

Submitted:
19 April 2024
Posted:
22 April 2024
You are already at the latest version
Abstract
BACKGROUND:
Thromboembolic disorders including Myocardial infarction[ MI] and stroke represent the leading causes of death worldwide. Fibrinolytic enzymes extracted from microbial sources showed high efficacy in the dissolution of different blood clots.
AIM OF THE STUDY:
Screening and the bacterial recombinant DNA manufacture of bacterial fibrinolytic enzymes from different soil environments in Egypt.
METHODOLOGY:
A total of 50 soil samples were screened for their fibrinolytic enzyme production. The potent fibrinolytic enzyme-producing bacterial isolates were evaluated for their thrombolytic activities using the plasma plate method. The characterization of the enzyme activity and thermostability were carried out; also, the determination of molecular mass using a mass spectrometer and western blot technique was performed. The purification of the fibrinolytic enzymes was done through the affinity chromatography technique. On the other hand, the production of the purified bacterial fibrinolytic enzyme was achieved via bacterial recombinant DNA technology. Formulation of fibrinolytic enzymes in different dosage forms was tried.
RESULTS:
In the present study, the purified bacterial fibrinolytic enzyme was approximately 83% pure through affinity chromatography and SDS-PAGE assay. The predominating bacterial isolate secreting fibrinolytic enzymes was found to be Bacillus cereus. The fibrinolytic enzyme activities of 50 soil samples were found to be in the range of 0.167-1.853 U/ ml. The fibrinolytic activity of the extracellular enzyme refined from the culture supernatant of Bacillus cereus was relatively stable over the PH range from 7.4-10 for 18 hours and also it showed stability with the highest productivity at a temperature of 43 0C for nearly 60 minutes. The enzyme was called fibrin-proteinase[ FP] in the present study. The FP degraded the fibrin clots via direct thrombolysis. The specific activity and the molecular mass of the FP were estimated to be nearly 40.71 Units/ mg protein and nearly 30 KDa respectively. Protease activity was noticed to be slightly increased in the presence of Fe+3; While it was inhibited in the presence of EDTA. On the other hand, the FP fibrinolytic activity was enhanced greatly after the addition of monovalent cations such as K+1 and Na +1. The enzyme was also active over the temperature range of 20- 65 0C with the highest activity at 55 0C. The optimum temperature and PH of protease production was at 35-43 0C and PH 8.0-10.
Conclusion:
During the present study, the thermostable fibrinolytic enzyme FP purified from Bacillus cereus in different soil environments in Egypt was a promising fibrinolytic enzyme because it showed a broader efficacious fibrinolytic activity as well as less adverse effects than the current fibrinolytic enzymes globally. It is recommended in the future advanced exploration of the optimization of suitable formulation of bacterial fibrinolytic enzymes to aid in the dissolution of various blood clots and as a consequence overcoming the high rate of mortality globally.
Keywords:
fibrinolytic
; enzyme
; thrombosis
; screening
; myocardial infarction
Introduction
Thromboembolic diseases are potentially fatal ailments that necessitate the use of fibrinolytic medications. Cardiovascular illnesses have emerged as the primary cause of death, with low- and middle-income nations bearing the brunt of this burden. Thromboembolic disorders are thought to be the cause of one in four fatalities worldwide [1]. According to the WHO in 2017, thrombosis is one of the leading causes of mortality globally, accounting for 31% of all fatalities [2]. Secondly, thrombolysis is the term for the fibrin-specific protease plasmin's digestion of fibrin [3]. The precursor form of plasmin, known as plasminogen, circulates throughout the fibrinolytic system in an inactive state [4]. Plasminogen activator changes plasminogen into plasmin in the context of tissue damage [5]. Fibrin clots are dissolved and digested by plasmin [6]. Fibrin aggregates in blood arteries to cause thrombosis, which can result in myocardial infarction or other cardiovascular problems [7]. Conventional medications, such as anticoagulants, antiplatelets, and fibrinolytic proteins and enzymes, may cause allergic reactions, bleeding complications, and hemorrhaging [8]. One characteristic of tissue plasminogen activators like alteplase and tencteplase is their high cost [9]. To get beyond the limitations of the available fibrinolytic medications, it became imperative to discover new, inexpensive fibrinolytic enzymes [10]. With an estimated 5.5 million deaths each year, stroke is the second most common cause of death worldwide [11]. Approximately 85% of stroke patients are of the ischemic stroke variety, necessitating the use of fibrinolytic medications [12].
The extracellular protein streptokinase, which is generated by streptococci, combines with proactivator plasminogen to create a complex [13]. The transformation of inactive plasminogen into active plasmin is catalyzed by this enzyme complex [14]. The kidney produces urokinase [15]. It changes plasminogen into active plasmin [16]. Due to their inability to be synthesized for use in various oral delivery methods and inability to be thermostable, existing fibrinolytic medications cannot be kept at ambient temperature or outside of a refrigerator [17]. To mitigate the unfavorable side effects of the fibrinolytic enzymes already on the market worldwide, the current study set out to investigate novel sources of microbial fibrinolytic enzymes from various soil conditions in Egypt.
Patients and Methos
Ethical statement: All relevant institutional, national, and/or worldwide guidelines for the care and use of humans and animals were prioritized in the current survey. The ethical committee for human and animal handling at Cairo University (ECAHCU), at the faculty of pharmacy, Cairo University, Egypt, authorized all study procedures involving humans and animals in accordance with the recommendations of the Weatherall report. The approval number for this committee is P-9-12-2022. Every attempt was made to reduce the number of people and animals used in the study, as well as their suffering.
Type of the study: Screening experimental study.
Place and date of the study: This study was conducted from September 2022 to November 2023 at Cairo University's pharmacy faculty in Egypt.
Source of animal models: They were acquired and approved by the pharmacology and toxicology division of Cairo University's pharmacy faculty in Egypt.
Inclusion criteria for animal models: An adult male rabbit model that is fat and weighs around 2 kg is caused by fibrin blood clots. Before the trial, the rabbits were allowed to acclimatize for one week. At a controlled temperature (252 0C), 50% humidity, and a 12-hour light-dark cycle. Fresh grass was provided to the bunnies.
Exclusion criteria for animal models: Young and female rabbits; Non-obese rabbits weighing less than 2 kg.
Material
The cell lines were acquired from the USA-based Accegen biological firm. Bacillus subtilis strain W23, was the reference microbe used in this investigation in order to standardize it. Every reagent that was utilized was analytical grade.
Identification and isolation media:
Mineral Fibrinogen Agar(MFA):
A selective media for the isolation and identification of microorganisms having the ability to use fibrinogen as the sole carbon and nitrogen source for their growth. This medium was composed of the following ingredients( g/ L):
The ingredients were mixed together, dissolved in boiling water and agitated frequently until completely dissolved. Then, the medium was cooled in a water bath to 47-50 0C and PH of the medium was at 7.3 and temperature 37 0C. Directly after mixing the ingredients the plates were poured up to volume of 15-20 ml in dishes with a diameter of 90 mm.
All ingredients were bought from Algomhoria company for chemicals in Cairo, Egypt [18]. Table 1 indicates the composition of mineral fibrinogen agar plate.
Blood agar:
It was an enrichment media for identification of beta- haemolysis of the positive isolates cultured on MFA to aid in identification of fibrin-protease producing bacterial species together with the gram stain, the biochemical tests and the morphology of colonies. Table 2 refers to the composition of blood agar plate.
Final PH at 25 0C was 7.3. The ingredients were combined ;then with 5% sheep blood which was added after autoclave at 1210C for 15 minutes and before pouring onto the plates. All ingredients were bought from Algomhuria company for chemicals in Cairo, Egypt [19].
Equipment
Table 3 refers to the list of instruments used in the present study.
Methods
Sample collection:
The samples were grassland soils that were randomly selected from various governmental locations and were taken at a depth of 11 to 20 cm. Samples were kept at 4 0C until processing in sterile containers.
Isolation of fibrinolytic producing bacterial isolates:
One gram of each soil sample was suspended in 99 ml of sterile distilled water contained in 250 ml Erlenmeyer flasks and shaken at 400 rpm for two minutes in a gyrator shaker. The soil suspensions were serially diluted in sterile distilled water and the dilutions from 10-1 to10-6 were plated on mineral fibrinogen agar( MFA) medium containing 0.5 g KCl, 0.5 g Mgso4, 1 g KH2PO4, 0.1 g FeSO4, 0.1 g Znso4, 2 g fibrinogen and 2% agar. The PH of medium adjusted at 7.3 at temperature 37 0C. The plates were incubated at 37 0C for 48 hours. Only the microorganisms having the ability to use fibrinogen as the sole carbon and nitrogen source could grow on the MFA medium. Colonies showing growth were purified twice using streak plate technique; then were taken on nutrient agar slants and were kept at 4 0C. Subculture of the positive isolated colonies on sheep blood agar was achieved to show if there was either beta-haemolysis or not. The selected isolate was routinely sub-cultured every 4 weeks, and the slant culture was maintained in the refrigerator.
Inoculum preparation:
The investigated bacterial isolate's inoculum was generated in 250 mL Erlenmeyer flasks containing 50 ml of nutrient broth liquid at PH 7. After autoclave the medium, it was infected with a loopful of culture from a 24-hour-old nutritional agar slant. The inoculated flasks were shaken for 24 hours at 150 rpm and utilized as the inoculum [20].
Identification of fibrinolytic enzymes producing bacterial isolates:
Gram stain:
It classified bacteria into two categories based on the makeup of their cell walls. The bacterial cells became purple after being treated with a solution of crystal violet and subsequently iodine on a microscope slide. When colored cells were treated with a solvent such as alcohol or acetone, gram-positive organisms kept the stain whereas gram-negative organisms lost the stain and turned colorless. With the addition of the counter-stain safranin, the clear, gram-negative bacteria became pink.
Spore shape:
This was discovered using the spore staining method. To get rid of any fingerprints, the slide was wiped with alcohol and a Kim-wipe. On the bottom of the slide, a Sharpie was used to create two circles. Each circle was filled with two tiny droplets of water using an inoculation loop. A very small amount of germs was taken out of the culture tube using an aseptic method. The water droplet on the slide had microorganisms on it. The slide was thoroughly dried by air. Bypassing the slide through the flame three to four times with the smear side up, the slide was heat-fixed. It took a while for the slide to completely cool. A piece of paper towel placed inside the slide's border was used to hide the streaks. A beaker of heating water was situated over the slide. The slide was allowed to steam for three to five minutes; while the paper towel was covered with a malachite green liquid. Removed and thrown away was the discolored paper towel. To get rid of any stray paper towel bits, the slide was gently cleaned with water. The counter-stain was safranin for 1 minute. Before putting the slide on the microscope's stage and seeing it via the oil immersion lens, the slide's bottom was dried.
Spore site:
During the Gram stain test, the spore location was established.
Cell shape:
During the Gram stain test, the cell shape was assessed.
Blood haemolysis:
On blood agar media, the microorganism's capacity to haemolyze the blood was tested.
Motility test:
It discriminated between motile bacteria and non-motile bacteria.
A sterile needle was used to penetrate the medium to within 1 cm of the tube's bottom to select a well-isolated colony and test for motility. The needle was certainly retained in the same position as it was inserted and removed from the medium. It took 18 hours of incubation at 35°C, or until noticeable growth appeared.
Biochemical reactions:
lecithinase test:
The differentiated and enriched media known as egg yolk agar is used to isolate and suppose the differentiation of numerous species depending on their lecithinase activity. Lecithin is a common component in egg yolks. In egg yolk agar, lecithovitellin, a lipoprotein component, may be broken down by the enzyme lecithinase into phosphorylcholine and an insoluble diglyceride, causing a precipitate to form in the medium. Microorganisms with the enzyme lecithinase degrade lecithin into insoluble diglyceride and phosphorylcholine, resulting in a white, opaque zone of precipitation that spreads beyond the colony's perimeter. When a colony forms on egg yolk agar medium, an opaque halo forms around it, suggesting that the lecithinase activity of the test is positive. The test organism was withdrawn in a loop after being streaked on the plate. After 24 hours at 35-37°C, the plate was examined for an opalescent halo surrounding the inoculates [precipitation surrounding the bacterium stripe (+ve)].
Methyl red test:
In the Methyl Red test, an infected tube of MR-VP broth was used before adding the methyl red pH indicator. The buffers in the medium were overcome by the acids when an organism used the mixed acid fermentation pathway and produced stable acidic end products, resulting in an acidic environment.
Catalase test:
A little inoculum of a specific bacterial strain was introduced to a 3% hydrogen peroxide solution to see if it might produce catalase. It was observed for the rapid emergence of oxygen bubbles.
Oxidase test:
The 1% Kovács oxidase reagent was applied to a tiny piece of filter paper, which was then allowed to air dry. A well-isolated colony was taken from a fresh (18 to 24-hour culture) bacterial plate using a sterile loop, and it was then rubbed onto prepared filter paper. Color alterations were noticed.
Citrate utilization:
Five milliliters of a Simmon Koser's citrate medium were taken after it had been autoclaved at 15 pounds for 15 minutes. To create a clear slant and butt, the test tube containing melted citrate medium was slanted. Using sterilized wire and labeled tubes, the specified samples of microbe were injected on the media's incline. For 24 hours, the tubes were incubated at 37°C. The medium's color shift was watched for.
Starch hydrolysis:
For 48 hours at 37°C, the bacterium plates were injected. After incubation, a dropper was used to saturate the surface of the plates with an iodine solution for 30 seconds. Iodine that was in excess was afterward poured out. The area surrounding the bacterial growth line was looked at.
Gelatin hydrolysis:
1% gelatin was used to create agar media. The supplied microorganism was added to the gelatin agar plates by utilizing an inoculating loop to create a single center streak in the plate. The plates were incubated for 24 hours at 37 °C. HgCl2 solution was poured over the plates. After a short while, the plates were examined. Positive test result; distinct halo-zone surrounding the injected region showed gelatin hydrolysis.
Growth at 45 0C:
On nutrient agar media, growth was observed to be possible at 45°C.
Indol test:
The test tube containing the microorganism for inoculation received 5 drops of the Kovács reagent directly. Within seconds after introducing the reagent to the media, the reagent layer formed a pink to red colour (cherry-red ring), which was a sign of a positive indol test.
Tolerance salinity:
Its capacity to develop on nutrient agar while being responsive to 5% and 7% NaCl was examined.
Voges-Proskauer(VP) test:
For the test, Voges-Proskauer broth, a glucose-phosphate broth loaded with microorganisms, was added to alpha-naphthol and potassium hydroxide. A successful outcome was indicated by a cherry red tint, whereas an unfortunate outcome was indicated by a yellow-brown color.
Triple sugar Iorn test( TSI):
Glucose, lactose, and sucrose fermentation with or without gas generation were evaluated using triple-sugar iron agar (TSI agar). It also examined if amino acids may produce hydrogen sulfide. In this test medium, the pH indicator was phenol red. A TSIA slant was attained. The designated organism was injected into the TSIA slant's butt using an inoculating needle. TSIA pulled up the surface of the slanted part of the tube in a zigzag manner after the inoculating needle was removed. 24 hours were spent incubating the slant. Any changes in the tube were noted after the incubation time. The lactose and/or sucrose fermentation was shown by the slant color. The butt color suggested that glucose was fermenting. Agar bubbles, a sign of gas production, were seen. The medium became dark, indicating the production of H2S.
Saccharide fermentation tests:
Glucose fermentation test:
The fermentation reactions of glucose were investigated using glucose purple broth. Peptone and the PH indicator bromcresol purple made up the purple broth. A 1% concentration of glucose was added. Isolated colonies from a 24-hour pure culture of microorganisms were added to the glucose purple broth as an inoculant. Parallel to the inoculation of the glucose-based medium, a control tube of purple broth base was used. The inoculated medium was incubated aerobically for 3 days at a temperature of 35–37 0C. The medium began to become yellow, which was a sign of a successful outcome. A poor carbohydrate fermentation response was indicated by the lack of yellow color development.
Fructose fermentation test:
A pure culture's inoculum was aseptically transferred to a sterile tube of phenol red fructose broth. The infected tube was incubated for 18–24 hours at 35–37 0C. A color shift from red to yellow, signifying an acidic PH alteration, was a sign of a favorable response.
Maltose fermentation test:
A pure culture inoculum was aseptically transferred to a sterile tube containing phenol red maltose broth. The infected tube was incubated for 18–24 hours at 35–37 0C. A color shift from red to yellow, signifying an acidic PH alteration, was a sign of a favorable response.
Sucrose fermentation test:
A pure culture's inoculum was aseptically transferred to a sterile tube containing phenol red sucrose broth. For 24 hours, the infected tube was incubated at 35–37 0C. A colour shift from red to yellow, signifying an acidic PH alteration, was a sign of a favourable response.
The determination of optimal environmental and physiological factors affecting growth of some selected bacterial isolates producing fibrinolytic enzymes including metal ions such as Fe+2, Mg+2, Co+2, Mn+2, Ba+2, K+1, Na+1, Ni+2at a concentration of 9 mM was accomplished by cultivating several soil samples previously obtained on MFA. The effects of various PH values[ 4-12], incubation temperatures[ 20-50 0C], inoculum volumes[ 1-10%] were investigated through the evaluation of the fibrinolytic activity via the plasmin[ fibrin] plate assay.
Optimization of soil bacterial fibrinolytic enzymes production:
The metal ions, nitrogen and carbon sources were obtained from Alnasr pharmaceutical chemical company, Abo-zabal, Alkhanka, Egypt.
There have been investigations into several process variables that increase fibrinolytic enzymes yield. Peptone, Soyabean, and ammonium nitrate at a concentration of 1% W/V were used as nitrogen sources, and the effects of adding carbon sources such as sucrose, mannitol, dextrose and soluble starch at a concentration of 2% W/ V were also studied. The experiments were run in triplicate, and the mean results were presented.
To determine the effective parameters and substrates, a series of fermentations were carried out in 500 ml Erlenmeyer flask containing 100 ml of MFA medium with different carbon( 2% W/ V), nitrogen ( 1% W/ V) and metal ion( 9 mM) sources as well as inoculation volumes( 1- 10%), PH( 4-12) and temperatures( 20-500C). The carbon sources used were mannitol, dextrose, lactose and sucrose. The nitrogen sources were tryptone, peptone, soyabean, sodium nitrite, ammonium sulfate and ammonium nitrate. The salts of different metal ions including CU +2, Ca +2, Mg +2, Fe +2, Mn +2, Zn +2, Co +2, Ni +2 and Ba +2 were utilized in the culture medium [21].
Molecular detection:
The predominant bacterial isolate with high fibrinolytic activity was identified using 16S rRNA sequencing and other biochemical tests. Nucleic acid was extracted from a swab by bead-beating in a buffered solution containing Phenol, Chloroform and Isoamyl alcohol. Variable region of 16S rRNA gene was then amplified from the resulting nucleic acid using PCR. The genomic DNA was extracted from 18 hours cultured cells using a DNA purification kit[ PurreLinkTM Genomic DNA Mini Kit with Catalog number: K182002 was purchased from Invitrogen, USA] according to the protocol provided by the manufacturer of DNA purification kit. The 16S rRNA gene was amplified by PCR[ PCR SuperMix kit was purchased from Invitrogen,USA] using forward[ 5-AGAGTTTGATCCTGGCTCAG-3-] and reverse[ 5-GGTTACCTTGTTACGACTT-3-] primers. PCR amplicons from up to hundreds of samples were then combined and sequenced on a single run. The resulting sequences were matched to a reference database to determine relative bacterial abundances. Polymerase Chain Reaction (PCR) is a powerful method for amplifying particular segments of DNA. PCR uses the enzyme PlatinumTM Taq DNA polymerase with catalog number 10966018[ purchased from Invitrogen, USA] that directs the synthesis of DNA from deoxynucleotide substrates on a single-stranded DNA template. DNA polymerase adds nucleotides to the 3` end of a custom-designed oligonucleotide when it is annealed to a longer template DNA. Thus, if a synthetic oligonucleotide is annealed to a single-stranded template that contains a region complementary to the oligonucleotide, DNA polymerase can use the oligonucleotide as a primer and elongate its 3` end to generate an extended region of double stranded DNA. Denaturation is the initial PCR cycle stage The DNA template is heated to 94° C. This breaks the weak hydrogen bonds that hold DNA strands together in a helix, allowing the strands to separate creating single stranded DNA. Annealing is the second PCR cycle. The mixture is cooled to anywhere from 50-70° C. This allows the primers to bind (anneal) to their complementary sequence in the template DNA. Extension is the final step of PCR cycle. The reaction is then heated to 72° C, the optimal temperature for DNA polymerase to act. DNA polymerase extends the primers, adding nucleotides onto the primer in a sequential manner, using the target DNA as a template. With one cycle, a single segment of double-stranded DNA template is amplified into two separate pieces of double-stranded DNA. These two pieces are then available for amplification in the next cycle. As the cycles are repeated, more and more copies are generated and the number of copies of the template is increased exponentially. The amplified PCR product was sequenced using a genetic analyzer 3130XL[ purchased from Applied biosystems, USA]. DNA sequence homology search analysis of the predominant bacterial isolate was achieved using Blast n algorithm at NCBI website [22].
Upstream process:
Bacterial recombinant DNA production of fibrinolytic enzymes:
Primer for expression of FP,
Forward primer: TTCCAACAAAATGGACGTGA
Reverse primer: CAGGATAGCCGATTGTGCTT.
The expression vector was pET-14b( purchased from Novagene in the United States). The expression vector was designed via GenSmart™ Design sortware. The promotor was T7 Lac, and the tagged protein was 6x histidine linked to the C terminus of an molecule. Escherichia coli BL21[ DE3] polys S served as the expression host. All of them were used in the manufacture of Fibrin-proteinase fibrinolytic enzyme using bacterial recombinant DNA technology. IPTG was the transcription process's inducer. The principal host for the plasmid synthesis and replication was Escherichia coli DH5 [obtained from Stratagene corporation, USA]. Fibrin-proteinase genomic DNA was isolated from Bacillus cereus ATCC 14579 discovered in several Egypt soil conditions using restriction endonuclease type II enzymes[ DNA cutting enzymes] Taq I and Hae III. These cutting enzymes were bought from the German business Sigma-Aldrich. Furthermore, genomic DNA was amplified using the polymerase chain reaction method before being sub-cloned to the prokaryotic expression vectorPET-14b using the same restriction endonuclease type II enzymes used to extract genomic DNA from Bacillus cereus ATCC 14579. This was followed by the transformation of pET-14b into the polys S expression host Escherichia coli BL21[ DE3]. The addition of IPTG stimulated transcription at the promotor site T7 Lac, hence initiating gene expression. Luria agar and broth[ LA, LB] were used for routine bacterial culture for 24 hours at 37 0C incubation temperature. Ampicillin and/or Kanamycin were added to the culture medium according to the manufacturer's guidelines [23].
Downstream process:
Purification was carried out using 500 ml of crude enzyme extract.
For recombinant expression yield, a centrifuge tube was spun for 5 minutes at 4000 rpm. The expressed protein was extracted from the supernatant through salting out using 70% ammonium sulfate.
Procedure of salting out using 70% Ammonium sulfate:
38 grams of ammonium sulfate were dissolved in 100 ml distilled water at 25 0C to prepare 70% saturated solution. The retentate was subjected to 70% W/ V ammonium sulfate precipitation via stirring using a magnetic stirrer at 4 0C for over night; moreover the precipitate formed was centrifuged at 10000 rpm for 30 min in a centrifuge 4K15( purchased from Sigma-Aldrich, German) and the precipitate obtained was dissolved in a minimal quantity of 60 mM Tris-HCl buffer, PH 7.2. Furthermore, the expressed protein was purified using Ni-NTA Agarose Column affinity chromatography technique[ Ni-NTA Purification System with catalog number K95001 was purchased from Invitrogen, USA] [24].
Procedure of Ni-NTA Agarose Column affinity chromatography:
8 ml of cell lysate was added to a prepared purification column. To keep the resin suspended in the lysate solution, it was bound for 15–30 minutes at room temperature using gentle agitation on a rotating wheel. The resin was settled by low speed centrifugation at 500 rpm and carefully the supernatant was aspirated. The column was washed with 5 ml denaturing binding buffer by resuspending the resin and rocking for 3 minutes. The column was washed with 4 ml denaturing wash buffer (pH 6.0) by resuspending the resin and rocking for two minutes; then the column was washed with 10 ml native wash buffer by resuspending the resin and rocking for 3 minutes. The column was clamped in a vertical position and the cap was snapped off on the lower end. The protein of interest was eluted with 9 ml native elution buffer. 1 ml of the supernatants after each wash were kept at 4º C for SDS-PAGE analysis [25].
SDS-PAGE procedure:
SDS-PAGE Kit utilized during the present study was HiPer® SDS-PAGE Kit with Catalog number: HTP001 purchased from Hi-Media Laboratories, India. Procedure of SDS-PAGE was performed according to the manufacturer's instructions. The electrophoresis unit was assembled such that the glass plates were clamped to the unit along the spaces placed in-between them at two vertical edges. 1% agarose( 0.5 g in 5 ml of distilled water) was prepared. The agarose was boiled to dissolve then a thin horizontal layer was poured the lower edge of the plates to seal the assembly. The agarose was allowed to solidify via allowing it to cool down for 5- 10 minutes. The preparation of 12% separating gel was carried out through the addition of the following:
The gel was poured in-between the plates and was allowed to solidify for an hour. Immediately after the gel was poured, the distilled water was added to level the gel. After one hour the water was poured off by inverting the casting assembly. 5% stacking gel was prepared through the addition of the following components:
After the addition of TEMED, the components were mixed gently by swirling the beaker. The stacking gel was poured was poured on the top of the separating gel and immediately the comb avoiding air bubbles was placed; as well as the gel was allowed to solidify for 30 minutes. 1X Tris-Glycine-SDS gel running buffer was poured in the unit such that the buffer connects the two electrodes, and hence completed the flow of current. The comb was removed from the stacking gel carefully. 5 µl of prestained protein ladder and 20 µl of samples immediately were loaded
after the heat treatment in the wells created by the comb in the stacking gel. The power cord was connected to the electrophoertic power supply according to the conventions: red Anode and black Cathode. It was allowed to electrophorese at 100 volts and 10 mA until dye front reached 0.5 cm above the sealing gel. The gel was carefully removed from in-between the plates using spatula into the plastic tray containing distilled water. The gel was washed for 1 minute. The water was discarded and staining destaining procedure was proceeded. Staining and destaining of the gel included the addition of 50 ml of staining solution in the tray containing gel, till the bands were visible. The gel; afterwards was removed the staining solution. The staining solution could be reused 2-3 times; then the gel was washed by rinsing in distilled water till a considerable amount of stain was leached out from the gel. Changing the distilled water was kept for 3-4 times. 50 ml of destaining solution was added to the gel with constant moderate shaking. The destaining was continued till clear and distinct bands were observed. In the end of the process, the gel was removed from the destaining solution.
After staining and destaining of the gel the molecular weights of samples were compared with that of the protein markers.
Molecular weights were confirmed via a mass spectrometer [26]. Table 4a refers to the composition of 12 SDS-PAGE gel; while Table 4b showed the components of 5% stacking gel.
Quantitative purified fibrinolytic protein estimation by lowry method:
The determination of of the unknown concentration of purified fibrinolytic enzyme in a sample was carried out using standard curve obtained through Lowry assay using bovine serum albumin as the standard, and the values were expressed as mg/ ml [27].
Determination of cellular position of fibrinolytic enzyme:
This was determined through spectrophotometric analysis of thrombolytic activity( SATA) assay, standardized by tissue plasminogen activator( tPA), which could quantitatively measure in vitro thrombolytic activity. Blood clots were formed, uniformly, by mixing citrated whole blood with partial thromboplastin time( PTT) reagent, together with calcium chloride. Then, designated concentrations of tPA as a standard fibrinolytic drug, supernatants and cell lysates of different centrifuged soil samples containing test fibrinolytic enzymes at 500 rpm were added. The released red blood cells from each clot were quantified using spectrophotometry( λmax=405nm) as an indicator of thrombolytic activity [28].
Assessment of secretion of antibodies to bacterial fibrinolytic enzyme:
The quantity of IgG antibodies to the enzyme of interest in mouse serum was dictated via ELISA. 100 µl of an emulsion containing 50 µg of FP and an equal volume of complete Freund adjuvant [purchased from Sigma Aldrich, USA) at 3 week intervals to 10 mice.Sera separated and used as primary antibodies [29].
The kinetic parameters Km and Vmax determination:
The parameters of kinetic, Michaelis–Menten constant (Km) and maximum velocity (Vmax) of purified fibrinolytic enzymes were ascertained with suited concentrations of fibrinogen (2–11 mM) as the substrate. Data was connected to the nonlinear exponential stage union curve of regression. GraphPad Prism 5 software was utilized during this process. The outcome of fibrinolytic enzymes were computed aside measurement of the hydrolysis rate of fibrin clots below standard laboratory circumstances victimizing the equation of Michaelis-Menten [30].
Formulation of bacterial fibrinolytic enzymes:
The secreted fibrinolytic enzymes from the predominant bacterial isolate grown on SFA medium was formulated as a sterile solution intended for the utilization via parenteral routes of administration either IV, IM or SC injections. Lyophphilized powder of recombinant FP was obtained for preparation of a solution for injection of 50 units and 100 units in vials. The preparation was administered intravenously in the initial dose of 200 IU in 60 ml of isotonic solution of sodium chloride during 30 minutes( 25 drops per minute). Later, the administration of FP in the dose of 150 IU per hour was followed.
Table 5 demonstrates the composition of parenteral dosage form of FP.
Compatibility studies of fibrinolytic enzyme and polymer:
These were performed via FTIR spectroscopy and DSC. Recombinant FP. and different excipients utilized in the preparation of intravenous and subcutaneous parenteral formulations were characterized by FT-IR( Perkins-Elmer 1600 FTIR spectrophotometer) spectroscopy and DSC( Shimadzu-DSC 50) to find the compatibility. The optimized formulations were blended with 100 mg KBr; then compressed into discs which were scanned at 5mm/ sec with a resolution of 1 cm-1 at a range of 4000-300 cm-1. Experiments of thermal analysis were carried out utilizing various scanning calorimeter( DSC). The samples of the optimized formulation were heated in hermetically sealed Aluminium pans at a temperature range of 0-4000 0C at a constant rate of 105 0C/minute under a purge of nitrogen( 40 ml/ min).
Testing the fibrinolytic activity of recombinant fibrinolytic enzymes:
This was achieved through the following calibration assays:
Fibrin plate method:
Human fibrinogen, plasmin and thrombin were procured from Sigma-Aldrich, USA. Fibrinolytic activity was determined by using a fibrin plate assay. Human fibrinogen( 7 ml, 0.5% w/v, in 60 mM pH 7.4 sodium phosphate buffer) was mixed with agarose solution ( 6 ml, 2% w/v, in 50 mM pH 7.4 sodium phosphate buffer) and 0.1 mL of thrombin ( 5 NIH U/ml in 60 mM pH 7.4 sodium phosphate buffer) in a petri dish. The solution was left for 2 h at room temperature to form a fibrin clot layer. 50 µL of the fibrinolytic enzyme laden supernatant from different samples obtained in experimentation was added into a 10 mm diameter well punched fibrin plate followed by the incubation of the plate at 37°C for 24 h. Enzyme activity was calculated by measuring the lytic area. One unit of the fibrinolytic enzyme activity is defined as the amount of enzyme in 30 µL of enzyme solution that produced a clear zone of 1 mm2 at pH 7.4 and 37°C for 18 h. Plasmin (1000 U/ ml) was used as a reference standard to produce a calibration plot which was used to calculate the FEA of the samples [31].
Casein digestion method:
Fibrinolytic enzyme activity was determined using the casein digestion method, which is based on the determination of tyrosine released from digested casein. Activity was determined absolutely victimizing the modified method from Sutar et al( 1986). Reaction mixture(3 ml) incorporated 10 mg casein, 50 mM Tris-HCl, pH 9.0, 0.1 ml( or appropriate diluent) supernatant. Reactions were carried out at 37° C for 20 minutes and then stopped by the addition of 3.5 ml of 6% w/v trichloroacetic acid( TCA) and 0.3 ml of 4.4 M HCl. The reaction was then kept on ice for 30 minutes before filtering exploiting Whatman #1 filter paper. The absorbance of the TCA soluble fraction was deliberated at 280 nm. Units of enzymatic activity were measured utilizing the curve of standard plasmin [32].
Effect of plasminogen addition on fibrinolytic enzyme activity:
The incubation mixture contained 200 µl of 2 % fibrin( pH 8), 200 µl of 0.2 M Tris-HCl (20 mM CaCl2 , pH 7.8), the enzyme solution ( 100 µl), and 100 µl plasminogen( 0.730 U). Fibrinolytic activity was measured by using fibrin plate assay and was compared with the activity of the enzyme without plasminogen. The fibrin plate was prepared by the addition of 5 ml of 2.1 % fibrin(pH 8) to 4 ml 35 mM Tris-HCl (including 0.80 % agar, 0.20 M NaCl, pH 7.9) at 45°C [33].
Effects of pH and temperature on enzyme activity:
The optimal temperature for enzyme activity of extracellular fibrinolytic enzymes was determined by incubating the reaction mixture in 605mM phosphate buffer (pH 7.0) for 2 h at temperature ranging from 25o C to 95o C. Enzyme activity was assayed by using fibrin plate assay. The optimal pH for enzyme activity was assayed from pH 4.0 to 11.0. The enzyme in 65 mM sodium phosphate buffer(pH 7.0) was mixed with different buffers. The buffers used and their ranges were 0.2 M citrate-phosphate buffer( pH 2.0-5.0), 65 mM sodium phosphate buffer( pH 6.0-7.0), Tris-Cl buffer (pH 8.0-9.0), and glycine-NaOH buffer( pH 10.0- 12.0). The thermostability of the enzyme activity was assayed by measuring the activity remained after incubating the enzyme in 65 mM sodium phosphate buffer (pH 7.0) at temperature ranging from 25o C to 95o C for 2 h [34].
Effect of metallic ions on enzyme fibrinolytic activity:
The effect of the enzyme was investigated using MgSO4, CoCl2, MnCl2, ZnCl2, FeSO4, CuSO4, and CaCl2. The partial purified protein was incubated in both the absence and the presence of metal ions including Mg2+, Co2+, Mn2+, Zn2+, Fe2+, Cu2+ and Ca2+ with a final concentration of 10 mM in Tris buffer( pH7.3) for 2 hrs at 37o C and the fibrinolytic activity was assayed using fibrin plate assay [35].
Experimental venous thrombosis Technique:
Biological activity of the test fibrinolytic enzyme was compared to standard activity in a rabbit model of experimental venous thrombosis.
300 male rabbit models weighing nearly 2 kg were collected and divided into three groups (test, standard, and control). Each group consisted of 100 of rabbit models. In test and control groups, thrombosis was induced by jugular vein stasis and injection of 10 mg/kg thromboplastin into the ear vein of each rabbit model. Animals were randomized to receive IV test fibrinolytic enzyme 0.2, 2.0, 4.0, or 9.0 mg/ kg or vehicle control and compared to standard intravenous plasmin and vehicle control. On the other hand, activated partial thromboplastin time( APTT) test was performed to detect the anticoagulant effect of fibrinolytic enzymes; as well as the clotting time( CT), thrombin time( TT), Euglobulin lysis time( ELT), fibrinogen( FIG) and hemorheology conditions were determined [36].
Determination of phamacokinetic profile:
In vitro fibrinolytic enzyme release and in vivo bioavailability study of optimized formulations were determined according to British pharmacopoeia 2023. A 0.5- 1 ml rabbit animal model blood samples were withdrawn before dosing and immediately after dosing at 30, 60, 90, 120, 240 and 360 minutes; afterwards blood samples were refrigerated within 1 hour of sampling and centrifuged at 4 ̊C. Fibrin-proteinase concentrations were measured using HPLC. HPLC analysis was performed on a reverse- phase column using phosphate buffer[ PH 4.3] and acteonitrile[ 750: 250, V/V] as a mobile phase with a flow rate of 1 ml / min. The limit of the determination with UV detection was at 225 nm [37].
Figure 1.
It shows fibrinolytic activity of the bacterial thrombolytic enzymes secreted from Bacillus SPP on nutrient agar plates inoculated with 3% fibrinogen solution.
Figure 1.
It shows fibrinolytic activity of the bacterial thrombolytic enzymes secreted from Bacillus SPP on nutrient agar plates inoculated with 3% fibrinogen solution.
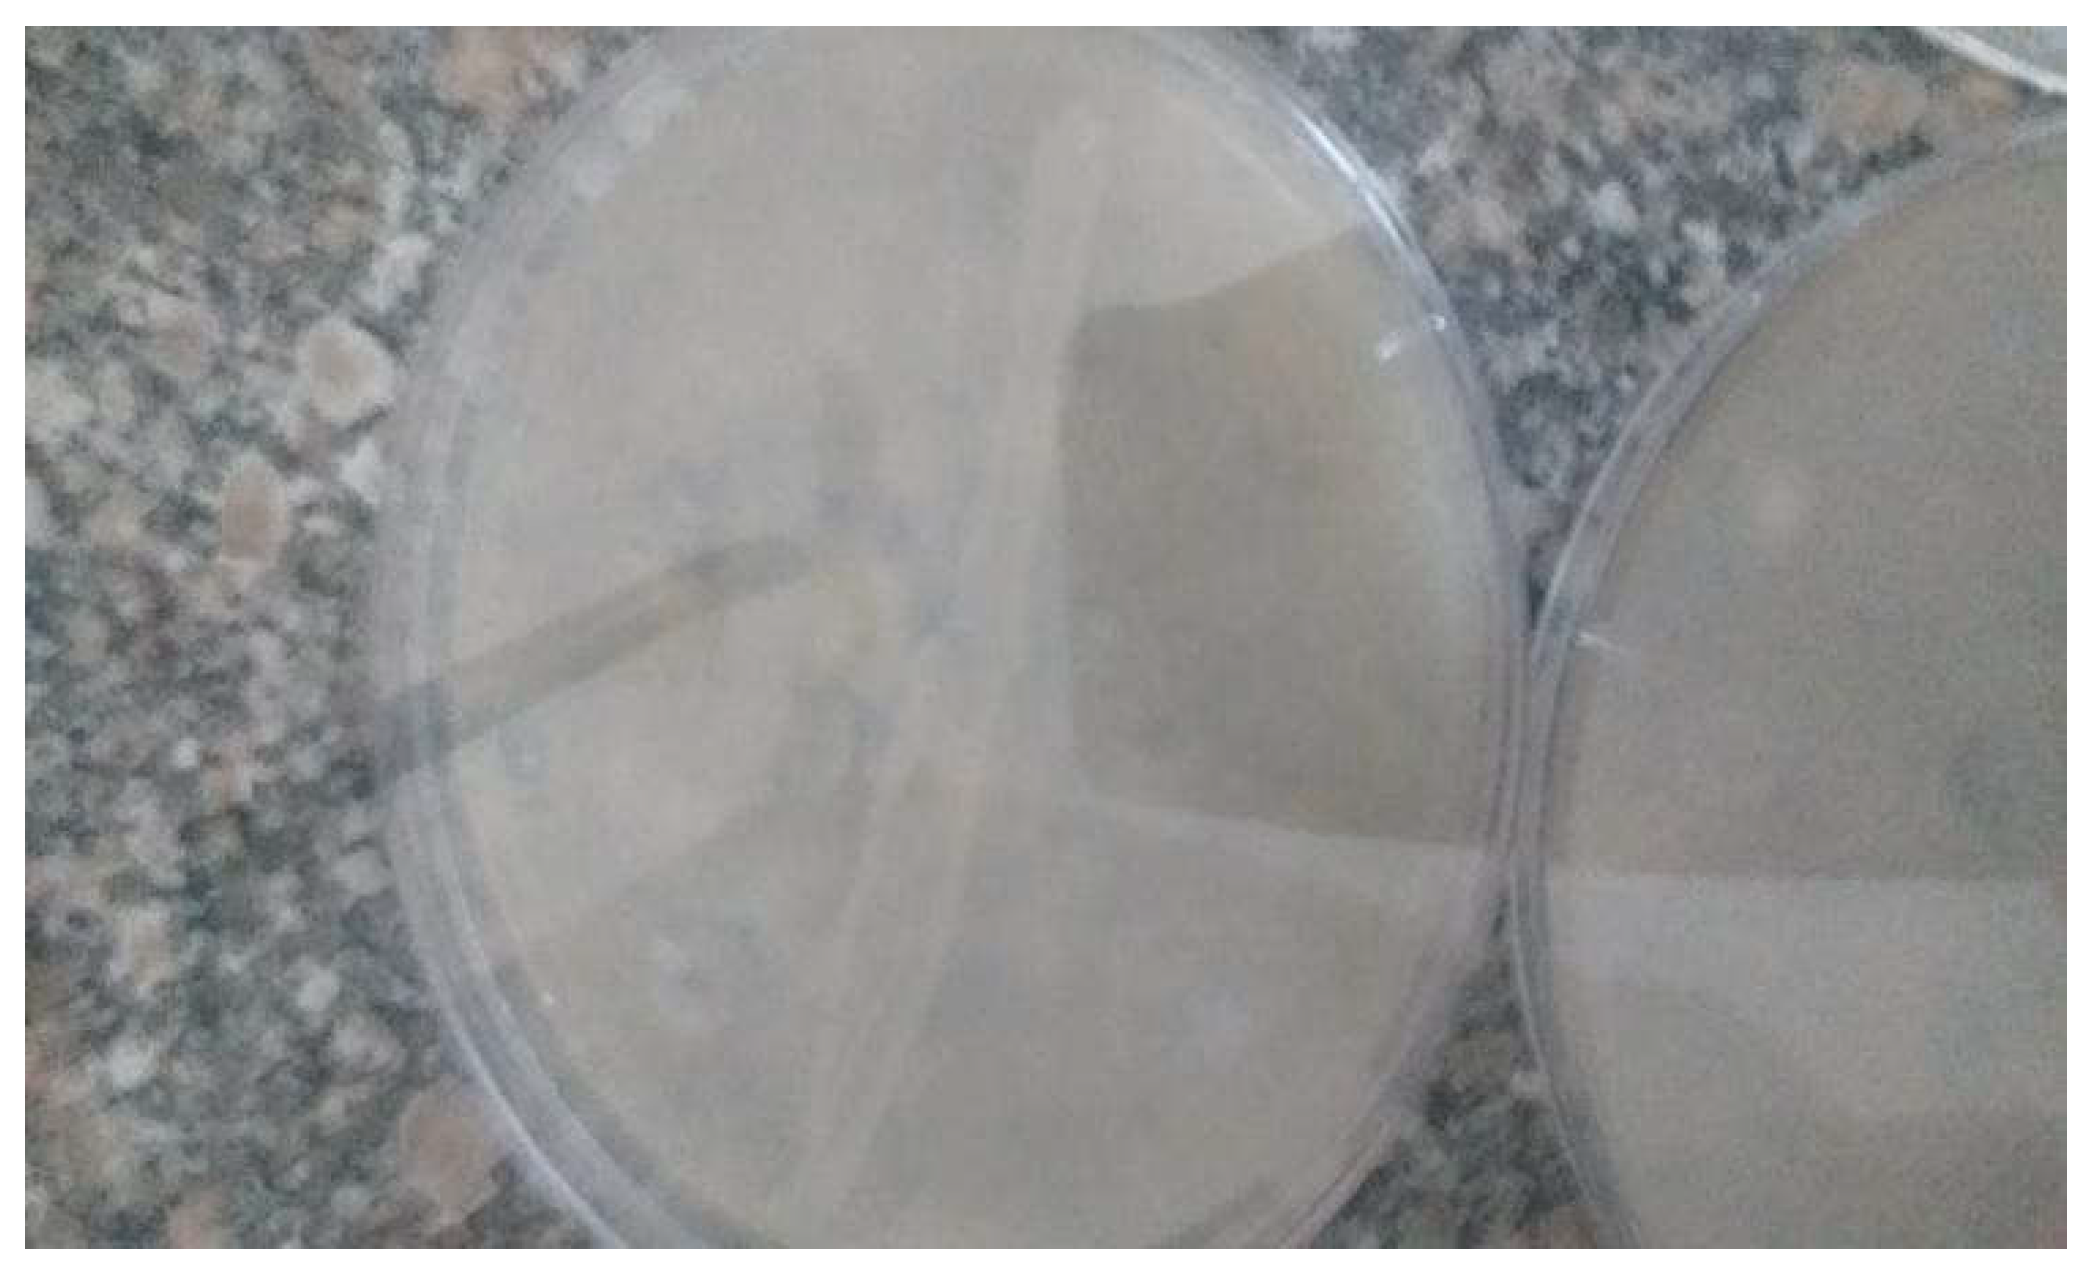
Figure 2.
It shows Positive Gram staining of bacterial Bacillus subtilis and cereus isolates producing thermostable fibrinolytic enzymes.
Figure 2.
It shows Positive Gram staining of bacterial Bacillus subtilis and cereus isolates producing thermostable fibrinolytic enzymes.
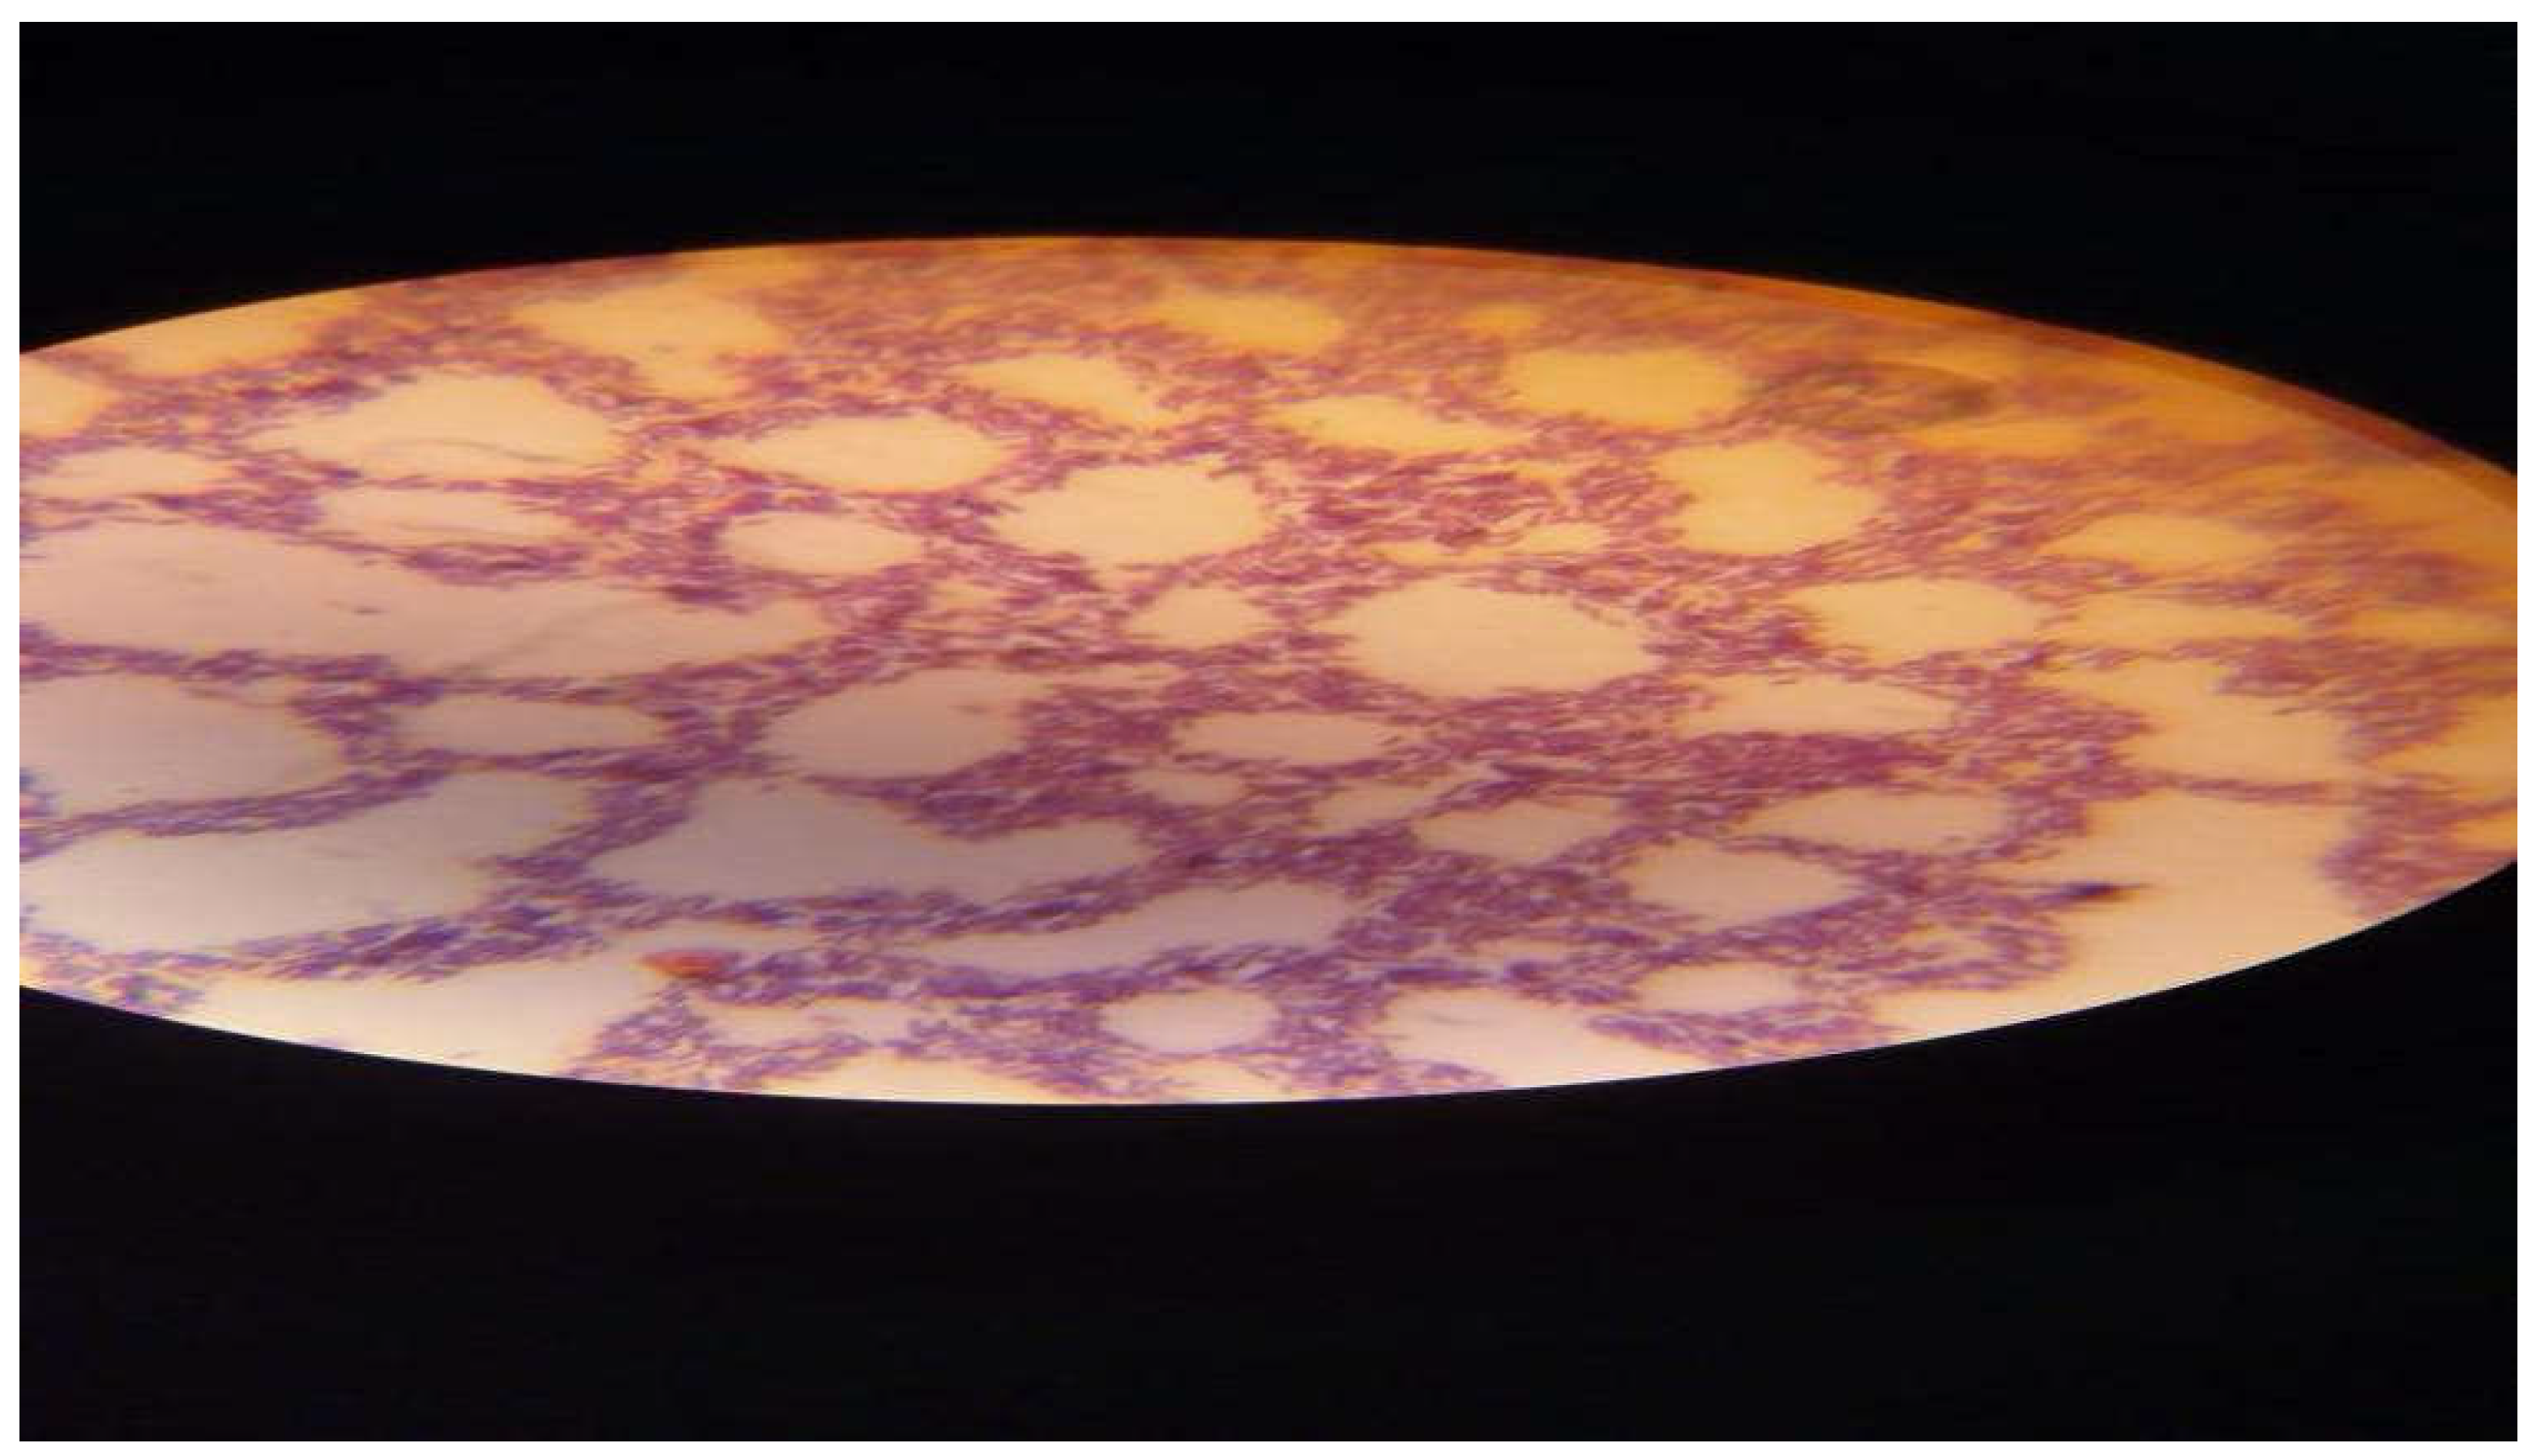
Figure 3.
It represents 3D structure of Fibrin-proteinase excreted from Bacillus cereus. The molecular mass reached nearly 30 KDa as determined via mass spectrometer.
Figure 3.
It represents 3D structure of Fibrin-proteinase excreted from Bacillus cereus. The molecular mass reached nearly 30 KDa as determined via mass spectrometer.
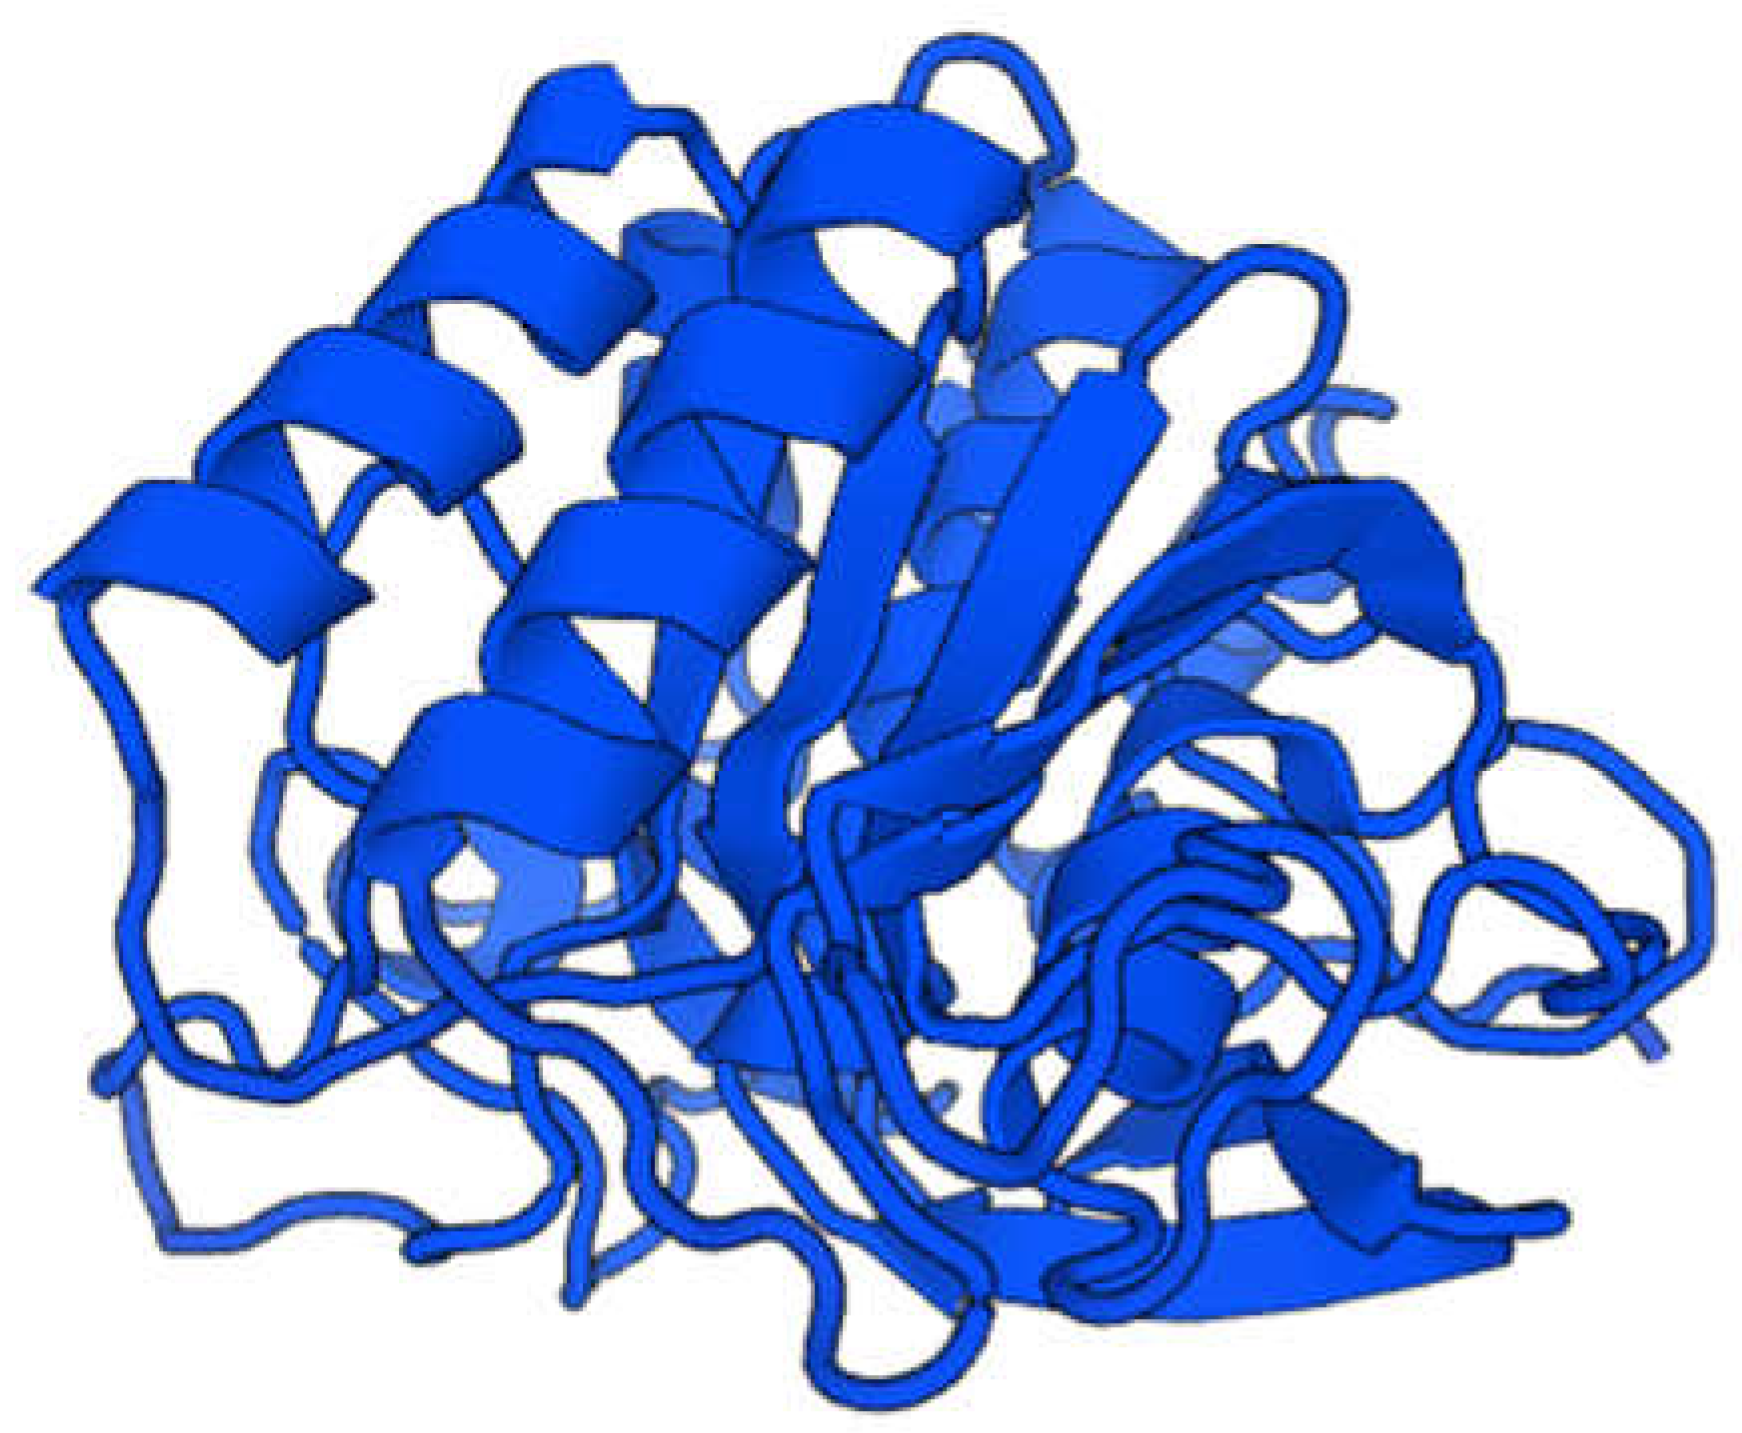
Figure 4.
It demonstrates the SDS-PAGE purification of Fibrin-proteinase secreted from Bacillus cereus ATCC 43 42. The degree of purity reached approximately 80%.
Figure 4.
It demonstrates the SDS-PAGE purification of Fibrin-proteinase secreted from Bacillus cereus ATCC 43 42. The degree of purity reached approximately 80%.
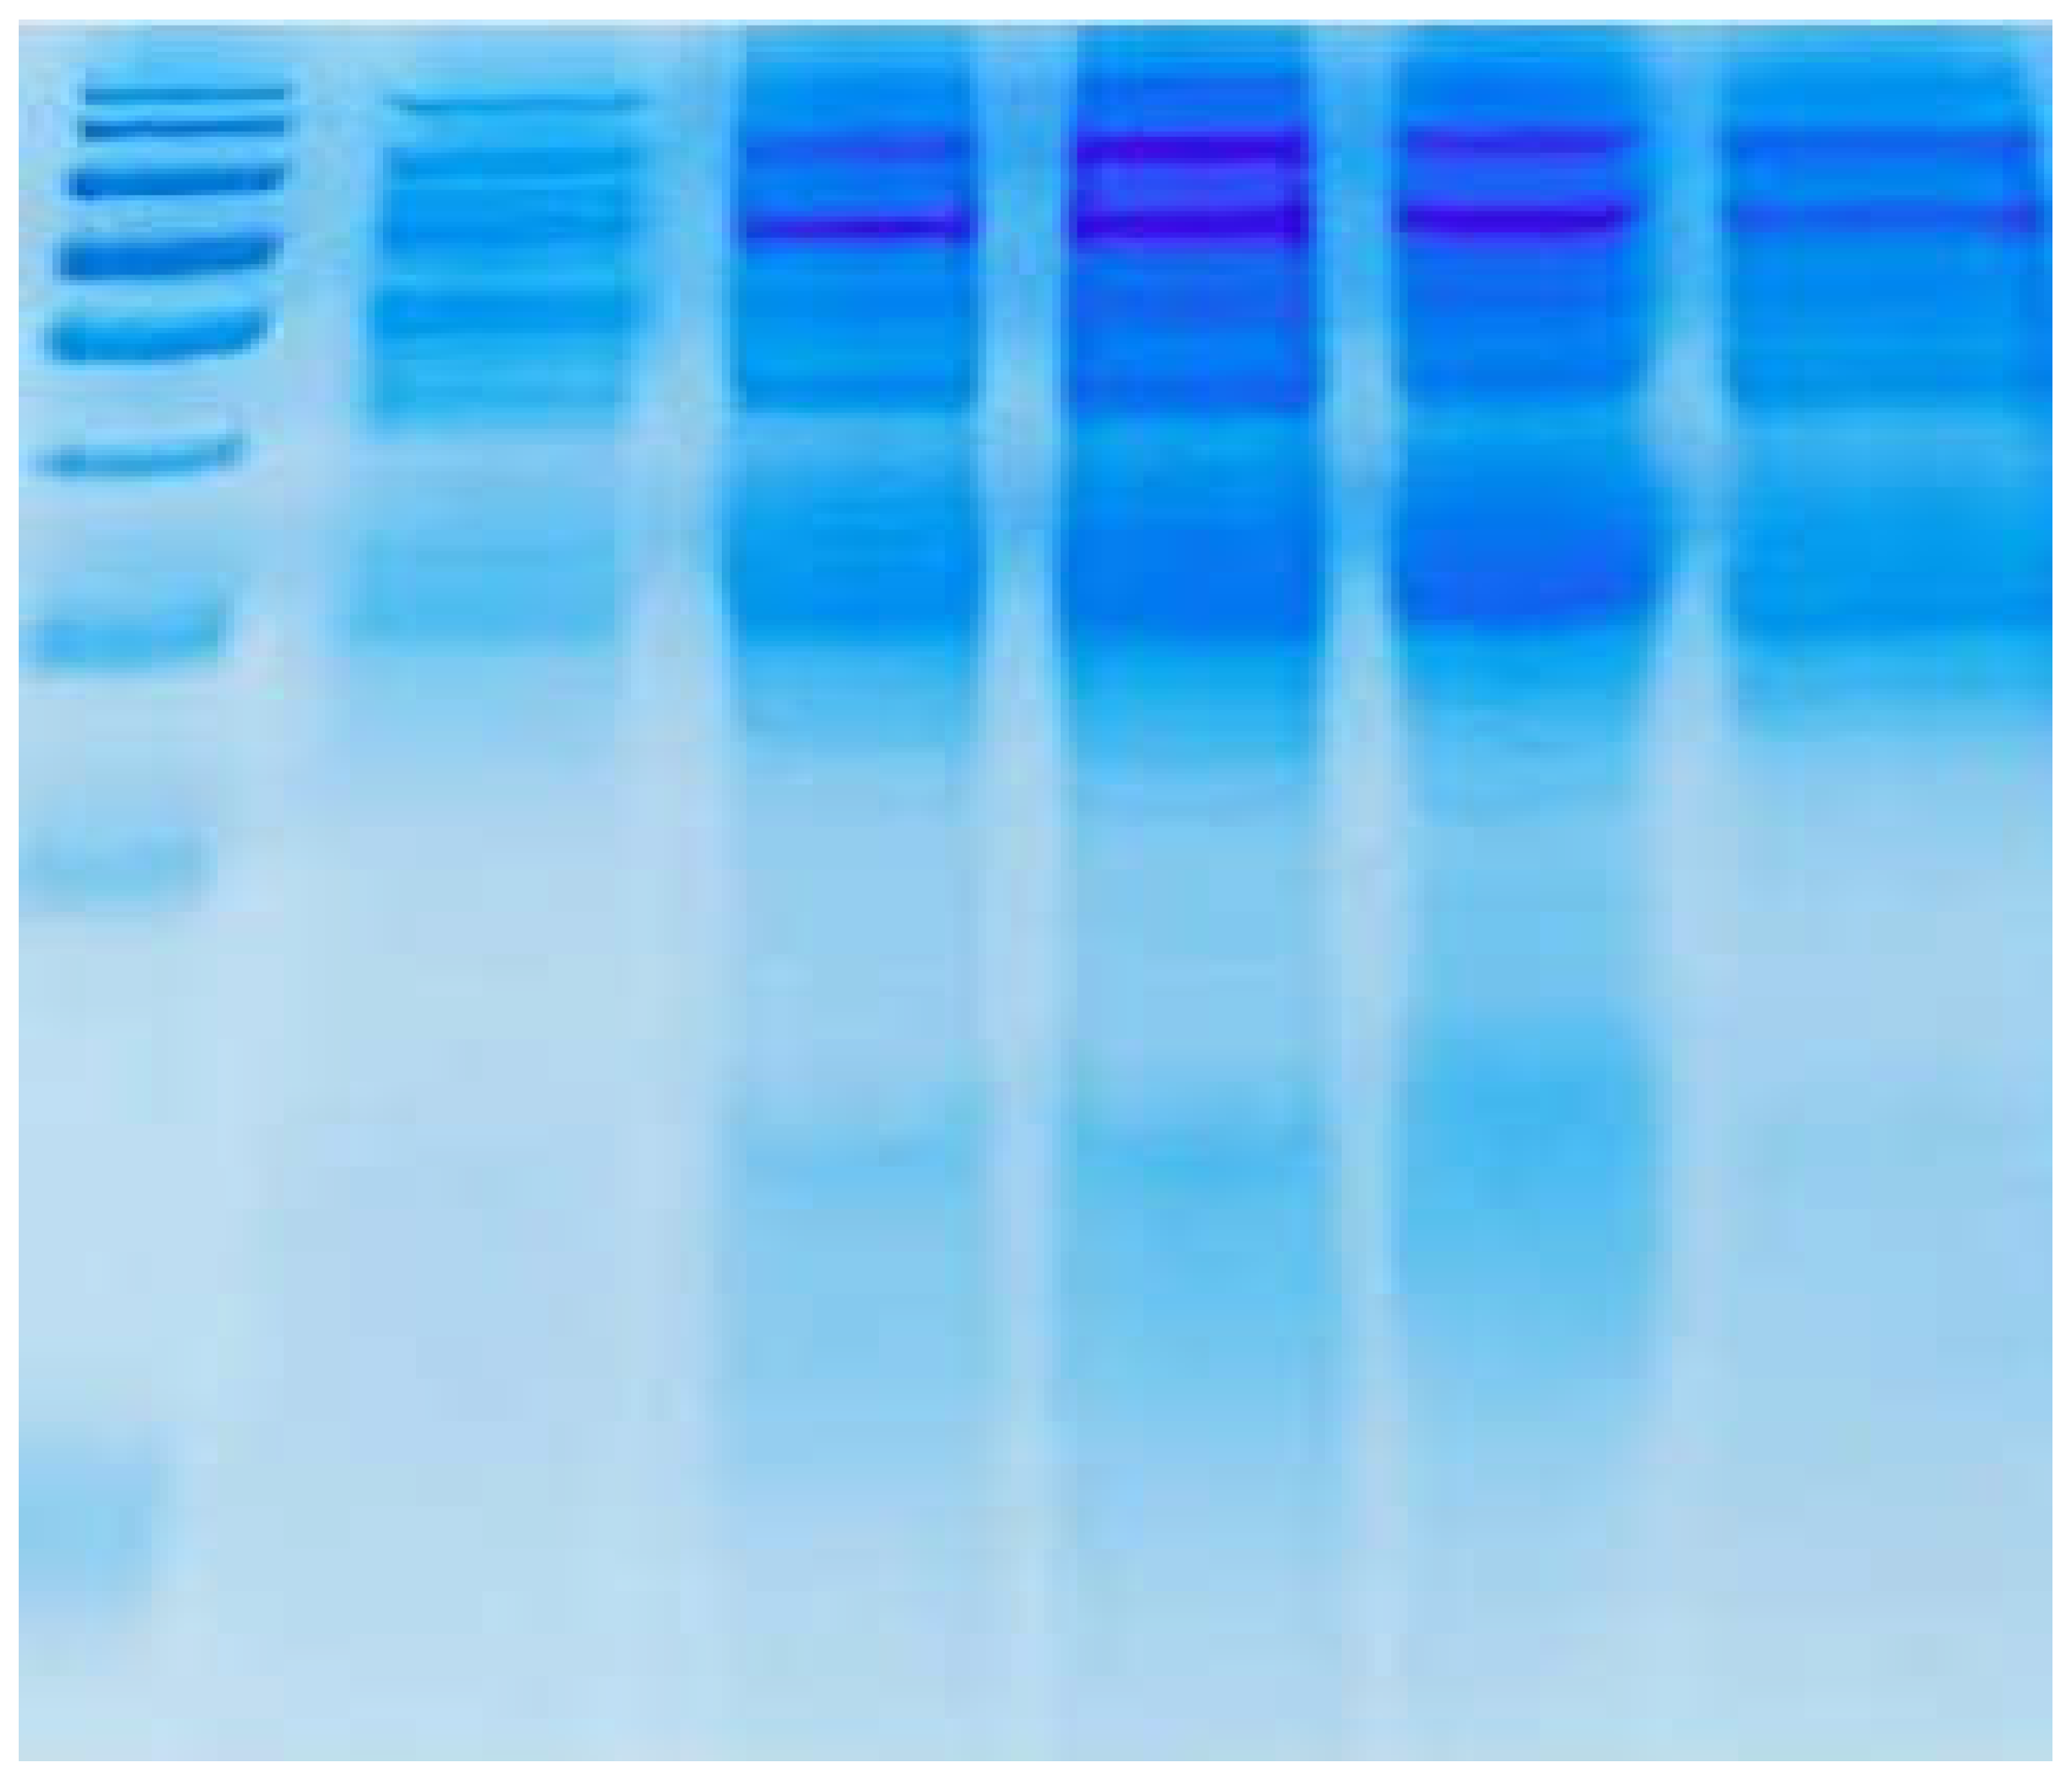
Figure 5.
It shows growth of Bacillus cereus and Bacillus subtilis bacterial isolates on MFA.
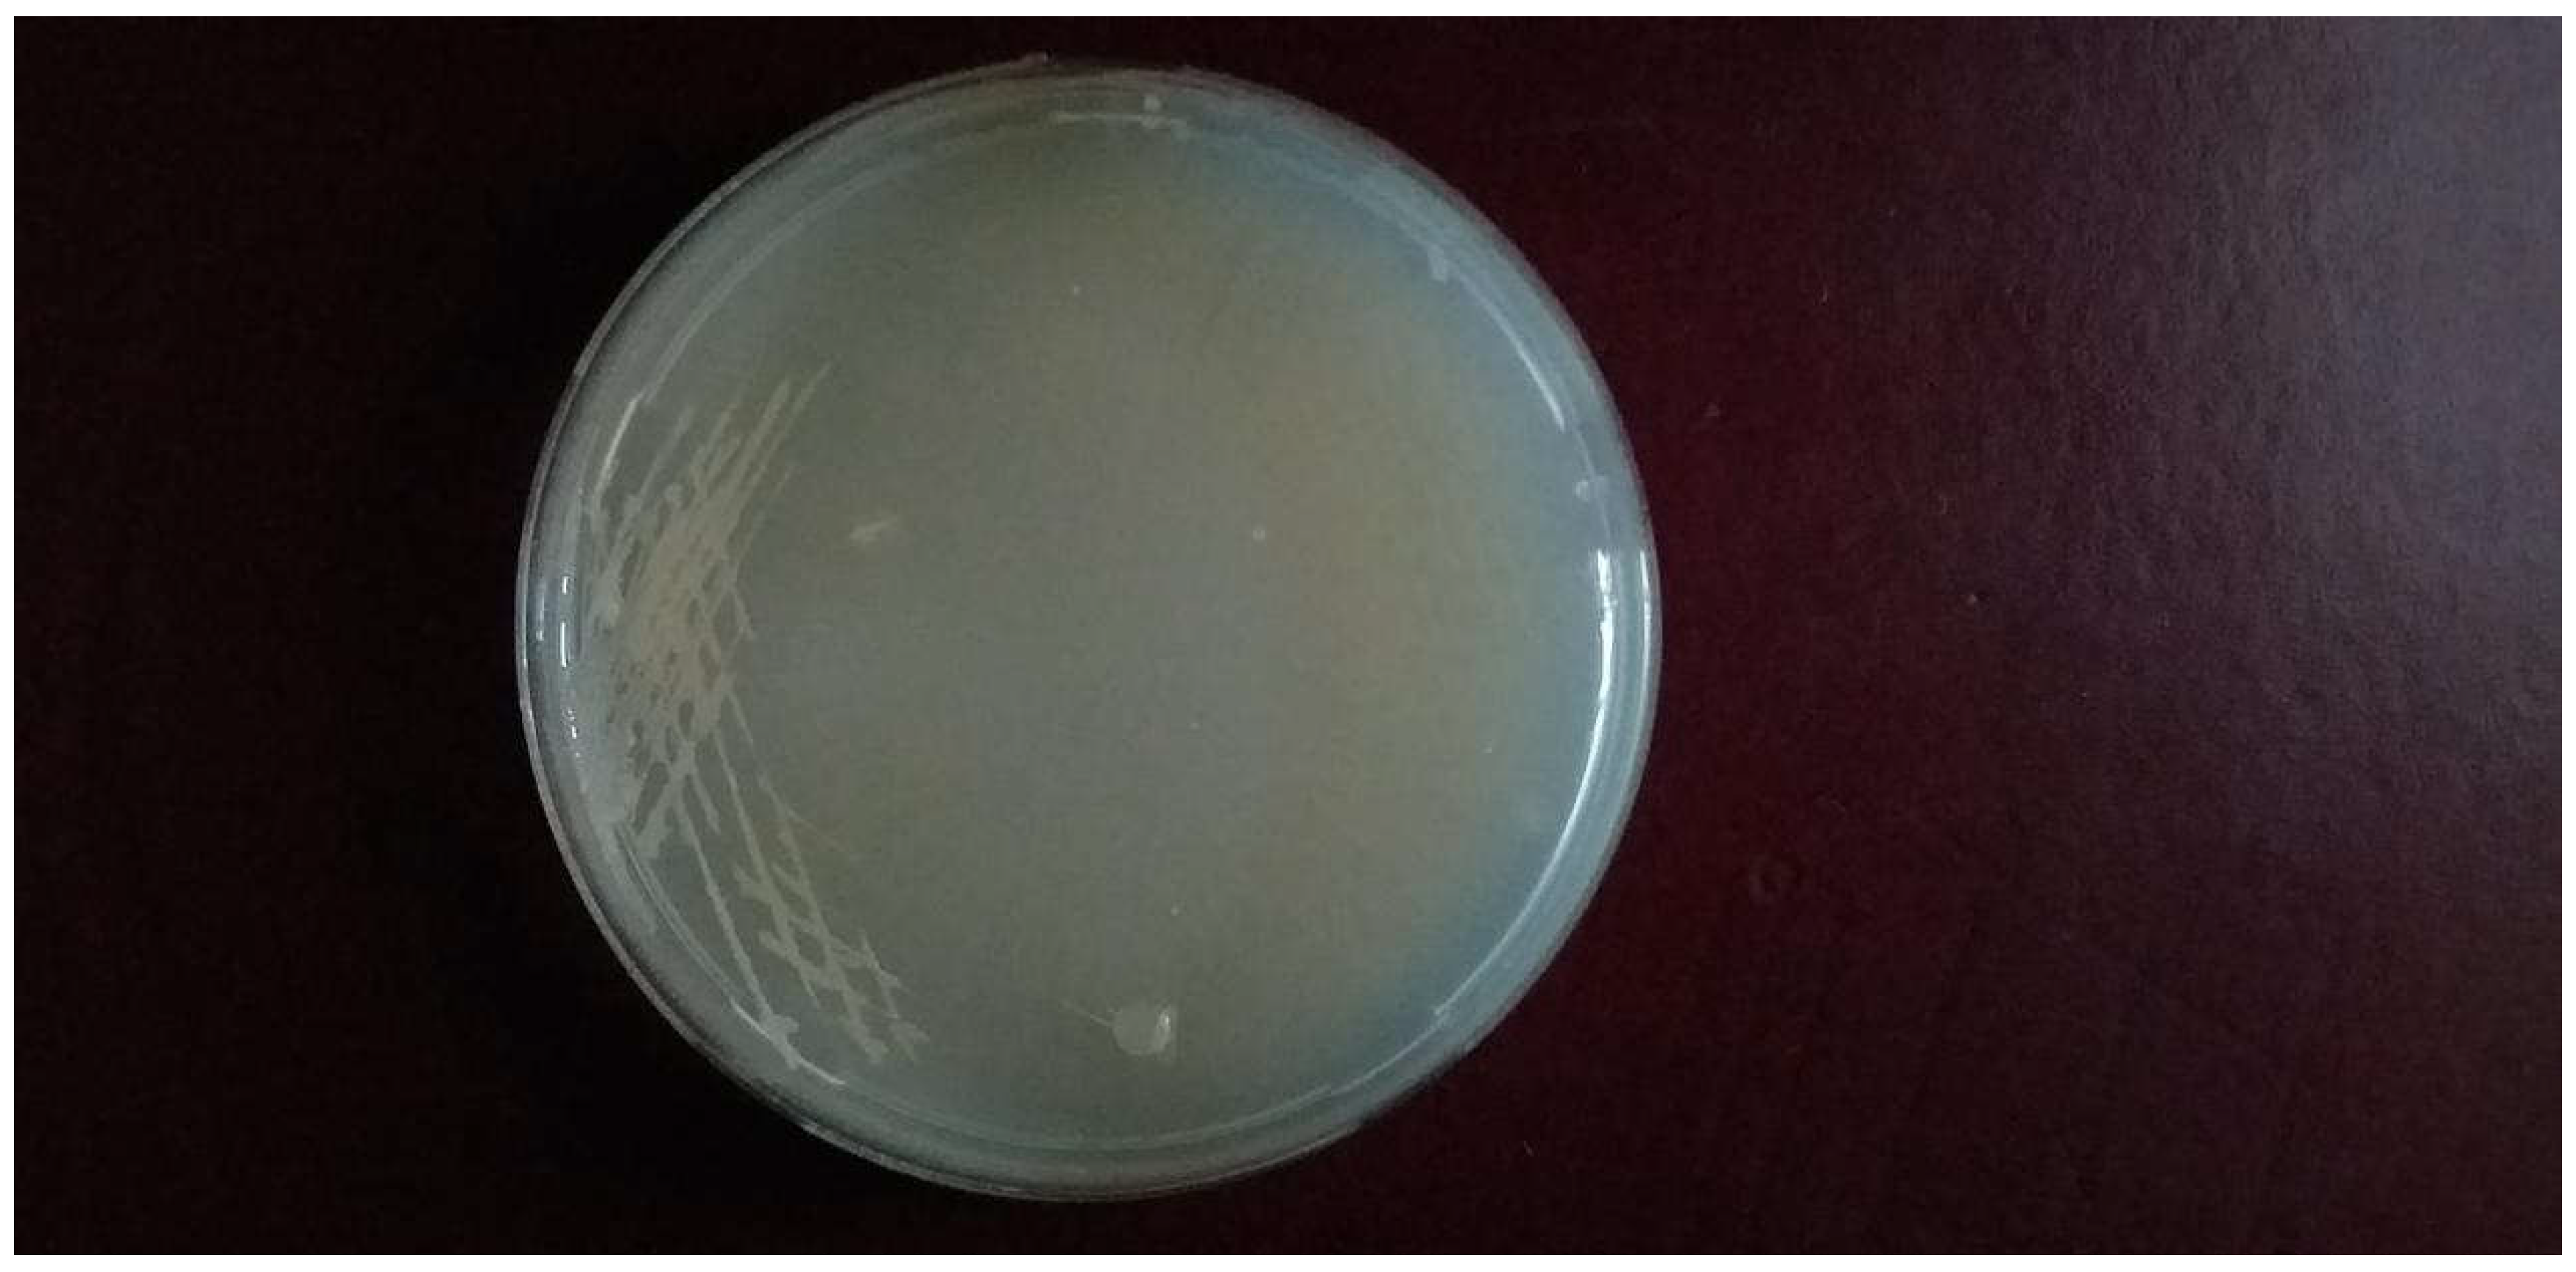
Figure 6.
It shows the effect of different inoculum volumes on FP productivity at PH 7.4, temperature 37℃ and 18 hours incubation time.
Figure 6.
It shows the effect of different inoculum volumes on FP productivity at PH 7.4, temperature 37℃ and 18 hours incubation time.
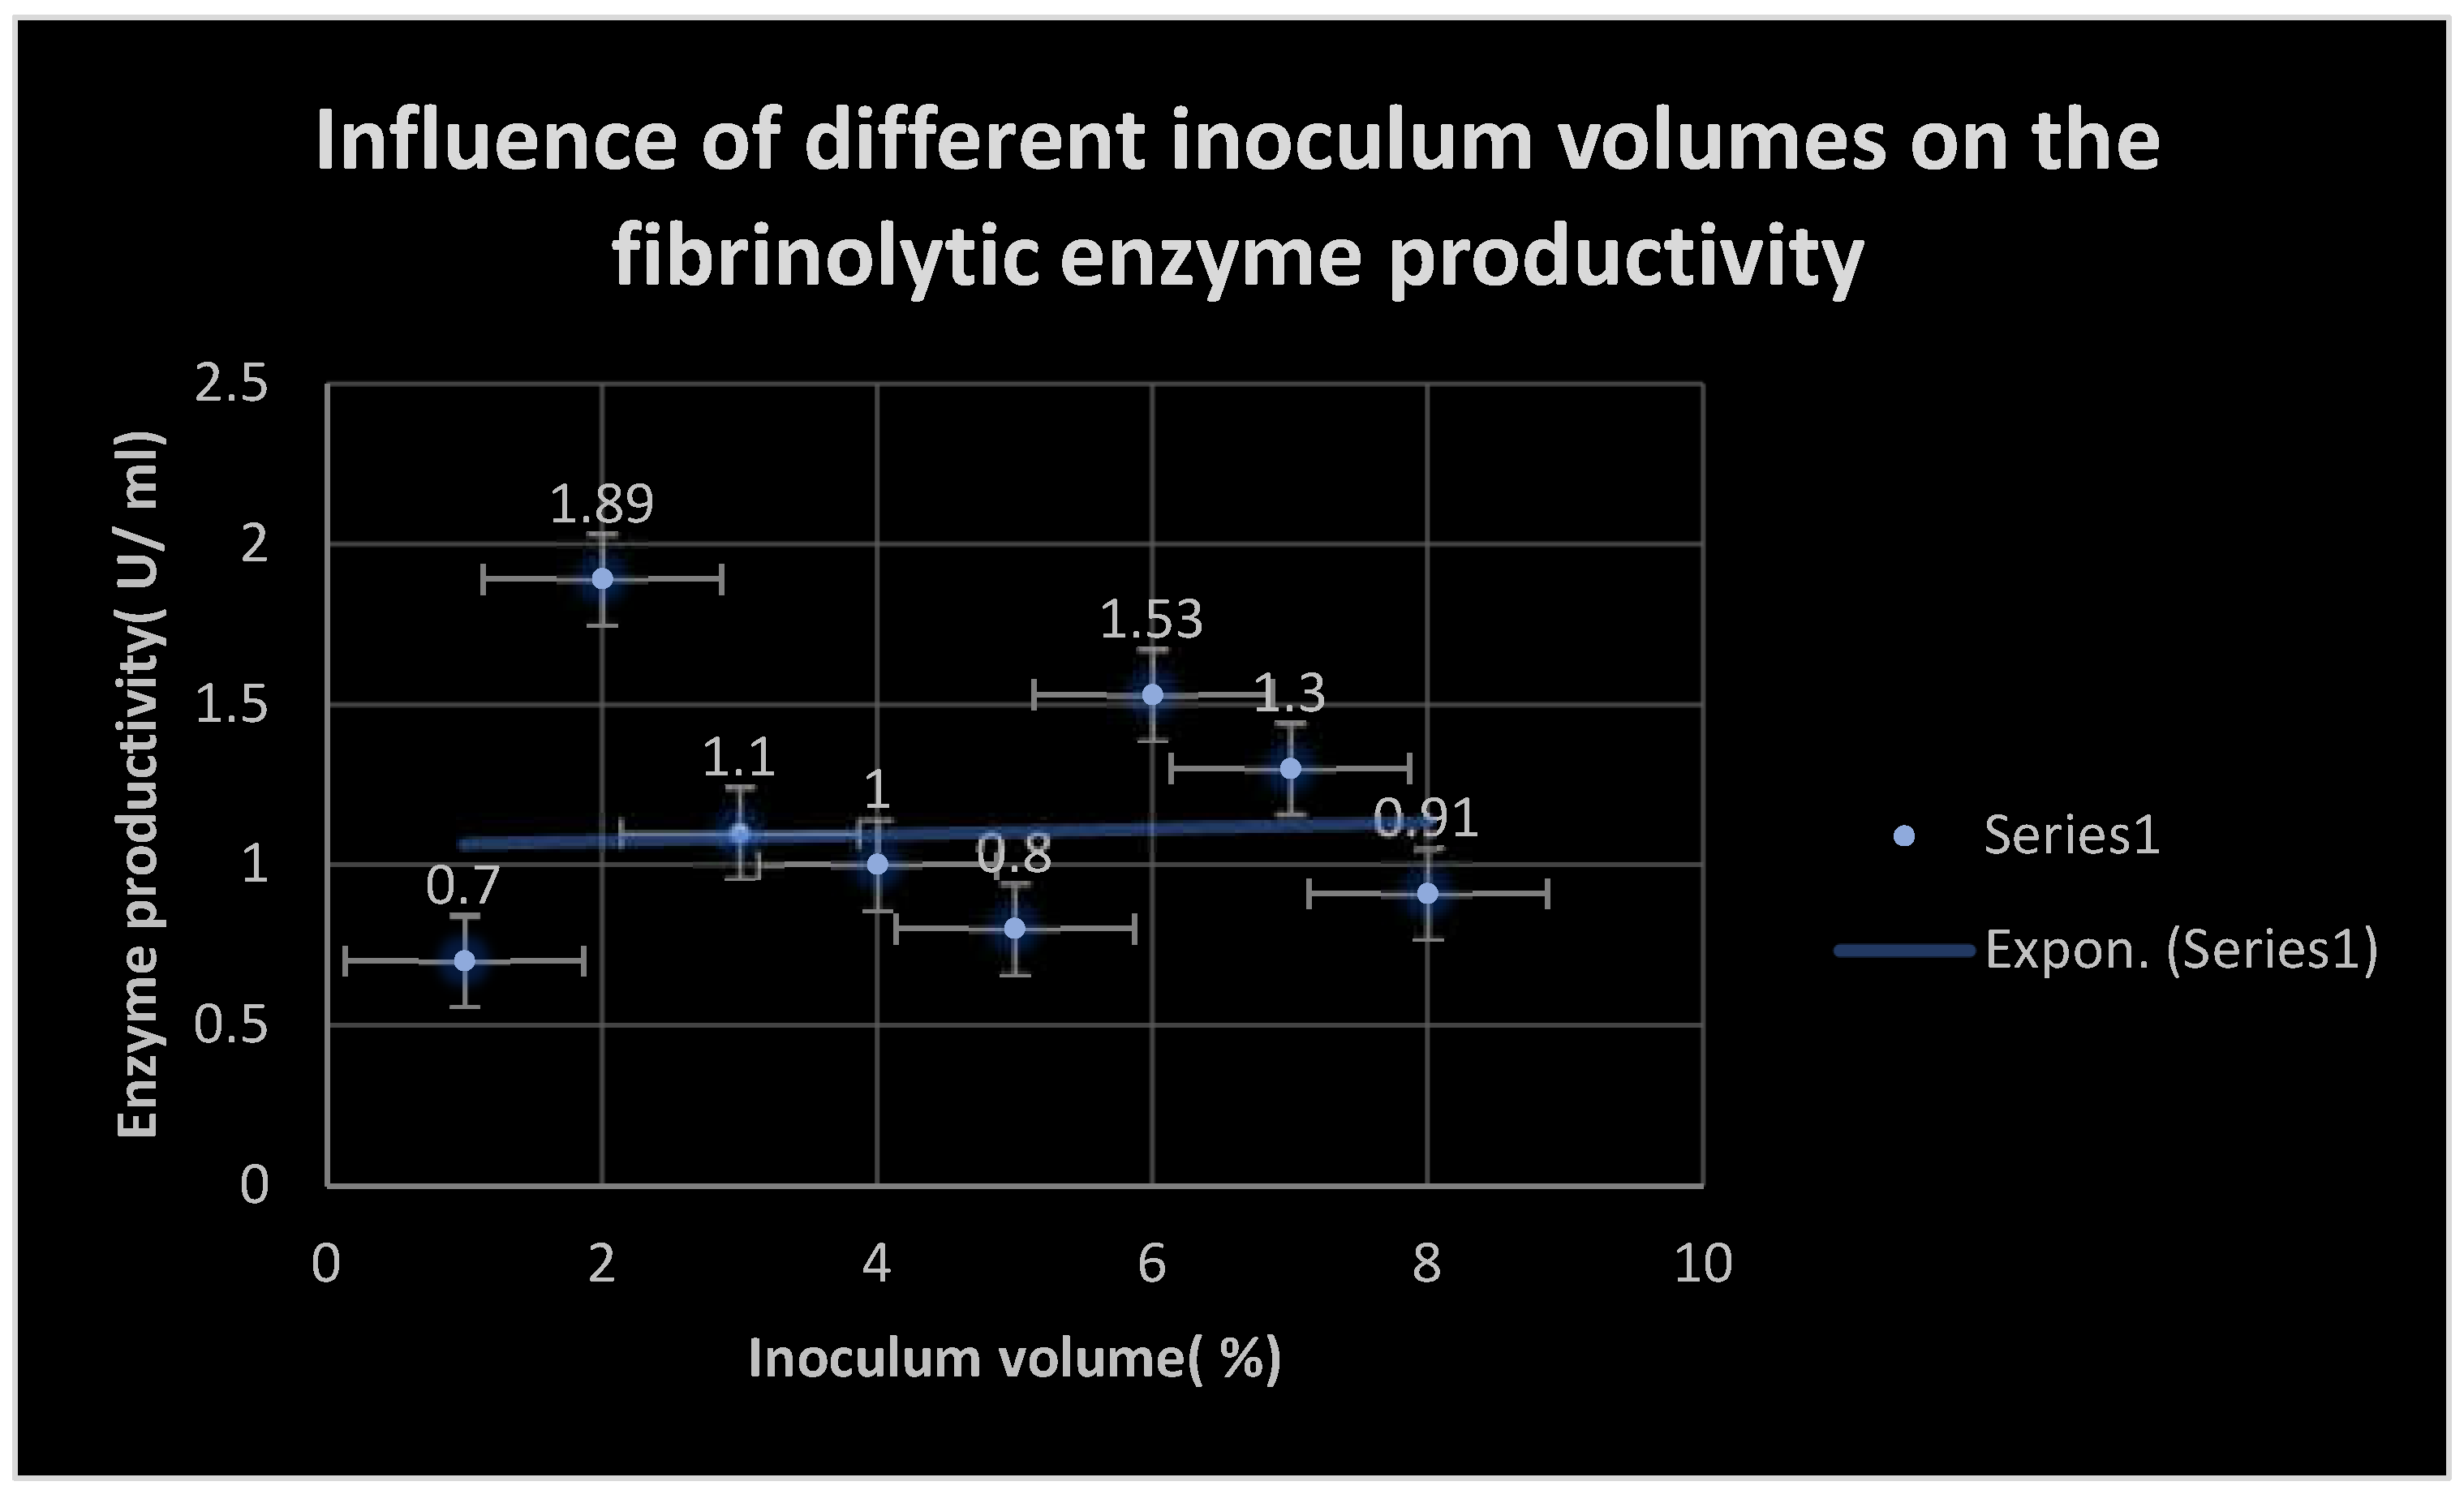
Figure 7.
It demonstrates the effects of different PH values on fibrinolytic enzymes productivity.
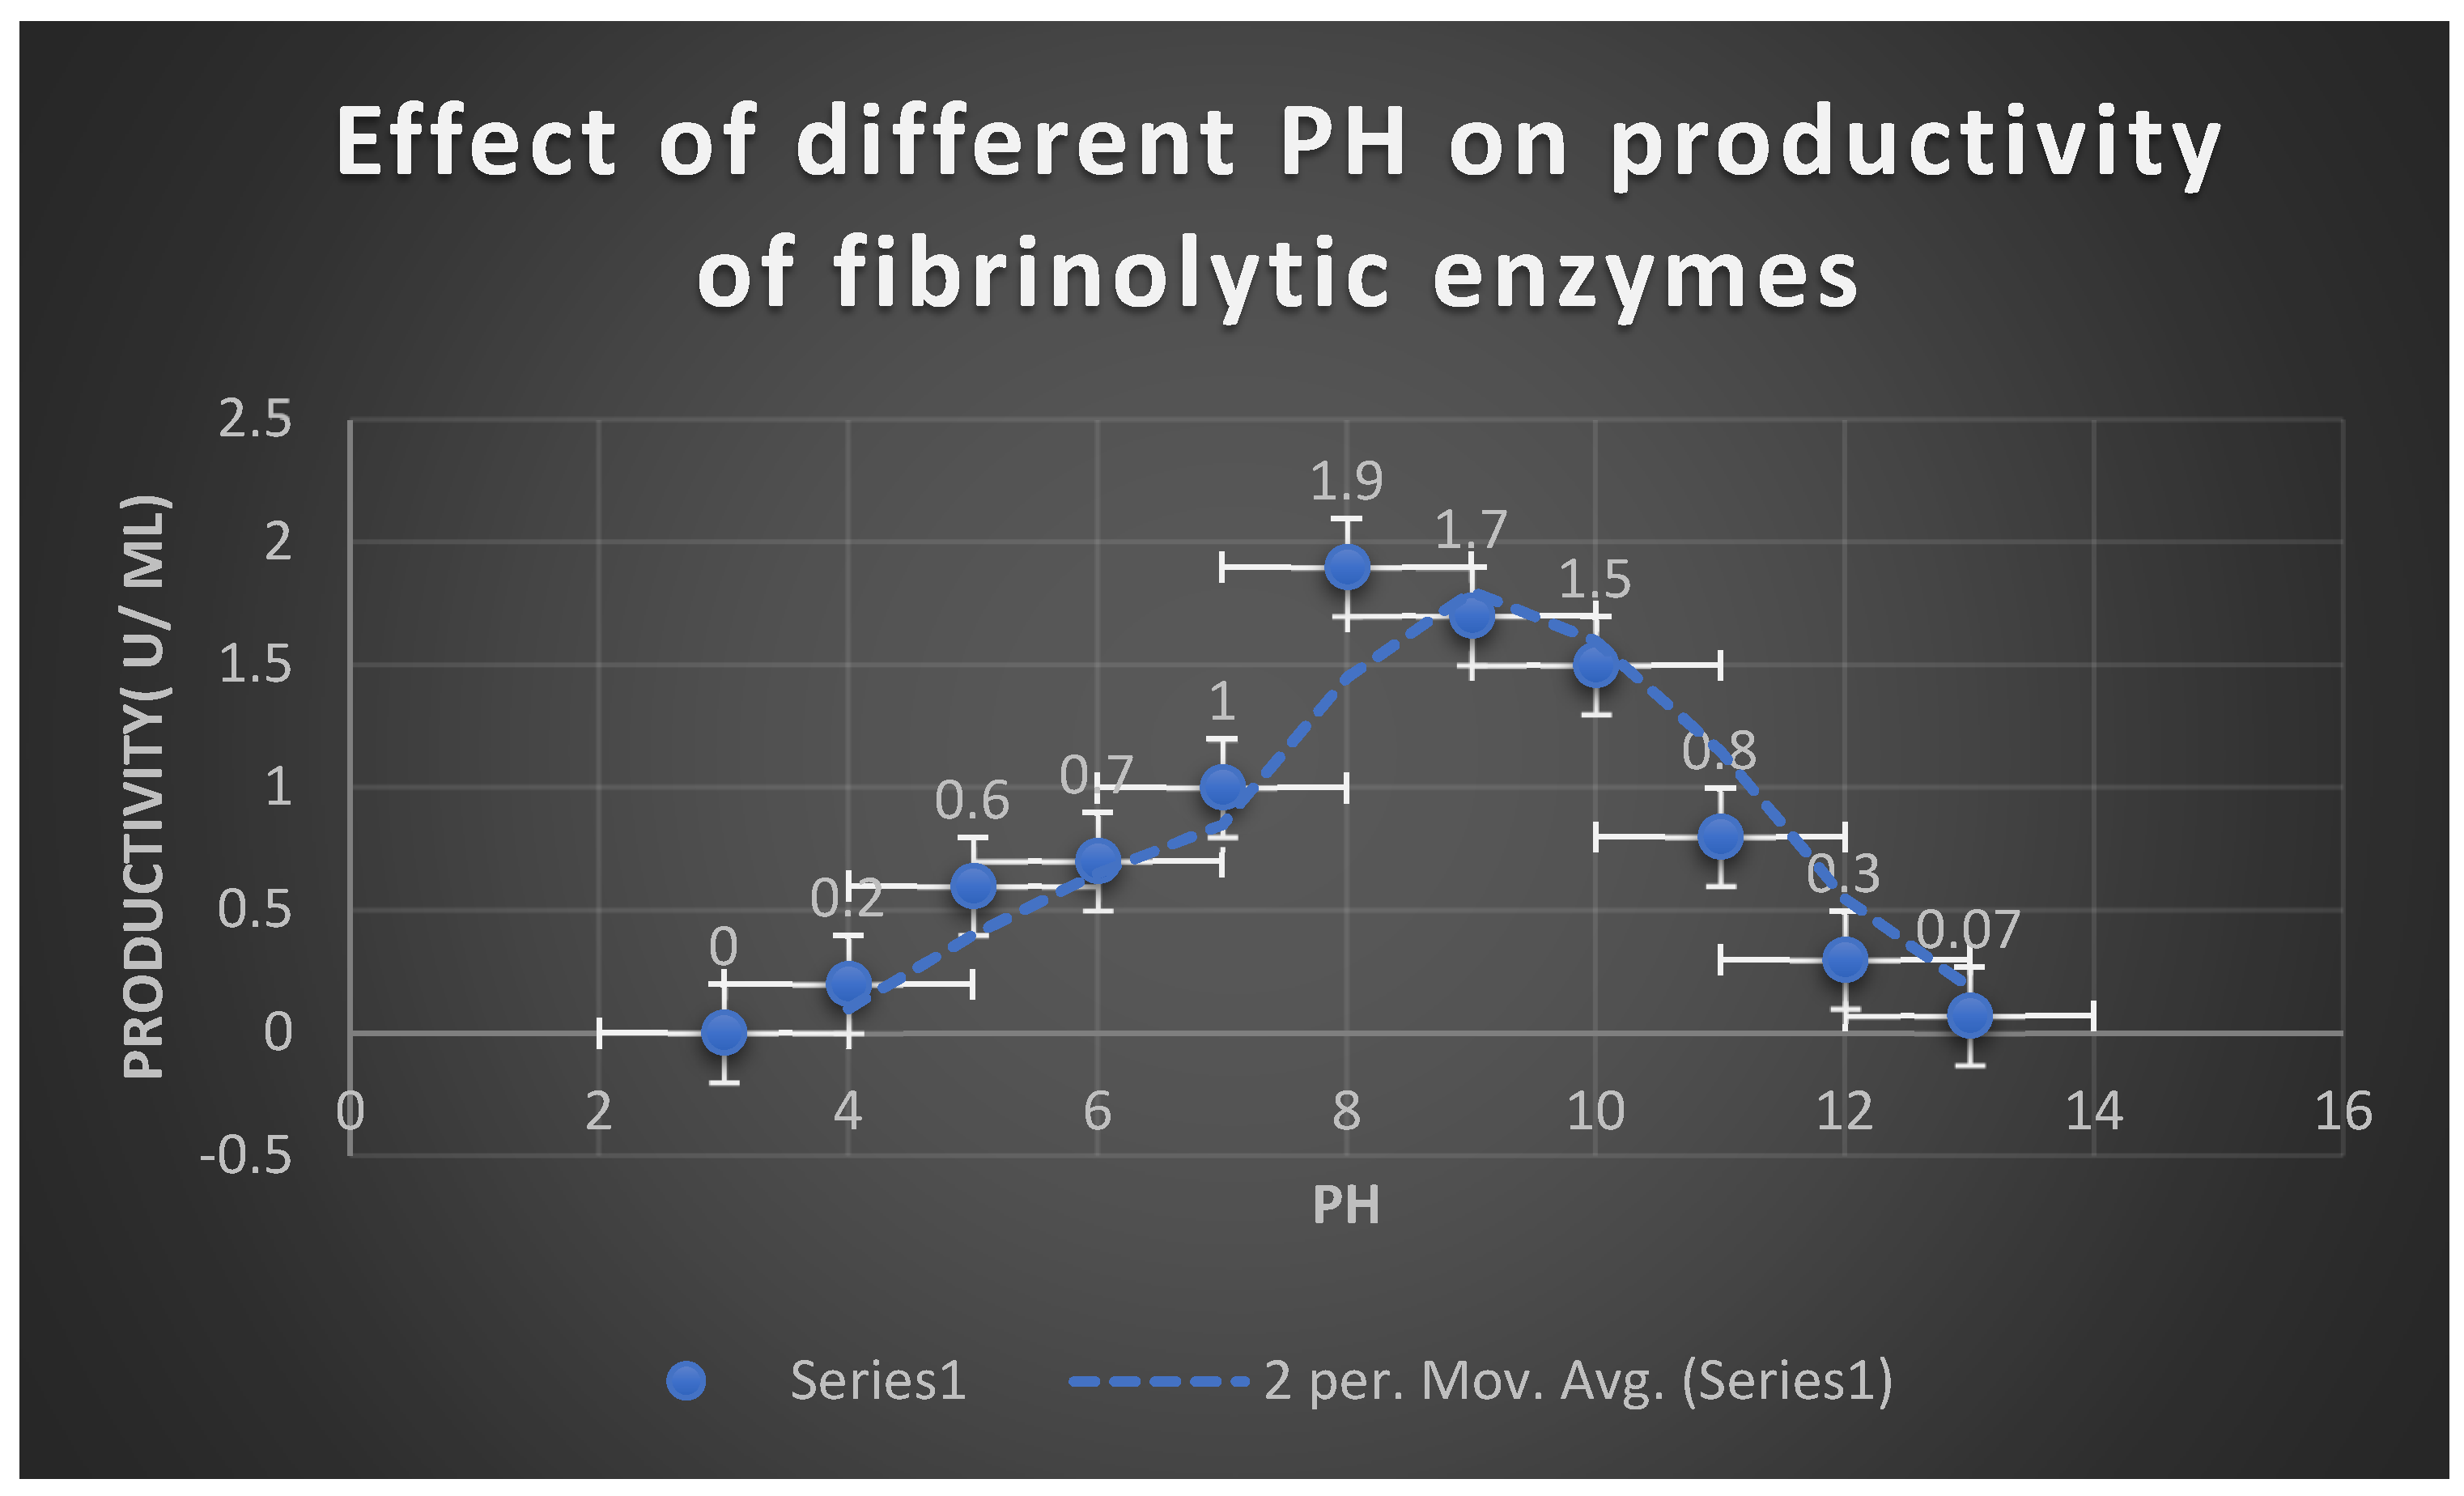
Figure 8.
It demonstrates the effects of various incubation temperatures on fibrinolytic enzyme productivity.
Figure 8.
It demonstrates the effects of various incubation temperatures on fibrinolytic enzyme productivity.
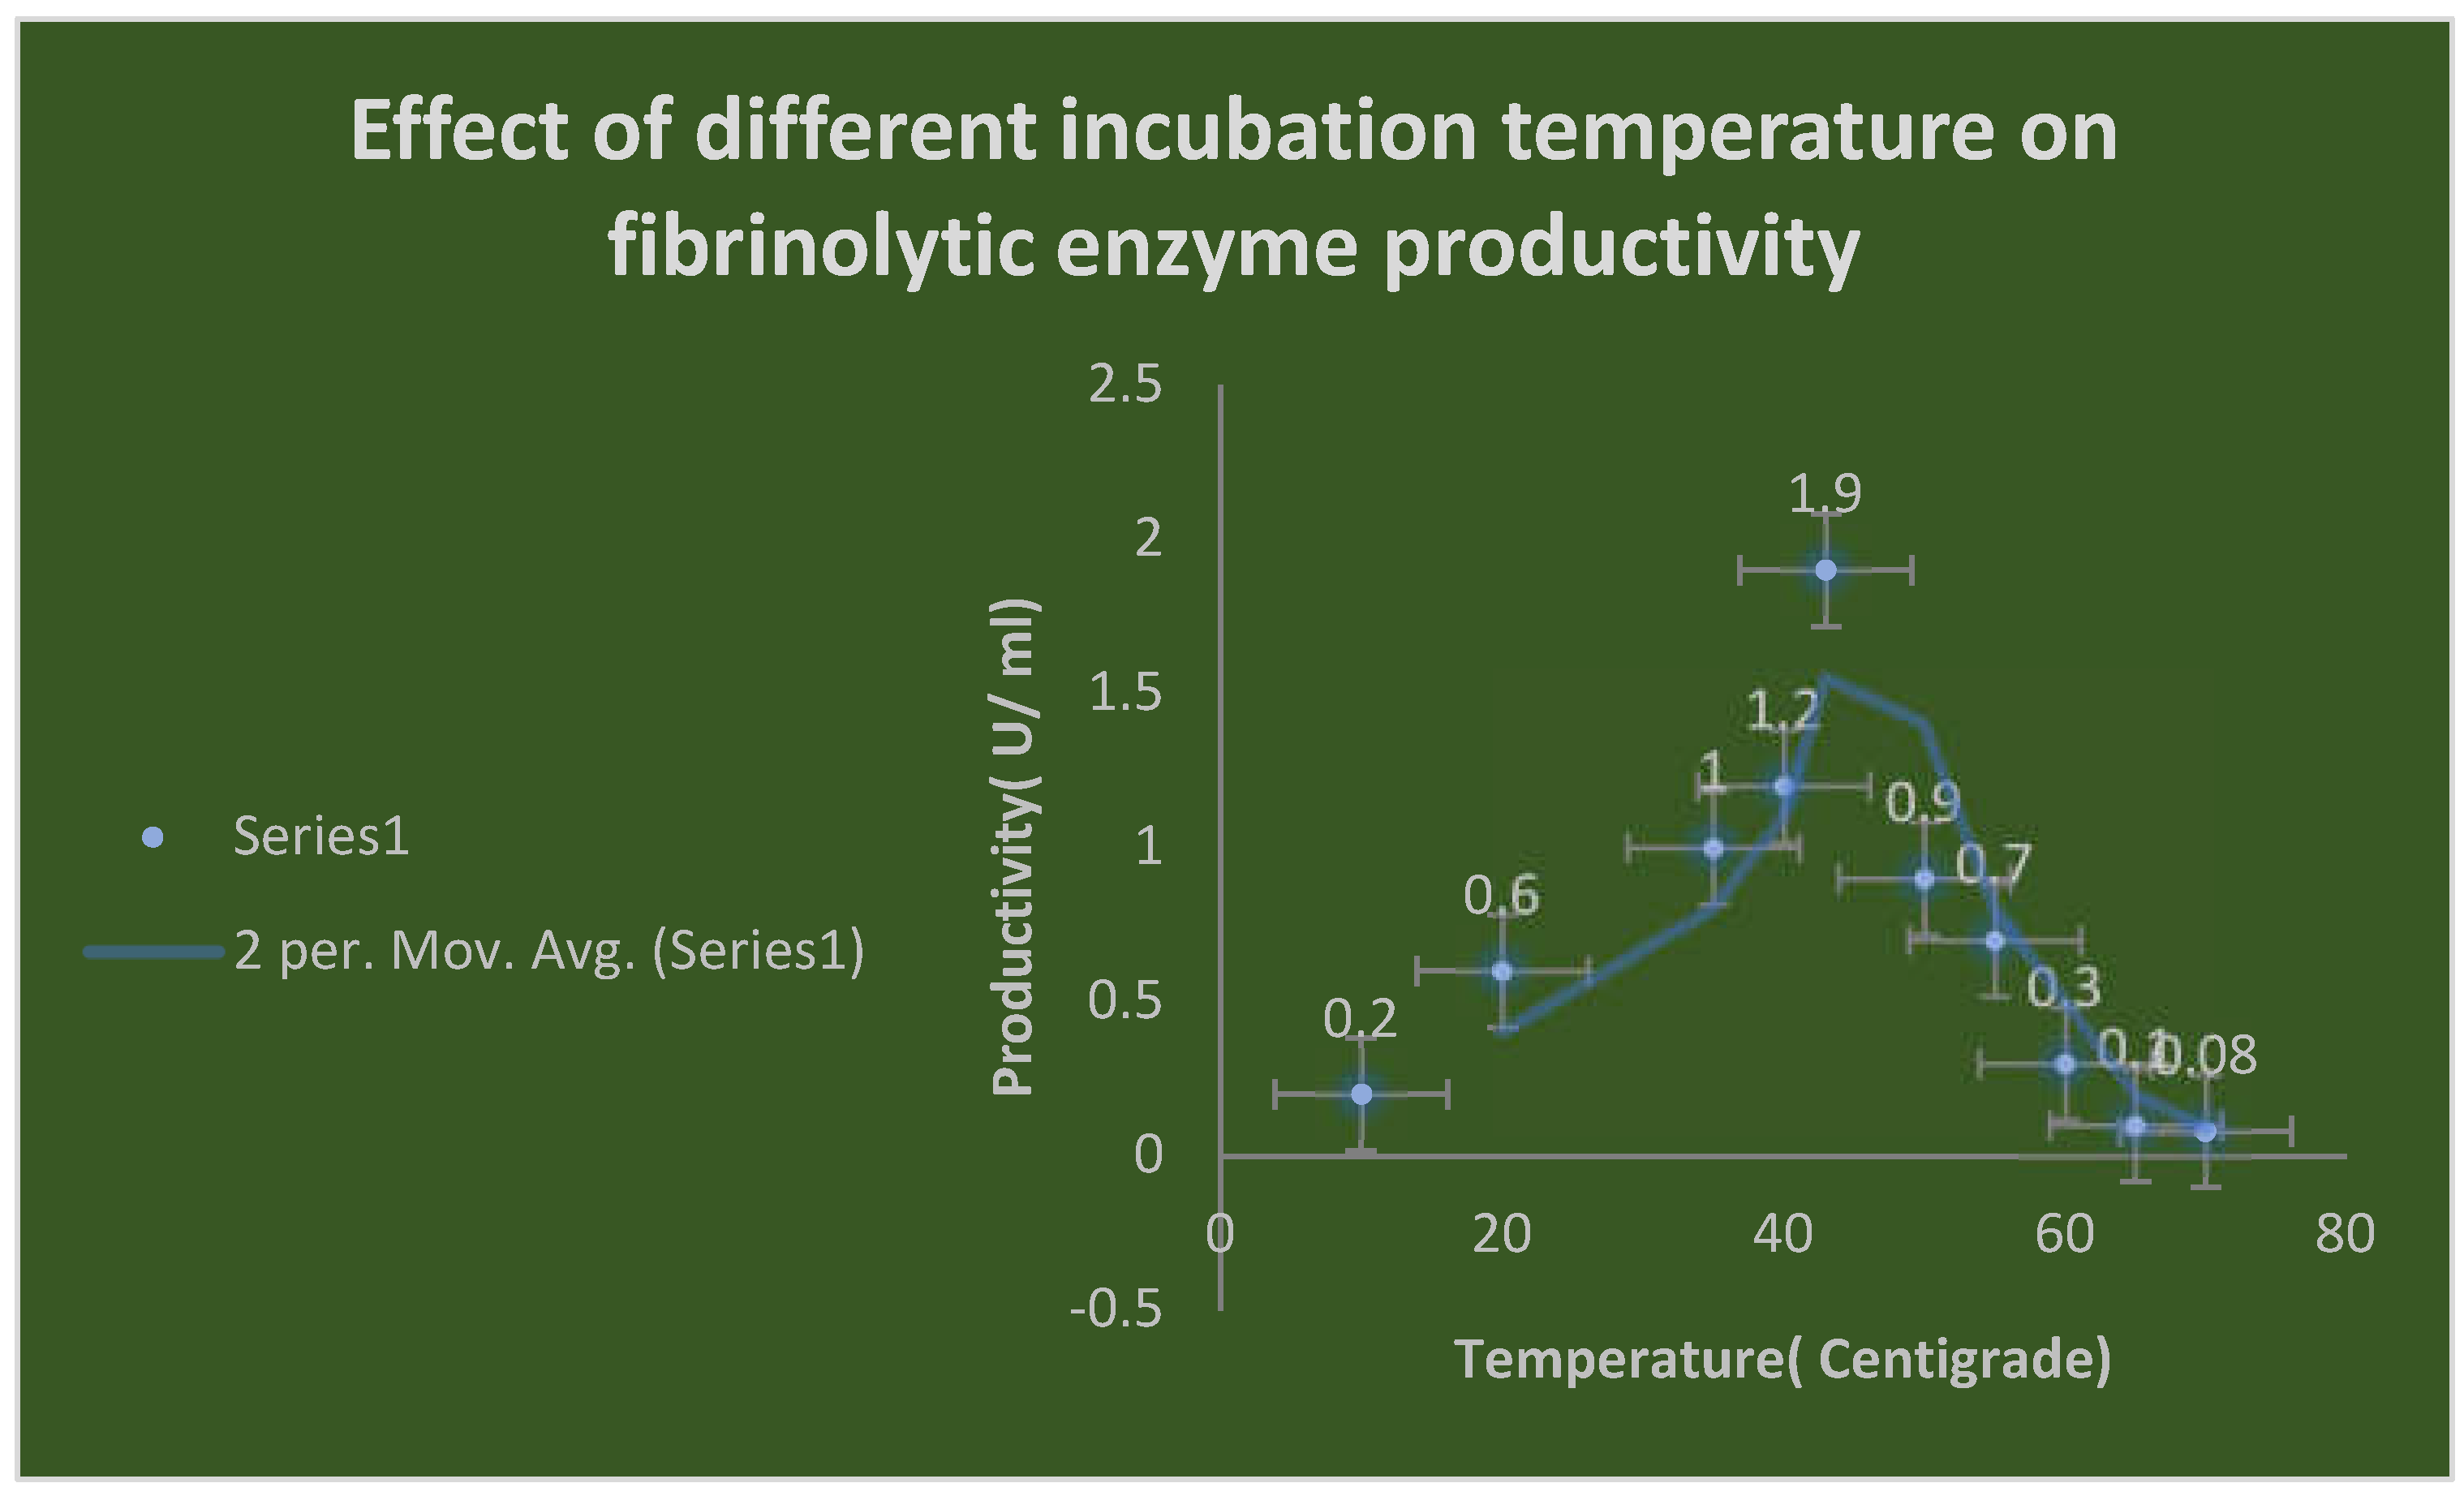
Figure 9.
Effect of different carbon sources on the productivity of fibrinolytic enzymes.
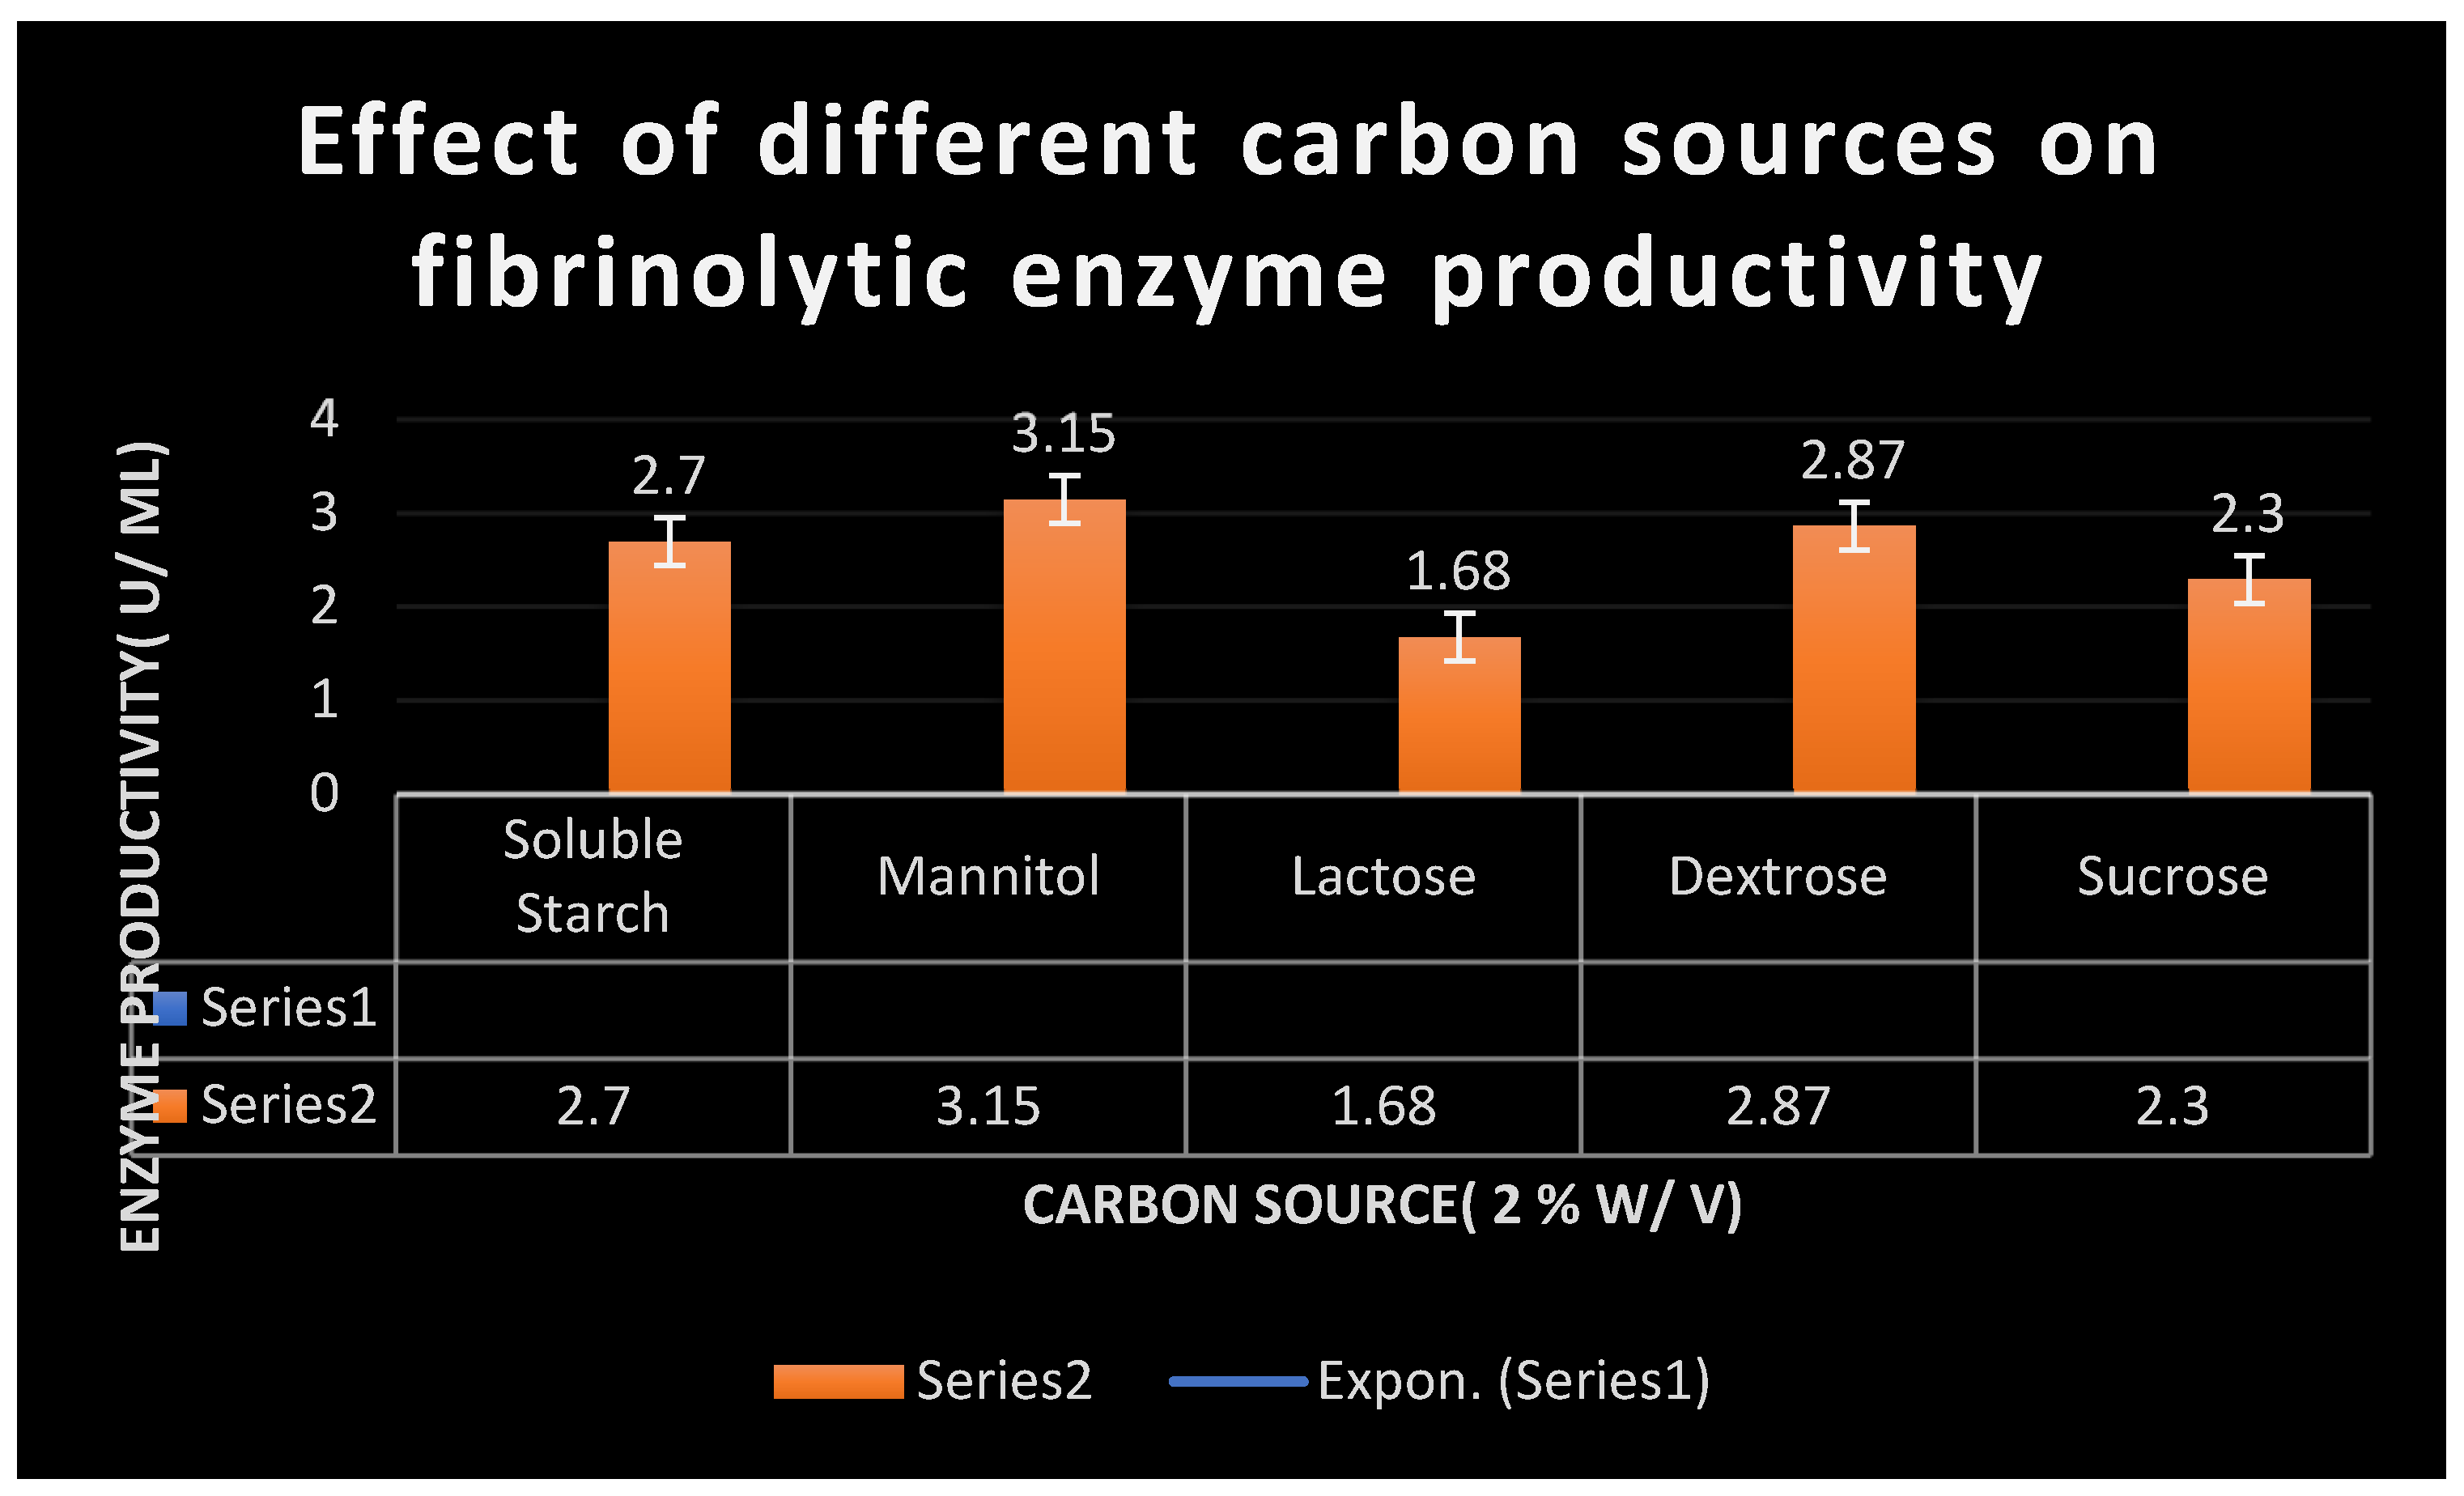
Figure 10.
Effect of different nitrogen sources on the productivity of fibrinolytic enzymes.
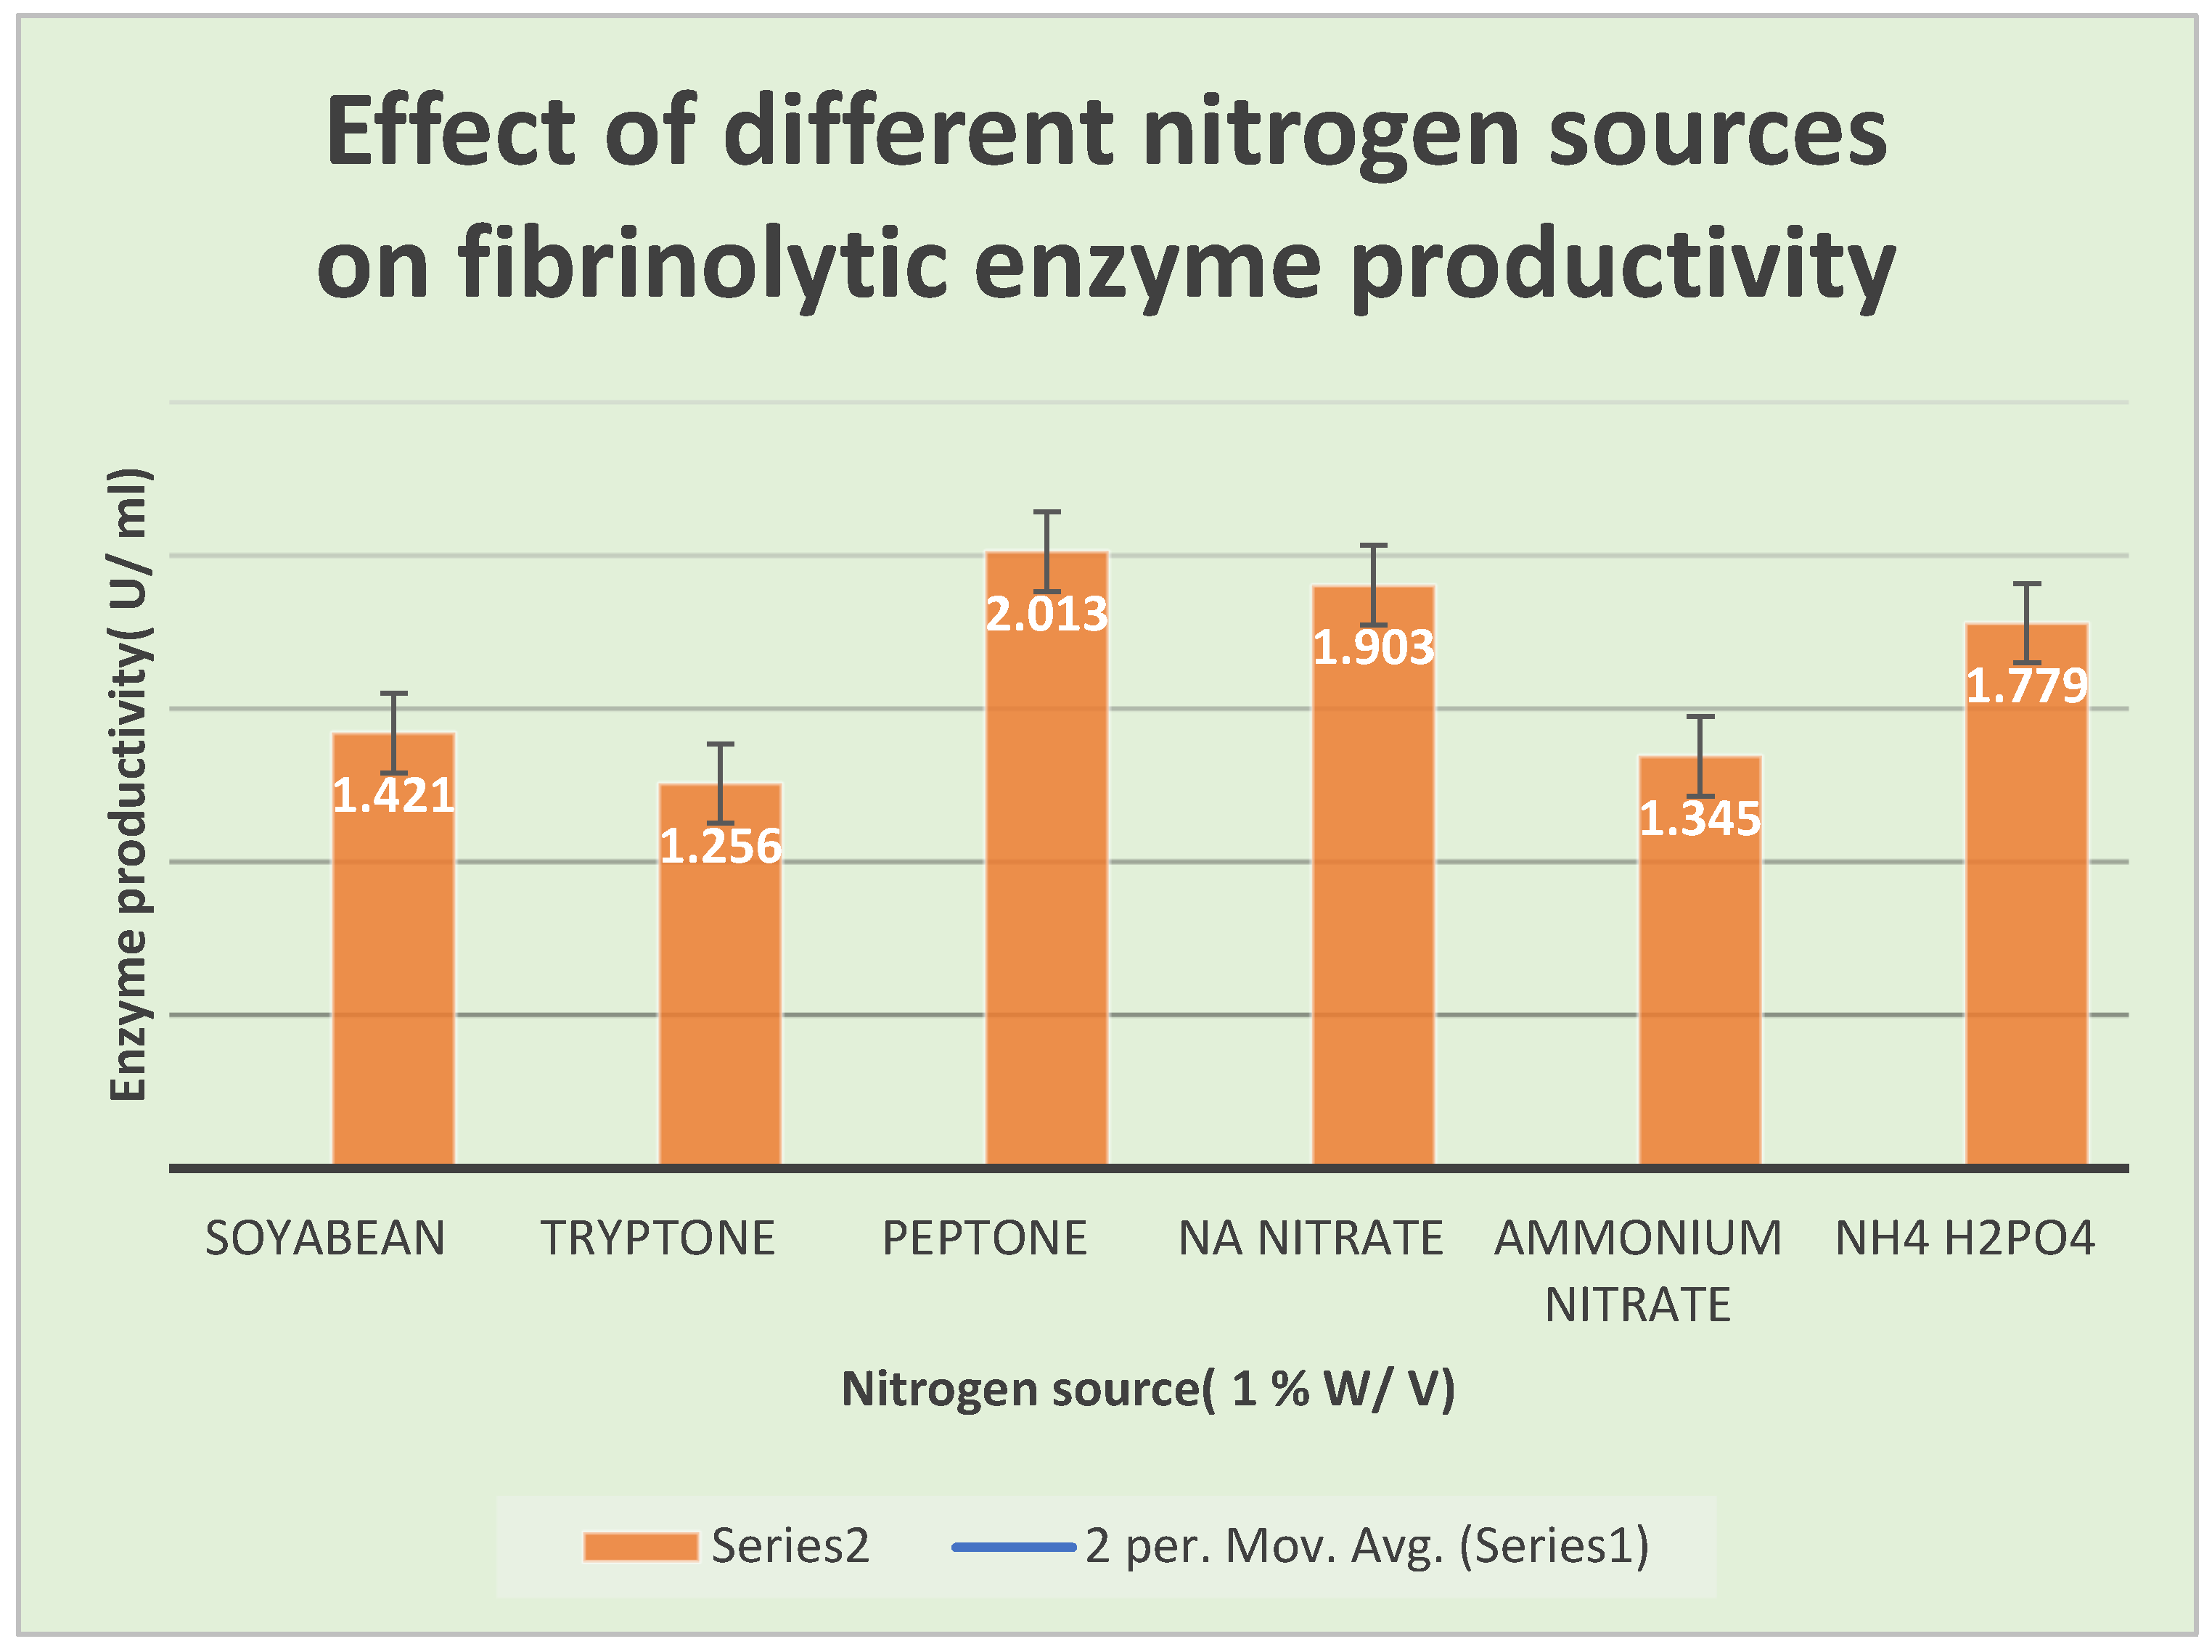
Figure 11.
It shows Michaelis Menten Plot.
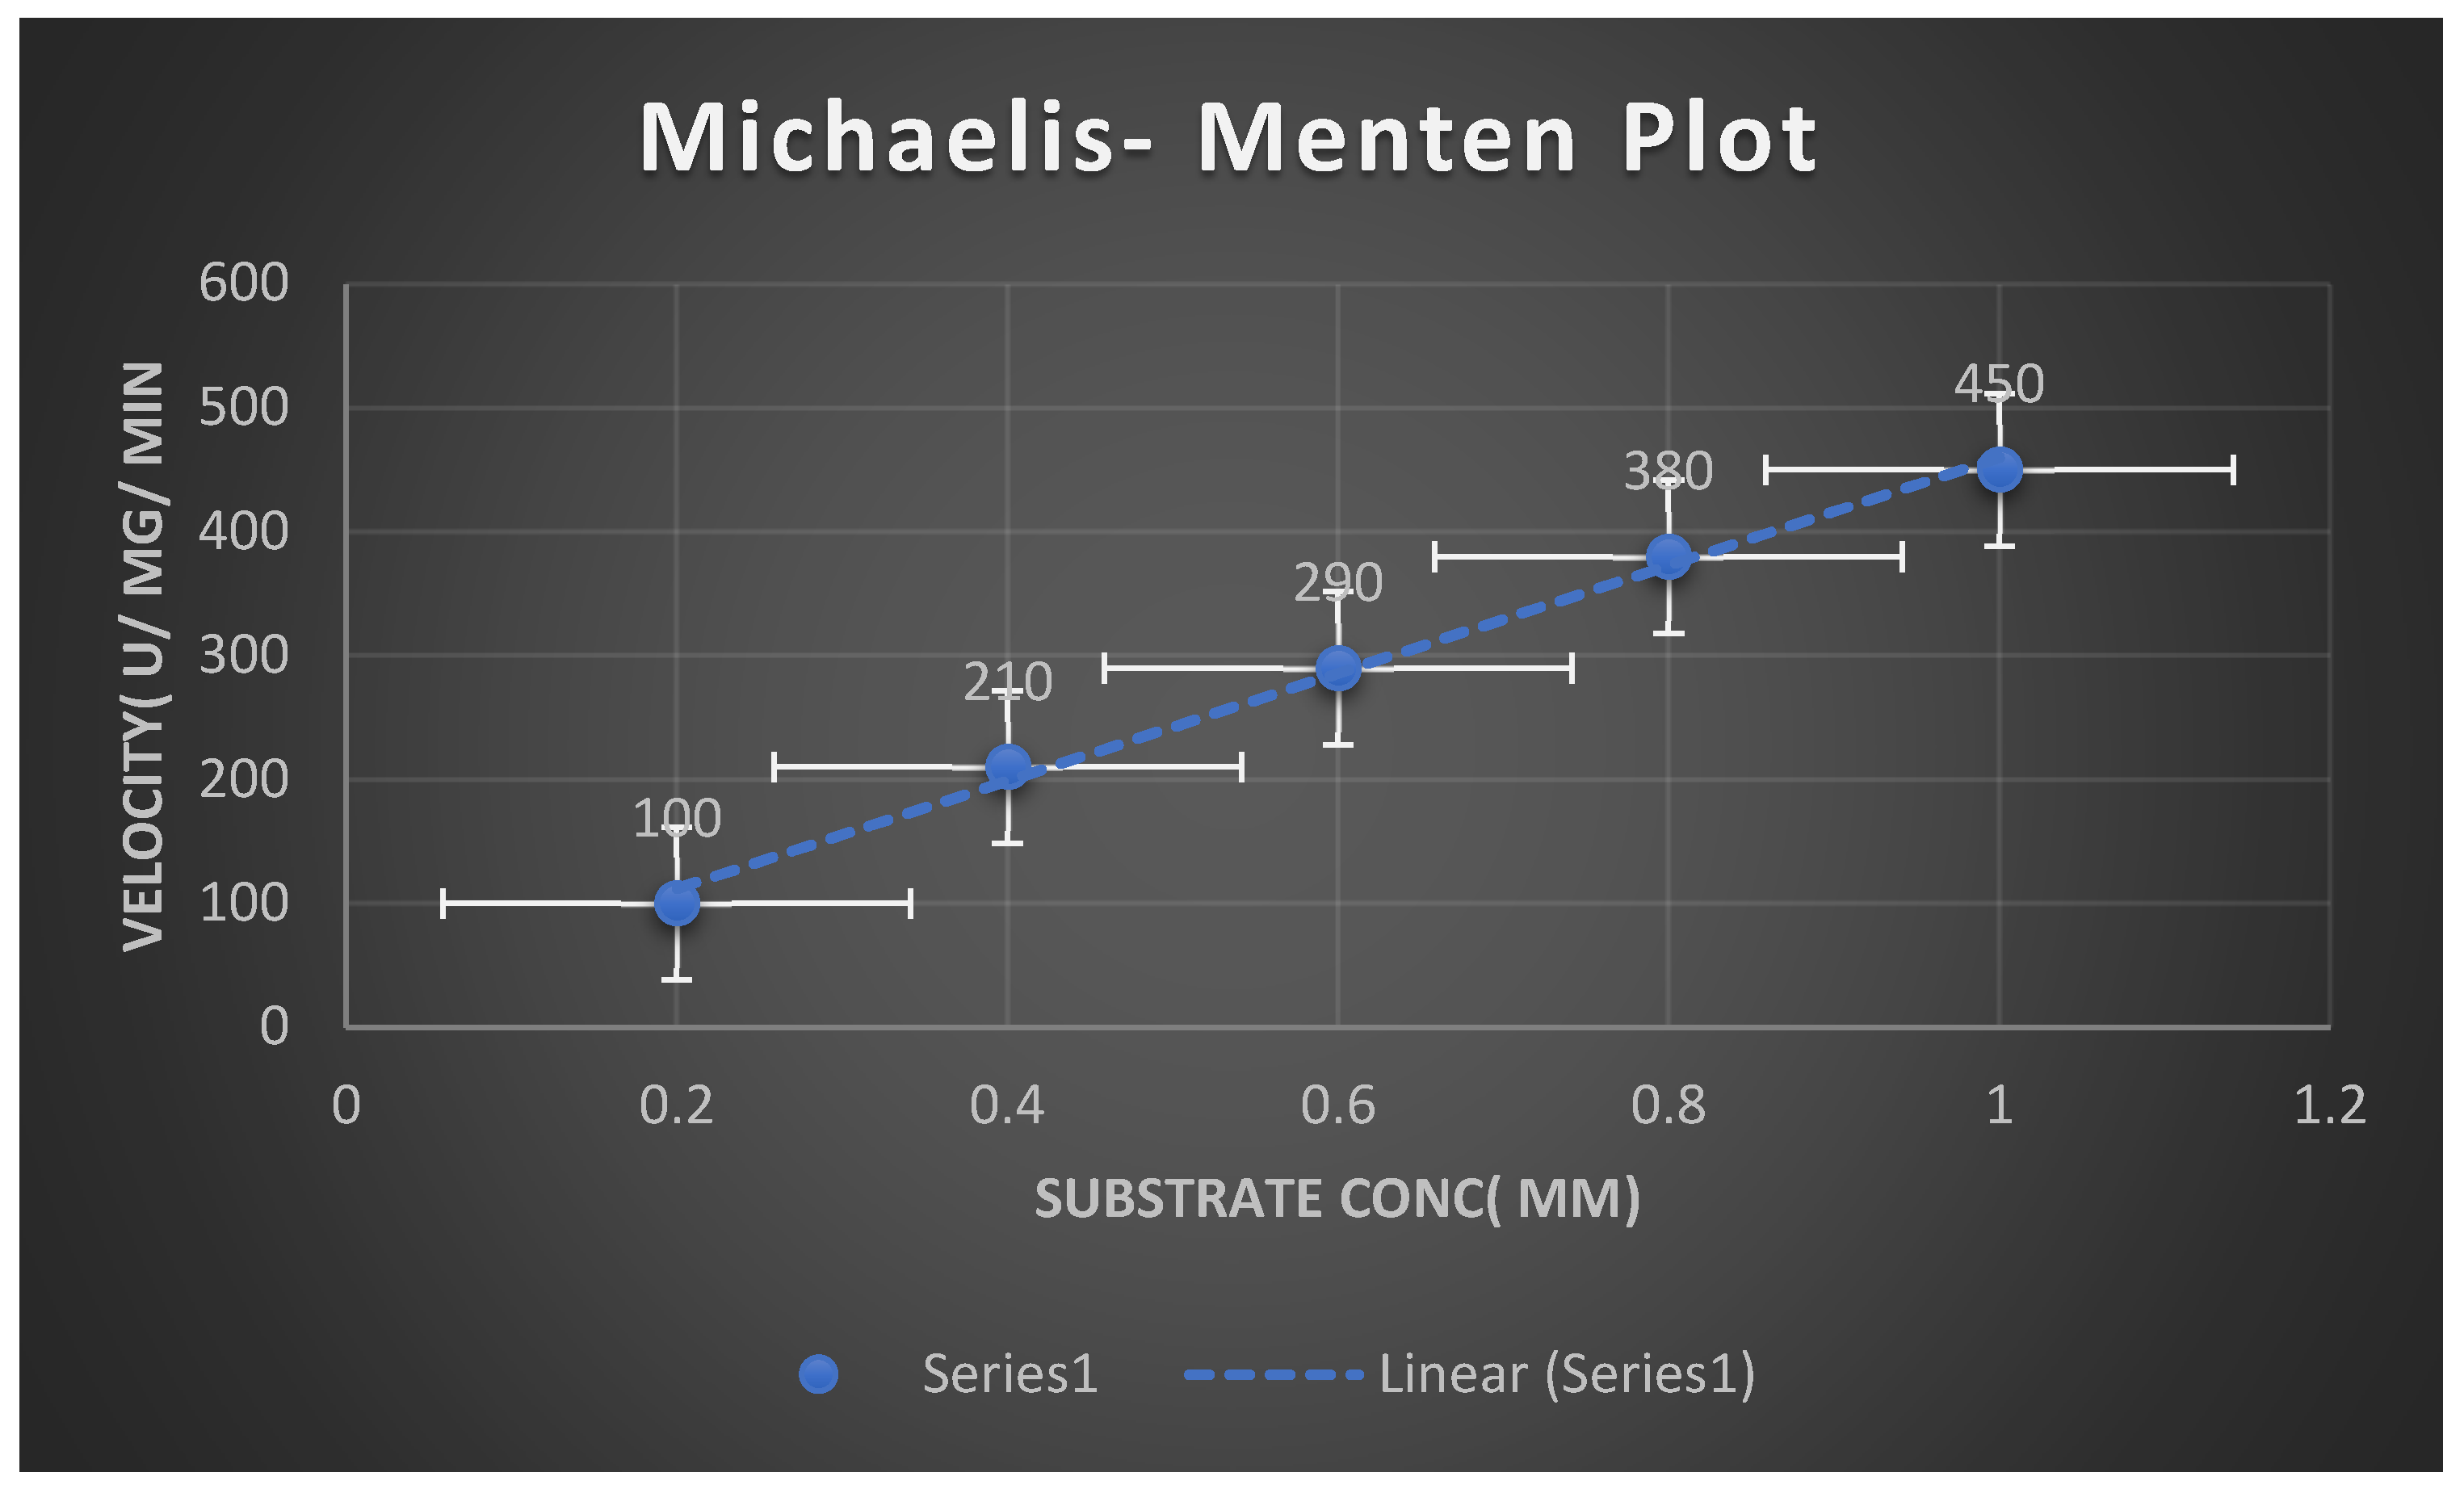
Figure 12.
Effect of temperature on fibrinolytic enzyme activity.
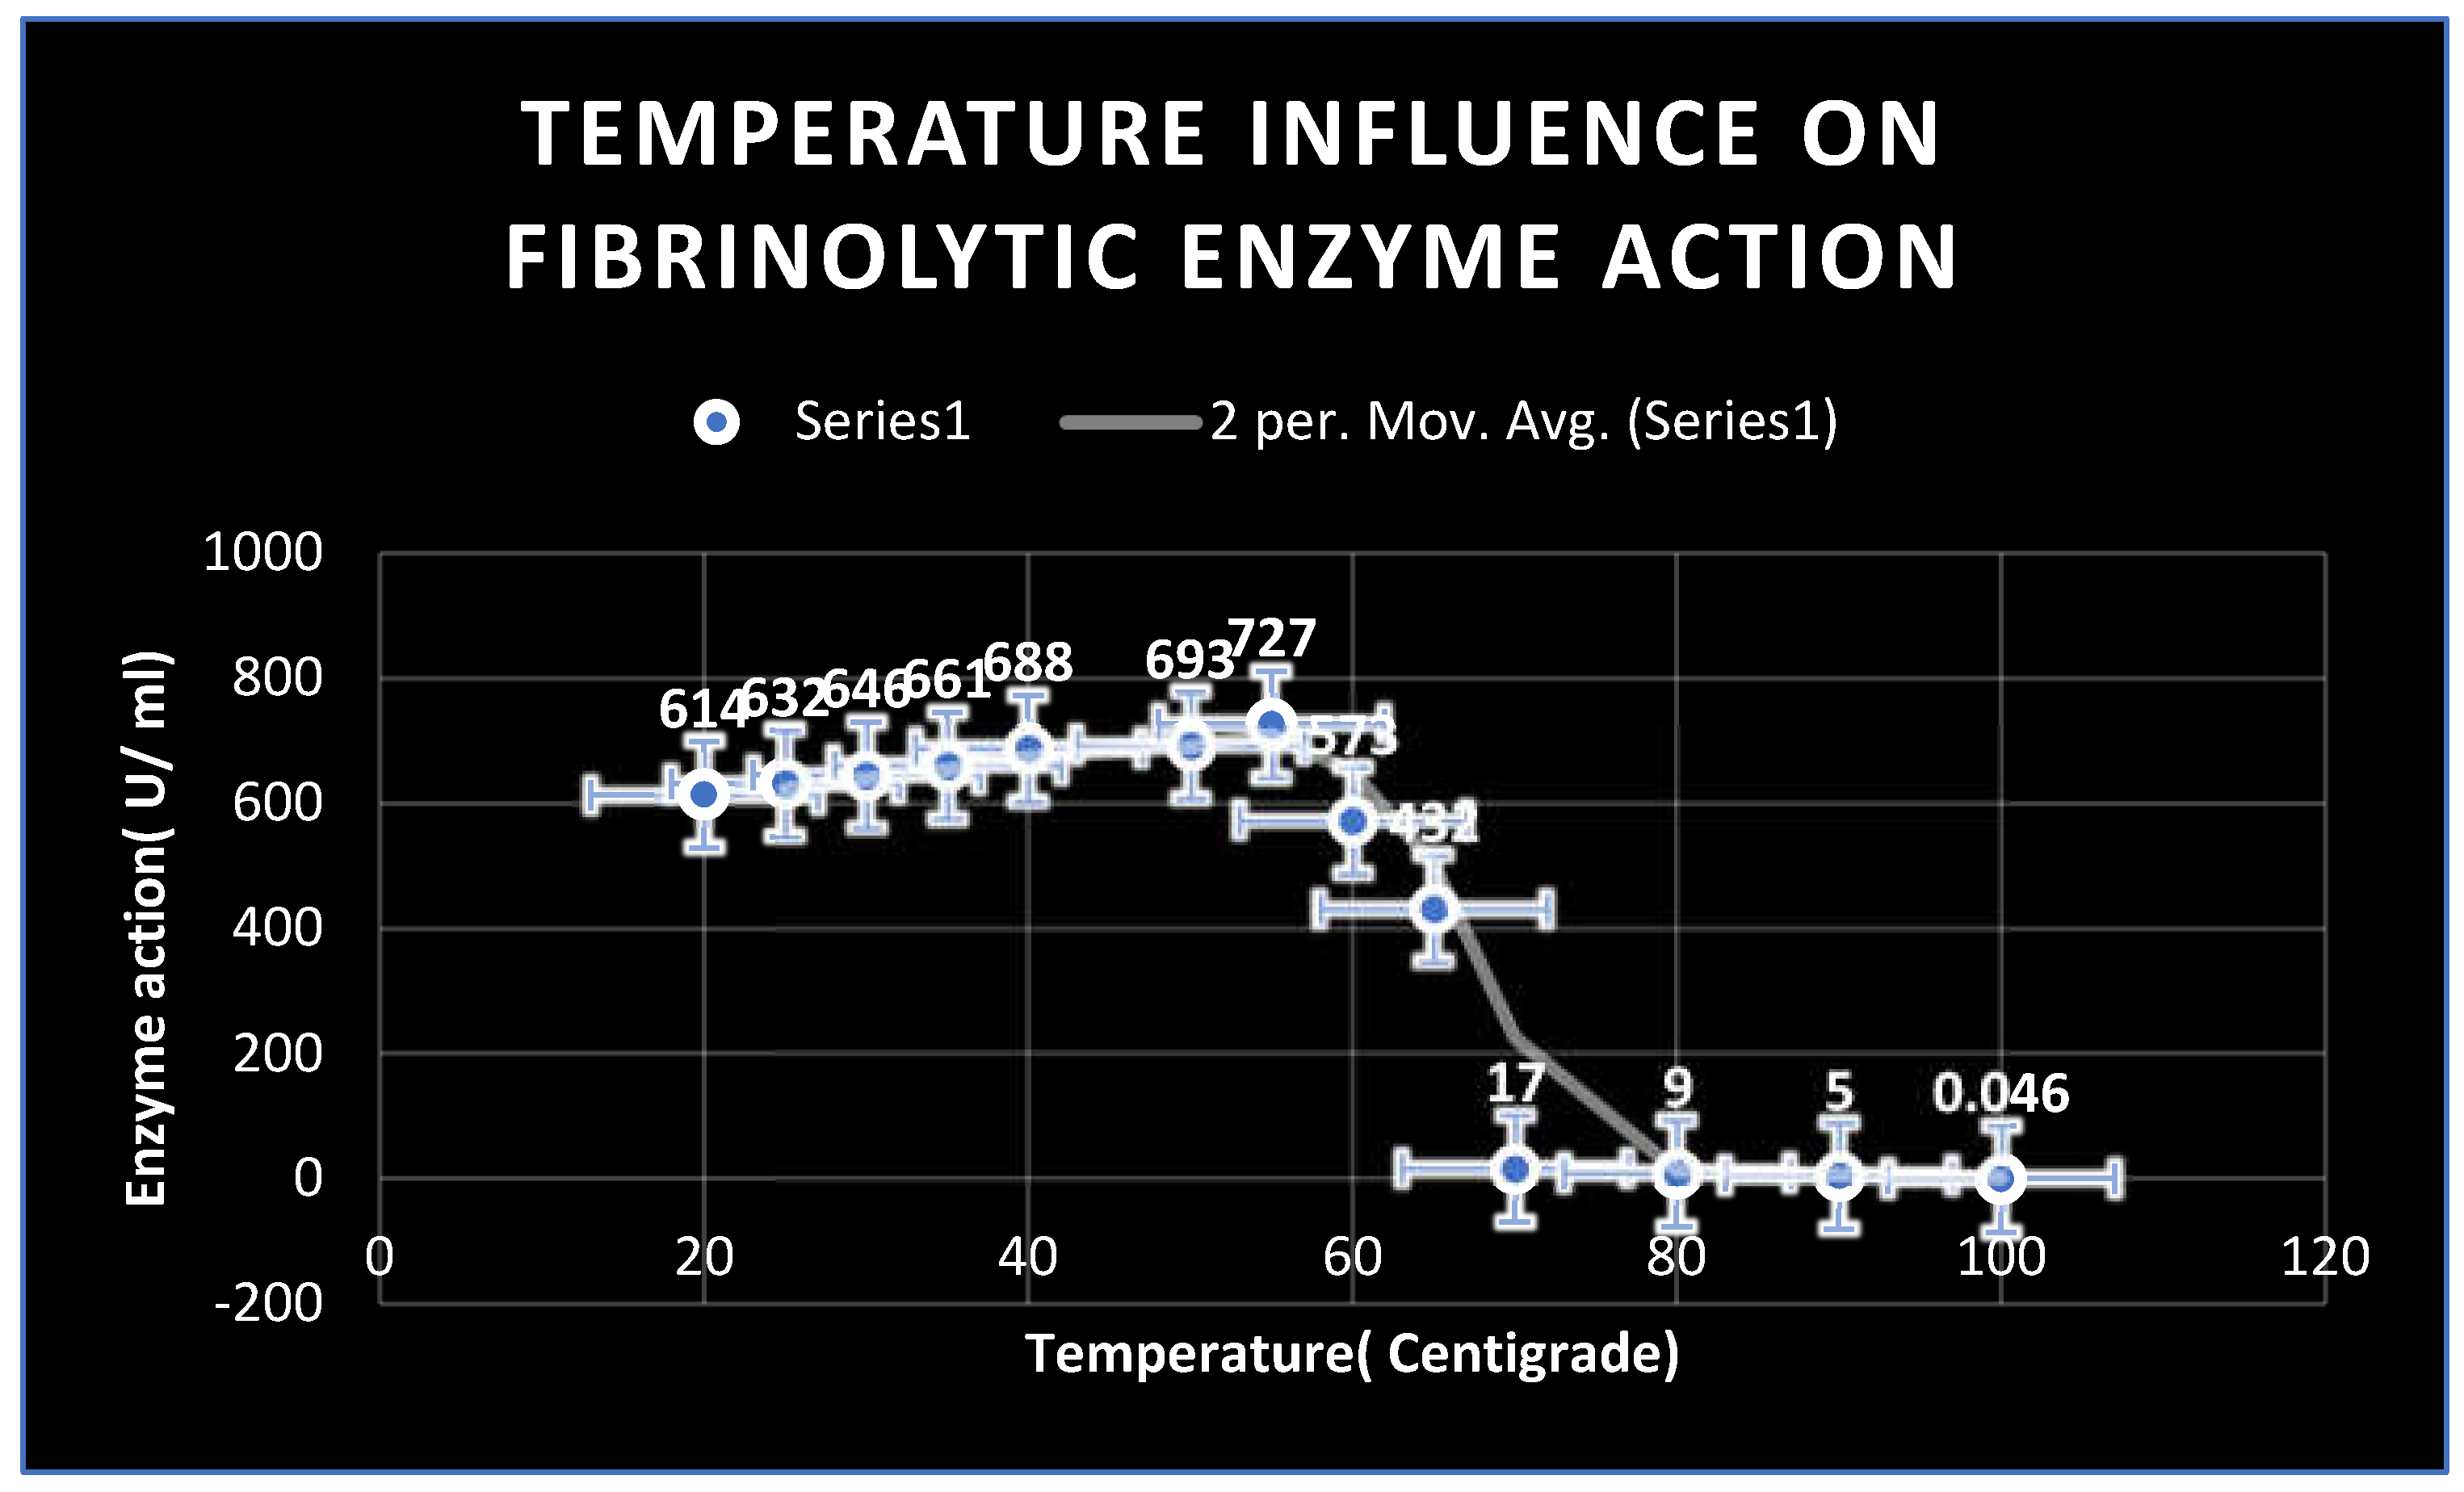
Figure 13.
It demonstrates the effects of different PH values on the fibrinolytic enzyme action.
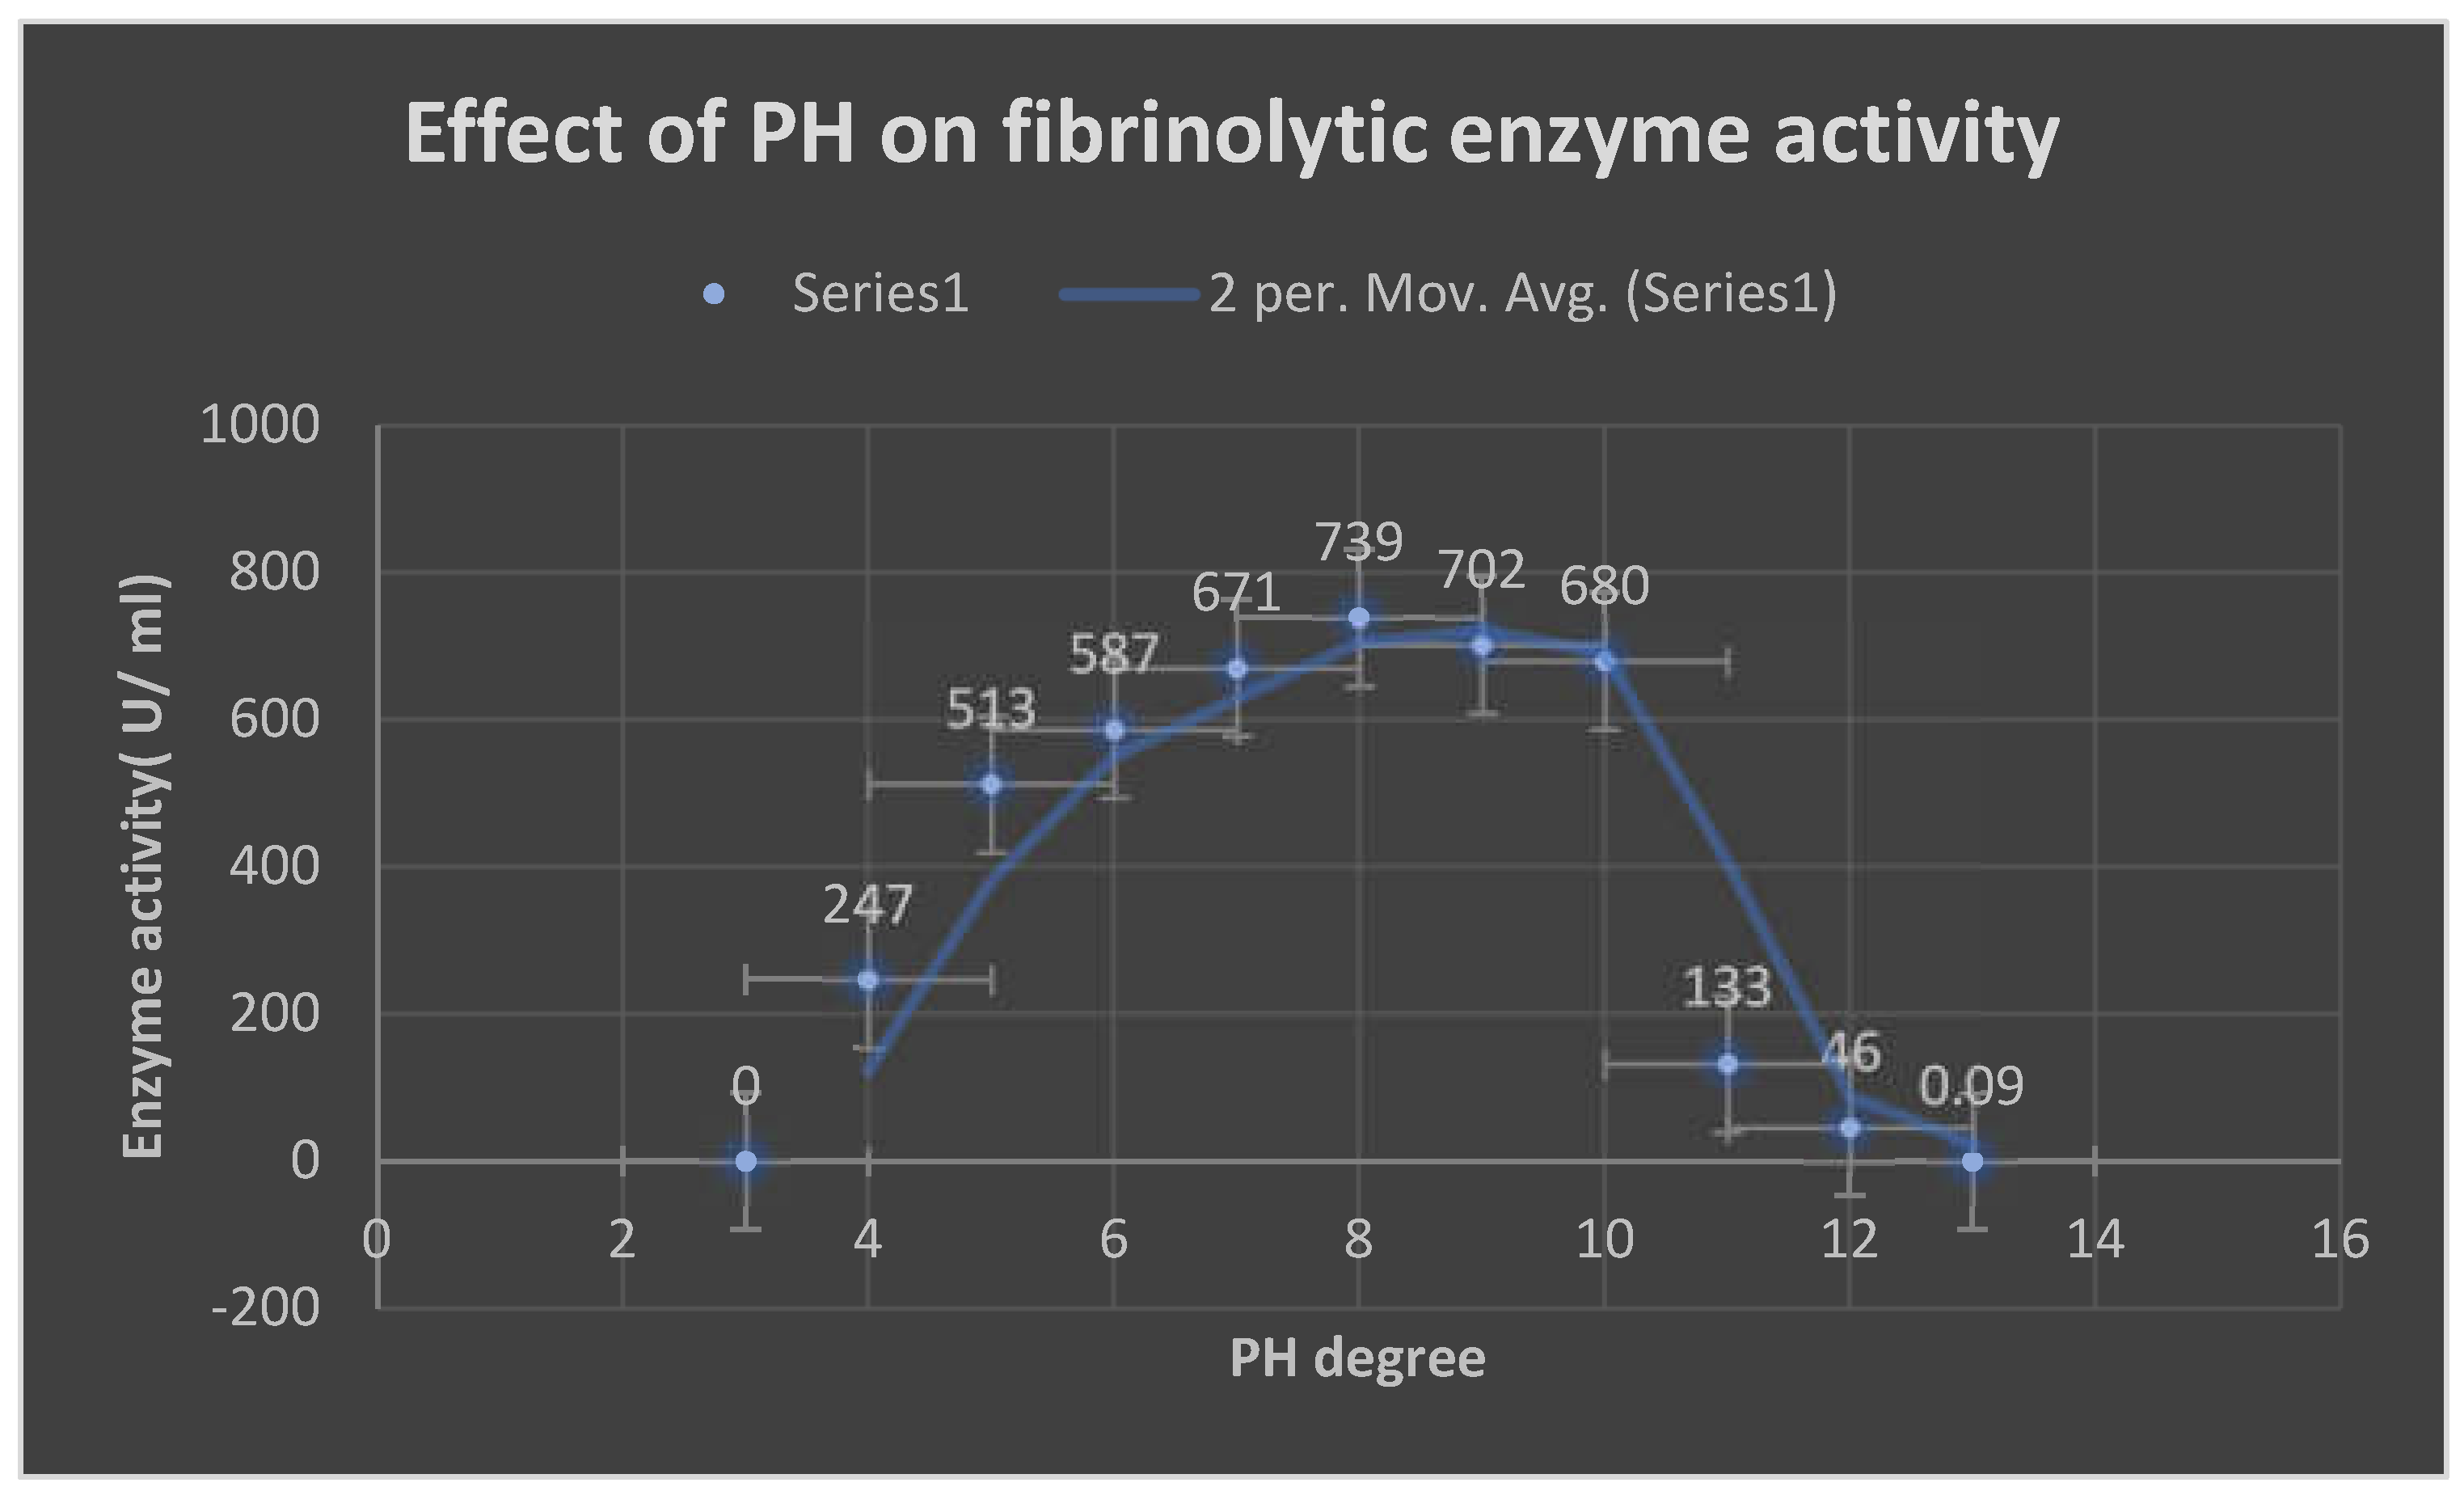
Figure 14.
It demonstrates the effects of different metal ions and EDTA on fibrinolytic enzyme activity. The enzyme fibrinolytic action was inhibited via EDTA.
Figure 14.
It demonstrates the effects of different metal ions and EDTA on fibrinolytic enzyme activity. The enzyme fibrinolytic action was inhibited via EDTA.
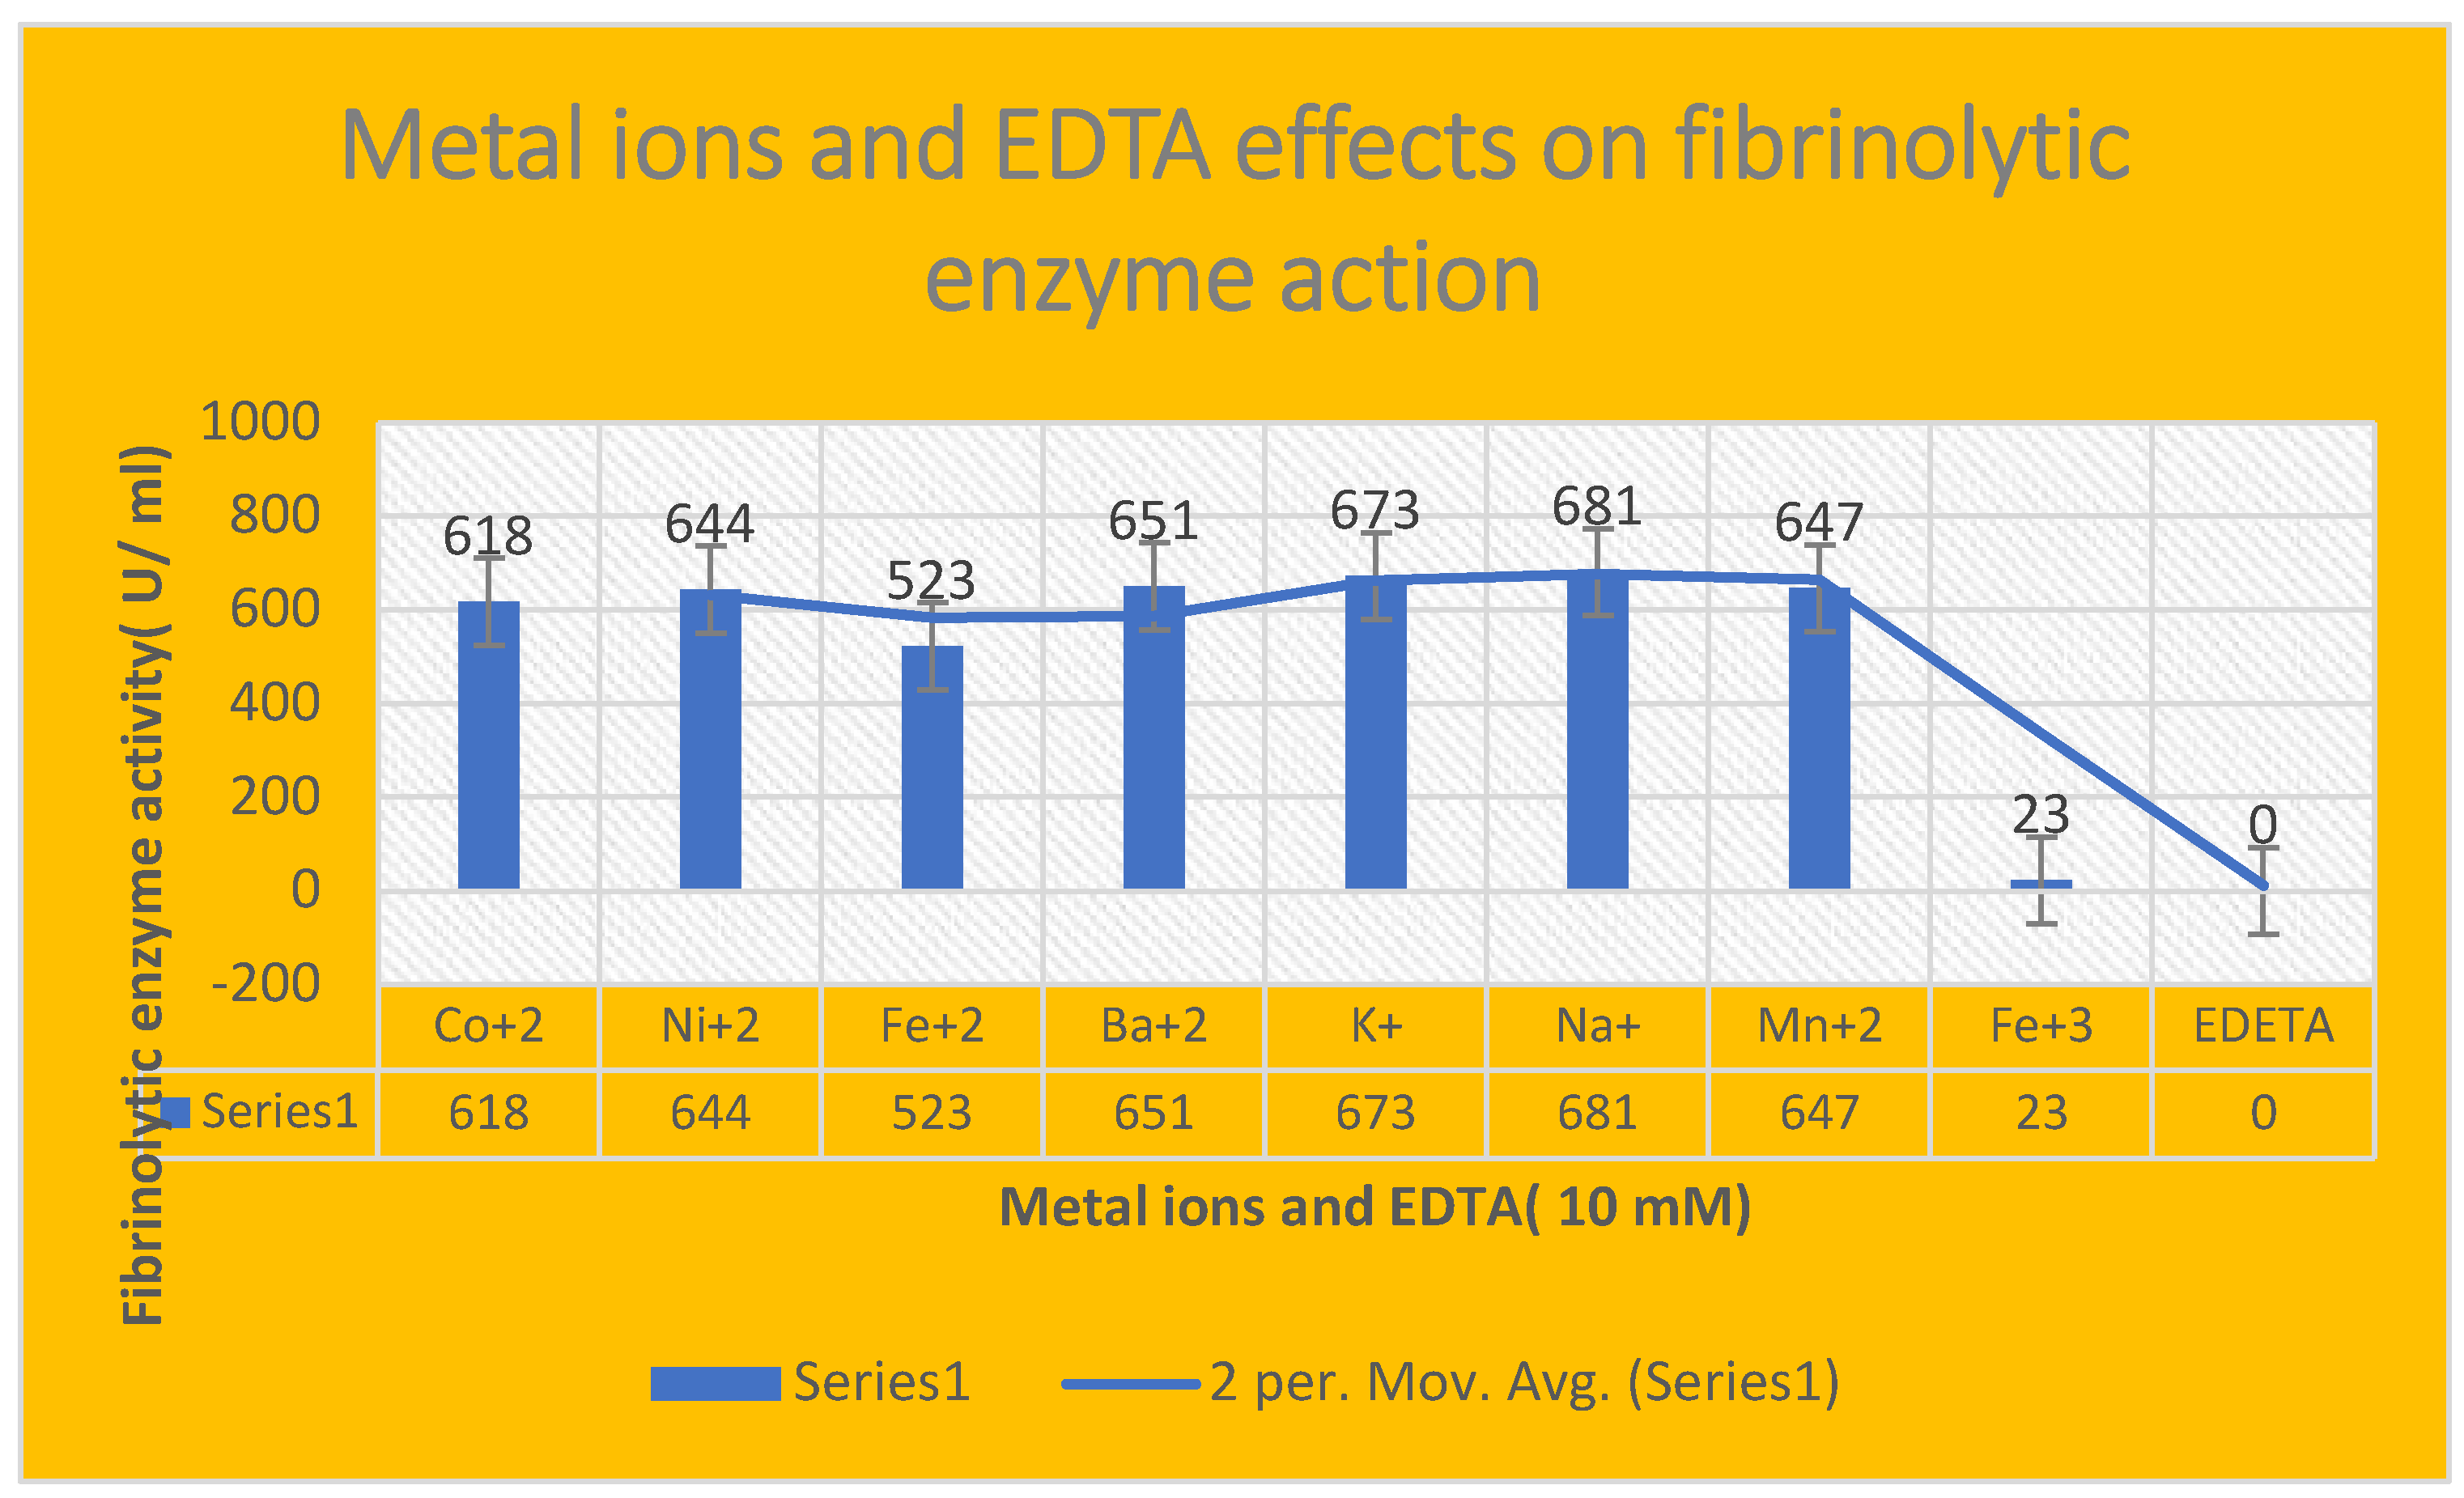
Figure 15.
It represents a recombinant Fibrin-proteinase release profile.
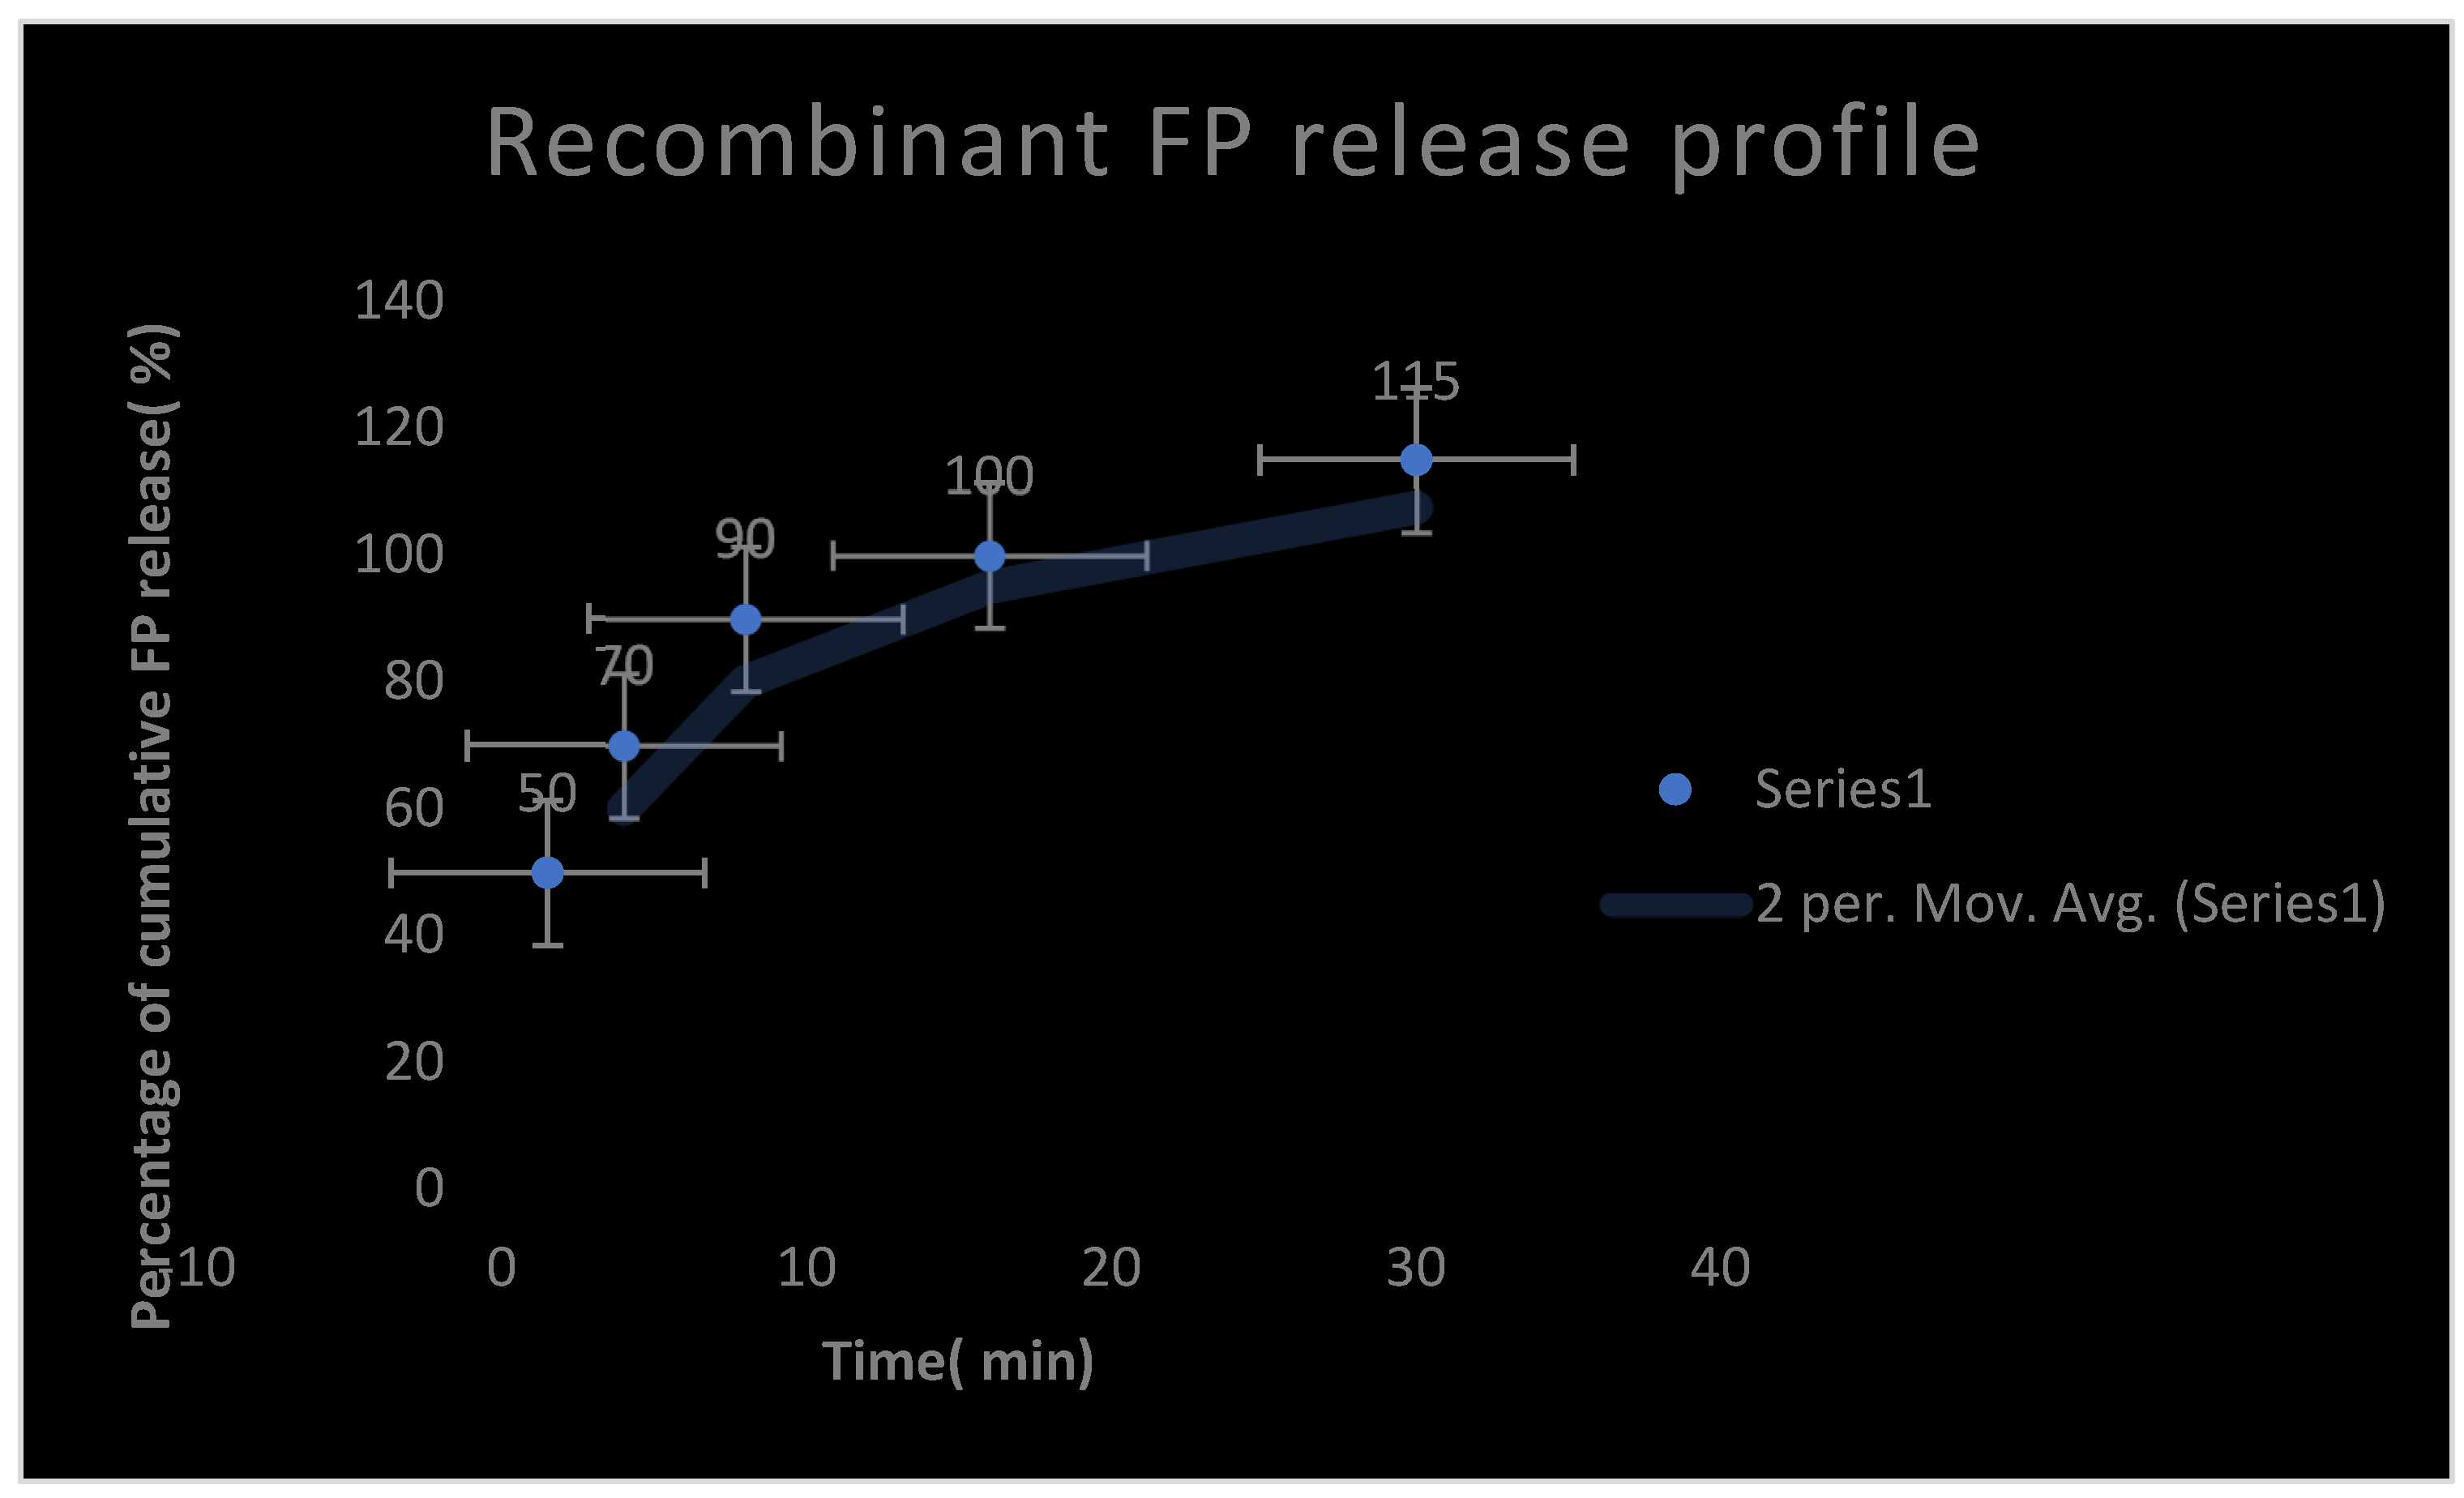
Figure 16.
It represents AUC of recombinant Fibrin- proteinase given through SC route of administration.
Figure 16.
It represents AUC of recombinant Fibrin- proteinase given through SC route of administration.
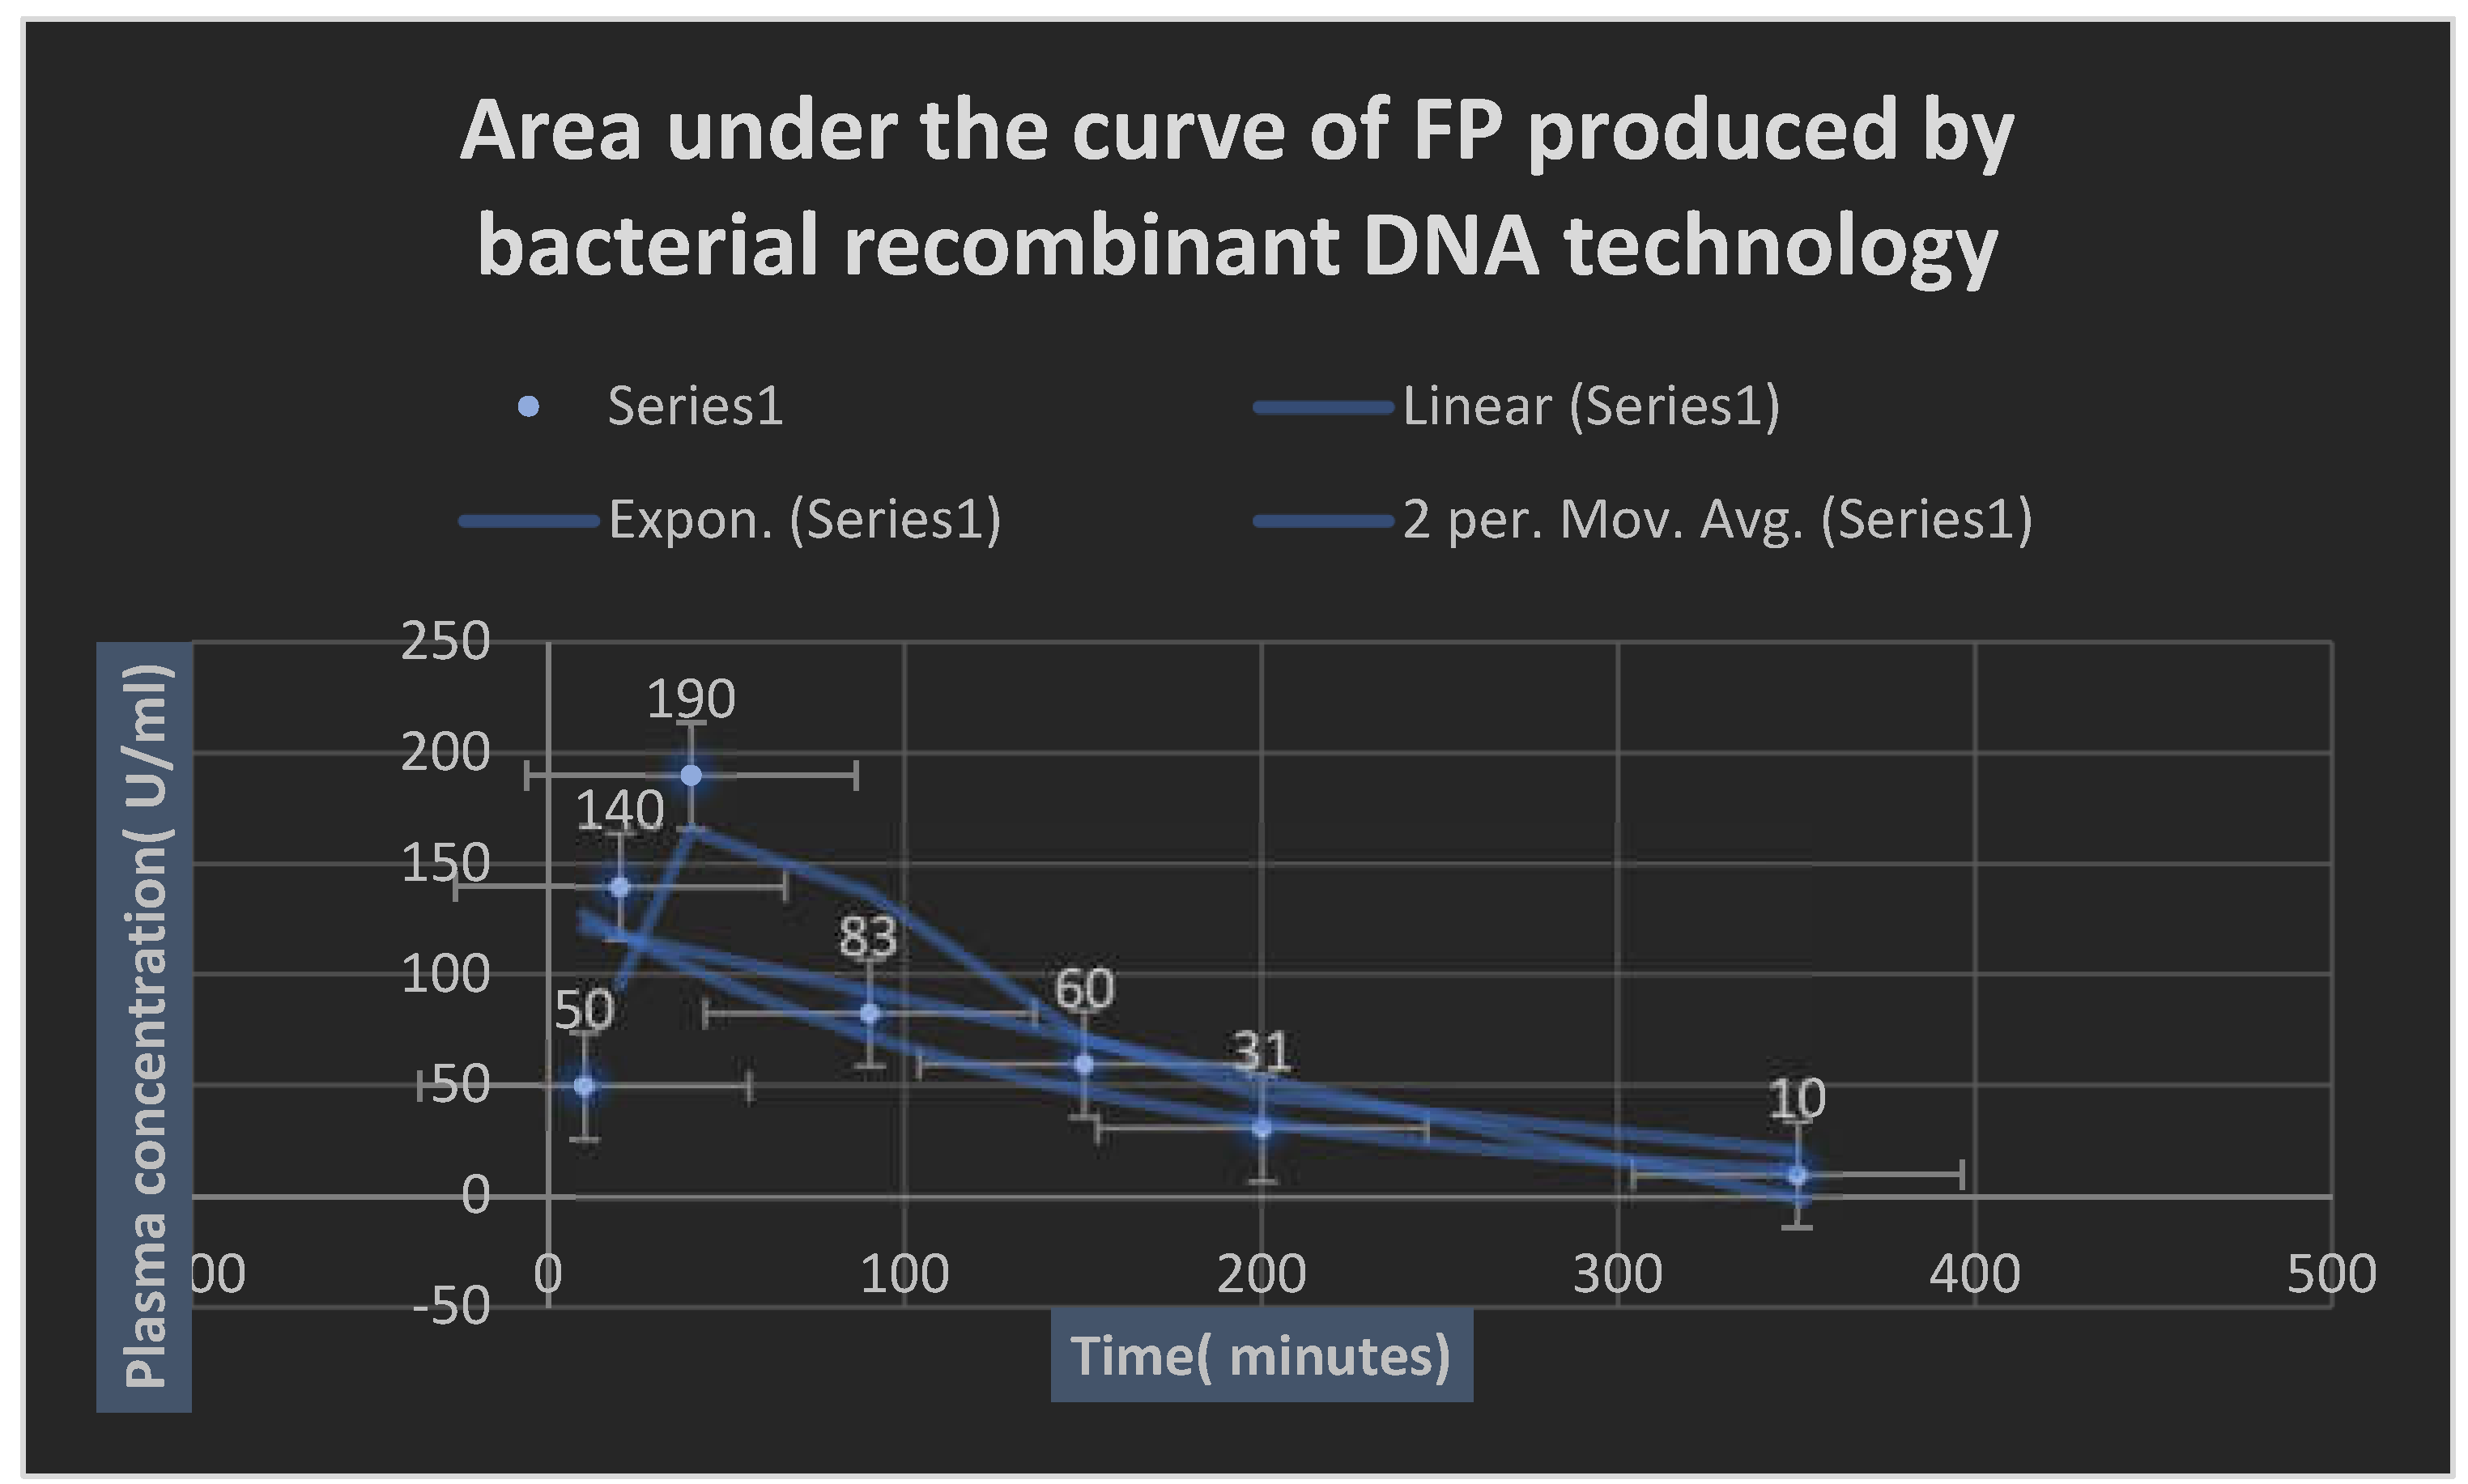
Figure 17.
It represents fibrinolytic and proteolytic activities of test FP by casein digestion assay.
Figure 17.
It represents fibrinolytic and proteolytic activities of test FP by casein digestion assay.
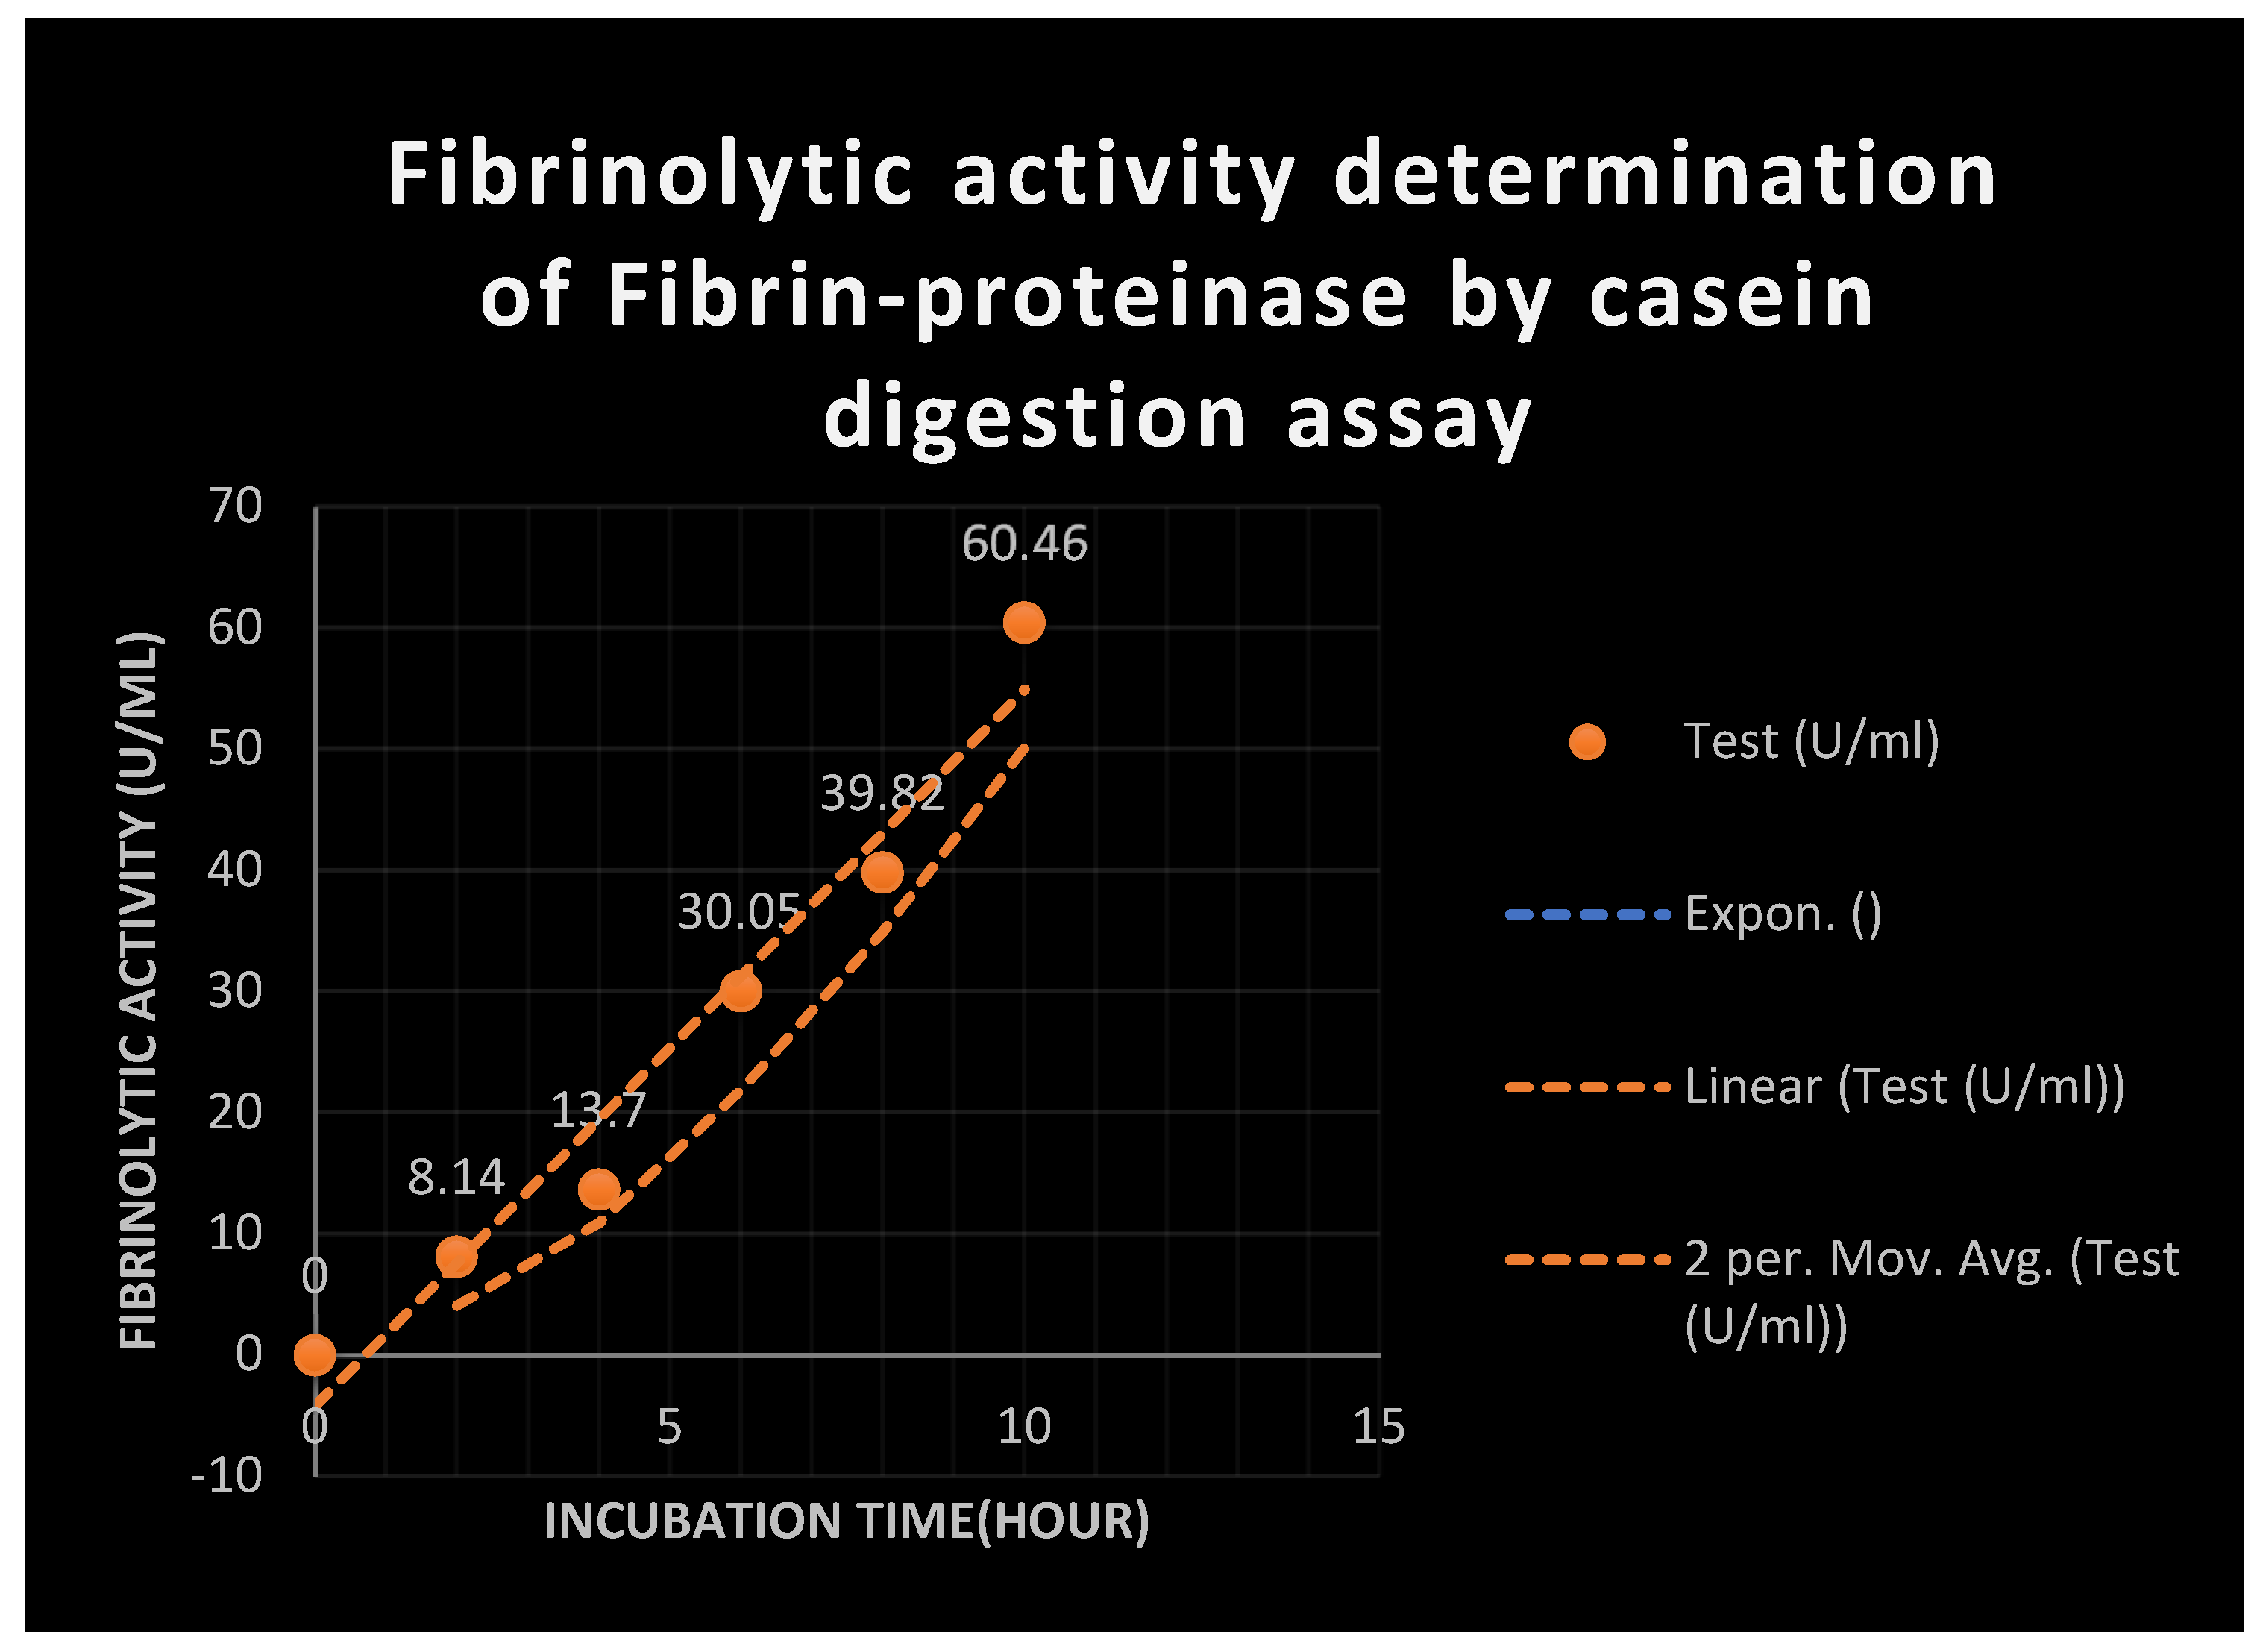
Figure 18.
It displays the percentage of fibrinolysis of Fibrin-proteinase during a randomized preclinical trials stage.
Figure 18.
It displays the percentage of fibrinolysis of Fibrin-proteinase during a randomized preclinical trials stage.
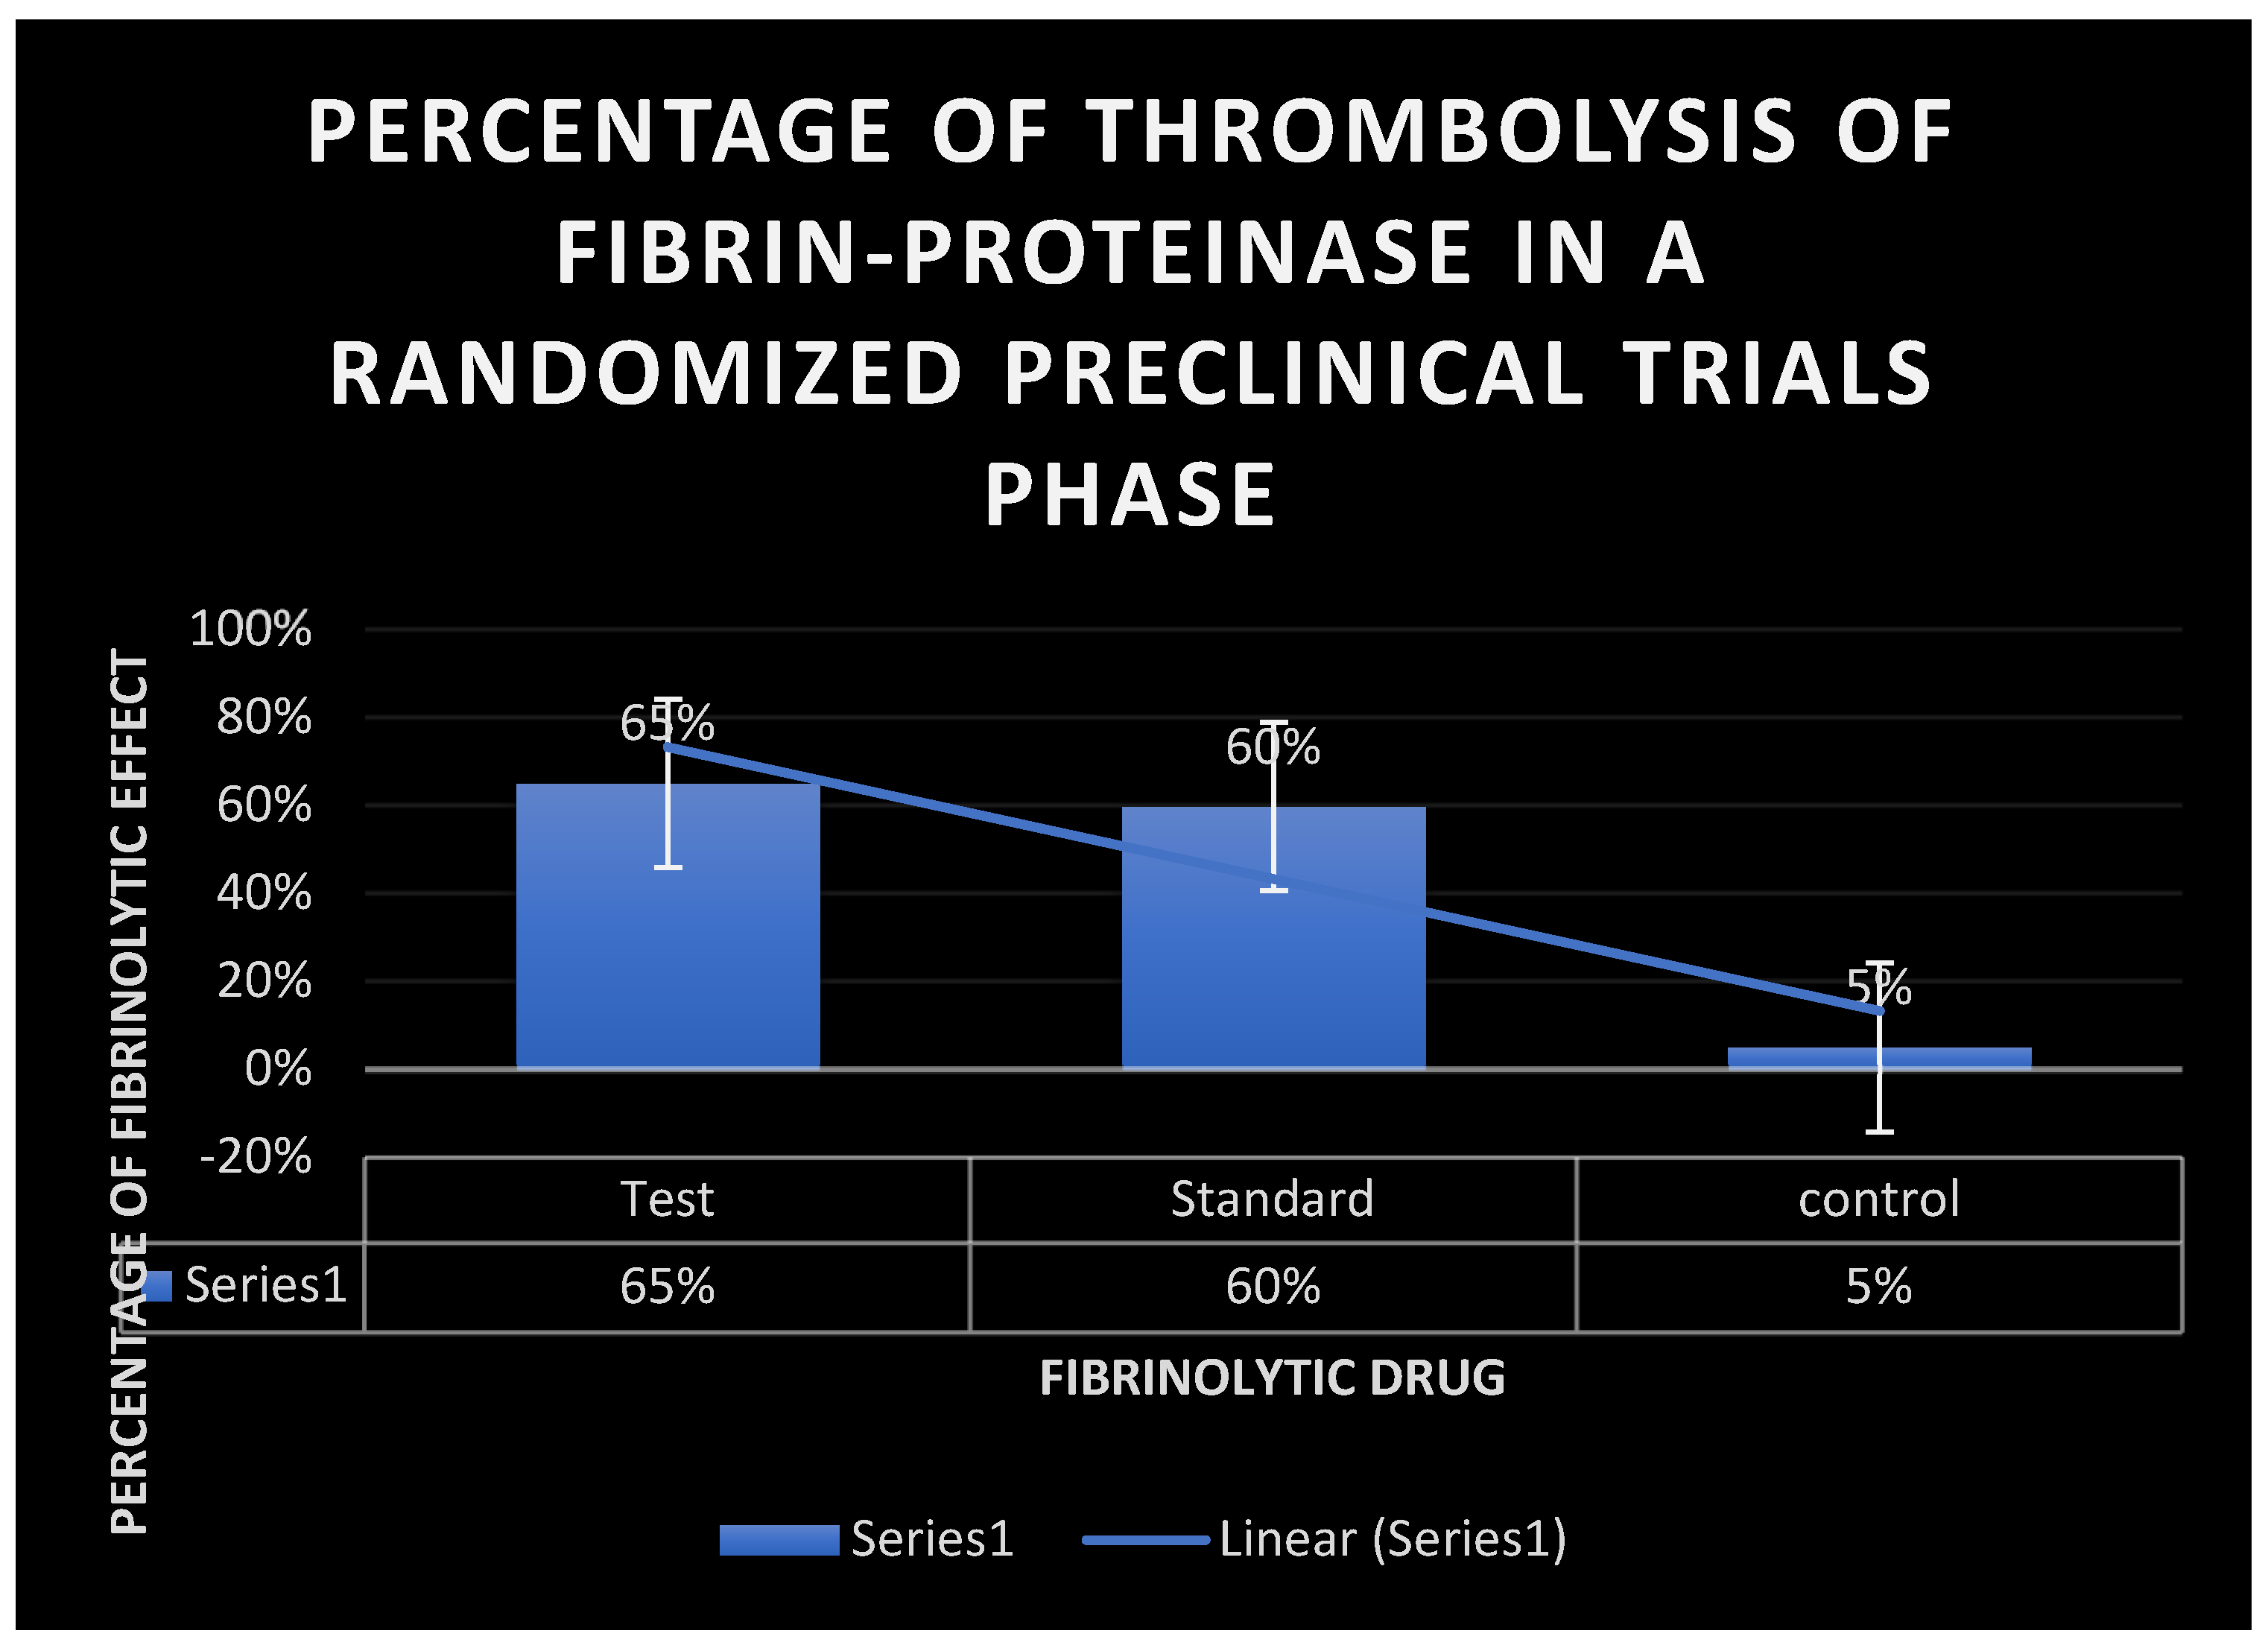
Figure 19.
It shows compatibility studies of FP and its excipients.
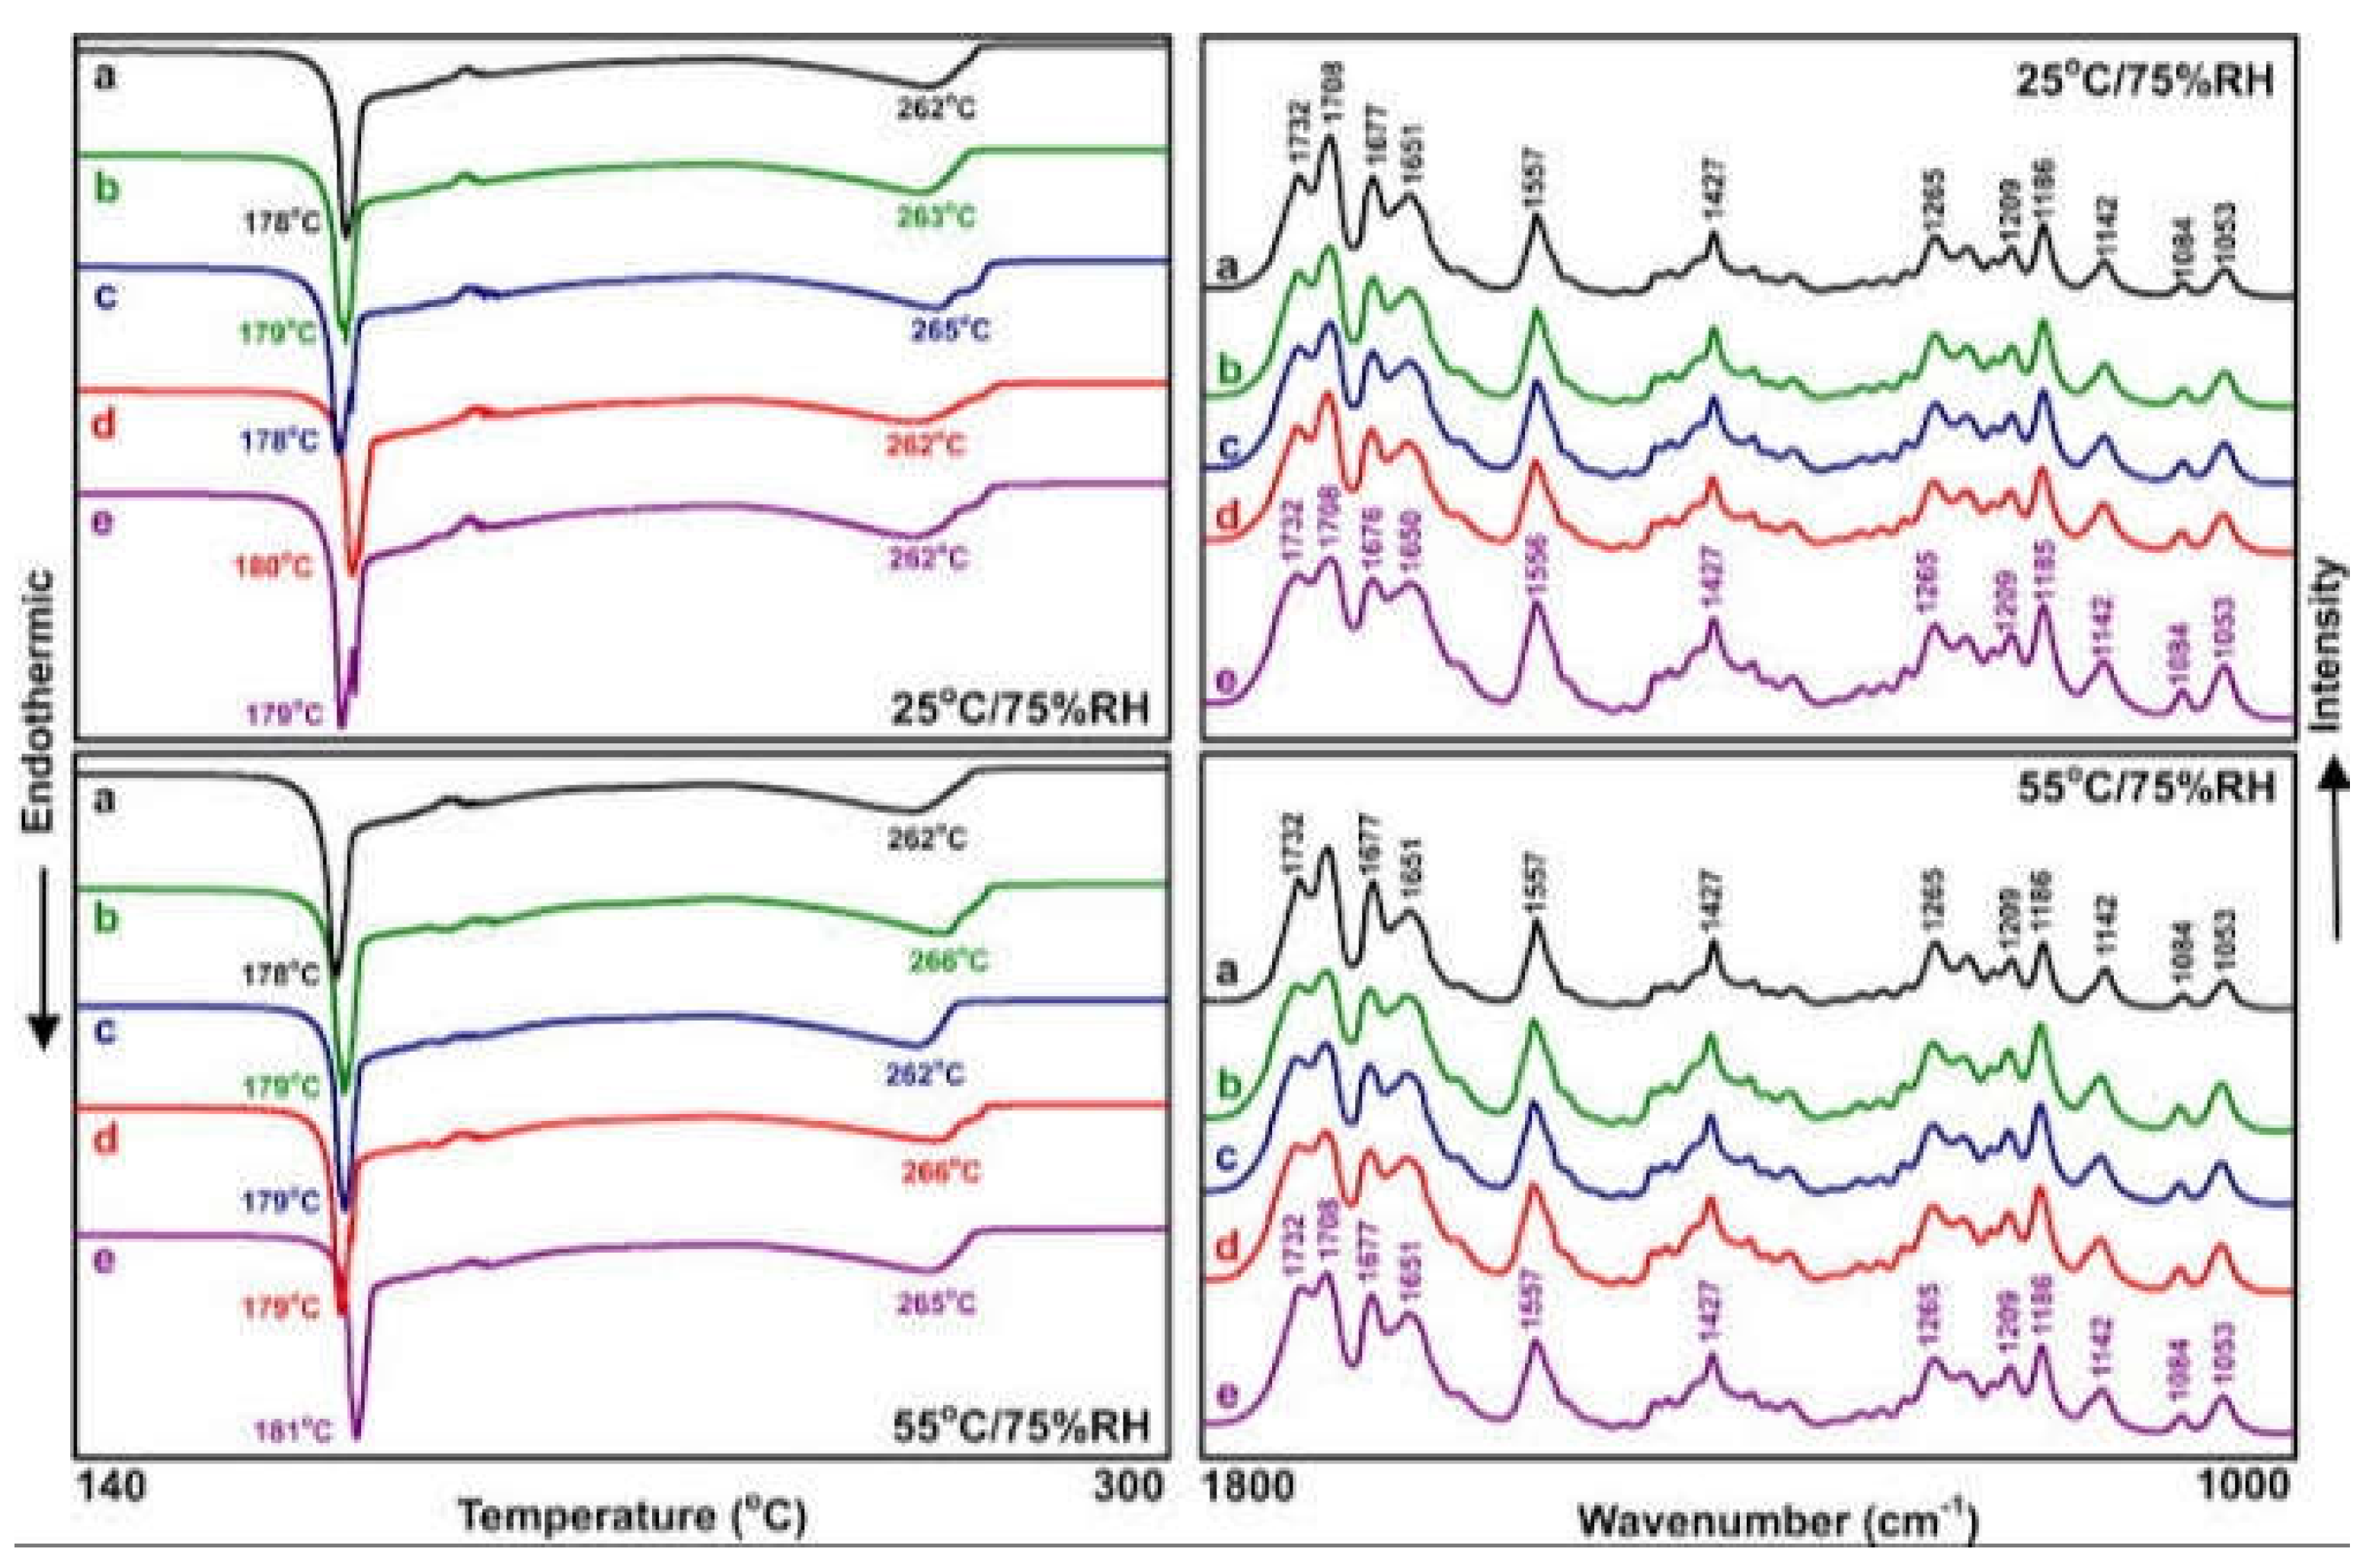
There were no drug polymer interactions or incompatibilities.
Figure 20.
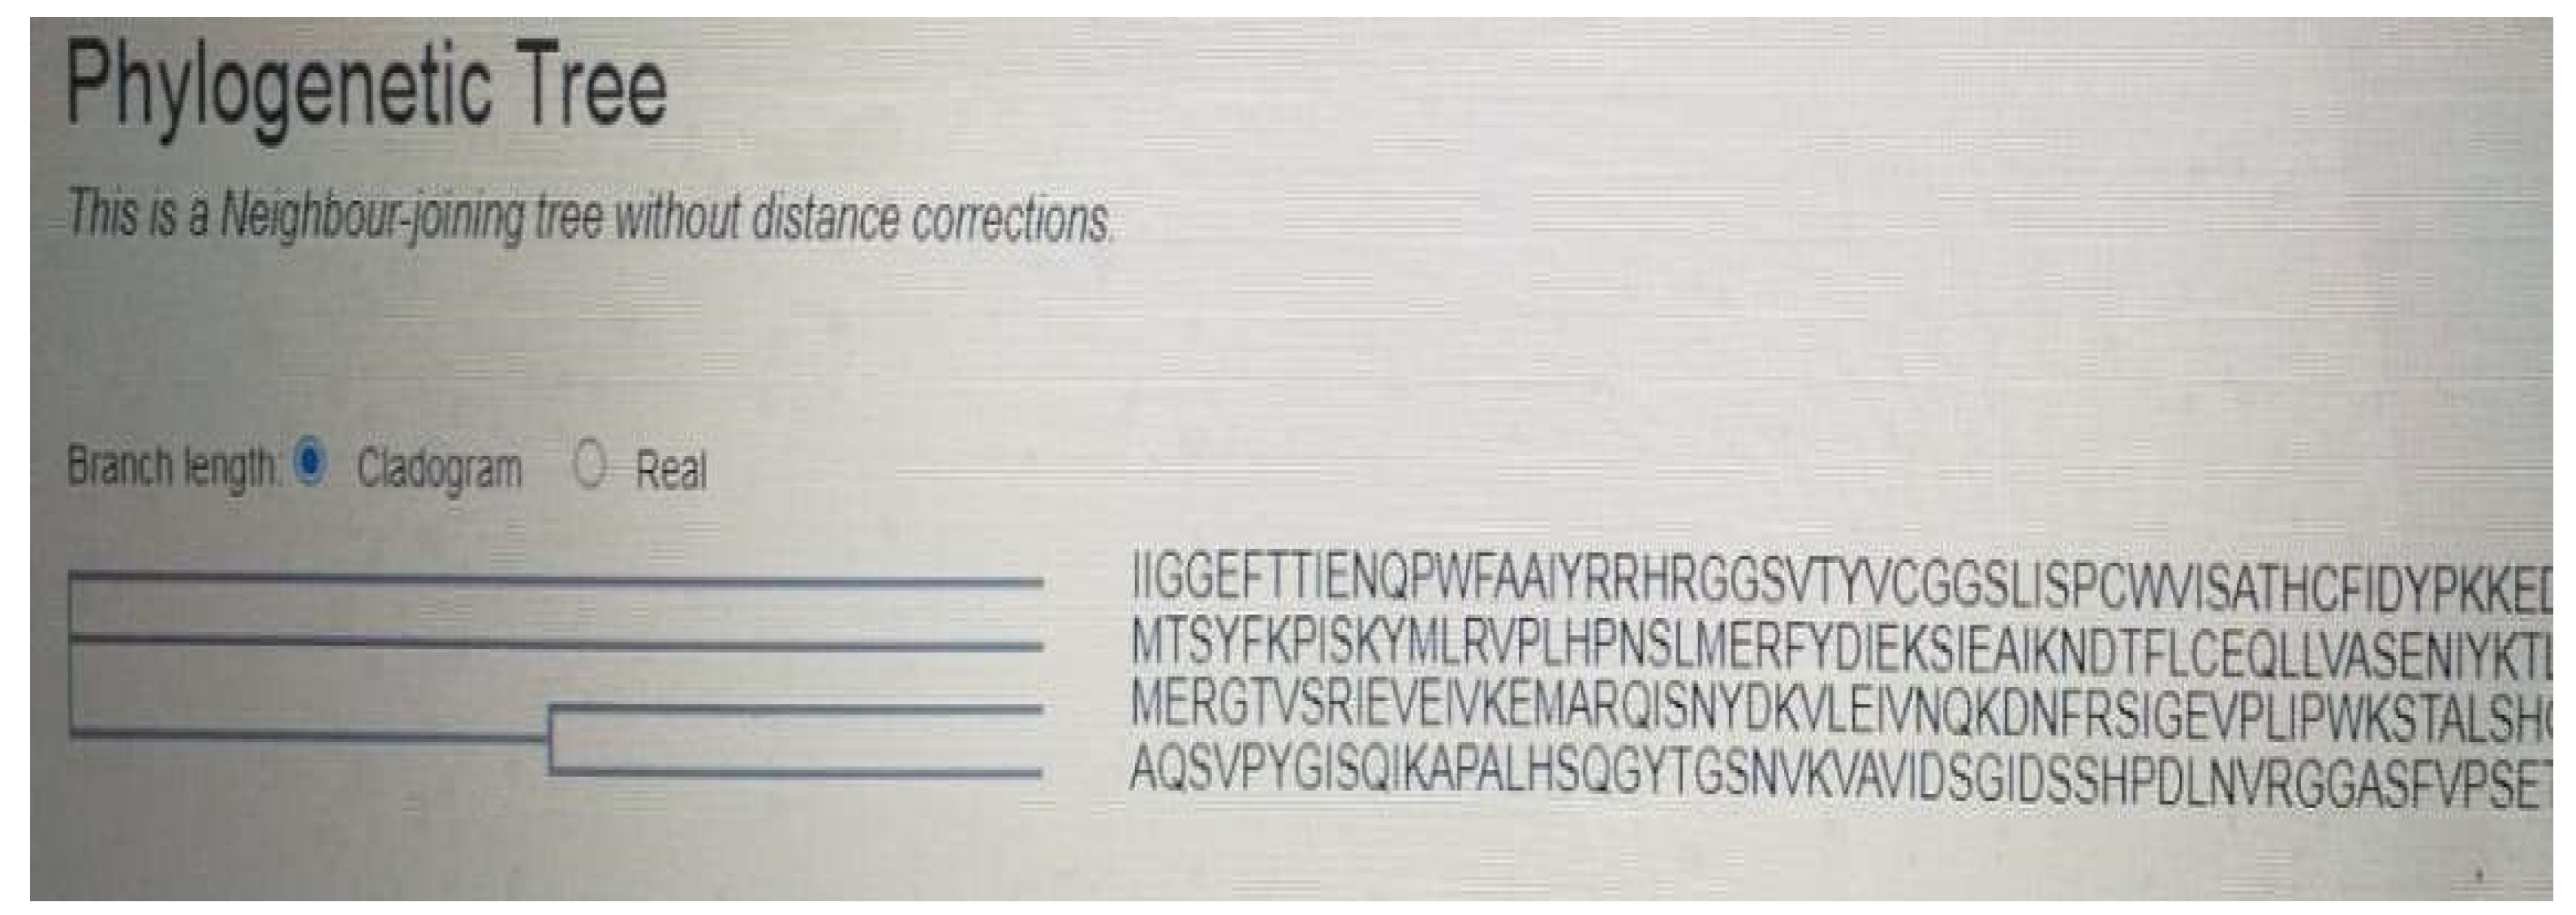
It represents Phylogenetic tree of FP as a fibrinolytic agent generated via Clustal Omega multiple sequence alignment software. Molecular homology revealed that FP possesses more than 70 % similarity with Subtilisin DFE fibrinolytic agent. It consists of 275 amino-acids.
Figure 20.
It represents Phylogenetic tree of FP as a fibrinolytic agent generated via Clustal Omega multiple sequence alignment software. Molecular homology revealed that FP possesses more than 70 % similarity with Subtilisin DFE fibrinolytic agent. It consists of 275 amino-acids.
Statistical Analysis
All cultures were conducted in triplets. Their presentation was by means and standard deviation.One way analysis of variance (p value≤ 0.05) was used as means for performing statistical analysis and also, statistical analysis based on excel-spreadsheet-software. F test was utilized during the present study.
Results
The present study revealed the possibility of the production Fibrin proteinase secreted from Bacillus cereus ATCC 4342 as a fibrinolytic agent via bacterial recombinant DNA technology.
Table 6 displays the positive bacterial isolates distribution on MFA. Table 7 displays distribution of the main producing fibrinolytic bacterial bacilli on MFA.
Isolation of the bacterial fibrinolytic enzymes from different soil environments in Egypt:
During screening of fibrinolytic enzyme producing bacterial isolates, a total of 31 Bacillus SPP were isolated from different soil environments in Egypt. These isolates were subjected to primary screening via MFA plates. Only the isolates which were able to utilize fibrinogen as a sole metabolic carbon and nitrogen source were able to grow on MFA plates. All 31 isolates gave relatively large clear zones on fibrin plate assay. The fibrinolytic enzyme activities of 31 Bacillus isolates were determined between 478- 623 U/ ml. In secondary screening on blood agar plates 17 isolates out of 31 were detected with considerable high fibrinolytic activities through different fibrinolytic assays such as casein digestion technique and fibrin plate assay. Only these 17 isolates were tested for their thermostability. The morphological, biochemical reactions, Gram staining and molecular detection using 16S rRNA gene analysis revealed that Bacillus cereus ATCC 4342 and Bacillus subtilis DC 27 were the main positive bacterial isolates producing fibrinolytic enzymes in the present study. Bacillus cereus ATCC 4342 represented 17 out of positive bacterial isolates; while Bacillus subtilis DC 27 represented 14 out of the positive bacterial Bacilli producing fibrinolytic enzymes. The isolate Bacillus cereus ATCC 4342 was found to have the highest level of fibrinolytic activity together with the highest thermostability; thus it was selected for further investigations.
Bacillus cereus ATCC 4342 was noticed to be a Gram positive Bacillus shaped, endospore forming bacterium. The cells were 2- 3 µm long and 0.8- 1 µm wide. Its spores were oval in form and 0.7- 0.8 µm wide with 1- 1.4 µm long. During 16S rRNA gene analysis, both major bacterial isolates were identified based on 16S rRNA gene sequence using Blast analysis which showed high degree of similarity with these both types of Bacilli. Molecular mass of fibrinolytic enzyme Fibrin-proteinase[ FP] produced by Bacillus cereus ATCC 4342 was approximately 30 KDa as determined via mass spectrometer and confirmed with SDS-PAGE technique.
Purification of the test fibrinolytic enzymes:
The yielded fibrinolytic enzyme after the purification via immobilized Nickel affinity chromatography ranged from 0.184- 1.926 U/ ml. The productivity reached a maximum at 24 hours after which it decreased due to sporulation occurrence during culturing the collected soil samples from different environments in Egypt on MFA plates. The degree of purity of fibrinolytic enzymes reached nearly 83% as determined by SDS-PAGE chromatography and western blot technique. The fibrinolytic enzyme specific activity reached 40.71 U/ mg estimated via lowry assay. The average total protein extracted from the supernatant of culture plates reached nearly 0.228 mg. The total enzyme activity was detected to be 9.281 U. The specific activity was calculated via dividing total activity on total protein content extracted from the supernatant of the culture through Lowry assay.
Optimization of the growth media included different carbon and nitrogen sources. Optimization of various PH, Temperature, inoculum volumes and metal ions was performed in an attempt to determine the optimum physiological and environmental factors affecting the growth of the predominating bacterial isolates producing fibrinolytic enzymes.
Effect of different carbon sources on fibrinolytic enzyme productivity:
A series of experiments with different carbon sources: starch, lactose, sucrose, mannitol, dextrose were performed to determine the best carbon source of fibrinolytic enzyme productivity of Bacillus SPP. The concentration of carbon source was maintained constant at 2 % W/ V in all experiments. Mannitol was found to be the optimum carbon source as it yielded 3.15 U/ ml of fibrinolytic enzymes.
Table 8 confirm the outcomes of different carbon sources on productivity of fibrinolytic enzymes.
Effect of different inoculum volumes on FP productivity:
The inoculum volume was optimized via comparing the productivity resulting with 1- 7 % V/ V inoculum volumes. The highest level of productivity was detected at 2% inoculum volume( 1.89 U/ ml).
Table 9 demonstrates the influence of different inoculum volumes on the production of fibrinolytic enzymes at incubation conditions PH 7.4, temperature 37 0C and 18 hours incubation period.
Effect of different Nitrogen sources on FP productivity:
A series of experiments were performed with different nitrogen sources. Peptone was noticed to be the best organic nitrogen source due to increase in productivity( 2.013 U/ml) as compared with the control.
Table 10 shows the effects of different nitrogen sources on FP productivity.
Effect of different metal ions on fibrinolytic enzyme productivity:
Zn+2 and Hg+2 metal ions showed negligible effects on the production of fibrinolytic enzyme Fibrin-proteinase secreted from Bacillus cereus ATCC4342; while Ca+2 and Mn+2 demonstrated the optimum conditions on the growth of Bacillus SPP producing fibrinolytic enzymes during the present study.
Table 11 demonstrates the effects of different metal ions on the fibrinolytic enzyme productivity.
Determination of fibrinolytic enzyme cellular position:
The fibrinolytic enzymes were extracellular with 91%; while 9 % were showed as intracellular.
Table 12 shows the cellular position of the fibrinolytic enzymes via the spectrophotometric assay.
Effect of different PH on FP productivity:
The PH range 8- 10 was optimal for optimization of the growth of bacterial isolates producing fibrinolytic enzymes on MFA plates with the highest productivity was noticed at PH 8. negligible growth was detected at acidic PH degrees. The fibrinolytic enzyme FP purified from the culture supernatant of Bacillus cereus ATCC 4342 was relatively was relatively stable at PH range 7.4- 10 for 18 hours.
Effect of different incubation temperatures on FP productivity:
The fibrinolytic enzyme FP purified from the culture supernatant of Bacillus cereus ATCC 4342 was relatively stable with the highest productivity at temperature 43 0C for nearly 60 minutes. The optimum temperature of protease production was at 35-43 0C at incubation time ranged from 18-24 hours.
Table 14 demonstrates the effects of different temperatures degrees on FP production.
Effect of different PH degrees on fibrinolytic enzyme activity:
FP retained the fibrinolytic activity and stability at PH range 4-12. The activity was detected at alkaline PH range 8-10 with the highest enzyme action at PH 8.
Effect of different temperatures on fibrinolytic enzyme activity:
Effect of different Temperatures on fibrinolytic enzyme activity:
The purified enzyme was stable and retained 100 % of its activity at a temperature ranged from 20 to 65 0C with the highest stability and activity was detected at 55 0C( 727 U/ ml) for 1 hour. On the other hand, Tm of refined enzyme was recorded at 58 0C.
Effect of different metal ions and EDTA on fibrinolytic enzyme activity:
EDTA inhibited the proteolytic enzyme activity; while Fe+3 metal ion showed negligible effects on enzyme action[ 23 U/ ml]. On the other hand, the fibrinolytic activity reached the highest activity with Na+1[ 681 U/ ml] and K+1[ 653 U/ ml] monovalent cations respectively. Mn+2, K+1, Na+1, Co+2, Ni+2, Ni+2, Ba+2, Fe+2 metal ions were found to be enzymatic activators that increased FP activity by 29 %, 31 %, 35 %, 19 %, 17 %, 10 %, 21 %, 16 % respectively.
Effect of plasminogen addition on fibrinolytic activity:
The mixture of plasminogen and the extracted fibrinolytic enzymes addition did not give a higher fibrinolytic activity through fibrin plate assay than the activity of fibrinolytic enzymes alone because a similar result was obtained from fibrin plate analysis; thus this suggested the test fibrinolytic enzymes degraded fibrin directly and it was not the activity of plasminogen activator which degraded fibrin via activating plasminogen.
Production of FP via bacterial recombinant DNA technology:
The gene of interest encoding FP was isolated from Bacillus cereus ATCC 4342 using restriction endonuclease type II cutting enzymes which cut DNA at specific locations; Then joined to the plasmid expression vector pET-14b through ligase enzyme and the homo-polymer tailing. The recombinant plasmid was then introduced into the bacterial expression host Escherichia coli BL 21(DE3) Ploys S through transformation process. On the other hand the expression host was cloned as well as induced for expression of recombinant protein through addition of IPTG. The produced recombinant( transformed) FP fibrinolytic enzyme was screened for its production through the selection and the screening of the transformed cells.
Purification of recombinant FP fibrinolytic enzyme:
The crude enzyme yielded after salting out with 70% ammonium sulfate suggested that SDS-PAGE could retain the specific molecular mass proteins. The fibrinolytic enzyme produced from the predominating bacterial isolate on MFA was called Fibrin-proteinase( FP). Its productivity increased via bacterial recombinant DNA technology 15folds because it reached to 28.5 U/ ml. The specific activity reached nearly 600 U/ mg protein. The total protein reached approximately 3.5 mg. FP was purified from gel filtration during SDS-PAGE procedure. A single band having a molecular mass of nearly 30 KDa was observed on SDS-PAGE. FP showed purification fold 3.2± 2.7 with final enzyme recovery 56± 3.14 %.
Kinetic parameters Km,Vmax, Kcat of purified fibrinolytic enzyme were 5.78 mM, 100 µmol/ mg/ min and 2.41× 10( 2) M( -1) S( -1) respectively. Kinetic parameters values during the present study were determined through Michaelis- Menten plot. These parameters values reflected the presence of high affinity of FP towards Fibrin substrate. The isoelectric point of purified enzyme reached 8.3.
Table 15 demonstrates Michaelis Menten Plot.
Table 17 represents fibrinolytic activity of test thermostable FP by Casein digestion assay.
Table 18 represents Fibrin-proteinase release profile.
Table 20 represents the effects of various temperatures on the fibrinolytic activity of Fibrin-proteinase.
Table 21 represents the effects of different metal ions and inhibitors on fibrinolytic activity of Fibrin-proteinase.
Determination of phamacokinetic profile of FP:
Table 22 displays the pharmacokinetics profile of Fibrin-proteinase.
Like other proteins, FP was noticed to be metabolized proteolytically in the liver and eliminated via the kidneys. A little amount of the FP enzyme was detected to be excreted unchanged in bile. The pharmacokinetic profile of FP is represented in table 21. The test enzyme reached the peak concentration within one hour after parenteral SC administration. Repeat usage after 5 days and for 12 months was not recommended due to the development of mild neutralizing antibodies because of its prokaryotic origin. It was noticed that the usage of moderately high loading dose up on repeating the dose overcome the neutralizing antibodies; thus giving excellent efficacy as a fibrinolytic enzyme. The drug efficacy diminished after 5-6 hours and it was inefficacious after 12 hours. The loading dose was noticed to neutralize any anti- FP antibodies which appeared up on repeated doses. The invitro release of FP parenteral SC formulation was up to 15 minutes. The percentage relative bioavailability of FP from optimized SC parenteral formulation reached 76 %.
Determination of fibrinolytic activity of FP:
This was determined through fibrin plate assay, the spectrophotometric method and Casein digestion test. Fibrin plate assay revealed that the fibrinolytic enzymatic activity ranged from 372± 19.04- 529± 30. 86 U/ ml. FP was detected to possess casein-lytic and proteolytic activities similar to serine proteinases. FP showed proteolytic trypsin like activity; while it did not demonstrate any chymotrpsin proteolytic like actions. The effect of plasminogen addition revealed that this enzyme was a plasminogen independent type and degraded the fibrin clot directly which makes the enzyme a potent secure candidate for oral administration. The purified FP was highly specific against N-Suc-Ala-Ala-Pro-Phe-pNA( 190/ mmol/ min/ ml) and clot lytic activity reached 19± 2.3 % within 1 hour invitro. The purified fibrinolytic enzyme showed little erythrocytic lysis activity; thus confirmed safety to prevent various health risks, including hemolytic anemia. Based on this study, administration of fibrinolytic enzyme produced from Bacillus cereus ATCC 4342 was safe for clinical applications. FP prolonged CT, PT, APTT and TT. FP improved the hemorheology conditions in the rabbit models. Activated partial thromboplastin time increased by approximately 50 %, fibrinogen content decreased by 63 %. Fibrin degradation also increased obviously, but the plasminogen content did not change obviously. Thrombogenesis inhibition rate was noticed to be approximately 65 %. The changes of these biochemical data revealed the thrombolytic properties of FP in vivo. The thrombolytic effect of FP[ 3841 U.kg-1 on venous thrombus in rabbit animal models was most remarkable versus that of control[ P< 0.001], but was not divergent versus that of standard plasmin drug at the same dose[ P< 0.05]. The results showed that FP is a plasmin like protein. The protease fully hydrolyzed fibrin clots in 2-3 hours. The fibrinogen degradation pattern generated by FP as a function of time was similar to that obtained with plasmin. The results demonstrated FP was a serine protease analog to the Substilin family consisting of 275 amino acid residues. N-terminal aminoacid sequence was detected to be QATVPYEQPHCSL which was different from that of other known fibrinolytic enzymes. Results of the fibrinolysis pattern showed that FP rapidly hydrolyzed the fibrin alpha and gamma chains of fibrin clots; while it slowly hydrolyzed the beta chains of fibrin clots. The enzyme showed anticoagulant activity measured with activated with partial thrombin time and pro-thrombin time tests. FP slightly decreased ELT.
Bioinformatic analysis and molecular docking of FP:
Further bioinformatic analysis using Swiss model and Clustal omega soft-wares demonstrated that FP had a PI of 5.8, low instability index, high aliphatic index and low GRAVY value. Molecular docking analysis using Autodock Vina software indicated that there were favorable interactions between FP and the fibrin substrate, as indicated by a high binding affinity( ∆G:- 20.7 Kcal/ mol) and low Kd value( 5.1E- 14 M). BLASTn analysis of nucleotide sequence encoding FP revealed approximately 70 % homology with the gene encoding the fibrinolytic enzyme Subtilisin DFE.
Determination of compatibility studies:
No drug polymer interaction or incompatibility was detected via FTIR and DSC studies.
Determination of Immunogenicity of FP:
This was determined via ELISA which showed no detectable antibodies after the administration of the initial dose. On the other hand, moderate antibodies were produced up on repeated doses. It was noticed that the utilization of loading dose of FP could lessen immunogenicity up on repeating doses for a maximum 4 days. FP lost more than 70 % its fibrinolytic activity after its administration more than 5 days due to evoking graded titers of neutralizing antibodies.
Table 23 informs Molecular 16 S rRNA detection of the predominating bacterial isolates producing FP
Table 24 shows the biochemical reactions of the predominating bacterial isolates producing FP.
Discussion
Thromboembolic diseases rank among the world's major causes of mortality. The few fibrinolytic medications on the market today, such as urokinase, streptokinase, alteplase, and tencteplase, have significant drawbacks such as haemorrhage propensity, low specificity, and high production costs. To get around these problems, it is necessary to look for new sources of fibrinolytic enzymes.
In the current study, a new fibrinolytic enzyme( FP) has been identified. It is secreted by the predominant bacterial isolates that were obtained from several environmental soil samples in Egypt. Based on morphology, biochemical responses, and molecular detection, the predominant bacterial isolate generating FP fibrinolytic enzyme in this investigation was Bacillus cereus ATCC 4342, as determined by high-throughput sequencing of 16S rRNA. Every carbon source that might potentially provide fibrinolytic enzymes was selected. It was interesting to note that mannitol showed relatively the highest productivity( 3.15 U/ ml) during the present study; while, Narasimhan M study, 2015 stated that Corn flour was ideal agent as a carbon source for the production of fibrinolytic enzymes and soyabean powder was the optimum Nitrogen source [38]. In the present study, Nitrogen source was found to play a major role in enhancing the fibrinolytic productivity in the media. The optimum Nitrogen source in the present study was noticed to be peptone( 2.013 U/ ml). Fibrin-proteinase obtained from Bacillus cereus ATCC 4342 demonstrated higher productivity and activity at basic PH. The optimum inoculum volume for the production of fibrinolytic enzymes from different soil environments was consummated at 2% V/ V. Syahbanu F et al study, 2020 confirmed that 1% V/V inoculum volume was the optimal one for the growth of the predominating bacterial isolates producing the fibrinolytic enzymes in different culturing media [39]. At inoculum volumes higher than 7% V/ V, there was a decline in the productivity. Seon Ah Kom et al study, 2011 stated that maximum fibrinolytic enzyme production was obtained at 35- 45 0C [40]. The experimental results in the current study demonstrated comparable outcomes where the productivity of fibrinolytic enzyme from Bacillus cereus ATCC 43 42 was high at a range of temperature 35- 43 0C. Divalent cations such as Ca+2, Cu+2 and Mn+2 were found to be optimum cofactors for the productivity of FP during the present study. Hg+2, Zn+2 and Fe+3 were detected to inhibit the production of fibrinolytic enzymes in the current work. In the the present investigation the production of FP was detected to be high at PH 8- 10. The optimization media composition resulted in nearly 3 folds increase( 3.15 U/ ml) in fibrinolytic productivity when compared to the original media composition. The fibrinolytic enzyme yield obtained during the present study was higher than the results reported on fibrinolytic enzyme production via Bacillus vallisomritis ACE 02( in the previous study of Kim et al, 2007 [41]. FP produced via bacterial recombinant DNA technology demonstrated more significant productivity and yield( nearly 15 folds increase) than the original initial non hybrid yield at near physiological temperature 37 0C and PH 7.4. The fibrinolytic enzyme secreted from Bacillus cereus ATCC 43 42 was shown to be extracellular in nature as noticed via the spectrophotometric method, so its purification and yield would be economically feasible. Recombinant FP was more active and stable in basic PH environments( PH 8-10). Similar results were found that Subtilisin DFE from Bacillus amyloliquefaciens DC-4 was active and stable at PH( 6-10) [42]. The effect of plasminogen addition revealed that the test fibrinolytic enzyme was a plasminogen independent type and degraded the fibrin clot directly suggesting that recombinant FP a potent secure candidate for parenteral and oral administration.FP showed anticoagulant activity as demonstrated through APTT, TT, ELT and pro-thrombin time tests. The molecular mass of FP was estimated through mass spectrometer and SDS-PAGE gel filtration to be approximately 30 KDa which was higher than that of Nattokinase( 27.7 KDa) and Subtilisin CK ( 28.2 KDa) but smaller that that of Streptokinase( 47 KDa) [43]. The molecular homology detection via Clustal Omega software and BLASTn analysis at NCBI website demonstrated that FP was approximately 70% similar to Subtilisin family especially Subtilisin DEF. The specific activity of recombinant FP was nearly 40 U/ mg; while it was 45 U/ mg for Subtilisin CK [44]. FP maintained the highest thermal stability at 55 0C for 1 hour. On the other hand, Tm of the fibrinolytic enzyme was observed at 58 0C. in another previous study Subtilisin DJ-4 showed thermal stability up to 60 0C for 60 minutes. Kinetic parameters Km,V max, Kcat of purified fibrinolytic enzyme FP in the present study were 5.78 mM, 100 µmol/ mg/ min and 2.41× 10( 2) M( -1) S( -1) respectively; while Km, Vmax and K cat of Subtilisin DJ-4 were 0.130mM, 1.89 U/ mg/ min and 3.87× 10( 4) M( -1) S( -1) respectively [45]. These data reflected that test FP possessed high affinity and catalytic activity for fibrin substrate. The in vitro and in vivo assays revealed that the enzyme could catalyze blood clot lysis effectively indicating that this enzyme could be useful as a fibrinolytic agent. The invitro release of FP parenteral SC formulation was up to 15 minutes. The percentage relative bioavailability of FP from optimized SC parenteral formulation reached 76 %. The biological half life of test enzyme was noticed to be about 90 minutes and its action lasted for nearly 6 hours. On the other hand the biological half life of Streptokinase[ indirect fibrinolytic drug which catalyzes the conversion of plasminogen into plasmin dissolving fibrin clots was about 80 minutes and its action lasts for approximately 5 hours [46]. The fibrinolytic enzyme activity of test recombinant FP was activated by monovalent cations such as Na+1 and K+1, while Fe+3 showed negligible effects on enzyme activity. On the other hand, EDTA inhibited FP fibrinolytic activity which was confirmed via Autodock Vina molecular docking software. Molecular modeling analysis using Swiss model software suggested that the 163 threonine residue of FP was located near the cation binding site; consequently tight binding of monovalent cations such as Na+1 and K+1 with FP occurred which probably increased thermostability and action of the test fibrinolytic enzyme. As well as, Molecular docking revealed that FP was analog to serine proteinase family type. BLASTn analysis of nucleotide sequence encoding FP revealed approximately 70 % homology with the gene encoding the fibrinolytic enzyme Subtilisin DFE. To avoid bleeding tendency risk, FP was not suggested to be administered with blood thinners such as heparin anticoagulants during the present study. I.M parenteral formulation was noticed to cause hematoma to rabbit animal models at the site of injection suggesting its exclusion in the usual dosage regimens. FP showed both anticoagulant and fibrinolytic activities during the present work suggesting the necessity to avoid its administration with heparin anticoagulant drug to minimize the risk of heavy bleeding. FP was detected in the current study to enhance bleeding tendency when was utilized with other blood thinner such as aspirin and warfarin. On the other hand, FP was observed to be metabolized proteolytically in the liver; however little amount was metabolized in the bile. FP was eliminated through the kidney after the termination of its fibrinolytic action within 300-360 minutes. In the present study, in vivo efficacy during randomized preclinical trials phase reached approximately 63% as demonstrated experimentally on rabbit animal models diseased previously with venous thrombi. The optimal dosage form for FP was found to be intermittent intravenous injection or deep subcutaneous injection. Figure 20 represents Phylogenetic tree of FP as a fibrinolytic agent generated via Clustal Omega multiple sequence alignment software. Molecular homology revealed that FP possesses more than 70 % similarity with Subtilisin DFE fibrinolytic agent. It consists of 275 amino-acids. Figure 18 displays the percentage of fibrinolysis of Fibrin-proteinase during a randomized preclinical trials stage. Figure 2 shows Positive Gram staining of bacterial Bacillus subtilis and cereus isolates producing thermostable fibrinolytic enzymes. Figure 1 shows fibrinolytic activity of the bacterial thrombolytic enzymes secreted from Bacillus SPP on nutrient agar plates inoculated with 3% fibrinogen solution. Figure 3 represents 3D structure of Fibrin-proteinase excreted from Bacillus cereus. The molecular mass reached nearly 30 KDa as determined via mass spectrometer. Figure 8 demonstrates the effects of various incubation temperatures on fibrinolytic enzyme productivity. Figure 4 demonstrates the SDS-PAGE purification of Fibrin-proteinase secreted from Bacillus cereus ATCC 43 42. The degree of purity reached approximately 80%. Figure 19 shows compatibility studies of FP and its excipients. There were no drug polymer interactions or incompatibilities. Figure 7 demonstrates the effects of different PH values on fibrinolytic enzymes productivity. Figure 5 shows growth of Bacillus cereus and Bacillus subtilis bacterial isolates on MFA. Figure 6 shows the effect of different inoculum volumes on FP productivity at PH 7.4, temperature 37℃ and 18 hours incubation time. Figure 12 demonstrates effect of temperature on fibrinolytic enzyme activity. Figure 9 represents effect of different carbon sources on the productivity of fibrinolytic enzymes. Figure 11 shows Michaelis Menten Plot. Figure 10 shows effect of different nitrogen sources on the productivity of fibrinolytic enzymes. Figure 13 demonstrates the effects of different PH values on the fibrinolytic enzyme action. Figure 17 represents fibrinolytic and proteolytic activities of test FP by casein digestion assay. Graph 15 represents a recombinant Fibrin-proteinase release profile. Graph 16 represents AUC of recombinant Fibrin- proteinase given through SC route of administration. Figure 14 demonstrates the effects of different metal ions and EDTA on fibrinolytic enzyme activity. The enzyme fibrinolytic action was inhibited via EDTA.
Conclusion
The use of bacterial recombinant DNA technology to produce FP with excellent fibrinolytic activity made the current investigation very promising. It is advised that more research be done to determine the ideal dosing schedule for this fibrinolytic drug to dissolve various potentially fatal thrombi.
References
- Bardal Stan,Waechter Jason, Martin Douglas( 2020). Applied pharmacology.V14: Chemotherapeutic drugs. Elsevier Edinburgh, London. 2020. 14[ 2]: 1178-1186.
- Caroline S, Zeind Michael G( 2018). Applied therapeutics, the clinical use of drugs.V23: Complications of End-Stage Liver Disease. Wolters Kluwer, London. 2018. 23[ 7]: 463-473.
- Dipro Cecily, Schwinghammer Terry, Dipro Joseph, Well Barbara ( 2021). Pharmacotherapy handbook.V13: Hepatic carcinoma. McGraw Hill Education, New York. 2021. 13( 9): 1582-1593.
- Fisher Bruce, Champe Pamela, Harvey Richard( 2021). Lippincott illustrated reviews microbiology. V6:Virology. Wolters Kluwer, London. 2021. 6( 8): 369-386.
- Golderg Stephen( 2020). Clinical physiology is made ridiculously simple.V6: Physiology of the liver. Med Master, Miami, United States of America. 2020. 6( 9): 2556-2578.
- Levinson Warren[ 2021]. Review of medical microbiology and immunology. V15: Immunology. McGraw Hill Education, New York. 2021. 15[ 13]: 937-953.
- Meeting Patricia J( 2019). Physiology.V16: Gastrointestinal physiology. McGraw Hill Education, New York. 2019. 16[ 1]: 1881-1895.
- Olson James( 2020). Clinical pharmacology made ridiculously simple. V7: Anticancer drugs. MedMaster, Miami, United States of America. 2020. 7[ 5]: 132-141.
- Parveen Kumar( 2017). Kumar, Clark's clinical medicine.V9: Oncology. Elsevier Edinburgh London. 2017. 9[ 20]: 692-703.
- Parveen Nadaf et al( 2019). Isolation, screening and characterization of L-glutaminase producing soil bacteria. International journal of pharmaceutical sciences and research. 2019; 23( 9):1874-1887.
- Trevor Anthony, Katzung Bertram, Kruidering-Hall Marieke( 2021). Katzung Trevor pharmacology examination board review.V13: Anticancer drugs. McGraw Hill Education, New York. 2021. 13[ 7]: 912-926.
- Swanson Larry N, Souney Paul F, Muntnick Alan H, Shargel Leon ( 2019). Comprehensive Pharmacy Review for NAPLEX.V10: Oncology. Wolters Kluwer, London. 2019. 10[ 13]: 1238-1250.
- Wilson Golder N( 2019). Biochemistry and genetics. V8: Gastroenterology and nutrition. McGraw Hill Education, New York. 2019; 8( 3): 763-771.
- Agrebi R et al( 2009). BSF1 fibrinolytic enzyme from a marine bacterium Bacillus subtilis A26: purification, biochemical and molecular characterization. Journal of process biochemistry. 2009; 44: 1252-1259. [CrossRef]
- Bryan PN et al( 2000). Protein engineering of Subtilisin. Journal of biochemistry and physics. Acta; 2000; 1543: 203-222.
- Ghasemi Y et al( 2012). Cloning of a fibrinolytic enzyme( Subtilisin) gene from Bacillus subtilis in Escherichia coli. Journal of Mol. Biotechnol. 2012; 52: 1-7. [CrossRef]
- Jaouadi B et al( 2010). Enhancement of thermostability and the catalytic efficiency of Bacillus pumilus CBS protease by site-directed mutagenesis. Journal of biochimie. 2010; 92: 360-369. [CrossRef]
- Jeong S-J et al( 2007). Cloning of fibrinolytic enzyme gene from Bacillus subtilis isolated from cheonggukjang and its expression in protease deficient Bacillus subtilis strain. Microbiol. Biotechnol Journal. 2007; 17: 1018-1023.
- Jeong S-J et al( 2014). Over-expression of apr E2, a fibrinolytic enzyme gene from Bacillus subtilis CH3-5 in Escherichia coli and the properties of Apr E2. Journal of Microbiol. Biotechnol. 2014; 24: 969-978.
- Jo H-D et al( 2011). Cloning and over-expression of apr E3-17 encoding the major fibrinolytic protease of Bacillus licheniformis CH 3-17. Journal of Biotechnol. Bioproc. Eng. 2011; 16: 352-359.
- Afifah, D. N., Sulchan, M., Syah, D., Yanti Suhartono, M. T., and Kim, J. H( 2014). Purification and characterization of a fibrinolytic enzyme from Bacillus pumilus 2.g isolated from Gembus, an Indonesian fermented food. Journal of Prev. Nutr. Food Sci. 2014; 19: 213–219. [CrossRef]
- Agrebi, R., Haddar, A., Hajji, M., Frikha, F., Manni, L. et al( 2009) Fibrinolytic enzymes from a newly isolated marine bacterium Bacillus subtilis A26: characterization and statistical media optimization. Can. J. Microbiol. 2009; 55: 1049–1061.
- Bajaj, B. K., Sharma, N., and Singh, S( 2013). Enhanced production of fibrinolytic protease from Bacillus cereus NS-2 using cotton seed cake as nitrogen source. Biocatal. Agri. Biotechnol. 2013; 2: 204–209. [CrossRef]
- Bajaj, B. K., Singh, S., Khullar, M., Singh, K., and Bhardwaj, S ( 2014). Optimization of fibrinolytic protease production from Bacillus subtilis I-2 using agro-residues. Journal of Braz. Arch. Biol. Technol. 2014; 57: 653– 662. [CrossRef]
- Balaraman, K. and Prabakaran, G( 2007). Production and purification of a fibrinolytic enzyme (thrombinase) from Bacillus sphaericus. Indian J. Med. Res. 2007; 126: 459–464.
- Collen, D. and Lijnen, H. R( 2004). Tissue-type plasminogen activator: a historical perspective and personal account. J. Thromb. Haemost.2004; 2: 541–546. [CrossRef]
- Sweta, P., Rajpal, S. K., Jayant, Y. D., Hemant, J. P., Girdhar, M. T. et al( 2006). Development of an in vitro model to study clot lysis activity of thrombolytic drugs. Thromb. J.2006; 4: 1–4.
- Yong, P., Xiaojuan, Y., and Yizheng, Z( 2005). Microbial fibrinolytic enzymes: an overview of source, production, properties, and thrombolytic activity in vivo. Appl. Microbiol. Biotechnol. 2005; 69: 126–132.
- Verhamme, I. M. and Bock, P. E( 2014). Rapid binding of plasminogen to streptokinase in a catalytic complex reveals a three-step mechanism. J. Biol. Chem. 2014; 289: 28006–28018. [CrossRef]
- Seo, J. H. and Lee, S. P( 2004). Production of fibrinolytic enzyme from soybean grits fermented by Bacillus firmus NA-1. J. Med. Food. 2004; 7: 442–449. [CrossRef]
- Mukherjee, A. K. and Rai, S. K( 2011). A statistical approach for the enhanced production of alkaline protease showing fibrinolytic activity from a newly isolated gram-negative Bacillus sp. strain ASS20-I. New Biotechnol. 2011; 28: 182–189. [CrossRef]
- Mihara, H., Sumi, H., Yoneta, T., Mizumoto, H., Ikeda, R. et al( 1991). A novel fibrinolytic enzyme extracted from the earthworm, Lumbricus rubellus. Jpn. J. Physiol. 1991; 41: 461–472. [CrossRef]
- Markland, F. S., Jr( 1998). Snake venom fibrinogenolytic and fibrinolytic enzymes: an updated inventory. Journal of Thromb Haemost. 1998; 79: 668– 674. [CrossRef]
- Mahajan, P. M., Nayak, S., and Lele, S. S. (2012) Fibrinolytic enzyme from newly isolated marine Bacillus subtilis ICTF-1: media optimization, purification and characterization. J. Biosci. Bioeng. 2012; 113: 307–314.
- Liu, J., Xing, J., Chang, T., Ma, Z., and Liu, H( 2005). Optimization of nutritional conditions for nattokinase production by Bacillus natto NLSSE using statistical experimental methods. Process. Biochem. 2005 40: 2757–2763. [CrossRef]
- Kotb, E( 2013). Activity assessment of microbial fibrinolytic enzymes. Journal of Appl. Microbiol. Biotechnol. 2013; 97: 6647–6665. [CrossRef]
- Kim, J. B., Jung, W. H., Ryu, J. M., Lee, Y. J., Jung, J. K. et al( 2007). Identification of a fibrinolytic enzyme by Bacillus vallismortis and its potential as a bacteriolytic enzyme against Streptococcus mutans. Biotechnol. Lett.2007; 29: 605–610. [CrossRef]
- Narasimhan M et al( 2015). Fibrinolytic enzyme production by newly isolated Bacillus cereus SRM-001with enhanced in-vitro blood clot lysis potential. Journal of applied microbiology. 2015; (61): 157-164. [CrossRef]
- Sahbanu F et al( 2020). Molecular analysis of a fibrin degrading enzyme from Bacillus subtilis K2 isolated from the Indonesian soyabean-based fermented food moromi. Mol Biol Rep. 2020 Nov; 47( 11): 8553-8563.
- Kim A et al( 2011). Characterization and production of thermostable and acid stable fibrinolytic enzymes from Cordyceps militaris. International journal of entomology. 2011, 22( 2): 83-93.
- Yeo WS et al( 2011). Biochemical analysis of a fibrinolytic enzyme purified from Bacillus subtilis A1. Journal of Microbiology. 2011; 49: 376-380.
- Yin LJ et al( 2010). Bio-properties of potent Nattokinase from Bacillus subtilis YJ1. Journal of agricultural food chemistry. 2010; 58: 5737-5742.
- Sumi H et al( 1987). A novel fibrinolytic enzyme( Nattokinase) in the vegetable cheese natto; a typical and popular soybean food in the Japanese diet. Journal of experientia. 1987; 43: 1110-1111.
- Peng Y et al( 2004). Cloning and expression of a fibrinolytic enzyme( Subtilisin DFE) gene from Bacillus amyloliquefaciens DC-4 in Bacillus subtilis. Journal of Res. Microbiol. 2004; 155: 167-173.
- Peng Y et al( 2003). Purification and characterization of a fibrinolytic enzyme produced by Bacillus amyloliquefaciens DC-4 screened from douchi, a traditional Chinese soybean food. Journal of comp. Biochem. Phys. 2003; B; 134: 45-52.
- Heo K et al( 2013). Characterization of a fibrinolytic enzyme secreted by Bacillus amyloliquefaciens CB1 and its gene cloning. Journal of Microbiology and Biotechnology. 2013; 23: 974-983.

Table 1.
Ingredients of Mineral Fibrinogen Agar:.
| Ingredient | Unit of measurement |
|---|---|
| Potassium chloride | 0.5 mg |
| Magnesium sulfate | 0.5 mg |
| KH2PO4 | 1.0 g |
| Ferrous sulfate | 0.1 g |
| Zinc sulfate | 0.1 g |
| Fibrinogen | 2.0 g |
| Agar | 2% |
Table 2.
list of ingredients of blood agar.
| Ingredient | Unit of measurement |
|---|---|
| peptone | 10.0 g/ L |
| tryptose | 10.0 g/ L |
| Sodium chloride | 5.0 g/ L |
| Agar | 15.0 g/ L |
| Distilled water | 960 ml |
Table 3.
List of instruments.
| Instrument | Model and manufacturer |
|---|---|
| Autoclaves | Tomy, japan |
| Aerobic incubator | Sanyo, Japan |
| Digital balance | Mettler Toledo, Switzerland |
| Oven | Binder, Germany |
| Deep freezer -70 0C | Artiko |
| Refrigator 5 | whirpool |
| PH meter electrode | Mettler-toledo,UK |
| Deep freezer -20 0C | whirlpool |
| Gyratory shaker | Corning gyratory shaker, Japan |
| 190-1100nm Ultraviolet visible spectrophotometer | UV1600PC, China |
| Light(optical) microscope | Amscope 120X-1200X, China |
Table 4a.
It demonstrates the components of 12% SDS-PAGE gel:.
| Component | Volume |
|---|---|
| 30% Acrylamide-bis-acrylamide solution | 6 ml |
| Distilled water | 3 ml |
| 2.5 X Tris-SDS Buffer( PH 8.8) | 6ml |
| 10% APS solution | 125 µl |
| TEMED | 18 µl |
Table 4b.
It refers to the components of 5% stacking gel:.
| Component | Volume |
|---|---|
| 30% Acrylamide-bis-acrylamide solution | 1.3 ml |
| Distilled water | 5.1 ml |
| 5X Tris-SDS Buffer( PH 6.8) | 1.6 ml |
| 10% APS solution | 75 µl |
| TEMED | 10 µl |
Table 5.
It displays the formulation of Fibrin-proteinase as a sterile solution at PH 7:.
| Ingredient | concentration |
|---|---|
| Fibrin-proteinase | 50-100 IU |
| Mono-basic sodium phosphate | USP, 2 mg + 5% |
| Di-basic sodium phosphate | USP, 3 mg + 5% |
| Sodium chloride | USP, 5 mg + 5% |
| Water for injection | Query size to 1 ml |
Table 6.
It shows the positive bacterial isolates distribution on MFA:.
| No of +ve bacterial isolates | No of -ve bacterial isolates |
| 31 | 19 |
Table 7.
Distribution of the main producing fibrinolytic bacterial bacilli on MFA:.
| No. of Bacillus cereus isolates | No. of Bacillus subtilis isolates |
| 17 | 14 |
Table 8.
It demonstrates the outcomes of different carbon sources on productivity of fibrinolytic enzymes:.
Table 8.
It demonstrates the outcomes of different carbon sources on productivity of fibrinolytic enzymes:.
| Carbon source( 2% W/ V) | Productivity( U/ml) |
|---|---|
| Soluble starch | 2.7 |
| Mannitol | 3.15 |
| Lactose | 1.68 |
| Dextrose | 2.87 |
| Sucrose | 2.3 |
Table 9.
It shows the influence of different inoculum volumes on the production of fibrinolytic enzymes at incubation conditions PH 7.4, temperature 37 0C and 18 hours incubation period:.
Table 9.
It shows the influence of different inoculum volumes on the production of fibrinolytic enzymes at incubation conditions PH 7.4, temperature 37 0C and 18 hours incubation period:.
| Inoculum volume( %) | Fibrinolytic enzyme productivity( U/ ml) |
|---|---|
| 1 | 0.76 |
| 2 | 1.89 |
| 3 | 1.12 |
| 4 | 1.00 |
| 5 | 0.84 |
| 6 | 1.53 |
| 7 | 1.33 |
| 8 | 0.91 |
Table 10.
It shows the effects of different nitrogen sources on FP productivity:.
| Nitrogen source( 1% W/ V) | FP productivity( U/ml) |
|---|---|
| Soyabean | 1.421 |
| Tryptone | 1.256 |
| Peptone | 2.013 |
| Na Nitrate | 1.903 |
| Ammonium Nitrate | 1.345 |
| Ammonium Dihydrogen Phosphate | 1.779 |
Table 11.
It demonstrates the effects of different metal ions on the fibrinolytic enzyme productivity:.
Table 11.
It demonstrates the effects of different metal ions on the fibrinolytic enzyme productivity:.
| Metal ion( 10 mM) | Productivity( U/ ml) |
|---|---|
| Mg+2 | 1.8 |
| Zn+2 | 0 |
| Hg+2 | 0 |
| CU+2 | 2.1 |
| Fe+2 | 1.8 |
| Ca+2 | 2.4 |
| Mn+2 | 2.3 |
| Fe+3 | 0 |
Table 12.
It shows the cellular position of the fibrinolytic enzymes:.
| Cellular position | Percentage( %) |
| Extracellular | 90 |
| Intracellular | 9 |
| Surface bound | 1 |
Table 13.
It demonstrates the effects of different PH degrees on FP production:.
| PH | FP productivity( U/ ml) |
|---|---|
| 3 | 0 |
| 4 | 0.2 |
| 5 | 0.6 |
| 6 | 0.7 |
| 7 | 1 |
| 8 | 1.89 |
| 9 | 1.7 |
| 10 | 1.5 |
| 11 | 0.8 |
| 12 | 0.4 |
| 13 | 0.1 |
Table 14.
It demonstrates the effects of different temperatures degrees on FP production:
| T( 0C) | FP productivity( U/ ml) |
|---|---|
| 10 | 0.2 |
| 20 | 0.6 |
| 35 | 1 |
| 40 | 1.2 |
| 43 | 1.9 |
| 50 | 0.9 |
| 55 | 0.7 |
| 60 | 0.3 |
| 65 | 0.1 |
| 70 | 0.0 |
Table 15.
It demonstrates Michaelis Menten Plot:.
| Substrate concentration( mM) | Velocity( U/ mg/ min) |
|---|---|
| 0.2 | 100 |
| 0.4 | 210 |
| 0.6 | 290 |
| 0.8 | 380 |
| 1 | 450 |
Table 16.
It represents AUC of recombinant Fibrin-proteinase given through SC injection:.
| Time( minute) | plasma concentration( U/ml) |
|---|---|
| 10 | 50 |
| 20 | 140 |
| 40 | 190 |
| 90 | 83 |
| 150 | 60 |
| 200 | 31 |
| 350 | 10 |
Table 17.
It represents fibrinolytic activity of test thermostable FP by Casein digestion assay:.
| Incubation time( hr) | Test (U/ml) | Standard (U/ml) |
|---|---|---|
| 0 | 0 | 0 |
| 2 | 8.14 | 7.02 |
| 4 | 13.7 | 14.07 |
| 6 | 30.05 | 28.44 |
| 8 | 39.82 | 37.29 |
| 10 | 60.46 | 58.51 |
Table 18.
It represents Fibrin-proteinase release profile:.
| Time( min) | Percentage of release( %) |
|---|---|
| 1.5 | 50 |
| 4 | 70 |
| 8 | 90 |
| 16 | 100 |
| 30 | 115 |
Table 19.
It represents the effects of different PH values on FP fibrinolytic activity:.
| PH | Enzyme activity( U/ ml) |
|---|---|
| 3 | 0 |
| 4 | 247 |
| 5 | 513 |
| 6 | 587 |
| 7 | 671 |
| 8 | 739 |
| 9 | 702 |
| 10 | 680 |
| 11 | 133 |
| 12 | 46 |
| 13 | 0.09 |
Table 20.
It represents the effects of various temperatures on the fibrinolytic activity of Fibrin-proteinase:.
Table 20.
It represents the effects of various temperatures on the fibrinolytic activity of Fibrin-proteinase:.
| T (℃) | Enzyme activity( U/ ml) |
|---|---|
| 20 | 614 |
| 25 | 632 |
| 30 | 646 |
| 35 | 661 |
| 40 | 688 |
| 50 | 693 |
| 55 | 727 |
| 60 | 573 |
| 65 | 432 |
| 70 | 17 |
| 80 | 9 |
| 90 | 5 |
| 100 | 0.046 |
Table 21.
It represents the effects of different metal ions and inhibitors on fibrinolytic activity of Fibrin-proteinase:.
Table 21.
It represents the effects of different metal ions and inhibitors on fibrinolytic activity of Fibrin-proteinase:.
| Metal ion( 10mM) | Fibrinolytic enzyme activity( U/ ml) |
|---|---|
| Co+2 | 618 |
| Ni+2 | 644 |
| Fe+2 | 523 |
| Ba+2 | 651 |
| K+ | 673 |
| Na+ | 681 |
| Mn+2 | 647 |
| Fe+3 | 23 |
| EDETA | 0 |
Table 22.
It shows the pharmacokinetics profile of Fibrin-proteinase:.
| Biological half life t1/2( min) | Total clearance( ml/ min) | Duration of action( min) | Onset time( min) | Apparent volume distribution( L) | Peak reach time( min) |
|---|---|---|---|---|---|
| 85-90 min | 11.6± 7.1 ml/ min | 300-360 min | 15-30 min | 2.8± 0.69 L | Within 60 minutes |
Table 23.
It indicates Molecular 16 S rRNA detection of the predominating bacterial isolates producing FP:
Table 23.
It indicates Molecular 16 S rRNA detection of the predominating bacterial isolates producing FP:
| Description | Scientific Name | Max Score | Total Score | Query Cover | E value | Per. ident |
| Bacillus cereus ATCC 4342, complete genome | Bacillus cereus ATCC 4342 | 1423 | 1423 | 100% | 0 | 100 |
| Bacillus cereus strain FT9, complete genome | Bacillus cereus | 1395 | 1395 | 100% | 0 | 99.35 |
| Bacillus cereus strain BC-AK genomic sequence | Bacillus cereus | 1373 | 1373 | 100% | 0 | 98.83 |
| Bacillus cereus G9241, complete genome | Bacillus cereus G9241 | 1373 | 1373 | 100% | 0 | 98.83 |
| Bacillus cereus strain FM1, complete genome | Bacillus cereus | 1373 | 1373 | 100% | 0 | 98.83 |
| Bacillus cereus strain 03BB87, complete genome | Bacillus cereus | 1373 | 1373 | 100% | 0 | 98.83 |
| Bacillus cereus strain BHU2 chromosome | Bacillus cereus | 1367 | 1367 | 100% | 0 | 98.7 |
| Bacillus cereus MRY14-0075 DNA, complete genome | Bacillus cereus | 1367 | 1367 | 100% | 0 | 98.7 |
| Bacillus cereus strain EFR-1 chromosome | Bacillus cereus | 1367 | 1367 | 100% | 0 | 98.7 |
| Bacillus cereus NC7401 genomic DNA, complete genome | Bacillus cereus NC7401 | 1367 | 1367 | 100% | 0 | 98.7 |
| Bacillus cereus Q1, complete genome | Bacillus cereus Q1 | 1367 | 1367 | 100% | 0 | 98.7 |
| Bacillus cereus AH187, complete genome | Bacillus cereus AH187 | 1367 | 1367 | 100% | 0 | 98.7 |
| Bacillus cereus strain AR156, complete genome | Bacillus cereus | 1362 | 1640 | 100% | 0 | 98.57 |
| Bacillus cereus strain CC-1 chromosome, complete genome | Bacillus cereus | 1351 | 1351 | 100% | 0 | 98.31 |
| Bacillus cereus 30090 DNA, complete genome | Bacillus cereus | 1351 | 1351 | 100% | 0 | 98.31 |
| Bacillus cereus ATCC 10987 chromosome | Bacillus cereus ATCC 10987 | 1267 | 1267 | 100% | 0 | 96.36 |
| Bacillus cereus strain G9241 chromosome | Bacillus cereus | 1267 | 1267 | 100% | 0 | 96.36 |
| Bacillus cereus FRI-35, complete genome | Bacillus cereus FRI-35 | 1267 | 1267 | 100% | 0 | 96.36 |
| Bacillus cereus ATCC 10987, complete genome | Bacillus cereus ATCC 10987 | 1267 | 1267 | 100% | 0 | 96.36 |
Table 24.
It demonstrates the biochemical reactions of the predominating bacterial isolates producing FP:
Table 24.
It demonstrates the biochemical reactions of the predominating bacterial isolates producing FP:
| Test | Result |
|---|---|
| Gram stain | + |
| Cell shape | Rod |
| Spore shape | Ellipsoidal |
| Spore site | Central |
| Motility | + |
| Catalase | + |
| Oxidase | + |
| Blood haemolysis | Beta haemolysis |
| Indol | - |
| Methyl red | + |
| Voges-proskauer | + |
| Citrate utilization | + |
| Starch hydrolysis | + |
| Gelatin hydrolysis | + |
| Growth at 45 0C | + |
| TSI | + |
| Tolerance salinity | |
| 5% NaCl | + |
| 7% NaCl | + |
| Saccharide fermentation | |
| Glucose | + |
| Fructose | + |
| Maltose | + |
| Sucrose | + |
Disclaimer/Publisher’s Note: The statements, opinions and data contained in all publications are solely those of the individual author(s) and contributor(s) and not of MDPI and/or the editor(s). MDPI and/or the editor(s) disclaim responsibility for any injury to people or property resulting from any ideas, methods, instructions or products referred to in the content. |
© 2024 by the authors. Licensee MDPI, Basel, Switzerland. This article is an open access article distributed under the terms and conditions of the Creative Commons Attribution (CC BY) license (http://creativecommons.org/licenses/by/4.0/).
Copyright: This open access article is published under a Creative Commons CC BY 4.0 license, which permit the free download, distribution, and reuse, provided that the author and preprint are cited in any reuse.


