
Submitted:
21 November 2025
Posted:
24 November 2025
You are already at the latest version
Abstract
The identification of robust biomarkers reflecting biological age is crucial for advancing precision medicine. This study investigates the transcriptional fidelity of N-myc downstreamregulated gene 1 (NDRG1) relative to chronological age in a Mesenchymal Stromal Cell (MSC) context, utilizing a cohort of 61 subjects. Analysis of transcriptomic expression data revealed a mean expression of 5.9420 (SD: 0.4918). A significant negative Pearson correlation was observed between NDRG1 expression and age (r = −0.4459, p = 0.0003), indicating a consistent decline in transcript abundance with advancing age. Linear regression modeling quantified this decline with a slope of -0.0127 per year. These findings position NDRG1 as a candidate biomarker for age-related transcriptional dysregulation.
Keywords:
NDRG1
; Mesenchymal Stromal Cells (MSCs)
; transcriptomic profiling
; age-associated downregulation
; chronological age
; biomarker
; pearson correlation
; linear regression
; transcript abundance
1. Introduction
Aging is a multifactorial process characterized by the progressive loss of physiological integrity and increased susceptibility to disease. At the molecular level, aging is driven by genomic instability, epigenetic alterations, and the dysregulation of gene expression. The convergence of these risk factors often manifests as distinct transcriptional signatures, particularly in genes governing cellular stress responses, metabolic regulation, and inflammation [1,7]. Consequently, identifying specific genes that exhibit consistent, age-dependent expression patterns is essential for developing panels of biological aging biomarkers [11].
This study analyzes the specific genetic locus identified in the Ensembl database. The Ensembl database (ENSG) serves as a comprehensive genome browser, providing stable, species-specific identifiers for genomic assemblies. The "ENSG" prefix explicitly denotes a human gene identifier within this ontology, ensuring precise annotation distinct from transcript (ENST) or protein (ENSP) variants. In this analysis, the identifier ENSG00000104419 corresponds to the N-myc downstream-regulated gene 1 (NDRG1).
NDRG1 is a pleiotropic regulator involved in stress responses, cell growth, and differentiation. It has been extensively studied as a prognostic marker in various malignancies, including breast and lung cancer, as well as head and neck cancers [3,9]. Furthermore, its role extends to neuronal metabolism and stability, markers of which are often compromised during aging [10]. However, its expression dynamics in the context of non-pathological chronological aging in MSCs remain less characterized. Previous literature has established that regulatory genes often show age-dependent downregulation in healthy tissues, similar to patterns observed in genes like GALNT14 [5]. This paper tests the hypothesis that NDRG1 expression is inversely correlated with chronological age, potentially reflecting a decline in cellular stress response mechanisms over time.
2. Methods
2.1. Data Acquisition and Sample Characteristics
The dataset comprises observational transcriptomic expression values for NDRG1 derived from human tissue samples (). The chronological age of the subjects in the cohort ranged from 17 to 84 years, providing a broad spectrum for analyzing age-related trends.
2.2. Bioinformatic Analysis
Descriptive statistics (mean, standard deviation, minimum, maximum) were calculated to characterize the distribution of NDRG1 expression. The strength and direction of the linear relationship between age and transcript abundance were evaluated using Pearson’s correlation coefficient (r). A simple linear regression model was fitted to the data to quantify the rate of change in expression intensity per year of age. Significance was defined as .
3. Results
3.1. Descriptive Statistics
The expression levels of NDRG1 showed measurable variability across the cohort. The mean expression level was 5.942, with a standard deviation of 0.492. Table 1 summarizes the population characteristics.
3.2. Correlation and Regression Analysis
A statistically significant negative correlation was identified between chronological age and NDRG1 expression (, ). This indicates a moderate inverse relationship where expression levels consistently decrease as age increases. The results of the linear regression and correlation analysis are detailed in Table 2.
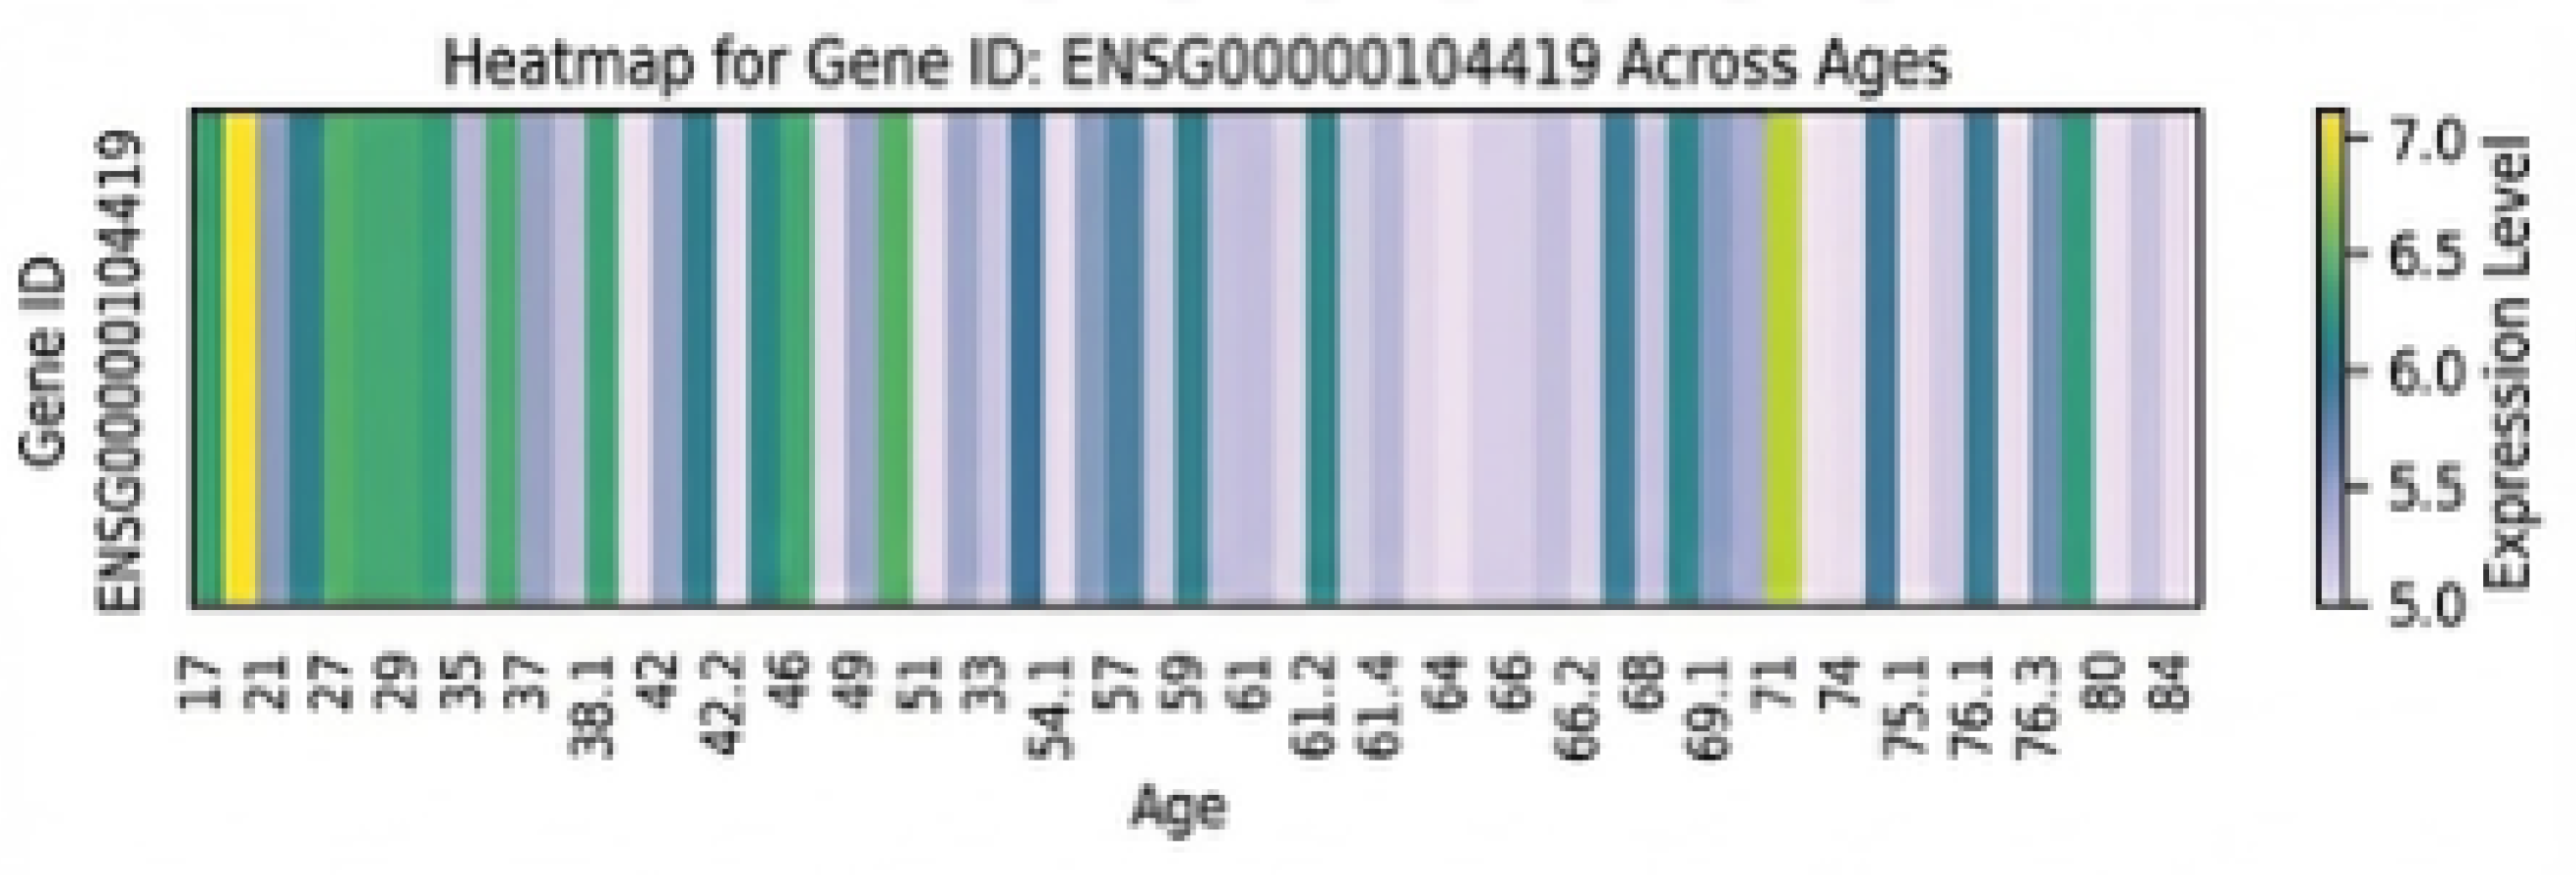
To visualize the distribution of expression intensity across the age spectrum, a heatmap is presented below.
Linear regression analysis yielded the following equation:
The slope indicates that for every decade of aging, NDRG1 expression decreases by approximately 0.127 units.
Figure 1.
Linear regression analysis of gene NDRG1 expression relative to age. The scatter plot and trend line illustrate the correlation between increasing age and changes in gene expression levels.
Figure 1.
Linear regression analysis of gene NDRG1 expression relative to age. The scatter plot and trend line illustrate the correlation between increasing age and changes in gene expression levels.
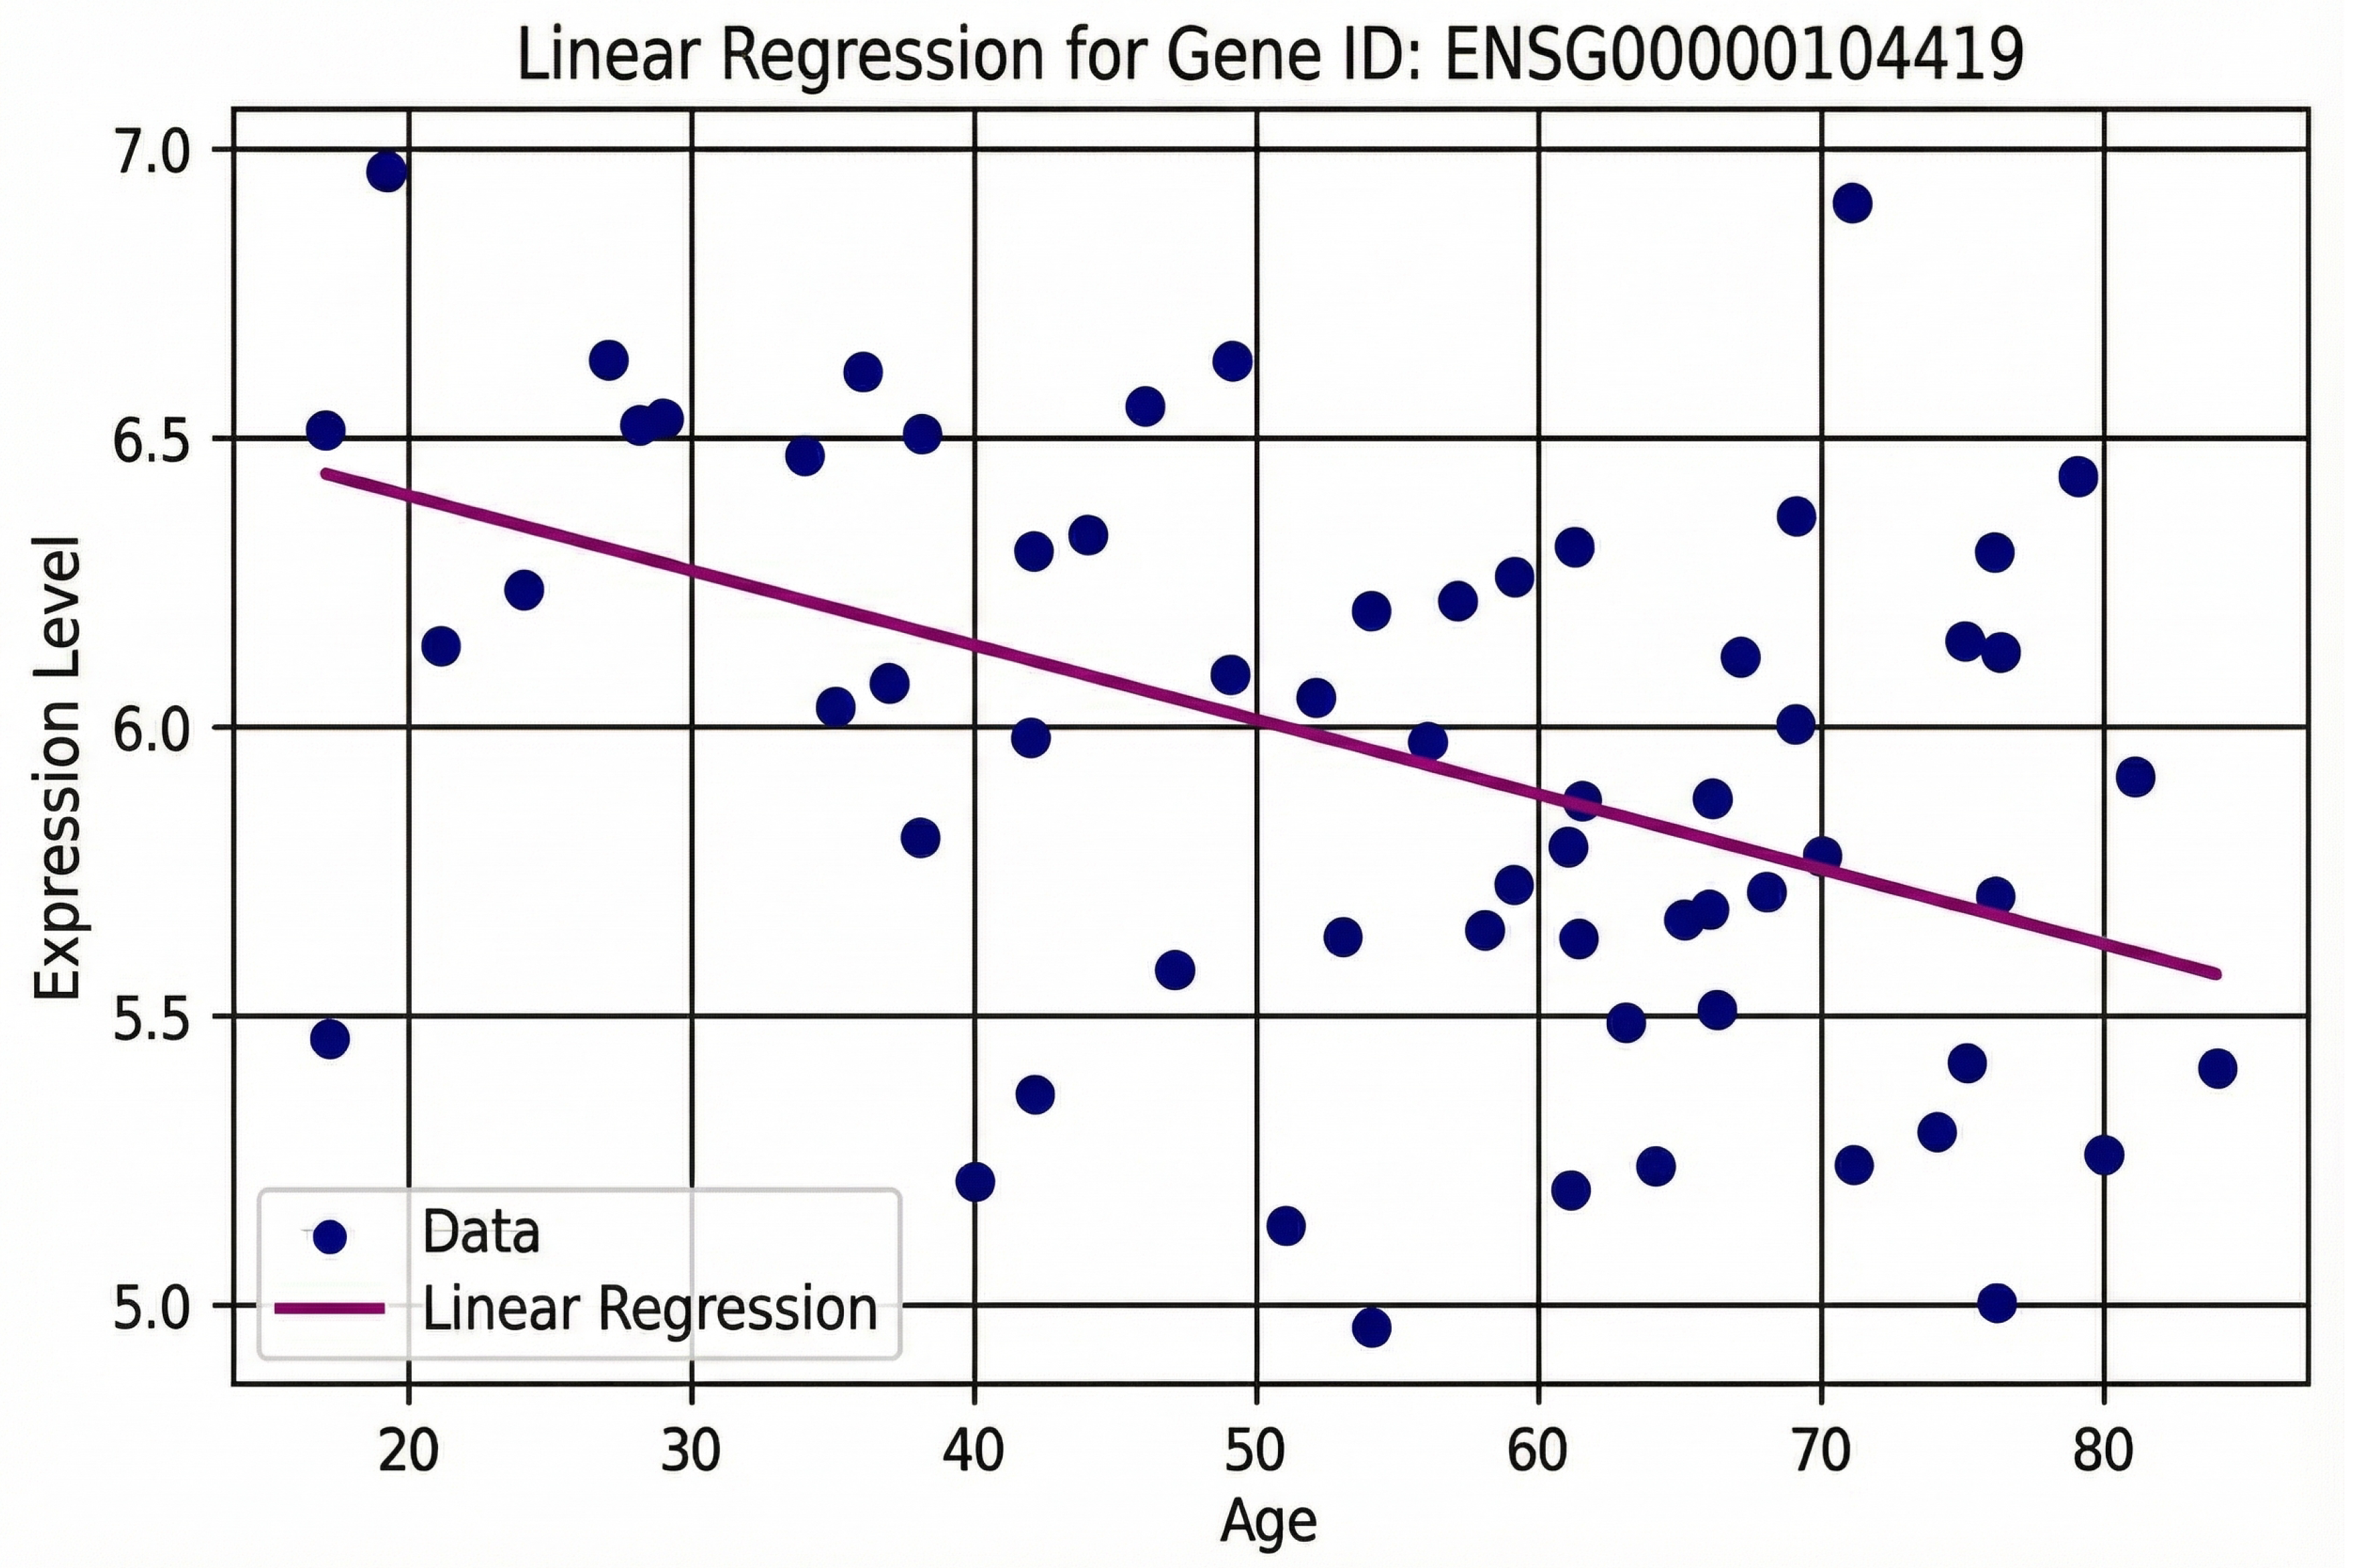
Figure 2.
Heatmap displaying the expression levels of gene NDRG1 across various age groups. The color gradient represents expression intensity, with lighter colors indicating higher expression values.
Figure 2.
Heatmap displaying the expression levels of gene NDRG1 across various age groups. The color gradient represents expression intensity, with lighter colors indicating higher expression values.
4. Discussion
The results of this study demonstrate a significant age-dependent decline in the expression of NDRG1. The negative correlation () aligns with the "aging signature" hypothesis, where specific regulatory genes exhibit progressive dysregulation [6].
NDRG1 is functionally critical for cellular stress responses and the regulation of DNA damage responses, mechanisms often compromised in aging and cancer [8]. Its downregulation in older subjects suggests a potential mechanism for the reduced homeostatic capacity observed in aging tissues. If NDRG1 levels are insufficient, cells may become more vulnerable to hypoxic or metabolic stress, conditions often preceding age-related pathologies [4]. While NDRG1 is often upregulated in specific cancer contexts as a stress response, its basal decline with age in this cohort suggests a loss of protective baseline function.
4.1. Limitations
Several limitations must be acknowledged. First, while the sample size () is sufficient for detecting moderate correlations, it may not capture subtle sub-group variations. Second, this study utilizes observational data; therefore, the correlation does not imply causality. It is undetermined whether the decline in NDRG1 is a driver of aging or a consequence of upstream cellular senescence.
4.2. Future Directions
Future research should focus on validating these findings in larger, longitudinal cohorts to confirm the trajectory of expression decline within individuals over time. Mechanistic studies are required to determine if restoring NDRG1 expression in aged cells can rescue stress response phenotypes. Additionally, proteomic analysis should be conducted to verify if the transcriptional decline corresponds to a reduction in functional NDRG1 protein levels.
5. Conclusions
This analysis confirms a statistically significant negative correlation between chronological age and the expression of NDRG1. The data supports the classification of NDRG1 as an age-repressed gene. These findings contribute to the broader understanding of the molecular footprint of aging and highlight NDRG1 as a potential candidate for biomarker panels assessing biological age.
References
- İzgi, H. (2017). Meta Analysis of Alzheimer’s Disease at the Gene Expression Level. ProQuest.
- Saponaro, C., Gammaldi, N., & Cavallo, V. (2025). Insight into the Regulation of NDRG1 Expression. MDPI.
- Joshi, V., Stacey, A., & Feng, Y. (2024). NDRG1 is a prognostic biomarker in breast cancer and breast cancer brain metastasis. Wiley Online Library.
- Yang, H., Wang, Z., Gong, L., & Huang, G. (2022). A Novel Hypoxia-Related Gene Signature with Strong Predicting Ability in Non-Small-Cell Lung Cancer. Wiley Online Library.
- Czyrnik, E. D., Wiesehöfer, M., & Dankert, J. T. (2023). Stromal-epithelial interaction induces GALNT14 in prostate carcinoma cells. PMC.
- Luo S, Bai Y, Li X, Jin S, Yan D, Dong X. Analysis of the differential transcriptome expression profiles during prenatal muscle tissue development in Diqing Tibetan pigs. doi: 10.3389/fvets.2025.1584236. PMID: 41246267; PMCID: PMC12616866..
- Smajic, S. (2022). The role of neuromelanin in dopaminergic neuron demise and inflammation in idiopathic Parkinson’s disease. orbilu.uni.lu.
- Papadaki, C., Monastirioti, A., Rounis, K., & Makrakis, D. (2020). Circulating MicroRNAs regulating DNA damage response and responsiveness to cisplatin in the prognosis of patients with non-small cell lung cancer. MDPI.
- Mes, S. W. (2021). Novel prognostic biomarkers in head and neck cancer. VU Research.
- Tricolici, A. M. (2024). Investigation of mTOR-dependent neuronal markers, gene expression and central metabolism in dopaminergic neurons. Repository Essex.
- Karkia, R., Sisu, C., Saravi, S., Kyrou, I., & Randeva, H. S. (2025). Effects of Asprosin and Role of TLR4 as a Biomarker in Endometrial Cancer. MDPI.

Table 1.
Descriptive Statistics for Age and NDRG1 Expression ()
| Variable | N | Mean | Std. Dev. | Min | Max |
|---|---|---|---|---|---|
| Age (Years) | 61 | 54.16 | 17.85 | 17.00 | 84.00 |
| NDRG1 Expression | 61 | 5.942 | 0.492 | 4.957 | 7.117 |
Source: Derived from dataset.
Table 2.
Transcriptomic Analysis Results for NDRG1 vs. Age
| Statistic | Value |
|---|---|
| Pearson Correlation (r) | -0.4459 |
| P-value | 0.0003 |
| Regression Slope () | -0.0127 |
| Intercept | 6.6437 |
| Direction | Negative |
Source: Regression modeling.
Disclaimer/Publisher’s Note: The statements, opinions and data contained in all publications are solely those of the individual author(s) and contributor(s) and not of MDPI and/or the editor(s). MDPI and/or the editor(s) disclaim responsibility for any injury to people or property resulting from any ideas, methods, instructions or products referred to in the content. |
© 2025 by the authors. Licensee MDPI, Basel, Switzerland. This article is an open access article distributed under the terms and conditions of the Creative Commons Attribution (CC BY) license (http://creativecommons.org/licenses/by/4.0/).
Copyright: This open access article is published under a Creative Commons CC BY 4.0 license, which permit the free download, distribution, and reuse, provided that the author and preprint are cited in any reuse.


