
Submitted:
21 November 2025
Posted:
24 November 2025
You are already at the latest version
Abstract
Climate change is impacting rivers worldwide, with a reduction in normal flow conditions in temperate regions like Poland. Such changes have an influence on riparian vegetation, as depicted by this study, which focuses on a 250km-long reach of the Polish Vistula River and investigates variations of monthly maximum discharges and vegetation conditions over the period 1984-2023 by means of Landsat satellite images. These satellite data were handled via Google Earth Engine, looking at a common index such as the Normalized Difference Vegetation Index, considered as a proxy of vegetation coverage variations. Results suggest that a process of riparian vegetation growth and consequent oversimplification is affecting this river reach, particularly over the last couple of decades, during which water availability has decreased significantly. Using the Vistula River as an exemplary case study, this research suggests that prolonged dry periods, more common in recent decades due to climate change, might impact large rivers located in temperate climates, favouring the development of vegetation on exposed sandbars, eventually resulting in a less dynamic active channel.
Keywords:
Google Earth Engine
; Landsat
; remote sensing
; Riparian vegetation
; Vistula River
1. Introduction
Alluvial river channels are inherently dynamic systems, continuously adjusting their morphology in response to fluctuations in water discharge and sediment supply from upstream sources [1,2,3]. This self-regulating behaviour highlights the need to study rivers through a holistic lens, which can capture the intricate feedback mechanisms and mutual adjustments linking landforms with both physical and biological processes [4]. Vegetation plays a central role in these interactions, as its presence along river margins, floodplains, and in-channel bars contributes to the shaping of distinct fluvial forms by altering hydraulic conditions, redistributing flow velocities, and influencing sediment transport rates. Vegetation also modifies the trajectory of channel evolution by stabilizing certain areas while enhancing deposition in others. Conversely, the establishment, growth, and spatial distribution of riparian plants are themselves strongly controlled by local environmental factors that include the frequency and magnitude of floods, sediment dynamics, and the morphodynamic disturbances generated during extreme hydrological events [5,6].
Apart from the impact of humans, recognizable in many rivers worldwide [7,8], climate change is emerging as a major driver of fluvial and riparian transformations. In particular, it is altering the synchrony and asynchrony of flooding regimes and associated ecological processes across Europe. Recent studies suggest a shift toward more synchronous flood events, a trend that may have profound implications for the long-term functioning of rivers and their adjoining floodplains [9]. One of the most visible consequences of such altered hydrological patterns is the expansion of vegetation on riverbanks and in-channel bars. The establishment of riparian vegetation is highly sensitive to both the timing of seed release and germination, and to hydrological variability, particularly the occurrence and magnitude of annual peak discharges [10,11,12]. When peak flows are reduced in frequency or intensity, conditions become favourable for seedlings to survive the vulnerable early stages of growth, leading to increased vegetation encroachment in previously active fluvial zones. Over time, this process not only modifies channel morphology but also affects habitat availability, sediment transport, and the resilience of riparian ecosystems.
In temperate regions such as Central Europe, recent decades have been marked by a noticeable decline in precipitation and the occurrence of increasingly prolonged dry periods [13]. This trend is not unique to Poland but reflects a broader global phenomenon, as extended droughts are becoming more frequent in many parts of the world, with far-reaching negative impacts on diverse environmental systems [14,15]. Focusing on Europe, historical records indicate that since the 1950s the frequency of drought events has risen across southern and much of Central Europe, while conversely declining in several northern regions [16,17,18]. Situated in Central Europe, Poland has not been exempt from these climatic shifts, and multiple studies have documented an increase in both the frequency and duration of dry periods within the country, relying on a combination of in situ measurements and remote sensing analyses [19,20,21,22]. As these investigations consistently demonstrate, shifts in climatic conditions are strongly reflected in fluvial systems, influencing key compartments such as water availability, sediment dynamics, and riparian vegetation. Reduced water availability not only constrains ecological functions and biodiversity within riparian zones but also affects the long-term resilience of river corridors, emphasizing the need for integrated water management and adaptation strategies under a changing climate.
Remote sensing, and satellite imagery in particular, has become an indispensable tool for monitoring fluvial dynamics across a range of spatial and temporal scales [23,24]. By conceptualizing the river corridor as an integrated unit comprising river channels, fluvial deposits, riparian zones and adjacent floodplains [25], remotely sensed data provide a powerful means of capturing the complex interactions that shape river systems. These datasets support a variety of bio-geomorphological applications, from tracking channel migration and sediment deposition to assessing riparian vegetation cover and dynamics [26].
Among the many Earth observation initiatives, the Landsat programme stands out as a cornerstone of global surface monitoring. As the longest-running satellite programme dedicated to terrestrial ecosystem observation, Landsat has been delivering moderate-resolution imagery since the launch of its first satellite in 1972 [27]. Over the decades, successive missions have carried advanced multispectral sensors, culminating in the current operation of Landsat 9, started in 2021. These sensors capture detailed surface reflectance data, which have been extensively used for scientific and management purposes, including the analysis of river morphology [28,29] and the monitoring of vegetation coverage [30,31,32].
The growing reliance on satellite-based information has driven the development of innovative data infrastructures and processing tools capable of handling vast volumes of Earth observation data. One of the most transformative platforms in this respect is Google Earth Engine (GEE), a cloud-based system that provides access to petabytes of geospatial datasets while offering advanced computational capacity for planetary-scale analyses [33]. By enabling large-scale, high-frequency, and long-term assessments, GEE has proven particularly valuable for bio-geomorphological research [34]. Since its introduction, it has become the most widely adopted cloud-processing tool for remote sensing applications, playing a pivotal role in advancing spatial analyses across diverse disciplines [35,36].
Previous studies on European alluvial rivers have shown that fluctuations in water levels and flood regimes strongly influence riparian plant communities, often facilitating the establishment of vegetation on floodplains, banks and in-channel bars [34,37]. Alterations to the natural flow regime, whether driven by human interventions or by climate change, have been demonstrated to exert a direct impact on riparian ecosystems, reshaping community structure and distribution patterns [38,39].
In light of these findings, the present study investigates how the recently observed decline in water availability in Poland has affected riparian vegetation along the Middle and Lower Vistula River. To this end, hydrological records were integrated with satellite imagery to assess vegetation dynamics over a 250 km-long section of the river, spanning the period 1984–2023. The analysis specifically considers monthly maximum discharges as a proxy for flow variability, since such events are capable of mobilizing both sediments and seeds, thereby creating favourable conditions for vegetation establishment [40,41,42]. The study area covers an upstream part that is relatively natural but increasingly threatened by vegetation encroachment and morphological simplification [24,43], and a more anthropized part that traverses the anthropized urban landscape of Warsaw, where human pressures intersect with climatic stressors to shape vegetation patterns. Vegetation dynamics across this corridor were inferred using the Normalized Difference Vegetation Index (NDVI), one of the most widely adopted spectral indices for monitoring vegetation condition and coverage [44,45].
As demonstrated with this case study, the proposed methodology can provide insights into the medium- to long-term evolution of alluvial watercourses. In addition, thanks to its relative simplicity and low costs, this approach can be transferred to relatively ungauged basins and used to evaluate the long-term evolution of large rivers, covering temporal horizons of several decades.
2. Materials and Methods
2.1. Study Area
The research focus is a 250 km-long reach of the Polish Vistula River between Dęblin and Płock (Figure 1). The Vistula River basin has a total drainage basin area of around 194,000 km2, of which 87% (169,000 km2) lies within Poland, while the remaining part of the basin is located in Belarus, Ukraine, and Slovakia [46]. The Vistula rises in the south of Poland at around 1,200 m a.s.l. in the Carpathian Mountains, and then flows north through metropolises such as Kraków and Warsaw, emptying into the Vistula Lagoon or directly into the Gdansk Bay of the Baltic Sea [24]. The regional climate of Poland is generally temperate, characterized by cold winters, warm summers, and the absence of a pronounced dry season. In the southern mountainous areas, similar conditions prevail, with higher altitudes exhibiting tundra-like climatic characteristics in the highest peaks [47].
2.2. River Morphology
The Vistula River and its valley possess a geological history that spans more than two million years [48]. Although the current landscape has been predominantly shaped by processes active over the last 14,000 years, fluvial dynamics such as riverbank erosion and sediment deposition within the main channel continue to actively modify the system. Unlike many other European rivers, the Vistula exhibits a unique management history shaped by centuries of political fragmentation and varied human interventions [49]. In fact, from the late 18th century until 1918, the Vistula basin was divided among Austria, Russia, and Prussia, with each authority implementing river management strategies tailored to its own administrative and economic priorities. In the lower course, Prussia initiated extensive river regulation projects during the nineteenth century, while repeated flooding in the Upper Vistula prompted Austrian authorities to undertake channelization works. Meanwhile, the central section of the river, the longest stretch under Russian administration, remained largely unmodified until Poland regained independence. Today, this middle reach still retains many natural characteristics, including braided channels, islands, and relatively unaltered floodplain features. Despite this persistence of natural elements, traces of past human interventions remain clearly visible, superimposed on the ongoing geomorphological and ecological processes that continue to shape the river corridor [50]. This interplay of historical management and active fluvial processes provides a distinctive context for understanding the Vistula’s current morphology, hydrology, and riparian vegetation dynamics.
The study area (Figure 1b) encompasses a 250 km-long section of the Vistula River, extending from Dęblin to Płock, situated between the river’s middle and lower courses. During the 18th and 19th centuries, this reach exhibited a predominantly braided channel pattern, characterized by numerous bars and islands, with only a few abandoned meanders appearing where the valley widened. This watercourse is rather natural with respect to other large rivers in Europe. In fact, even if the earliest flood protection and river regulation measures were introduced toward the end of the 19th century, downstream of Warsaw, significant channelization works were not implemented until the 1960s. As a result of these interventions, the average channel width has contracted substantially from its original 1,000–1,600 meters to approximately 300–500 meters. These changes have modified flow dynamics, increasing flow velocity and driving morphological adjustments, as evidenced by sandbar migration rates ranging from 0.4 to 2.4 m/day [51]. Further transformations followed the construction of the Włocławek Dam in 1968–1969, which fundamentally altered hydro-morpho-biodynamic processes [52]. The dam created a backwater zone that trapped incoming sediment and induced substantial downstream changes in sediment transport and channel morphology [53]. The combined effects of channelization and backwater influence have markedly reduced lateral erosion, while promoting rapid vertical aggradation and the formation of new terraces along the channel [50]. These modifications in river morphology have important ecological consequences: the contraction and stabilization of the channel, combined with altered sediment dynamics, have diminished the provision of ecosystem services and created potential challenges for protected and endangered species that depend on dynamic riverine habitats [54].
2.3. Hydrological Data
The study reach starts at the gauging station of Dęblin, and the minimum, mean, and maximum monthly discharges were retrieved from the Polish Institute of Meteorology and Water Management database, considering the period 1984-2023 (Figure 2).
The data acquired in this station were considered representative of the whole reach hydrology, on the basis of the observations reported in Nones (2021), who pointed out that the presence of a major tributary like the Narew does not significantly alter the trend of discharges [24]. It is worth reminding here that this research aims to evaluate how a different pattern in flood frequency impacted the riparian vegetation dynamics, rather than specifically analysing the quantitative variations.
2.4. Satellite Data
Google Earth Engine (GEE) was employed to extract information on vegetation dynamics from multi-temporal, multi-spectral satellite imagery. Specifically, Landsat surface reflectance products, including Landsat 5 TM, Landsat 7 ETM, Landsat 8 OLI, and Landsat 9 OLI/TIRS, covering the period 1984–2023 were selected as the primary data source. These products, available through the GEE data catalog (developers.google.com/earth-engine/datasets/catalog), have been atmospherically corrected, enabling more accurate and consistent comparisons of spectral reflectance measurements across different acquisition dates. The Landsat dataset is particularly well-suited for assessing long-term changes in riparian vegetation along large rivers such as the Vistula due to several factors: i) it offers near-continuous temporal coverage, with revisit intervals ranging between 9 and 17 days [55], ii) it provides a spatial resolution of 30 meters for most spectral bands. These characteristics allow for reliable detection of both gradual and abrupt changes in vegetation patterns, supporting the analysis of spatiotemporal dynamics across extensive river reaches over multiple decades.
The region of interest (ROI) was initially delineated using QGIS, by mapping the active river channels within the main levees with reference to Google Earth imagery. A temporal range corresponding to the study period, from 1 January 1984 to 31 December 2023, was established, and a time filter was applied to select all available Landsat surface reflectance imagery within this interval. To improve data quality, the CFMask algorithm was applied to each image in the collection to identify and mask cloud and cloud shadow pixels [56], ensuring that only cloud-free observations were retained for subsequent analysis. This approach is particularly advantageous because it provides a dynamic masking capability, which accounts for hydrodynamic variations in river stage between different acquisition dates, thereby capturing temporal changes in the extent of the active channel [57]. Using only the retained pixels, the Normalized Difference Vegetation Index - NDVI [44] was calculated as:
where NIR represents the near-infrared band and R is the red band. NDVI is a common index for vegetation monitoring [58], with higher values for more vegetated and healthier areas, and negative values indicating the absence of vegetation.
3. Results
3.1. Hydrological Variability
Vegetation dynamics is driven by high water levels [34,59], and therefore, in the current analysis, only maximum annual discharge were considered.
Looking at maximum monthly discharges measured at the gauging station of Dęblin (Figure 3, blue line), it is possible to observe an increase in discharge after around 1998, with relatively constant maximum values until 2015. After this, a general decrease in water levels, and consequently discharges, was recognizable, as also pointed out recent studies [43]. A 5-year moving average (Figure 3, black line) was utilized to highlight such a reduction in maximum monthly discharge, which is forecasted to continue due to climate change [60].
Vegetation needs time to develop, and therefore the monthly maximum discharges were clustered in 20-year periods, namely 1984-2003, 1994-2013, 2004-2023, to relate hydrological variability with vegetational dynamics. As visible in Figure 4, the period 1994-2013 was very humid, with high maximum discharges that flooding events [61], while the period 1984-2003 was characterized by lower maximum discharges. Looking at the cluster 2004-2023 a significant reduction of water flow is observable, which eventually implies variations for both river morphology and riparian vegetation, as already observed by other scholars [24,43].
3.2. Vegetational Dynamics
NDVI values for each image were derived from GEE as a single value covering the whole study area. Mean NDVI values were computed using cloud-free, non-water acquisitions, along with the 25th and 75th percentiles that indicate the lower and upper quartiles of the NDVI response. A slightly increasing trend is observable (Figure 5), meaning that vegetation is nowadays more present and healthy in the area with respect to what it was at the beginning of the observational period. At the same time, it is worth noticing some outliers, which might be connected to the quality of the images.
As depicted by Figure 6, analysing long-term variations of NDVI, it is possible to observe an increase in both very negative (< -0.5) and very positive (> 0.8) values when comparing early acquisitions (period 1984-2003, blue bars)) to the recent situation (period 2004-2023, orange bars). This trend confirms the results previously reported, and indicates an increase in vegetated areas over time, which consequently reduces the room for the river, given that the total area (i.e., the masked ROI) remains constant.
Spatially, vegetation is changing dynamically, likely as a response of hydrological changes (Figure 7). During the 1994-2013 period, characterised by higher discharges, vegetation tend to distribute across the entire valley, with a reduction of in-channel vegetation in favour of its establishment on bars and banks, eventually contributing in starting new islands (Figure 7b). Periods characterized by low monthly maximum, such as the recent years 2004-2023 (Figure 7c) helps vegetation in establishing along banks and on secondary channels, eventually causing their closure and redirecting the flow into the main channel, with consequent deepening.
4. Discussion
Fluvial dynamics represent highly complex, multiscale processes that arise from the continuous interaction among water flow, sediment transport, and riparian vegetation [42,62]. Over the years, researchers have approached the study of these processes using a wide range of methodologies. Initial investigations were often conducted at the local scale with the aid of field instruments and in situ measurements [63]. More recently, advances in technology have made it possible to study riverine environments at broader spatial and temporal scales through the deployment of uncrewed aerial vehicles (UAVs) and Earth observation satellites [64].
In the present investigation, which focuses on the largest river in Poland and one of the major river systems in Europe, remote sensing techniques have proven particularly valuable for detecting the long-term development of riparian vegetation. Such an approach not only enables the identification of vegetation trends over extended time horizons, but also facilitates linking these patterns to possible driving factors, such as variability in river hydrology.
Despite past studies and also the current results demonstrated the advantages of using remote sensing approaches in riparian vegetation investigations, the application of satellite-derived vegetation indices, such as the Normalized Difference Vegetation Index (NDVI), does not come without significant challenges. For example, NDVI values are known to be influenced by a variety of external factors, including atmospheric conditions, topography, and soil reflectance characteristics [65,66]. Furthermore, when NDVI is computed from medium-resolution imagery such as Landsat, each pixel often represents a combination of vegetation types and bare soil. These so-called “mixed pixels” [67] can obscure subtle differences in vegetation composition and reduce the accuracy of vegetation mapping, making it difficult to detect species-specific responses. Another limitation is related to sparse or patchy vegetation, which may not generate a sufficiently strong spectral signal to be reliably classified as vegetation, thereby leading to underrepresentation of these communities [68]. Despite these constraints, a growing body of literature has demonstrated that NDVI remains a useful tool for assessing vegetation dynamics in riparian corridors [45,57,69,70]. Its ability to capture general vegetation trends over space and time makes it particularly suitable for large-scale, long-term studies. To strengthen and validate the insights derived from satellite data, however, future research should complement remote sensing approaches with targeted field campaigns. Collecting species-level information through ground surveys would allow the creation of updated and high-resolution databases, thereby enabling more accurate assessments of how different plant communities respond to both natural disturbances and human-induced pressures.
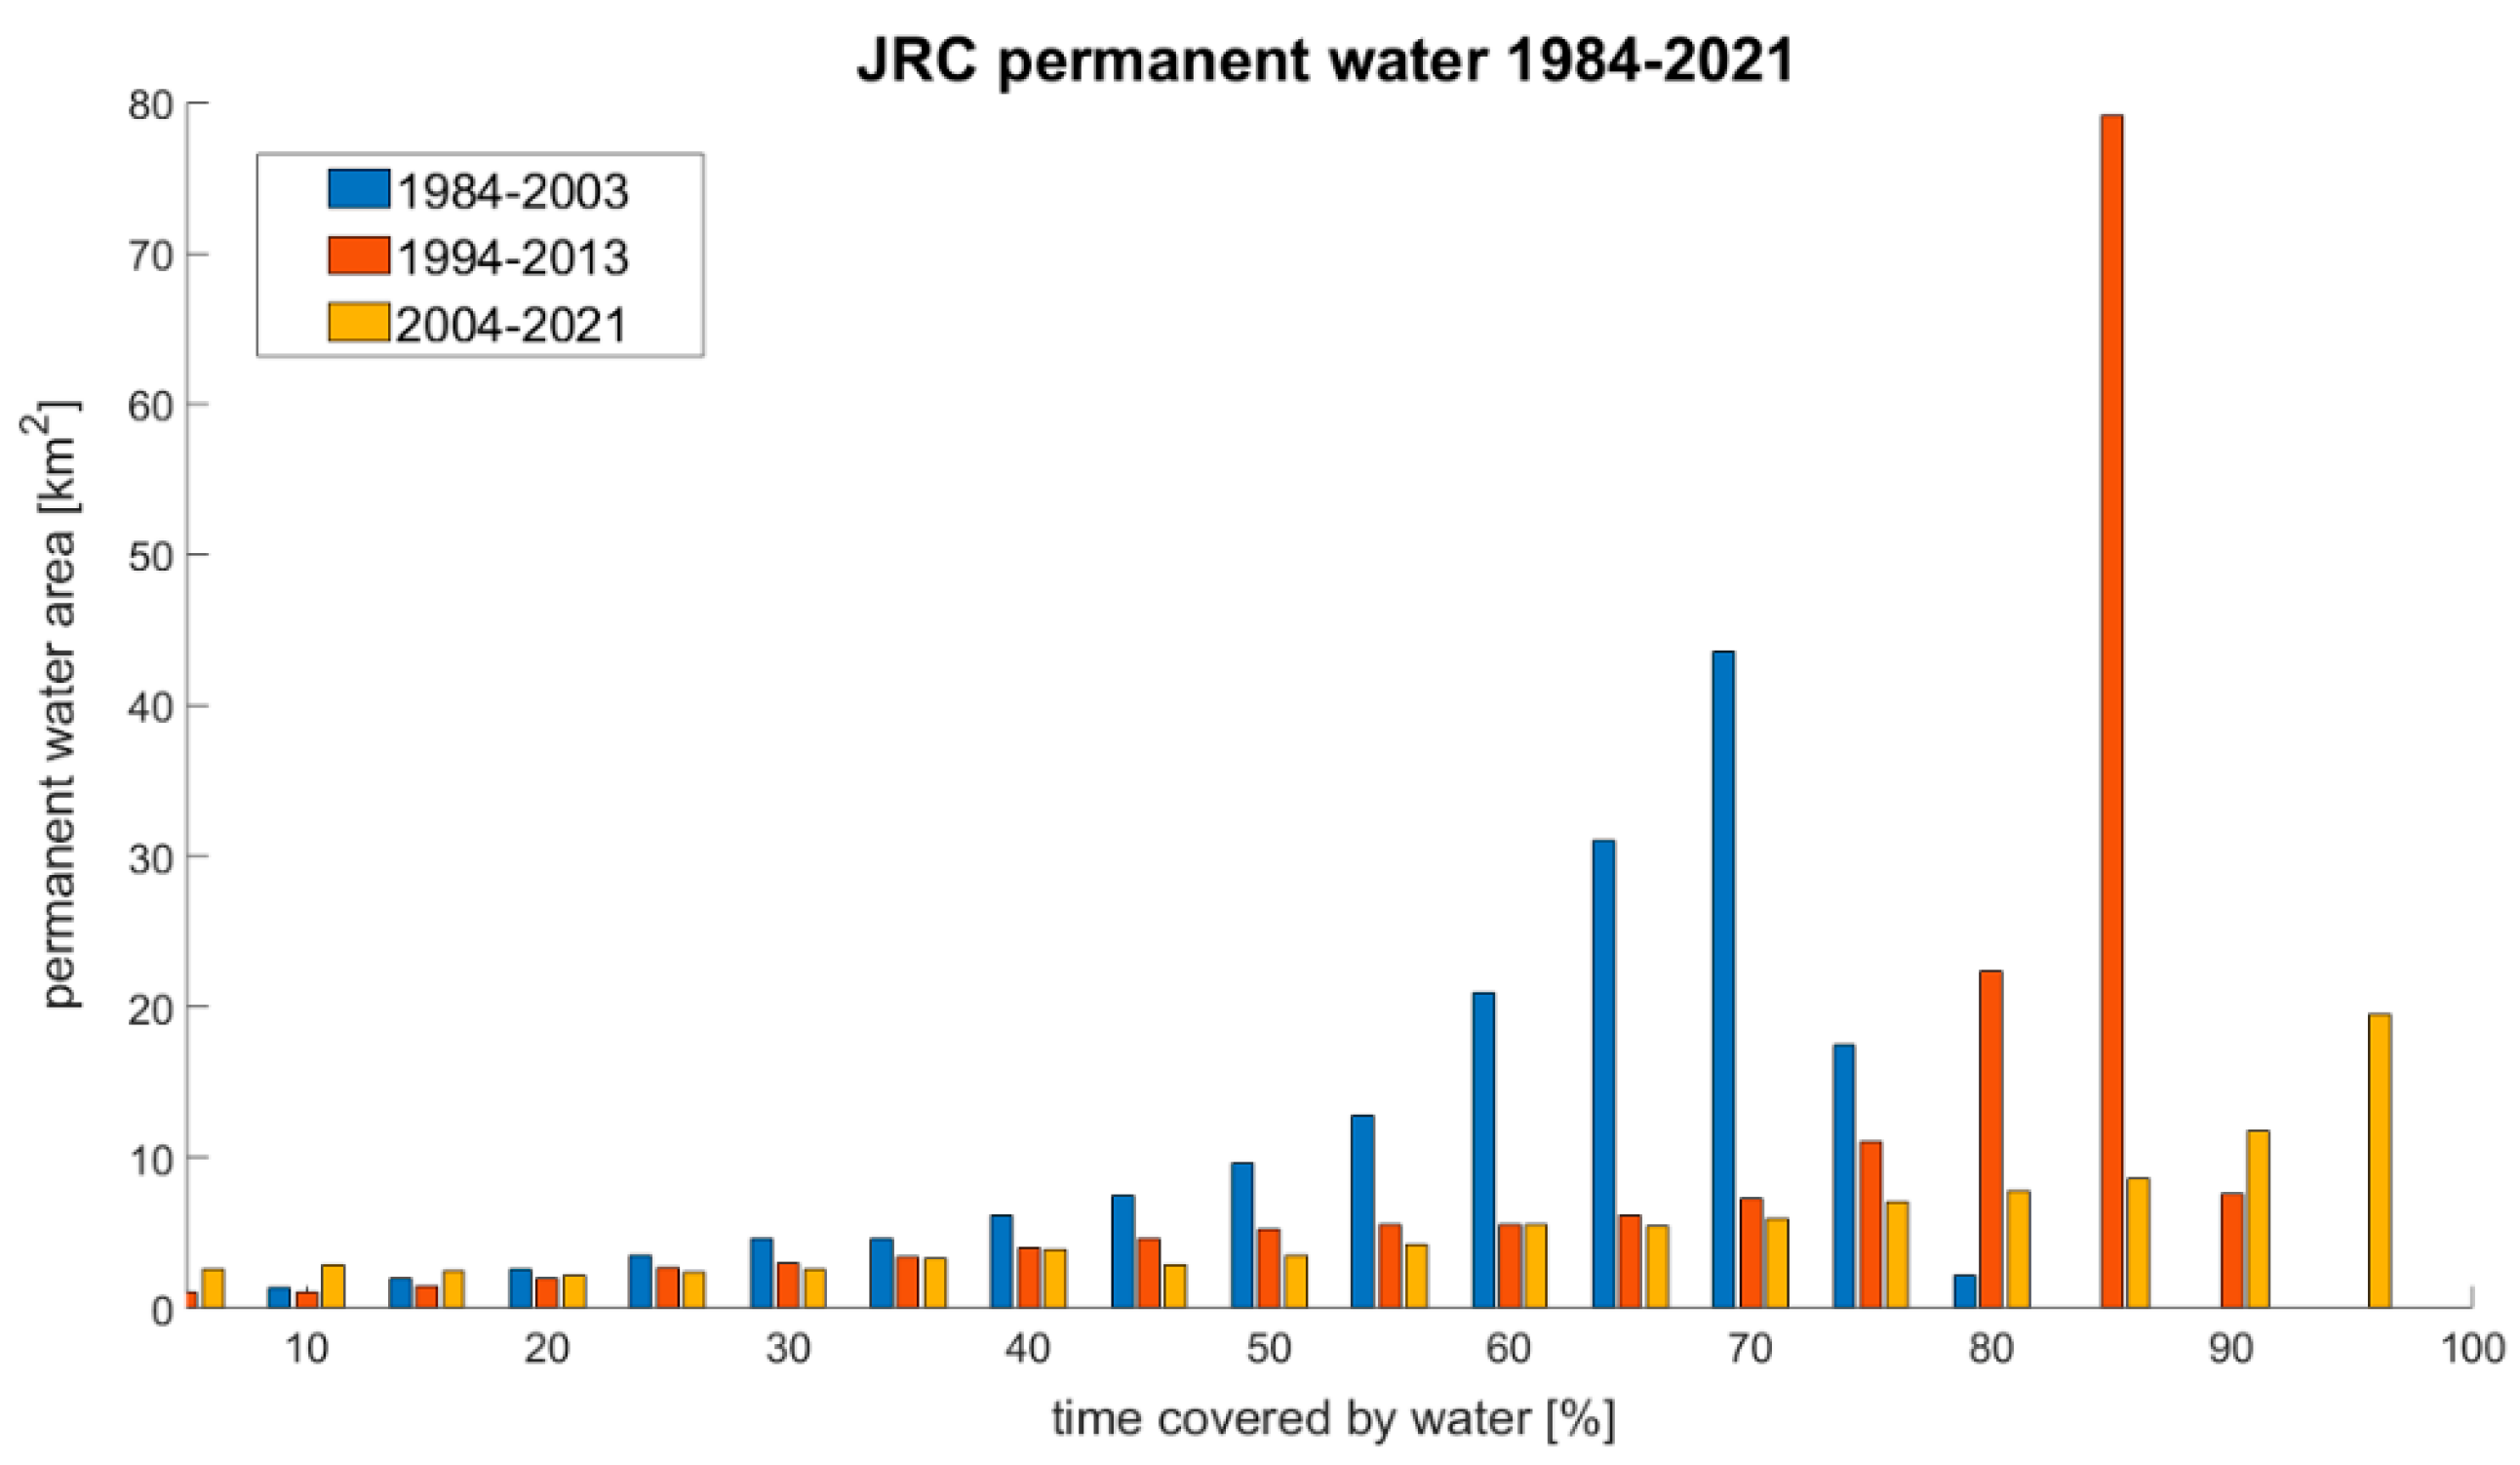
The analysis of permanent water along the study reach confirms the reduction of extreme vents during the last decades. Such information derives from the JRC Yearly Water Classification History, which is a dataset containing maps of the location and temporal distribution of surface water from 1984 to 2021, generated from Landsat 5, 7, and 8 acquired between 16 March 1984 and 31 December 2021 by classifying each pixel into water/non-water [71]. Figure 8 shows that early periods (1984-2003, blue bars) were characterized by the majority of pixels not always covered by water, meaning that water was flowing along multiple channels over time. The increment of areas covered by permanent water (i.e., higher bars towards 80-100% of coverage) depicted during the more recent decades implies that water nowadays flow in a rather constrained active channel. This shift of vegetation is mostly attributable to the growing of vegetation due to the reduction of flooding events, as described in the previous section and pointed out by similar investigations worldwide [34,43,72].
The findings of this study highlight the influence of climate change on the riparian vegetation growing along the Middle and Lower Vistula River. A long-term decrease in monthly maximum discharges creates conditions that favour vegetation colonization bars and banks. Over time, this establishment of riparian vegetation contributes to an oversimplification of the main channel, reinforcing a feedback loop between channel morphology and vegetation growth. Specifically, once vegetation becomes established, it promotes the trapping and accumulation of sediments as well as seeds that would otherwise be transported downstream, leading to recurring cycles of deposition and vegetation expansion in the same areas [43]. This type of vegetation–morphology interaction is not unique to the Vistula River. Similar processes have been documented in other major European river systems, where reduced hydrological variability and altered flood regimes facilitate the encroachment of vegetation into active channels [34,73]. Such transformations carry important implications for river management, as they may affect flood conveyance, water quality, biodiversity, and the overall resilience of riparian ecosystems.
Addressing these challenges requires innovative strategies that integrate ecological and geomorphological perspectives. In this regard, the approach proposed in the current study offers a preliminary but important step toward developing such strategies. By exploiting open-access data sources and freely available analytical tools, and by leveraging the broad spatial and temporal coverage provided by Landsat satellites, this investigation provides a cost-effective means of identifying long-term hydrological and vegetation dynamics. As such, it can serve as a valuable foundation for future management plans aimed at reconciling the ecological and societal needs of large river corridors under changing climatic conditions.
5. Conclusions
Leveraging satellite imagery and Google Earth Engine, the present study investigated the impact of changes in monthly maximum discharges on the riparian vegetation along a 250km reach of the Vistula River in Poland, considering the period 194-2023. The opportunity to utilize high-performance computational tools such as GEE allow for providing results at a large spatiotemporal scale, which is paramount to properly inform policymakers and water managers to develop adequate management strategies.
The analysis pointed out variations in the river hydrology during the observed period, with more humid years in the middle of such period, and a decrees of maximum monthly discharge during the last 20 years, likely connected with a more severe impact of climate change. Such reduction of water flow allow more time for vegetation to establish on river bars and banks, eventually creating new islands and causing an oversimplification of the active channel, a phenomena observable across many European piedmont rivers.
To corroborate the results presented here, as well as to depict plant-species dynamics, additional studies are needed, considering a combination of methods such as field investigations, numerical modelling and high-resolute imagery.
Author Contributions
Conceptualization, M.N; methodology, M.N.; formal analysis, M.N. and Y.G.; resources, M.N.; data curation, M.N.; writing, M.N. and Y.G.; supervision, M.N.; project administration, M.N.; funding acquisition, M.N. All authors have read and agreed to the published version of the manuscript.
Funding
This research was funded by the NCN National Science Centre Poland – call PRELUDIUM BIS-3, Grant Number 2021/43/O/ST10/00539. This work was partially supported by a subsidy from the Polish Ministry of Education and Science for the Institute of Geophysics Polish Academy of Sciences.
Data Availability Statement
Data are available within the article or could be asked to the corresponding author.
Conflicts of Interest
The authors declare no conflicts of interest.
References
- Leopold, L.B.; Maddock, T. The Hydraulic Geometry of Stream Channels and Some Physiographic Implications.; US Government Printing Office: Washington, DC, USA, 1953. [Google Scholar] [CrossRef]
- Yalin, M.S. (1992). River Mechanics. Oxford: Pergamon Press.
- Slater, L.J.; Khouakhi, A.; Wilby, R.L. River channel conveyance capacity adjusts to modes of climate variability. Sci. Rep. 2019, 9, 1–10. [Google Scholar] [CrossRef]
- Corenblit, D.; Tabacchi, E.; Steiger, J.; Gurnell, A.M. Reciprocal interactions and adjustments between fluvial landforms and vegetation dynamics in river corridors: A review of complementary approaches. Earth-Science Rev. 2007, 84, 56–86. [Google Scholar] [CrossRef]
- Gurnell, A.M.; Bertoldi, W.; Corenblit, D. Changing river channels: The roles of hydrological processes, plants and pioneer fluvial landforms in humid temperate, mixed load, gravel bed rivers. Earth-Science Rev. 2012, 111, 129–141. [Google Scholar] [CrossRef]
- Caponi, F.; Vetsch, D.F.; Vanzo, D. BASEveg: A python package to model riparian vegetation dynamics coupled with river morphodynamics. SoftwareX 2023, 22. [Google Scholar] [CrossRef]
- Di Baldassarre, G.; Kooy, M.; Kemerink, J.S.; Brandimarte, L. Towards understanding the dynamic behaviour of floodplains as human-water systems. Hydrol. Earth Syst. Sci. 2013, 17, 3235–3244. [Google Scholar] [CrossRef]
- Maaß, A.-L.; Schüttrumpf, H.; Lehmkuhl, F. Human impact on fluvial systems in Europe with special regard to today’s river restorations. Environ. Sci. Eur. 2021, 33, 1–13. [Google Scholar] [CrossRef]
- Balke, T.; Nilsson, C. Increasing Synchrony of Annual River-Flood Peaks and Growing Season in Europe. Geophys. Res. Lett. 2019, 46, 10446–10453. [Google Scholar] [CrossRef]
- Mahoney, J.M.; Rood, S.B. Streamflow requirements for cottonwood seedling recruitment—An integrative model. Wetlands 1998, 18, 634–645. [Google Scholar] [CrossRef]
- Balke, T.; Herman, P.M.J.; Bouma, T.J. Critical transitions in disturbance-driven ecosystems: identifying Windows of Opportunity for recovery. J. Ecol. 2014, 102, 700–708. [Google Scholar] [CrossRef]
- Gui, H.; Hou, L.; Wang, J.; Dong, X.; Han, S. Flood changed the community composition and increased the importance of stochastic process of vegetation and seed bank in a riparian ecosystem of the Yellow River. Ecol. Indic. 2023, 154. [Google Scholar] [CrossRef]
- Nones, M. Satellite-Based Monitoring of Drought at the Watershed Scale. In Advances in Hydraulic Research, GeoPlanet: Earth and Planetary Sciences: 281-291. Eds Springer Nature Switzerland. 2023. [CrossRef]
- Islam, S.M.S.; Yeşilköy, S.; Baydaroğlu, Ö.; Yıldırım, E.; Demir, I. State-level multidimensional agricultural drought susceptibility and risk assessment for agriculturally prominent areas. Int. J. River Basin Manag. 2024, 23, 337–354. [Google Scholar] [CrossRef]
- Kartal, V.; Nones, M. Assessment of meteorological, hydrological and groundwater drought in the Konya closed basin, Türkiye. Environ. Earth Sci. 2024, 83, 1–27. [Google Scholar] [CrossRef]
- Briffa, K.R.; Jones, P.D.; Hulme, M. Summer moisture variability across Europe, 1892–1991: An analysis based on the palmer drought severity index. Int. J. Clim. 1994, 14, 475–506. [Google Scholar] [CrossRef]
- Poljansek, K.; Marín Ferrer, M.; De Groeve, T.; Clarck, I. (2017). Science for disaster risk management 2017: knowing better and losing less. Eds. ETH Zürich, Switzerland.
- Spinoni, J.; Naumann, G.; Vogt, J.V. Pan-European seasonal trends and recent changes of drought frequency and severity. Glob. Planet. Chang. 2017, 148, 113–130. [Google Scholar] [CrossRef]
- Somorowska, U. Changes in Drought Conditions in Poland over the Past 60 Years Evaluated by the Standardized Precipitation-Evapotranspiration Index. Acta Geophys. 2016, 64, 2530–2549. [Google Scholar] [CrossRef]
- Pińskwar, I.; Choryński, A.; Kundzewicz, Z.W. Severe Drought in the Spring of 2020 in Poland—More of the Same? Agronomy 2020, 10, 1646. [Google Scholar] [CrossRef]
- Karamuz, E.; Bogdanowicz, E.; Senbeta, T.B.; Napiórkowski, J.J.; Romanowicz, R.J. Is It a Drought or Only a Fluctuation in Precipitation Patterns?—Drought Reconnaissance in Poland. Water 2021, 13, 807. [Google Scholar] [CrossRef]
- Raczyński, K.; Dyer, J. Changes in streamflow drought and flood distribution over Poland using trend decomposition. Acta Geophys. 2023, 72, 2773–2794. [Google Scholar] [CrossRef]
- Gilvear, D. J. , Bryant, R., & Hardy, T. (1999). Remote sensing of channel morphology and in-stream fluvial processes. Progress in Environmental Science, 1, 257-284.
- Nones, M. Remote sensing and GIS techniques to monitor morphological changes along the middle-lower Vistula river, Poland. Int. J. River Basin Manag. 2020, 19, 345–357. [Google Scholar] [CrossRef]
- Harvey, J.; Gooseff, M. River corridor science: Hydrologic exchange and ecological consequences from bedforms to basins. Water Resour. Res. 2015, 51, 6893–6922. [Google Scholar] [CrossRef]
- Henshaw, A.J.; Gurnell, A.M.; Bertoldi, W.; Drake, N.A. An assessment of the degree to which Landsat TM data can support the assessment of fluvial dynamics, as revealed by changes in vegetation extent and channel position, along a large river. Geomorphology 2013, 202, 74–85. [Google Scholar] [CrossRef]
- Wulder, M.A.; Skakun, R.S.; Kurz, W.A.; White, J.C. Estimating time since forest harvest using segmented Landsat ETM+ imagery. Remote. Sens. Environ. 2004, 93, 179–187. [Google Scholar] [CrossRef]
- Halder, A.; Chowdhury, R.M. Evaluation of the river Padma morphological transition in the central Bangladesh using GIS and remote sensing techniques. Int. J. River Basin Manag. 2021, 21, 21–35. [Google Scholar] [CrossRef]
- Hasan, I.; Dey, J.; Munna, M.R.; Preya, A.; Nisanur, T.B.; Memy, M.J.; Zeba, M.Z.S. Morphological changes of river Bank Erosion and channel shifting assessment on Arial Khan River of Bangladesh using Landsat satellite time series images. Prog. Disaster Sci. 2024, 24. [Google Scholar] [CrossRef]
- Xie, Z.; Phinn, S.R.; Game, E.T.; Pannell, D.J.; Hobbs, R.J.; Briggs, P.R.; McDonald-Madden, E. Using Landsat observations (1988–2017) and Google Earth Engine to detect vegetation cover changes in rangelands - A first step towards identifying degraded lands for conservation. Remote. Sens. Environ. 2019, 232. [Google Scholar] [CrossRef]
- Andreatta, D.; Gianelle, D.; Scotton, M.; Dalponte, M. Estimating grassland vegetation cover with remote sensing: A comparison between Landsat-8, Sentinel-2 and PlanetScope imagery. Ecol. Indic. 2022, 141. [Google Scholar] [CrossRef]
- Pereyra, F.; Walker, E.; Frau, D.; Gutierrez, M.F. (2024). Temporal and spatial patterns of riparian vegetation in the Colastiné Basin (Argentina) and riparian ecological quality estimation as toohttps://doi.org/10.1080/15715124.2024.2414202ls for water management. International Journal of River Basin Management, 1-10. [CrossRef]
- Gorelick, N.; Hancher, M.; Dixon, M.; Ilyushchenko, S.; Thau, D.; Moore, R. Google Earth Engine: Planetary-scale geospatial analysis for everyone. Remote Sens. Environ. 2017, 202, 18–27. [Google Scholar] [CrossRef]
- Nones, M.; Guerrero, M.; Schippa, L.; Cavalieri, I. Remote sensing assessment of anthropogenic and climate variation effects on river channel morphology and vegetation: Impact of dry periods on a European piedmont river. Earth Surf. Process. Landforms 2024, 49, 1632–1652. [Google Scholar] [CrossRef]
- Tamiminia, H.; Salehi, B.; Mahdianpari, M.; Quackenbush, L.; Adeli, S.; Brisco, B. Google Earth Engine for geo-big data applications: A meta-analysis and systematic review. ISPRS J. Photogramm. Remote. Sens. 2020, 164, 152–170. [Google Scholar] [CrossRef]
- Pérez-Cutillas, P.; Pérez-Navarro, A.; Conesa-García, C.; Zema, D.A.; Amado-Álvarez, J.P. What is going on within google earth engine? A systematic review and meta-analysis. Remote. Sens. Appl. Soc. Environ. 2022, 29. [Google Scholar] [CrossRef]
- Chen, Y.; Mossa, J.; Singh, K.K. Floodplain characteristics affect woody vegetation regeneration on point bars of a coastal plain river recovering from anthropogenic disturbances. Ecohydrology 2022, 16. [Google Scholar] [CrossRef]
- Rivaes, R.; Rodríguez-González, P.M.; Albuquerque, A.; Pinheiro, A.N.; Egger, G.; Ferreira, M.T. Riparian vegetation responses to altered flow regimes driven by climate change in Mediterranean rivers. Ecohydrology 2012, 6, 413–424. [Google Scholar] [CrossRef]
- Yang, Y.; Wang, Y.; Cong, N.; Wang, N.; Yao, W. Impacts of the Three Gorges Dam on riparian vegetation in the Yangtze River Basin under climate change. Sci. Total. Environ. 2023, 912, 169415. [Google Scholar] [CrossRef] [PubMed]
- Naiman, R.J.; Décamps, H. The Ecology of Interfaces: Riparian Zones. Annu. Rev. Ecol. Syst. 1997, 28, 621–658. [Google Scholar] [CrossRef]
- Steiger, J.; Tabacchi, E.; Dufour, S.; Corenblit, D.; Peiry, J. Hydrogeomorphic processes affecting riparian habitat within alluvial channel–floodplain river systems: a review for the temperate zone. River Res. Appl. 2005, 21, 719–737. [Google Scholar] [CrossRef]
- Nones, M.; Di Silvio, G. Modeling of River Width Variations Based on Hydrological, Morphological, and Biological Dynamics. J. Hydraul. Eng. 2016, 142. [Google Scholar] [CrossRef]
- Wierzbicki, G.; Sudra, P.; Lewicki, T.; Pawłowski, K.; Jóźwiak, J.; Chormański, J. Dry Means Green—Using ALS LiDAR DEM to Determine the Geomorphological Reaction of a Large, Untrained, European River to Summer Drought (the Vistula River, Warsaw, Poland). IEEE J. Sel. Top. Appl. Earth Obs. Remote. Sens. 2024, 18, 2157–2167. [Google Scholar] [CrossRef]
- Rouse, J.W., Jr. Monitoring the Vernal Advancement and Retrogradation (Green Wave Effect) of Natural Vegetation; Texas A&M University: College Station, TX, USA, 1973; p. 120. [Google Scholar]
- Chu, H.; Venevsky, S.; Wu, C.; Wang, M. NDVI-based vegetation dynamics and its response to climate changes at Amur-Heilongjiang River Basin from 1982 to 2015. Sci. Total. Environ. 2019, 650, 2051–2062. [Google Scholar] [CrossRef]
- Majewski, W. General characteristics of the Vistula and its basin. Acta Energetica Power Eng. Q. 2013, 2, 6–15. [Google Scholar] [CrossRef]
- Karamuz, E.; Romanowicz, R.J. Temperature Changes and Their Impact on Drought Conditions in Winter and Spring in the Vistula Basin. Water 2021, 13, 1973. [Google Scholar] [CrossRef]
- Starkel, L. Reflection of the glacial-interglacial cycle in the evolution of the Vistula river Basin, Poland. Terra Nova 1994, 6, 486–494. [Google Scholar] [CrossRef]
- Webb, B.W.; Petts, G.E.; Moller, H.; Roux, A.L. Historical Change of Large Alluvial Rivers: Western Europe. Geogr. J. 1990, 156, 91. [Google Scholar] [CrossRef]
- ajczak, A.; Plit, J.; Soja, R.; Starkel, L.; Warowna, J. (2006). Changes of the Vistula River Channel and Foodplain in the Last 200 Years. Geographia Polonica, 79(2), 65–87.
- Babiński, Z. Hydromorphological consequences of regulating the lower vistula, Poland. Regul. Rivers: Res. Manag. 1992, 7, 337–348. [Google Scholar] [CrossRef]
- Habel, M. Effects of flow regulation and river channelization on sandbar bird nesting availability at the Lower Vistula River. Ecol. Quest. 2018, 29, 1–18. [Google Scholar] [CrossRef]
- Lisimenka, A.; Kubicki, A. Bedload transport in the Vistula River mouth derived from dune migration rates, southern Baltic Sea. Oceanologia 2019, 61, 384–394. [Google Scholar] [CrossRef]
- Wozniak, M.; Leuven, R.S.; Lenders, H.R.; Chmielewski, T.J.; Geerling, G.W.; Smits, A.J. Assessing landscape change and biodiversity values of the Middle Vistula river valley, Poland, using BIO-SAFE. Landsc. Urban Plan. 2009, 92, 210–219. [Google Scholar] [CrossRef]
- Drusch, M.; Del Bello, U.; Carlier, S.; Colin, O.; Fernandez, V.; Gascon, F.; Hoersch, B.; Isola, C.; Laberinti, P.; Martimort, P.; et al. Sentinel-2: ESA's Optical High-Resolution Mission for GMES Operational Services. Remote Sens. Environ. 2012, 120, 25–36. [Google Scholar] [CrossRef]
- Foga, S.; Scaramuzza, P.L.; Guo, S.; Zhu, Z.; Dilley, R.D.; Beckmann, T.; Schmidt, G.L.; Dwyer, J.L.; Hughes, M.J.; Laue, B. Cloud detection algorithm comparison and validation for operational Landsat data products. Remote Sens. Environ. 2017, 194, 379–390. [Google Scholar] [CrossRef]
- Boothroyd, R.J.; Nones, M.; Guerrero, M. Deriving Planform Morphology and Vegetation Coverage From Remote Sensing to Support River Management Applications. Front. Environ. Sci. 2021, 9. [Google Scholar] [CrossRef]
- Džubáková, K.; Molnar, P.; Schindler, K.; Trizna, M. Monitoring of riparian vegetation response to flood disturbances using terrestrial photography. Hydrol. Earth Syst. Sci. 2015, 19, 195–208. [Google Scholar] [CrossRef]
- O'CAllaghan, M.; del Hoyo, J.G.; Finch, B.D.; Ruiz-Villanueva, V. Grow With the Flow? Impact of Experimental Floods on Riparian Vegetation in an Alpine River. River Res. Appl. 2025. [Google Scholar] [CrossRef]
- Przybylak, R.; Oliński, P.; Koprowski, M.; Filipiak, J.; Pospieszyńska, A.; Chorążyczewski, W.; Puchałka, R.; Dąbrowski, H.P. Droughts in the area of Poland in recent centuries in the light of multi-proxy data. Clim. Past 2020, 16, 627–661. [Google Scholar] [CrossRef]
- Krasiewicz, D.W.; Wierzbicki, G. Flood Perception from Local Perspective of Rural Community vs. Geomorphological Control of Fluvial Processes in Large Alluvial Valley (the Middle Vistula River, Poland). Hydrology 2023, 10, 191. [Google Scholar] [CrossRef]
- Wintenberger, C.L.; Rodrigues, S.; Greulich, S.; Bréhéret, J.G.; Jugé, P.; Tal, M.; Dubois, A.; Villar, M. Control of Non-migrating Bar Morphodynamics on Survival of Populus nigra Seedlings during Floods. Wetlands 2019, 39, 275–290. [Google Scholar] [CrossRef]
- Ivanov, V.Y.; Bras, R.L.; Vivoni, E.R. Vegetation-hydrology dynamics in complex terrain of semiarid areas: 1. A mechanistic approach to modeling dynamic feedbacks. Water Resour. Res. 2008, 44. [Google Scholar] [CrossRef]
- Acharya, B.S.; Bhandari, M.; Bandini, F.; Pizarro, A.; Perks, M.; Joshi, D.R.; Wang, S.; Dogwiler, T.; Ray, R.L.; Kharel, G.; et al. Unmanned Aerial Vehicles in Hydrology and Water Management: Applications, Challenges, and Perspectives. Water Resour. Res. 2021, 57. [Google Scholar] [CrossRef]
- Borgogno-Mondino, E.; Lessio, A.; Gomarasca, M.A. A fast operative method for NDVI uncertainty estimation and its role in vegetation analysis. Eur. J. Remote. Sens. 2016, 49, 137–156. [Google Scholar] [CrossRef]
- Huete, A.; Didan, K.; Miura, T.; Rodriguez, E.P.; Gao, X.; Ferreira, L.G. Overview of the radiometric and biophysical performance of the MODIS vegetation indices. Remote Sens. Environ. 2002, 83, 195–213. [Google Scholar] [CrossRef]
- Glenn, E.P.; Huete, A.R.; Nagler, P.L.; Nelson, S.G. Relationship Between Remotely-sensed Vegetation Indices, Canopy Attributes and Plant Physiological Processes: What Vegetation Indices Can and Cannot Tell Us About the Landscape. Sensors 2008, 8, 2136–2160. [Google Scholar] [CrossRef]
- Bozzolan, E.; Brenna, A.; Surian, N.; Carbonneau, P.; Bizzi, S. Quantifying the Impact of Spatiotemporal Resolution on the Interpretation of Fluvial Geomorphic Feature Dynamics From Sentinel 2 Imagery: An Application on a Braided River Reach in Northern Italy. Water Resour. Res. 2023, 59. [Google Scholar] [CrossRef]
- Zhao, X.; Xia, H.; Pan, L.; Song, H.; Niu, W.; Wang, R.; Li, R.; Bian, X.; Guo, Y.; Qin, Y. Drought Monitoring over Yellow River Basin from 2003–2019 Using Reconstructed MODIS Land Surface Temperature in Google Earth Engine. Remote. Sens. 2021, 13, 3748. [Google Scholar] [CrossRef]
- Yu, H.; Yang, Q.; Jiang, S.; Zhan, B.; Zhan, C. Detection and Attribution of Vegetation Dynamics in the Yellow River Basin Based on Long-Term Kernel NDVI Data. Remote. Sens. 2024, 16, 1280. [Google Scholar] [CrossRef]
- Pekel, J.-F.; Cottam, A.; Gorelick, N.; Belward, A.S. High-resolution mapping of global surface water and its long-term changes. Nature 2016, 540, 418–422. [Google Scholar] [CrossRef]
- Johansson, M.E.; Nilsson, C. Responses of riparian plants to flooding in free-flowing and regulated boreal rivers: an experimental study. J. Appl. Ecol. 2002, 39, 971–986. [Google Scholar] [CrossRef]
- Miller, K.A.; Webb, J.A.; de Little, S.C.; Stewardson, M.J. Environmental Flows Can Reduce the Encroachment of Terrestrial Vegetation into River Channels: A Systematic Literature Review. Environ. Manag. 2013, 52, 1202–1212. [Google Scholar] [CrossRef]
Figure 1.
a) Vistula River basin and sub-basins. b) Study reach between Dęblin and Płock.
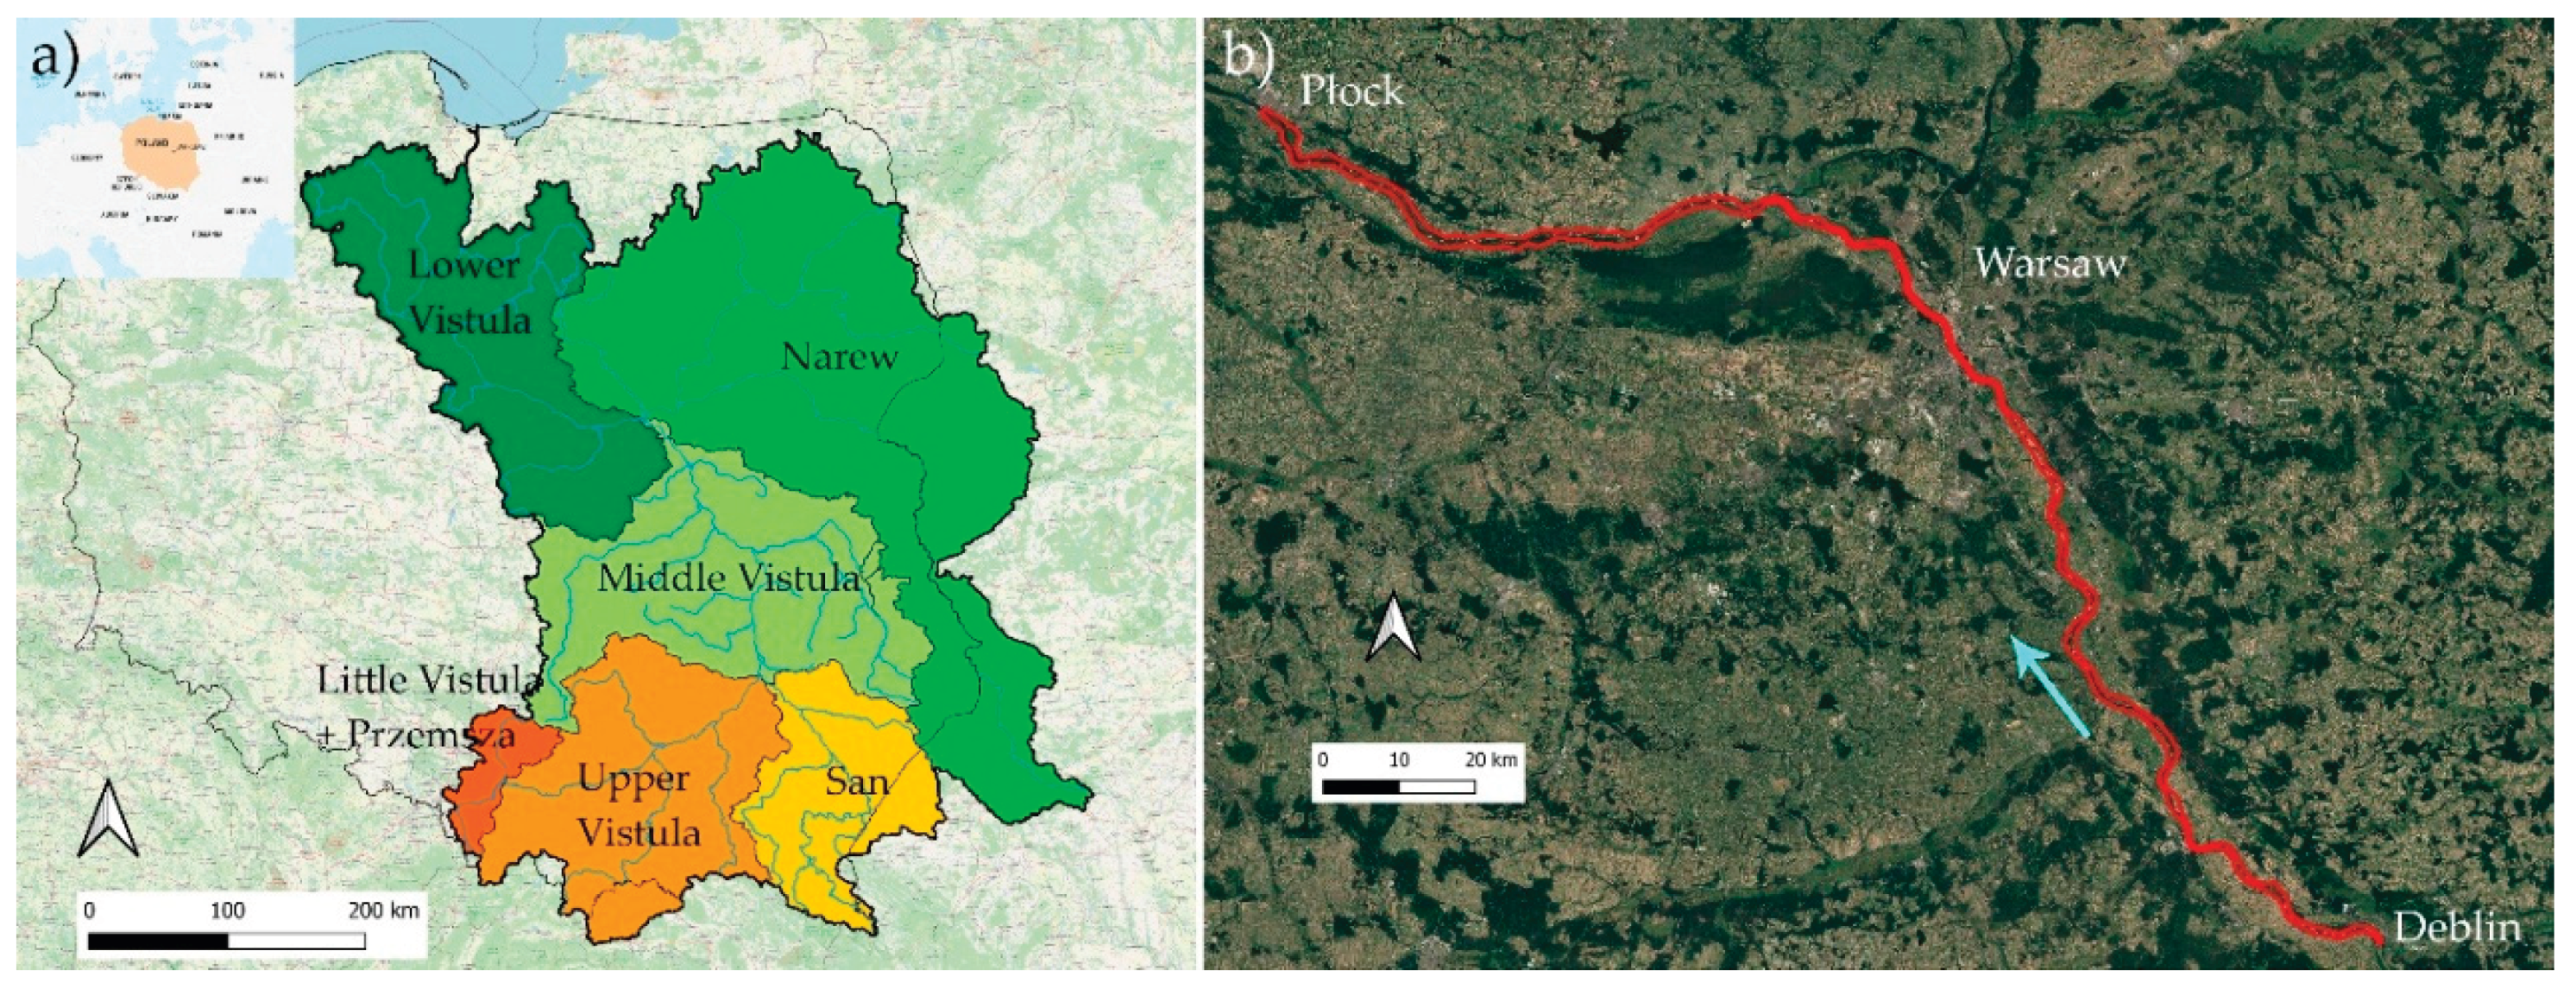
Figure 2.
Monthly discharges measured at Dęblin during the period 1984-2023.
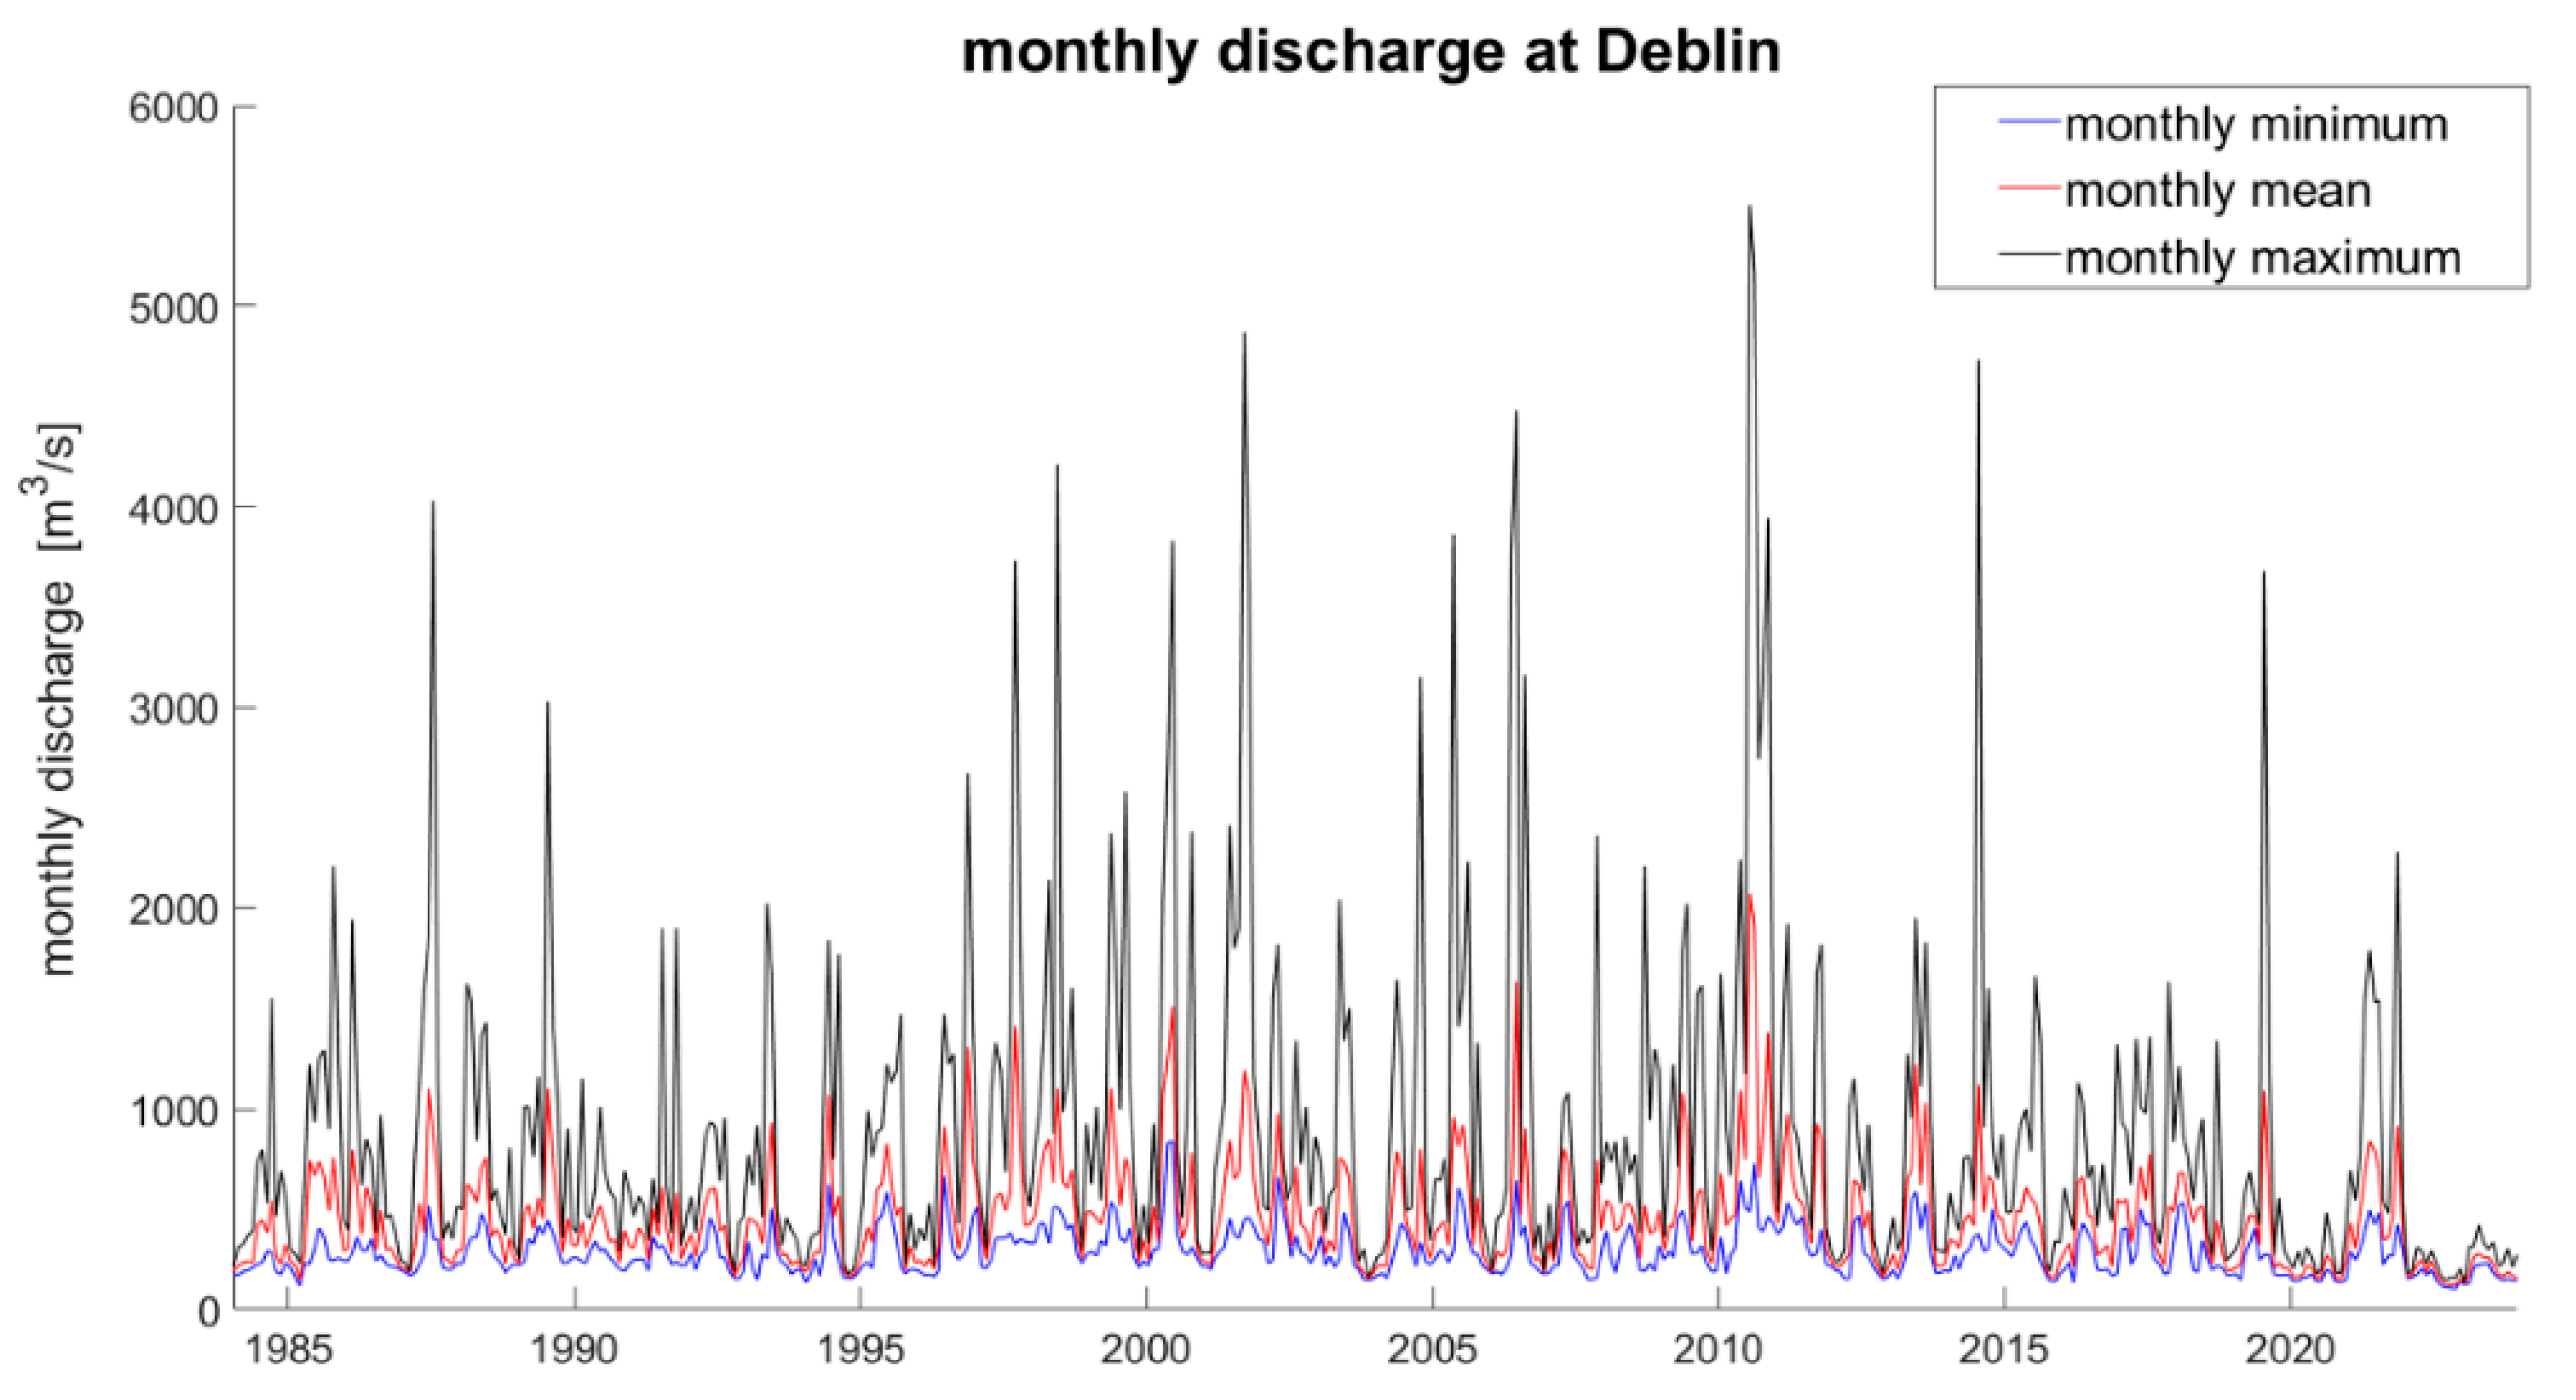
Figure 3.
Monthly maximum discharges measured at Dęblin during the period 1984-2023, with 5-year moving average.
Figure 3.
Monthly maximum discharges measured at Dęblin during the period 1984-2023, with 5-year moving average.
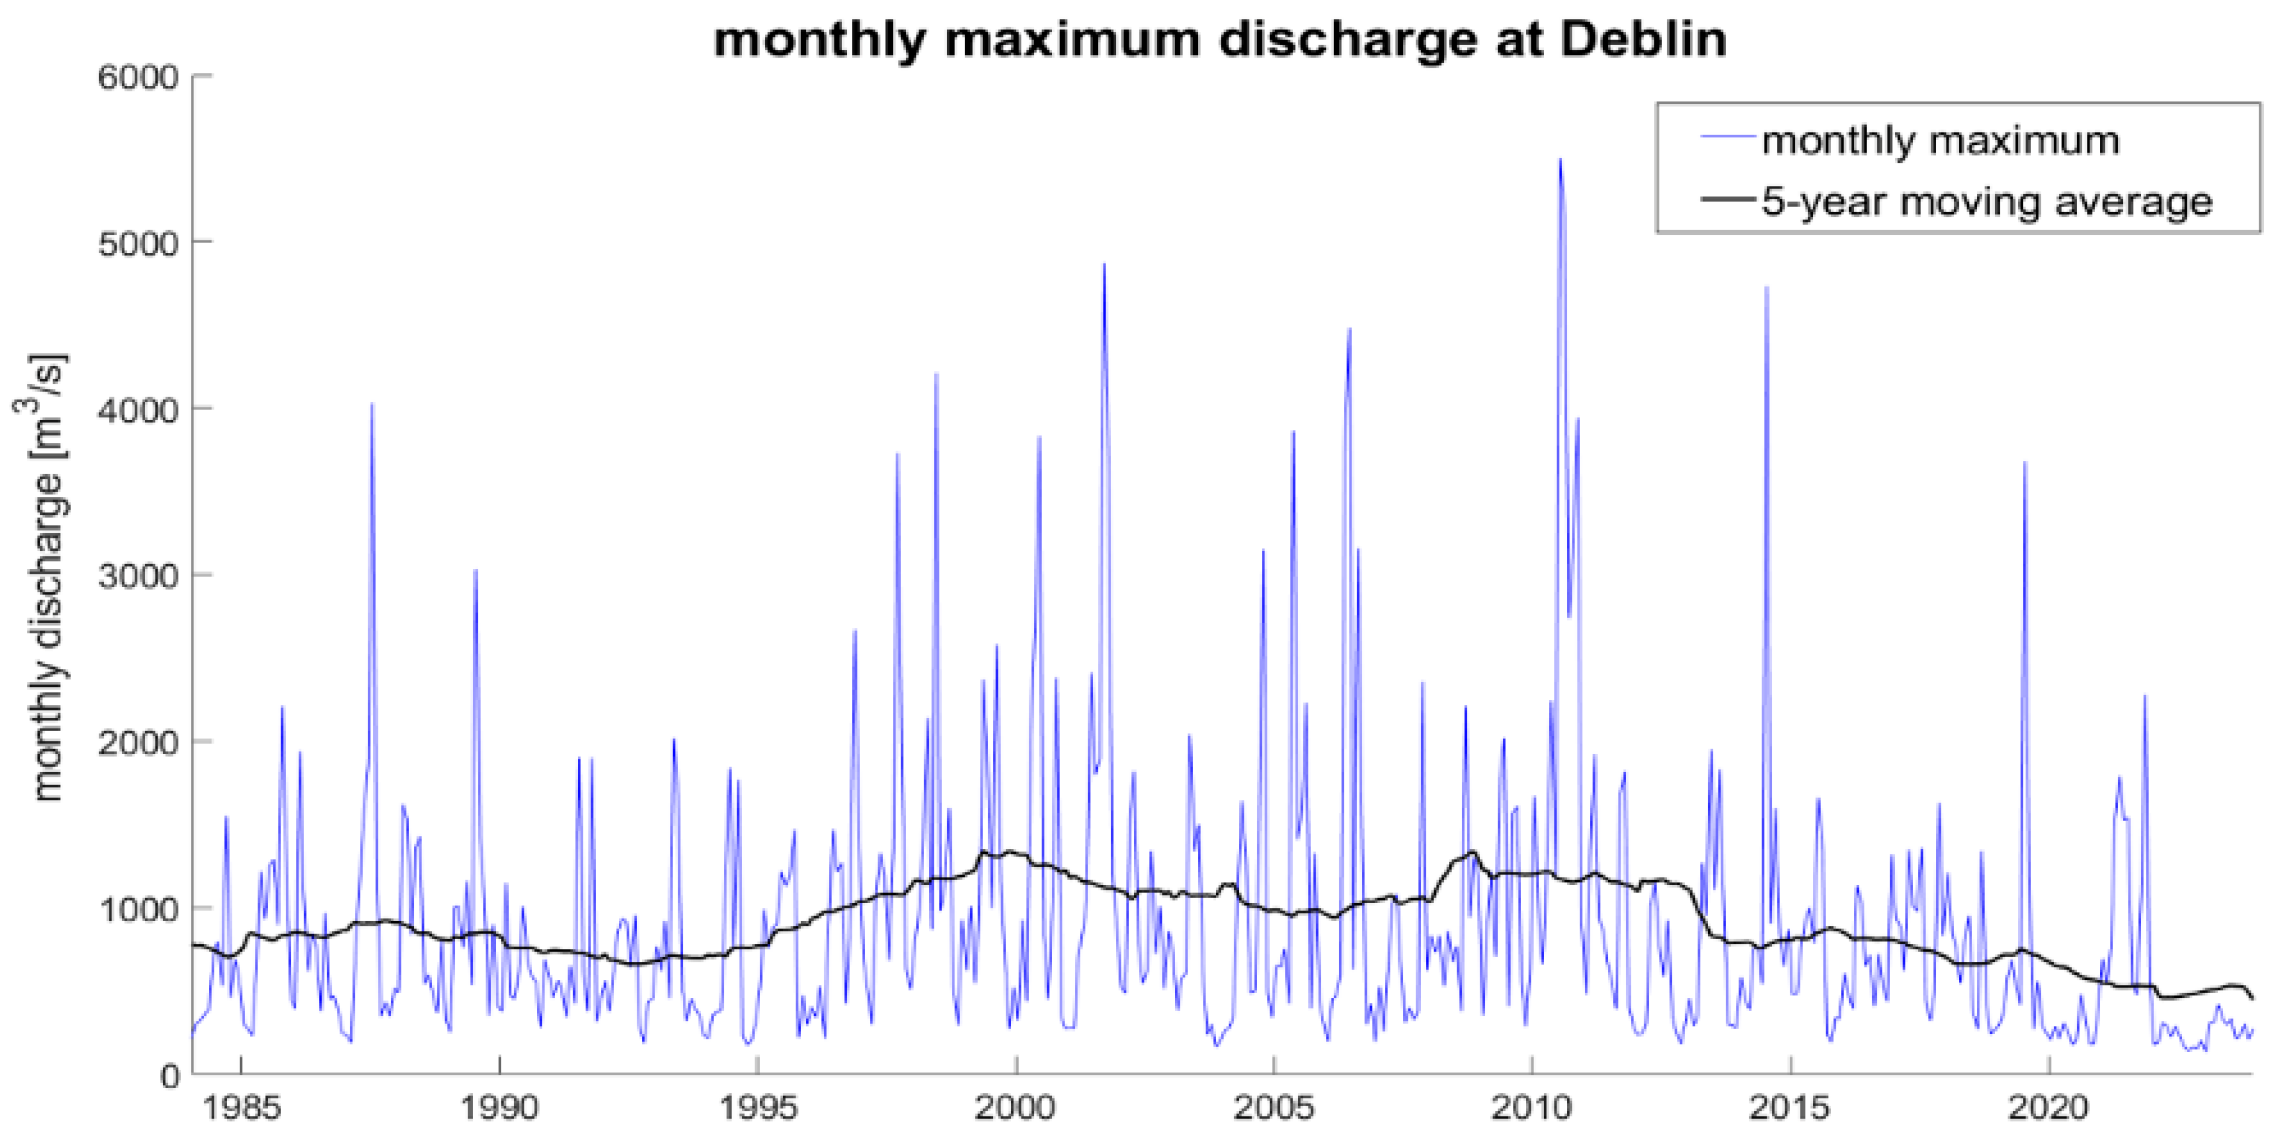
Figure 4.
Monthly maximum discharges measured at Dęblin during the period 1984-2023, with 20-year average over the periods 1984-2003, 1994-2013, 2004-2023.
Figure 4.
Monthly maximum discharges measured at Dęblin during the period 1984-2023, with 20-year average over the periods 1984-2003, 1994-2013, 2004-2023.
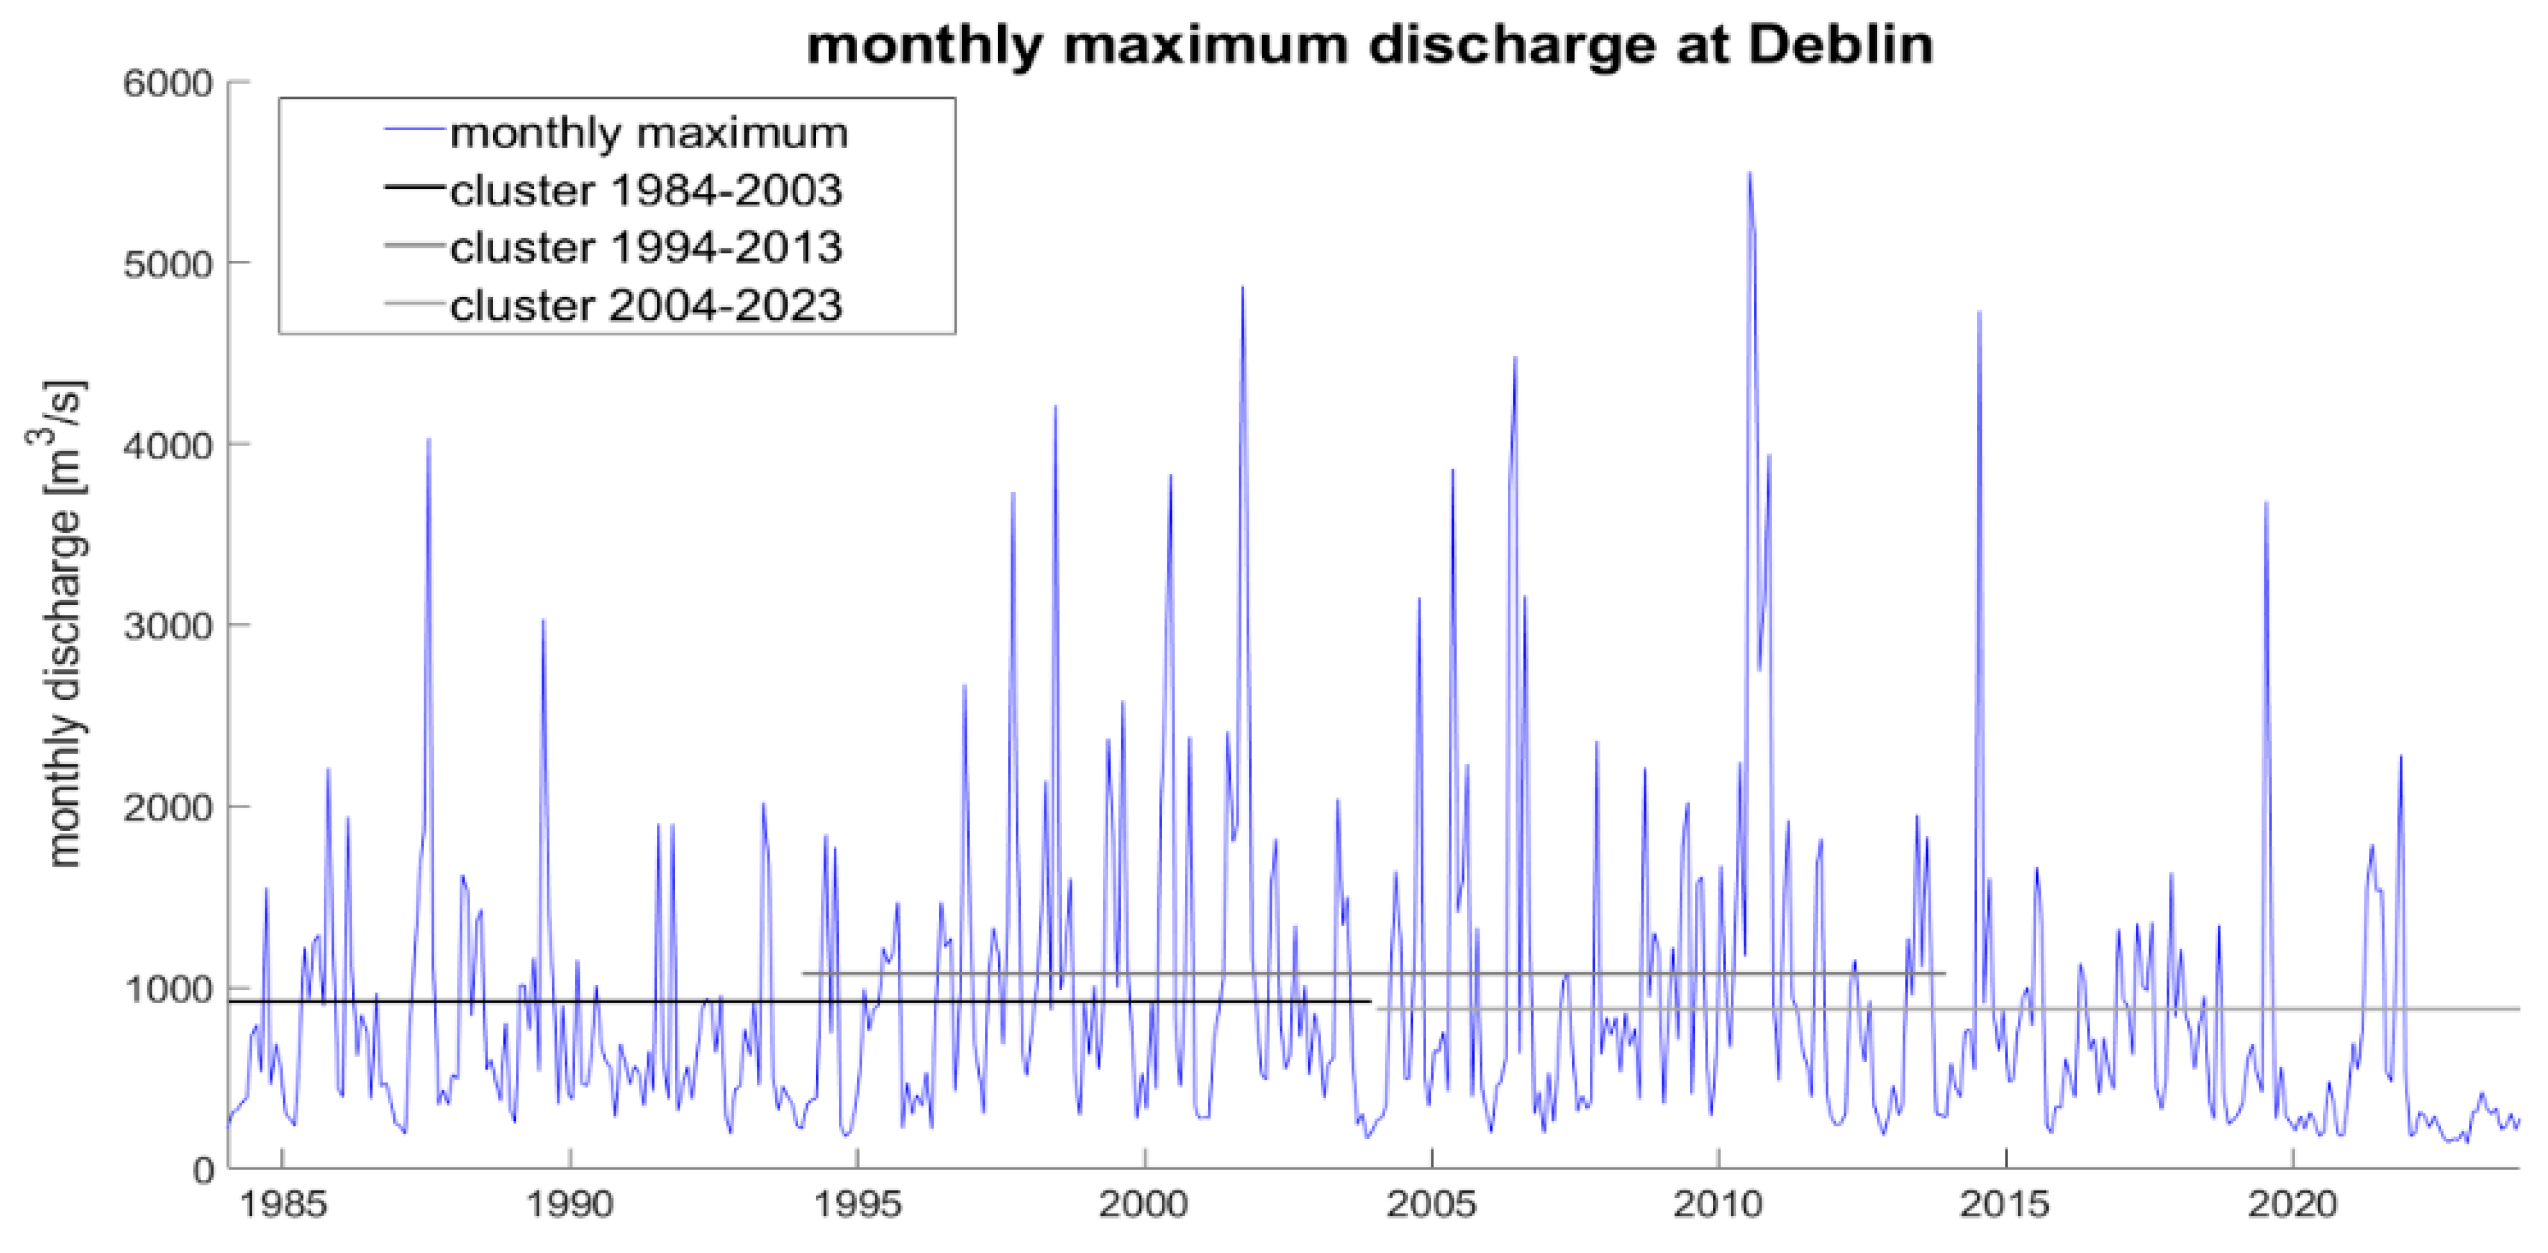
Figure 5.
Variation of NDVI over the periods 1984-2003, considering median values and 25th and 75th percentiles.
Figure 5.
Variation of NDVI over the periods 1984-2003, considering median values and 25th and 75th percentiles.
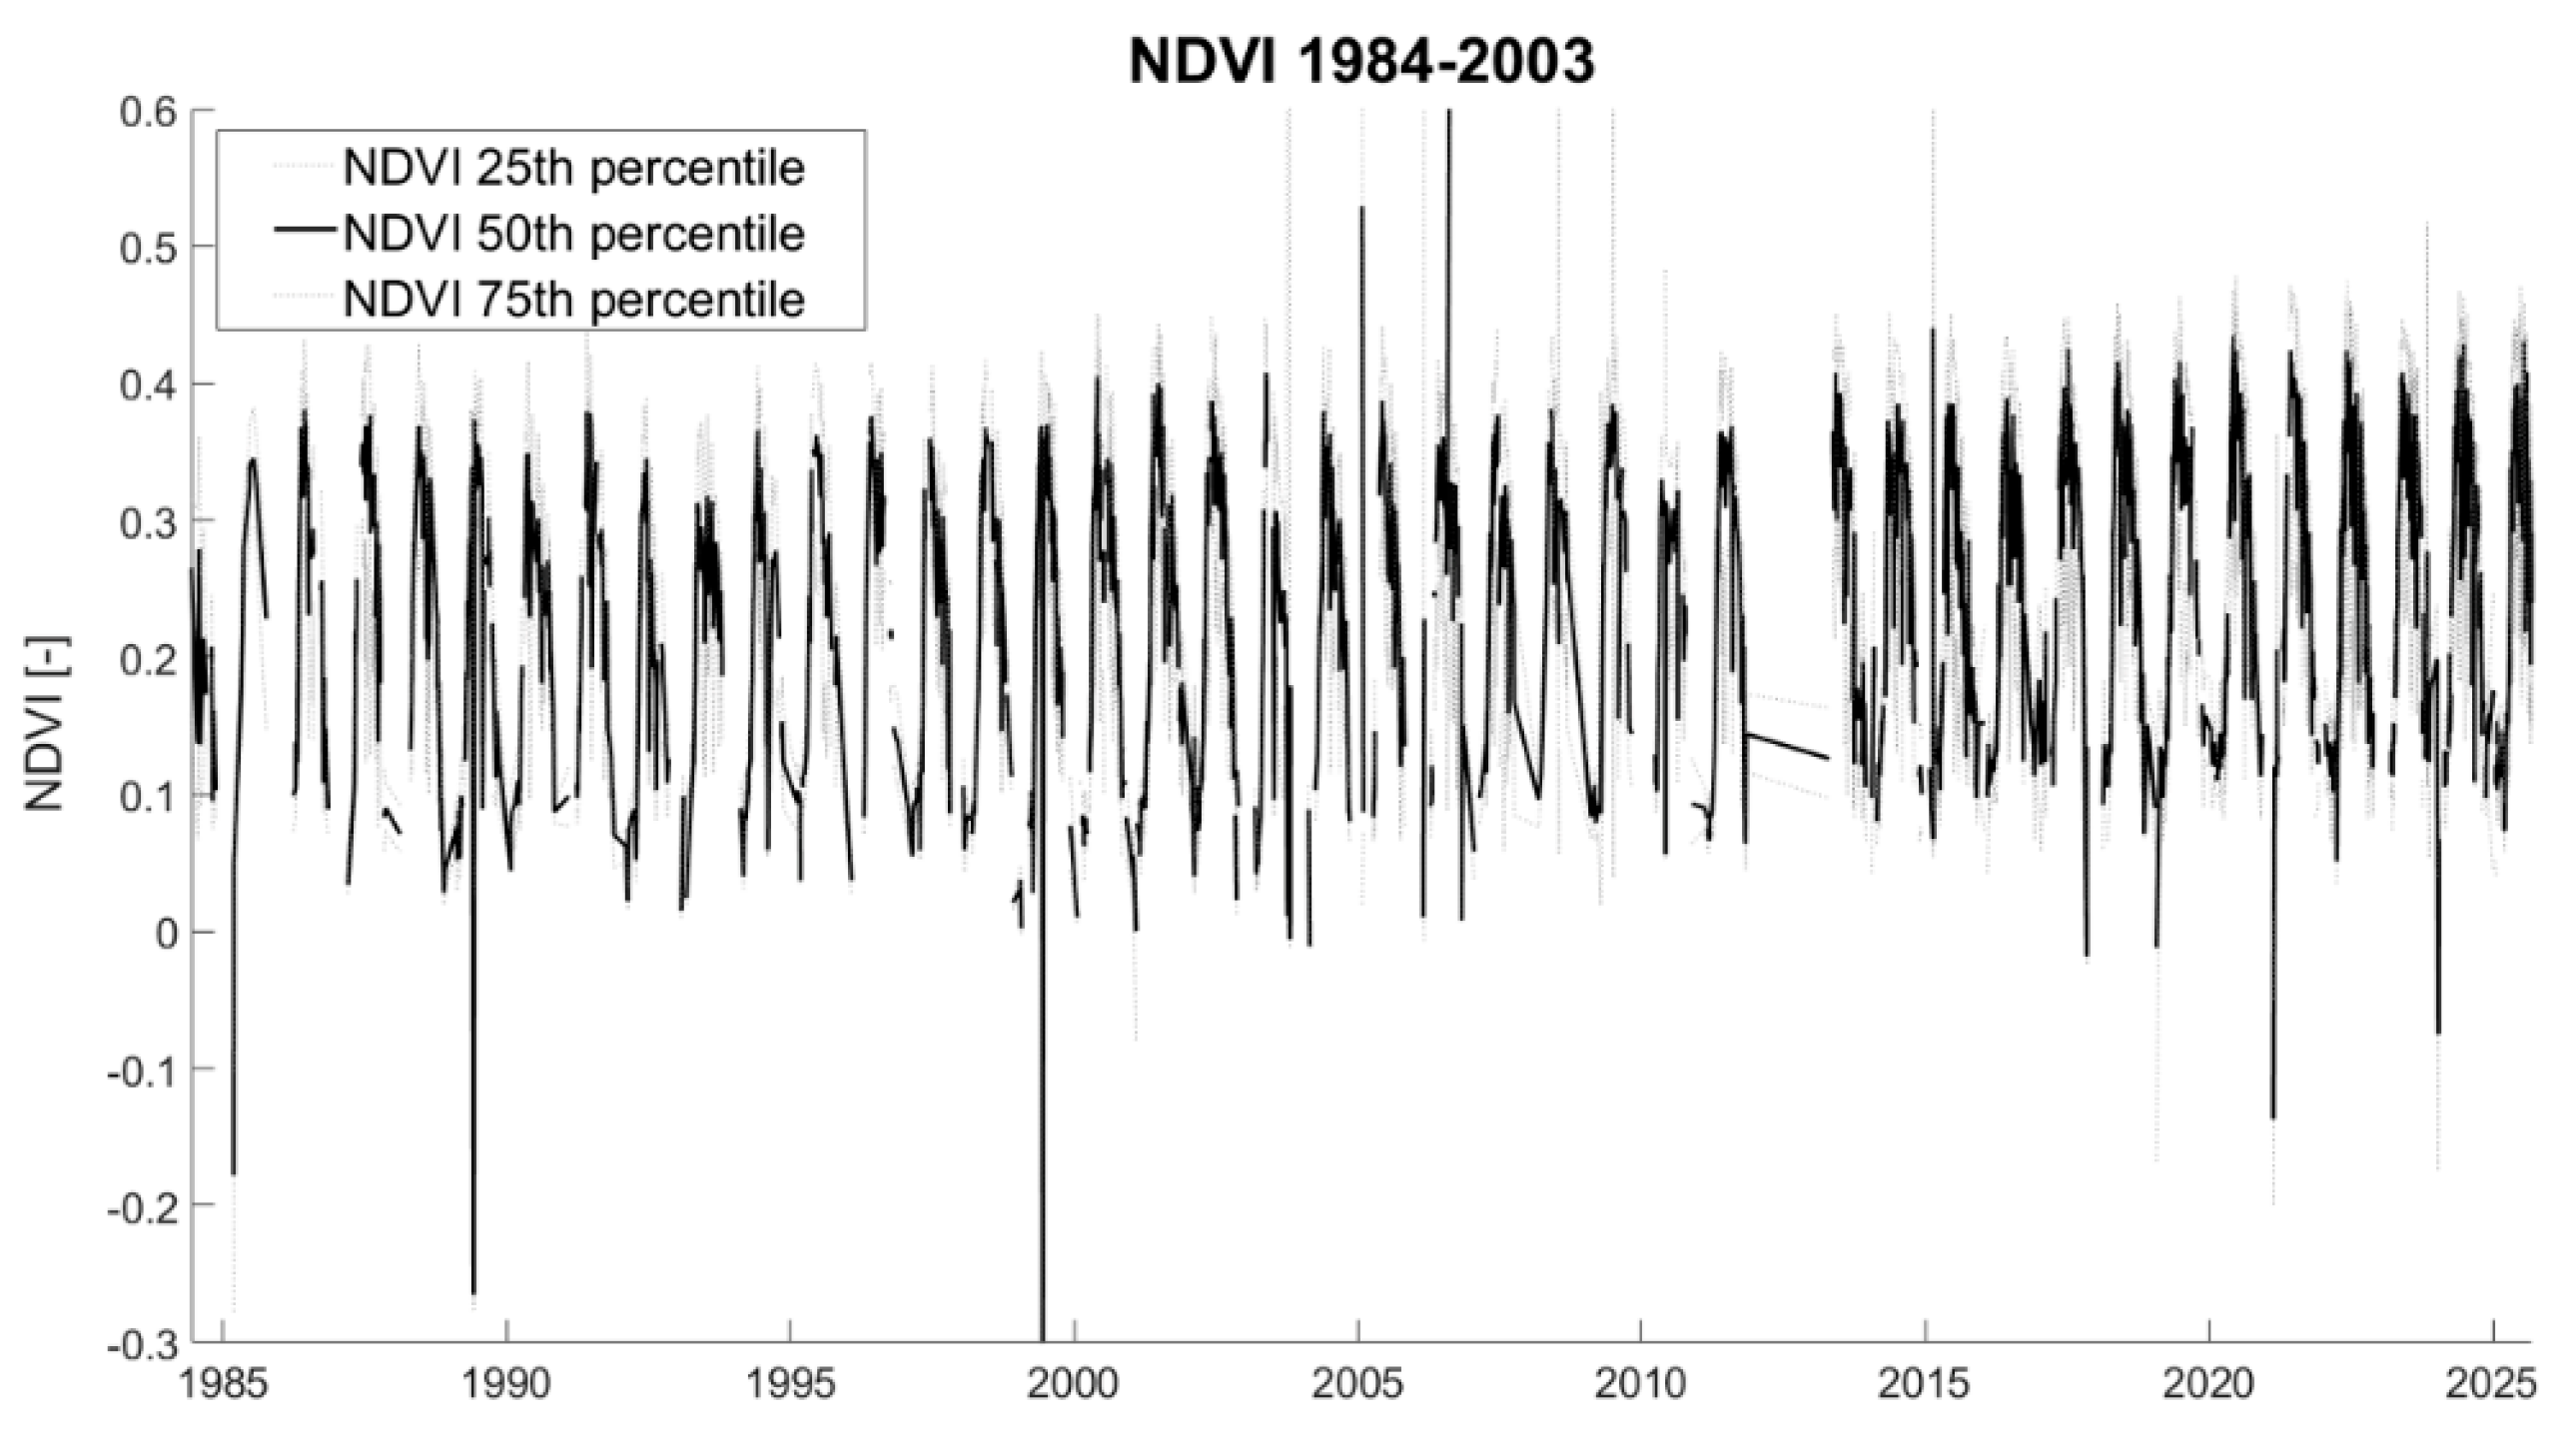
Figure 6.
Changes in NDVI over the periods 1984-2003 (blue bars), 1994-2013 (red bars), 2004-2023 (orange bars).
Figure 6.
Changes in NDVI over the periods 1984-2003 (blue bars), 1994-2013 (red bars), 2004-2023 (orange bars).
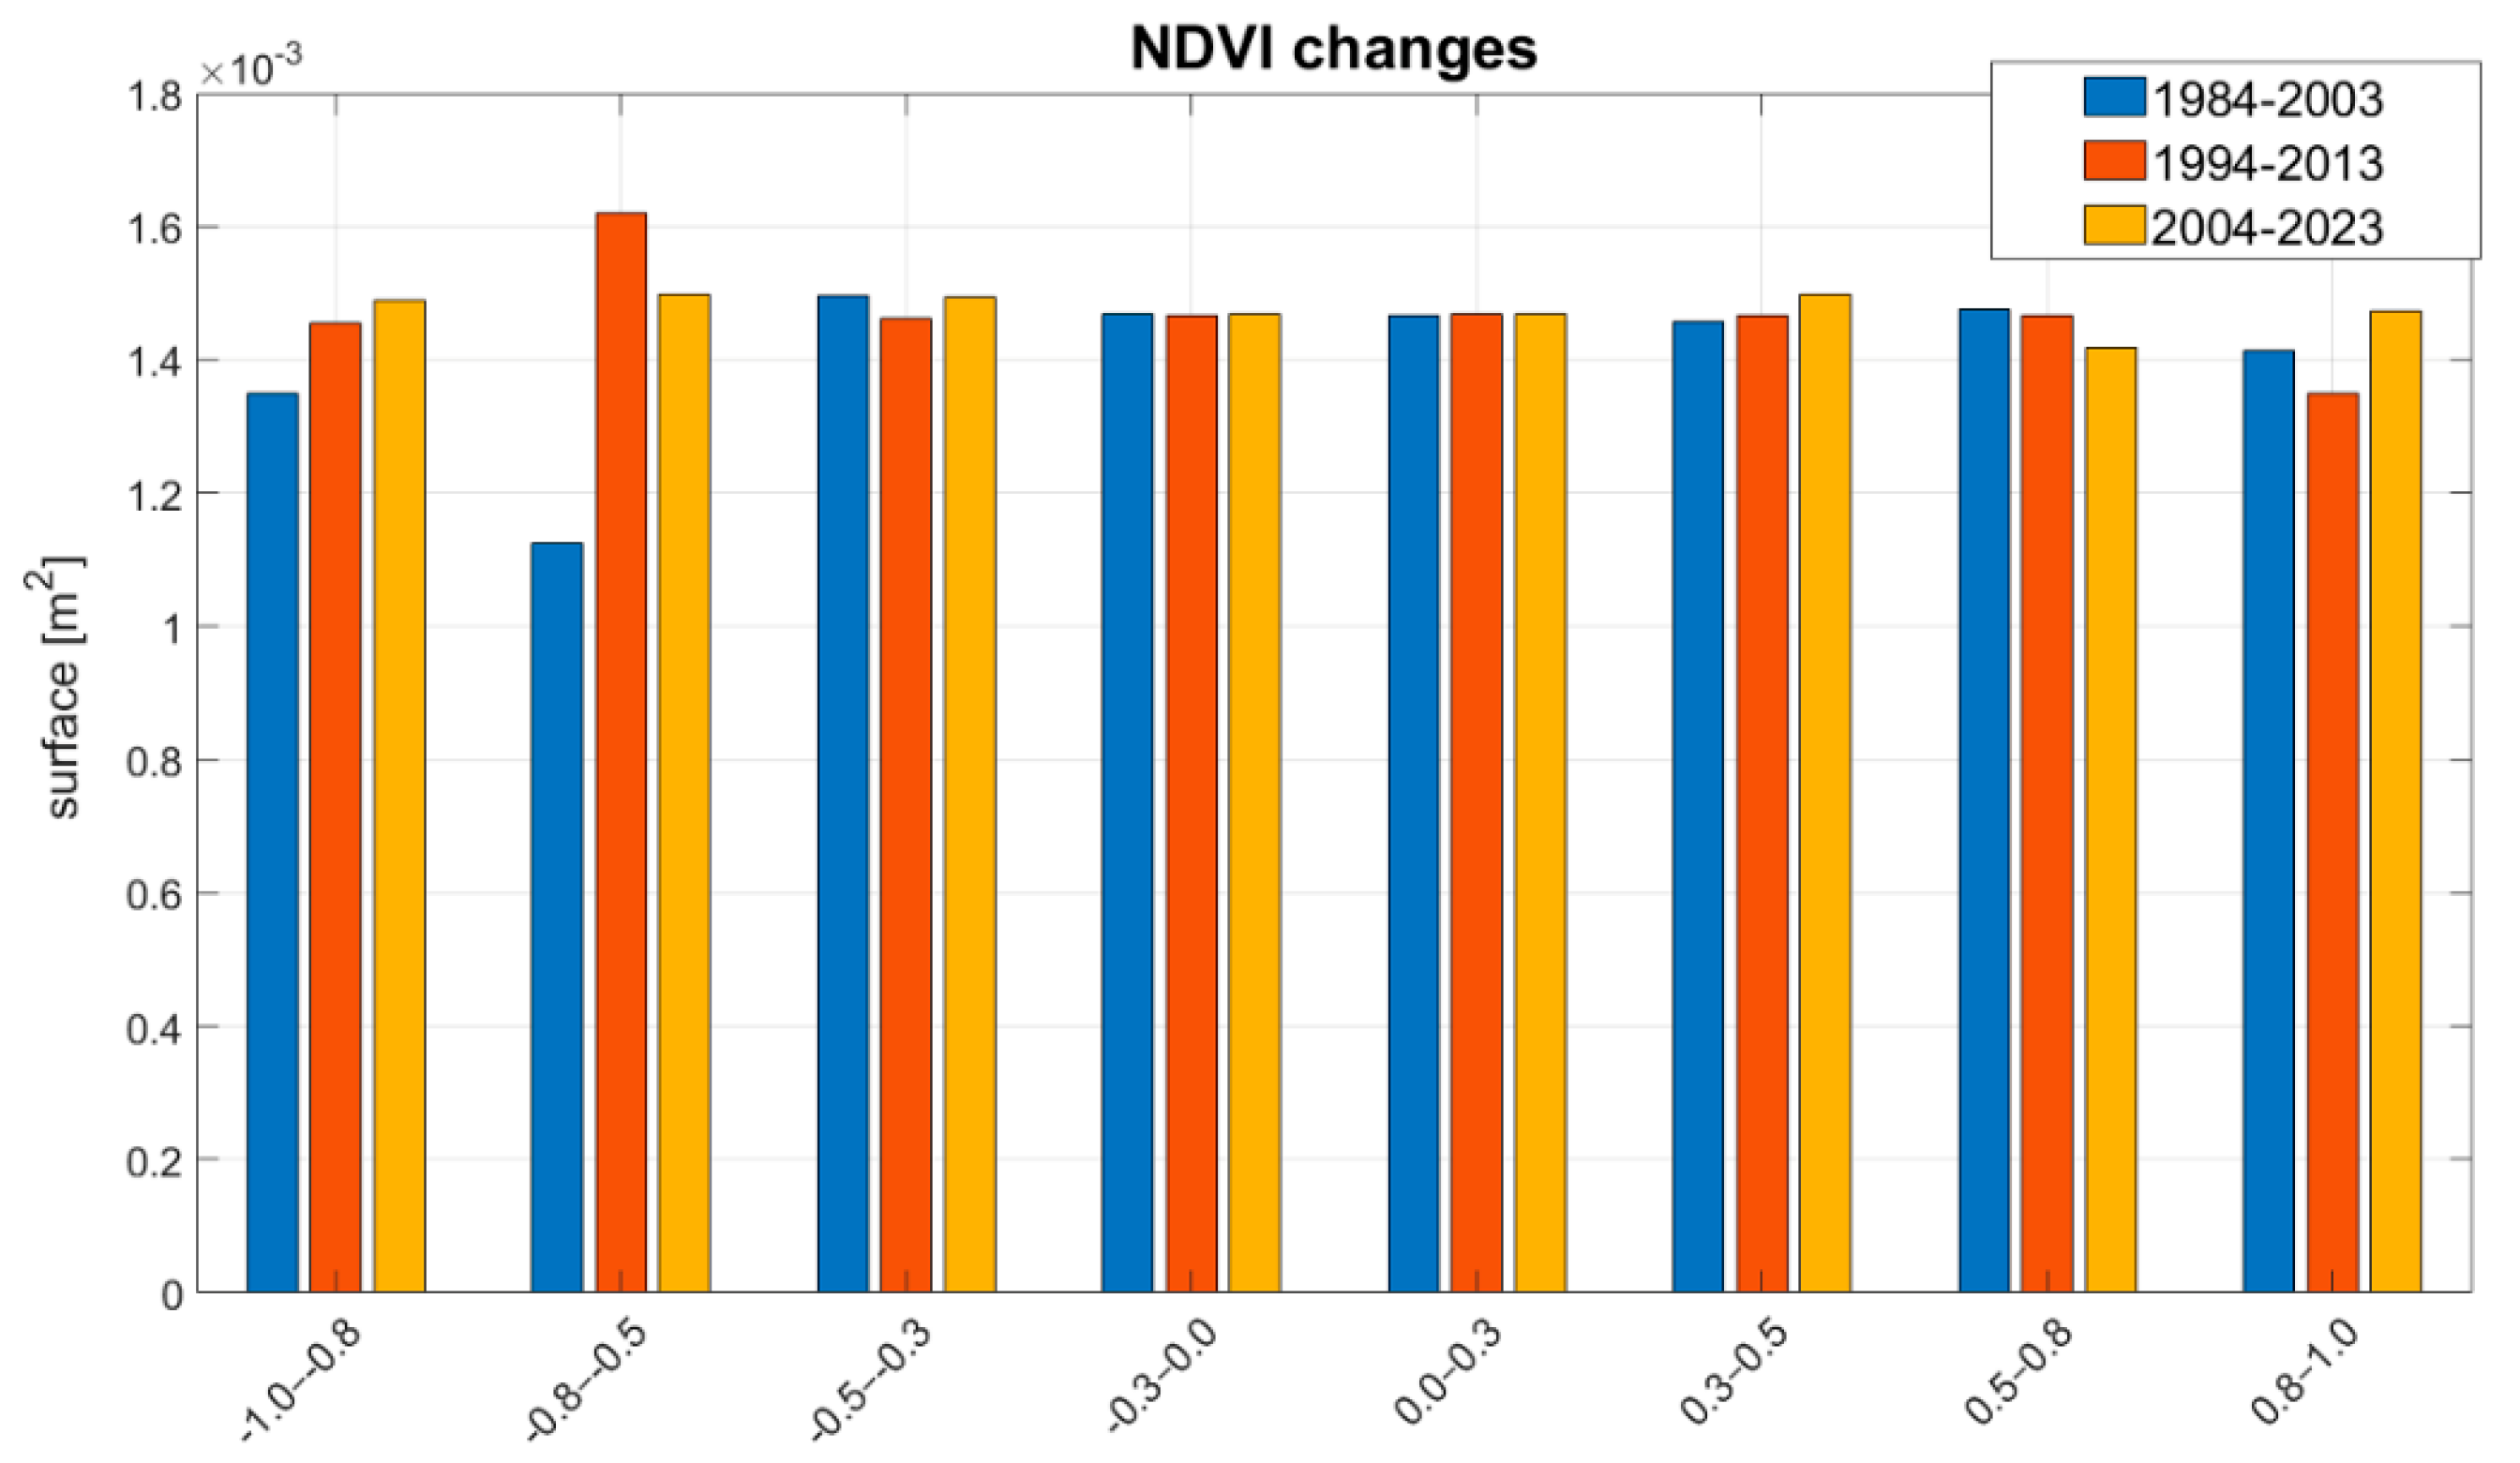
Figure 7.
Changes in NDVI the periods a) 1984-2003, b) 1994-2013 and c) 2004-2023 in a selected reach close to Wyszogród, downstream of Warsaw. Red and yellow colours indicate a reduction in NDVI during the period, while cyan and green indicate an increase in NDVI values.
Figure 7.
Changes in NDVI the periods a) 1984-2003, b) 1994-2013 and c) 2004-2023 in a selected reach close to Wyszogród, downstream of Warsaw. Red and yellow colours indicate a reduction in NDVI during the period, while cyan and green indicate an increase in NDVI values.
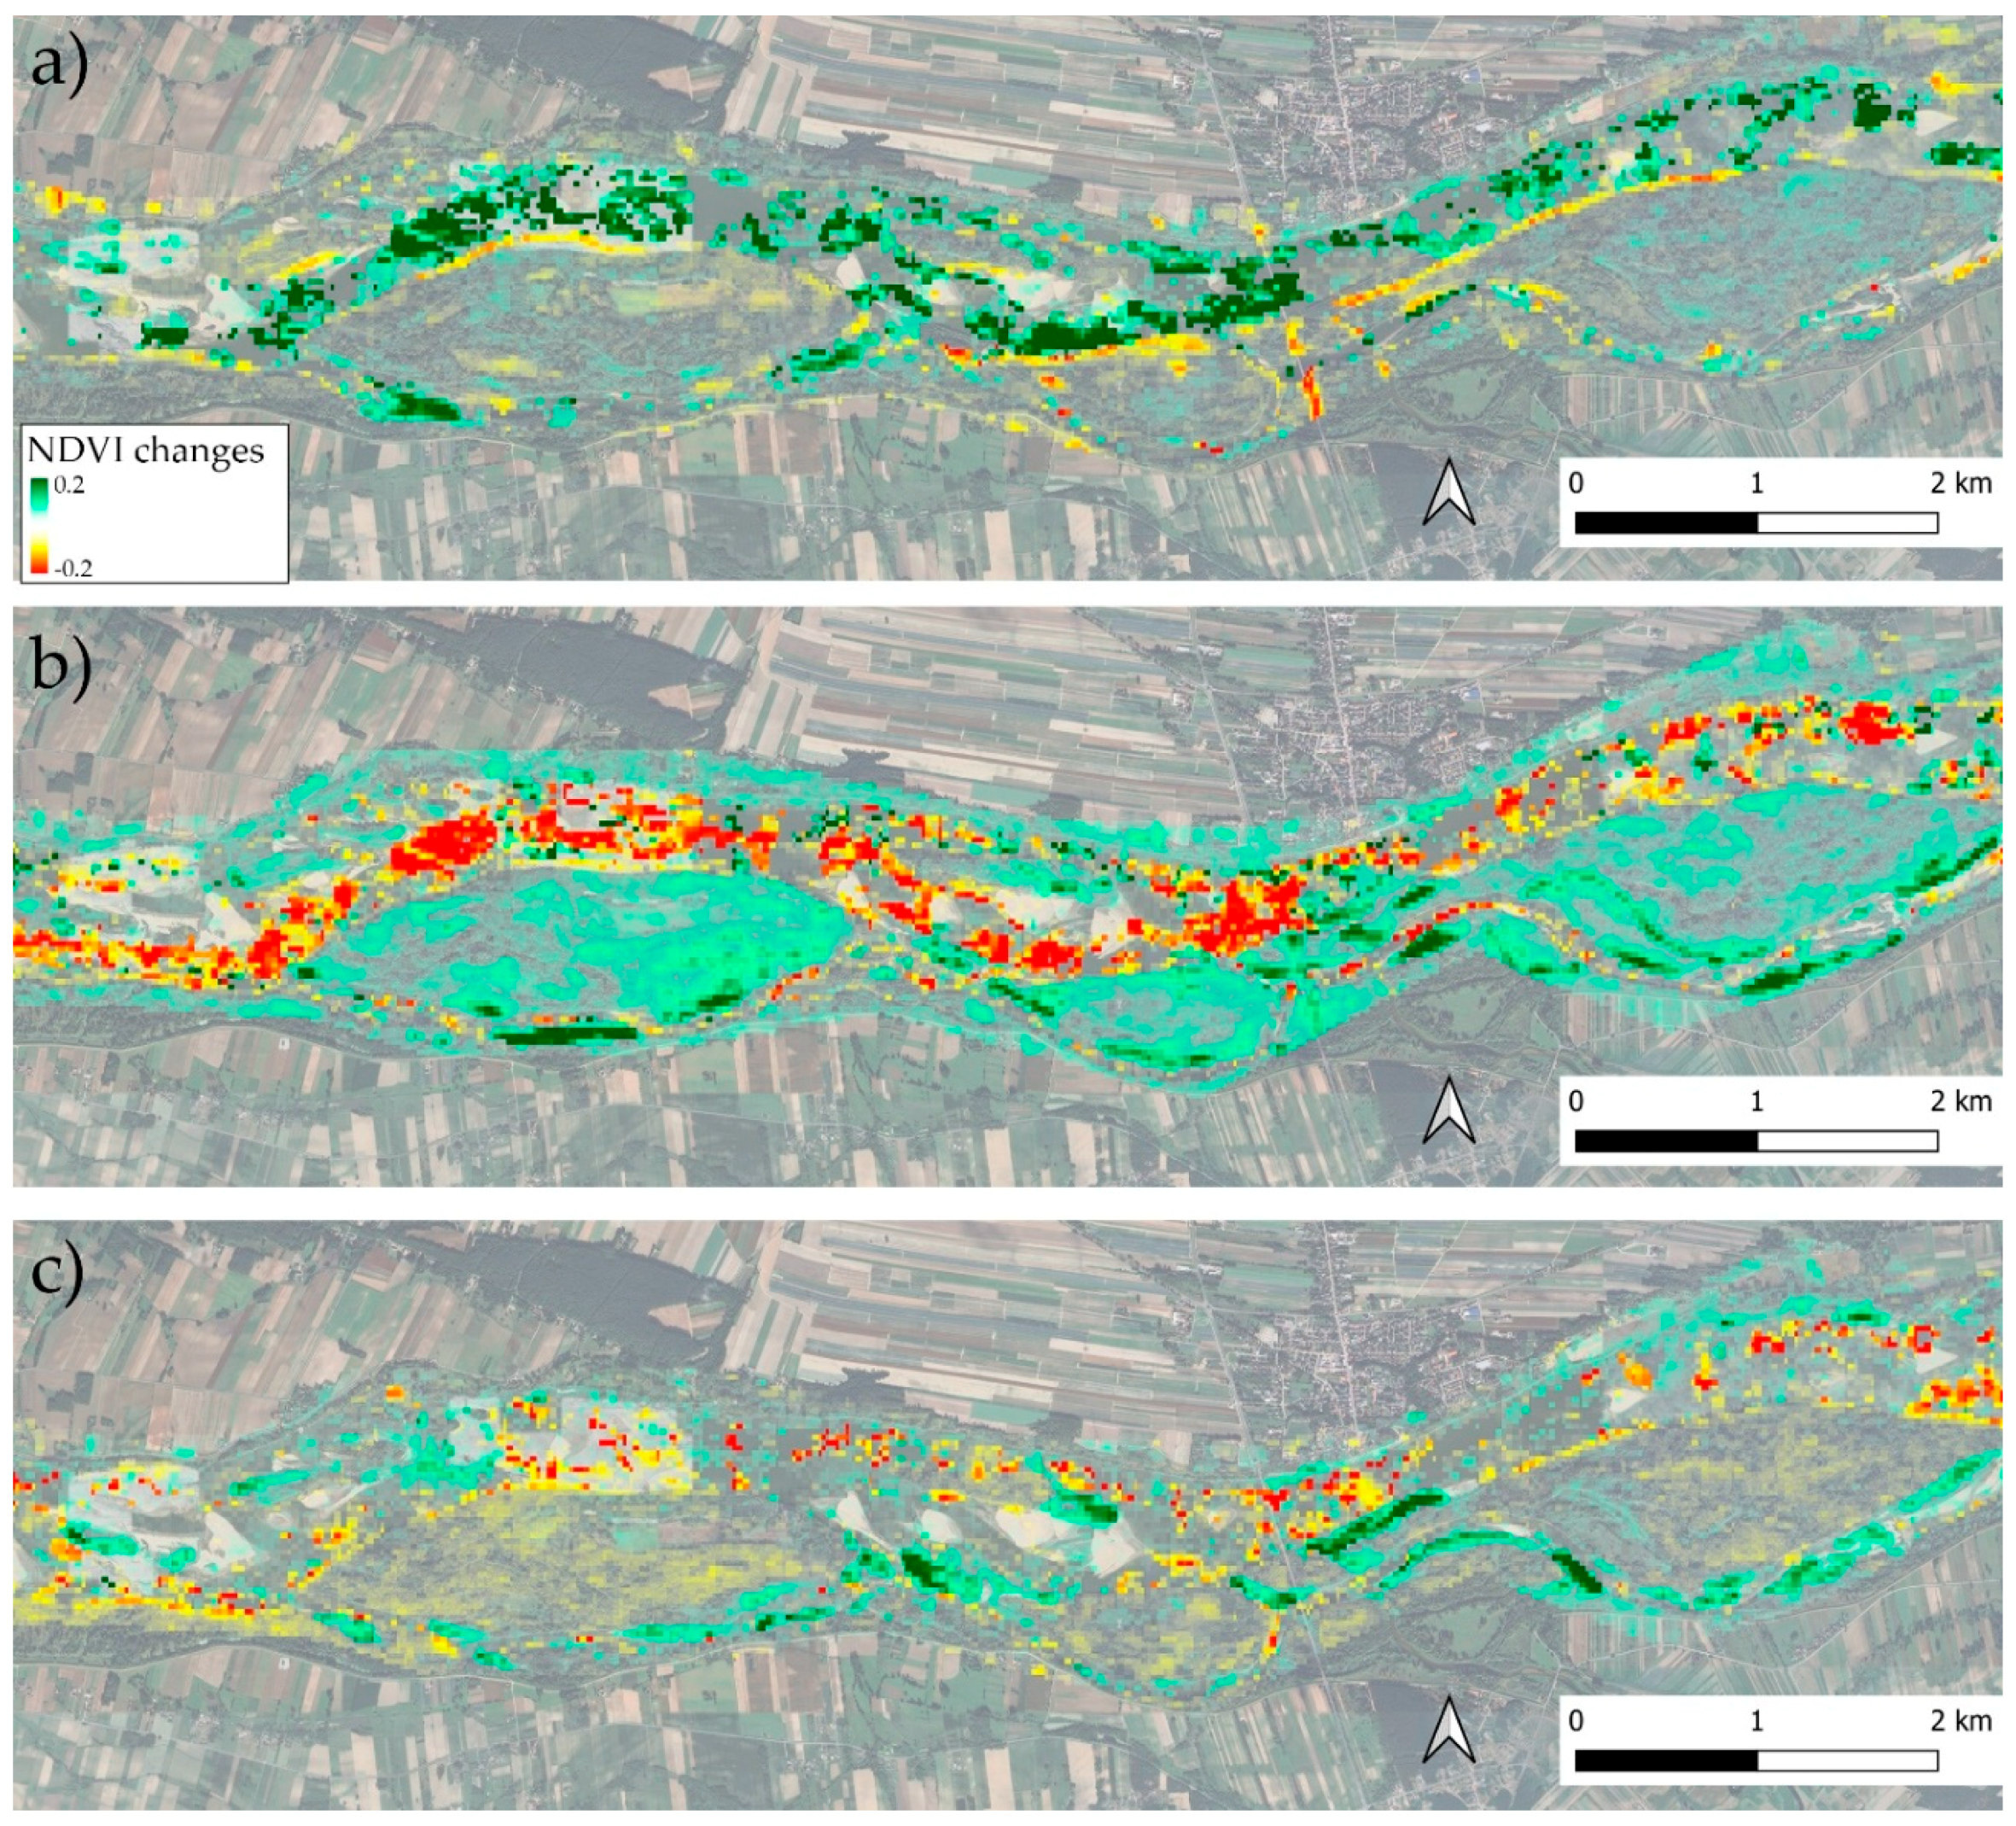
Figure 8.
Areas covered by water, as derived from the JRC Yearly Water Classification History dataset.
Figure 8.
Areas covered by water, as derived from the JRC Yearly Water Classification History dataset.
Disclaimer/Publisher’s Note: The statements, opinions and data contained in all publications are solely those of the individual author(s) and contributor(s) and not of MDPI and/or the editor(s). MDPI and/or the editor(s) disclaim responsibility for any injury to people or property resulting from any ideas, methods, instructions or products referred to in the content. |
© 2025 by the authors. Licensee MDPI, Basel, Switzerland. This article is an open access article distributed under the terms and conditions of the Creative Commons Attribution (CC BY) license (http://creativecommons.org/licenses/by/4.0/).
Copyright: This open access article is published under a Creative Commons CC BY 4.0 license, which permit the free download, distribution, and reuse, provided that the author and preprint are cited in any reuse.


