Submitted:
20 November 2025
Posted:
24 November 2025
You are already at the latest version
Abstract
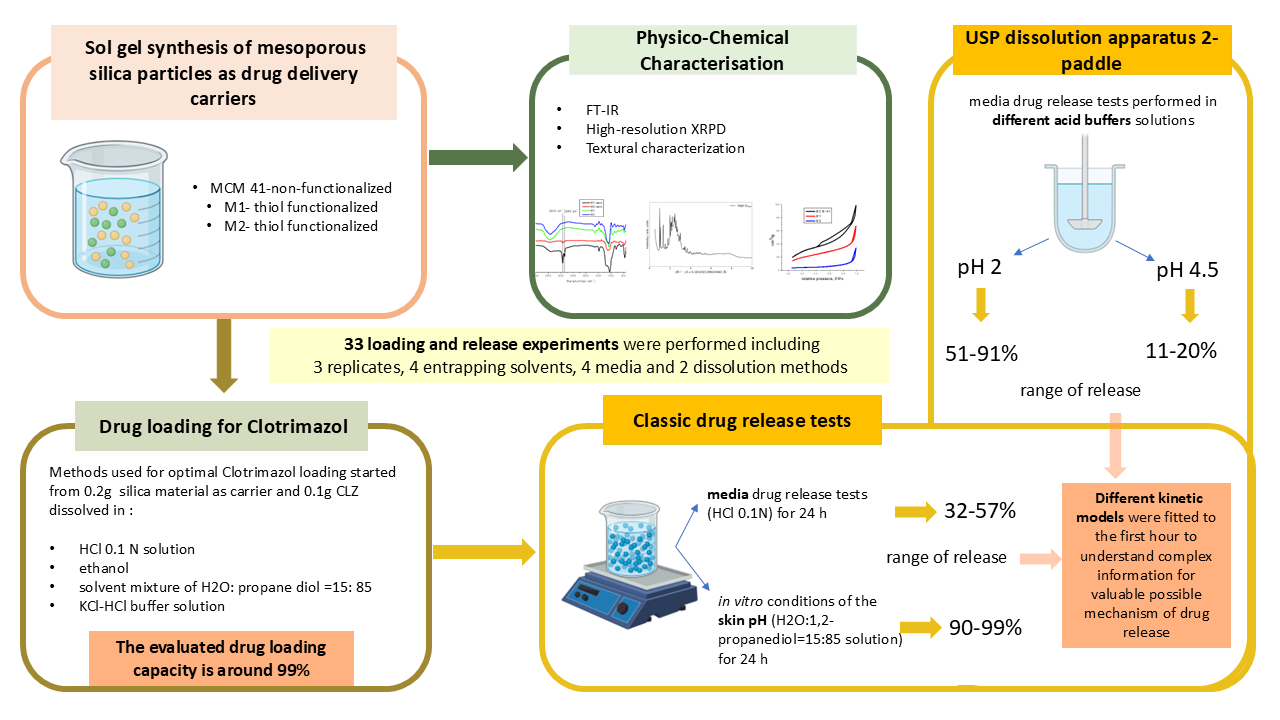
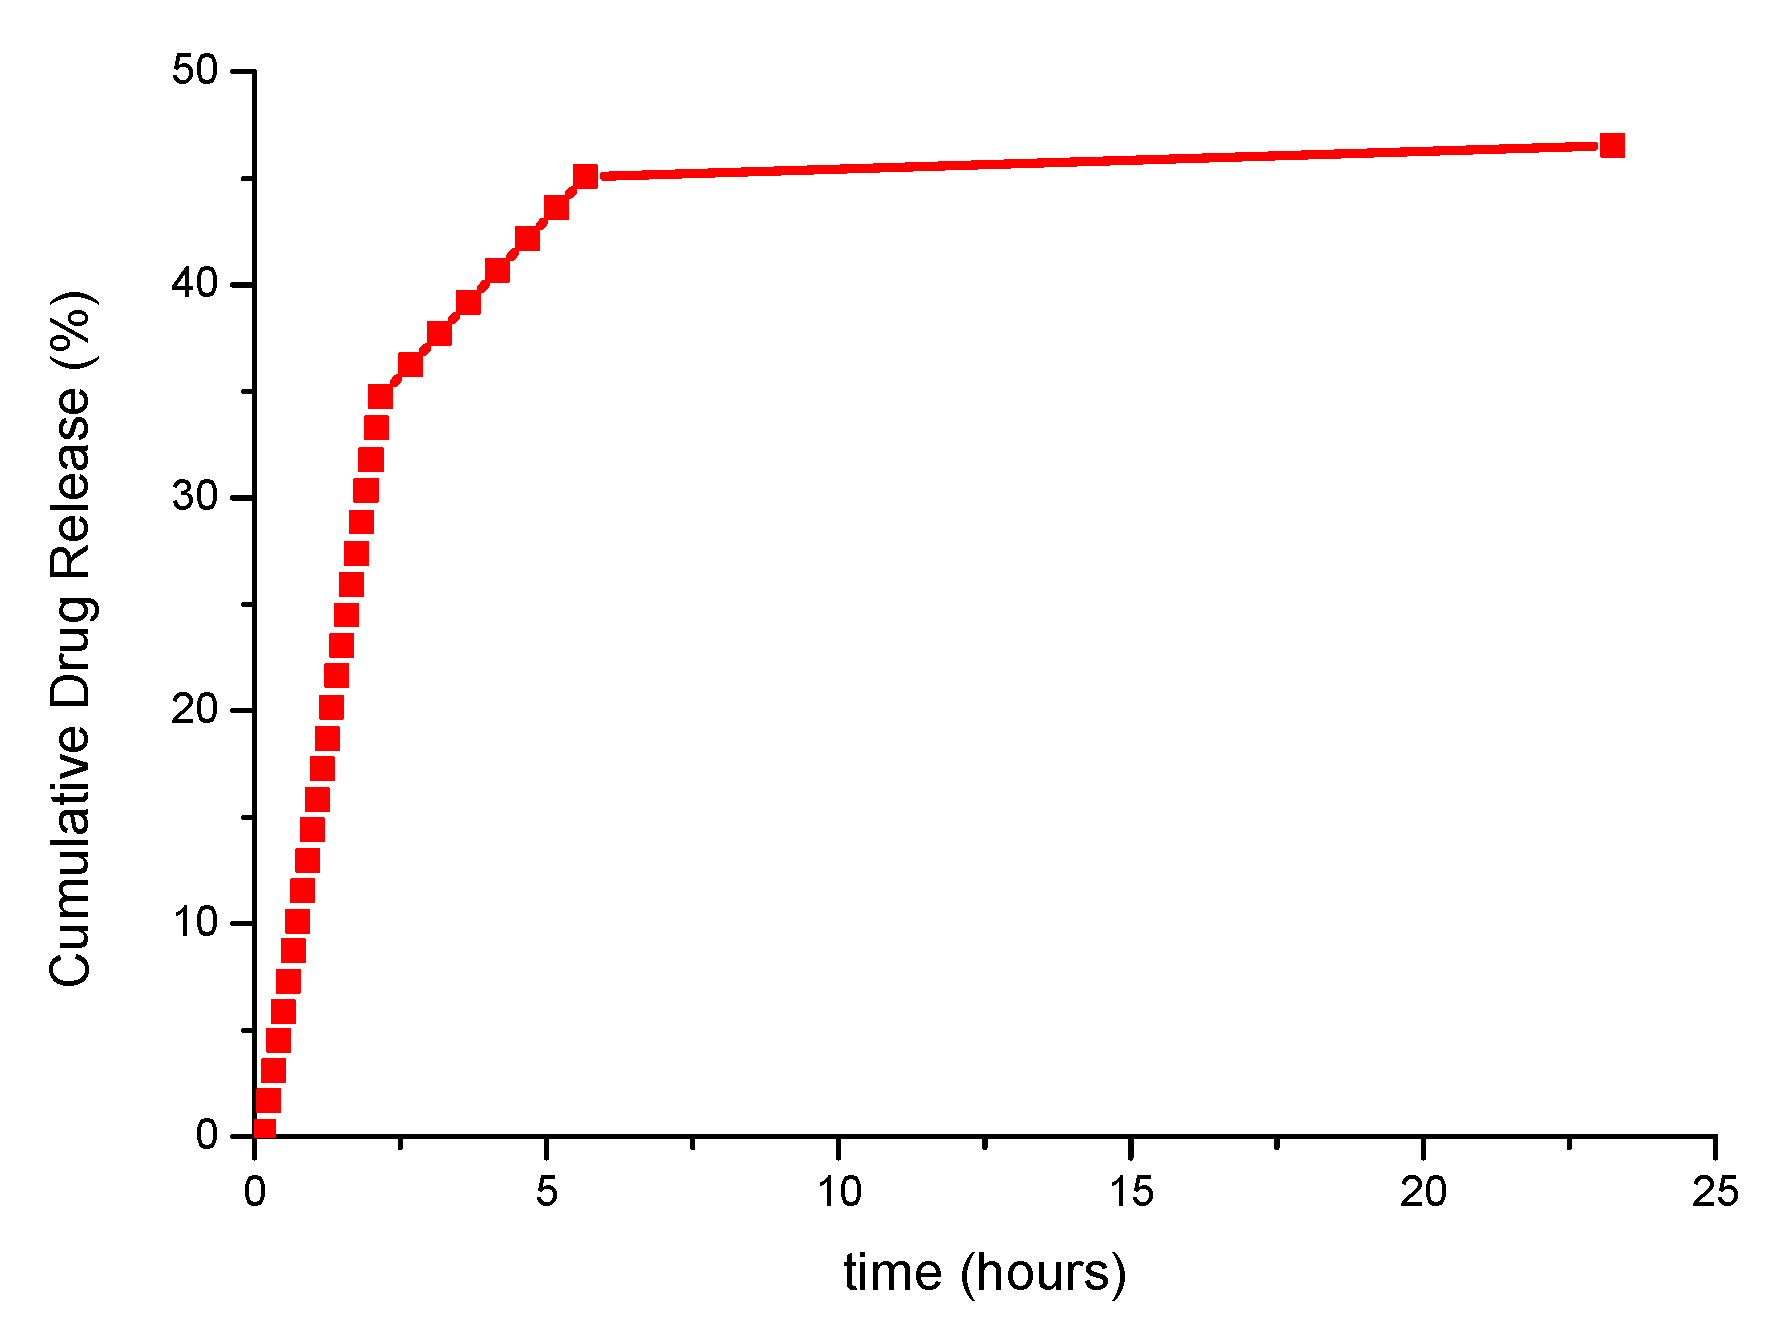
Functionalized mesoporous silica particles were synthesized via a simplified sol–gel co-condensation method using mixed silica precursors—tetraethoxysilane (TEOS) and (3-mercaptopropyl) triethoxysilane (MPTES)—in two different molar ratios, alongside a reference non-functionalized MCM-41 sample. The obtained materials were characterized by nitrogen adsorption–desorption (BET–BJH–DFT) to assess their textural properties. The results confirmed a significant decrease in surface area and pore volume upon functionalization (from 1213 to 72.35 and 16.06 m² g⁻¹), accompanied by narrower pore diameters (2.4–3.5 nm), indicating partial pore blocking and increased surface tortuosity in the M1 and M2 samples. All materials demonstrated excellent carrier capacity for the hydrophobic antifungal drug clotrimazole (CLZ), achieving loading efficiencies close to 99% in all tested solvent media. The release behaviour was evaluated in acidic and mildly acidic environments (0.1 N HCl, KCl–HCl buffer pH 2, and acetate buffer pH 4.5). The best performance was observed when the same buffer was used for both drug loading and release, with cumulative release values between 51–91% at pH 2, while release remained in the 11–20% range at pH 4.5 and around 45% in 0.1 N HCl after 6 h. These findings highlight the influence of surface chemistry and pore architecture on drug–matrix interactions, confirming the potential of thiol-functionalized silica carriers for controlled delivery of hydrophobic drugs under pH-relevant conditions. The measured release time was evaluated for 24 hours via classical evaluation and for 3 hours and 20 minutes for the experiments performed with the dissolution instrument. The water: propan diol mixture solution has been chosen in order to mimic the pH of the skin level conditions. The different acidic solution has been chosen in order to mimic the acidic pH around a cancercell or around an inflammation. The extreme pH conditions (1 or 2) were chosen in order to model the dissolution of a drug with very low water solubility in an acidic environment. Moreover, these systems are very rarely studied in the literature.
Keywords:
1. Introduction
2. Materials and Methods
2.1. Sample Synthesis
2.2. Characterization Methods
2.3. Application of the Obtained Materials as Drug Carriers
2.3.1. Chemicals
2.3.2. Dissolution Media
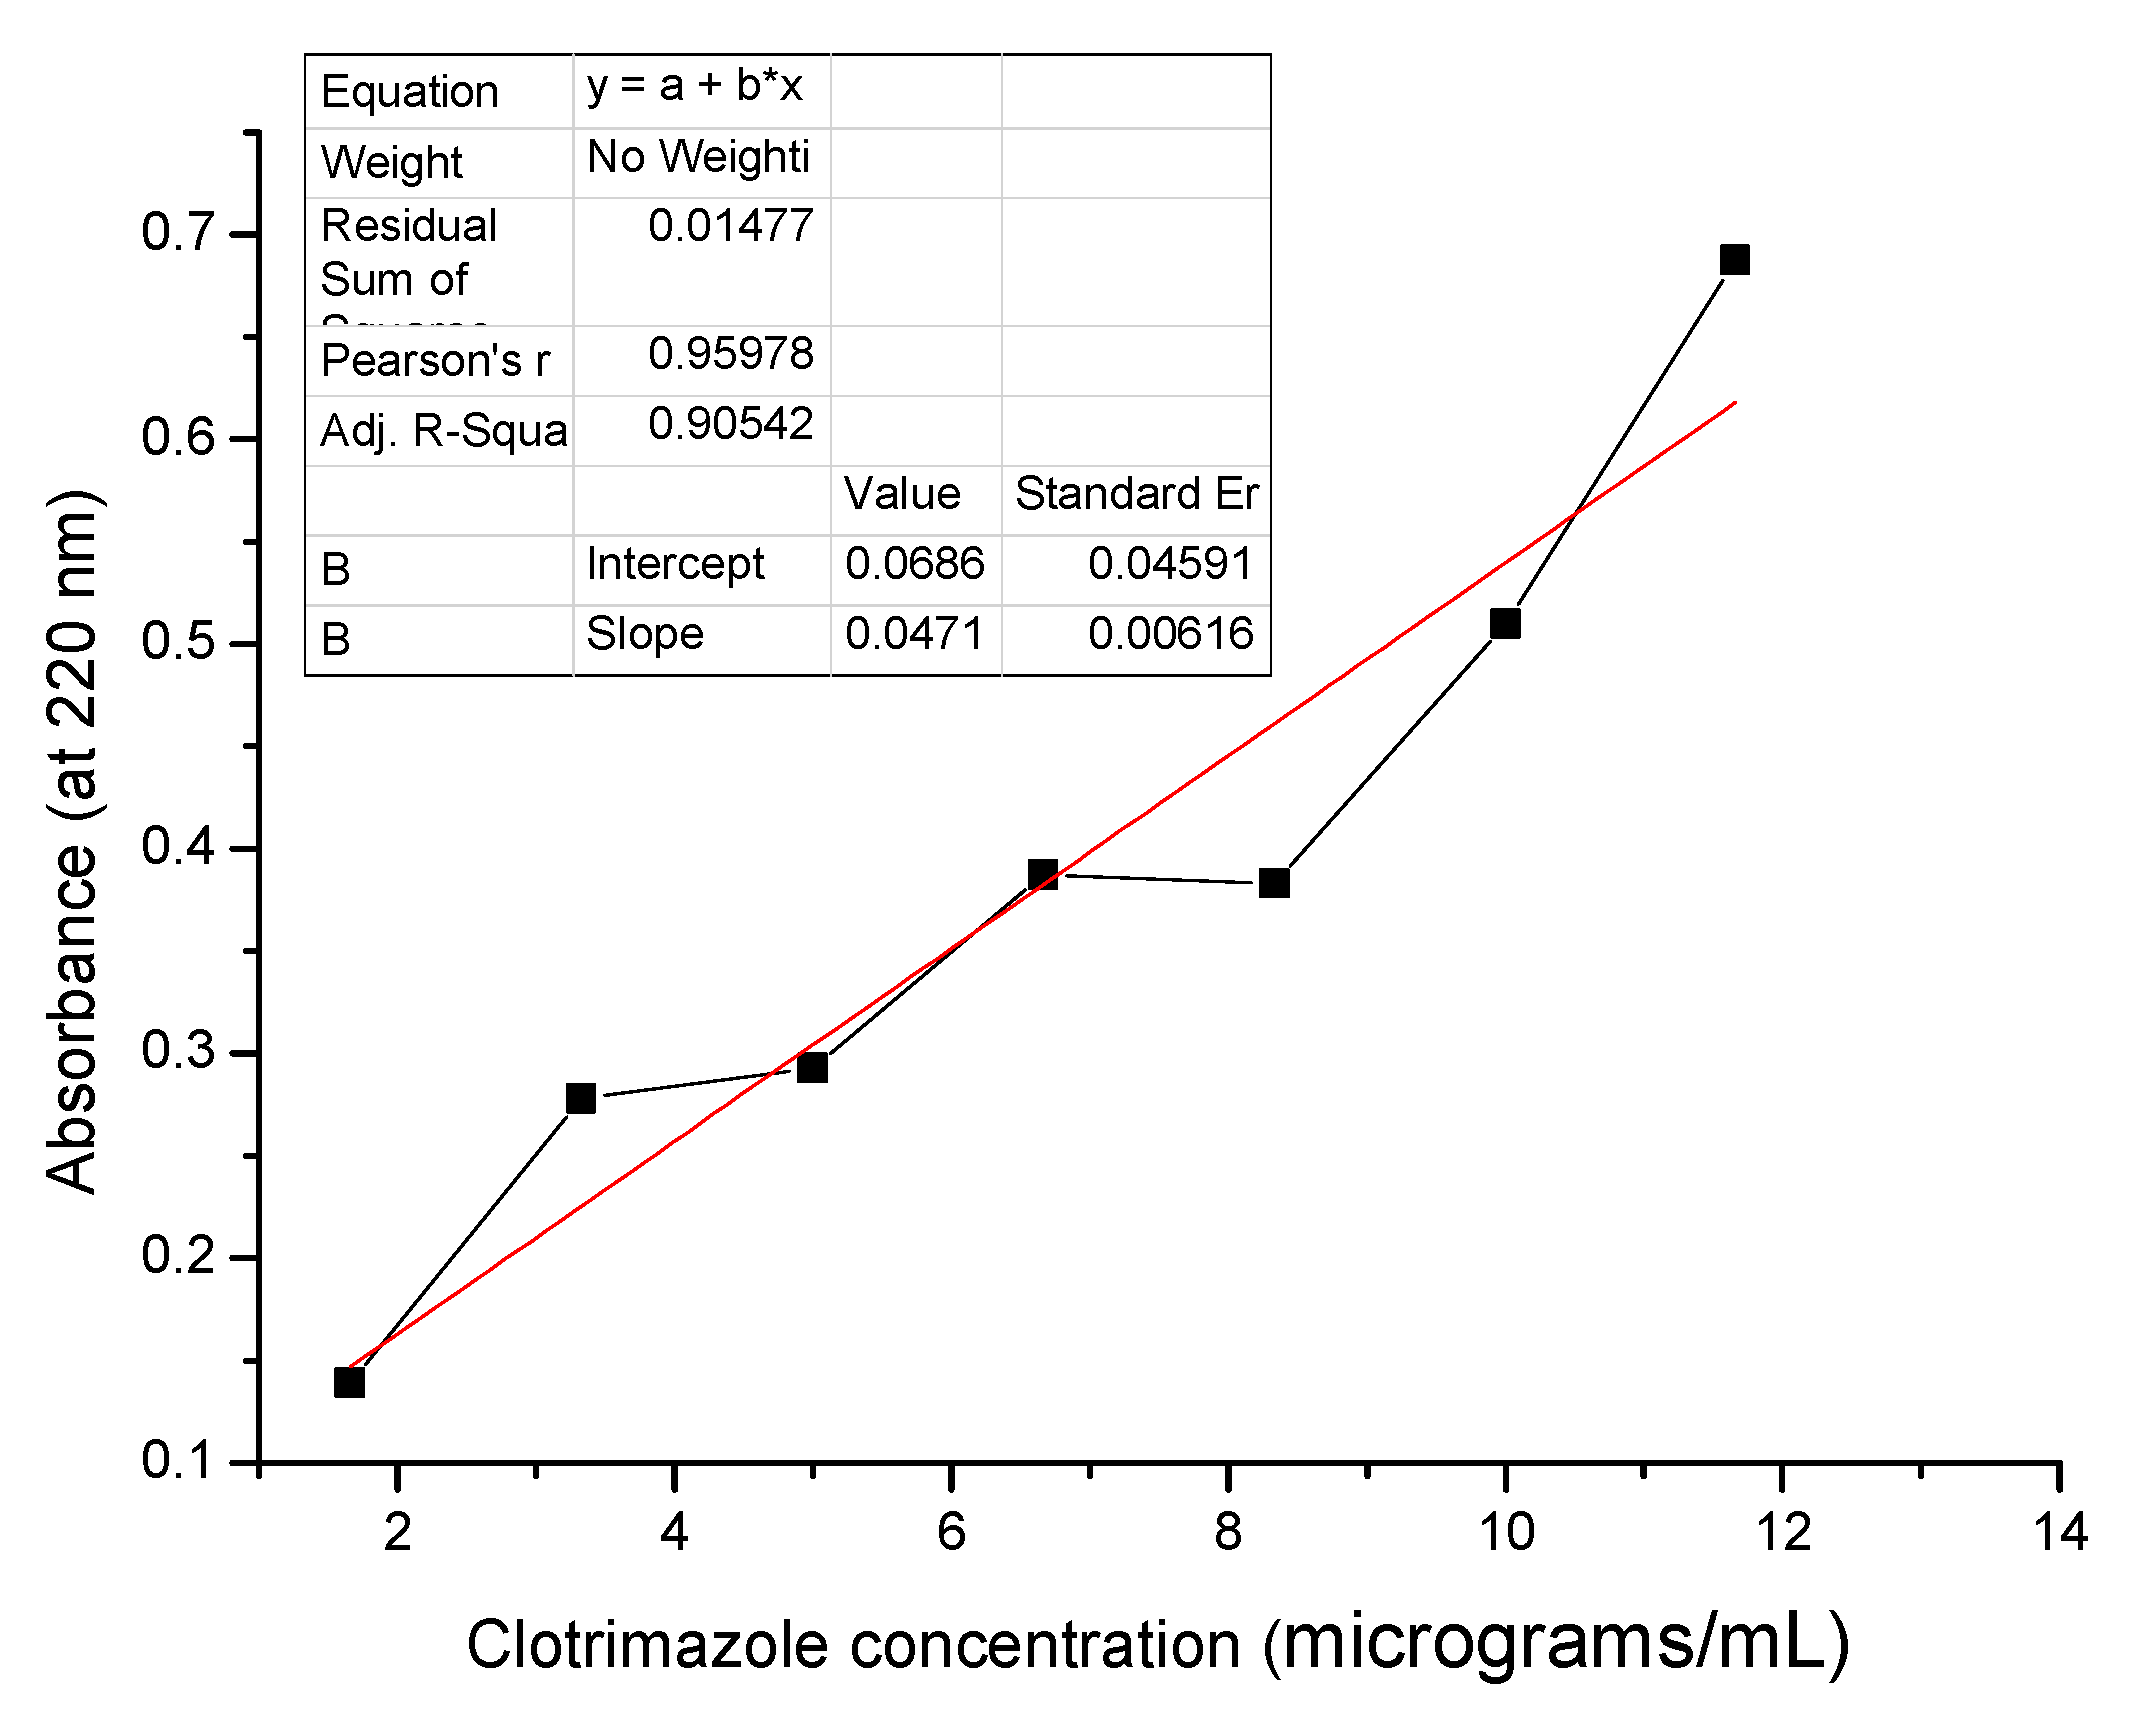
2.3.3. UV-VIS Calibration Curves
Calibration Curve for CLZ in HCl 0.1 N (pH 1)
Calibration Curve for CLZ in Nuffer KCl-HCl (pH 2)
Calibration Curve for CLZ in Nuffer pH 4.5
Calibration Curve for Clotrimazole in H2O: Propane Diol =15: 85 Solvent Mixture
Calibration Curves for Clotrimazole in Ethanol
2.3.4. Drug Loading Experiments
Drug Loading in HCl 0.1 N Solution (pH 1)
Drug Loading in KCl- HCl Buffer Solution (pH 2)
Drug Loading in Ethanol Solution (For the Samples That Were Further Released in Buffer of pH = 4.5
Drug Loading in H2O: Propane Diol =15: 85 Solvent Mixture
2.3.4. In Vitro Drug Release Procedures Were Done in Two Ways: Classic Laboratory Experiment and Using Suitable Dissolution Apparatus
In vitro drug release procedure using classical method
In vitro Drug Release Procedure Using the Dissolution Apparatus 850-DS Model from Agilent in Paddle Module
3. Results
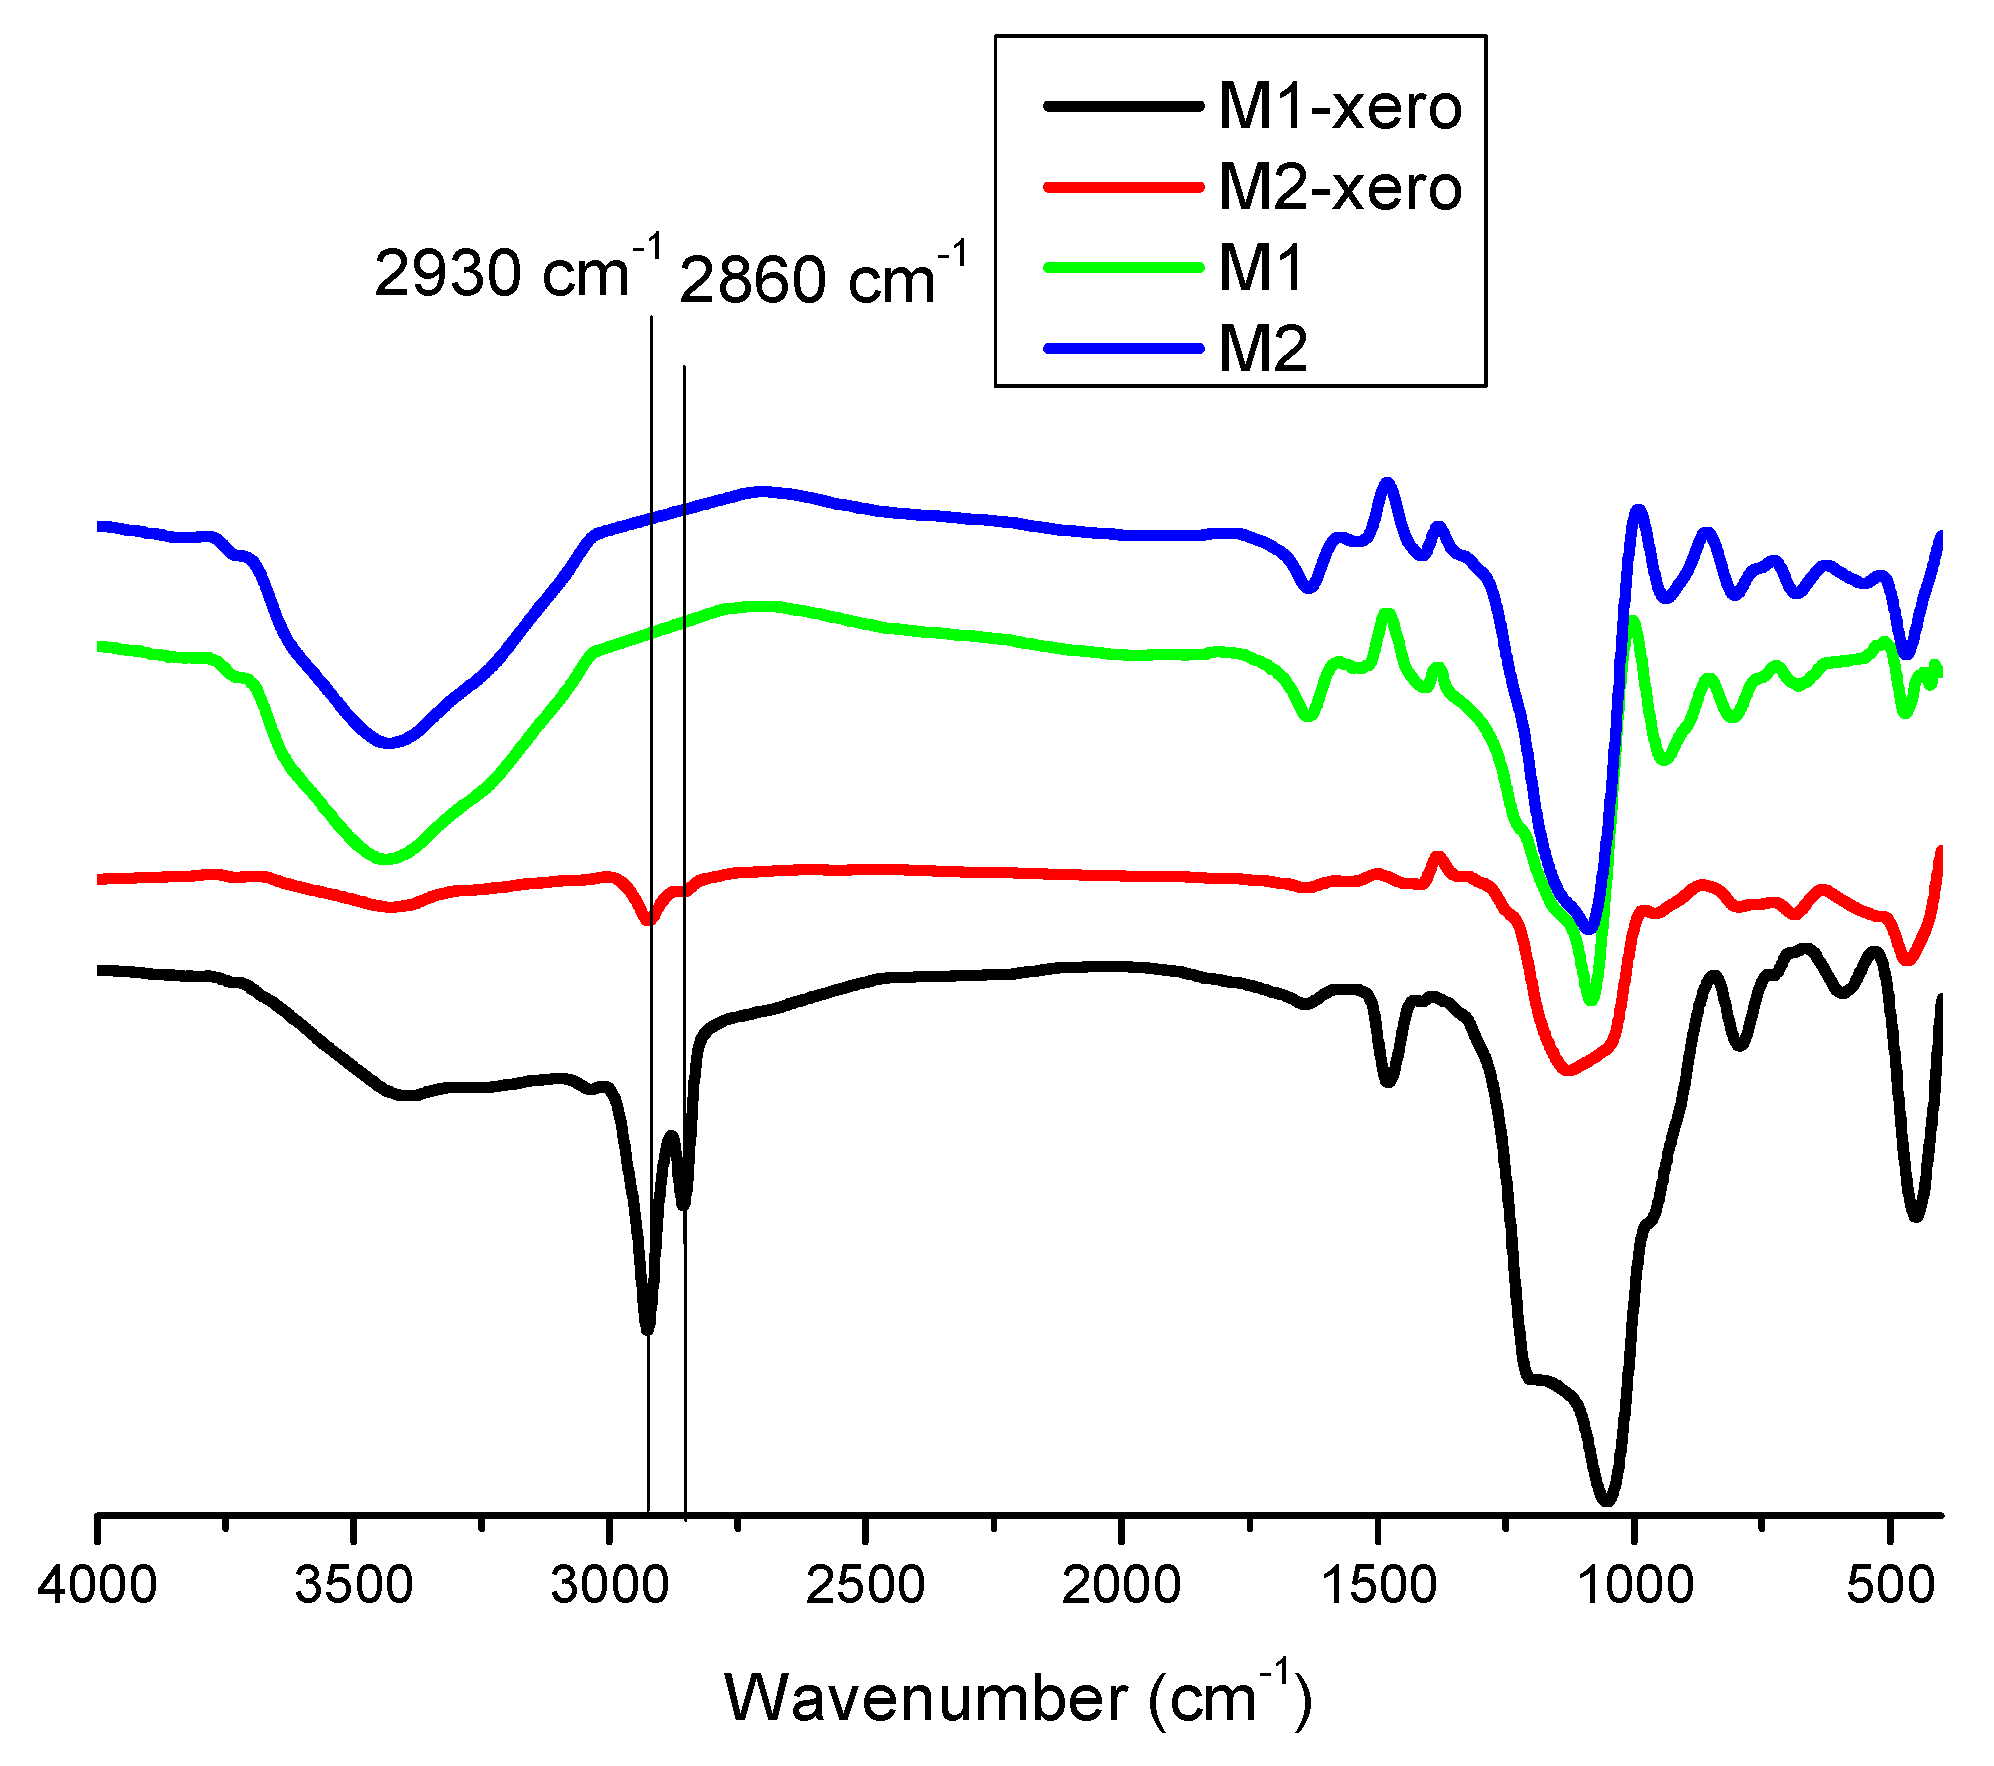
3.1. FT-IR Analysis
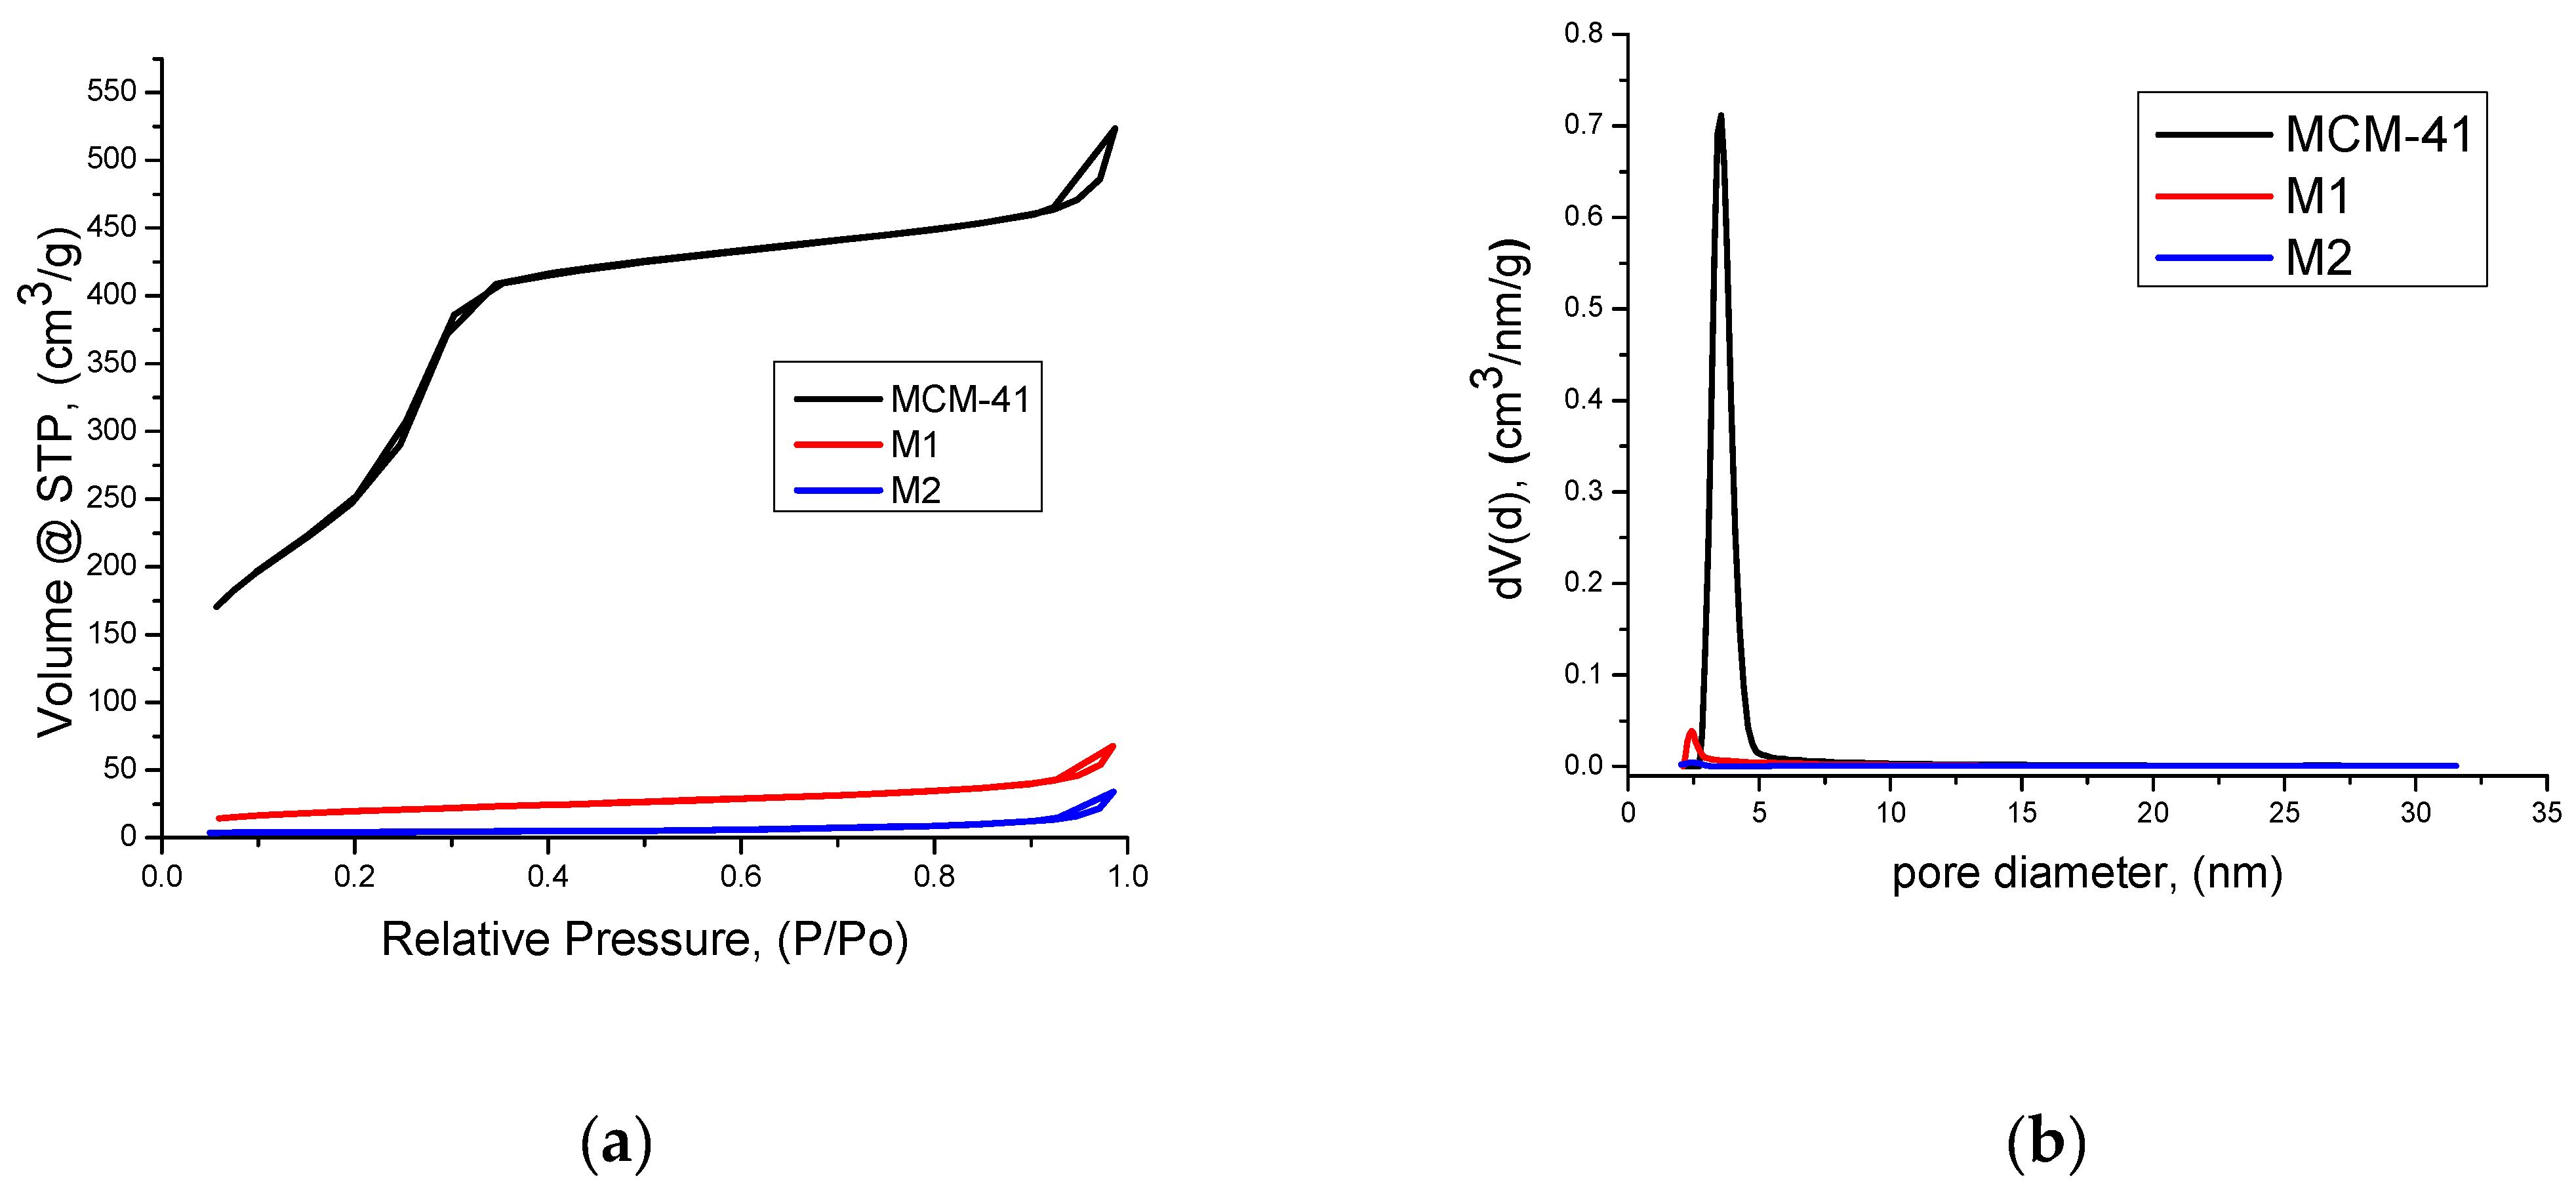
3.2. Textural Characterization by Nitrogen Sorption Method
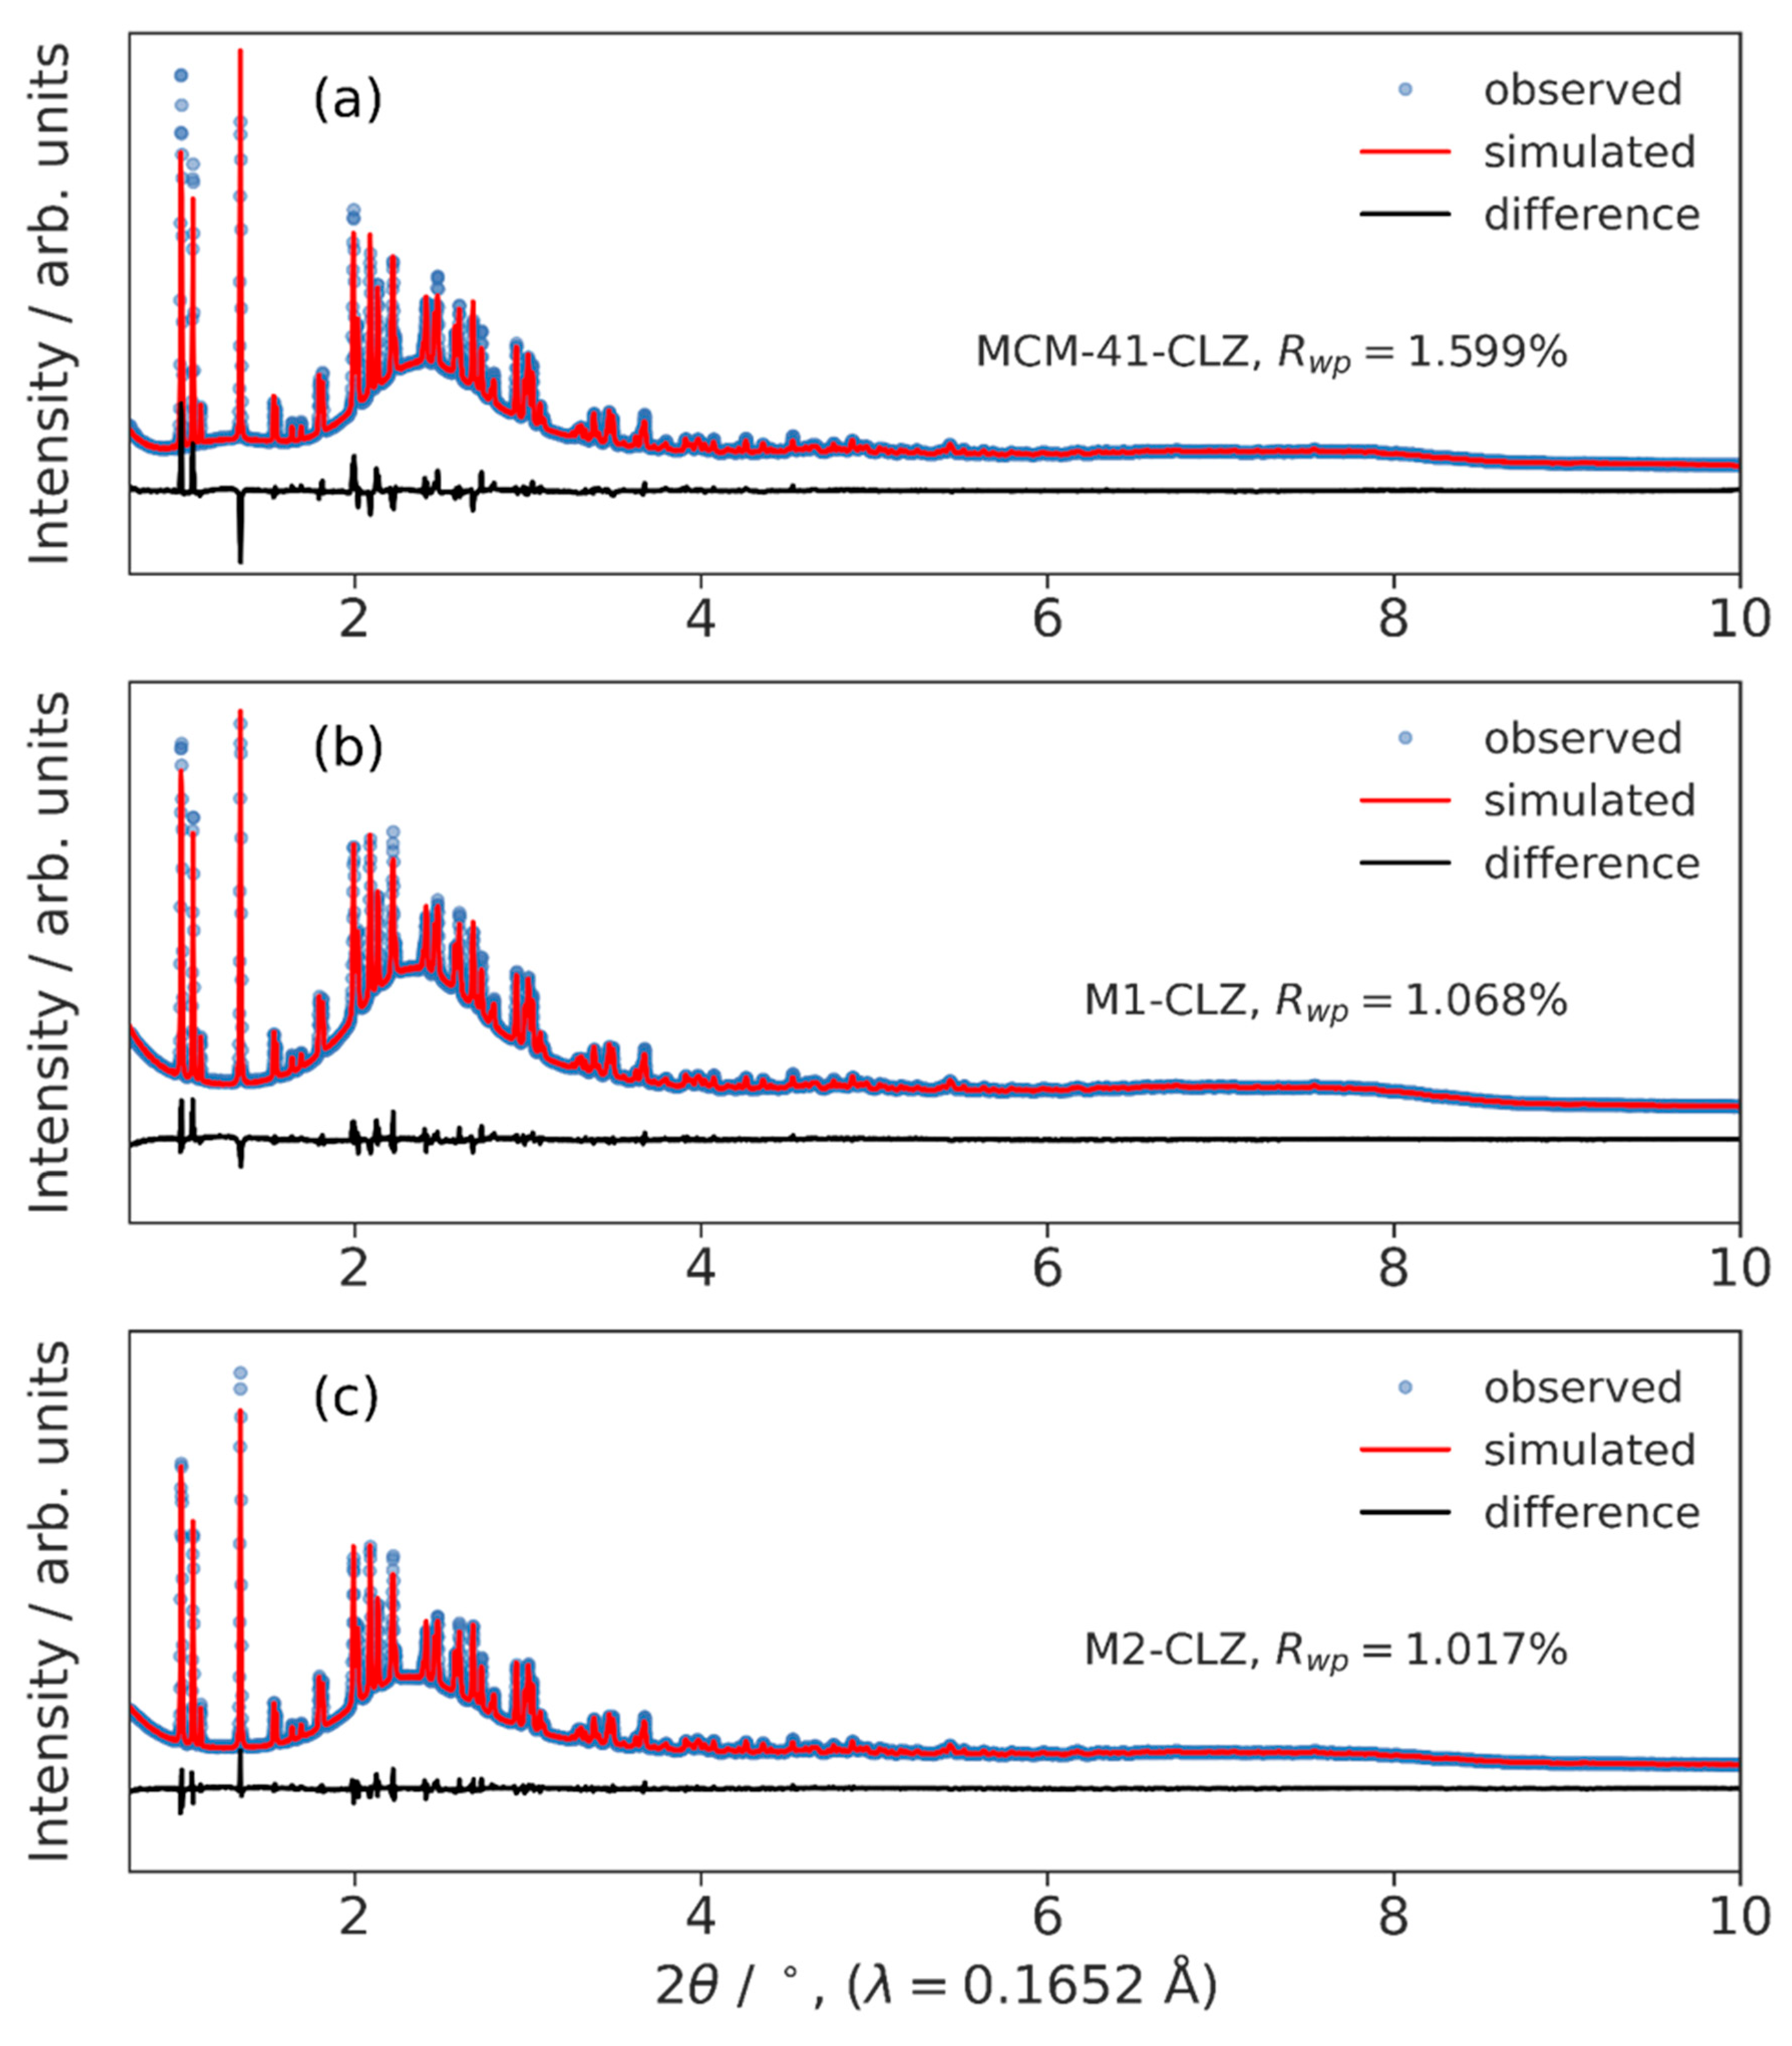
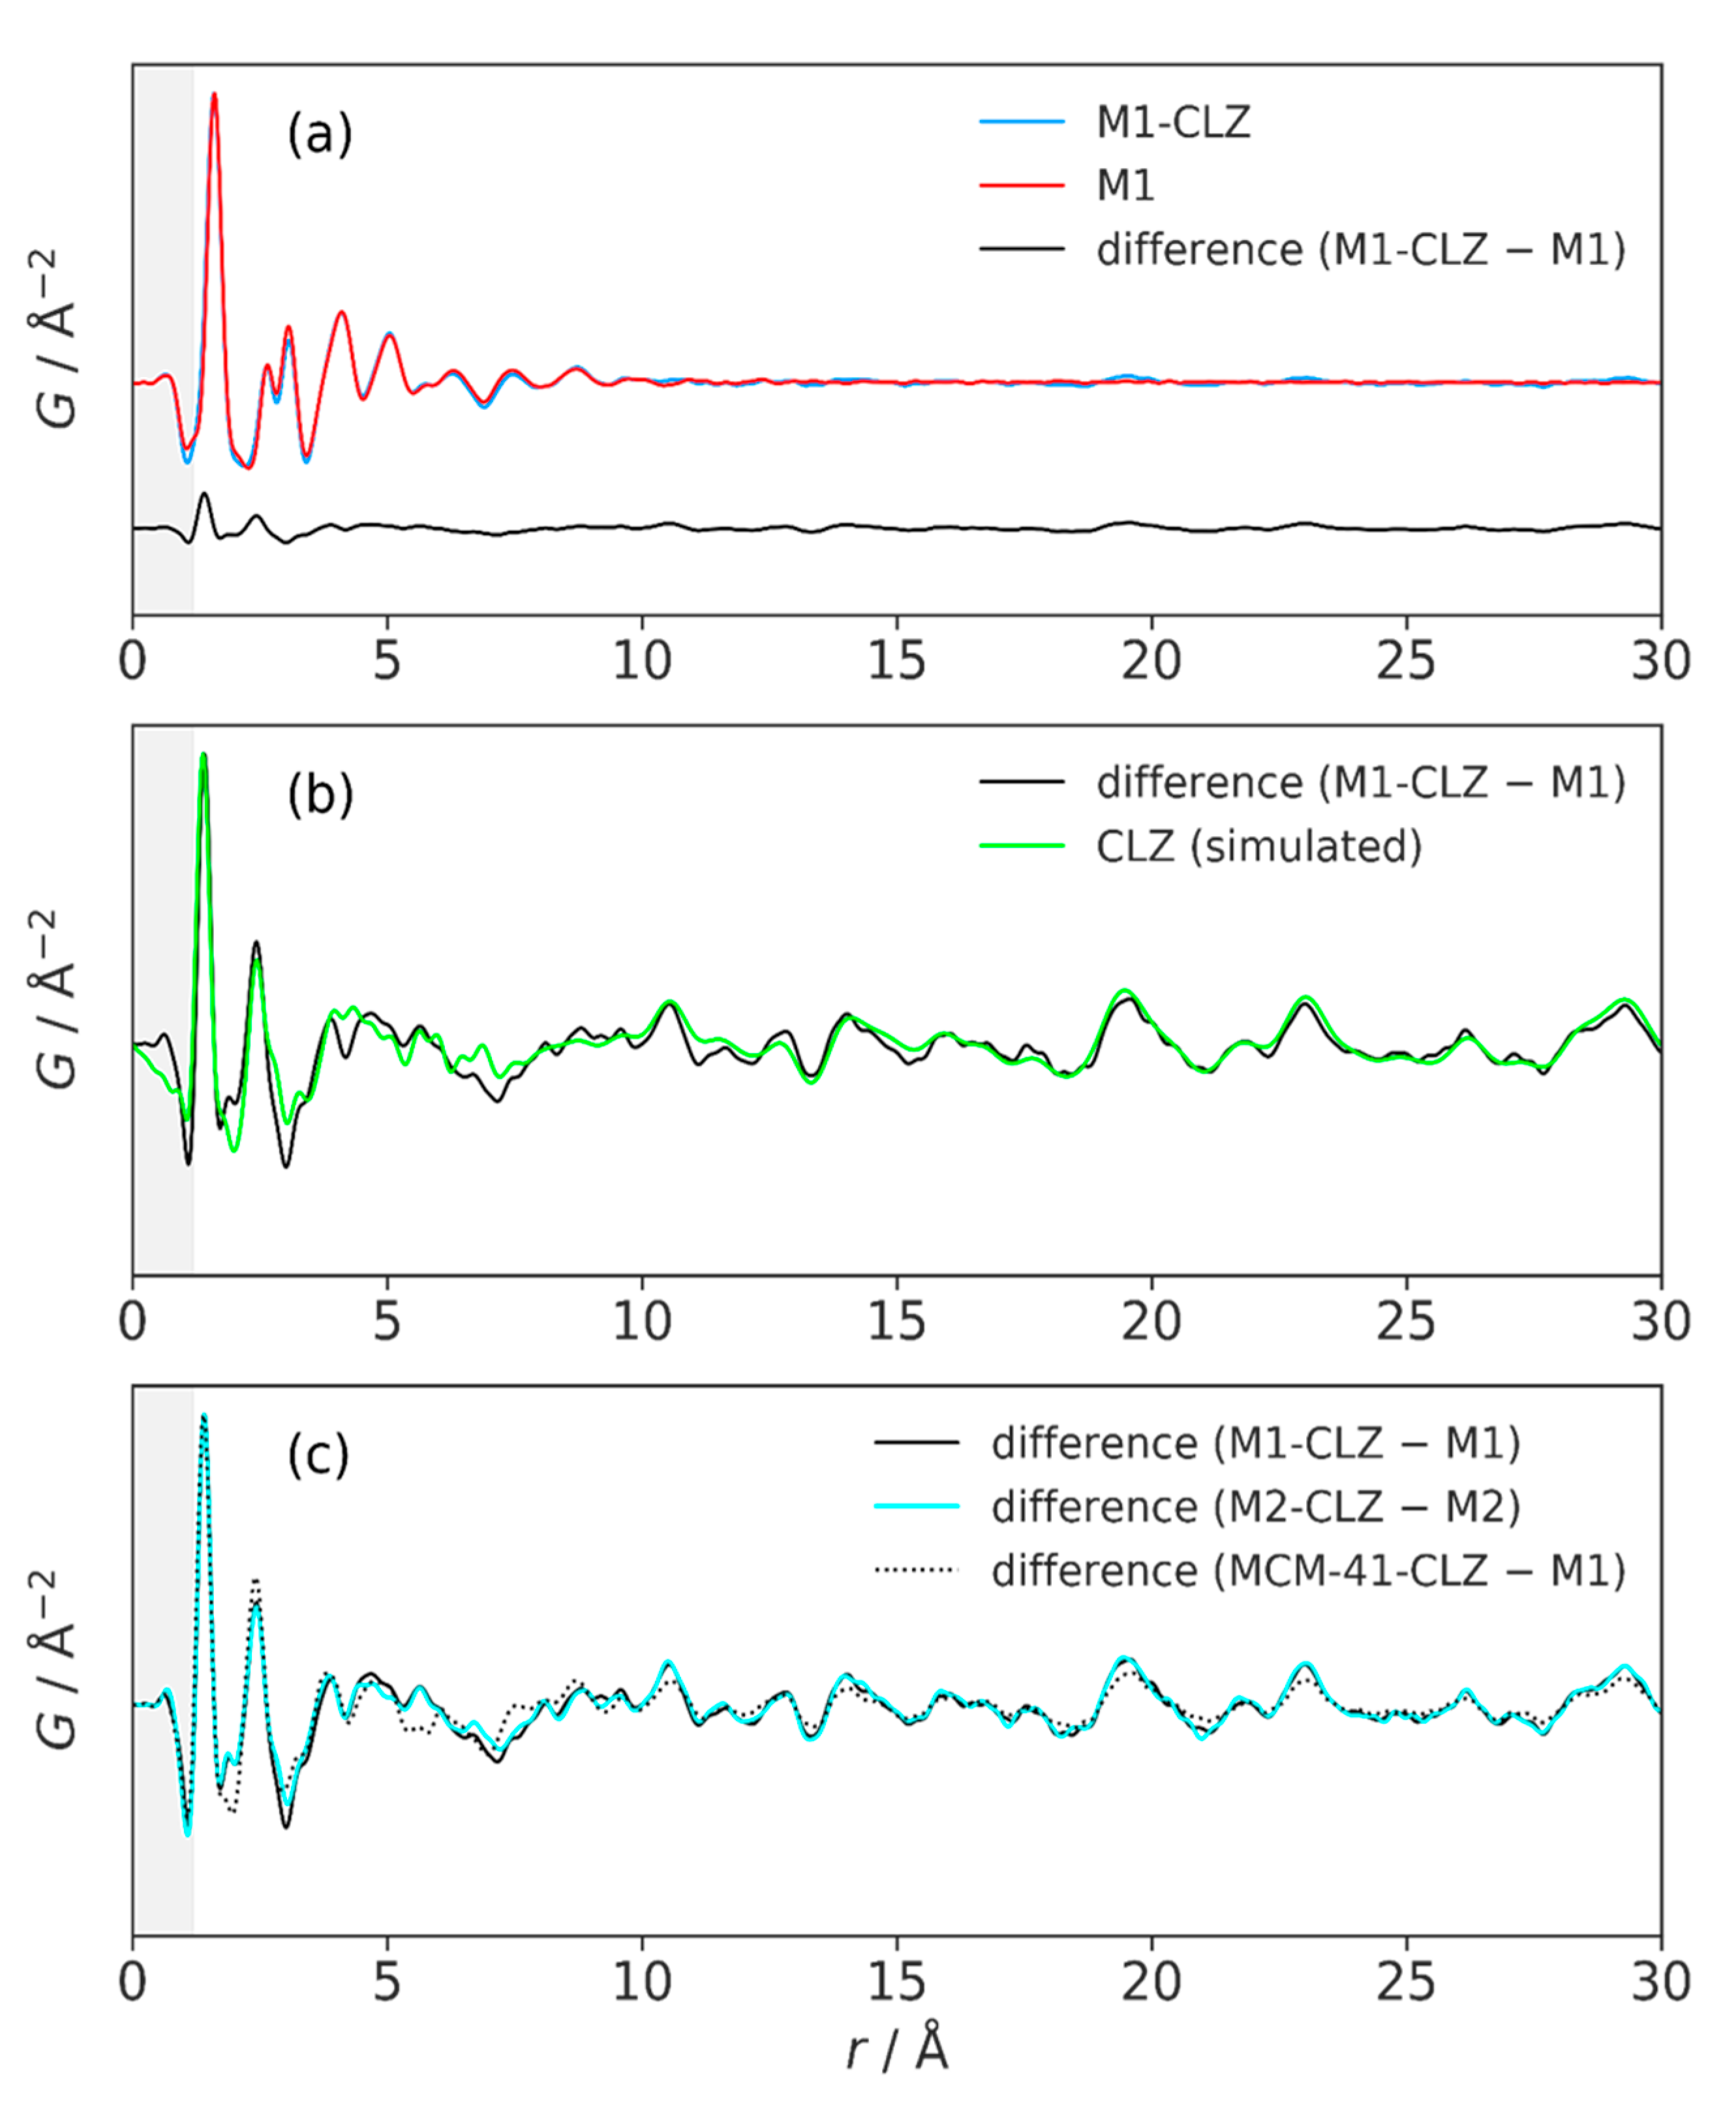
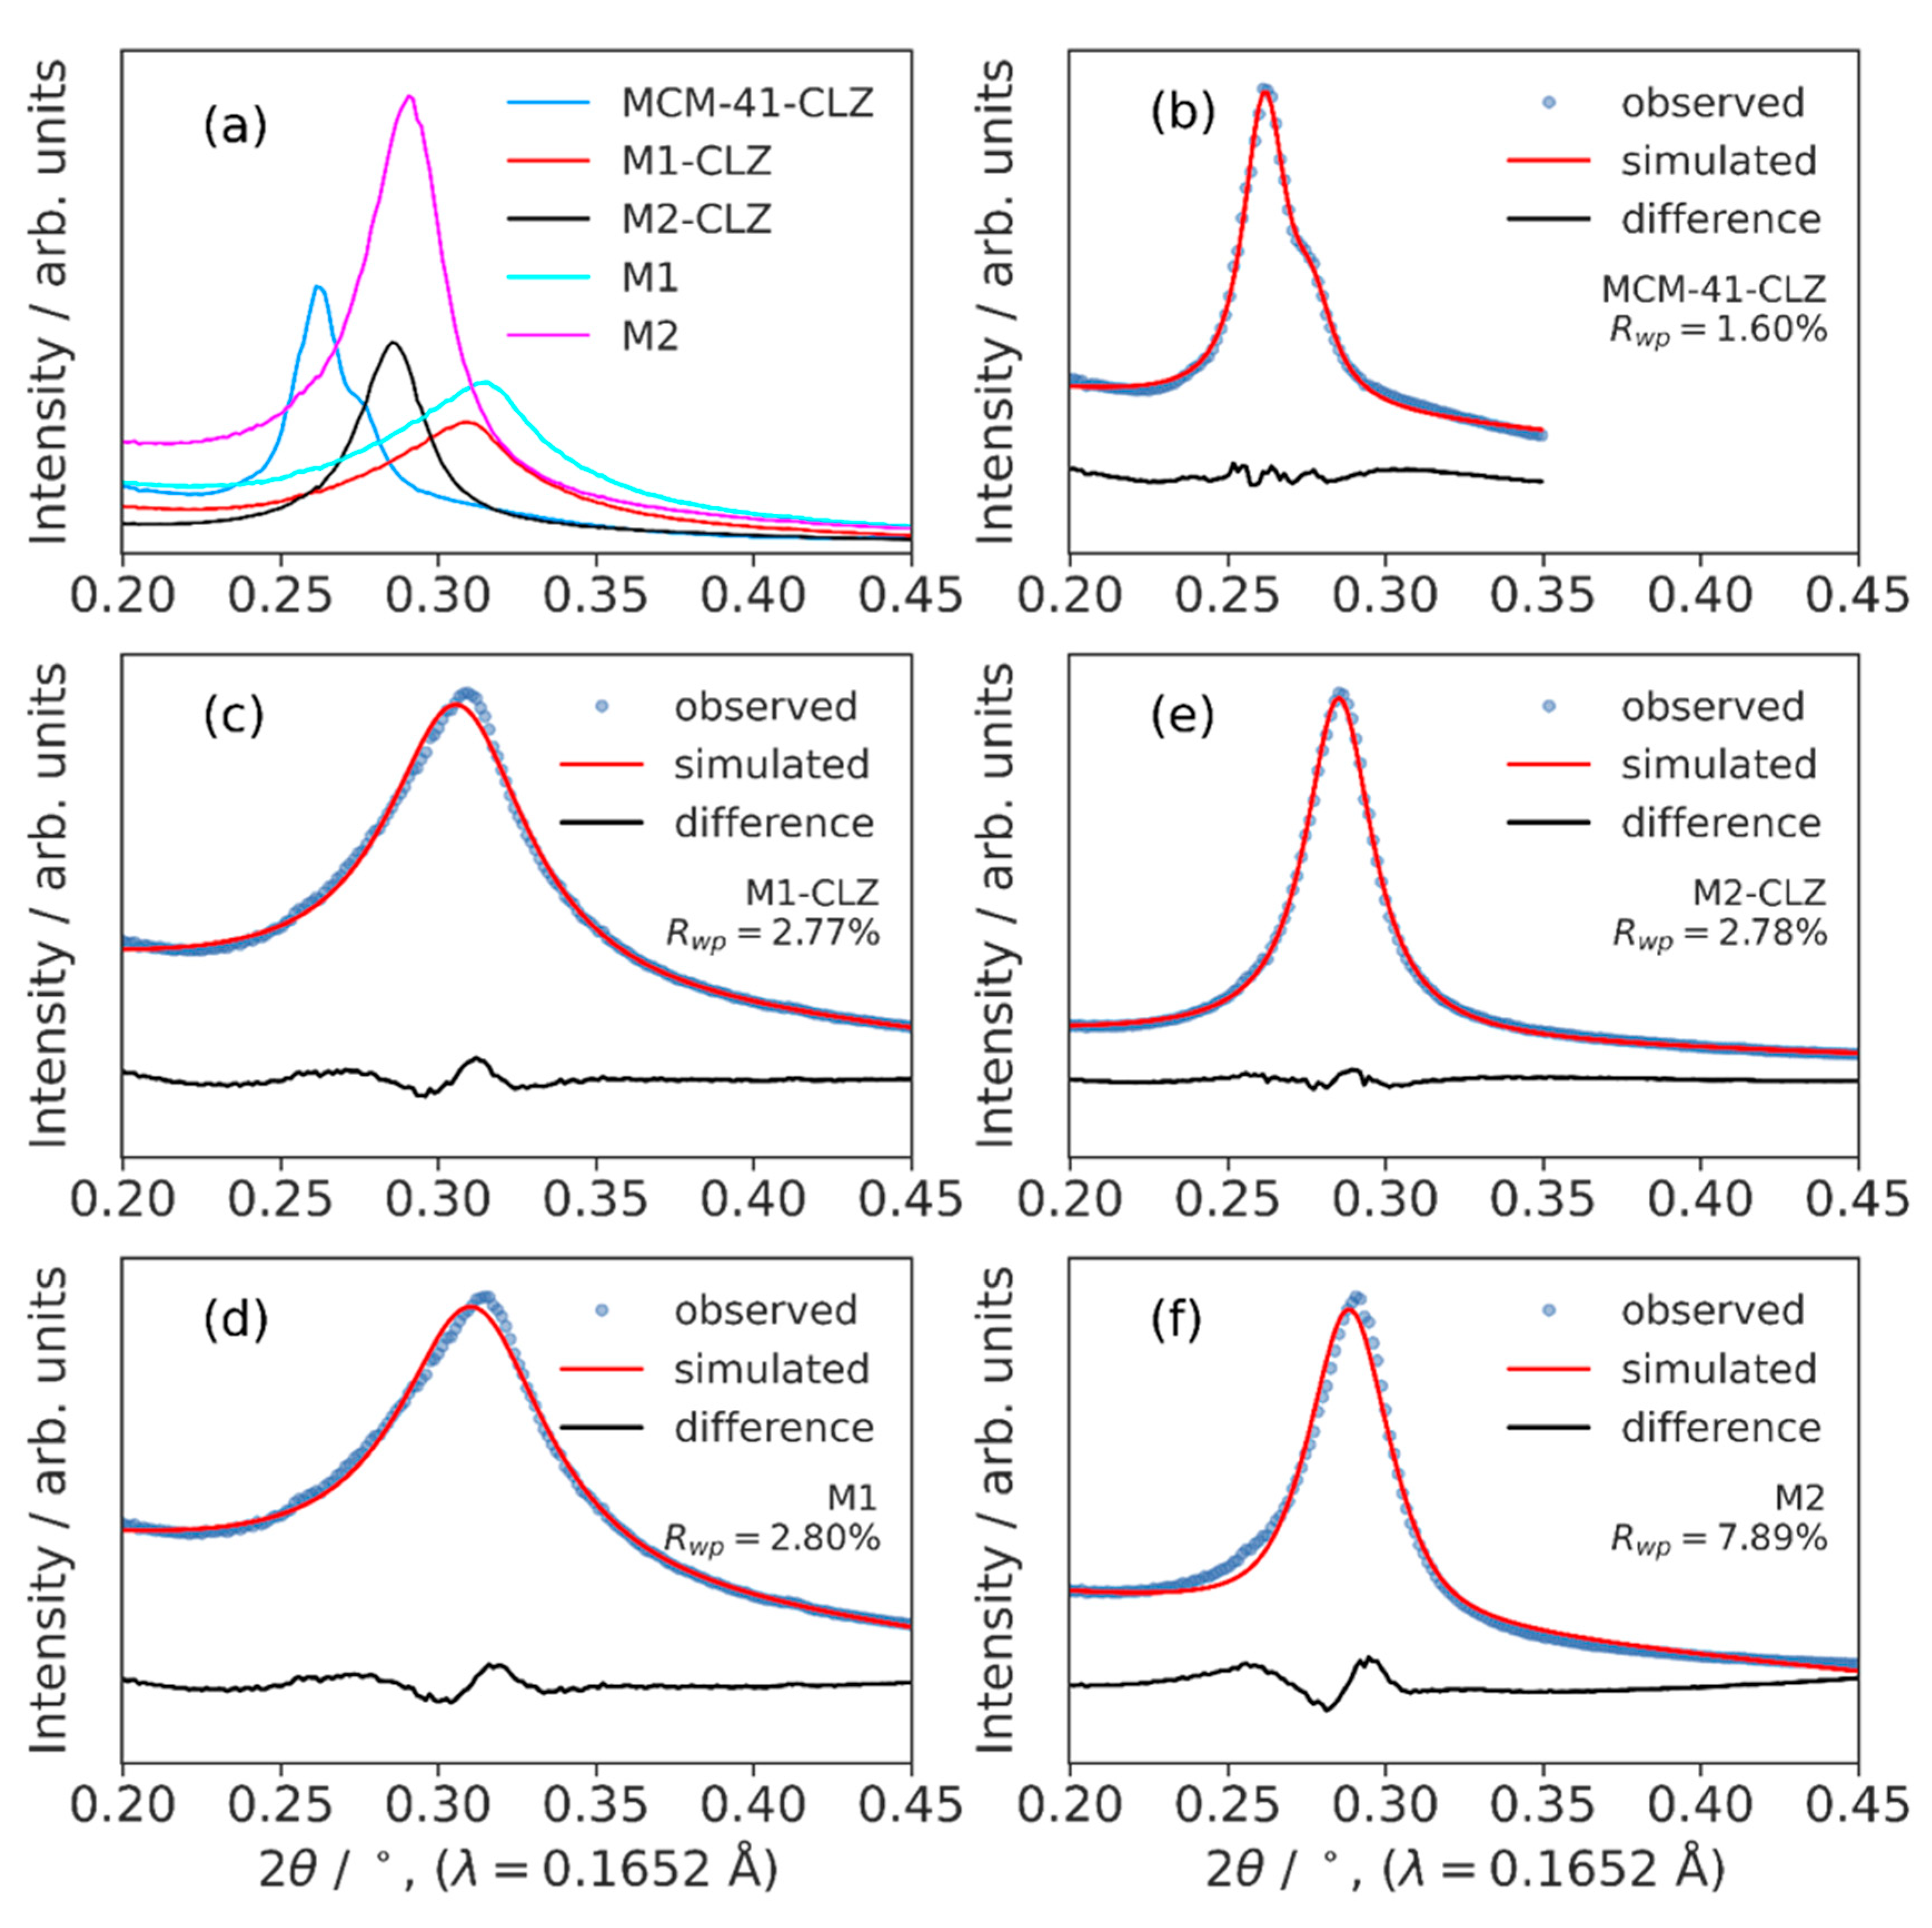
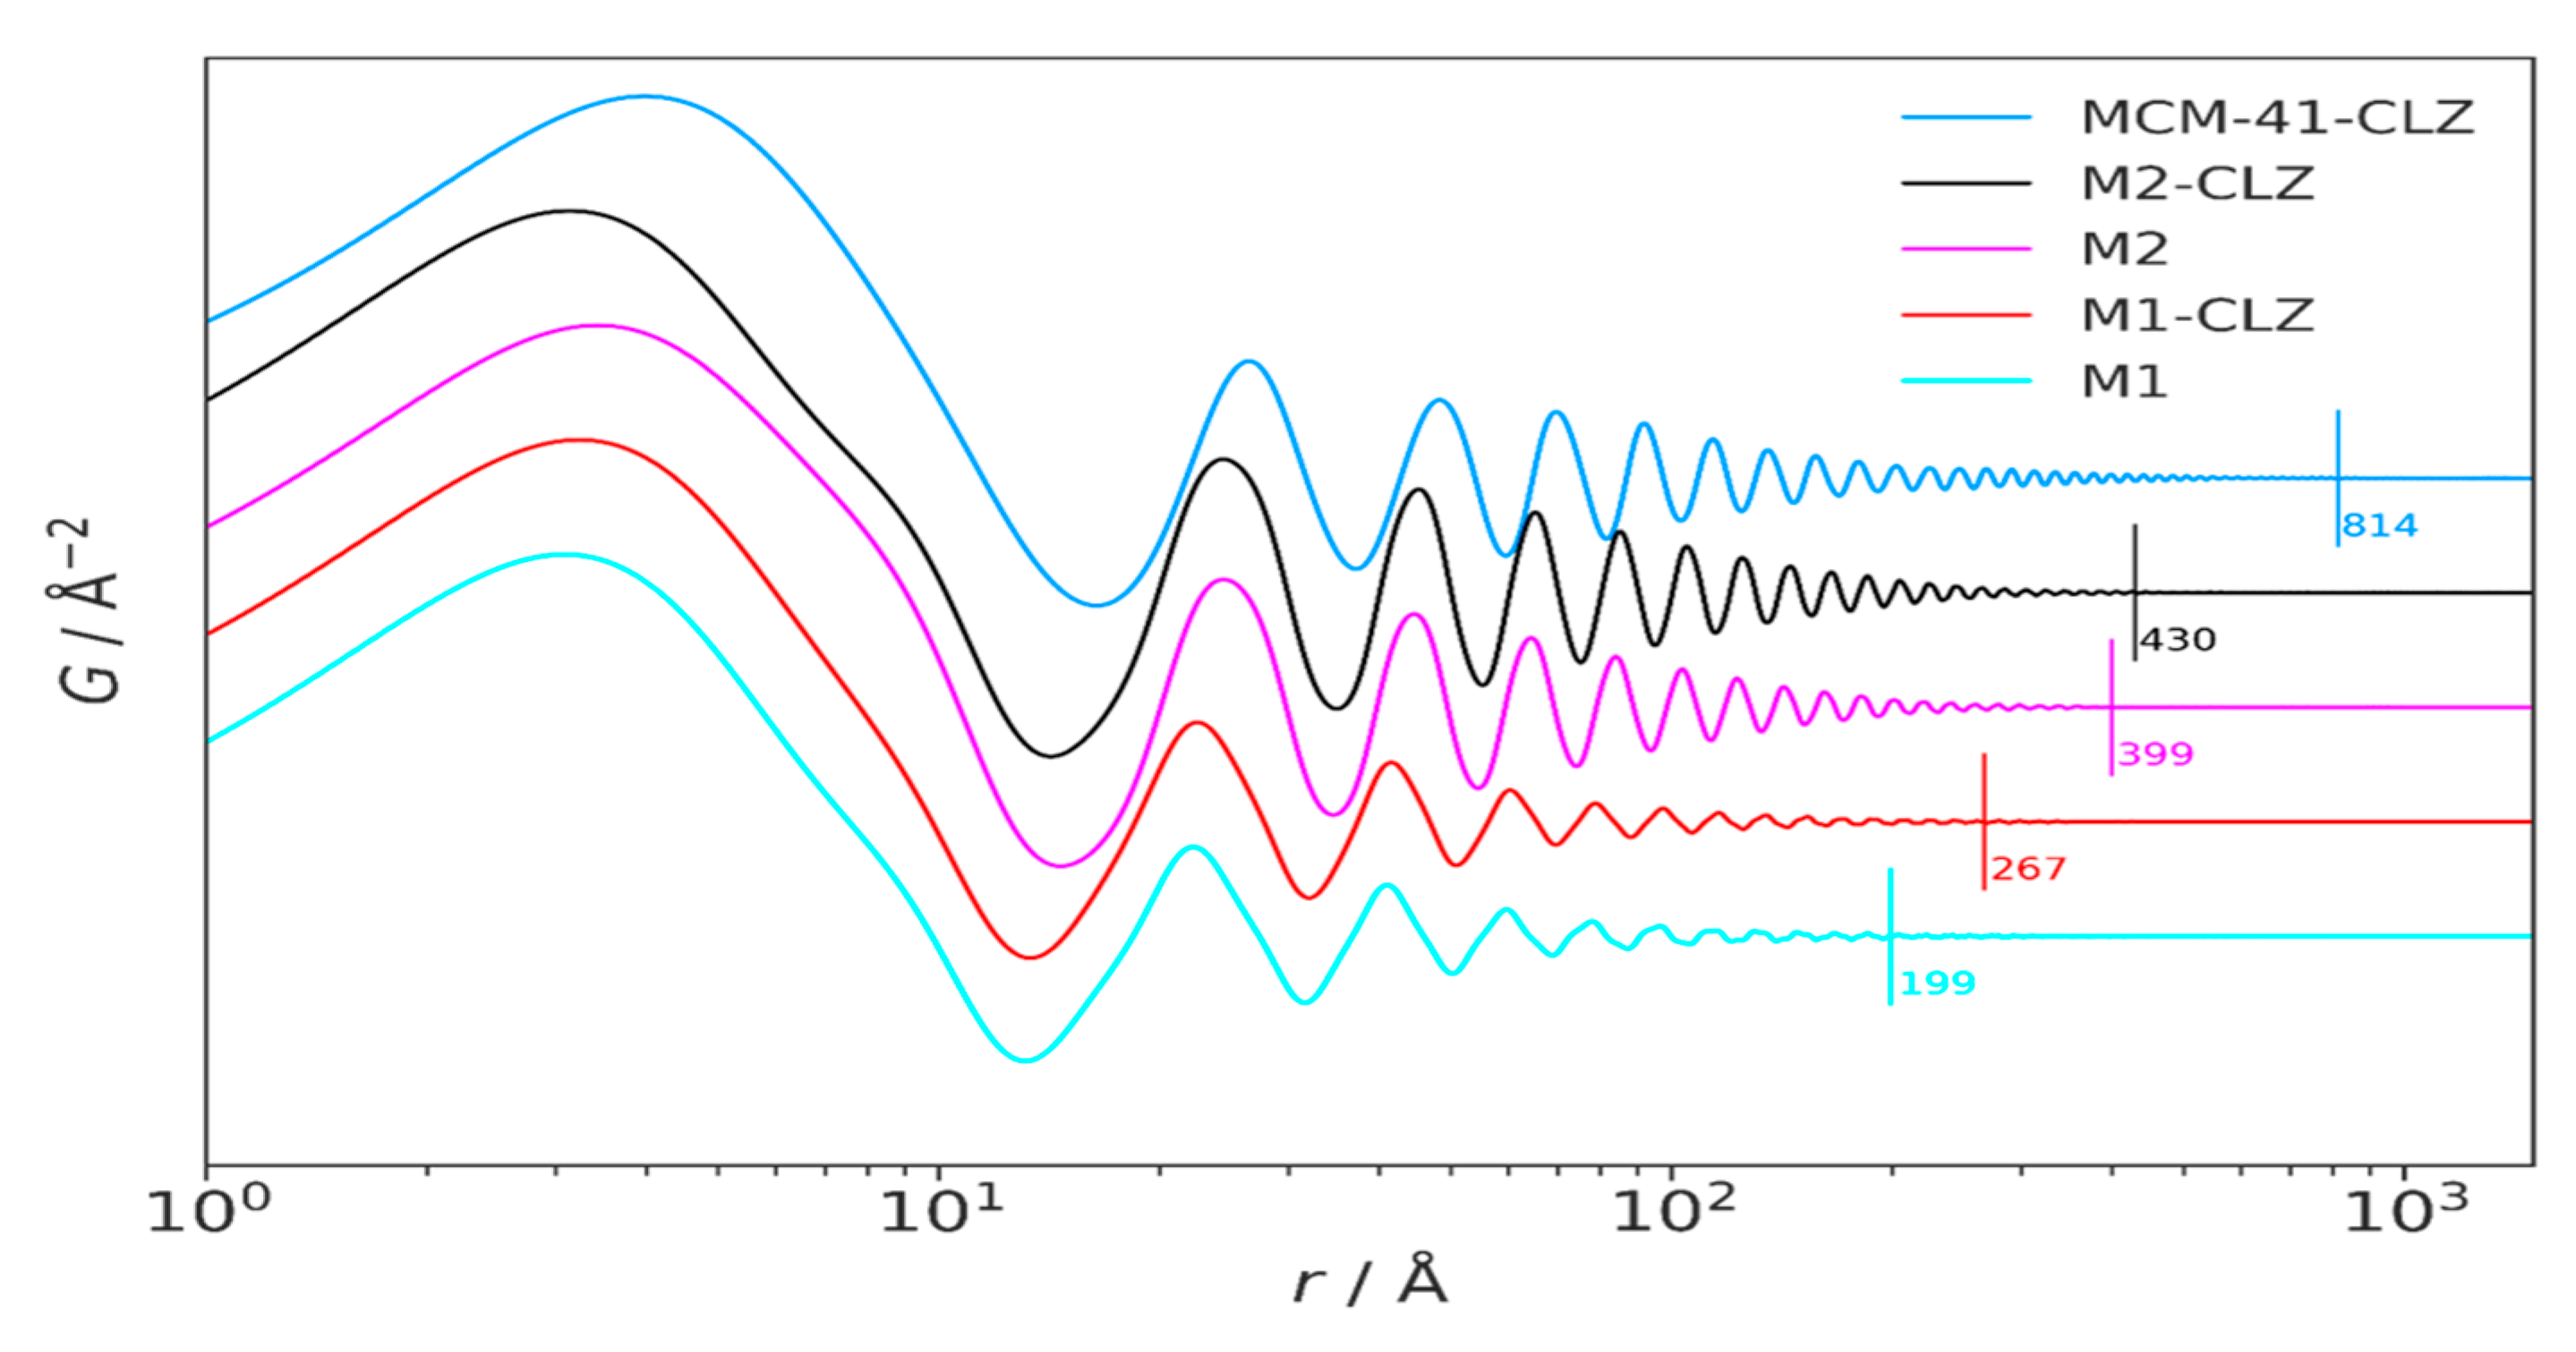
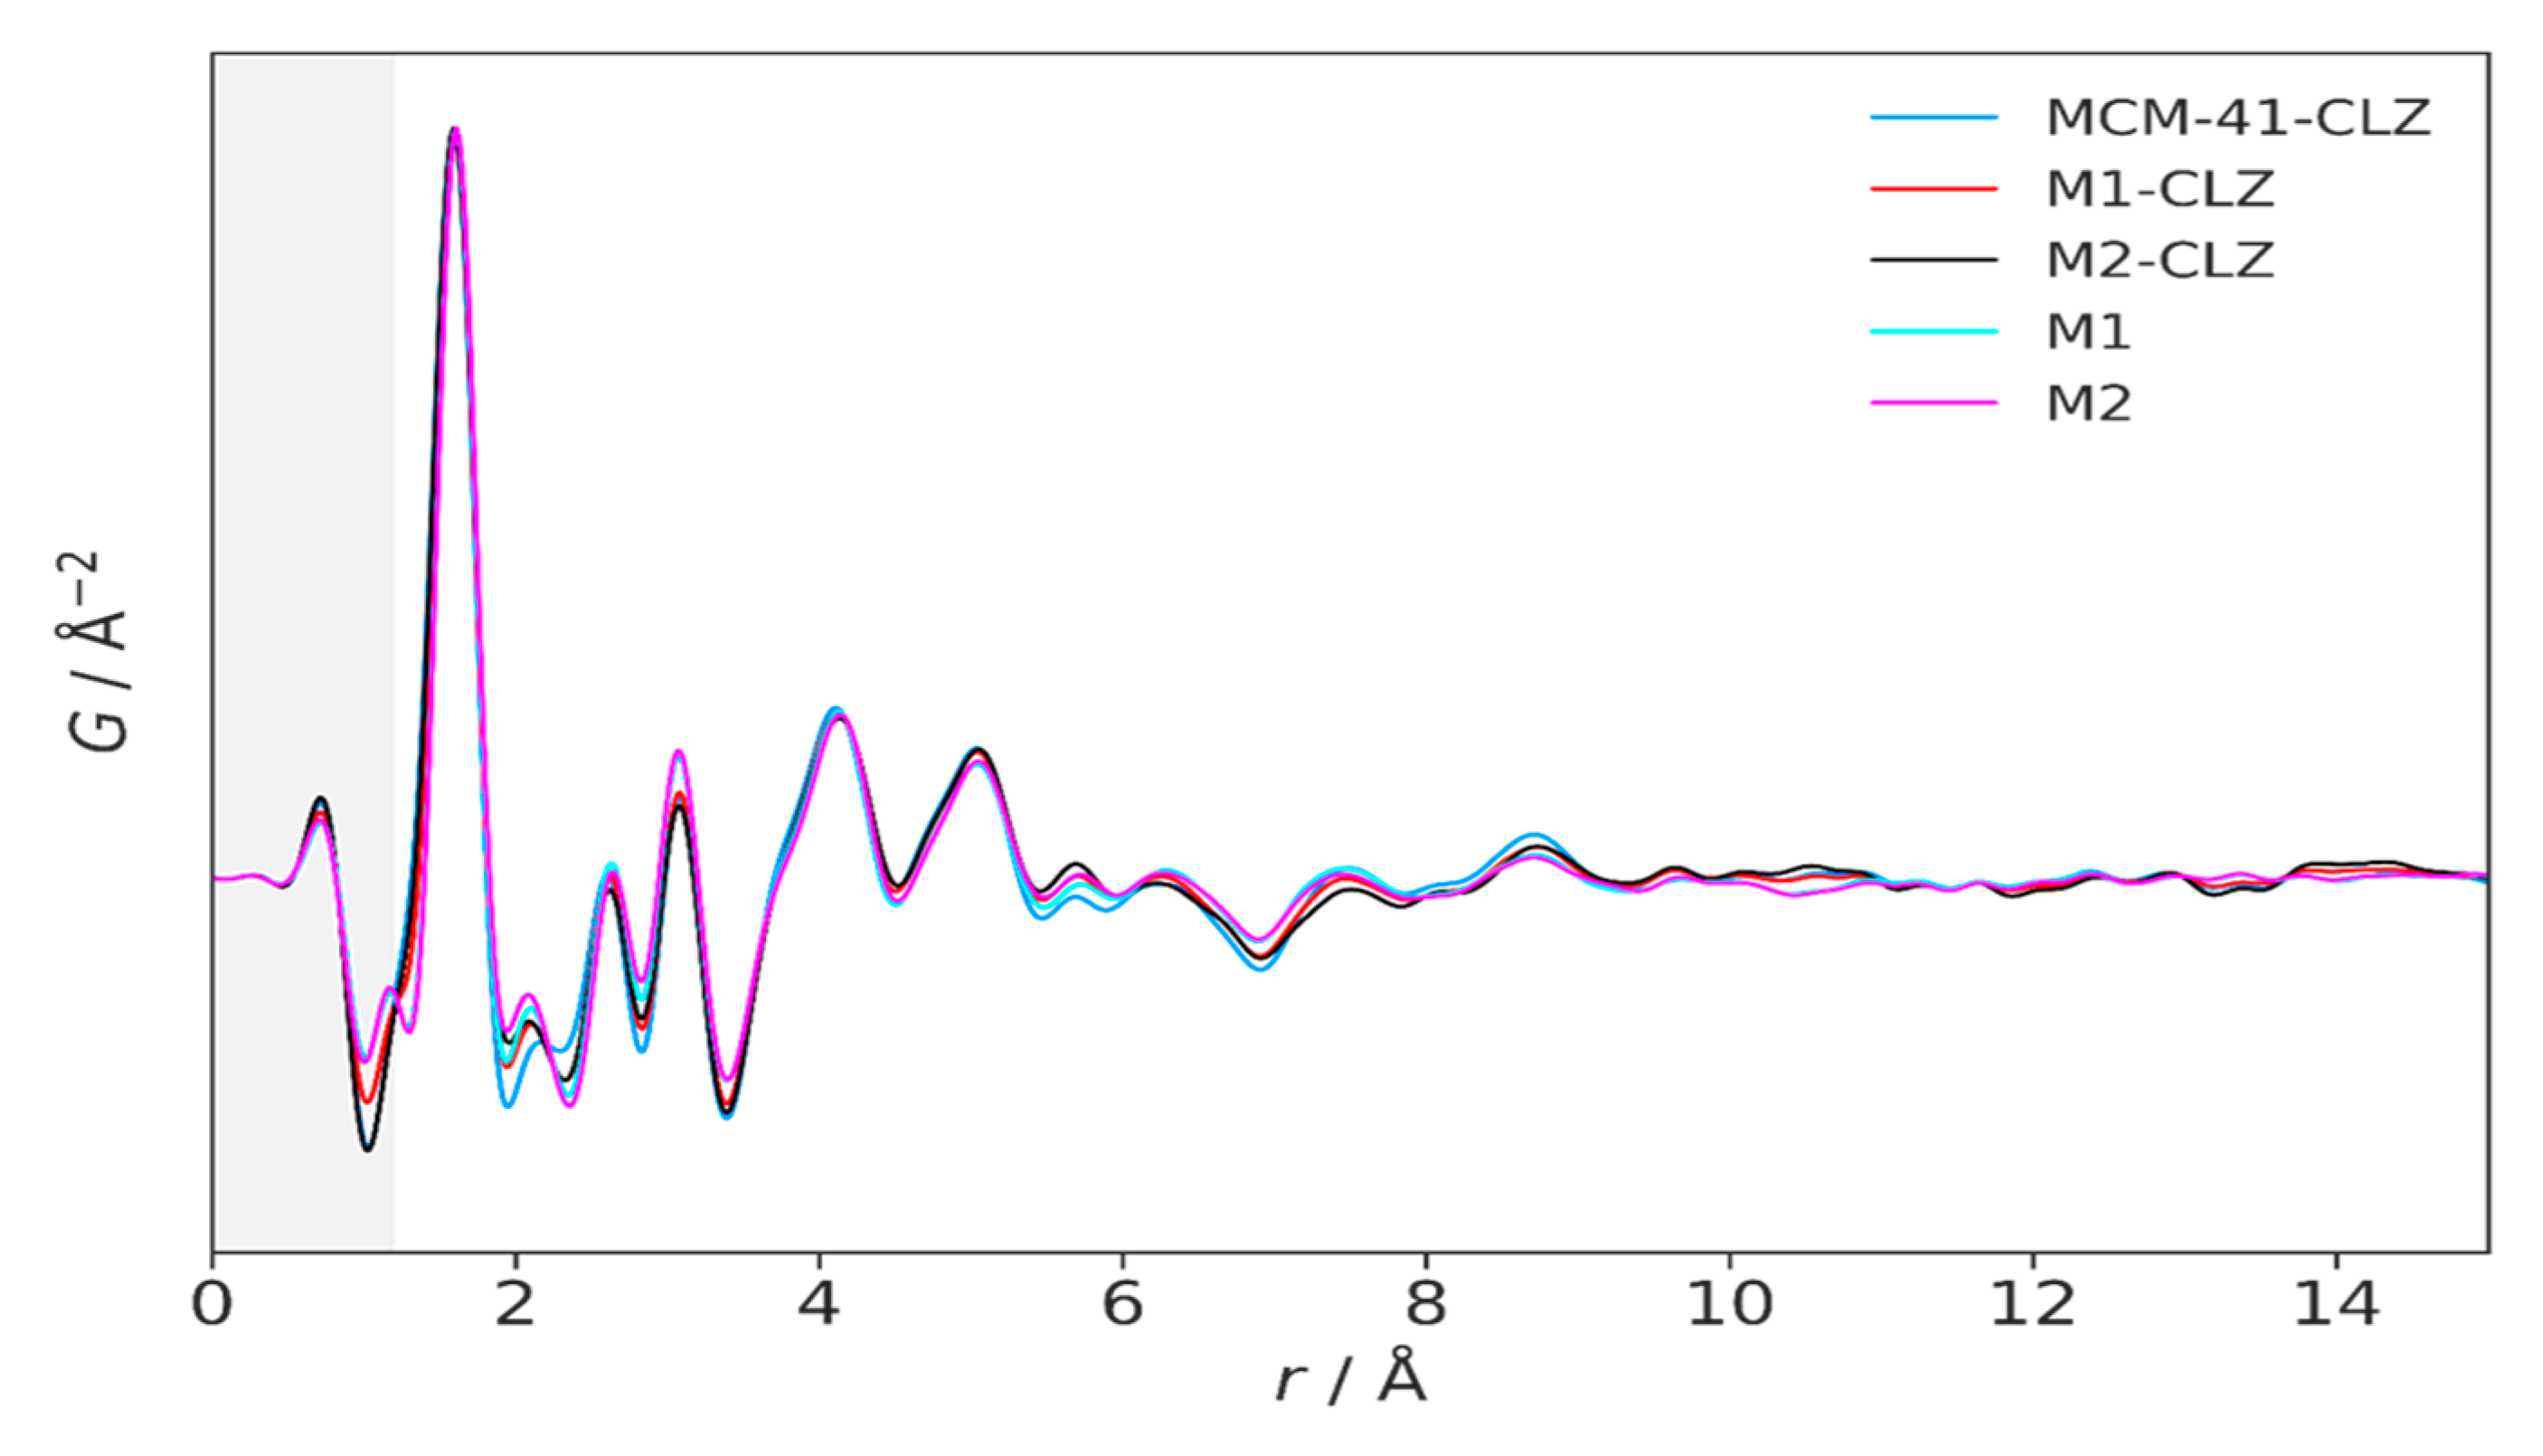
3.3. High-Resolution XRPD and Total Scattering Measurements and the Processed Pair Distribution Functions
3.4. Application of the Obtained Materials as Drug Carriers
4. Discussions
4.1. Sample Synthesis
4.2. Textural Characterization by Nitrogen Sorption Method
4.3. High-Resolution XRPD and Total Scattering Measurements and the Processed Pair Distribution Functions
4.4. Application of the Obtained Materials as Drug Carriers
5. Conclusions
Author Contributions
Funding
Institutional Review Board Statement
Informed Consent Statement
Data Availability Statement
Acknowledgments
Conflicts of Interest
Abbreviations
| CLZ | Chlotrimazole |
| M1 | Mercapto-1-“e” |
| M2 | Mercapto-2-“e” |
| MCM-41 | Simple mesoporous silica |
Appendix A

| Carrier | Loading Efficiency (%) |
| MCM-41-CLZ | 99.87 |
| M1-CLZ-r1 | 99.96 |
| M1-CLZ-r2 | 99.97 |
| M1-CLZ-r3 | 99.97 |
| M2-CLZ-r1 | 99.97 |
| M2-CLZ-r2 | 99.98 |
| M2-CLZ-r3 | 96.7 |
| MCM-41-CLZ-r1 | 97.85 |
| M1-CLZ-r1 | 97.77 |
| MCM-41-CLZ-r2 | 96.92 |
| M1-CLZ-r2 | 98.18 |
| M2-CLZ-r2 | 98.18 |
| CLZ-pure-r1 | |
| CLZ-pure-r2 | - |
| CLZ-pure-r3 | - |
| CLZ-herba caps-r1 | - |
| CLZ-herba caps-r2 | - |
| CLZ-herba caps-r3 | - |
| M1-CLZ-r1 | 98.17 |
| M1-CLZ-r2 | 97.71 |
| M1-CLZ-r3 | 98.63 |
| M2-CLZ-r1 | 99.68 |
| M2-CLZ-r2 | 99.68 |
| M2-CLZ-r3 | 99.68 |
| M1-CLZ-r1 | 87.44 |
| M1-CLZ-r2 | 86.96 |
| M1-CLZ-r3 | 86.1 |
| M2-CLZ-r1 | 13.38 |
| M2-CLZ-r2 | 15.45 |
| M2-CLZ-r3 | 11.96 |
| MCM-41-CLZ | 89.95 |
| M1-CLZ | 94.92 |
| M2-CLZ | 95.51 |
| Kinetic model | Zero Order | First Order | Higuchi | Korsmeyer-Peppas | Hixson–Crowell |
| Applied for the first 5.66 hours of release | |||||
| Rel in acidic buffer | 0.85 | 0.89 | 0.94 | 0.82 | 0.88 |
| Applied for the first hour of release | |||||
| Rel in acidic buffer | 0.99 | 0.98 | 0.85 | 0.7 | 0.98 |
References
- Manca, M.L.; Usach, I.; Peris, J.E.; Ibba, A.; Orrú, G.; Valenti, D.; Escribano-Ferrer, E.; Gomez-Fernandez, J.C.; Aranda, F.J.; Fadda, A.M.; Manconi, M. Optimization of innovative three-dimensionally-structured hybrid vesicles to improve the cutaneous delivery of clotrimazole for the treatment of topical Candidiasis. Pharmaceutics. 2019, 11, 263–280. [Google Scholar] [CrossRef] [PubMed]
- Bolla, P.K.; Meraz, C.A.; Rodriguez, V.A.; Deaguero, I.; Singh, M.; Yellepeddi, V.K.; Renukuntia, J. Clotrimazole loaded ufosomes for topical delivery: formulation development and In-Vitro studies. Molecules. 2019, 24, 3139–3153. [Google Scholar] [CrossRef]
- Deng, R.; Wang, X.; Li, R. Dermatophyte infection: from fungal pathogenicity to host immune responses. Front Immunol. 2023, 14, 1285887. [Google Scholar] [CrossRef]
- Shah, R.M.; Eldridge, D.S.; Palombo, E.A.; Harding, I.H. Encapsulation of clotrimazole into solid lipid nanoparticles by microwave-assisted microemulsion technique. Appl. Mater. Today 2016, 5, 118–127. [Google Scholar] [CrossRef]
- Bongomin, F.; Gago, S.; Oladele, R.O.; Denning, D.W. Global and multi-national prevalence of fungal diseases-estimate precision. J Fungi 2017, 3, 57–85. [Google Scholar] [CrossRef] [PubMed]
- Gupta, M.; Sharma, V.; Chauhan, N.S. Chapter 11—Promising Novel Nanopharmaceuticals for Improving Topical Antifungal Drug Delivery. In: Nano- and Microscale Drug Delivery Systems, Editor: Grumezescu A.M., Elsevier; Amsterdam, The Netherlands: 2017, pp. 197–228.
- Lertsuphotvanit, N.; Tuntarawongsa, S.; Jitrangsri, K.; Phaechamud, T. Clotrimazole-loaded borneol-based in situ forming gel as oral sprays for oropharyngeal candidiasis therapy. Gels 2023, 9, 412–430. [Google Scholar] [CrossRef]
- Gupta, A.K.; Foley, K.A.; Versteeg, S.G. New Antifungal Agents and New Formulations Against Dermatophytes. Mycopathologia 2017, 182, 127–141. [Google Scholar] [CrossRef]
- Ivanov, M.; Ćirić, A.; Stojković, D. Emerging Antifungal Targets and Strategies. Int. J. Mol. Sci. 2022, 23, 2756–2781. [Google Scholar] [CrossRef]
- Grimling, B.; Karolewicz, B.; Nawrot, U.; Włodarczyk, K.; Górniak, A. Physicochemical and Antifungal Properties of Clotrimazole in Combination with High-Molecular-Weight Chitosan as a Multifunctional Excipient. Mar. Drugs 2020, 18, 591–608. [Google Scholar] [CrossRef]
- Jaworska-Krych, D.; Gosecka, M.; Gosecki, M.; Urbaniak, M.; Dzitko, K.; Ciesielska, A.; Wielgus, E.; Kadłubowski, S.; Kozanecki, M. Enhanced Solubility and Bioavailability of Clotrimazole in Aqueous Solutions with Hydrophobized Hyperbranched Polyglycidol for Improved Antifungal Activity. ACS Appl. Mater. Interfaces 2024, 16, 18434–18448. [Google Scholar] [CrossRef] [PubMed]
- StatPearls. Clotrimazole. NCBI Bookshelf. 2023. Available online: https://www.ncbi.nlm.nih.gov/books/NBK560643/ (accessed on Nov 2025).
- Crowley, P.D.; Gallagher, H.C. Clotrimazole as a pharmaceutical: Past, present and future. J. Appl. Microbiol. 2014, 117, 611–617. [Google Scholar] [CrossRef] [PubMed]
- Balata, G.; Mahdi, M.; Bakera, R.A. Improvement of Solubility and Dissolution Properties of Clotrimazole by Solid Dispersions and Inclusion Complexes. Indian J. Pharm. Sci. 2011, 73, 517–526. [Google Scholar] [CrossRef] [PubMed]
- Ravani, L.; Esposito, E.; Bories, C.; Le Moal, V.; Loiseau, P.M.; Djabourov, M.; Cortesi, R.; Bouchemal, K. Clotrimazole-Loaded Nanostructured Lipid Carrier Hydrogels: Thermal Analysis and In Vitro Studies. Int. J. Pharm. 2013, 454, 695–702. [Google Scholar] [CrossRef]
- Vallet-Regí, M.; Schüth, F.; Lozano, D.; Colilla, M.; Manzano, M. Engineering mesoporous silica nanoparticles for drug delivery: where are we after two decades? Chem. Soc. Rev. 2022, 51, 5365–5451. [Google Scholar] [CrossRef] [PubMed]
- Vallet-Regí, M.; Colilla, M.; Izquierdo-Barba, I.; Manzano, M. Mesoporous silica nanoparticles for drug delivery: current insights. Molecules 2018, 23, 47. [Google Scholar] [CrossRef]
- Mohamed, F.; Oo, M.K.; Chatterjee, B.; Alallam, B. Biocompatible Supramolecular Mesoporous Silica Nanoparticles as the Next-Generation Drug Delivery System. Front. Pharmacol. 2022, 13, 886981. [Google Scholar] [CrossRef]
- Trzeciak, K.; Chotera-Ouda, A.; Bak-Sypien, I.I.; Potrzebowski, M.J. Mesoporous Silica Particles as Drug Delivery Systems-The State of the Art in Loading Methods and the Recent Progress in Analytical Techniques for Monitoring These Processes. Pharmaceutics. 2021, 13, 950–992. [Google Scholar] [CrossRef]
- Karaman, D.S.; Patrignani, G.; Rosqvist, E.; Smatt, J.H.; Orlowska, A.; Mustafa, R.; Preis, M.; Rosenholm, J.M. Mesoporous silica nanoparticles facilitating the dissolution of poorly soluble drugs in orodispersible films. Eur. J. Pharm. Sci. 2018, 122, 152–159. [Google Scholar] [CrossRef]
- Gignone, A.; Manna, L.; Ronchetti, S.; Banchero, M.; Onida, B. Incorporation of clotrimazole in Ordered Mesoporous Silica by supercritical CO2. Microporous Mesoporous Mater. 2014, 200, 291–296. [Google Scholar] [CrossRef]
- Gignone, A.; Delle Piane, M.; Corno, M.; Ugliengo, P.; Onida, B. Simulation and Experiment Reveal a Complex Scenario for the Adsorption of an Antifungal Drug in Ordered Mesoporous Silica. J. Phys. Chem. C. 2015, 119, 13068–13079. [Google Scholar] [CrossRef]
- Terban, M.W.; Billinge, S.J.L. Structural analysis of molecular materials using the pair distribution function. Chem. Rev. 2021, 122, 1208–1272. [Google Scholar] [CrossRef]
- Egami, T.; Billinge, S. J. L. Underneath the Bragg peaks: structural analysis of complex materials. Pergamon Press, Elsevier, Oxford, England, 2003, 3-404.
- Ashiotis, G.; Deschildre, A.; Nawaz, Z.; Wright, J. P.; Karkoulis, D.; Picca, F. E.; Kieffer, J. The fast azimuthal integration Python library: pyFAI. J. Appl. Cryst. 2015, 48, 510–519. [Google Scholar] [CrossRef]
- Coelho, A.A. TOPAS and TOPAS-Academic: an optimization program integrating computer algebra and crystallographic objects written in C++. J. Appl. Cryst. 2018, 51, 210–218. [Google Scholar] [CrossRef]
- Marlton, F.; Ivashko, O.; Zimmerman, M.; Gutowski, O.; Dippel, A.C.; Jorgensen, M.R.V. A simple correction for the parallax effect in x-ray pair distribution function measurements. J. Appl. Cryst. 2019, 52, 1072–1076. [Google Scholar] [CrossRef]
- Peterson, P.F.; Božin, E.S.; Proffen, Th. .; Billinge, S.J.L. Improved measures of quality for atomic pair distribution functions. J. Appl. Cryst. 2003, 36, 53–64. [Google Scholar] [CrossRef]
- Billinge, S.J.L.; Farrow, C.L. Towards a robust ad-hoc data correction approach that yields reliable atomic pair distribution functions from powder diffraction data. J. Phys.: Condens. Matter 2013, 25, 454202. [Google Scholar] [CrossRef]
- Juhas, P.; Davis, T.; Farrow, C.L.; Billinge, S.J.L. PDFgetX3: A rapid and highly automatable program for processing powder diffraction data into total scattering pair distribution functions. J. Appl. Cryst. 2013, 46, 560–566. [Google Scholar] [CrossRef]
- Lorch, E. Neutron diffraction by germania, silica and radiation-damaged silica glasses. J. Phys. C: Solid State Phys. 1969, 2, 229–237. [Google Scholar] [CrossRef]
- Zhou, Y.; Quan, G.; Wu, Q.; Zhang, X.; Niu, B.; Wu, B.; Huang, Y.; Pan, X.; Wu, C. Mesoporous silica nanoparticles for drug and gene delivery. Acta Pharm. Sin. B 2018, 8, 165–177. [Google Scholar] [CrossRef]
- Almásy, L.; Putz, A.M.; Tian, Q.; Kopitsa, G.P.; Khamova, T.V.; Barabás, R.; Rigó, M.; Bóta, A.; Wacha, A.; Mirica, M.; Ţăranu, B.; Savii, C. Hybrid Mesoporous Silica with Controlled Drug Release, J. Serb. Chem. Soc. 2019, 84, 1027–1039. [Google Scholar] [CrossRef]
- Al-Oweini, R.; El-Rassy, H. Synthesis and characterization by FTIR spectroscopy of silica aerogels prepared using several Si(OR)4 and R’’Si(OR’)3 precursors. J. Mol. Struct. 2009, 919, 140–145. [Google Scholar] [CrossRef]
- Stanovnik, B.; Tisler, M. Dissociation Constants And Structure Of Ergothioneine. Anal Biochem. 1964, 9, 68–74. [Google Scholar] [CrossRef] [PubMed]
- Cychosz, K.A.; Thommes, M. Progress in the Physisorption Characterization of Nanoporous Gas Storage Materials. Engineering 2018, 4, 559–566. [Google Scholar] [CrossRef]
- Thommes, M.; Kaneko, K.; Neimark, A.V.; Olivier, J.P.; Rodriguez-Reinoso, F.; Rouquerol, J.; Sing, K.S.W. Physisorption of gases, with special reference to the evaluation of surface area and pore size distribution (IUPAC technical report). Pure Appl. Chem. 2015, 87, 1051–1069. [Google Scholar] [CrossRef]
- Shkolnikov, E.I.; Sidorova, E.V.; Malakhov, A.O.; Volkov, V. V.; Julbe, A.; Ayral, A. Estimation of pore size distribution in MCM-41-type silica using a simple desorption technique. Adsorption 2011, 17, 911–918. [Google Scholar] [CrossRef]
- Ahmad, A.L.; Mustafa, N.N.N. Pore surface fractal analysis of palladium-alumina ceramic membrane using Frenkel-Halsey-Hill (FHH) model. J. Colloid Interf. Sci. 2006, 301, 575–584. [Google Scholar] [CrossRef]
- Juhas, P.; Farrow, C.; Yang, X.; Knox, K.; Billinge, S. Complex modeling: a strategy and software program for combining multiple information sources to solve ill posed structure and nanostructure inverse problems. Acta Cryst. 2015, A71, 562–568. [Google Scholar] [CrossRef]
- Gesing, T. M.; Robben, L. Determination of the average crystallite size and the crystallite size distribution: the envelope function approach EnvACS. J. Appl. Cryst. 2024, 57, 1466–1476. [Google Scholar] [CrossRef]
- Agudelo, C.G. Mesoporous silicas for incorporation and release of drugs, Master of Science Thesis, Politecnico di Torino, Torino, 2014. [Google Scholar]
- Santos, S.S.; Lorenzoni, A.; Ferreira, L.M.; Mattiazzi, J.; Adams, A.I.H.; Denardi, L.B.; Alves, S.H.; Schaffazick, S.R.; Cruz, L. Clotrimazole-loaded Eudragit®® RS100 nanocapsules: Preparation, characterization and in vitro evaluation of antifungal activity against Candida species. Mater. Sci. Eng. C 2013, 33, 1389–1394. [Google Scholar] [CrossRef]
- Ghosh, A.; Maity, T.; Kumar, P.; Maiti, S.; Ghosh, S.; Biswas, S. Development and Characterization of Clotrimazole-Loaded Nanostructured Lipid Carriers for Enhanced Topical Delivery. Int. J. Pharm. 2023, 642, 123169. [Google Scholar] [CrossRef]
- Waugh, C.D. Clotrimazole. XPharm Compr. Pharmacol. Ref. 2007, 1–4. [Google Scholar] [CrossRef]
- Ravani, L.; Esposito, E.; Bories, C.; Moal, V.L.-L.; Loiseau, P.M.; Djabourov, M.; Cortesi, R.; Bouchemal, K. Clotrimazole-loaded nanostructured lipid carrier hydrogels: Thermal analysis and in vitro studies. Int. J. Pharm. 2013, 454, 695–702. [Google Scholar] [CrossRef]
- Franks, G.V. Zeta Potentials and Yield Stresses of Silica Suspensions in Concentrated Monovalent Electrolytes: Isoelectric Point Shift and Additional Attraction. J. Colloid. Interface Sci. 2002, 249, 44–51. [Google Scholar] [CrossRef]
- Herman, P.; Percsi, D.; Fodor, T.; Juhasz, L.; Dudas, Z.; Horvath, Z.E.; Ryukhtin, V.; Putz, A.M.; Kalmar, J.; Almasy, L. Selective and high capacity recovery of aqueous Ag(I) by thiol functionalized mesoporous silica sorbent. J. Molec. Liq. 2023, 387, 122598. [Google Scholar] [CrossRef]
- Alam, M.A.; Al-Janoobi, F.I.; Alzahrani, K.A.; Al-Agamy, M.H.; Abdelgalil, A.A.; Al-Mohizea, A.M. In-vitro efficacies of topical microemulsions of clotrimazole and ketoconazole; and in-vivo performance of clotrimazole microemulsion. J. Drug Deliv. Sci. Technol. 2017, 39, 408–416. [Google Scholar] [CrossRef]
- Maheshwari, R.G.S.; Tekade, R.K.; Sharma, P.A.; Darwhekar, G.; Tyagi, A.; Patel, R.P.; Jain, D.K. Ethosomes and ultradeformable liposomes for transdermal delivery of clotrimazole: A comparative assessment. Saudi Pharm. J. 2012, 20, 161–170. [Google Scholar] [CrossRef] [PubMed]
- Ismail, N.B.S.; Narayana, B. Spectrophotometric and spectroscopic studies on charge transfer complexes of the antifungal drug clotrimazole. J. Taibah Univ. Sci. 2017, 11, 710–717. [Google Scholar] [CrossRef]
- Yan, X.; Meng, J.; Hu, X.; Feng, R.; Zhou, M. Synthesis of Thiol-Functionalized Mesoporous Silica Nanoparticles for Adsorption of Hg²⁺ from Aqueous Solution. J. Sol-Gel Sci. Technol. 2019, 89, 617–622. [Google Scholar] [CrossRef]
- Matadamas-Ortiz, A.; Pérez-Robles, J.F.; Reynoso-Camacho, R.; Amaya-Llano, S.L.; Amaro-Reyes, A.; Di Pierro, P.; Regalado-González, C. Effect of Amine, Carboxyl, or Thiol Functionalization of Mesoporous Silica Particles on Their Efficiency as a Quercetin Delivery System in Simulated Gastrointestinal Conditions. Foods 2024, 13, 1208. [Google Scholar] [CrossRef]
- Hudson, S.P.; Padera, R.F.; Langer, R.; Kohane, D.S. The biocompatibility of mesoporous silicates. Biomaterials 2008, 29, 4045–4055. [Google Scholar] [CrossRef] [PubMed]
- Zhang W, Liu H, Qiu X, Zuo F, Wang B. Mesoporous silica nanoparticles as a drug delivery mechanism. Open Life Sci 2024, 19, 20220867. [CrossRef]
- Beck, J.S.; Vartuli, J.C.; Roth, W.J.; Leonowicz, M.E.; Kresge, C.T.; Schmitt, K.D.; Chu, C.T.W.; Olson, D.H.; Sheppard, E.W.; McCullen, S.B. , Higgins, J.B.; Schlenker, J.L. A new family of mesoporous molecular sieves prepared with liquid crystal templates. J. Am. Chem. Soc. 1992, 114, 10834–10843. [Google Scholar] [CrossRef]
- Xu, T.; Cui, K.; Jin, S. Temperature-Driven Structural Evolution during Preparation of MCM-41 Mesoporous Silica. Materials 2024, 17(8), 1711. [Google Scholar] [CrossRef]
- Volitaki, C.; Lewis, A.; Craig, D.Q.M.; Buanz, A. Electrospraying as a Means of Loading Itraconazole into Mesoporous Silica for Enhanced Dissolution. Pharmaceutics 2024, 16, 1102. [Google Scholar] [CrossRef]
- Nemati, A.; Rezaei, H.; Poturcu, K.; Hanaee, J.; Jouyban, A.; Zhao, H.; Rahimpour, E. Effect of Temperature and Propylene Glycol as a Cosolvent on Dissolution of Clotrimazole. Ann. Pharm. Fr. 2023, 81(2), 258–266. [Google Scholar] [CrossRef] [PubMed]
- Lin YP, Chen WC, Cheng CM, Shen Lin Y.P.; Chen W.C.; Cheng C.M.; Shen C.J. Vaginal pH Value for Clinical Diagnosis and Treatment of Common Vaginitis. Diagnostics 2021, 11, 1996. [CrossRef] [PubMed]
| Nr. | Sample name | CTAB (g) | TEOS (mL) | MPTS (mL) |
| 1. | M-1-xero | 2 | 7 | 1 |
| 2. | M-2-xero | 2 | 7 | 2 |
| 3. | M1 | 2 | 7 | 1 |
| 4. | M2 | 2 | 7 | 2 |
| 5. | MCM-41 | 2 | 7 | - |
| Sample | Surface area, m2/g | Micropore Area, m2/g |
BJH ads, nm | BJH des, nm | DFT, nm | Total pore volume, cm3/g | FHH * |
| MCM-41 | 1213 | 0 | 3.42 | 3.44 | 3.54 | 0.81 | 2.46/ 2.81 |
| M1 | 72 | 14 | 3.10 | 3.28 | 2.43 | 0.1 | 2.19/ 2.73 |
| M2 | 16 | 8 | 4.96 | 6.49 | 2.43 | 0.05 | 1.78/ 2.59 |
| Sample/ Refine parameters |
MCM-41-CLZ | M1-CLZ | M2-CLZ |
| a / Å | 8.76234 | 8.76144 | 8.76212 |
| b / Å | 10.55085 | 10.55009 | 10.55059 |
| c / Å | 10.60473 | 10.59867 | 10.59938 |
| ɑ / ° | 114.096 | 114.085 | 114.082 |
| ꞵ / ° | 96.916 | 96.925 | 96.924 |
| γ / ° | 97.582 | 97.594 | 97.601 |
| V / Å3 | 870.54 | 869.90 | 870.07 |
| LVol-IB / nm | 500 | 454 | 442 |
| e0 | 0.000759 | 0.000773 | 0.000751 |
| Rwp / % | 1.59893885 | 1.06836241 | 1.0170491 |
| MCM-41-CLZ | M1-CLZ | M1 | M2-CLZ | M2 | ||
| XRD | dspacing / nm | 24.0 22.7 |
20.6 | 20.2 | 22.1 | 21.8 |
| LVol-IB / nm | 42 | 11 | 10 | 25 | 23 | |
| LVol (0.1% max) / nm | 81 | 27 | 20 | 43 | 40 |
| Carrier-CLZ | Drug used for entrapment (mg) | Loading Solution (10 mL, except three carriers, and it is specified) |
Drug Effectively Entrapped (mg) |
Release buffer/ volume |
Cumulative Drug Release/ release at Tx |
| MCM-41-CLZ | 100.2 | HCl 0.1 N | 99.9 | HCl 0.1 N buffer/ 200 mL |
98.88% (in 1 h) |
| M1- CLZ-r1 |
100 | HCl 0.1 N | 99.866 | HCl 0.1 N buffer/ 200 mL |
14.39% (in 1 h) 45.07% (in 5.66 h) 46.54% (in 23.5 h) |
| M1-CLZ-r2 | 100 | HCl 0.1 N | 99.96 | HCl 0.1 N buffer/ 200 mL |
57.1% (in 23.5 h) |
| M1- CLZ-r3 |
100 | HCl 0.1 N | 99.95 | HCl 0.1 N buffer/ 200 mL |
38.57% (in 23.5 h) |
| M2- CLZ-r1 |
100 | HCl 0.1 N | 99.97 | HCl 0.1 N buffer/ 200 mL |
32.62% (in 23.5 h) |
| M2-CLZ-r2 | 100 | HCl 0.1 N | 99.97 | HCl 0.1 N buffer/ 200 mL |
34.86% (in 23.5 h) |
| M2-CLZ-r3 | 100 | HCl 0.1 N | 99.98 | HCl 0.1 N buffer/ 200 mL |
34.01% (in 23.5 h) |
| MCM-41-CLZ-r1 | 100 | H2O:1,2-propanediol=15:85 | 96.7 | H2O:1,2-propanediol=15:85/ 100 mL |
90.91% (in first 5 minutes) |
| M1-CLZ-r1 | 100 | H2O:1,2-propanediol=15:85 | 97.85 | H2O:1,2-propanediol=15:85/ 100 mL |
99% (in first 5 minutes) |
| MCM-41-CLZ-r2 | 100 | H2O:1,2-propanediol=15:85 | 97.77 | KCl-HCl pH=2/ 900 mL |
59.3%-62.17% (in 3 h and 20 minutes) |
| M1-CLZ-r2 | 100 | H2O:1,2-propanediol=15:85 | 96.92 | KCl-HCl pH=2/ 900 mL |
64.41%-71.42% (in 3 h and 20 minutes) |
| M2-CLZ-r2 | 100 | H2O:1,2-propanediol=15:85 | 98.18 | KCl-HCl pH=2/ 900 mL |
63.88%-67.63% (in 3 h and 20 minutes) |
| CLZ-pure-r1 | 100.3 | - | - | KCl-HCl pH=2/ 900 mL |
97.57%-100% (in 3 h and 20 minutes) |
| CLZ-pure-r2 | 100.5 | - | - | KCl-HCl pH=2/ 900 mL |
94%-100% (in 3 h and 20 minutes) |
| CLZ-pure-r3 | 100.7 | - | - | KCl-HCl pH=2/ 900 mL |
93%-97.63% (in 3 h and 20 minutes) |
| CLZ-herba caps-r1 | 100.5 | - | - | KCl-HCl pH=2/ 900 mL |
5.44%-100% (in 3 h and 20 minutes) |
| CLZ-herba caps-r2 | 100.8 | - | - | KCl-HCl pH=2/ 900 mL |
5.43%-100% (in 3 h and 20 minutes) |
| CLZ-herba caps-r3 | 100.2 | - | - | KCl-HCl pH=2/ 900 mL |
5.57%-100% (in 3 h and 20 minutes) |
| M1-CLZ-r1 | 100.2 | Ethanol | 98.17 | KCl-HCl pH=2/ 900 mL |
8.11%-15.16% (in 3 h and 20 minutes) |
| M1-CLZ-r2 | 100.8 | Ethanol | 97.71 | KCl-HCl pH=2/ 900 mL |
7.19%-15.21% (in 3 h and 20 minutes) |
| M1-CLZ-r3 | 100 | Ethanol | 98.63 | KCl-HCl pH=2/ 900 mL |
6.12%-11.05% (in 3 h and 20 minutes) |
| M2-CLZ-r1 | 100.2 | Ethanol | 99.68 | KCl-HCl pH=2/ 900 mL |
6%-12.38% (in 5.66 h) |
| M2-CLZ-r2 | 100.2 | Ethanol | 99.68 | KCl-HCl pH=2/ 900 mL |
9.6%-15.94% (in 5.66 h) |
| M2-CLZ-r3 | 100.2 | Ethanol | 99.68 | KCl-HCl pH=2/ 900 mL |
5.49%-11.38% (in 5.66 h) |
| M1-CLZ-r1 | 100.5 | KCl-HCl pH=2 | 87.44 | KCl-HCl pH=2/ 900 mL |
67.26%-89.33% (in 3 h and 20 minutes) |
| M1-CLZ-r2 | 100.8 | KCl-HCl pH=2 | 86.96 | KCl-HCl pH=2/ 900 mL |
67.26%-89.33% (in 3 h and 20 minutes) |
| M1-CLZ-r3 | 100.8 | KCl-HCl pH=2 | 86.1 | KCl-HCl pH=2/ 900 mL |
51.44%-91.27% (in 3 h and 20 minutes) |
| M2-CLZ-r1 | 100.6 | KCl-HCl pH=2 50 mL |
13.38 | KCl-HCl pH=2/ 900 mL |
59.86%-90.18% (in 3 h and 20 minutes) |
| M2-CLZ-r2 | 100.7 | KCl-HCl pH=2 50 mL |
15.45 | KCl-HCl pH=2/ 900 mL |
55.45%-80.69% (in 3 h and 20 minutes) |
| M2-CLZ-r3 | 100.7 | KCl-HCl pH=2 50 mL |
11.96 | KCl-HCl pH=2/ 900 mL |
61%-100% (in 3 h and 20 minutes) |
| MCM-41-CLZ | 100.6 |
EtOH | 89.954 | Buffer pH=4.5/ 900 mL |
16.78%-20.1% (in 3 h and 20 minutes) |
| M1-CLZ | 100.7 |
EtOH | 94.917 | Buffer pH=4.5/ 900 mL |
11.88%-15.48% (in 3 h and 20 minutes) |
| M2-CLZ | 100.7 |
EtOH | 96.18 | Buffer pH=4.5/ 900 mL |
12.83%-18.5% (in 3 h and 20 minutes) |
Disclaimer/Publisher’s Note: The statements, opinions and data contained in all publications are solely those of the individual author(s) and contributor(s) and not of MDPI and/or the editor(s). MDPI and/or the editor(s) disclaim responsibility for any injury to people or property resulting from any ideas, methods, instructions or products referred to in the content. |
© 2025 by the authors. Licensee MDPI, Basel, Switzerland. This article is an open access article distributed under the terms and conditions of the Creative Commons Attribution (CC BY) license (http://creativecommons.org/licenses/by/4.0/).


