Submitted:
20 November 2025
Posted:
21 November 2025
You are already at the latest version
Abstract
Respiratory syncytial virus (RSV), a member of genus Orthopneumovirus, is an etiological agent in infant lower respiratory tract infections (LRTIs) producing substantial global morbidity. Here, secretoglobin (Scgb1a1)-derived progenitors play a primary role in triggering innate, inflammatory, and cell state transitions in response to RSV LRTIs. Whether RSV activation of innate signaling in this epithelial sentinel population leads to chronic airway disease is unknown. To understand the role of innate signaling in Scgb1a1-derived progenitors, a model of RSV-post viral disease (PVLD) was developed and studied in the presence or absence of RelA conditional knockout (CKO). In wild type mice, we observed persistence of atypical, differentiation intermediate, alveolar type 2 (aAT2) cells characterized by tumor protein 63 (Trp63), Aquaporin-3 (Aqp3) and Itgb4 expression. Mechanistically, we found the formation of aAT2 population was prevented by RelA CKO. Lineage tracing using Scgb1a1 CreERTM X mTmG mice demonstrated that the Scgb1a1+ populations were precursors to the aAT2 population. Single-cell RNA sequencing (scRNA-seq) showed that RSV-PVLD coordinately upregulates Nuclear Receptor Subfamily 1 Group D (Nr1d1/2), Clock and Basic Helix-Loop-Helix ARNT Like 1 (Bmal) both in the aAT2 cell and its Pdgfra+-mesenchymal niche in a RelA-dependent manner. Systematic analysis of intercellular epithelial-mesenchymal communication in the scRNA-Seq data showed that the clock-dysregulated epithelial-mesenchymal niche produces aberrant Angptl4 expression. We conclude that RSV-PVLD is mediated, at least in part, by RelA signaling in Scgb1a1-derived epithelial progenitors dysregulating an aAT2-PDGFRa epithelial-mesenchymal niche associated with persistent RSV replication, ANGPTL4 signaling and inflammatory clock expression.
Keywords:
post-viral lung disease
; club cell progenitors
; alveolar regeneration
1. Introduction
The Orthopneumovirus, Respiratory syncytial virus (RSV), is an etiological agent in infant lower respiratory tract infections (LRTIs) producing substantial morbidity globally [1], representing the most common cause of pediatric hospitalizations [2]. More importantly, children hospitalized with RSV-LRTI exhibit persistent reductions in lung function, utilize health care resources at greater rates [3,4,5,6], exhibit persistent obstructive airway disease as young adults [7] and are at a 2-fold increased risk of premature death from respiratory disease [5]. Interpreted with the findings that post LRTI show greater incidence of aeroallergen sensitization [3], these findings suggest early life RSV LRTI is associated with structural and immunological remodeling of the airways.
Upon initial infection, RSV replicates throughout the epithelium; as the virus RSV disseminates into the lower airway epithelium, its replication produces mucosal injury, barrier disruption and activation of innate immunity, triggering remodeling pathways [8,9,10]. Because high levels of RSV replication are associated with enhanced disease severity and longer hospitalization in naïve infants [11,12], innate responses of small airway epithelial cells play a critical role in determining disease outcome [13,14,15,16,17,18]. However, the role of the epithelial innate immunity in determining long-term outcomes of RSV LRTI is not fully understood.
In infections involving the lower airway, RSV replication produces ciliated cell sloughing, resulting in disruption of the epithelial surface [9], activating progenitor cell populations to initiate repair. Depending on the location and severity of injury, progenitor cells arise from distinct mesenchymal niches. In the terminal alveoli, alveolar type (AT2) stem cells normally repopulate the AT1, but this population does not repopulate the distal bronchioles [19]. Studies using models of distal small airway injury have identified distinct progenitor populations in the parenchyma that are recruited to expand and repopulate the lower airway and alveoli. These progenitors are derived from a population of secretoglobin (Scgb1a1)-expressing basal cells primarily within the broncho-alveolar duct junction, where they can contribute to ~50% of the distal alveolar population [20]. Spatial transcriptomics and single cell RNA Seq (scRNA-Seq) studies have found that that Scgb1a1+ progenitor cells are maintained in mesenchymal niches engaged in trophic interactions with Platelet-Derived Growth Factor Receptor (PDGFR)a –expressing fibroblasts [21]. These mesenchymal interactions not only maintain “stemness” of progenitor cells, but also participate in their expansion in response to injury [21,22]. The identity and source of progenitor epithelial populations in RSV-induced lung injury are not known.
Previously, we found that the Scgb1a1- expressing progenitor lineage is one of the major sentinel cells that initiate inflammatory responses to RSV infections in the lower airways [23,24]. Here, intracellular RSV replication activates the NFkB/RelA pathway induce secretion of Th2-polarizing chemokines, type I/III interferons (IFN) and mesenchymal growth factors [25,26,27,28,29,30,31]. RelA conditional knockout (CKO) in Scgb1a1 progenitors show significantly reduced neutrophilic inflammation, epithelial-dependent chemokine expression and myofibroblast expansion in response to RSV [23]. These data place RelA signaling in Scgb1a1 progenitors as central to a coordinated innate and inflammatory response to lower airway viral infection. The role of Scgb1a1 progenitors in RSV infection-induced repair and remodeling has not been explored.
Viral infections prior to adult epithelial differentiation produce distinct structural remodeling responses known as post-viral lung disease (PVLD) [32,33,34]. Reasoning that RelA signaling in the Scgb1a1 progenitor cell may play a role in epithelial remodeling in RSV-PVLD, we established a model of RSV-PVLD and investigated the effect of RelA CKO in a mouse model. Here we report that RSV-PVLD reduces gas exchange along with inducing epithelial thickening. To investigate this process further, scRNA-Seq was utilized which shows that RSV induces an accumulation of atypical alveolar type 2 (aAT2) cells expressing Tumor related protein (TRP63+) and Integrin (ITG)a6b4, characteristic of differentiation-intermediate transitional cells [20]. Furthermore, lineage tracing of Scgb1a1-derived progenitors using GFP tagging shows that RSV infection induces this population to appear in the alveolar parenchyma that express TRP63+ cells and exhibit persistent RSV glycoprotein expression. Differential gene expression analysis later confirmed that RSV-PVLD disrupts an aAT2 epithelial-PDGFRa+ mesenchymal niche through upregulation of inflammatory clock genes. Using probabilistic cell-cell communication inference, we infer that RSV disrupts trophic mesenchymal-epithelial signaling pathways, including an angiopoietin-like (ANGPTL) pathway. This data provides new mechanistic insights into the role of innate epithelial signaling in RSV PVLD by identifying the Scgb1a1 progenitor as a target for persistent RSV replication and dysregulated inflammatory clock gene expression.
2. Materials and Methods
2.1. Acute RSV Infection
Experiments were conducted using a protocol approved by the UW Institutional Animal Care and Use Committee (IACUC) with a 12-hour light and 12-hour dark cycle. 7-8 week old Scgb1a1-CreERTM X RelAfl/fl in the C57BL6/J background were mock infected (PBS) or infected with RSV (intranasally, 107 PFU; mice of both sexes were used). Scgb1a1-CreERTM X RelAfl/fl mice in the absence of treatment are fully RelA wild type. Mice were euthanized after 4 d wherein tissue and BALF were collected.
2.2. RSV-PVLD
Experiments were conducted using protocol approved by the UW Institutional Animal Care and Use Committee (IACUC) with a 12-hour light and 12-hour dark cycle. Time of RSV-infection and Tamoxifen were at ZT8 while euthanasia was at ZT4. Scgb1a1-CreERTM X RelAfl/fl mice (homozygous) are deficient in RelA with tamoxifen (TMX) administration. Cell lineage tracing was conducted using Scgb1a1 CreERTM X mTmG mice that exhibits a wild type RelA response along with Scgb1a1 progenitor tracing with GFP. In both the Scgb1a1-Cre ERTM X RelAfl/fl and Scgb1a1 CreERTM X mTmG mice, at day 0, animals were Mock (PBS) or RSV-infected 3-5 weeks after birth (intranasally, 107 PFU). Three days post-infection, mice were randomized into corn oil (10% ethanol and 90% corn oil; Oil) or tamoxifen (TMX) treatment (20 mg/kg/d i.p.; Sigma Aldrich, St. Louis, MO; T5648; RelA CKO) for 10 doses. For the Scgb1a1 CreERTM X mTmG mice, all animals received TMX. Animals were then rested for an additional week (21d post-RSV infection) before oxygen saturation (MouseOx® Plus, Starr Life Sciences Corp., Oakmont, PA) were measured and then mice were euthanized and tissue and BALF were collected.
2.3. Quantitative Real-Time PCR
Total RNA from the left lung was extracted and cDNA was prepared using LunaScript RT SuperMix Kit (New England Biolabs, MA) as previously described [25]. Gene specific primers used are in Supplemental Table S1. Relative changes in gene expression were quantified relative to control Gadph transcripts using the ΔΔCt method.
2.4. Immunohistochemistry
Right mouse lungs were frozen fixed in OCT (Optimal Cutting Temperature, Tissue-Tek® Sakura) Using 95% ethanol and 100% acetone, tissue was fixed to the slide before blocking with goat-serum (1:1000; Invitrogen). Sections were incubated with a primary antibody (Supplementary Table S2) overnight, washed, and stained with the appropriate secondary for 1 hr. Slides were mounted using ProLong™ Gold Antifade containing DAPI (ThermoFisher Scientific; P36935). Images were acquired on an ECHO Revolve R4 Microscope (ECHO, San Diego, CA). Hematoxylin–eosin stain (H&E) was performed by the university TRIP laboratory (Translational Research Initiatives in Pathology) core services.
2.5. Quantitation of Airway Features
Airway thickness was determined on hematoxylin and eosin (H&E) stains by taking 5 random points around the airway and averaging the distance from the inner to outer edge (Supplementary Figure S1). Five airways from each animal were taken and averaged to calculate the thickness from a 20X image.
2.6. Single Cell RNA Sequencing (scRNA-Seq)
scRNA-seq libraries were constructed according to the Chromium NextGEM Fixed RNA Profiling Reagent Kits user guide (10x Genomics). Cells frozen in 10X Genomics Quenching Buffer were thawed and resuspended in 0.5X PBS with 0.02% BSA. The total cell number was quantified on the Luna-FX7 automated cell counter (Logos Biosystems, Anyang, South Korea) using acridine orange/propidium iodide stain. Aliquots of less than two million cells were used as input for the probe hybridization reaction and incubated at 42 ºC overnight. Following incubation, subsets of four samples with unique probe barcodes were pooled and washed in 10X Genomics Post-Hyb Wash Buffer. Samples were filtered through 30 μm Celltrics filters (Sysmex, Kobe, Japan) and the appropriate volume of cells was loaded onto a Single Cell Chip Q (Supplementary Table S3). The GEMs were transferred to emulsion safe strip tubes for the cell and UMI barcoding reaction using an Eppendorf MasterCycler Pro thermocycler (Eppendorf, Hamburg, Germany). After the GEM incubation, the barcoded probe products were amplified by PCR. A portion of the amplified probe products was put into a second PCR reaction to add unique dual indexes to each library. The final libraries were quantified on the Qubit v4 fluorometer (ThermoFisher Scientific) and profiled on the Agilent 4200 Tapestation (Agilent Technologies, Santa Clara, CA). These libraries were sequenced on a NovaSeq X+ sequencer with paired-end, 150bp sequencing. Data was processed with bcl2fastq.
2.7. scRNA Seq Analysis
STAR (version 2.5.2a) was used for mapping. Reads were aligned to the mm10 reference genome, excluding barcodes with <200 detected genes. The numbers of cells in each library are shown in Supplementary Table S2. QA/QC processing showed that >90-93% of the sequencing reads were within cells, indicating negligible ambient RNA contamination (Supplementary Table S4). Cells with >10% mitochondrial reads, and >5000 UMIs were filtered from further analysis. Downstream analysis was in ScanPy (Python). Doublets were identified and removed using nearest-neighbor classifier (Scrublet) [35]. Batch effects were corrected using SciV. Counts were normalized to median total counts, log transformed and PCA clustered. Highly variable genes were identified using Seurat [36]. Nearest neighbor clustering was using Leiden. Cell annotation followed best practices [37] manually validated using PanglaoDB [38]. Differential gene expression was using pseudobulk correcting for multiple hypothesis using moderated estimation in DESEQ2 [39].
2.8. Statistical Analysis
Two-way Analysis of Variance (ANOVA) with Tukey’s post-hoc test was utilized for analyses of mouse groups. All other data were analyzed using Student’s t-test (to compare two conditions) or one-Way ANOVA with Sidák multiple comparison. Kaplan-Meyer curve was analyzed using Log-rank (Mantel Cox). For all analyses, p < 0.05 was considered statistically significant.
3. Results
3.1. Acute RSV Infection Induces Phenotypic Changes in Distal Airway and Alveolus
In the lower airway, RSV replicates in ciliated epithelial cells initiating innate responses and cell sloughing resulting in airway obstruction [40]. To determine this effect in vivo, mice in the C57BL6/J strain were acutely infected with RSV intranasally. The C57BL6/J stain was selected because this strain exhibits a robust remodeling response driven by innate, and Th1 immunity [41]. Four days later, at the peak of RSV transcription (Figure 1A), mice were euthanized. Similarly RSV infection induced a 30-fold ± 7.9-fold (P<0.01, n=4) population of CD68+ macrophages had infiltrated the airspaces, confirming the host response to infection (Figure 1B,C). Examination of the small airways showed an abundant population of ciliated of acetyl Tubulin+ ciliated epithelial cells in the Mock-infected mice (Figure 1D). By striking contrast, the population of ciliated epithelial cells was reduced in the RSV-infected mice to ~70% (P<0.05, n=4; Figure 1D, E). These data confirm that acute RSV infection depletes ciliated cells of the lower airway.
We next examined the alveolar airspaces. A robust staining of surfactant protein c (SPC)+ AT2 cells was seen both in Mock and RSV-infected mice (Figure 1F). By contrast, a striking 1.9 ± 0.1-fold upregulation of the AT1 marker, podoplanin (Pdpn), was observed in the parenchyma of the RSV-infected mice (P<0.05, n=4; Figure 1F). This change in alveolar cell phenotype was further associated with a significant reduction in the expression of the ITGb4 adhesion protein (Figure 1F, G), whose loss is associated alveolar inflammation and barrier disruption [42,43]. At higher magnification of merged cell images, we noted the presence of SPC and PDPN co-expressing cells (Figure 1H), suggesting RSV induces a population of alveolar differentiation intermediate cells, previously noted in more severe models of bleomycin and influenza virus-induced airway injury [20,44].
3.2. RSV-PVLD Induces Bronchiolar and Alveolar Remodeling
To explore this phenomenon further and determine the mechanistic role of epithelial intrinsic immunity on progenitor expansion in RSV LRTI, we established a PVLD model, where immature (3 week old) homozygous for Scgb1a1Cre recombinase (CreERTM) X RelAfl/fl mice in the C57BL6/J background [25,26] were Mock-treated (PBS) or infected with RSV (Figure 2A). Mice were then randomized to vehicle (Corn Oil) or tamoxifen (TMX) treatment, the latter to induce RelA CKO after the resolution of acute infection (for simplicity in the following section, we refer to corn oil-treated mice as “WT mice” and TMX-treated mice as “RelA CKO”). Mice infected with RSV in both TMX or Oil-treated groups showed reduced weight gain in comparison to Mock treated controls (P<0.01, n=5-6; Figure 2B).
To confirm RelA CKO was successful, RelA mRNA was measured, where TMX treated mice expressed RelA mRNA at 22% that of Oil-treated mice (0.22 ± 0.11 vs 1 ± 1.1-fold; P<0.01, n=5; Figure 1C). By contrast, a 9.1 ± 5.3-fold increase in RelA mRNA expression was seen in RSV-infected WT mice that was significantly reduced by TMX treatment to 2.9 ± 2.8-fold in RSV-infected RelA CKO mice (n=5, P<0.05; Figure 2C). We also observed RSV-F mRNA was persistently detectable in RSV-infected RelA WT mice with an induction of 129 ± 158-fold relative to mock-treatment, suggesting a persistent, low-level of RSV replication (Figure 2D). Interestingly, this level of RSV transcription was reduced in RSV-infected RelA CKO mice, suggesting that RelA activation in Scgb1a1 progenitors was required for viral latency (Figure 2D). To establish whether RSV affected pulmonary gas exchange, resting O2 saturation was measured by collar oximeter. In the mock-infected WT mice, ambient O2 saturation (Sat) was 99 ± 0.3%, whereas O2 Sat in RSV-PVLD in WT mice was significantly reduced to 97 ± 0.3%, and RelA CKO restored ambient O2 saturation to 99 ± 0.1 % (P<0.05, n=5-6, Figure 2E).
H&E staining was performed to better understand the effect of RSV PVLD on structural remodeling and lung architecture. A detailed examination of small bronchioles showed no obvious enhancement of mucous metaplasia or leukocytic infiltration (Figure 3A). Specifically, we noted that the histology of the mock-infected WT mice was indistinguishable from that of mock-infected RelA CKO mice (Figure 3A). However, we did notice an increase in epithelial thickness in the small bronchioles in RSV-infected WT mice that was reduced in the RSV-infected RelA CKO mice. To quantitate this feature, bronchiolar thickness was measured radially around the perimeter of each bronchiole (See Supplementary Figure S2 for further detail). In mock-infected WT mice, the small bronchiolar thickness was 14.6 ± 1.2 mm which was increased to 20.4 ± 4.2 mm in RSV-infected WT mice (P=0.012, n=5, Figure 2B). By contrast, bronchiolar thickness was reduced in the RSV-infected RelA CKO mice where the bronchiolar thickness was measured at 13.7 ± 2.5 mm (P<0.003, n=5, Figure 3B). These data indicated that RSV-PVLD induced changes in small airway epithelium in a RelA-dependent manner.
3.3. Expansion of Alveolar Progenitor Epithelial Populations in RSV-PVLD
To better characterize the epithelial atypia, we stained for the presence of reparative progenitor cell markers. We first analyzed expression of the small membrane transporter, aquaporin 3 (Aqp3), a marker of acute lung injury associated with epithelial proliferation and migration [45]. In WT mice, we observed that RSV infection produced a significant 6.5 ± 2.6-fold increase of Aqp3 mRNA in lung (P<0.01, n=4; Figure 4A). This induction was significantly reduced to 1.8 ± 1.1-fold in the RSV-infected RelA CKOs (P<0.01, n=4; Figure 4A). To examine the tissue distribution of AQP3, immunofluorescence microscopy (IFM) was conducted, where increased AQP3 staining was observed in the membrane in small bronchioles, in the basal cell layer, and throughout the alveoli (Figure 4B). Quantitation of the IFM staining confirmed a 4.5-fold increased AQP3 immunofluorescent signal in RSV-infected WT mice that was normalized by RelA CKO (P<0.01, n=4; Figure 4C).
We next quantitated tumor related protein 63 (Trp63), a marker of alveolar progenitors responsible for repopulating the alveolus in response to bleomycin injury [46] and influenza H1N1 infection [20]. We found RSV induced a 2.9 ± 1.2-fold increase of Trp63 mRNA in RSV-infected WT mice (P<0.01, n=4) that was significantly reduced in both mock-infected and RSV-infected RelA CKO mice (P<0.01, n=4; Figure 4D). By IFM, TRP63 was not identified in mock or RSV-infected bronchioles, consistent with other reports [47]. However, we did observe an increase in TRP63 immunostaining in a patchy distribution throughout the alveolar parenchyma in RSV-infected WT mice. This pattern was reduced in the RSV-infected RelA CKO (Figures 4E, F), indicating TRP63 expression in Scgb1a1+ progenitors is downstream of RelA.
To further explore this finding, we examined the expression of ITG-a6 and b4 isoforms We were particularly interest in this measurement because the expression of ITG is TRP63-dependent, and would therefore serve as a marker of functional TRP63 activity [48,49]. We found that RSV induced Itga6 mRNA by 3.7 ± 1.2-fold in RSV-infected WT mice (n=4, P<0.01, Supplemental Figure S2), an induction blocked by RelA CKO (Supplemental Figure S2). In striking contrast to that seen in the acute RSV infection, 5-fold upregulation of Itgb4 mRNA was observed (Supplemental Figure S2). Collectively these data indicate that RelA signaling in Scgb1a1+ precursors is required for expansion of the AQP3+/TRP63+/ITGa6+ epithelial cell progenitors in distal airways in RSV-PVLD.
3.4. scRNA Sequence Analysis of RSV-PVLD Shows Atypical AT2 Populations
To provide greater insight into this coordinated multi-cellular injury-repair process, we conducted scRNA-seq of the RSV-PVLD model. Left lungs from n=4 replicates of each treatment were subjected to 10X Genomics Flex 3’ sRNA sequencing. After QA/QC processing showing that the libraries had 92.7 ± 0.8% fractions of reads mapped to cells, indicating the scRNA libraries had negligible ambient RNA contamination (Supplementary Table S3), an integrated dataset of 104K cells X 14.5K genes was generated. Thirty-five distinct cell types could be resolved based on expression of unique cell signature markers. In WT mice, RSV expectedly induced significant shifts in atypical AT2 cells, B cell and NK populations (Supplementary Figure S3).
Reasoning that expansion of epithelial progenitors in RSV-PVLD was due, in part, to activation of the mesenchymal-epithelial niche controlling epithelial progenitor expansion, we focused the remaining study on determining effects of RSV infection on the epithelial-mesenchymal niche. To accomplish this, the data set was filtered for epithelial and mesenchymal gene signatures and subjected to leiden nearest-neighbor clustering. 32 transcriptionally distinct cellular populations that were assigned based on majority voting of highly expressed markers and manual validation. These groups include a heterogeneous group of surfactant (Sfpt)-c+/Advanced Glycosylation End-Product Specific Receptor (Ager)+ atypical AT2 (aAT2) cells, Lysozyme (Lyz)1+ AT2 cells, proliferating Mki67+ AT2 cells, keratin 8 (Krt8)+/Scgb1a1+ Club cells, AT1 cells, Pdgfra+ fibroblasts, Lgr6+ myofibroblasts, Itgb4+ progenitors (Prog) and hypoxia factor (Hif)1+ pericytes (Peri, Figure 5A). An initial analysis of cell populations affected by RSV was identified by coloring the cells in the UMAP by treatment condition (Figure 5B). We noted that RSV infection in the vehicle-treated animals shifted subpopulations in the aAT2, Club, Krt8+Club and Hif+ Peri cell groups. RelA CKO affected Hif+Peri, Pdgfra+ Fibro and aAT2 populations (Figure 5B).
To identify the cell populations targeted for RelA CKO, Scgb1a1 mRNA expression was overlaid on the UMAP representation. Here, we observed Krt8+ Club, and Club cells were strongly positive as expected (Figure 5C). Similarly, aAT2, proliferating (Mki67+) AT2 and lysozyme (Lyz)1+AT2 cells were strongly surfactant protein C positive (Sfptc+), confirming their identification at AT2 cells (Figure 5D).
Hierarchial clustering of the most highly variable genes was next performed to confirm assigned cellular phenotypes. Here, AT2, Mki67+AT2 and Lyz+AT2 cells co-clustered based on shared high levels of expression of the Sftp isoforms, including Sftp-c and -d expression (Figure 5E). Interestingly, we noted aAT2 cells co-expressed Ager, the classical cell marker of AT1 cells (Figure 5E). A separate cluster included Itgb 4+ progenitors, Club- and Krt8+Club cells that exhibited high levels of Scgb1a1 and Scgb3a2 expression (Figure 5E). Also AT1 cells expressed Ager mRNA as well as the HOP Homeobox (HopX), a marker of AT2 progenitor responsible for regeneration of alveoli after hyperoxic injury [50].
A dot-plot clustering of cell types indicated the aAT2, Krt8+Club, Itg+ progenitor and club cells had similar transcriptional profiles and grouped separately from the fibroblast and myofibroblast populations (Figure 5F). These data indicated that RSV-PVLD induced aberrant populations of lower airway cells in intermediate differentiation states.
We next examined changes in cell populations using cell frequency analysis for each cell type by treatment condition. RSV infection induced increases in AT1 and Fib populations, but decreased Lgr6+Fibro, Mki67+AT2 and SMC populations (Figure 5G). By contrast, in the RSV-infected RelA CKO mice, increases in the Hif+ Peri and aAT2 cells were seen relative to RSV-infected WT, along with decreases in Itgb4+ Prog, Krt8+Club and Fib populations were seen (Figure 5G). These data indicate not only does RSV PVLD induce shifts in epithelial cell differentiation states but unanticipatedly, Scgb1a1-directed RelA CKO influences mesenchymal (fibroblast and pericyte) populations. Since the Lgr6-expressing fibroblast population is trophic for expansion of Scgb1a progenitors [51,52], RSV-PVLD may affect the number or function of these crucial epithelial-mesenchymal niches.
3.5. Scgba1a1 Progenitors Contribute to the aAT2 Population in RSV-PVLD
To more clearly establish the fate of the Scgb1a1+ progenitor population in RSV-PVLD, we next conducted cell lineage tracing studies by tagging Scgb1a1-expressing cells with GFP using heterozygous Scgb1a1-CreERTM X dimer Tomato (mT)-membrane-targeted green fluorescent protein (mG) mouse (mTmG) strain. These mice express WT levels of RelA and can be used to track the cellular lineage using the green fluorescent protein (GFP) reporter. All cells in the mT/mG mouse express Tomato, a red fluorescence protein, prior to Cre activation. In response to Cre activation, expression of Tomato is silenced and GFP is induced, enabling identification of Scgb1a1+ progenitors. Our previous light sheet microscopy studies using Scgb1a1-CreERTM X mTmG mice mapped Scgb1a1 progenitors as widely and uniformly distributed throughout the small bronchiolar epithelium [26]. We therefore subjected heterozygous Scgb1a1-CreERTM X RelAfl/fl X mTmG mice to RSV PVLD and labeled the Scgb1a1+ progenitor population after RSV infection (Schematically shown in Figure 6A).
In either Mock or RSV-infected mice, GFP+Scgb1a-derived progenitors populated the small bronchioles, consistent with the role of these self-replicating cells as progenitors of secretory goblet and ciliated cells [53] (Figure 6B). We next examined the population of GFP+Scgb1a in the alveoli. Here, we observed a low level of GFP+ cells consistent with presence of Scgb1a1 expressing cells in alveoli [53] (Figure 6B, bottom). We further noted that this population increased with RSV-PVLD. Quantification of the GFP+ cell population showed RSV infection induced GFP fluorescence from 0.96 ± 0.14 to 1.2 ± 0.09 arbitrary fluorescence units (n=4, P<0.01, Figure 6C).
To determine whether these progenitors were replicating RSV or contributed to the TRP63+ population, we conducted immunofluorescence assays. Here, we found that the alveolar GFP+ population was positive for RSV F protein expression, where we observed an increase in RSV F glycoprotein staining (Figure 6D). Relative to Mock, where no RSV F staining could be detected, RSV F staining in GFP+ cells increased in the RSV-infected mice to 4.18 ± 0.5-fold (n=4, P<0.001, Figures 6D, F). We also noted GFP+ alveolar parenchymal populations co-stained with TRP63, where a 1.62 ± 0.11-fold increase in TRP63 staining was quantitated (n=4, P<0.001, Figures 6D, E). Collectively, these data indicate that Scgb1a1+ progenitor cells are a direct target of RSV replication and that RelA signaling mediates cell state transitions into atypical TRP63+ progenitors in the alveolar epithelium.
3.6. RSV-PVLD Dysregulates Inflammatory Clock Genes in the Alveolar-Mesenchymal Niche
Distal airway progenitors are engaged in bidirectional trophic interaction with fibroblast populations in spatially resolved “niches”. In the distal parenchyma, Scgb1a1+ progenitors are engaged with trophic interactions with PDGFRa+ fibroblasts to maintain stem cell properties [21]. To further explore the effect of RSV infection in alveolar cell atypia, a differential gene expression (DEG) analysis of individual cell groups was conducted using pseudobulk analysis and DESEQ2 to minimize false positives [54]. We identified DEGs in aAT2 cells for mock-infected vs RSV-infected WT mice. 64 DEGs were significantly changed at an absolute value of log2FC >1.5 and adjusted p-value (pAdj) of <0.01. These genes were plotted in a Volcano plot representation where nuclear receptor subfamily 1 group D member (Nr1d)-2 and -1 genes, also known as REV-ERB-b/a key regulators of inflammatory clock genes were identified as being the most highly upregulated by RSV infection, with a reduction in Cryptochrome Circadian Regulator 1 (Cry1) and Early growth response 1 (Egr1) mRNAs (Figure 7A). A genome ontology analysis identified that the most highly affected biological pathway was that of circadian clock, as well as RUNX3 signaling, heat shock factor (HSF1) transactivation and others (Figure 7B).
A similar analysis was conducted for the Pdgfr1a+ fibroblasts. Here, RSV affected 66 genes at the same stringent cut-off values. Intriguingly, Nr1d1 was the most highly induced, along with D-Box Binding PAR BZIP Transcription Factor (Dbp) and Nr1d2, along with a downregulation of Cry1 (Figure 6C), mapping to a highly enriched circadian clock pathway (Figure 7D). Collectively, these data indicate that RSV-PVLD is associated with dysregulation of inflammatory circadian clock genes in both aAT2 epithelial cells and Pdgfra+ fibroblasts.
The effect of RSV-PVLD on Bmal was validated using Q-RTPCR. Here, we observed that RSV infection induced Bmal mRNA expression by 2.87 ± 1.9-fold in WT mice (n=4, P<0.05, Figure 8A), and induction which was reduced to 0.31 ± 0.44-fold in RSV-infected RelA CKO (n=4, P<0.05, Figure 8A). Nr1d1 mRNA expression was dramatically upregulated to 12.8 ± 0.44-fold in RSV-infected WT mice (n=4, P<0.0001, Figure 8B), and reduced in the RSV-infected RelA CKO mice to 5.8 ± 1.8-fold (n=4, P<0.001, Figure 8B). Similar patterns of RSV induction and inhibition by RelA CKO were observed for the 9.1 ± 3.2 -fold induction of Nr1d2 mRNA and 5.9 ± 6.2-fold Clock mRNAs (Figures 8C, D).
To confirm upregulation of NR1D1, we conducted IFM where a 1.6-fold increase in NR1D1 expression could be identified in RSV infected WT mice predominately in the bronchioles and to a lesser extent in the alveoli, an induction reduced by the RelA CKO (Figures 8E, F). Collectively these data indicate that RSV-PVLD is associated with dysregulated inflammatory clock gene expression.
3.7. RSV Disrupts Intercellular Epithelial-Mesenchymal Signaling Networks
Trophic mesenchymal-epithelial interactions mediate progenitor epithelial cell differentiation and myofibroblast expansion in response to injury through secretion of matricellular and soluble growth factors [21]. Our collective findings that RSV-PVLD induces changes in epithelial mesenchymal populations and their phenotypes, suggested to us that RSV infection may affect these trophic signaling networks. To better understand this, we conducted a systematic inference of epithelial-mesenchymal cell-communication networks. Here, scRNA-seq data was analyzed using a validated, probabilistic method that incorporates expression of secreted factors, their receptors and co-receptors across a manually curated database of >2,000 interactions [55].
We individually analyzed each treatment condition for dominant “senders” (those cells producing factors) and “receivers” (those cells expressing cognate receptors and co-factors). These data were plotted into a 2-dimensional representation of outgoing signals vs incoming signals (Figure 9). In mock-infected WT mice, the dominant cell types producing outgoing signals included Goblet cells (Gob) and Lgr6+ alveolar fibroblasts (Lgr6+ Fib, Figure 9A). We paid particular attention to this effect in Lgr6+ Fib population as epithelial trophic signaling is important for its known role supporting small airway epithelial progenitors [21]. By contrast, in RSV-infected WT mice, Hif1+ Peri cells were highly induced to produce outgoing messages (arrowhead, Figure 9B). In the RelA CKO, the outgoing signals of Hif1+ Peri population were unchanged relative to RSV-infected WT mice (Figure 9C).
Intercellular signaling intensity for specific pathways were determined by condition and cell type and displayed as an information flow bar chart (Figure 9D). In mock-infected WT mice, endothelin (EDN), Macrophage Migration Inhibitory Factor (MIF) and CC chemokine ligand (CCL) pathways were the highest fraction observed (Figure 9D). By contrast, CSF, growth differentiation factor (GDF) and angiopoietin-like (ANGPTL) pathways emerged as the top enriched pathways in RSV-infected vehicle-treated mice (Figure 9D). Of these, ANGPTL4 signaling was noted because mesenchymal ANGPTL signaling controls intestinal stem cell regeneration and fibroblast expansion in response to lung [56] and intestinal injury [57]. By contrast, a distinct pattern of information flow was observed in the RSV-infected WT vs RelA CKO. Here, protein kinase c receptor (PROC), IL1 and ANGPTL signaling emerged as the top pathways in RelA CKO, along with ANGPTL4 (Figure 9E).
To better understand the intercellular signals converting on the aAT2 population, we analyzed incoming signals as a function of cell type for mock and RSV infected WT mice. These data are displayed as a heat map, where a significant enhancement of ANGPTL signaling was seen in the RSV infected cells as an incoming signal for the Lgr6+ fibroblasts and aAT2 cells (arrowheads, Figure 9F). The majority of cell types producing ANGPTL4 were Hif1+ Peri and Fibro (arrowheads, Figure 9G). Collectively we interpreted these data indicates that RSV PVLD is associated with dysregulated mesenchymal ANGPTL4 signaling from Hif1+ Peri to Lgr6+ alveolar fibroblasts and the aAT2 cell population.
3.8. RSV Dysregulates Mesenchymal-Epithelial ANGPTL Signaling
To better understand the intercellular signaling network of ANGPTL in RSV-PVLD, we analyzed the strength of ANGPTL signaling between individual cells as a function of treatment. In mock-infected mice, autocrine ANGPTL is produced by Hif1+Peri cells that signal to both Lgr6+ Fib and Goblet cells (Figure 10A). By contrast, ANGPTL signaling intensity is increased in RSV-infected mice where Hif1+Peri signaling to aAT2 cells becomes prominent, as well as ANGPTL signaling increases in Fibro to aAT2, Mki67+AT2, Lyz+AT2 and Lgr6+ Fibroblasts (Figure 10B). In RelA CKO, the ANGPTL patterns largely return to those of mock-infected controls (Figure 10C). In airway epithelial cells, syndecan-1 (Sdc1) is the dominant ANGPTL4 receptor. Overlaying Angptl4 and Scd1 expression patterns in UMAP, we observed that that Hif1+ Peri and Pdgfra+ Fibro cells express Angptl4 (Figure 10D), whereas aAT2 and Krt8+Scgb1a+ Club cells have the highest Scd1 expression (Figure 10E), further suggesting the presence of mesenchymal-epithelial ANGPTL signaling.
To systematically identify the ligands and receptors in the ANGPTL pathway, the levels of expression for each in RSV-infected vehicle-treated vs control mice were quantified and plotted as violin plots. Although Angptl2 mRNA was constitutively expressed in mesenchymal cells, Angptl4 mRNA was upregulated in RSV-infected Fibro and Hif+Peri (arrowheads, Figure 10F).
Finally, the level of ANGPTL4 protein in bronchoalveolar lavage fluid (BALF) was measured by ELISA. Here we observed BALF ANGPTL4 concentration was 217 ± 123 pg/mL in mock-infected mice that rose 4.2-fold to 920 ± 424 pg/mL in RSV-infected mice (P<0.001, n=5; Figure 10G); this induction was reduced by ~50% to 404 ± 163 pg/mL in RelA CKO mice (P<0.01, n=5; Figure 10G). These data indicate that RSV activates ANGPTL4 signaling at the level of ligand expression.
4. Discussion
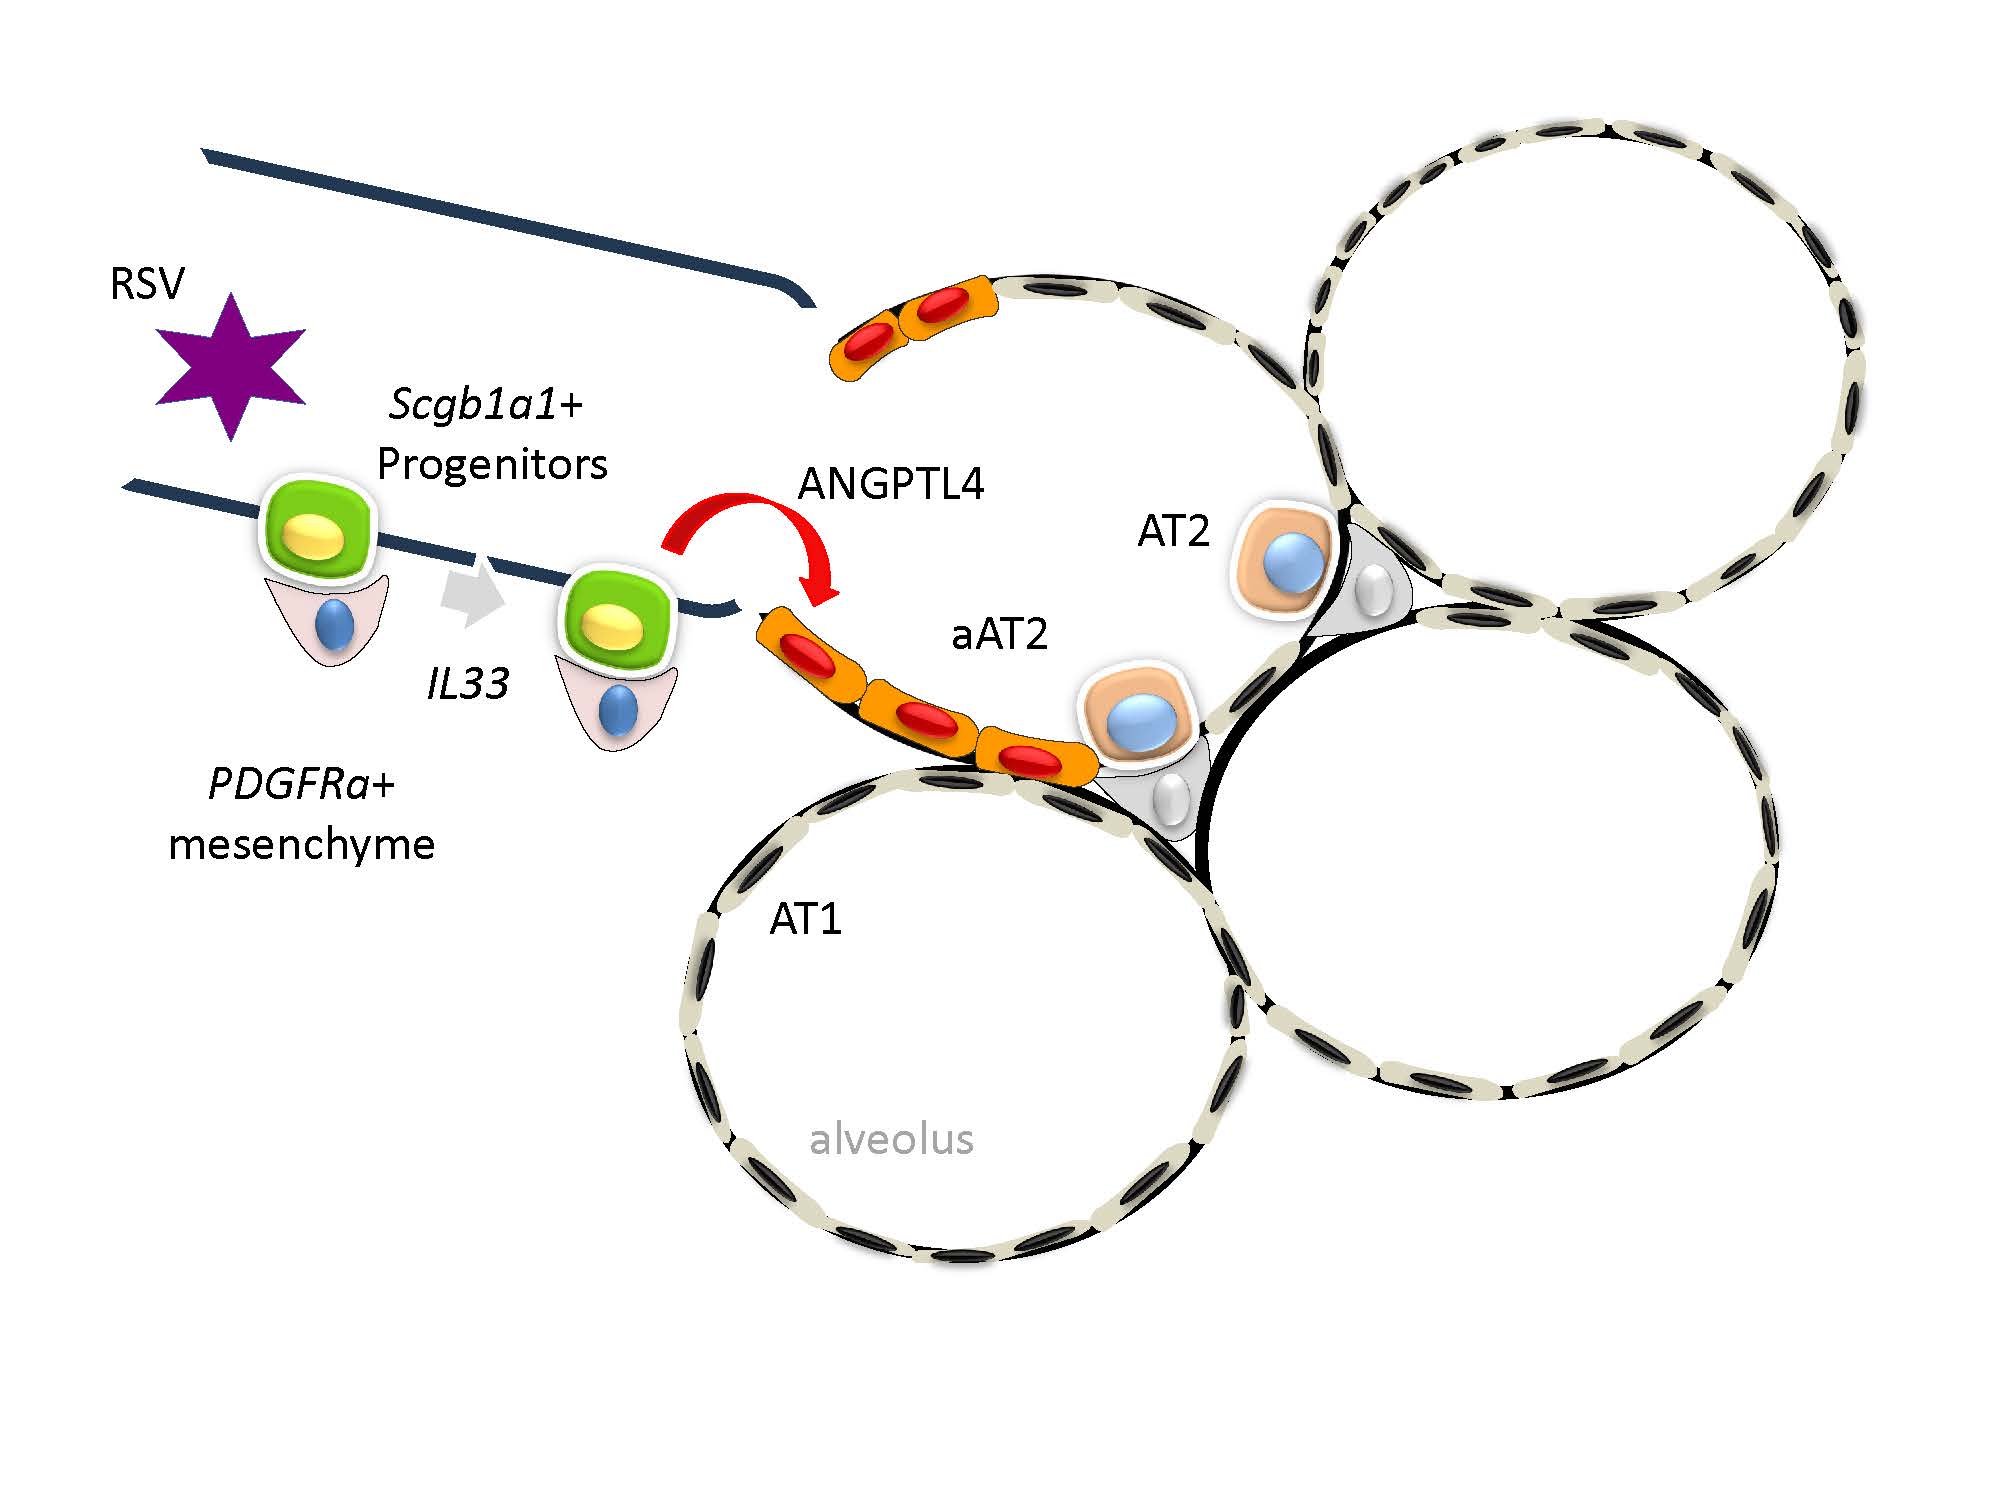
Children with RSV LRTI are at greater risk for long-term reductions in lung function and are at a 2-fold increased risk of premature death from respiratory disease [3,4,5,6]. As the target permissive for RSV infection, the epithelium plays a primary role in modulating acute RSV disease through an inducible innate response [15,16,17]. However, the role of innate signaling in long-term remodeling outcomes of RSV disease is not fully understood. Here we utilize a well-established inducible knockout in a key sentinel epithelial cell to understand the mechanistic role of RelA in determination of long-term sequelae of early life RSV infection. We find that RelA signaling in Scgb1a1+ progenitors mediates major mucosal changes in RSV-PVLD by promoting expansion of atypical, progenitor-like alveolar epithelial cells with dysregulated circadian clock expression. In addition to identifying the presence of latent RSV in aAT2, we find evidence that RSV modulates epithelial-mesenchymal intercellular ANGPTL4 signaling pathways. Schematically illustrated in Graphical Abstract, we conclude that PVLD is the end-product of a spatiotemporally coordinated, multicellular reparative response to lower airway viral infection mediated by dysregulated epithelial-mesenchymal trophic signals.
4.1. Early Life RSV Infections Induce Epithelial Atypia Through Epithelial Plasticity
In rodent models, RSV infections in early life produce chronic changes that mimic LRTI in humans [32,33]. For example, it has been reported that RSV infections in neonatal mice produce long-term inflammatory airway disease characterized by airway functional changes (obstruction, hyper-reactivity [58]) as well as histological pathology (peribronchial inflammation, bronchial wall thickening and subepithelial fibrosis [59]). Recent work in early life infections in the BALB/C model have described the emergence of an indeterminant AT1-AT2 population associated with persistent IL33 expression [60]. This study found that early life exposure to IL1b triggers a similar pattern of IL33 expression, suggesting that innate responses initiate some of the chronic changes in RSV-PVLD.
The BALB/C model is widely used to understand the linkage between RSV and allergy because this strain exhibits a robust Th2 response, potentially obscuring the contributions of epithelial intrinsic immunity on airway modeling. Consequently, we studied RSV-PVLD in the C57BL6/J strain, a strain that mounts a robust innate and Th1- polarized immune response [41]. Here, we observe that acute RSV infection produces loss of distal ciliated epithelial cells, and confirm the rapid emergence of atypical aAT2 cells using colocalization in IFM. These alveolar epithelial changes evolve over time in the RSV-PVLD, driven by IL33 and associated with later upregulation of ITG isoforms, and dysregulation of the circadian clock program (Figure 11). Our work therefore extends these previous findings providing direct evidence that innate signaling in Scgb1a1 progenitors is required for the full manifestation of RSV-PVLD.
4.2. Scgb1a1+ Progenitors Mediate Epithelial Atypia in RSV-PVLD
Understanding the mechanisms controlling epithelial remodeling may shed light into the pathological sequelae of RSV LTRI. The presence of atypical AT2 cells may be due to dysregulated differentiation programs as well as the emergence of progenitor populations. scRNA sequencing of pediatric nasal epithelial cells has shown that RSV infection in the first year of life is associated with atypical differentiation programs [61], a finding seen in human epithelial cells in ALI cultures [10]. In parallel, RSV induces ciliated cell loss and sloughing [40], which may serve as a trigger for expansion of basal cell progenitors. Depending on the location and severity of injury, distinct populations of basal cells are recruited for airway repair.
Studies in influenza (H1N1) and Sendai virus (SeV) infection models where extensive viral infection-induces cellular necrosis activates a regenerative basal cell response to repopulate the lower airway [33,47,62,63]. Of particular interest to this study, previous work with influenza H1N1 and SeV infection found that Scgb1a1-expressing club cell progenitors originating in the broncho-alveolar junction are activated to repopulate the distal airway [20,47,64]. Additionally, other lineage tracing experiments in H1N1 infection found that these Scgb1a1 progenitors become TRP63+ and contribute to AT2 repopulation [65]. These studies reinforce our findings that the TRP63+ Scgb1a1+ progenitor is an important determinant of injury-induced repair and resolution in the lower airway after RSV infection.
Our findings from the Scgb1a1-mTmG lineage tracing experiments provide further, direct evidence that Scgb1a1+ progenitors contribute, at least in part, to the TRP63+/KRT8+ aAT2 population in RSV-PVLD. The phenotype of the aAT2 cells in this study are similar to that of the well-characterized “atypical differentiation intermediate” (ADI), “damage-associated transitional” (DATP) or “pre-alveolar type-1 transitional cell state” (PATS) cells [20,44,66,67] identified in bleomycin and influenza injury. Single cell analyses of this ADI population shows that these cell types express characteristic patterns of epithelial mesenchymal plasticity (EMP), cellular senescence, and TRP63+ signaling [20]. Importantly, persistence of this reparative cell population(s) is (are) associated with dysplastic repair and fibrotic remodeling. In bleomycin and viral injury models, for example, ADI cells contribute ~50% to the regenerating AT2 population, where their persistence results in dysplastic, fibrotic repair [20].
By contrast, in RSV-PVLD, Scgb1a1+ progenitor population in RSV PVLD appears to induce epithelial hyperplasia, resulting in defective ambient O2 exchange. More work will be required to establish the relationship of RSV-induced aAT2 cells with those of the ADIs arising in bleomycin injury. Although we can confirm expression of KRT8 and TRP63, we also identify an inflammatory clock signature in aAT2 cells which is distinct from that reported in the ADI population. We have not determined the presence of cellular senescence, which will be further explored in future studies. Nevertheless, these data suggest to us that progenitor transitions can evolve into multiple distinct cell states depending on the type of injury.
4.3. RSV Modulates Epithelial Plasticity and Differentiation Programs Through Innate Signaling
Although the Scgb1a1 lineage of TRP63+ progenitors have been implicated in alveolar repair, the mechanisms on how this population expands in the setting of RSV infection is not yet understood [68,69]. In other models of airway injury, regenerative epithelial changes are mediated through a growth factor-initiated epigenetic reprogramming leading to EMP [70,71]. Mucosal injury induces several important cell stress pathways important in EMP, including the unfolded protein response [72,73] and NFkB. Our previous work has placed RelA as a major mediator of the TGF- and viral-induced cellular plasticity in lower airway basal epithelial cells [70,74]. These previous mechanistic studies found that RSV replication triggers EMP, a series of cell state transitions mediated by IKK-NFkB signaling. In TRP63+/KRT5+ models of basal cells in vitro, RelA signaling is a component of a transcription factor cascade that maintains paracrine TGFb and Wnt signaling, sustaining EMP [21,73,74]. Plasticity programs play a central role in epithelial repair by disrupting intercellular hemidesmosomal contacts with the basement membrane, enhancing contractile protein expression that enhance cytokinesis, enabling basal cells to migrate and repopulate areas of epithelial injury [73,75,76]. A crucial determinant of resolution is whether the EMP-transitioned cells fully differentiate into mature AT cells or become trapped in a differentiation intermediate state, such as aAT2 or the ADI cells, where their persistence produces defective oxygenation or fibrosis [20].
An additional finding of our study is that the differentiation-indeterminant aAT2 cells have evidence of low levels of RSV F glycoprotein expression, suggesting RSV latency may also be directly influencing aAT2 cell phenotype. Although we do not find evidence of active viral production, the persistence of RSV transcripts is suggestive of low-level RSV replication, discussed below. Of relevance, it has been reported that RSV replication alters differentiation programs of lower airway-derived TP63+ basal cells in ALI, redirecting them from a default differentiation program to ciliated cells into a program generating mucous-secreting goblet cells [10]. This work further showed that inducible type I/III IFNs secreted from RSV-infected cells mediate reprogramming. Since we have shown that RSV-induced IFN synthesis is well-established to be dependent on RelA [77], collectively these data suggest that both local growth factor-induced mesenchymal plasticity and direct viral replication-induced cellular reprogramming is centrally mediated by RelA.
4.4. RSV Latency in RSV-PVLD
The evolution of acute RSV lower respiratory tract infection has been well-established in the mouse model [78]. Here, RSV replication activates innate macrophages, leading to RSV replication in the lower airways, including replication in type 1 and type 2 alveolar epithelial cells [79], consistent with the patterns of RSV replication in fatal human infections [9]. By 4-6 d after acute infection, the virus is largely cleared from the BALF. Interestingly, we detect persistent RSV transcription and cellular expression of the RSV F glycoprotein but are unable to detect infectious virions in the BALF. These data are consistent with the findings of Schwartze et al., who reported low level of RSV transcription and protein expression in wild type Balb/c mice after RSV infection [80]. This level of RSV replication was not sufficient to be detected in plaque assay of BALF, but the investigators could recover live virus after T cell depletion. This group concluded that RSV could establish latency by replication in privileged sites in the airway. Our data indicates that these sites are dependent on RelA, as RelA depletion reduces RSV transcription as well as persistence of glycoprotein expression. We suggest that RelA-expressing Scgb1a1+ progenitor cell may be one of these privileged sites.
4.5. RSV Disrupts Circadian Clock Gene Expression in aAT2 Cells
The current study is the first to describe coordinate Nr1d-1/-2 mRNA induction in aAT2 epithelial cells as well as Pdgfra + fibroblasts in RSV-PVLD. Our experiments were designed to control for variations in clock gene expression where timing of infections and harvest were synchronized to the same time. We think this finding is important because the coordinated upregulation of Nr1d-1 and -2 with downregulation of Cry1 mRNA suggests to us that RSV-PVLD is associated with dysregulated circadian clock function in epithelial-mesenchymal niche cells. Nr1d is an inflammation-associated nuclear transcription factor controlling lipid metabolism, cytokine activation and activation of Bmal1 in an oscillatory transcription termination loop [81].
Clock genes are cyclically expressed in the lung parenchyma, whose expression levels determine fibrosis, inflammation and immunity [82,83]. In mice, Bmal deficiency enhances replication, remodeling and disease severity in response to SeV replication [84], linking the BMAL pathway as a determinant of anti-viral response. Moreover, we note bronchial hyperreactivity chronically persists after RSV infection in mice [58], and dysregulation of BMAL has been linked to bronchial hyperreactivity in human asthma [84]. Additionally, RSV infection induces an exaggerated allergenic response to allergens in long-term mouse model [59], and that children with RSV LRTI are at greater risk for developing atopy decades afterwards [3]. More work will need to be done to investigate the functional significance of this intriguing finding of RSV-induced dysregulation of the Clock.
4.6. RSV-PVLD Disrupts Epithelial-Mesenchymal Niches
Basal epithelial cells are maintained in the stem cell through trophic interactions with mesenchyme through paracrine signals that modulate their differentiation and proliferation [21]. To understand these interactions affected by RSV-PVLD, we systematically identified cell-cell interactions using a probabilistic (“Cell Chat”) analysis of our scRNA-seq data. Our findings show that the Scgb1a1 +and aAT2 epithelial cells are actively engaged with trophic and inflammatory intercellular signaling pathways with Pdgfra+ fibroblasts. We are aware of other spatial transcriptomics work that have identified Scgb1a1+-derived TRP63+ progenitor cells engaged in PDGFRa+ fibroblasts within a small airways “niche” [21,47,64,85]. Our findings suggest that multiple constitutive and RSV-inducible mesenchymal-epithelial signaling pathways include those of PROCR, IL1 and ANGPTL [21]. Interestingly RelA CKO in Scgb1a1 + progenitors affect fibroblast and pericyte populations and signaling pathways, indicating complex, bi-directional signaling mediated by epithelial RelA with multiple mesenchymal populations [21].
4.7. A Potential Role for Angiopoietins in Post Viral Lung Disease
Here we validate the Cell Chat prediction for upregulation of ANGPTL4 in RSV-PVLD. ANGPTL4 was of interest because this member of the angiopoietin family is a secreted factor important in metabolic transition, stem cell renewal and fibrosis [86,87,88]. Moreover, this protein works as a chemotactic factor for ITGb1/5-expressing cells in fibrosis [87], and functions as a regulator of WNT signaling through degradation of the LRP6 receptor [88]. Lastly, fibroblast-generated ANGPTL4 mediates bleomycin induced fibrosis [56]. The significance of this finding will require additional experimentation to understand its role in RSV-PVLD. Nevertheless, these interesting findings provide plausible mechanism for role of ANGPTL4 in regulating Wnt-dependent differentiation, a finding that will require further study. In future studies, we will extend these findings to better understand the contribution of epithelial-mesenchymal niche in the anti-viral response.
5. Conclusions
In this study, we have established and analyzed a model of RSV-PVLD relevant to chronic airway sequelae in childhood RSV LRTI. We identified major features of epithelial atypia, cell state change, dysregulation of clock genes, and implicate ANGPTL4 signaling. We conclude that innate signaling in the Scgb1a1+ progenitor mediates alveolar atypia by disrupting mesenchymal-epithelial intercellular communication in RSV-PVLD. Overall, these data suggest that RSV-PVLD remodels the airway, shaping the mesenchymal-epithelial trophic niches, and may alter subsequent innate responses.
Author Contributions
Conceptualization: MS, ARB; Investigation: MS, ARB; Visualization: MS, ARB; Funding acquisition: ARB; Writing – original draft: MS, ARB.
Funding
This work was partially supported by NCATS UL1TR002373 (ARB); NIAID U01 AI136994 (ARB) and AI062885 (ARB); The funders had no role in the design of the study; in the collection, analyses, or interpretation of data; in the writing of the manuscript, or in the decision to publish the results.
Ethics Approval and Consent to Participate
All vertebrate animals experiments were conducted using a protocol reviewed and approved by the University of Wisconsin-Madison School of Medicine and Public Health Institutional Animal Care and Use Committee (IACUC), adhering to guidelines set by National Institutes of Health (NIH) and Association for Assessment and Accreditation of Laboratory Animal Care (AAALAC).
Data Availability Statement
scRNA seq are available via the Gene Expression Omnibus under the accession number: GSE291797.
Acknowledgments
The authors acknowledge the support of the UW-M Research Biomedical Research Model Services (BRMS), the UW-M Translational Research Initiative in Pathology (TRIP), UW-M Biotechnology Gene Expression Center and the UTMB Infant Bronchiolitis and Viral Core for use of facilities, reagents and expertise of their Research Service teams.
Conflicts of Interest
The authors declare that the research was conducted in the absence of any commercial or financial relationships that could be construed as a potential conflict of interest.
Abbreviations
ANGPTL4, angiopoietin-like 4; Aqp3, Aquaporin-3; AT, alveolar type; BMAL, Basic Helix-Loop-Helix ARNT Like 1; CKO, conditional knockout; Itg, Integrin; Nr1d, Nuclear Receptor Subfamily 1 Group D; mTmG, membrane-localized tdTomato GFP mouse; PVLD, post viral lung disease; RSV, respiratory syncytial virus; scRNA-Seq, single cell RNA seq, UMAP, Uniform Manifold Approximation and Projection; Trp63, tumor protein 63; Scgb1a1, secretoglobin.
References
- Shi T, McAllister DA, O’Brien KL, Simoes EAF, Madhi SA, Gessner BD, Polack FP, Balsells E, Acacio S, Aguayo C, et al.: Global, regional, and national disease burden estimates of acute lower respiratory infections due to respiratory syncytial virus in young children in 2015: a systematic review and modelling study. Lancet 2017, 390:946–958. [CrossRef]
- Stockman LJ, Curns AT, Anderson LJ, Fischer-Langley G: Respiratory syncytial virus-associated hospitalizations among infants and young children in the United States, 1997-2006. Pediatr Infect Dis J 2012, 31:5–9.
- Sigurs N, Aljassim F, Kjellman B, Robinson PD, Sigurbergsson F, Bjarnason R, Gustafsson PM: Asthma and allergy patterns over 18 years after severe RSV bronchiolitis in the first year of life. Thorax 2010, 65:1045–1052. [CrossRef]
- Fauroux B, Simoes EAF, Checchia PA, Paes B, Figueras-Aloy J, Manzoni P, Bont L, Carbonell-Estrany X: The Burden and Long-term Respiratory Morbidity Associated with Respiratory Syncytial Virus Infection in Early Childhood. Infect Dis Ther 2017, 6:173–197.
- Allinson JP, Chaturvedi N, Wong A, Shah I, Donaldson GC, Wedzicha JA, Hardy R: Early childhood lower respiratory tract infection and premature adult death from respiratory disease in Great Britain: a national birth cohort study. The Lancet 2023, 401:1183–1193. [CrossRef]
- Rosas-Salazar C, Chirkova T, Gebretsadik T, Chappell JD, Peebles RS, Jr., Dupont WD, Jadhao SJ, Gergen PJ, Anderson LJ, Hartert TV: Respiratory syncytial virus infection during infancy and asthma during childhood in the USA (INSPIRE): a population-based, prospective birth cohort study. The Lancet 2023, 401:1669–1680. [CrossRef]
- Saarikallio S, Riikonen R, Tikkakoski A, Laitinen S, Holster A, Korppi M, Lauhkonen E: Bronchiolitis in Early Infancy Is Associated With Irreversible Airway Obstruction in Young Adulthood. Pediatr Pulmonol 2025, 60:e71139. [CrossRef]
- Jozwik A, Habibi MS, Paras A, Zhu J, Guvenel A, Dhariwal J, Almond M, Wong EHC, Sykes A, Maybeno M, et al.: RSV-specific airway resident memory CD8+ T cells and differential disease severity after experimental human infection. Nat Commun 2015, 6:10224. [CrossRef]
- Johnson JE, Gonzales RA, Olson SJ, Wright PF, Graham BS: The histopathology of fatal untreated human respiratory syncytial virus infection. Mod Pathol 2007, 20:108–119. [CrossRef]
- Persson BD, Jaffe AB, Fearns R, Danahay H: Respiratory syncytial virus can infect basal cells and alter human airway epithelial differentiation. PLoS One 2014, 9:e102368. [CrossRef]
- El Saleeby CM, Bush AJ, Harrison LM, Aitken JA, Devincenzo JP: Respiratory syncytial virus load, viral dynamics, and disease severity in previously healthy naturally infected children. J Infect Dis 2011, 204:996–1002. [CrossRef]
- DeVincenzo JP, El Saleeby CM, Bush AJ: Respiratory syncytial virus load predicts disease severity in previously healthy infants. J Infect Dis 2005, 191:1861–1868.
- Mella C, Suarez-Arrabal MC, Lopez S, Stephens J, Fernandez S, Hall MW, Ramilo O, Mejias A: Innate immune dysfunction is associated with enhanced disease severity in infants with severe respiratory syncytial virus bronchiolitis. J Infect Dis 2013, 207:564–573. [CrossRef]
- García C, Soriano-Fallas A, Lozano J, Leos N, Gomez AM, Ramilo O, Mejias A: Decreased innate immune cytokine responses correlate with disease severity in children with respiratory syncytial virus and human rhinovirus bronchiolitis. Pediatr Infect Dis J 2012, 31:86–89. [CrossRef]
- Ganesan S, Comstock AT, Sajjan US: Barrier function of airway tract epithelium. Tissue Barriers 2013, 1:e24997.
- Lambrecht BN, Hammad H: Allergens and the airway epithelium response: gateway to allergic sensitization. J Allergy Clin Immunol 2014, 134:499–507. [CrossRef]
- Whitsett JA, Alenghat T: Respiratory epithelial cells orchestrate pulmonary innate immunity. Nat Immunol 2015, 16:27–35.
- Zhao C, Bai Y, Wang W, Amonkar GM, Mou H, Olejnik J, Hume AJ, Mühlberger E, Lukacs NW, Fearns R, et al.: Activation of STAT3-mediated ciliated cell survival protects against severe infection by respiratory syncytial virus. J Clin Invest 2024, 134. [CrossRef]
- Hogan BL, Barkauskas CE, Chapman HA, Epstein JA, Jain R, Hsia CC, Niklason L, Calle E, Le A, Randell SH, et al.: Repair and regeneration of the respiratory system: complexity, plasticity, and mechanisms of lung stem cell function. Cell Stem Cell 2014, 15:123–138. [CrossRef]
- Strunz M, Simon LM, Ansari M, Kathiriya JJ, Angelidis I, Mayr CH, Tsidiridis G, Lange M, Mattner LF, Yee M, et al.: Alveolar regeneration through a Krt8+ transitional stem cell state that persists in human lung fibrosis. Nat Commun 2020, 11:3559. [CrossRef]
- Zepp JA, Zacharias WJ, Frank DB, Cavanaugh CA, Zhou S, Morley MP, Morrisey EE: Distinct Mesenchymal Lineages and Niches Promote Epithelial Self-Renewal and Myofibrogenesis in the Lung. Cell 2017, 170:1134–1148.e1110. [CrossRef]
- Barkauskas CE, Cronce MJ, Rackley CR, Bowie EJ, Keene DR, Stripp BR, Randell SH, Noble PW, Hogan BL: Type 2 alveolar cells are stem cells in adult lung. The Journal of clinical investigation 2013, 123:3025–3036. [CrossRef]
- Tian B, Liu Z, Yang J, Sun H, Zhao Y, Wakamiya M, Chen H, Rytting E, Zhou J, Brasier AR: Selective Antagonists of the Bronchiolar Epithelial NF-kappaB-Bromodomain-Containing Protein 4 Pathway in Viral-Induced Airway Inflammation. Cell Rep 2018, 23:1138–1151. [CrossRef]
- Tian B, Yang J, Zhao Y, Ivanciuc T, Sun H, Wakamiya M, Garofalo RP, Brasier AR: Central Role of the NF-kappaB Pathway in the Scgb1a1-Expressing Epithelium in Mediating Respiratory Syncytial Virus-Induced Airway Inflammation. J Virol 2018, 92. [CrossRef]
- Skibba ME, Brasier AR: NFkB/RelA Signaling in Secretoglobin Progenitors Mediates Plasticity and MMP-Induced Barrier Disruption In House Dust Mite-Induced Allergic Asthma. American Journal of Physiology-Lung Cellular and Molecular Physiology 2024, 327:L86–L101. [CrossRef]
- Skibba ME, Xu X, Weiss K, Huisken J, Brasier AR: Role of Secretoglobin(+) (club cell) NFκB/RelA-TGFβ signaling in aero-allergen-induced epithelial plasticity and subepithelial myofibroblast transdifferentiation. Respir Res 2021, 22:315.
- Tully JE, Hoffman SM, Lahue KG, Nolin JD, Anathy V, Lundblad LKA, Daphtary N, Aliyeva M, Black KE, Dixon AE, et al.: Epithelial NF-κB Orchestrates House Dust Mite–Induced Airway Inflammation, Hyperresponsiveness, and Fibrotic Remodeling. The Journal of Immunology 2013. [CrossRef]
- Zhao Y, Jamaluddin M, Zhang Y, Sun H, Ivanciuc T, Garofalo RP, Brasier AR: Systematic Analysis of Cell-Type Differences in the Epithelial Secretome Reveals Insights into the Pathogenesis of Respiratory Syncytial Virus-Induced Lower Respiratory Tract Infections. J Immunol 2017, 198:3345–3364.
- Calhoun WJ, Dick EC, Schwartz LB, Busse WW: A common cold virus, rhinovirus 16, potentiates airway inflammation after segmental antigen bronchoprovocation in allergic subjects. J Clin Invest 1994, 94:2200–2208.
- Message SD, Laza-Stanca V, Mallia P, Parker HL, Zhu J, Kebadze T, Contoli M, Sanderson G, Kon OM, Papi A, et al.: Rhinovirus-induced lower respiratory illness is increased in asthma and related to virus load and Th1/2 cytokine and IL-10 production. Proc Natl Acad Sci U S A 2008, 105:13562–13567.
- Olzewska B, Casola A, Saito T, Alam R, Crowe S, Mei F, Ogra PL, Garofalo R: Cell-specific expression of RANTES, MCP-1, and MIP-1a by lower airway epithelial cells and eosinophils infected with respiratory syncytial virus. Journal of Virology 1998, 72:4756–4764. [CrossRef]
- Malinczak CA, Fonseca W, Hrycaj SM, Morris SB, Rasky AJ, Yagi K, Wellik DM, Ziegler SF, Zemans RL, Lukacs NW: Early-life pulmonary viral infection leads to long-term functional and lower airway structural changes in the lungs. Am J Physiol Lung Cell Mol Physiol 2024, 326:L280–L291. [CrossRef]
- Wu K, Kamimoto K, Zhang Y, Yang K, Keeler SP, Gerovac BJ, Agapov EV, Austin SP, Yantis J, Gissy KA, et al.: Basal epithelial stem cells cross an alarmin checkpoint for postviral lung disease. The Journal of Clinical Investigation 2021, 131.
- Garcia GL, Valenzuela A, Manzoni T, Vaughan AE, López CB: Distinct Chronic Post-Viral Lung Diseases upon Infection with Influenza or Parainfluenza Viruses Differentially Impact Superinfection Outcome. Am J Pathol 2020, 190:543–553. [CrossRef]
- Wolock SL, Lopez R, Klein AM: Scrublet: Computational Identification of Cell Doublets in Single-Cell Transcriptomic Data. Cell Systems 2019, 8:281–291.e289. [CrossRef]
- Stuart T, Butler A, Hoffman P, Hafemeister C, Papalexi E, Mauck WM, 3rd, Hao Y, Stoeckius M, Smibert P, Satija R: Comprehensive Integration of Single-Cell Data. Cell 2019, 177:1888–1902.e1821.
- Zeng H: What is a cell type and how to define it? Cell 2022, 185:2739–2755.
- Franzén O, Gan L-M, Björkegren JLM: PanglaoDB: a web server for exploration of mouse and human single-cell RNA sequencing data. Database 2019, 2019:baz046. [CrossRef]
- Love MI, Huber W, Anders S: Moderated estimation of fold change and dispersion for RNA-seq data with DESeq2. Genome Biol 2014, 15:550.
- Liesman RM, Buchholz UJ, Luongo CL, Yang L, Proia AD, DeVincenzo JP, Collins PL, Pickles RJ: RSV-encoded NS2 promotes epithelial cell shedding and distal airway obstruction. J Clin Invest 2014, 124:2219–2233.
- Watanabe H, Numata K, Ito T, Takagi K, Matsukawa A: Innate immune response in Th1- and Th2-dominant mouse strains. Shock 2004, 22:460–466. [CrossRef]
- Sucre JMS, Bock F, Negretti NM, Benjamin JT, Gulleman PM, Dong X, Ferguson KT, Jetter CS, Han W, Liu Y, et al.: Alveolar repair following LPS-induced injury requires cell-ECM interactions. JCI Insight 2023, 8. [CrossRef]
- Chi Y, Wang X, Zhang D, Han J, Shao X, Xiang Y, Deng L: Deficiency of integrin β4 contributes bronchopulmonary dysplasia by compromising cellular stability through the activation of RhoA-(ZO-1) signaling pathways. Scientific Reports 2025, 15:20985. [CrossRef]
- Kobayashi Y, Tata A, Konkimalla A, Katsura H, Lee RF, Ou J, Banovich NE, Kropski JA, Tata PR: Persistence of a regeneration-associated, transitional alveolar epithelial cell state in pulmonary fibrosis. Nat Cell Biol 2020, 22:934–946.
- Li J, Yang D, Lin L, Yu L, Chen L, Lu K, Lan J, Zeng Y, Xu Y: Important functions and molecular mechanisms of aquaporins family on respiratory diseases: potential translational values. J Cancer 2024, 15:6073–6085. [CrossRef]
- Lv Z, Liu Z, Liu K, Lin X, Pu W, Li Y, Zhao H, Xi Y, Sui P, Vaughan AE, et al.: Alveolar regeneration by airway secretory-cell-derived p63(+) progenitors. Cell Stem Cell 2024, 31:1685–1700 e1686. [CrossRef]
- Zuo W, Zhang T, Wu DZ, Guan SP, Liew AA, Yamamoto Y, Wang X, Lim SJ, Vincent M, Lessard M, et al.: p63(+)Krt5(+) distal airway stem cells are essential for lung regeneration. Nature 2015, 517:616–620.
- Carroll DK, Carroll JS, Leong CO, Cheng F, Brown M, Mills AA, Brugge JS, Ellisen LW: p63 regulates an adhesion programme and cell survival in epithelial cells. Nat Cell Biol 2006, 8:551–561.
- Chapman HA, Li X, Alexander JP, Brumwell A, Lorizio W, Tan K, Sonnenberg A, Wei Y, Vu TH: Integrin α6β4 identifies an adult distal lung epithelial population with regenerative potential in mice. J Clin Invest 2011, 121:2855–2862.
- Liu K, Meng X, Liu Z, Tang M, Lv Z, Huang X, Jin H, Han X, Liu X, Pu W, et al.: Tracing the origin of alveolar stem cells in lung repair and regeneration. Cell 2024, 187:2428–2445.e2420. [CrossRef]
- Aros CJ, Vijayaraj P, Pantoja CJ, Bisht B, Meneses LK, Sandlin JM, Tse JA, Chen MW, Purkayastha A, Shia DW, et al.: Distinct Spatiotemporally Dynamic Wnt-Secreting Niches Regulate Proximal Airway Regeneration and Aging. Cell Stem Cell 2020, 27:413–429.e414. [CrossRef]
- Habermann AC, Gutierrez AJ, Bui LT, Yahn SL, Winters NI, Calvi CL, Peter L, Chung MI, Taylor CJ, Jetter C, et al.: Single-cell RNA sequencing reveals profibrotic roles of distinct epithelial and mesenchymal lineages in pulmonary fibrosis. Sci Adv 2020, 6:eaba1972. [CrossRef]
- Rawlins EL, Okubo T, Xue Y, Brass DM, Auten RL, Hasegawa H, Wang F, Hogan BL: The role of Scgb1a1+ Clara cells in the long-term maintenance and repair of lung airway, but not alveolar, epithelium. Cell Stem Cell 2009, 4:525–534.
- Squair JW, Gautier M, Kathe C, Anderson MA, James ND, Hutson TH, Hudelle R, Qaiser T, Matson KJE, Barraud Q, et al.: Confronting false discoveries in single-cell differential expression. Nature Communications 2021, 12:5692. [CrossRef]
- Jin S, Guerrero-Juarez CF, Zhang L, Chang I, Ramos R, Kuan C-H, Myung P, Plikus MV, Nie Q: Inference and analysis of cell-cell communication using CellChat. Nature Communications 2021, 12:1088. [CrossRef]
- Saito S, Kitabatake M, Ouji-Sageshima N, Ogawa T, Oda A, Nishimura T, Nishioka T, Fushimi S, Hara A, Shichino S, et al.: Angiopoietin-like 4 Is a Critical Regulator of Fibroblasts during Pulmonary Fibrosis Development. Am J Respir Cell Mol Biol 2023, 69:328–339. [CrossRef]
- Horiguchi H, Endo M, Kawane K, Kadomatsu T, Terada K, Morinaga J, Araki K, Miyata K, Oike Y: ANGPTL2 expression in the intestinal stem cell niche controls epithelial regeneration and homeostasis. Embo j 2017, 36:409–424.
- Jafri HS, Chavez-Bueno S, Mejias A, Gomez AM, Rios AM, Nassi SS, Yusuf M, Kapur P, Hardy RD, Hatfield J, et al.: Respiratory syncytial virus induces pneumonia, cytokine response, airway obstruction, and chronic inflammatory infiltrates associated with long-term airway hyperresponsiveness in mice. J Infect Dis 2004, 189:1856–1865. [CrossRef]
- You D, Becnel D, Wang K, Ripple M, Daly M, Cormier SA: Exposure of neonates to respiratory syncytial virus is critical in determining subsequent airway response in adults. Respir Res 2006, 7:107. [CrossRef]
- Morris SB, Ocadiz-Ruiz R, Asai N, Malinczak C-A, Rasky AJ, Lombardo GK, Velarde EM, Ptaschinski C, Zemans RL, Lukacs NW, Fonseca W: Long-term alterations in lung epithelial cells after EL-RSV infection exacerbate allergic responses through IL-1β-induced pathways. Mucosal Immunology 2024, 17:1072–1088. [CrossRef]
- Berdnikovs S, Newcomb DC, Haruna NF, McKernan KE, Kuehnle SN, Gebretsadik T, McKennan C, Ma S, Cephus JY, Rosas-Salazar C, et al.: Single-cell profiling demonstrates the combined effect of wheeze phenotype and infant viral infection on airway epithelial development. Sci Adv 2025, 11:eadr9995. [CrossRef]
- Vaughan AE, Brumwell AN, Xi Y, Gotts JE, Brownfield DG, Treutlein B, Tan K, Tan V, Liu FC, Looney MR, et al.: Lineage-negative progenitors mobilize to regenerate lung epithelium after major injury. Nature 2015, 517:621–625.
- Wu K, Zhang Y, Austin SR, Yin-Declue H, Byers DE, Crouch EC, Holtzman MJ: Lung Remodeling Regions in Long-Term Coronavirus Disease 2019 Feature Basal Epithelial Cell Reprogramming. Am J Pathol 2023, 193:680–689.
- Kumar PA, Hu Y, Yamamoto Y, Hoe NB, Wei TS, Mu D, Sun Y, Joo LS, Dagher R, Zielonka EM, et al.: Distal airway stem cells yield alveoli in vitro and during lung regeneration following H1N1 influenza infection. Cell 2011, 147:525–538.
- Zheng D, Yin L, Chen J: Evidence for Scgb1a1(+) cells in the generation of p63(+) cells in the damaged lung parenchyma. Am J Respir Cell Mol Biol 2014, 50:595–604.
- Hernandez BJ, Cain MP, Lynch AM, Flores JR, Tuvim MJ, Dickey BF, Chen J: Intermediary Role of Lung Alveolar Type 1 Cells in Epithelial Repair upon Sendai Virus Infection. Am J Respir Cell Mol Biol 2022, 67:389–401.
- Choi J, Park JE, Tsagkogeorga G, Yanagita M, Koo BK, Han N, Lee JH: Inflammatory Signals Induce AT2 Cell-Derived Damage-Associated Transient Progenitors that Mediate Alveolar Regeneration. Cell Stem Cell 2020, 27:366–382.e367. [CrossRef]
- Zheng D, Limmon GV, Yin L, Leung NH, Yu H, Chow VT, Chen J: Regeneration of alveolar type I and II cells from Scgb1a1-expressing cells following severe pulmonary damage induced by bleomycin and influenza. PLoS One 2012, 7:e48451. [CrossRef]
- Kathiriya JJ, Brumwell AN, Jackson JR, Tang X, Chapman HA: Distinct Airway Epithelial Stem Cells Hide among Club Cells but Mobilize to Promote Alveolar Regeneration. Cell Stem Cell 2020, 26:346–358.e344.
- Tian B, Patrikeev I, Ochoa L, Vargas G, Belanger KK, Litvinov J, Boldogh I, Ameredes BT, Motamedi M, Brasier AR: NF-kappaB Mediates Mesenchymal Transition, Remodeling, and Pulmonary Fibrosis in Response to Chronic Inflammation by Viral RNA Patterns. Am J Respir Cell Mol Biol 2017, 56:506–520.
- Zhang J, Jamaluddin M, Zhang Y, Widen SG, Sun H, Brasier AR, Zhao Y: Type II Epithelial-Mesenchymal Transition Upregulates Protein N-Glycosylation To Maintain Proteostasis and Extracellular Matrix Production. J Proteome Res 2019, 18:3447–3460.
- Auyeung VC, Downey MS, Thamsen M, Wenger TA, Backes BJ, Sheppard D, Papa FR: IRE1α drives lung epithelial progenitor dysfunction to establish a niche for pulmonary fibrosis. Am J Physiol Lung Cell Mol Physiol 2022, 322:L564–l580.
- Qiao D, Skibba M, Xu X, Garofalo RP, Zhao Y, Brasier AR: Paramyxovirus replication induces the hexosamine biosynthetic pathway and mesenchymal transition via the IRE1alpha-XBP1s arm of the unfolded protein response. Am J Physiol Lung Cell Mol Physiol 2021, 321:L576–L594. [CrossRef]
- Tian B, Widen SG, Yang J, Wood TG, Kudlicki A, Zhao Y, Brasier AR: The NFkappaB subunit RELA is a master transcriptional regulator of the committed epithelial-mesenchymal transition in airway epithelial cells. J Biol Chem 2018, 293:16528–16545. [CrossRef]
- Erjefalt JS, Erjefalt I, Sundler F, Persson CG: In vivo restitution of airway epithelium. Cell Tissue Res 1995, 281:305–316.
- Zhang J, Tian XJ, Zhang H, Teng Y, Li R, Bai F, Elankumaran S, Xing J: TGF-beta-induced epithelial-to-mesenchymal transition proceeds through stepwise activation of multiple feedback loops. Sci Signal 2014, 7:ra91.
- Tian B, Yang J, Zhao Y, Ivanciuc T, Sun H, Garofalo RP, Brasier AR: BRD4 Couples NF-kappaB/RelA with Airway Inflammation and the IRF-RIG-I Amplification Loop in Respiratory Syncytial Virus Infection. J Virol 2017, 91:e00007–00017. [CrossRef]
- Shilovskiy IP, Yumashev KV, Nikolsky AA, Vishnyakova LI, Khaitov MR: Molecular and Cellular Mechanisms of Respiratory Syncytial Viral Infection: Using Murine Models to Understand Human Pathology. Biochemistry (Moscow) 2021, 86:290–306.
- Rameix-Welti MA, Le Goffic R, Hervé PL, Sourimant J, Rémot A, Riffault S, Yu Q, Galloux M, Gault E, Eléouët JF: Visualizing the replication of respiratory syncytial virus in cells and in living mice. Nat Commun 2014, 5:5104. [CrossRef]
- Schwarze J, O’Donnell DR, Rohwedder A, Openshaw PJM: Latency and Persistence of Respiratory Syncytial Virus Despite T Cell Immunity. American Journal of Respiratory and Critical Care Medicine 2004, 169:801–805.
- Duez H, Staels B: Rev-erb-alpha: an integrator of circadian rhythms and metabolism. J Appl Physiol (1985) 2009, 107:1972–1980.
- Gibbs JE, Blaikley J, Beesley S, Matthews L, Simpson KD, Boyce SH, Farrow SN, Else KJ, Singh D, Ray DW, Loudon ASI: The nuclear receptor REV-ERBα mediates circadian regulation of innate immunity through selective regulation of inflammatory cytokines. Proceedings of the National Academy of Sciences 2012, 109:582–587. [CrossRef]
- Gibbs J, Ince L, Matthews L, Mei J, Bell T, Yang N, Saer B, Begley N, Poolman T, Pariollaud M, et al.: An epithelial circadian clock controls pulmonary inflammation and glucocorticoid action. Nat Med 2014, 20:919–926.
- Ehlers A, Xie W, Agapov E, Brown S, Steinberg D, Tidwell R, Sajol G, Schutz R, Weaver R, Yu H, et al.: BMAL1 links the circadian clock to viral airway pathology and asthma phenotypes. Mucosal Immunol 2018, 11:97–111.
- Bilodeau C, Shojaie S, Goltsis O, Wang J, Luo D, Ackerley C, M Rogers I, Cox B, Post M: TP63 basal cells are indispensable during endoderm differentiation into proximal airway cells on acellular lung scaffolds. npj Regenerative Medicine 2021, 6:12. [CrossRef]
- Desai U, Lee EC, Chung K, Gao C, Gay J, Key B, Hansen G, Machajewski D, Platt KA, Sands AT, et al.: Lipid-lowering effects of anti-angiopoietin-like 4 antibody recapitulate the lipid phenotype found in angiopoietin-like 4 knockout mice. Proc Natl Acad Sci U S A 2007, 104:11766–11771.
- Goh YY, Pal M, Chong HC, Zhu P, Tan MJ, Punugu L, Lam CR, Yau YH, Tan CK, Huang RL, et al.: Angiopoietin-like 4 interacts with integrins beta1 and beta5 to modulate keratinocyte migration. Am J Pathol 2010, 177:2791–2803.
- Kirsch N, Chang L-S, Koch S, Glinka A, Dolde C, Colozza G, Benitez MDJ, De Robertis EM, Niehrs C: Angiopoietin-like 4 Is a Wnt Signaling Antagonist that Promotes LRP6 Turnover. Developmental Cell 2017, 43:71–82.e76.
Figure 1.
Acute RSV induces epithelial phenotypic changes. Heterozygous Scgb1a1-CreERTM X RelAfl/fl in the C57BL6/J background were mock infected (both sexes) were mock or RSV infected via the i.n. route. 4 d later, mice were euthanized for Q-RT-PCR and immunofluorescence microscopy (IFM). (A), Q-RT-PCR for RSV F mRNA. Shown are fold changes in RSV mRNA with mock values imputed to the lower limit of the assay. (B), IFM for CD68. Shown is a representative image from a single mouse. (C), Quantitation of total macrophage numbers/high power field. Each symbol is average of multiple images for each individual animal (n=5). **, P<0.01. (D), IFM for ciliated epithelial cells with anti-acetyl tubulin (Ac-Tub, red) with DAPI nuclear stain (blue). Shown is a representative image from a single mouse. (E), Quantitation of Ac-Tub fluorescence intensity in RSV versus mock treatment. Each symbol is average of multiple images for each individual animal (n=5). *, P<0.05. (F), IFM staining for distribution of differentiated alveolar type (AT) makers, Surfactant protein c (SPC), Podoplanin (PDPN) and ITGB4. Shown are representative images. (G), Quantitation of numbers of positive cells in RSV-infected versus mock treatment. *, P<0.05. (H), Merged image of SPC/PDPN/ITGB4 staining in IFM. Right, high magnification panels showing indeterminant AT phenotype.
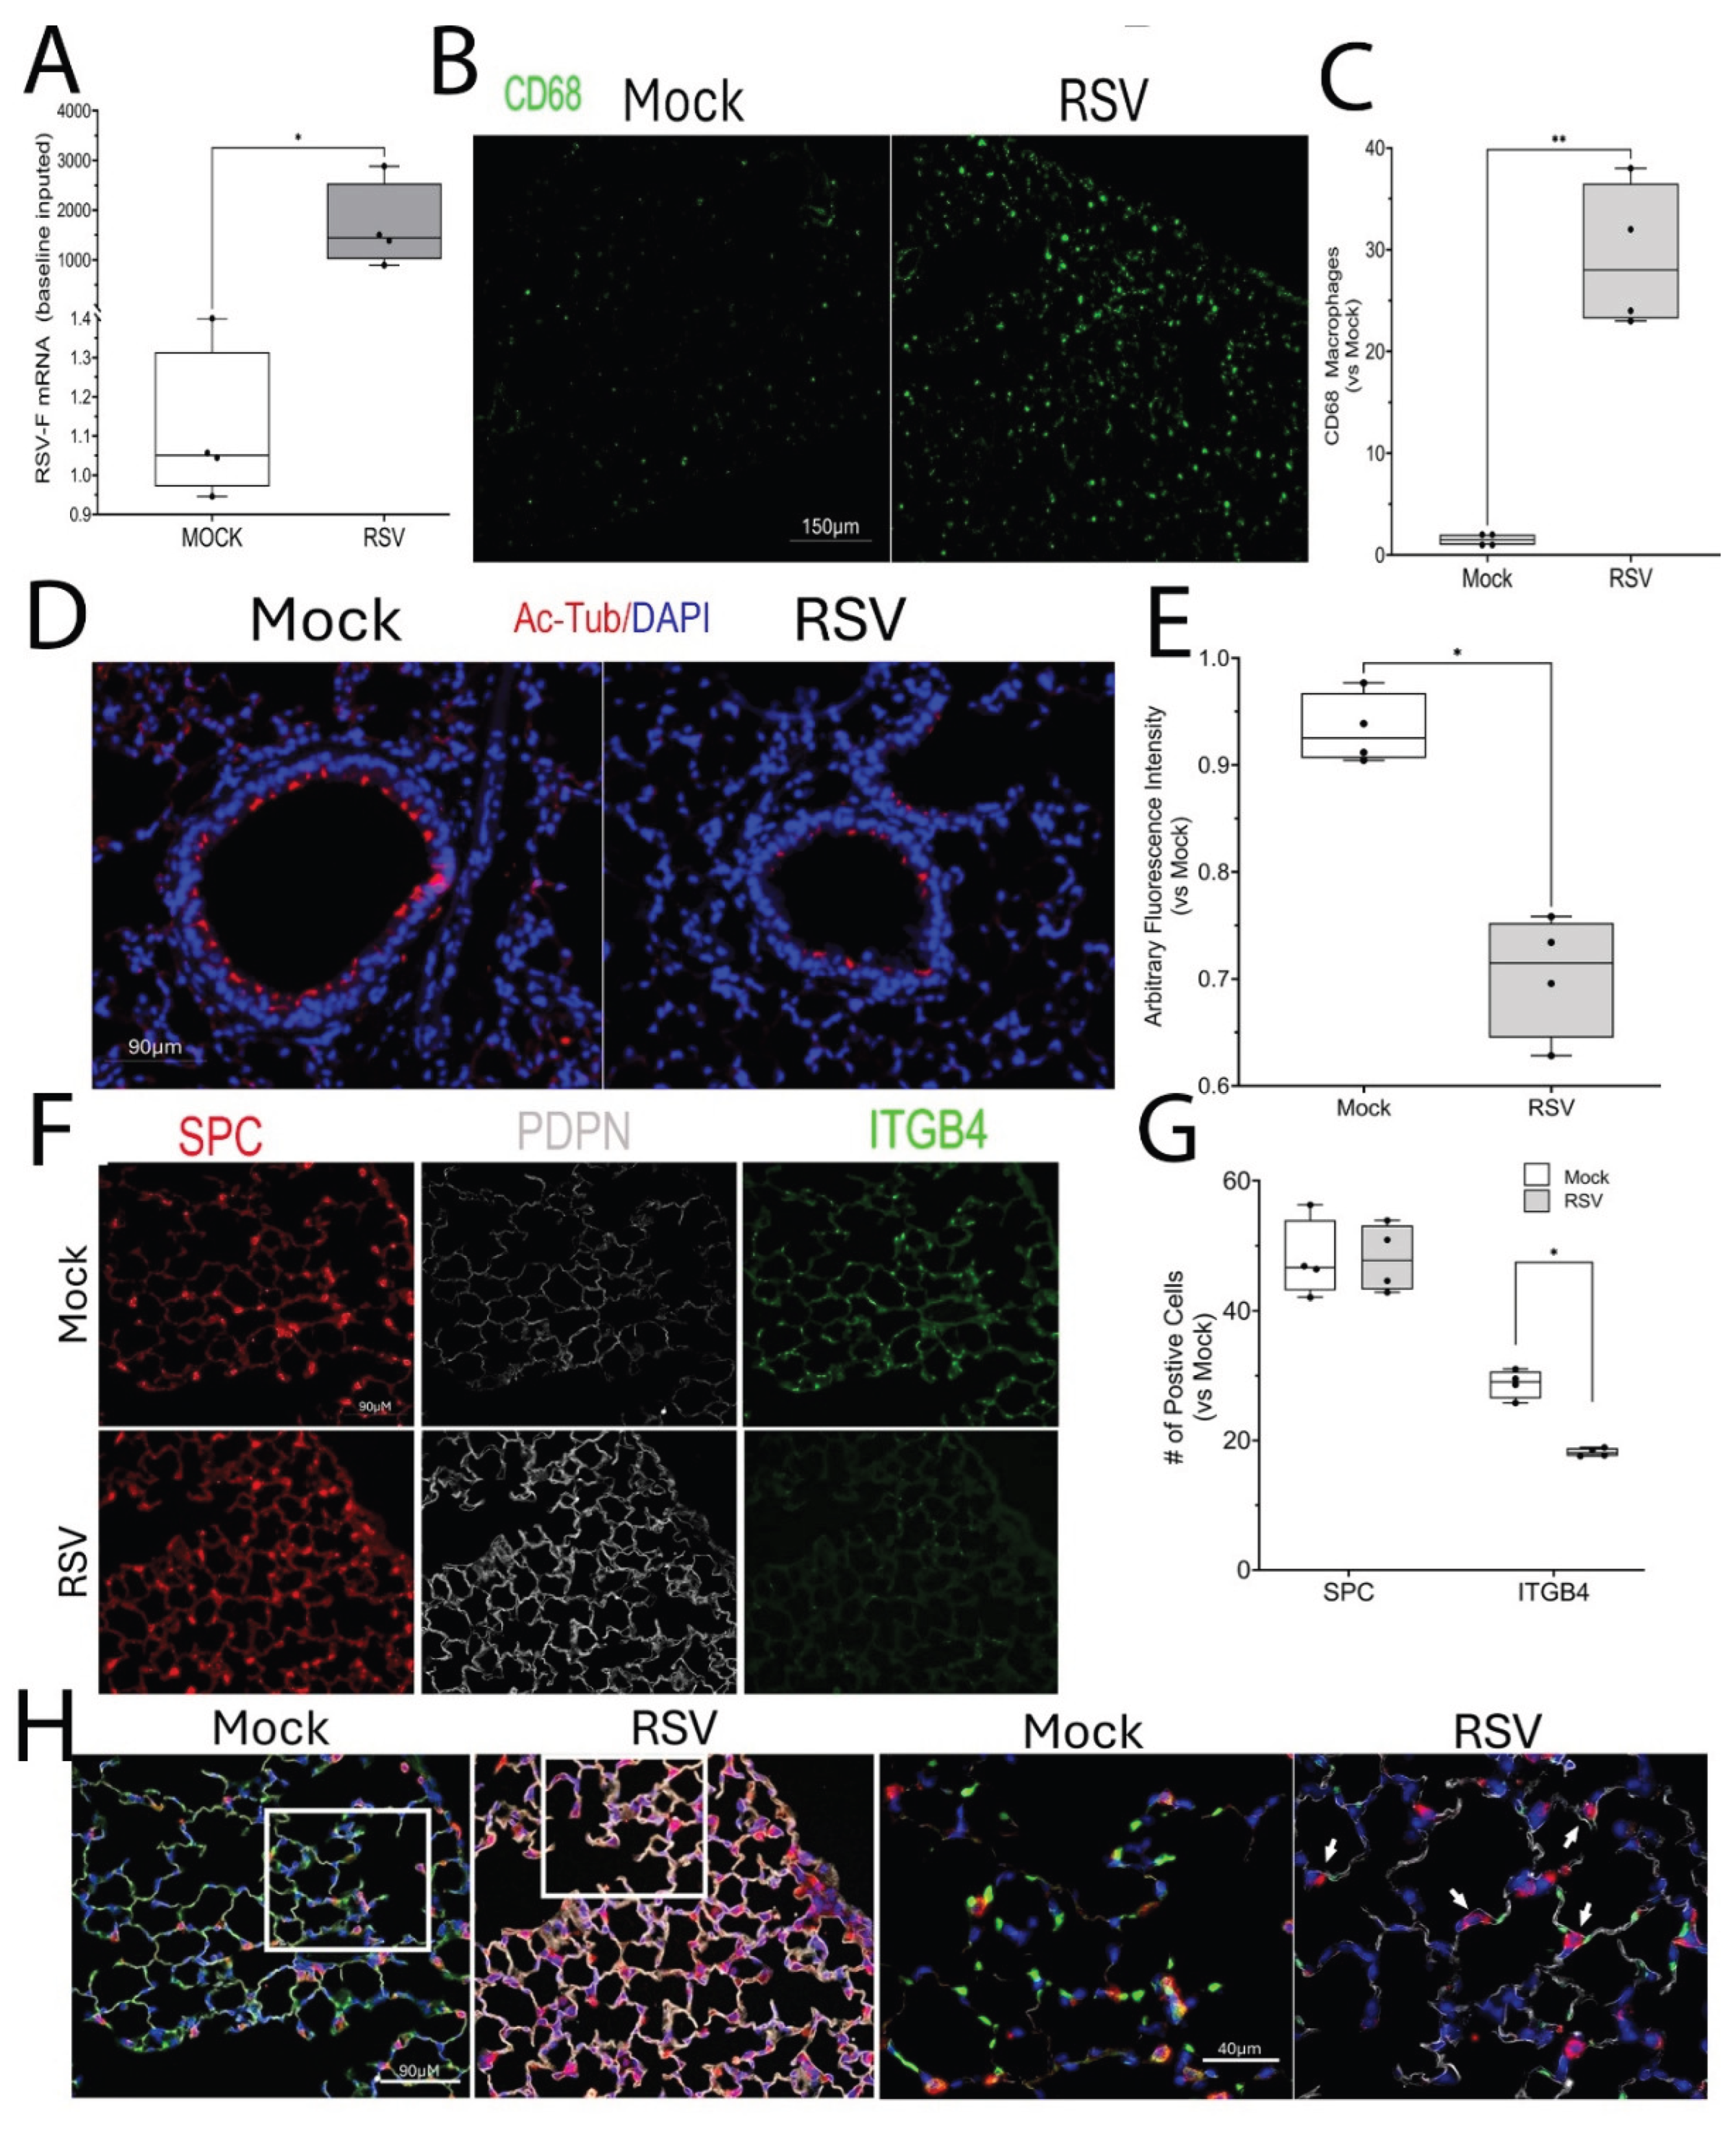
Figure 2.
RSV Post Viral Lung Disease (PVLD). (A), Schematic diagram of RSV-PVLD model. Three-five week old Scgb1a1-CreERTM X RelAfl/fl mice (both sexes) in the C57BL6/J background are mock treated or infected via the i.n. route. 3 days after infection, mice are randomized to receive corn oil or tamoxifen (TMX) treatments daily via i.p. until d16. At 21d-post infection the mice were euthanized for analysis. (B), Weight difference for treatment groups over time (days). Vertical arrows, timing of TMX treatment. **, P< 0.01 post-hoc. (C,D), Q-RT-PCR of total lung RNA normalized to Gadph as internal control. (C), RelA mRNA; (D), RSV. (E), Resting oxygen saturation by treatment group. Shown is 25-75% interquartile range (IQR); each symbol is an independent animal (n=5-6). *, P< 0.05. F mRNA. 25-75% IQR; each symbol is an independent animal. **, P< 0.01; ***, P<0.001.
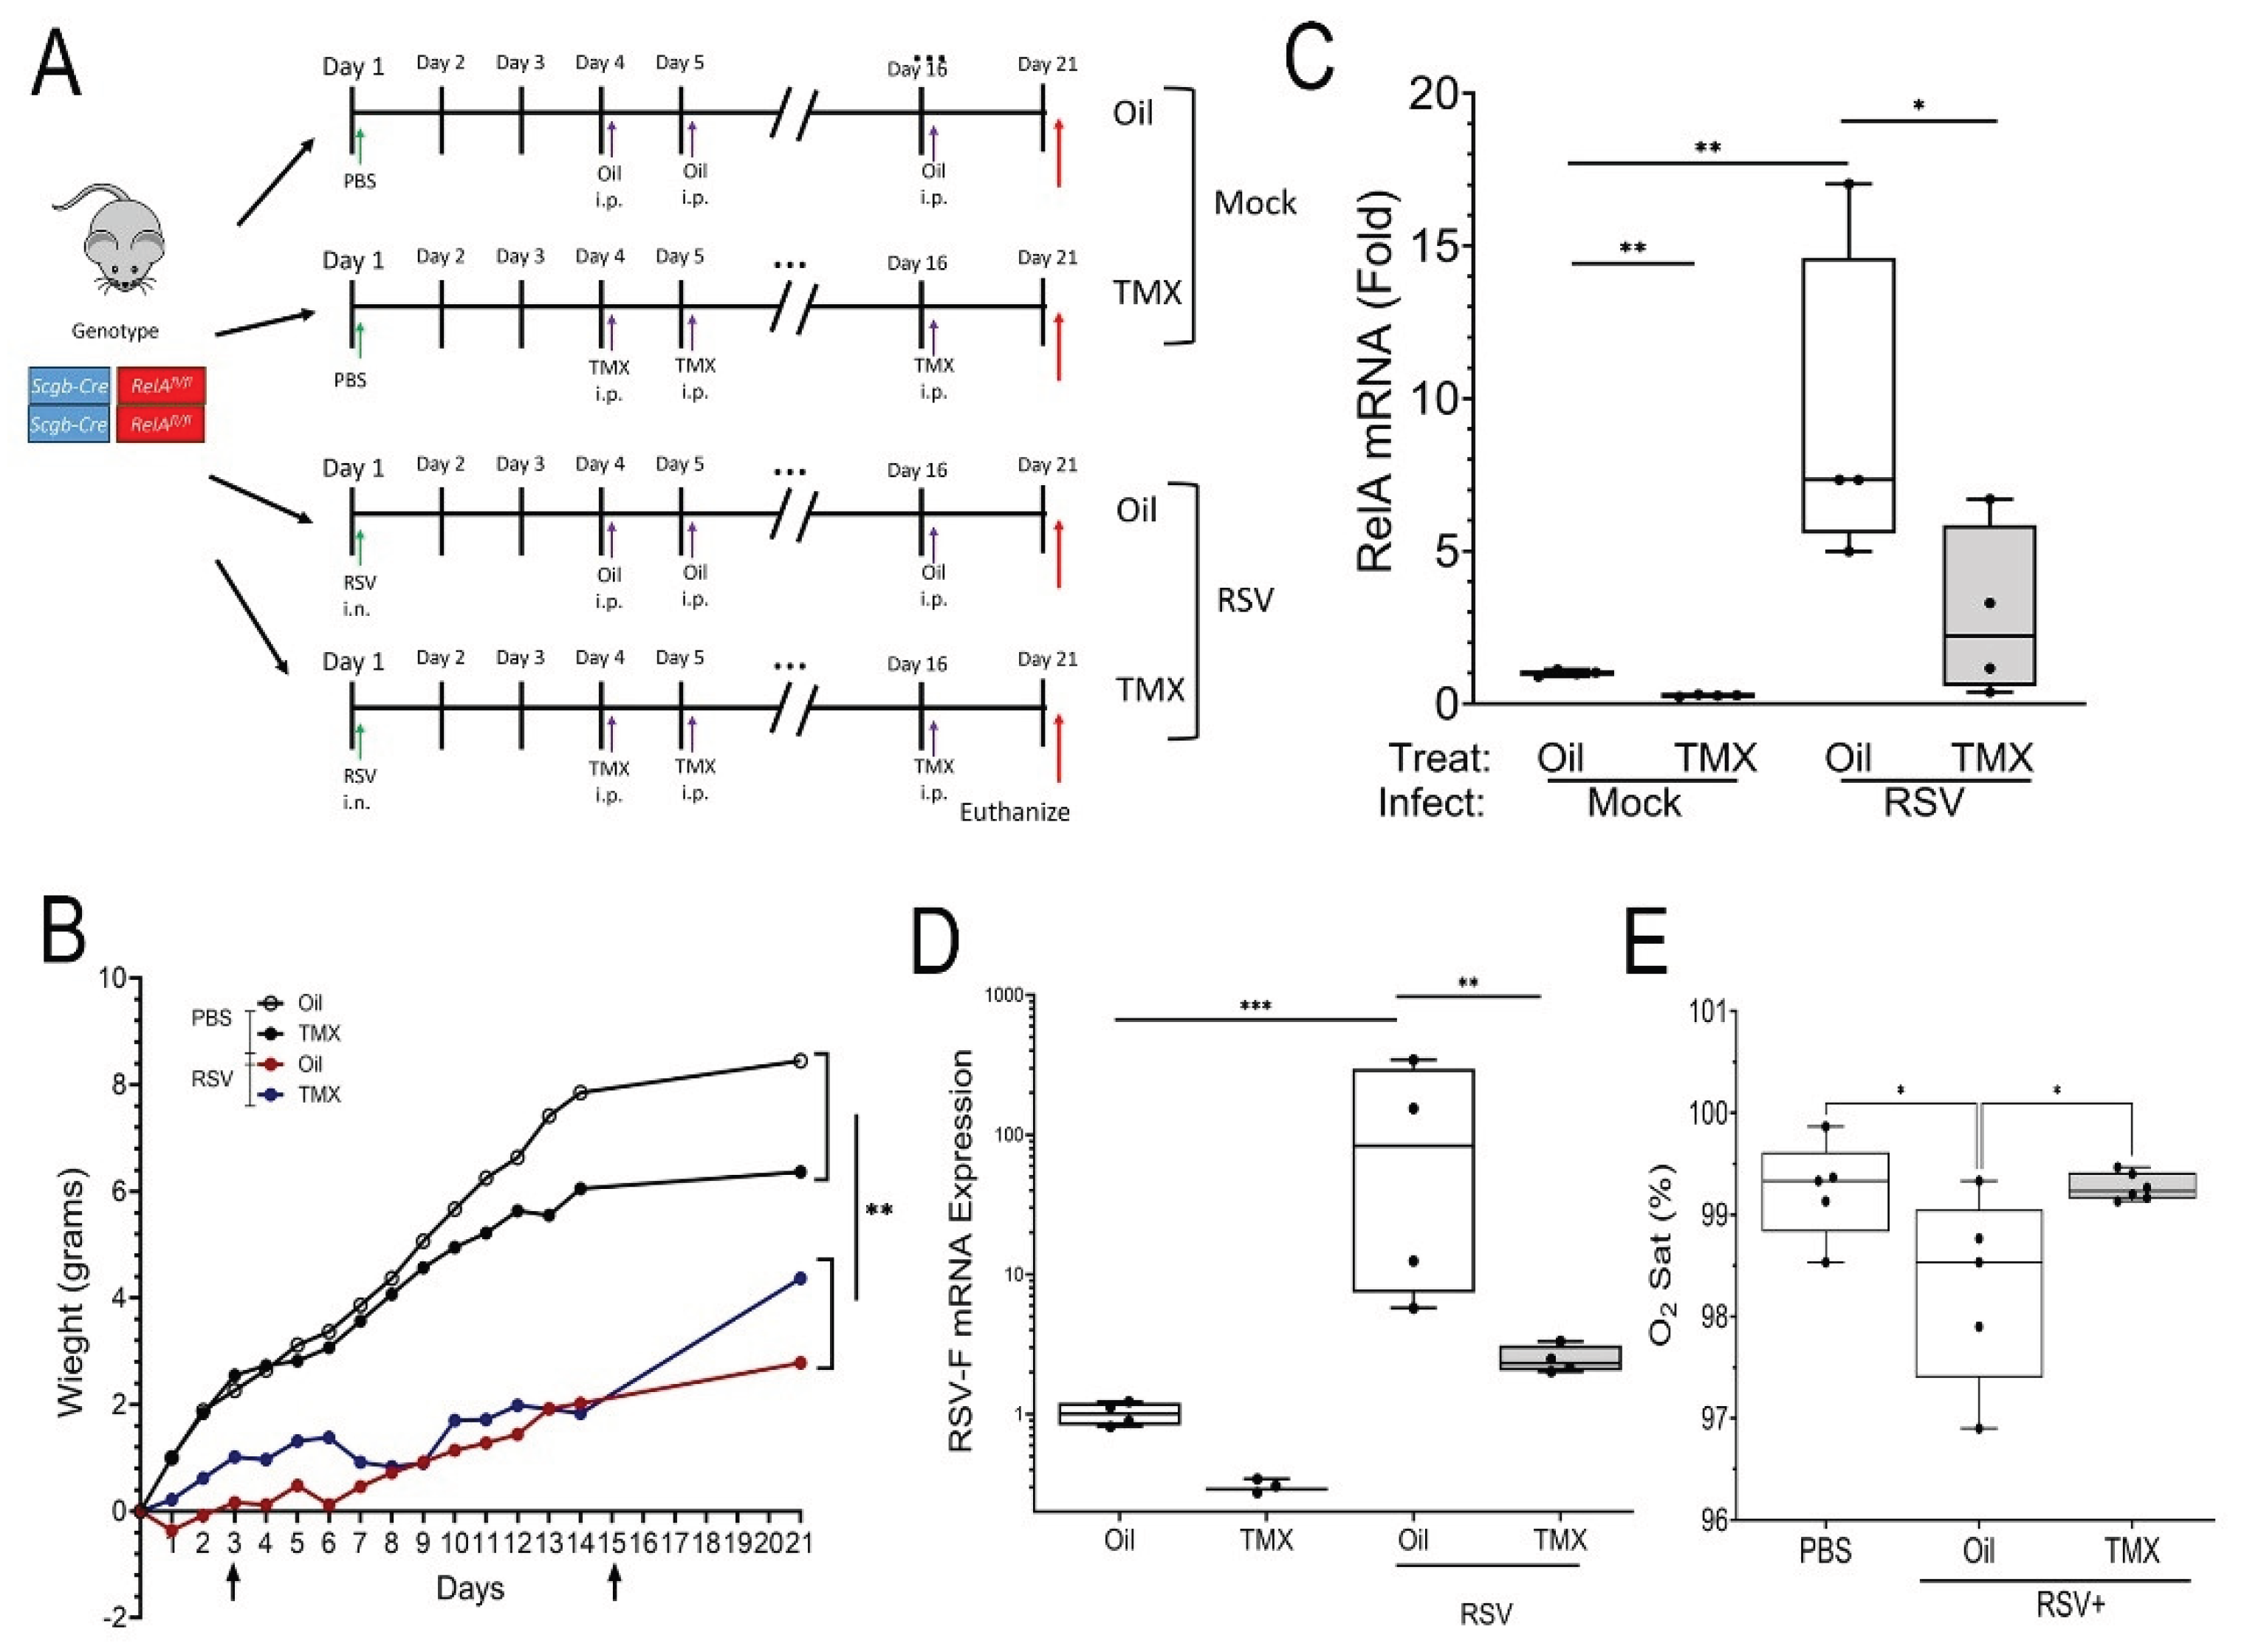
Figure 3.
Histological features of RSV-PVLD. Hematoxylin and eosin (H&E) staining. For each treatment 4X and 20X images of representative sections are shown. (A), H&E images from mock or RSV-infected mice. Oil, vehicle-treated; TMX, tamoxifen-treated. Mag, magnification. 4X Mag, scale bar, 330 mm; 20X Mag, Scale bar, 130 mm. (B), Thickness of airway epithelium. For each small bronchiole, 11 measurements of epithelial thickness were obtained and averaged to create an overall thickness score (See Supplementary Figure S1 for more detail). Each symbol is the average of multiple fields of view from an individual animal (n=5, both sexes). **, P<0.01; ***, P<0.001.
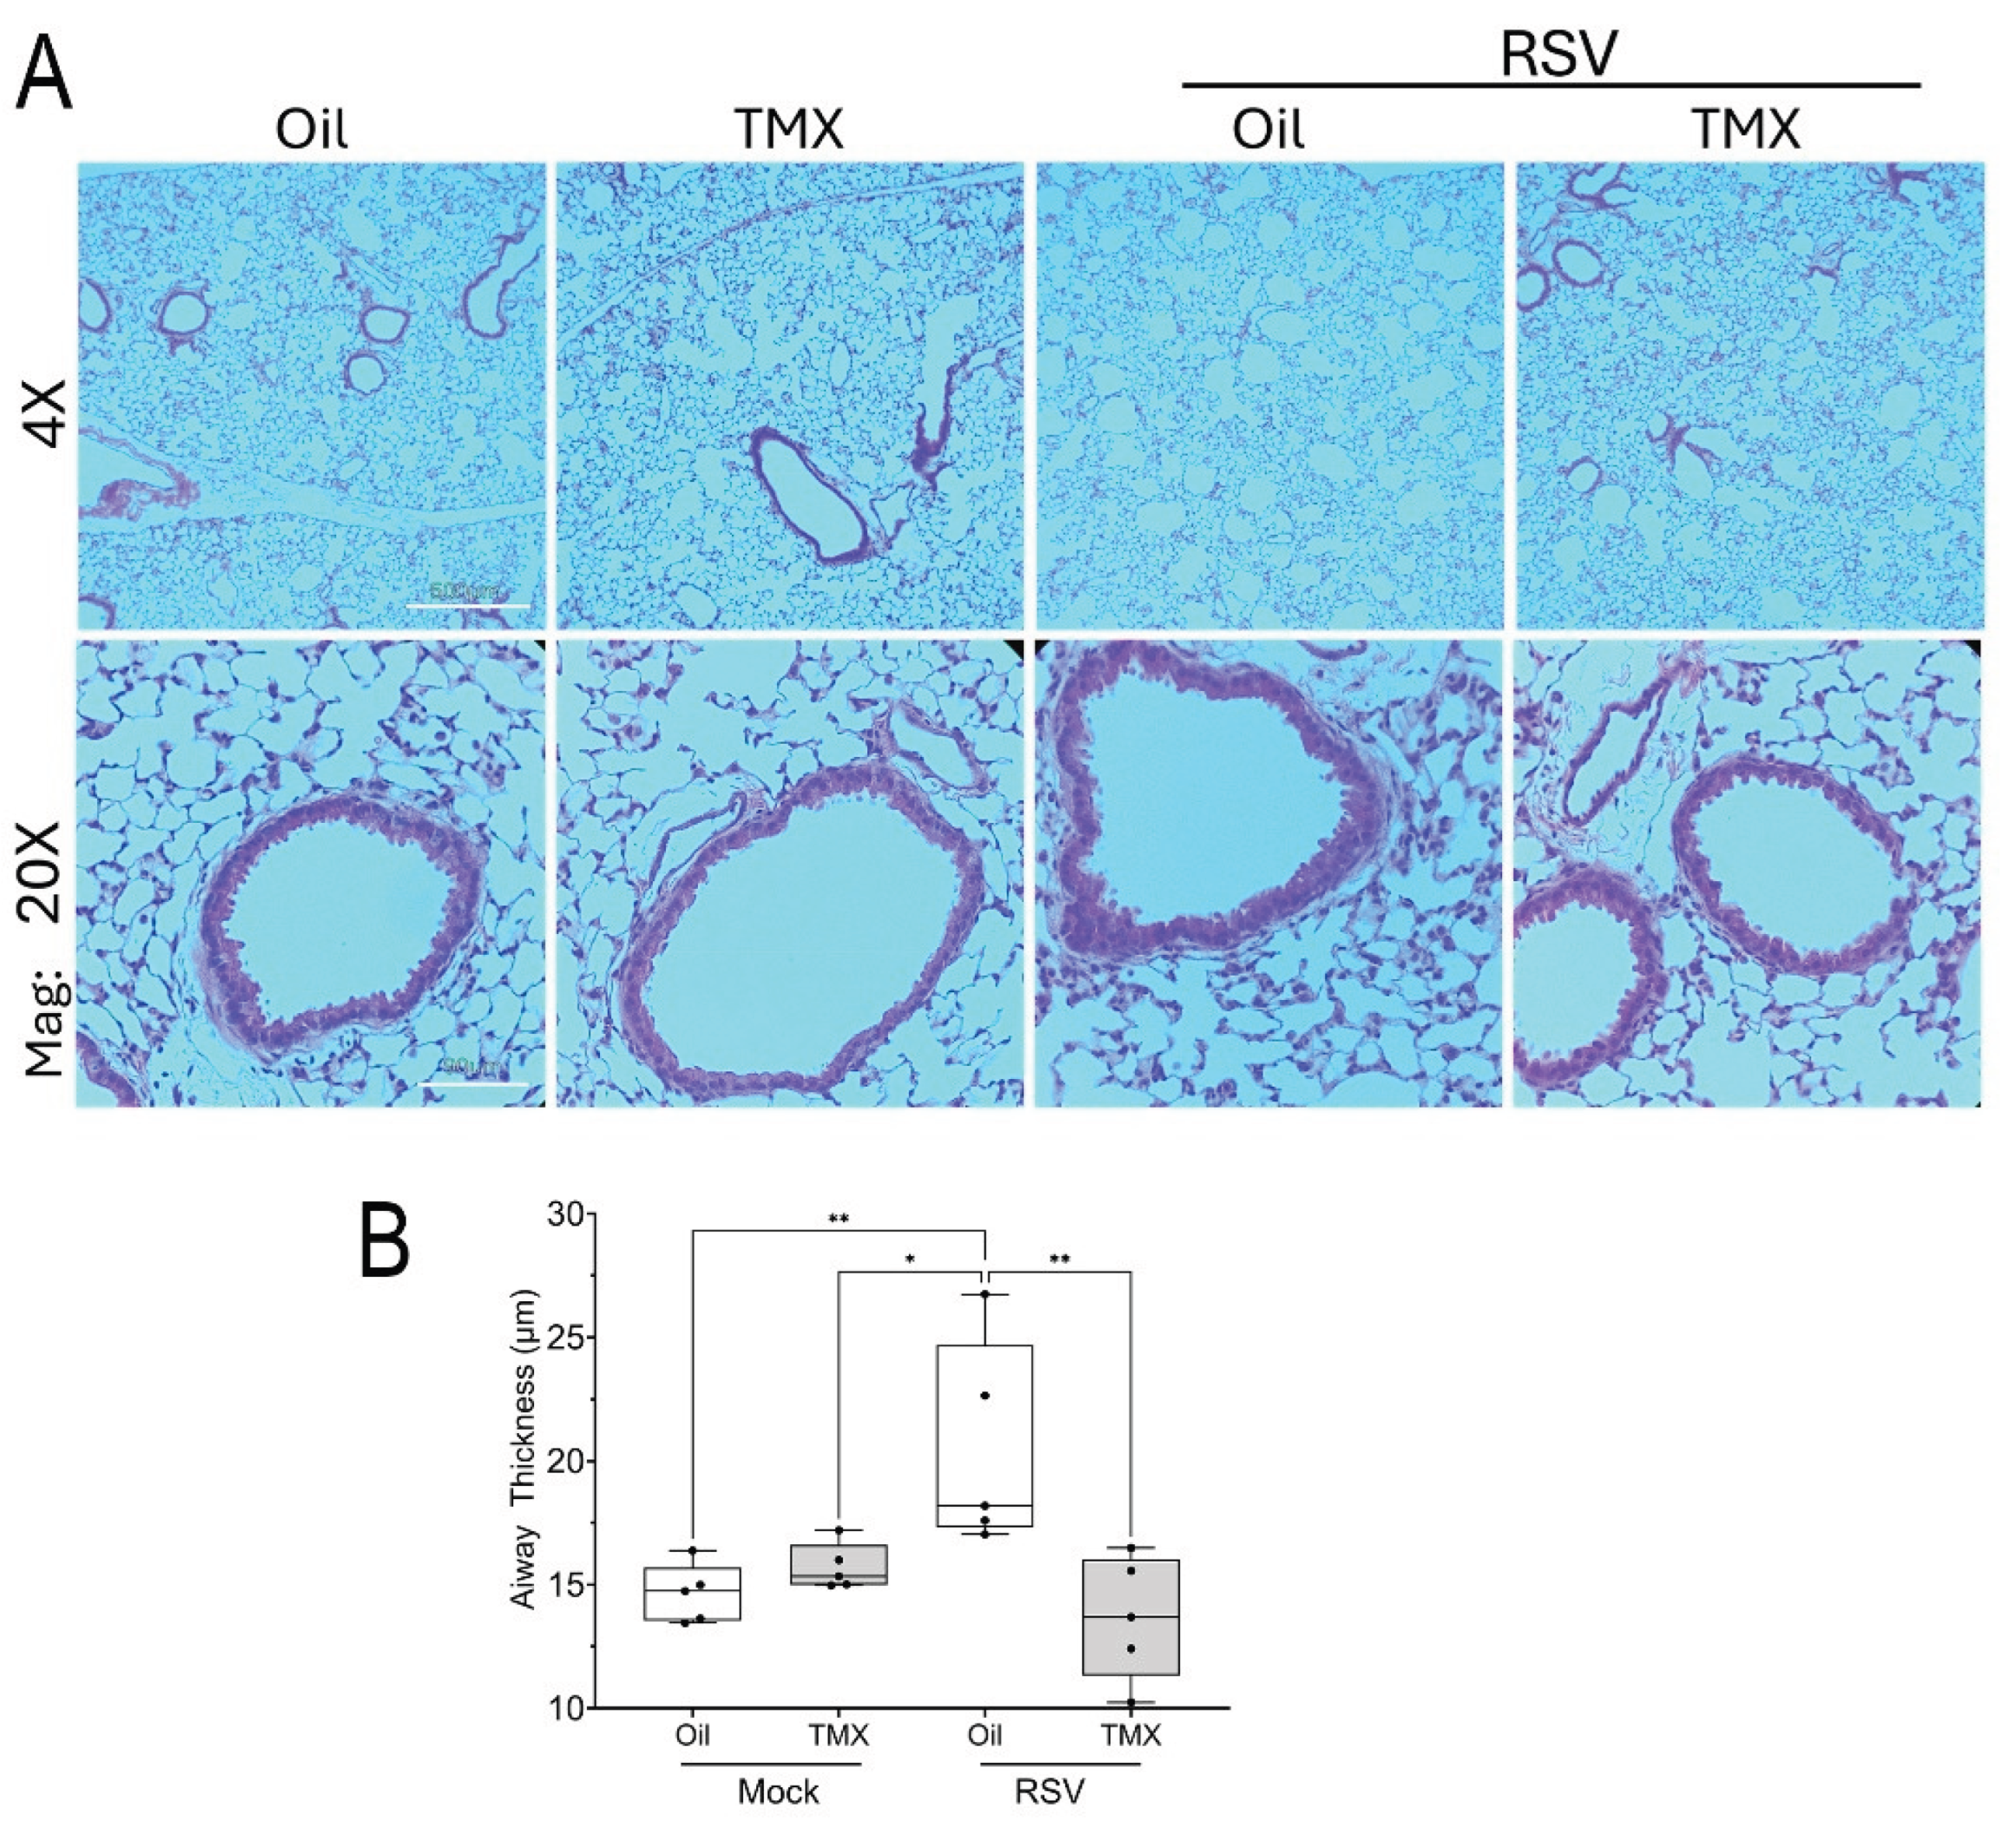
Figure 4.
Expansion of small airway and alveolar progenitor cells. (A), Q-RT-PCR for Aqp3 mRNA in total lung RNA normalized to Gadph as internal control. Shown is 25-75% IQR; each symbol is an independent animal. *, P< 0.05; **, P<0.01. (B), IFM for AQP3 in a representative image from each treatment group. At top, shown is merged image of AQP3 (green) fluorescence with DAPI nuclear stain (blue). At bottom AQP3 IFM only. Scale bar, 40 mm. (C) Quantitation of total AQP3 IFM, AU, arbitrary fluorescence units. Each symbol is average of multiple images for each individual animal (n=5). ****, P<0.0001. (D), Q-RT-PCR for Gadph-normalized Trp63 mRNA in total lung RNA. **, P<0.001. (E), IFM for TRP63 in a representative image. At top, shown is merged image of TRP63 (red) fluorescence merged with DAPI nuclear stain (blue), 40X. At bottom TRP63 IFM only. Scale bar, 40 mm. (F), Quantitation of TRP63 in IFM in AU. ****, P<0.0001.
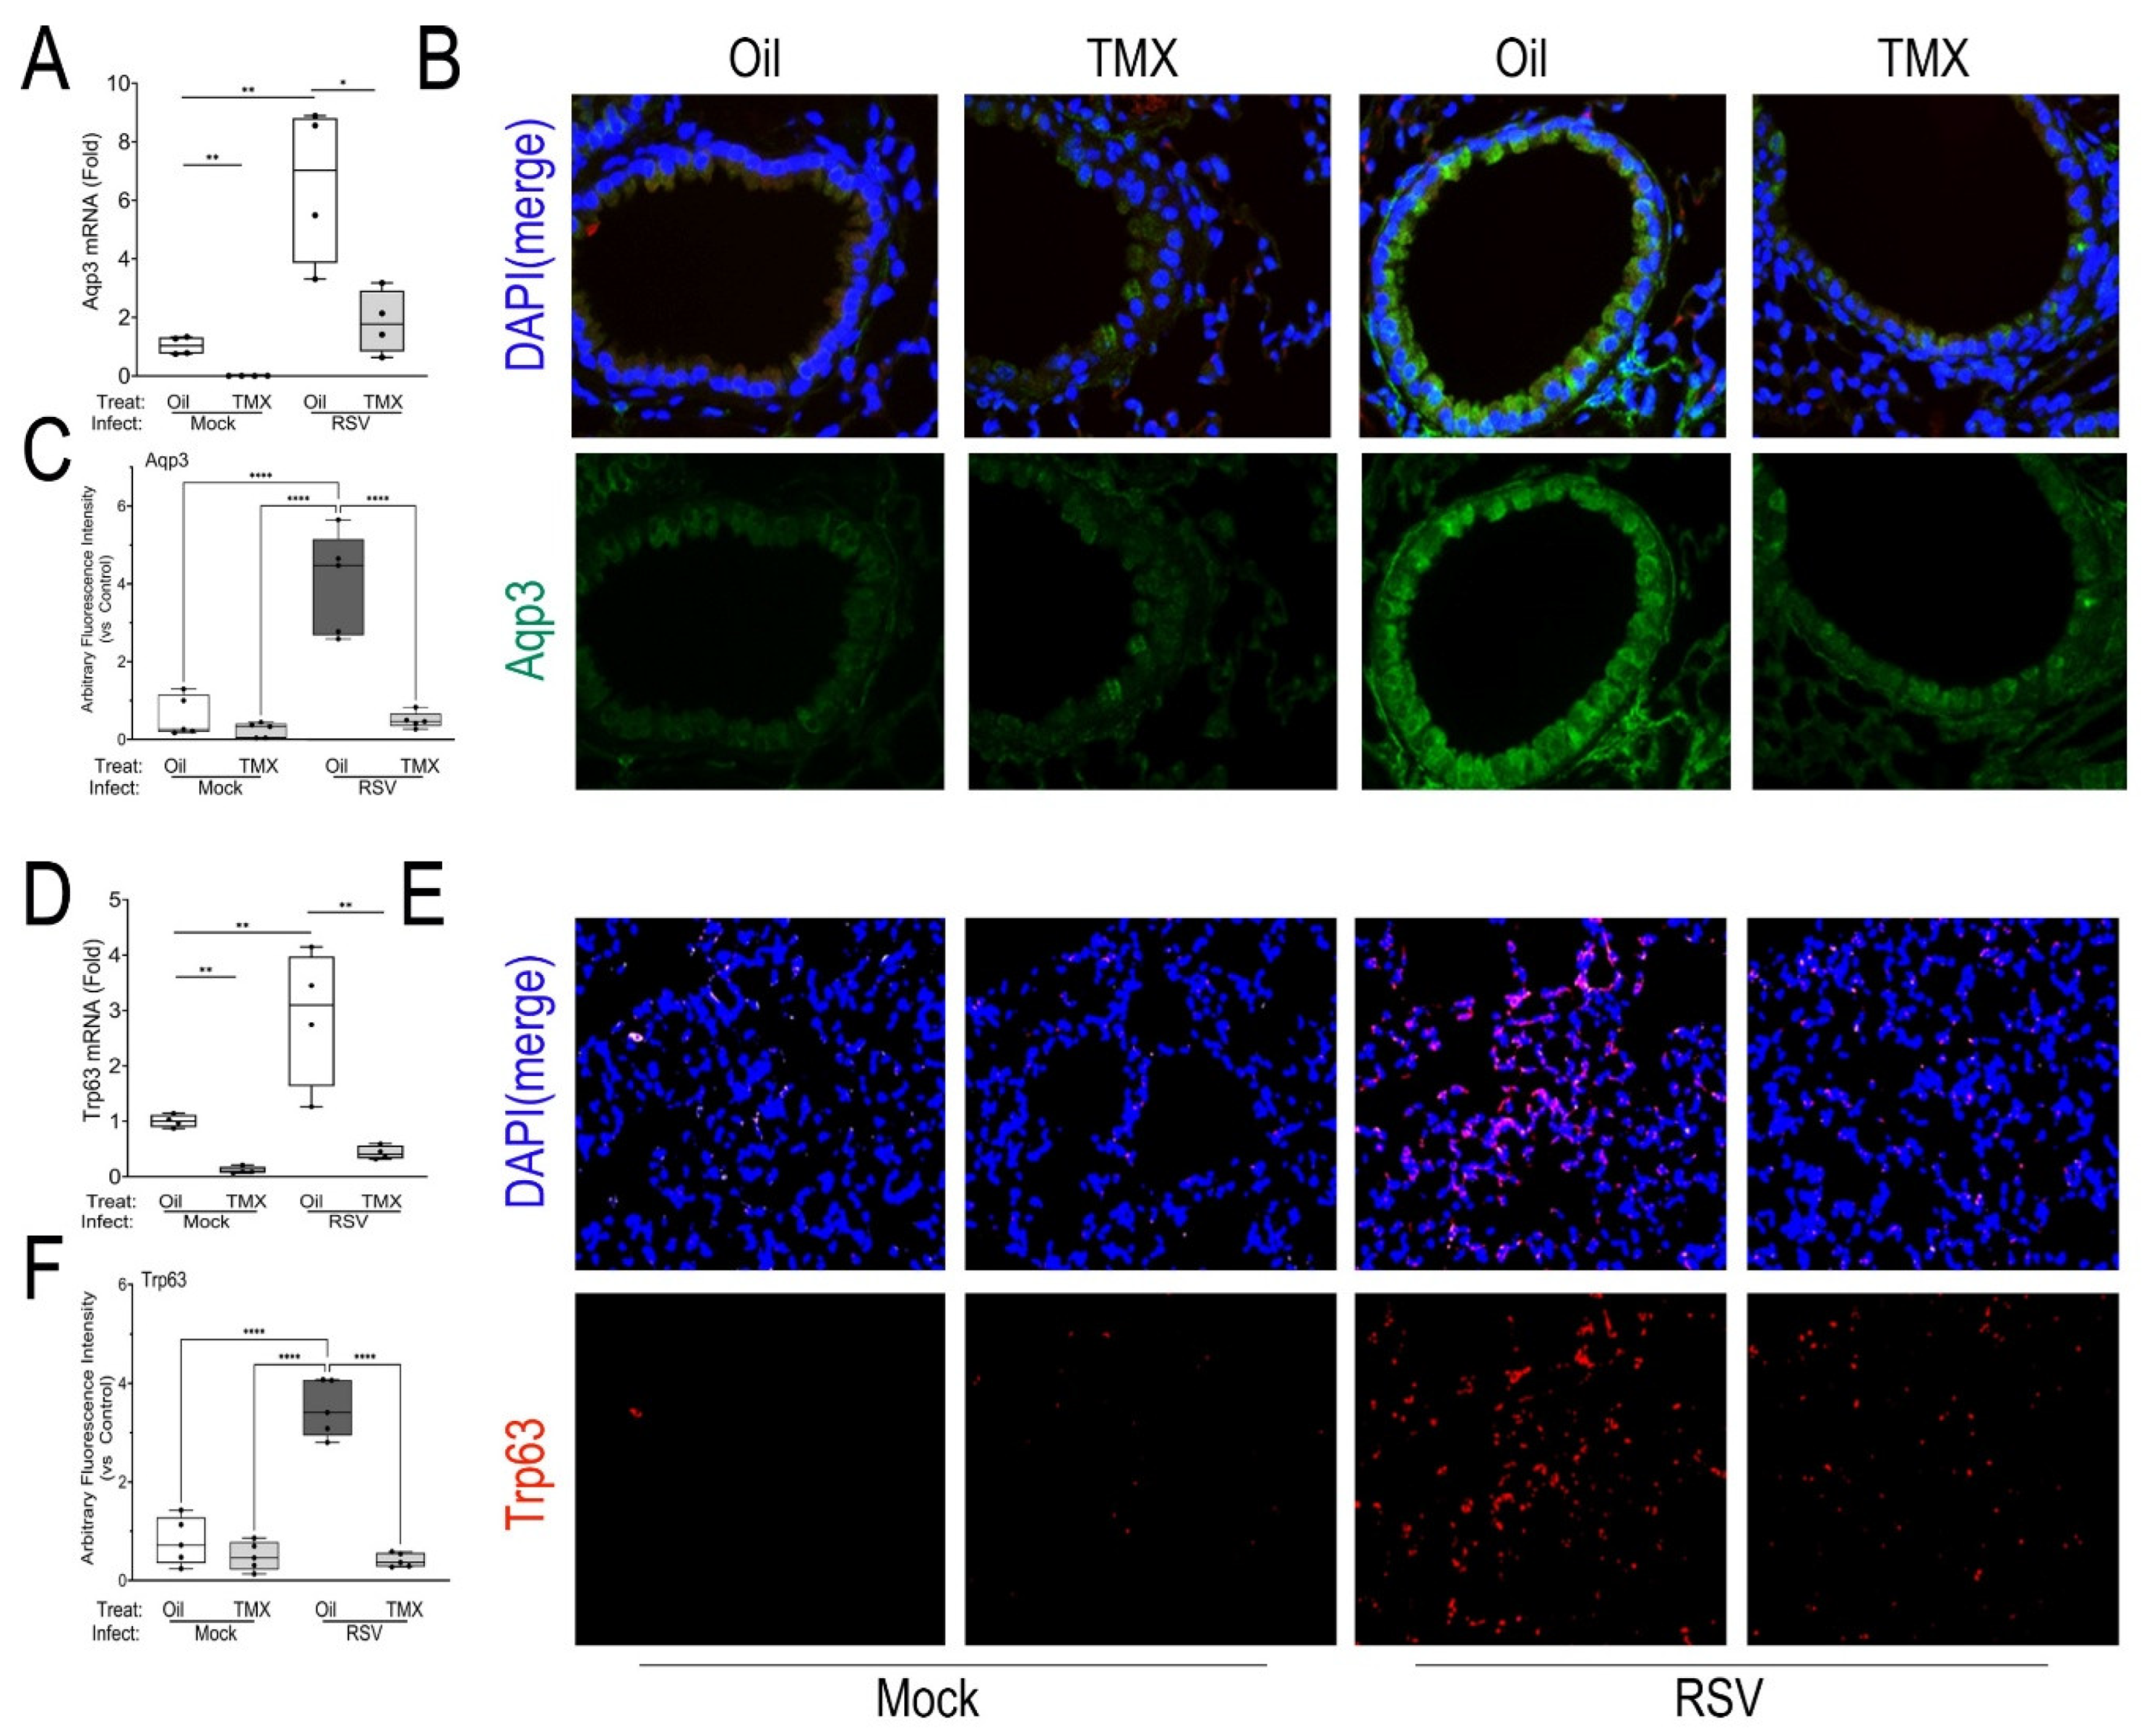
Figure 5.
scRNA sequencing analysis. (A), Uniform Manifold Approximation and Projection (UMAP) representation of single cell RNA sequencing of epithelial and mesenchymal cell populations from total lung homogenates from Mock-infected, vehicle-treated, RSV-infected, vehicle-treated or RSV-infected TMX-treated animals harvested 21 d after infection (see Supplementary Figure S3 for complete spectrum of cell types identified). Each symbol represents single cell, colored by nearest-neighbor (leiden) clusters and identified by majority voting of cell markers and unique gene expression modifiers. Abbreviations used: AT, alveolar type; Krt, keratin; Fibro, fibroblast; Fn, fibronectin; Gob, goblet; Hif, hypoxia inducible factor; Lrg, Leucine Rich Repeat Containing G Protein-Coupled Receptor; Lyz, lysozyme; Peri, pericyte. (B), UMAP representation of cell types by treatment. Note the presence of distinct populations of aAT2 and Krt8+Club cells induced by RSV in vehicle-treated mice or by RSV with RelA CKO. (C) Cell types expressing Scgb1a1. Shown is relative expression of Scgb1a1 mRNA overlaid on the parent UMAP. Note the high Scgb1a1 expression by the Krt8+Club and Club cells. Scale is shown at right. (D), Cell types expressing Sftpc. Shown is relative expression of Sftpc mRNA overlaid on the parent UMAP. Note the high Sftpc expression by the aAT2, Lyz+AT2 and Mki67+AT2 cells. Scale is shown at right. (E), Heat map of epithelial cell populations for major epithelial cell markers. Abbreviations: Sftp, surfactant protein; Lyz, lysozyme; SDC, syndecan; Hhip, hedgehog interacting protein; Hopx, HOP homeobox, Itgb4, integrin 4; Taglin, transgelin. (F), Dotplot of most highly variable genes for each cell type assignment. Circle diameter refers to percentage of cell population; color indicates expression level of indicated gene. Note the unique AT2 cell markers surfactant (Sftp)-C and D in the AT2 population and expression of the AT1 marker, Ager mRNA in the same population; and expression of the progenitor marker Hopx in the Krt8+Club cell. (G), Cell frequency of epithelial and mesenchymal cell populations by treatment. For each cell type in each treatment, the frequency of cells normalized to total cells was calculated. Mock, mock-infected/vehicle-treated; RSV, RSV-infected/vehicle-treated; RKD, RSV-infected, RelA knockdown (RelA CKO).
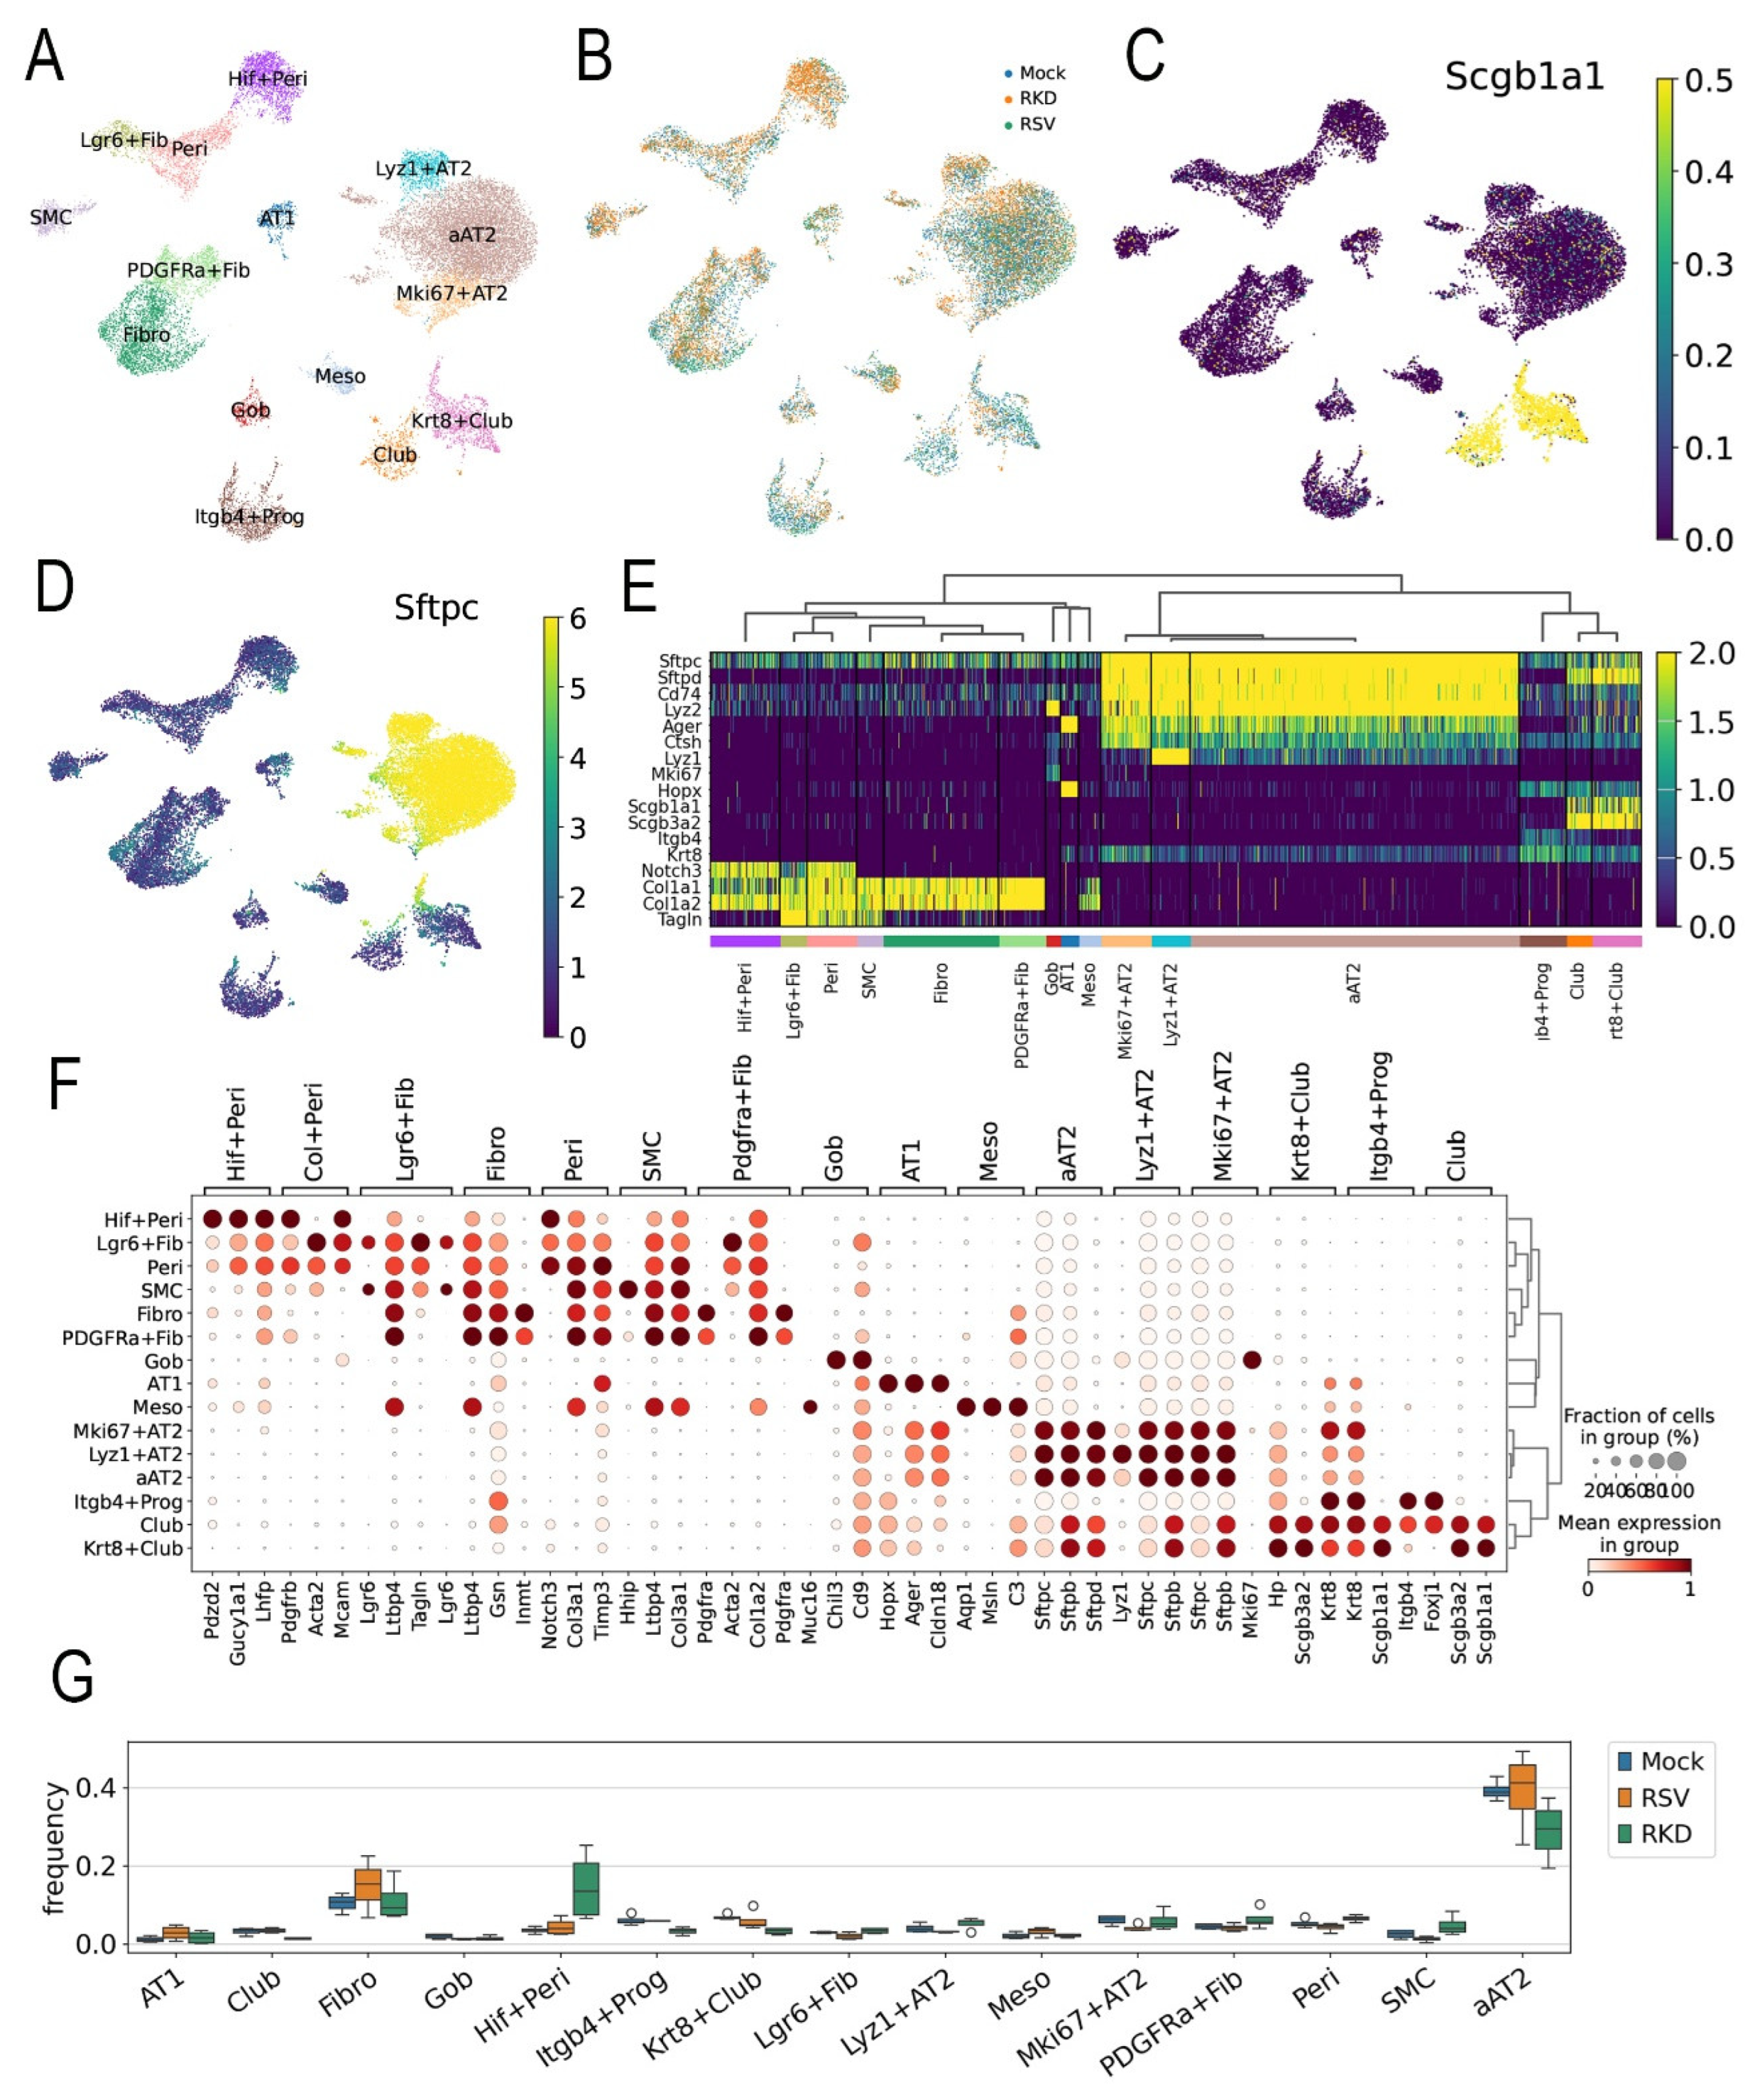
Figure 6.
Lineage tracing of Scgb1a progenitor cells. (A), Schematic view of lineage tracing experiment. RSV-PVLD was first induced, followed by TMX treatment 3-8 d prior to harvest at 21 d post infection. (B), GFP fluorescence in bronchiole (top) and alveoli (bottom) for Mock or RSV-infected mice. Shown is a representative image from each treatment group. (C), Quantitation of total GFP in alveoli. AU, arbitrary fluorescence units. Each symbol is average of multiple images for each individual animal (n=4). ***, P<0.001. (D), IFM for EGFP, RSV F glycoprotein and TRP63 in Mock-infected (top) or RSV-infected mice (Bottom row). Shown is a representative image from each treatment group. (E), Quantitation of RSV F glycoprotein staining. AU, arbitrary fluorescence units. Each symbol is average of multiple images for each individual animal (n=4). (F), Quantitation of TRP63 staining.
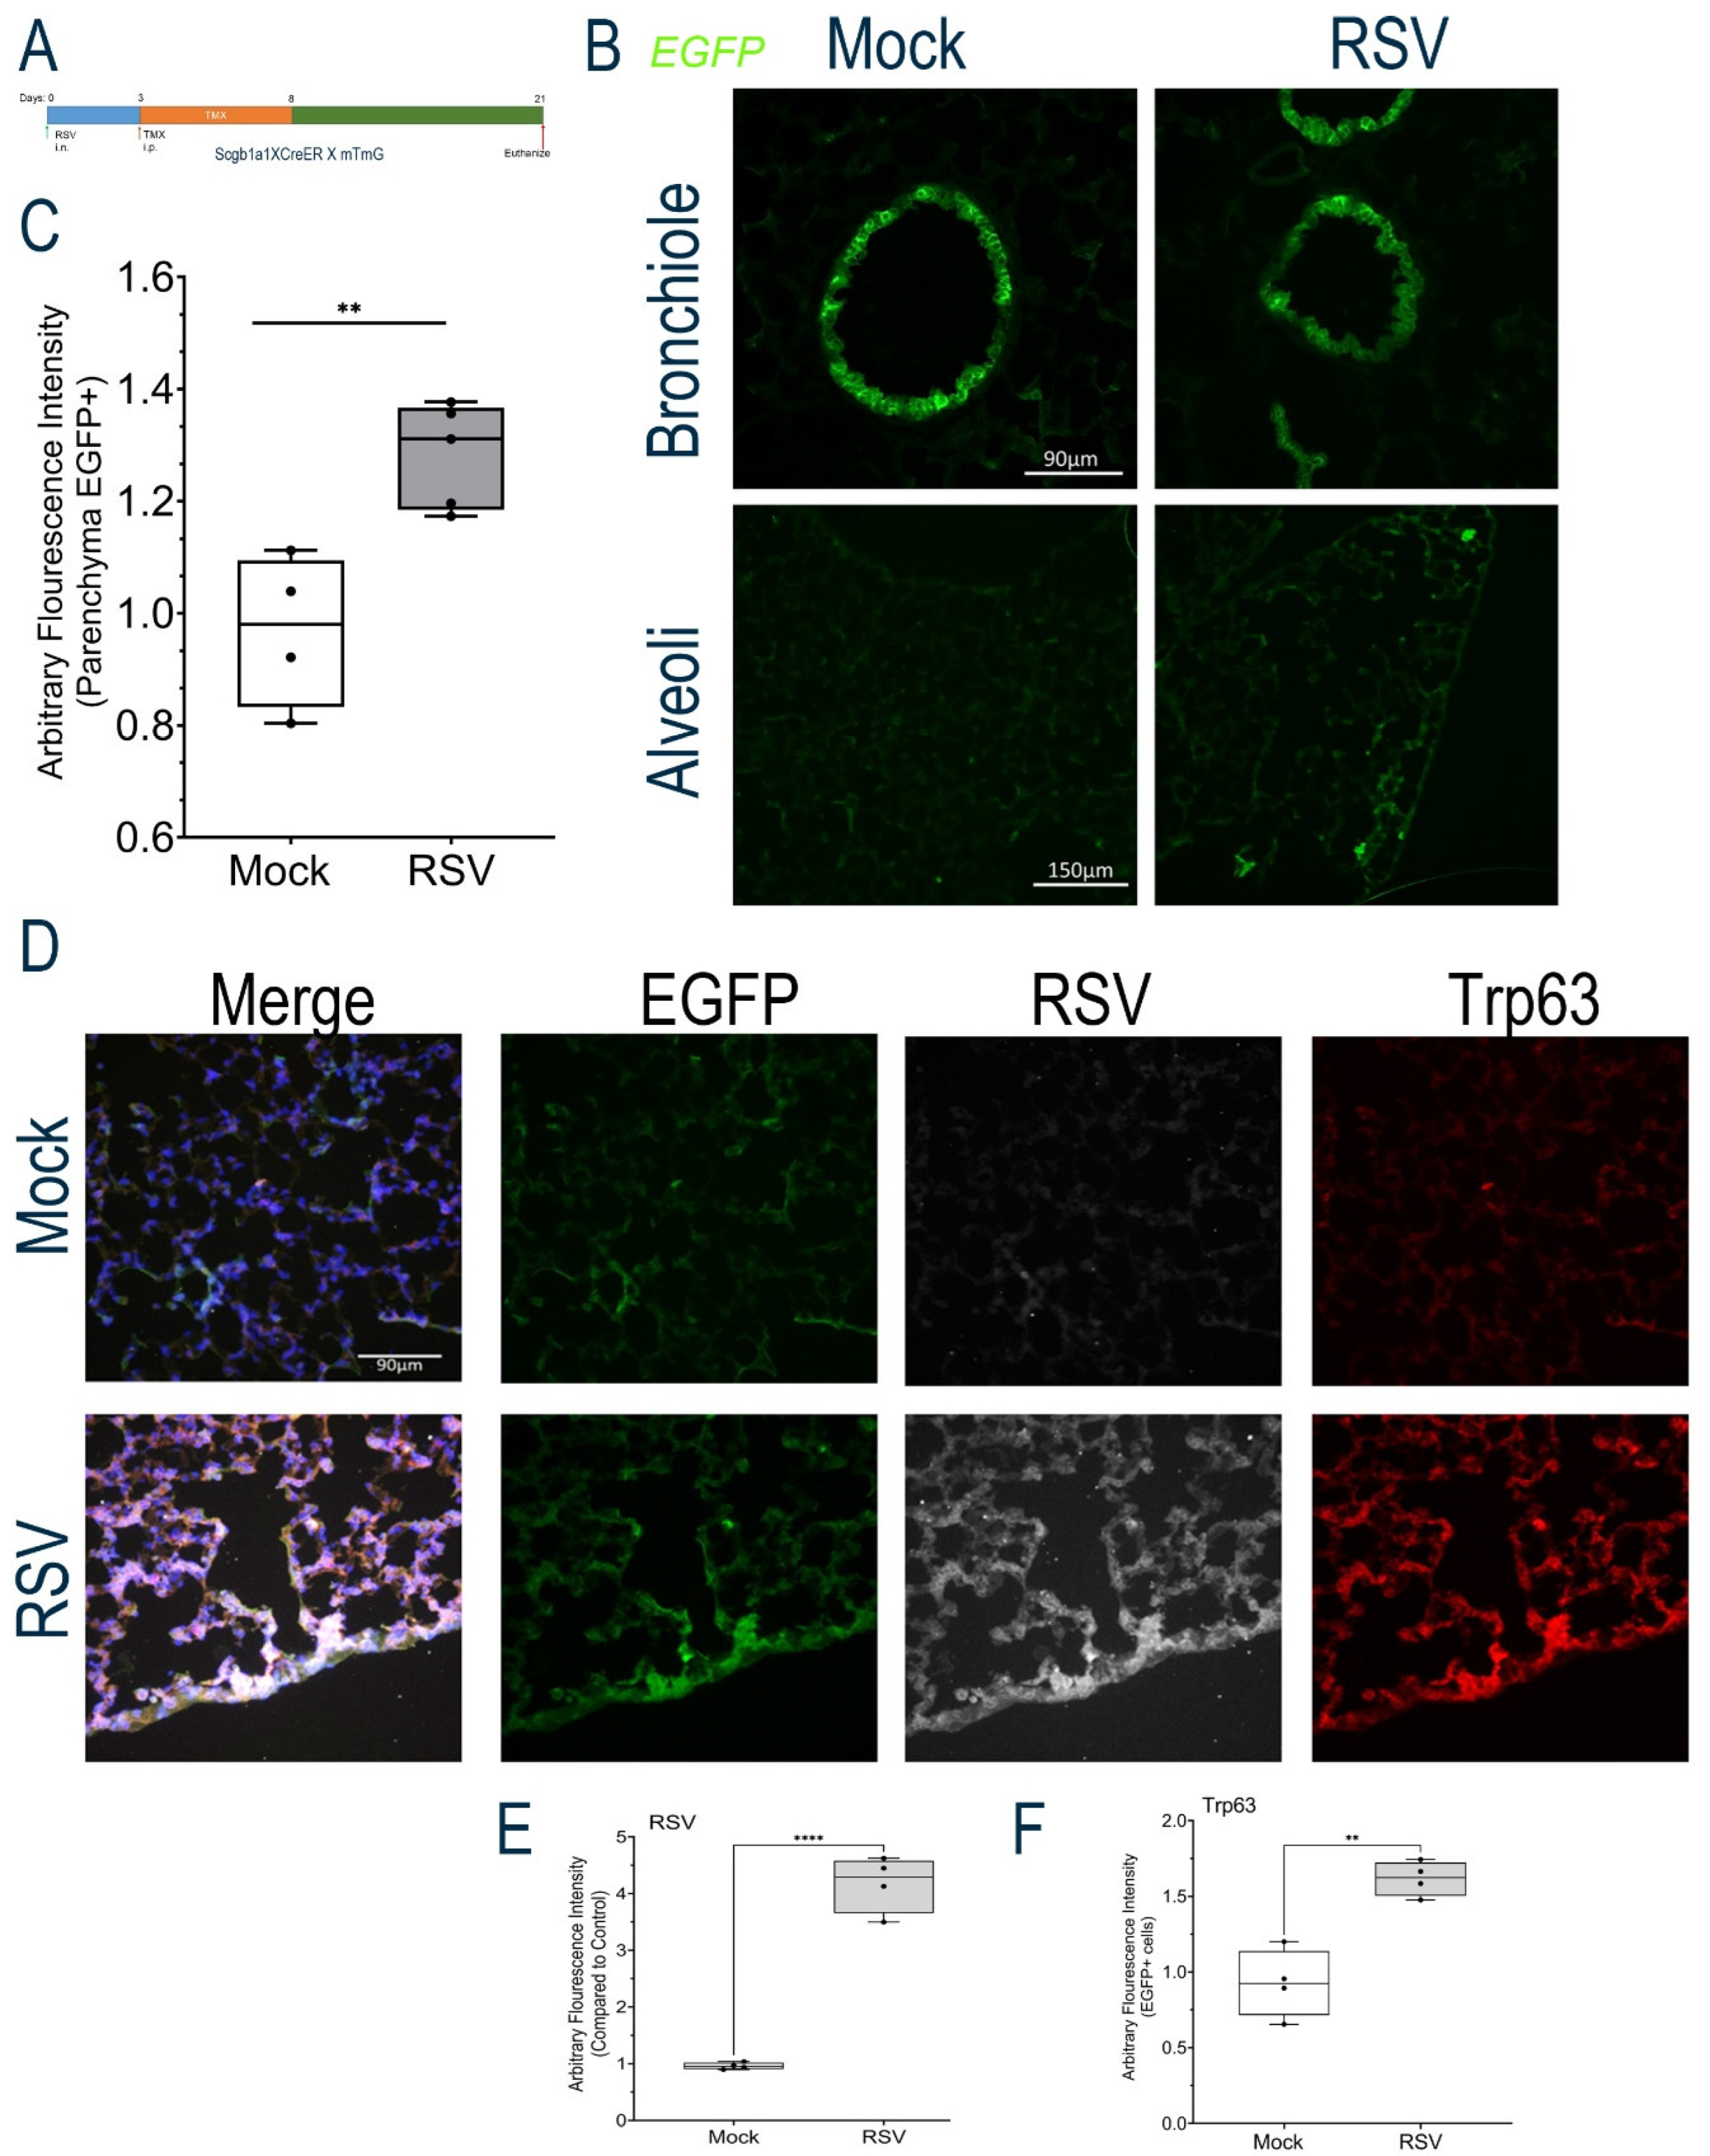
Figure 7.
RSV-induced differentially expressed genes (DEGs). Pseudobulk analysis of DEGs in response to RSV infection. Differential gene expression in mock-infected, vehicle treated aAT2 cells (A,B) or Pdgfra+ Fibroblasts (C,D) was estimated with pseudobulk methods, correcting for multiple hypothesis testing [54]. (A,C), Volcano plots of Log2FC gene expression vs -Log10(pVal) for significant genes are shown. Highly up- and down-regulated genes are shown. (A), aAT2 cells; (C), Pdgfra+ Fibroblasts. Selected abbreviations: Cry1, Cryptochrome Circadian Regulator 1; Cry1, Cryptochrome Circadian Regulator 1; Dbp, D-Box Binding PAR BZIP Transcription Factor; Egr1, Early Growth Response 1; Nr1d, Nuclear Receptor Subfamily 1 Group D Member; Rorc, RAR Related Orphan Receptor C. (B,D), Genome Ontology enrichment of DEGs. Top 15 biological pathways identified for DEGs are shown. For each pathway, the fraction of genes represented in the pathway (Ratio, bars) and the adjusted False Discovery Rate (FDR, circles) are shown. (B), aAT2 cells; (D), Pdgfra + Fibroblasts.
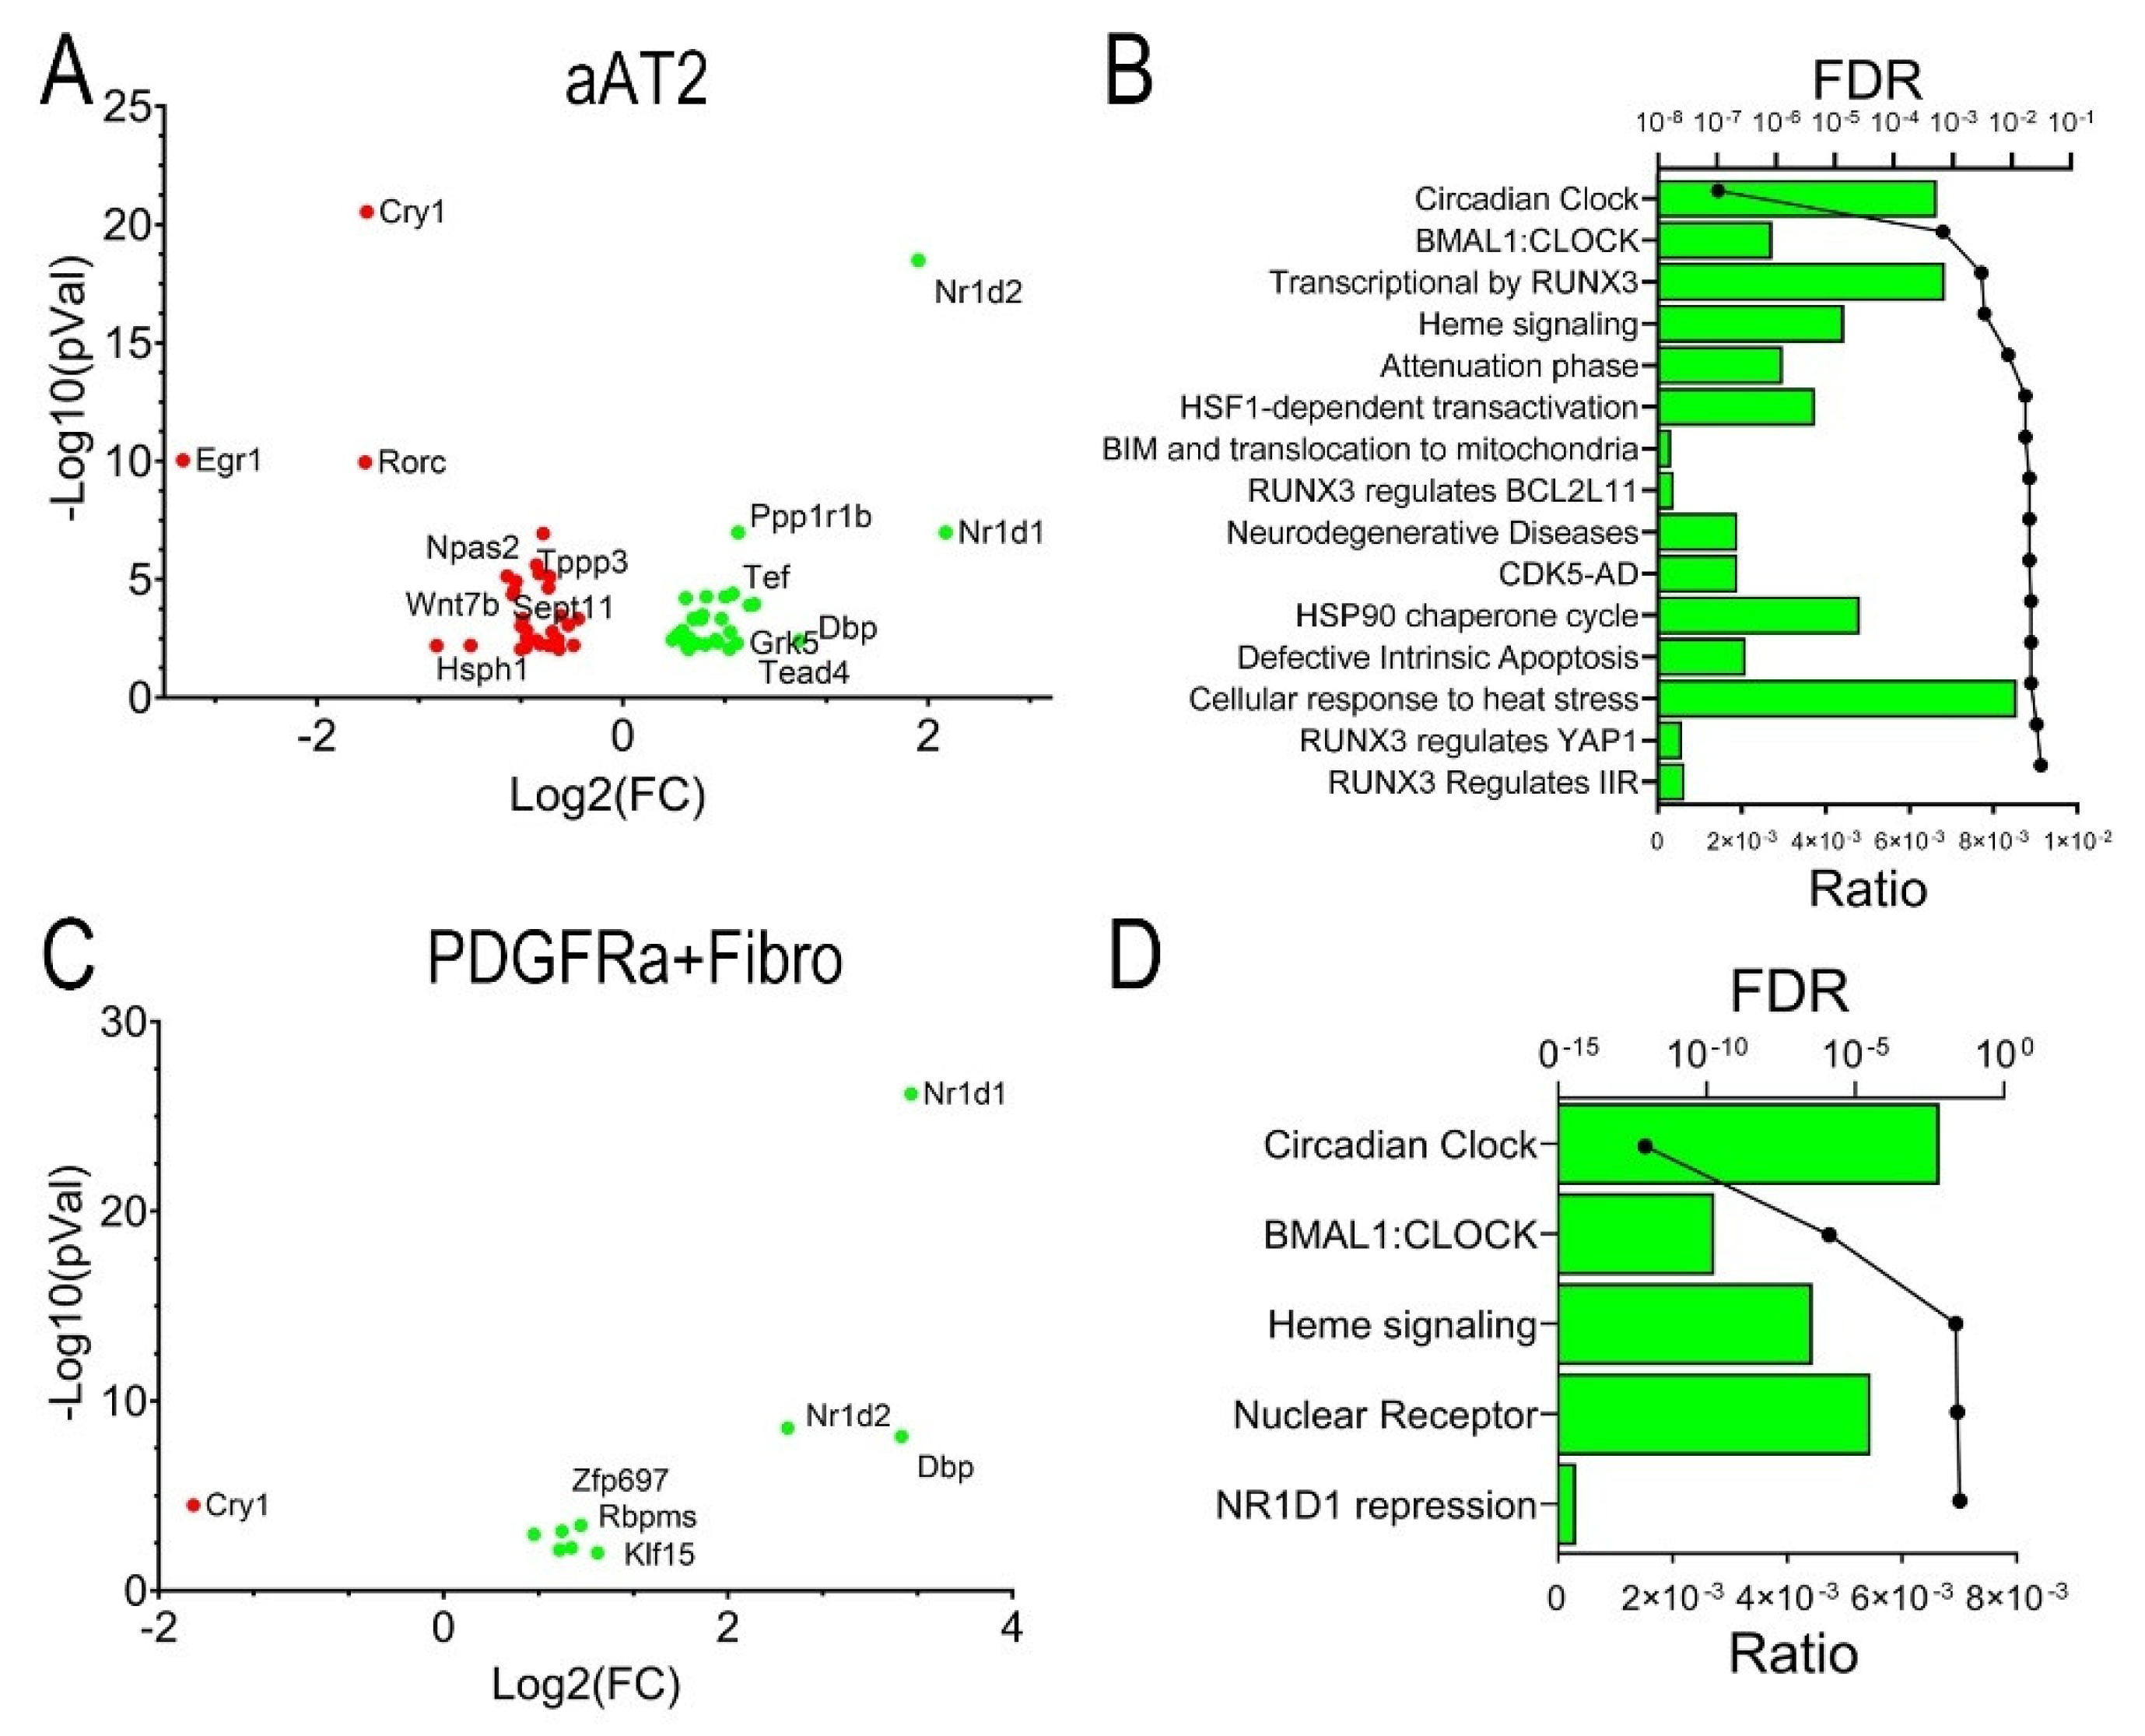
Figure 8.
Dysregulation of the BMAL-Nr1d1 clock pathway. (A-D) Q-RT-PCR for BMAL-Nr1d1 pathway genes in total lung RNA normalized to Gadph as internal control. Shown is 25-75% IQR; each symbol is an independent animal. (A), Bmal mRNA, (B), Nr1d1 mRNA, (C), Nr1d2 mRNA, (D) Clock1 mRNA. *, P< 0.05; **, P<0.01. (E), IFM for NR1D1. Shown is a representative image from each treatment group. Scale bar, 90 mm. (F), Quantitation of NR1D1 expression in AU.
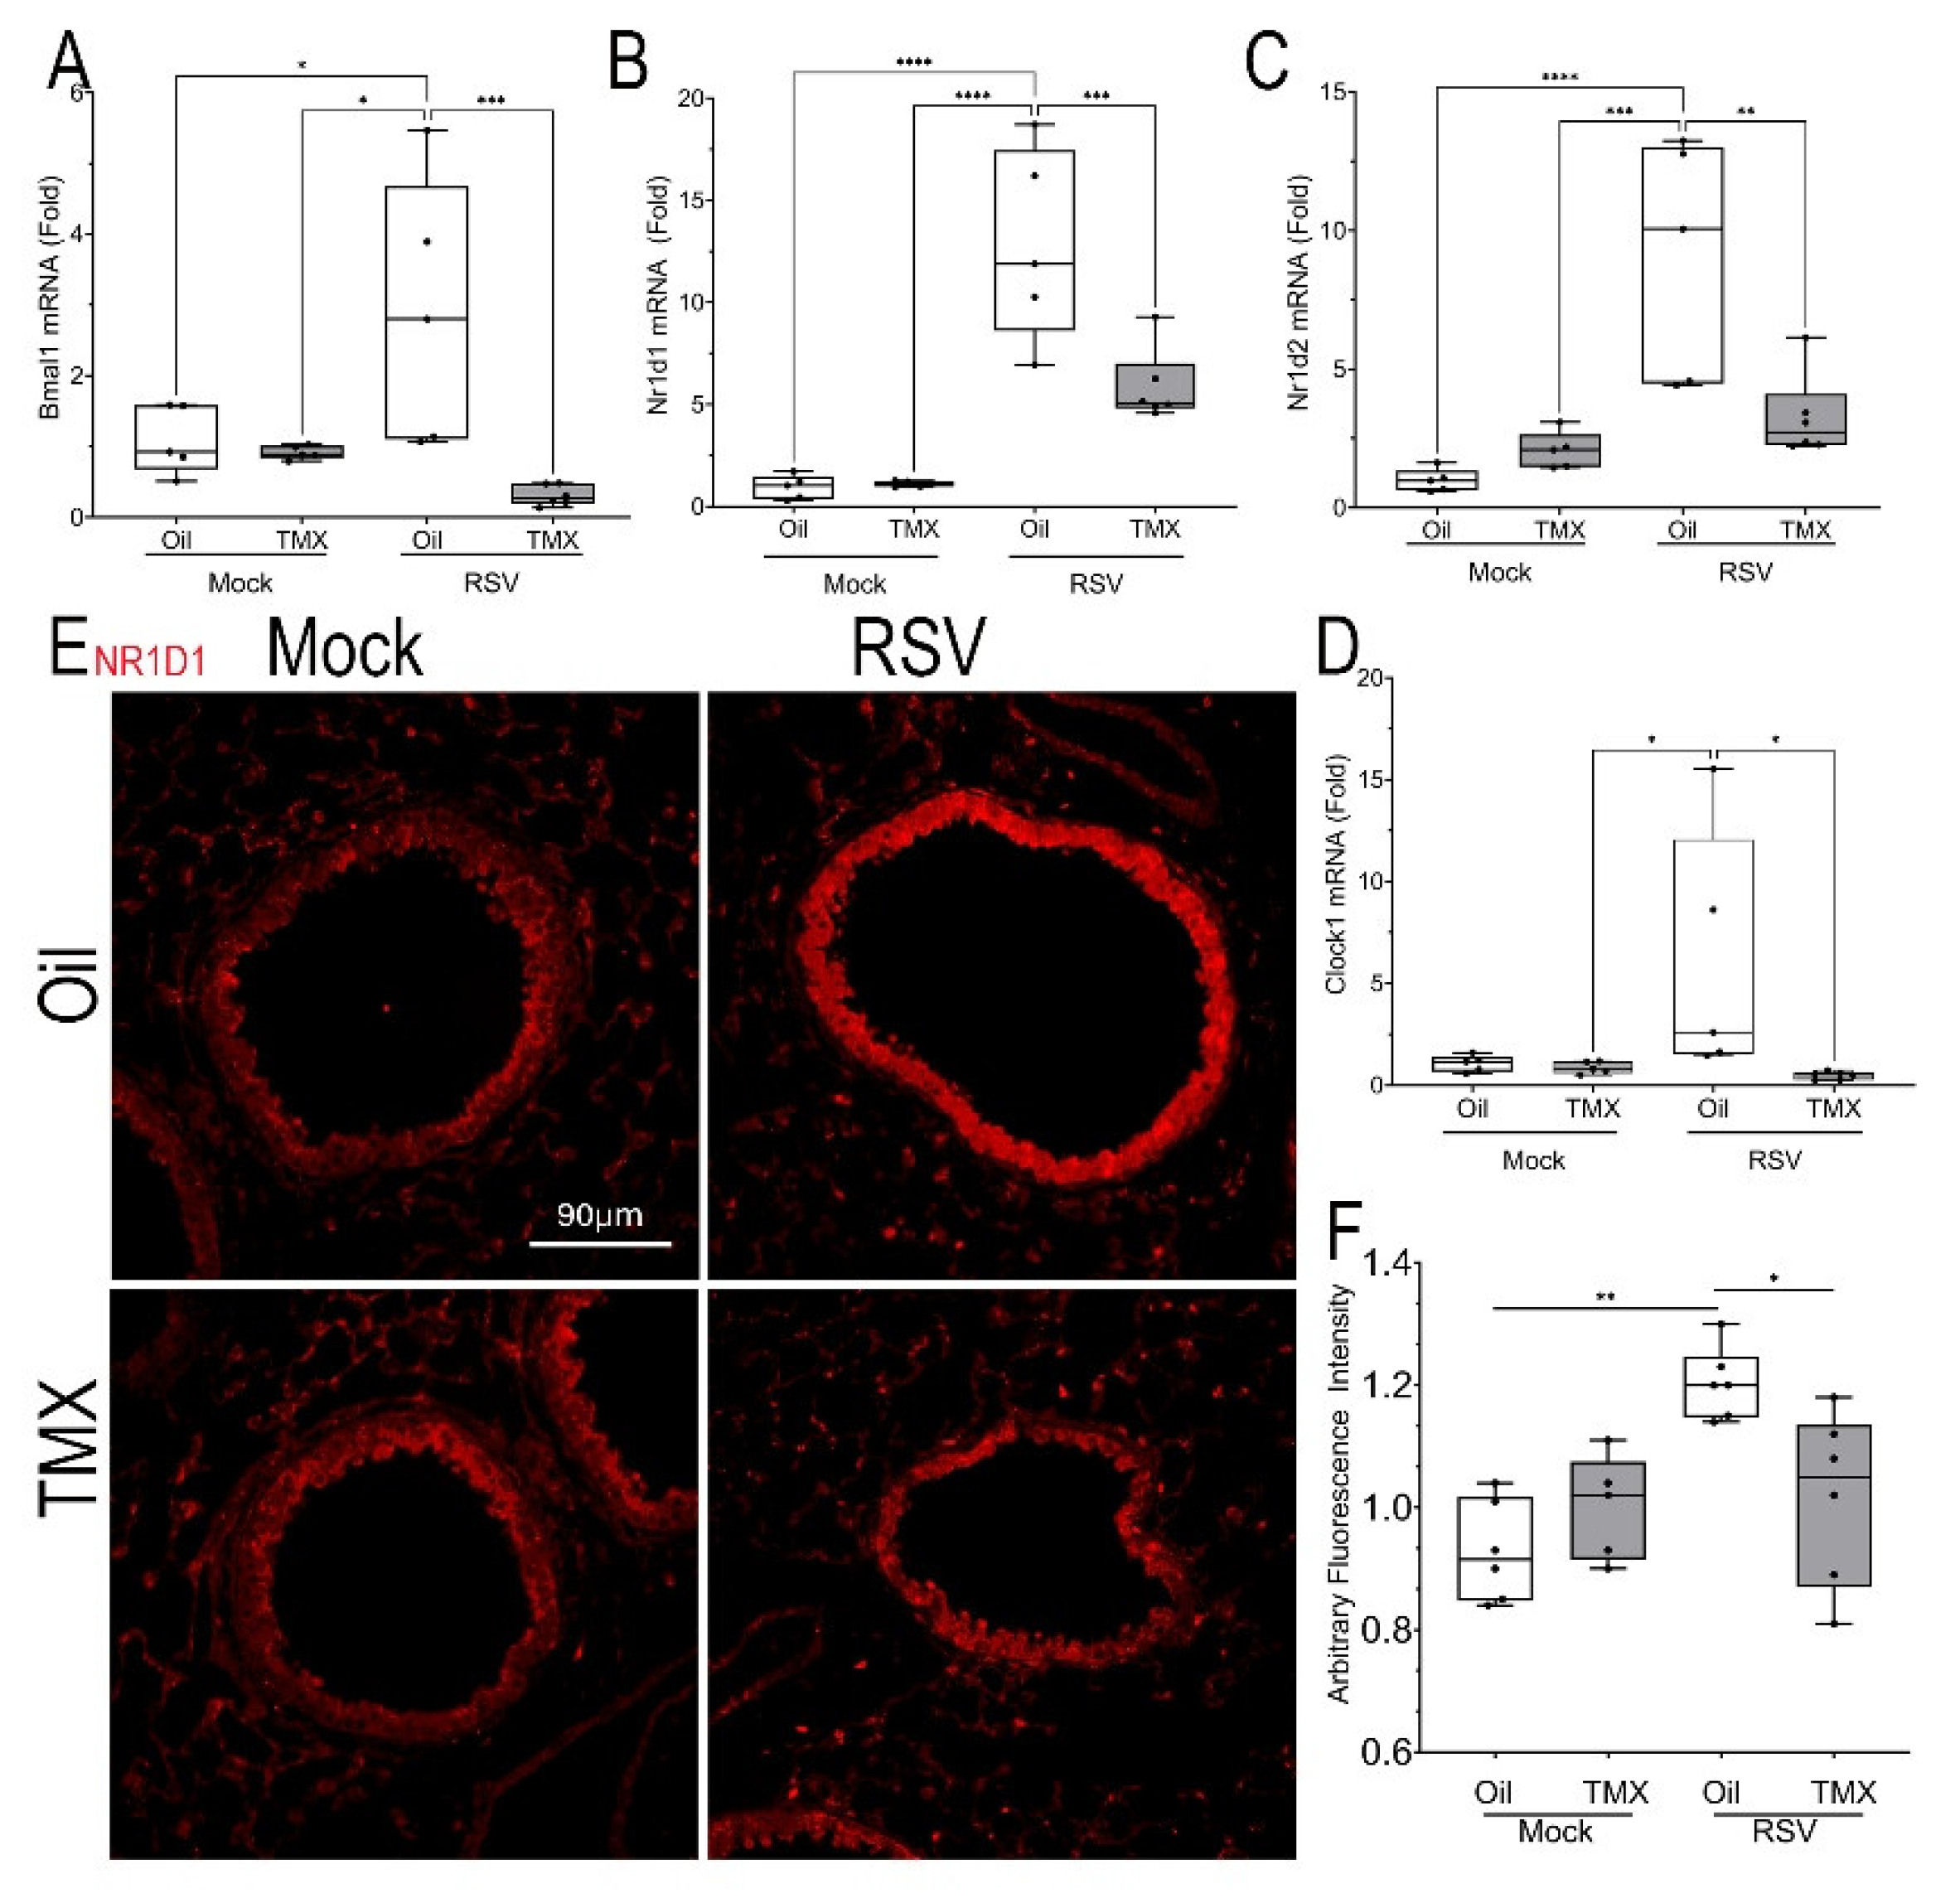
Figure 9.
Intercellular signaling analysis of epithelial-mesenchymal niches. (A-C), 2D global cellular communication network analysis. Each dot represents the communication network of one cell group with incoming signal plotted on the x-axis and outgoing signaling plotted on the y-axis. Dot size is proportional to the overall communication probability. (A), Mock-infected WT; (B), RSV-infected WT; (C) RSV-infected RelA CKO mice. Note the increase in outgoing signals generated by the Hif1+ Peri (arrowhead). (D), Information flow in RSV vs mock-infected mice. All the significant signaling pathways identified were ranked based on their differences of overall information flow between mock and RSV infected mice. The overall information flow of a signaling network is calculated by summarizing all the communication probabilities in that network. The top signaling pathways colored by red are more enriched in mock-infected mice, and the bottom ones in cyan are enriched in RSV-infected mice. Signaling pathways are shown on the y-axis; those colored in red or cyan are significant between treatments at P<0.05 level. (E), Information flow in RSV infected vehicle mice and RSV-infected RelA CKO (RKD). (F) Heat map of incoming signaling of individual cellular communication pathways for cell types in mock-infected mice. The top colored bar plot shows the total signaling strength of a cell group by summarizing all signaling pathways displayed in the heatmap. The right grey bar plot shows the total signaling strength of a signaling pathway by summarizing all cell groups displayed in the heatmap. Note the increase in ANGPTL4 incoming signal in Lgr6+ Fib and aAT2 (arrowheads). (G), Heat map of outgoing signaling for cells in RSV-infected WT mice. Note the increase in ANGPTL4 by Hif+ Peri (arrowhead).
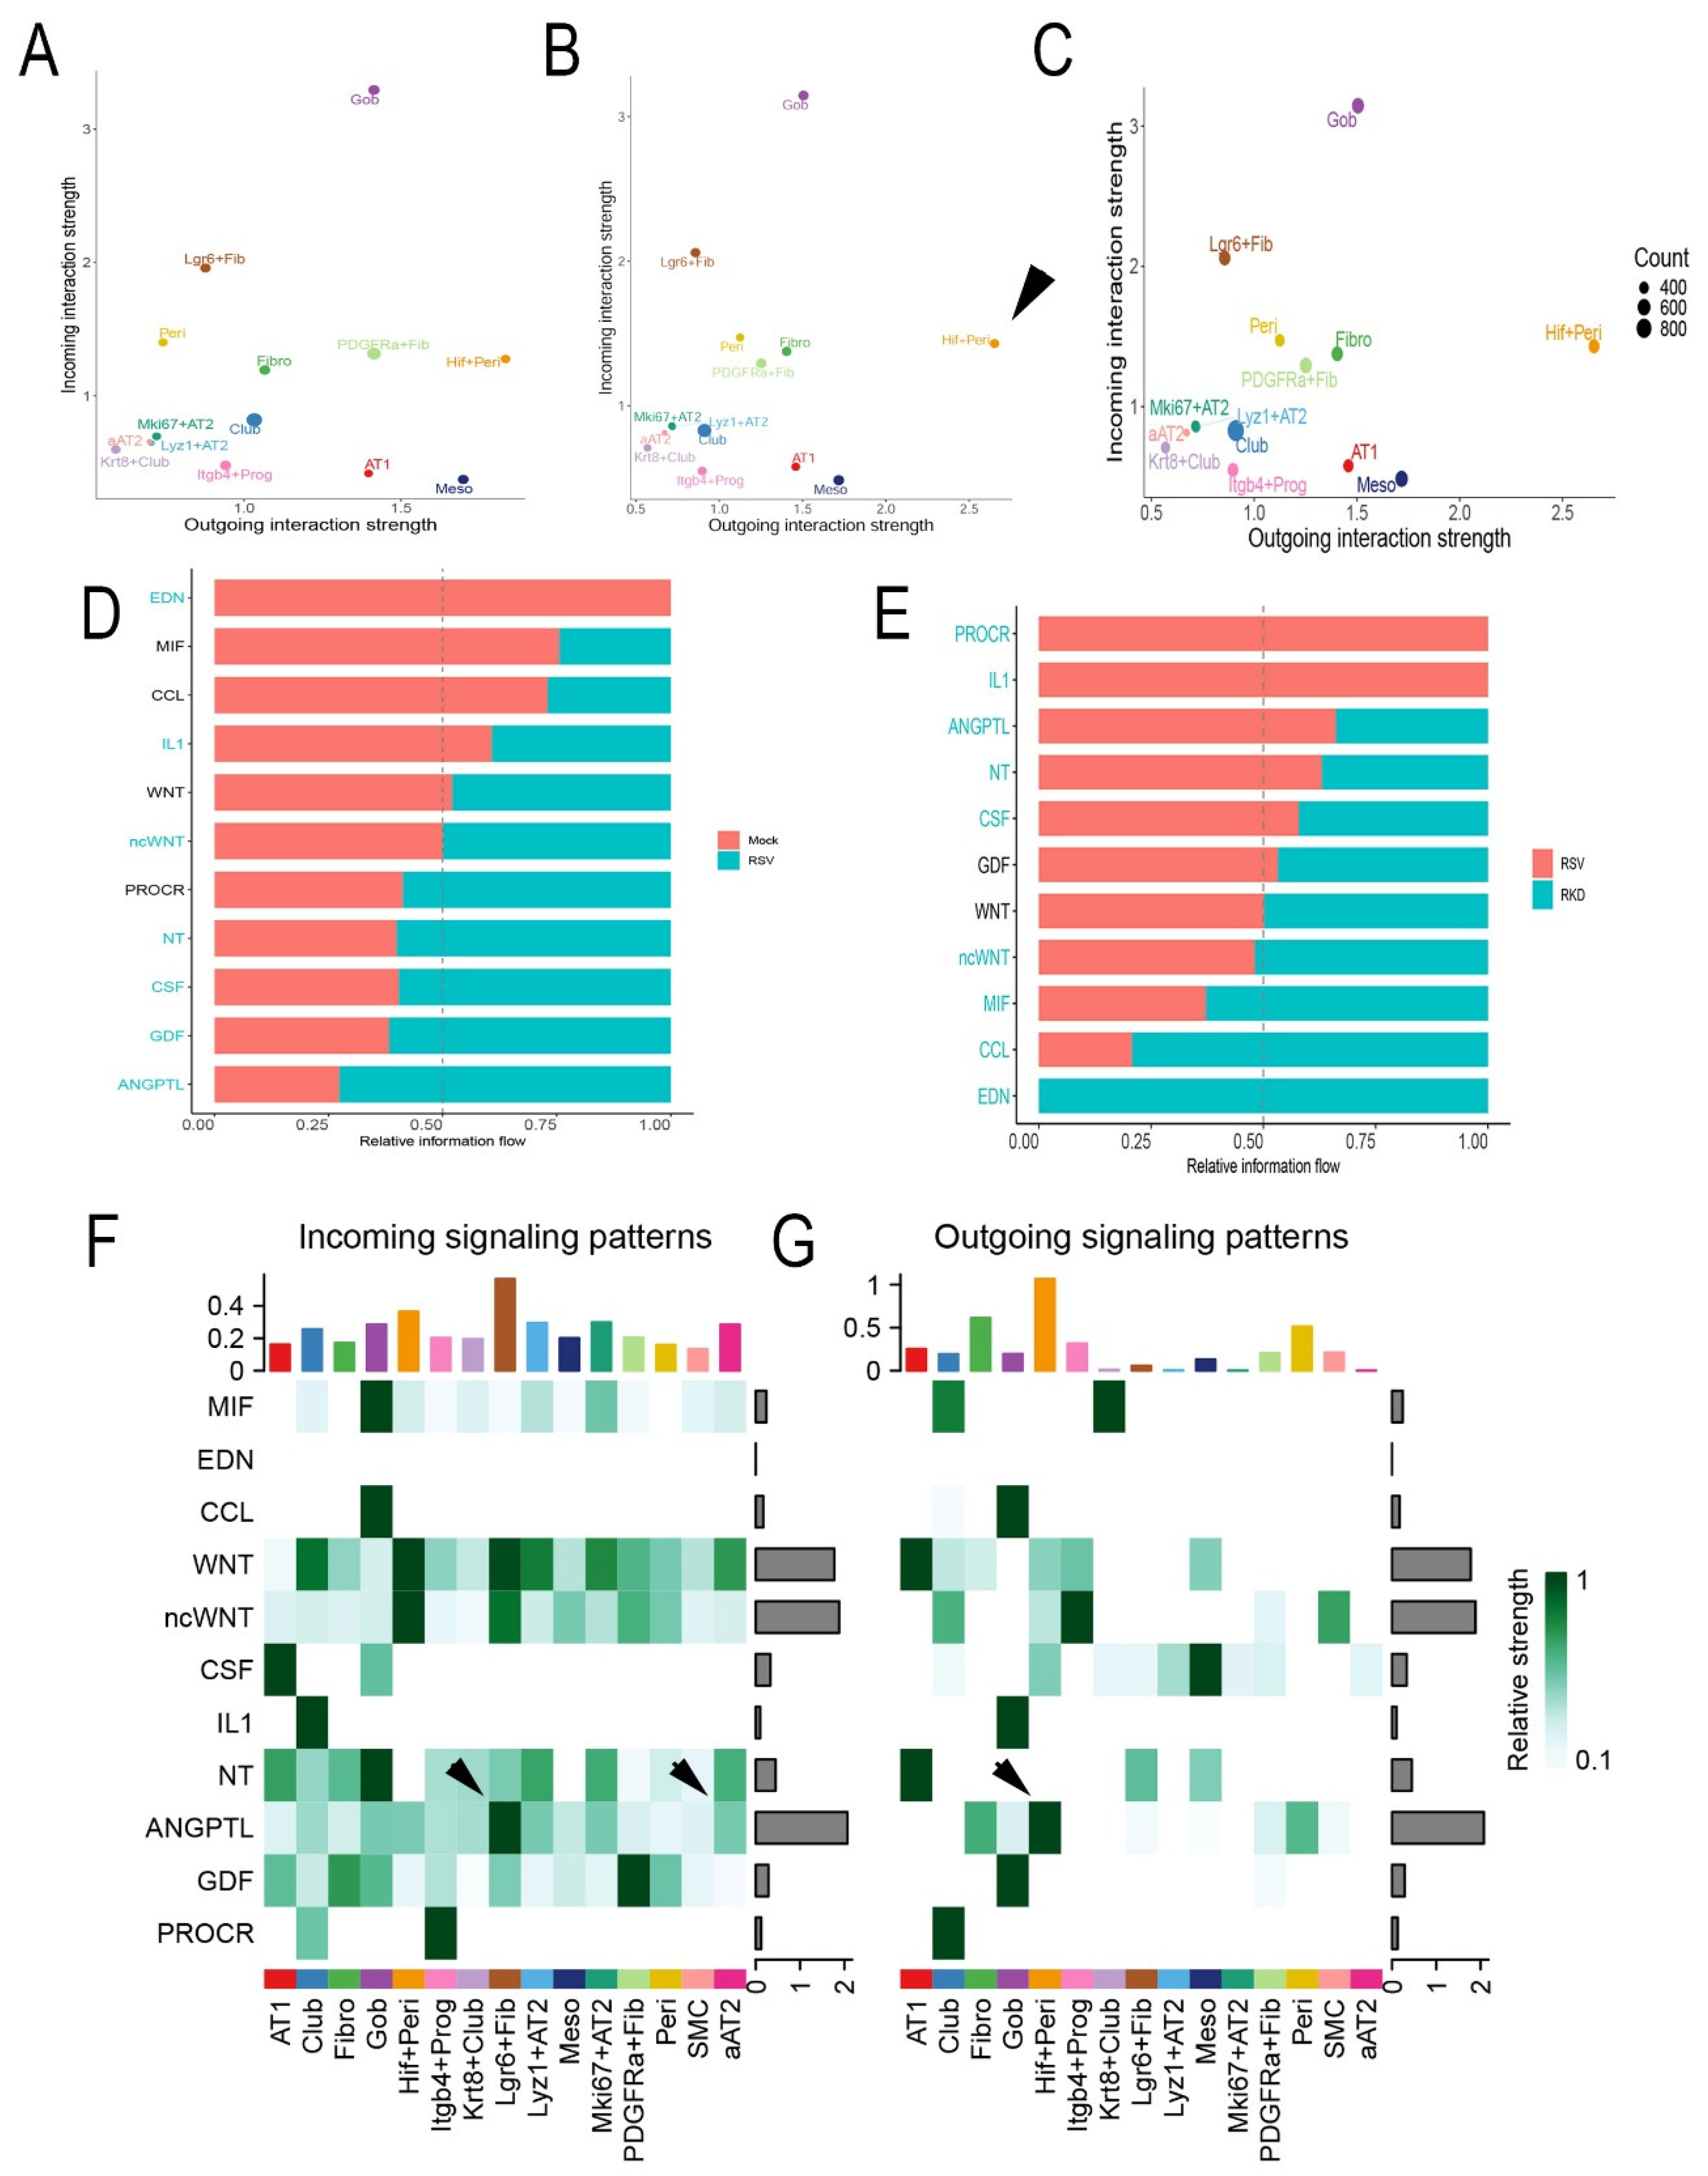
Figure 10.
Mesenchymal-epithelial ANGPTL4 signaling pathway. (A), Circle plot of ANGPTL4 communication probability between cell types. Each connecting edge width represents the communication probability. Note the autocrine regulation of Angptl4 on the Hif1+Peri and Lgr6+Fib and increased communication probability with Gob cells. (B), Circle plot of ANGPTL4 communication for RSV infected WT mice. Note increased signaling by Hif+Peri and Fibroblasts. (C) Circle plot of ANGPTL4 for RSV-infected RelA CKO. (D), Angptl4 expression in cells from RSV-infected mice. UMAP representation colored by Angptl4 mRNA expression. (E), Expression of major Angptl4 receptor. Sdc1 expression overlaying UMAP representation for RSV-infected cells. Note the high Angptl4 receptor expression in aAT2 and Krt8+ Club and Club cells. (F), Systematic analysis of ANGPTL family ligands and known receptors. Violin plot showing the expression distribution of signaling genes and receptors for the ANGPTL4 pathway. For each plot, expression is shown for mock (orange) or RSV-infected mice (green). Note the upregulation of ANGPTL4 ligand expression in Hif+Peri and Fibro (arrowheads) in RSV-infected mice without changes in ANGPTL receptor expression in target epithelial cells. (G), ANGPTL4 abundance in BALF. ANGPTL4 protein was measured in BALF (n=4). **, P<0.01.
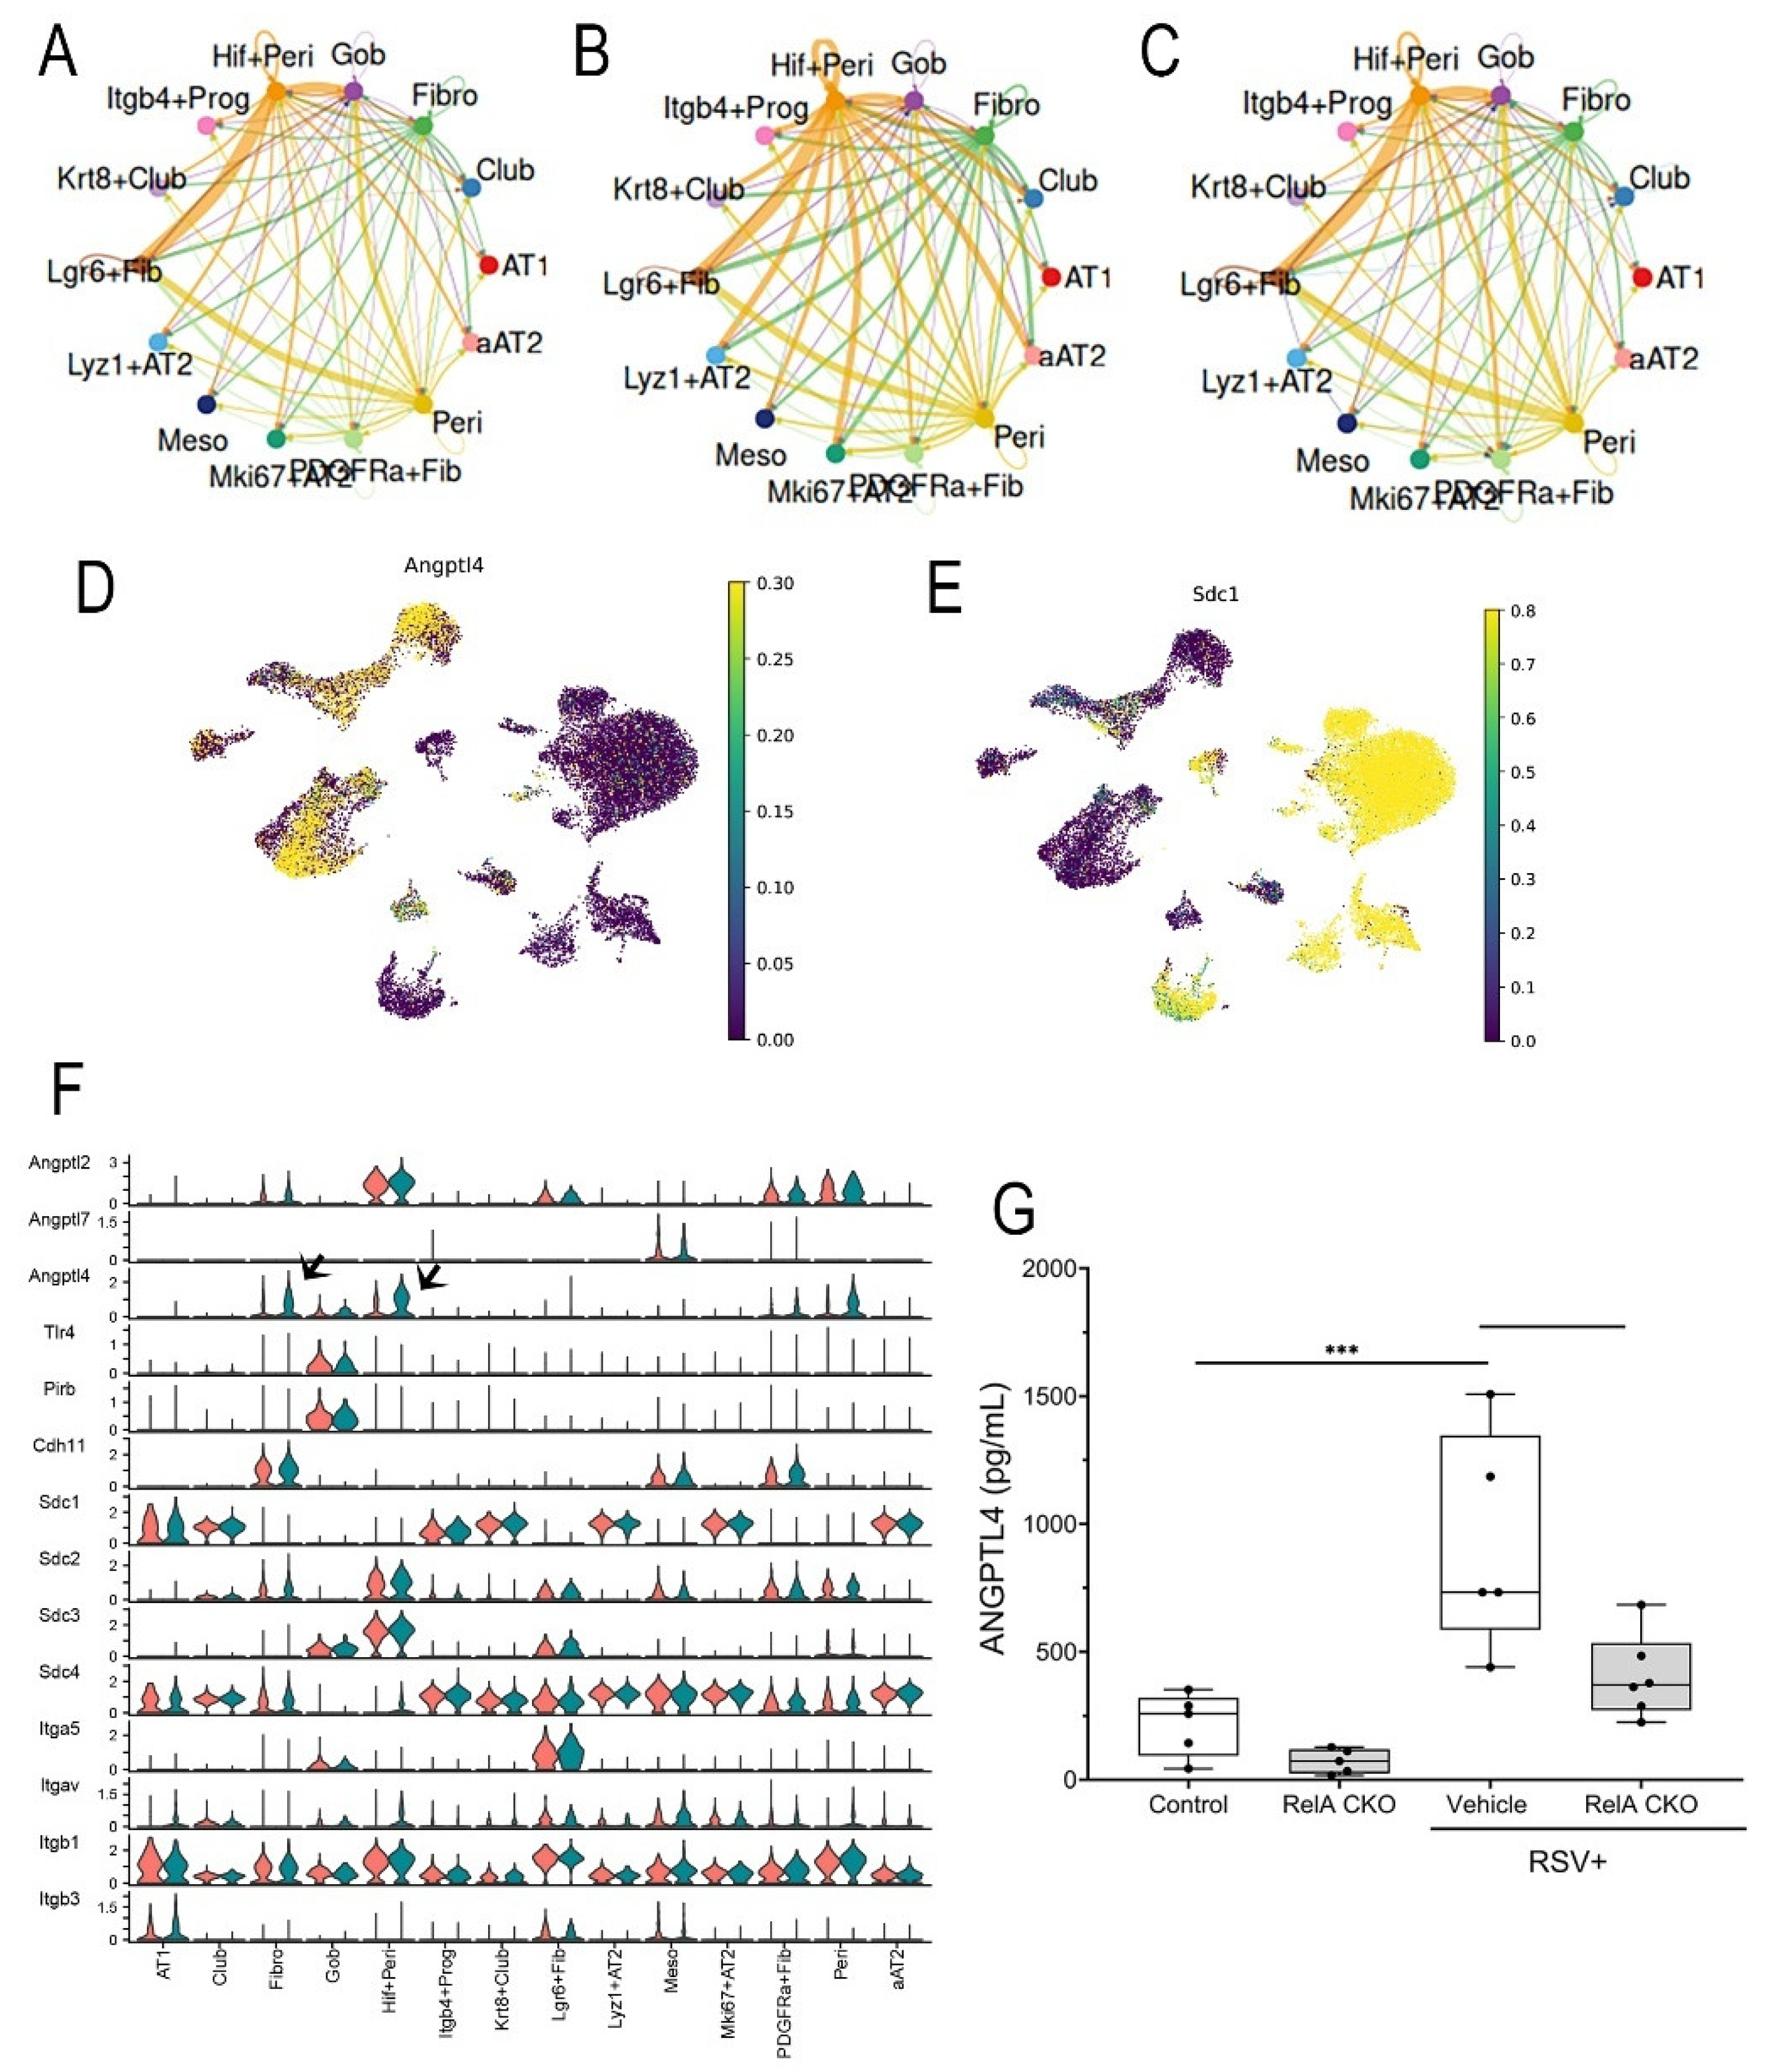
Disclaimer/Publisher’s Note: The statements, opinions and data contained in all publications are solely those of the individual author(s) and contributor(s) and not of MDPI and/or the editor(s). MDPI and/or the editor(s) disclaim responsibility for any injury to people or property resulting from any ideas, methods, instructions or products referred to in the content. |
© 2025 by the authors. Licensee MDPI, Basel, Switzerland. This article is an open access article distributed under the terms and conditions of the Creative Commons Attribution (CC BY) license (http://creativecommons.org/licenses/by/4.0/).
Copyright: This open access article is published under a Creative Commons CC BY 4.0 license, which permit the free download, distribution, and reuse, provided that the author and preprint are cited in any reuse.


