Submitted:
20 November 2025
Posted:
21 November 2025
You are already at the latest version
Abstract
Various methods for classifying and evaluating the shape, size, and surface texture of sand particles are examined, highlighting their importance in concrete mixture properties. The study emphasizes the role of particle morphology in determining concrete workability and segregation, particularly in glass fiber reinforced (GRC) thin-layer concrete for building facade panels. The effects of different aggregate types on concrete workability and segregation are analyzed, showing that aggregates with spherical particles and a lower elongation index improve mixture consistency and reduce segregation. Three types of fine aggregates were used for the research. Thin-layer concrete dispersively reinforced with concrete fiberglass using aggregates of different shapes is characterized by a layering of the mixture. The workability and segregation of the fine-grained fiberglass-reinforced concrete mixture depend on the shape of the aggregate particles. Up to 50% of the quartz sand can be replaced with granit stiftings or natural sand, as measured by the segregation index. Increasing the amount of natural sand from 10% to 50% also increases the segregation index from 1.9 to 2.6, and when using granite stiftings aggregates from 2.6 to 3.5, respectively. The segregation index can be calculated according to the method proposed in this paper. Aggregates with spherical particles are more suitable for this thin-layer GRC concrete.
Keywords:
fiberglass
; fiber reinforced thin-layer concrete
; granit stifting
; particle shape index
; particles surface roughness
; workability
; segregation index
1. Introduction
Fine aggregate affects the technical and economic performance of concrete. With the rapid depletion of natural pit sand resources in recent decades, in the construction industry, fine crushed stone aggregates are increasingly used instead of sand.
Debris from minerals and rocks mainly form due to rock weathering. A number of classification schemes, which are being improved and harmonized, have been developed. Sediments in monodisperse rock are carefully sorted, resulting in the predomination of one granulometric fraction. In bidisperse rock, the bulk of particles accumulates in two granulometric fractions. Sand particles differ in their origin, size, chemical and mineral composition, and shape. According to its grain shape, sand can be composed of predominantly round, partially round, and angled particles. The size of the particles and their other most characteristic features – shape, roundness degree, and surface roughness – are mostly determined by the physical decomposition of the rocks and the distribution of the debris material formed (transfer, deposition). The shape of grains is defined by the ratio of their axes. Zingg [1] distinguished four main classes of grain shapes according to axial length ratios based on the triaxial ellipsoid: spherical (isometric round), disc, plate, and rod-shaped grains. The initial shape of mineral debris changes due to the smoothing of corners and edges.
Grain sphericity is the ratio of the surface areas of a sphere and a grain at equal volume [2]. Sphericity is defined by the sphericity coefficient Ks – the degree of similarity of the shape of a grain to a sphere. The sphericity of a spherical grain is equal to 1; the less its shape resembles a sphere, the lower its sphericity value. Sphericity depends on the primary shape of the particles. It is determined by formulas or by visual comparison of a sample grain with the benchmarks. Sphericity and roundness typically increase evenly – as one parameter increases, the other increases as well and depends on the size of the particles. The surface characteristics of grains in fine aggregate are usually determined microscopically. Various names are used to describe the surface of particles, usually expressing the number of pits or roughness level, as well as assessing their depth, width, and the nature of various formations.
Particle shape is usually determined in a narrow range of one granulometric fraction. As the particles become larger, their degree of smoothing increases, therefore the particles of larger fractions generally have a higher degree of smoothing than those of smaller ones.
The methods for determining the size, shape, and surface nature of rock particles can be divided into several groups: methods for comparing grains with the benchmark; visual methods; geometric methods; and indirect methods.
The general benchmark for determining sphericity and roundness is easy to use. The advantage of all these methods is the possibility to quickly determine the morphometric parameters of grains, however, their disadvantage is the subjectivity of determination. Sand grain surface morphometry research methods have been used for a long time. The previously limited capabilities of the optical microscopic technique allowed only the general detection of grain surface roughness, angularity, or rounding. Researchers were only able to examine and describe the peculiarities of the grain surface structure can be seen by magnifying the grain ~ 100 times, whereas the consequences of chemical reactions can be seen by magnifying > 2000 times [3].
Two-dimensional or three-dimensional research methods are used to evaluate sand particle morphometry. Some parameters are calculated based on two-dimensional (planar) parameters determined from the grain projection plane. Image analysis and visual comparison methods are commonly used to evaluate the shape characteristics of granular materials. Particle shape can be described in three different ways: by shape and sphericity (general shape), by roundness (angle sharpness), and by roughness (surface texture).
Diagrams can facilitate the evaluation of particle roundness and sphericity using regular visual aids [4]. Particles were classified by Zingg using elongation (IL) and flatness (SL) ratios [1]. Krumbein provided a diagram comparing roundness [5]. Powers [6] proposed a roundness scale to visually compare and manually set the values of roundness and sphericity. In addition, Krumbein and Sloss proposed a diagram of the combinations of sphericity and roundness of particles to evaluate the shape thereof [7]. Cho et al. [8] modified this diagram by defining the particle shape as the arithmetic mean of roundness and sphericity and adding a dotted line to the proposed shape. Scientists proposed a diagram to evaluate the visual two-dimensional (2D) particle angularity. The results of the DIA and lCT analysis of the length/thickness aspect ratio (L/T ratio) as a shape parameter showed that, over almost the entire size range of the fillers, the grains have remarkably similar shape characteristics [9]. Blott and Pye combined the studies of Zingg and provided several graphs describing particle shape [10]. A camera was used according to the DIP technology to graphically visualize particles, followed by graphics-processing software to analyze and calculate particle shape parameters [11].
The shape and surface of the aggregate are important factors in determining the amount of water in a concrete mix [12,13]. Quartz sand is commonly used for fine-grained concrete. In this case, the consistency of the mixtures is good [14,15]. For the production of thin-walled products, it is difficult to apply concrete compaction agents. Therefore, an important requirement for dispersion-reinforced fine-grained finishing concrete mixes is the dispersion, compaction and segregation resistance of the mix. Particle angularity can increase the compressive and bending strength of concrete [16], and improve adhesion between coarse particles and cement paste, which is useful in improving strength, especially bending force. Studies have shown that a fiberglass content of 1.2% has the best effect on concrete mix mobility, and reaches around 70 mm [17]. Natural sand differs from most crushed aggregates (manufactured sand) in its type, particle shape and surface texture [18,19,20,21,22]. In crushed aggregates, the surfaces are more angular. In this case (decreasing values of slump and slump flow), more water is required for concrete production [9,23]. Replacing 100% natural sand with manufactured sand increases water demand [24]. Manufactured sand (MS) has a higher roundness and length-area ratio, and the ranges of distribution of roundness and length-area ratio in MS are larger than in river sand [20]. In the case of self-compacting concrete, mobility, and workability are easily compromised by the phenomenon of segregation and gravity [25]. The decrease in concrete workability is affected by the type, amount, and geometry of the used fiberglass, as well as the initial composition of the mix [26,27,28]. In addition to the factors above, concrete workability is also affected by the length of the used fiberglass, the length-to-diameter ratio (l / d), and shape configuration [29]. It has been observed that fiberglass of different amounts and different lengths has different effects on mobility [30]. Study results have shown that the optimum fiberglass content to achieve workability, stability, and appropriate mechanical properties is about 1% for 12 mm and 4% for 6 mm of fiberglass length [31]. It can also be seen that the addition of short fibers (3 mm, 6 mm) resulted in a higher slump than the addition of long fibers (12 mm, 20 mm). The reason for this may be that the long fibers may have been unevenly distributed in the concrete matrix, which may have reduced the slump of the concrete [30]. Insertion of fiberglass increases the viscosity of concrete, thus reducing its fluidity [32,33]. The poor fibre dispersion significantly reduces the workability and stability of the matrix [34]. Scientists have proposed a model that has proven to be an effective tool for designing fiber-reinforced concrete mixes with selected fresh-state properties using different fiber ratios and types. But they suggest that the model should be further refined in the future to take account of different aggregates [35]. However, there are not enough papers on the effect of different aggregates on the workability and segregation of concrete mixes.
Since there is currently very little material on the effect of aggregate quantity on the technological properties of fiberglass reinforced concrete, this work analyses the effect of different aggregates (natural sand and granite siftings) on the workability (spread and slump) of the concrete mix by replacing part of the quartz sand replacing part of the quartz sand with natural sand and granite stiftings. In this case, it is important to examine particle shape in a consistent manner, and to identify the key index affecting segregation. The research also has another goal, which is to investigate whether granite stiftings, which are waste from crushing granite rocks, are suitable for use in the production of fine-grained glass fiber reinforced thin-layer concrete and to what percentage these aggregates can replace part of the quartz sand, and whether natural sand is suitable for replacement.
2. Materials and Methods
Three types of fine aggregates were used for the study. Quartz sand was used - a common aggregate when mixing mixtures intended for dispersion-reinforced fine-grained finishing concrete. A certain part of the quartz sand in some mixtures was replaced with crushed granite siftings, and in other mixtures with natural sand. The main physical and chemical properties of the fine aggregates are presented in Table 1, and the granulometric composition is presented in Figure 1. In the production of thin-layer panels for facades, quartz sand is used, the usual particle size of which is 0-1 mm. This is a fairly expensive resource, therefore, research was conducted to replace this resource with conventional, but less expensive materials that have potential. The research used crushed granite siftings (particle size 0–2 mm) and natural construction sand, which is supplied from a quarry with a usual particle size of 0–2 mm.
Portand cement CEM I 52.5R was used in the work. The main properties and mineralogical composition of cement as required by the standard LST EN 197-1: 2011 are presented in Table 2 and Table 3.
In the production of concrete mixtures, 853 kg of cement was used per 1 m3 of the mixture. The total amount of fine aggregate in the mixtures, per 1 m3 of the mixture, was 853 kg. The amount of quartz sand in the mixtures varied from 50% to 100%. Quartz sand was replaced with granite siftings in GS mixtures, and with natural sand in NS mixtures. The amount of granite siftings and natural sand in GS and NS mixtures was 10%, 20%, 30%, 40%, 50%. Mixtures with granite siftings were marked GS10, GS20, GS30, GS40, GS50. Mixtures with natural sand were marked NS10, NS20, NS30, NS40, NS50. Mixture with quartz sand were marked QS. Superplasticizers were added from 1.1% of the cement mass, the W/C (water:cement) ratio was 0.36, and glass fiber was 2.9% of the dry matter content (Table 4). A high-performance plasticizer was used to plasticize the ester-based polycarboxylates of the cement matrix, which has high efficiency and is widely used in practice.
After a series of experimental mixes and based on the recommendations in the literature, an optimal mix preparation mode was selected. Water, superplasticiser, and aggregate are added first and the mix is stirred slowly for 20–30 seconds to completely wet the aggregate particles. The binder is then dosed, and the mix is stirred for 2 mins at a maximum mixer speed of 1000 rpm until a steady consistency is reached. Fiberglass is then added and stirred for 1 min at half the maximum speed of the mixer – 500 rpm. It should be noted that this mode is suitable for mixes with fiberglass, where the fibers of the fiberglass are evenly distributed throughout the volume of the mixes and do not break down into individual fibers. The high amount of fines in the mix makes conventional normal concrete mixing techniques inadequate, as there is not enough energy to mix the large amount of fines and obtain the required mix consistency [36]. For these fine-grained mixtures, the intensive mixing method is the exclusive method of mixing, where the concrete mixer has a single high-speed (up to 1500 rpm) rotating axis with a spiral nozzle.
The cylindrical spread method was suitable for fine-grained cementitious composites with fibers up to 20 mm in length and was chosen to study the workability of concrete mixes. A ø 57 (h = 55 mm metal cylinder is used for the test, which is placed on a smooth surface (glass or marine plywood) and a concrete mix is poured into it. After 15–20 s the cylinder is removed, the mix is allowed to spread, and after 10–15 s the diameter (cm) of the spread mix is measured (LST EN 1170-1).
Based on the diagram in Figure 2, we can create a parameter defining mix workability – the segregation index W, which is directly proportional to D1 and D2, but inversely proportional to h, and is expressed according to the following formula (dimensionless size):
where: D1 – cementitious mix spread calculated as the average of two measurements made in the perpendicular direction, cm; D2 – spread of fiber-reinforced cementitious matrix calculated as the average of two measurements made in the perpendicular direction, cm; h – mix slump (Suttard’s viscometer height), cm.
In order to better understand the effect of aggregate particle shape on thin-layer GRC concrete mix workability, the average particle shape parameter – elongation index I was calculated:
where: d1 – longer side of the aggregate particle, mm; d2 – shorter side of the aggregate particle, mm.
To determine particle shape, all three fine aggregates were separated into fractions by sieving through standard sieves: 2…4 mm, 1…2 mm, 0.5…1 mm, 0.25…0.5 mm, 0.125…0.25 mm, 0.063…0.125 mm, and microscopic photographs of each fraction were taken. An optical microscope MIN10 was used, which can magnify the image up to 104 times, and illumination from above was used. After loading the images into Autocad, elongation index (I) were determined with the help of measuring tools by selecting 30 particles from each fraction and calculating the average. Since the elongation index I is calculated as the ratio of the dimensions of particles in the perpendicular direction, the scale of images in the Autocad model space does not affect it.
When calculating particle shape and surface roughness index J, another parameter is introduced – surface roughness (R). This can be seen from the value given for the filler shape (elongation) (I) and surface roughness (R) parameters of the filling particles:
where: I – aggregate particle elongation index; R – aggregate particle surface roughness.
3. Result and Discussion
Subsection quartz sand is the most studied and most commonly used aggregate in fine-grained concrete systems. This choice is based on the particularly good mix workability using this aggregate [14,37], other materials such as silica flour, silica fume, etc. can also be used [38]. Fibres tend to tangle and form clusters in the centre of the flow [34]. Expensive quartz sand normally used in glass fiber concrete can be replaced with more economic locally available natural sand [39]. Since fluid concrete mixes are studied in this work, the ability of the mix to spread quickly and evenly, and to fill the formwork of the formed product is especially important. In the production of thin-walled products, it is difficult to apply concrete compaction measures. Therefore, an important requirement for dispersively reinforced fine-grained finish concrete mixes is mix spread, slump, and resistance to segregation. In this case, mixture segregation is defined in the scientific literature as the separation of the fiber and cement matrix, as shown in Figure 3.
In order to reduce the use of quartz sand for thin-bed GRC mixtures, workability was investigated for all mixtures under consideration. All mixtures were tested, and the most representative trends were selected for visual use of the results. The use of alternative aggregates significantly decreased the workability of the mix, in some cases resulting in high fiber-matrix segregation. Determination of regular slump according to Suttard’s viscometer height (h) alone is not sufficient to describe in detail the workability of such mixes. The spread diameters of mix D1 and D2, which characterize the segregation effect (Figure 3) must also be measured. Figure 4 shows the different spread tendencies of the concrete mix. As shown in Figure 4a, the best spread was determined in a concrete mix that contains only one type of aggregate (quartz sand), and allows a self-leveling GRC mix to be obtained. The spread is 22 cm. The analyzed sample reaches full slump. A full slump is not reached when half of the quartz sand is replaced with granite screenings or natural sand (Figure 4b,c).
Spread can be seen in Figure 5 and Figure 6. Replacement of quartz sand with 50% granite siftings or natural sand shows a decrease in spread. A greater spread reduction is observed when using the fine grains of granite (Figure 5). Spread d1 decreases by 31.8%, with 50% fine grains of granite (GS50) and by 15.9% with 50% of natural sand (NS50). In the case of spread d2, the same tendencies are observed when using both 10% of granite siftings (GS10) and 10% of natural sand (NS10) (Figure 5 and Figure 6). In both cases, a sudden decrease in the spread of the concrete mix is observed. This can be explained by studying the elongation of the aggregate. In the first case, it decreases to 9 cm, and in the second case to 10 cm.
Slump tests (Figure 7) have shown a decrease from 4.3 cm to 2.4 cm (44.18%) in the case of granite siftings and a decrease of 3.7 cm in the case of natural sand (13.95%). A number of studies with regular concrete have shown that aggregate particle shape and aggregate surface characteristics are important factors in determining the water-cement ratio of a concrete mix – the larger the particle surface area, the greater the amount of water required to obtain a concrete mix of the required workability [14]. Angled particles can increase the compressive strength of concrete, however the workability of the mix worsens [40].
The quartz sand particles used in these studies have a spherical shape with smooth surfaces, resulting in less friction between the cement matrix, the aggregate, and the fibers (Figure 8c). However, sand having a more uniform and spherical particle shape and providing less concrete voids will improve flow [39]. Sands with higher roundness value also have higher length-width ratio [41]. There are almost no studies on the properties of granite stiftings, but analysis of natural and artificial sand surfaces has been performed. On the one hand, natural sand has a smooth and round surface after water washing, movement and wear over a long period of time, while manufactured sand particles have a rough surface, sharp edges and corners and low roundness, with more inter-particle friction and interlocking, and therefore require more cement paste to pack and lubricate [21]. Granite siftings particles have a plate-like shape with sharp edges, which increases the internal friction in the matrix, the fibre gets trapped between the larger particles, and the fine particles pass through the gaps together with the cement mortar (Figure 8a). Particles of the natural sand aggregate are shaped like irregular spatial polygons, therefore the workability parameters of mixes are closer in composition to the granite aggregate (Figure 8b).
The consistency and segregation of concrete depend on the shape of the aggregate particles, as shown by consistency and segregation studies. A number of particle shape parameters have been developed by researchers and are used in numerical modeling of particle mix density [10]. However, other researchers have proposed using simplified shape indices (spherical mass, flatness, and elongation) in the study of concrete mix consistency problems [4]. In this work, the elongation index is chosen as such a parameter, which can be determined by simple visual means, such as microscopic photographs and plotting software. An increase in the elongation index of the aggregate particles of just 3% reduces the dispersion of the mixture by 10% when natural sand is used instead of quartz sand. When irregularly shaped aggregate (granite siftings) is used, the particle elongation index increases (Table 5) by 33% compared to quartz sand, and the spread of the mixture decreases accordingly to 50%. Increasing the content of natural sand from 10% to 50% increases the segregation index from 1.9 to 2.6, and from 2.6 to 3.5 with granite siftings. These parameters indicate that mixtures with a predominance of spherical particles, ensuring uniform dispersion of the cement matrix and fibers, are more in demand when a well-laid pavement mixture is required.
According to the amount of each fraction on different sieves, the average elongation indices for the entire aggregate were calculated: Iq= 1.40 (quartz sand), Ins= 1.44 (natural sand), Igs= 1.87 (granite siftings) (see Table 5) The predominant fraction in quartz sand is from 0.125 to 0.25 mm, while in natural sand the various fractions are distributed more evenly. In the case of granite siftings, the maximum amount of particles is from 0.5 to 1 mm. According to the results of the tests, concrete mix workability worsens with both an increase of the particle elongation index and an increase in the amount of larger particles. The highest values of the elongation index were determined in the case of granite siftings, as shown in Figure 8. In this case, the elongation value increases by 33.58%, and the concrete mix spread decreases accordingly to 50%. In the case of natural sand, the increase in the elongation index is only 2.86%. But even in this case, the spread of the mix decreases by 10%.
Research on conventional concretes has shown that the shape of the aggregate particles and the characteristics of the aggregate surface are important factors in determining the water/cement ratio of the concrete mix. The larger the surface area of the particles, the greater the amount of water needed to obtain a mix of the required consistency with a given amount of aggregate [40]. Angular particles can increase the compressive strength of concrete but degrade the consistency of the mix [40]. The quartz sand particles used in these studies are characterized by their spherical shape and smooth surfaces, resulting in lower friction between the cementitious matrix, aggregate, and fibers. Granite siftings particles have a plate-like shape with sharp edges, which increases the internal friction in the matrix, trapping the fibers between the coarser particles and allowing the fines to pass through the gaps with the cementitious mortar. The particles of regular sand aggregate are irregularly shaped spatial polygons, so the consistency parameters of the mixtures are closer to those of compositions with granite aggregate.
Segregation index tendencies are presented in Figure 9 and Figure 10. The segregation index is a measure used to quantify the degree of separation between different components in a concrete mix. Linear dependencies are shown in Figure 9. Research shows that as the proportion of natural sand and granite siftings in the mix increases, the segregation index also increases. This indicates a direct relationship between the amount of these alternative aggregates and the mix’s tendency to segregate. As the amount of natural sand and granite sifting increases, the value of the segregation index also increases. The segregation index values are consistently higher for concrete mixes with granite siftings compared to those with natural sand. If quartz sand is replaced with maximum amounts of granite siftings and natural sand, the segregation index with granite aggregate is 1.27 times higher. The fillers differ in their particle surface. Sand has a smooth particle surface, whereas granite has a rough surface.
The segregation index is influenced not only by the shape of the filler but also by the surface roughness. The particle shape and surface roughness parameter J was calculated using data provided in the study of the surface parameters of fine aggregate particles [41]. The dependence of the segregation index of mixtures on the shape (elongation) and surface roughness of the filler particles is shown in Figure 10. This figure shows that the dependenceof the segregation index on these parameters can be described by a square function. The square function of the dependency indicates that small changes in elongation and roughness can leas to larger changes in the segregation index. This suggests a non-linear relationship, where changes in particle shape and roughness can significantly impact segregation tendencies in complex manner.
In summary, can be emphasized the crucial role of aggregate characteristics in determining concrete workability and stability. Research reveals that both shape and surface texture aggregates significantly influence the segregation tendencies, with rougher and more elongated particles leading to higher segregation index. This comprehensive understanding can inform the selection and proportioning of aggregates in concrete mix designs to achieve desired workability and minimize segregation.
4. Conclusions
- When different aggregates are used, fine-grained concrete dispersively reinforced with fiberglass is characterized by layering of the mixture leading to the separation of the fiberglass together with fine aggregates from the cement matrix. Layering depends on the particle shape of the aggregate. As the aggregate particle elongation index increases from 1.4 to 1.64, the segregation index of the concrete mix varies from 1.9 to 3.5.
- The highest flow diameter of concrete mixture was obtained with quartz sand particle elongation index equal 1.4. An acceptable value for the segregation index of the mix can be achieved by replacing the quartz sand up to 50% with granite sifftings or natural sand.
- The workability and segregation of a fine-grained fiberglass reinforced concrete mix depends on aggregate particle shape, which can be described with the elongation index expressed as the ratio of the longer side of the particle to the shorter side. As the elongation index increases, workability worsens, and segregation increases. An increase in the aggregate elongation index of 3% reduces the spread of the mixture by 10% when natural sand is used instead of quartz sand. When an irregularly shaped aggregate (granite siftings) is used, the particle elongation index increases by 33% compared to quartz sand, and the spread of the mixture decreases to 50% accordingly. Increasing the amount of natural sand from 10% to 50% also increases the segregation index from 1.9 to 2.6, and using granite siftings – from 2.6 to 3.5, respectively.
- An even spread of the cement matrix and fibre of fine-grained fibreglass reinforced concrete is ensured when aggregates with spherical particles having an elongation index of not more than 1.4 are used. The segregation index is also important for these mixtures and needs to be assessed during technological operations. The index can be calculated according to the method proposed in this paper.
- Aggregates with spherical particles that ensure the even spread of cement matrix and fiber are more suitable for GRC concrete. The shape and surface roughness of particle aggregates has a decisive influence on the concrete mixture segregation parameter. This dependence is described by the square function.
- In addition to increasing the angularity of the aggregate particles, an increase in the surface roughness of the aggregates significantly increases the segregation index of the mix.
- The possibility of using granite stiftings or natural sand instead of quartz sand has been investigated. These aggregates have different physical surface characteristics, which significantly affect the consistency of the mixture. Therefore, in the future, when using fine aggregates with different surface parameters, different methods of compaction of the mixture must be applied, taking into account the possibility of segregation.
Author Contributions
Conceptualization, R.M., R.Z. and A.K; methodology, R.M., A.K., R.Z.; software, R.M.; validation, R.Z; formal analysis R.Z.; investigation R.M., and A.K; data curation R.M., R.Z.; writing—original draft preparation, A.K., R.Z. and R.M.; writing—review and editing, R.Z., R.M.; visualization R.M, A.K, R.Z. All authors have read and agreed to the published version of the manuscript.
Funding
This research received no external funding.
Institutional Review Board Statement
Not applicable.
Informed Consent Statement
Not applicable.
Data Availability Statement
Data are contained within the article.
Conflicts of Interest
The authors declare no conflicts of interest.
References
- Zingg, T. Beitrag zur Schotteranalyse. Schweiz Miner Petrogr Mitt. 1935, 15, 39–140. [Google Scholar]
- Wadell, H. A. Volume, shape and roundness of rock particles. Journal of Geology. 1932, 40, 443–451. [Google Scholar] [CrossRef]
- Kowalkowski, A.; Degórski, M. Wskaźniki dawnych i aktualnych środowisk kształtujących cechy eksturaln powierzchni ziarn piasku kwarcowego przy zastosowaniu skaningowej mikroskopii elektrownej Roczniki gleboznawcze. 2008. Warszawa, 160–174.
- Zheng, J.; Hryciw, R. D. Traditional soil particle sphericity, roundness and surface roughness by computational geometry. Géotechnique. 2015, 65, 494–506. [Google Scholar] [CrossRef]
- Krumbein, W. C. Measurement and geological significance of shape and roundness of sedimentary particles. J Sediment Re. 1941, 11, 64–72. [Google Scholar] [CrossRef]
- Powers, M.C. A new roundness scale for sedimentary particles. SEPM J Sediment Res. 1953, 23, 117–9. [Google Scholar]
- Krumbein, W. C.; Sloss L., L. Stratigraphy and sedimentation. 2nd ed. 1963. San Francisco: W.H. Freeman and Company.
- Cho, G. C.; Dodds, J.; Santamarina, J. C. Particle shape effects on packing density, stiffness, and strength: natural and crushed sands. J Geotech Geoenviron Eng. 2006, 132, 591–602. [Google Scholar] [CrossRef]
- Cepuritis, R. ; Wigum,.J.; Garbozci, E.J., Mørtsell, E., Eds.; Jacobsen, S. Filler from crushed aggregate for concrete: Pore structure, specific surface, particle shape and size distribution, Cem. Concr. Compos. 2014; Volume 54:2-16. [Google Scholar]
- Blott, S. J. , Pye K. Particle shape: a review and new methods of characterization and classification. Sedimentology. 2007, 55, 31–63. [Google Scholar] [CrossRef]
- Kwan, A. K. H.; Mora, C. F.; Chan, H. C. Particle shape analysis of coarse aggregate using digital imagine processing, Cement & Concrete Research. 1999, 29, 1403–1410. 29.
- Yamei, H.; Lihua, W. China Effect of Particle Shape of Limestone Manufactured Sand and Natural Sand on Concrete. 6th International Workshop on Performance, Protection & Strengthening of Structures under Extreme Loading, PROTECT2017, 11-, Guangzhou (Canton). 12 December 2017.
- Shilstone, Sr. J. M. Concrete Mixture Optimization. Concrete International: Design and Construction. 1990, 12, 33–39. [Google Scholar]
- Bartos, P. J. M. Glassfiber reinforced concrete: principles, production, properties and applications. 2017. Whittles Publishing. 183p.
- Abe, J.;Takeuchi, Y.; Imai, K. Development of Self-compacting Premix GRC, GRCA symposium, Istanbul, 2011.
- Kaplan, M. F. Flexural and Compressive Strength of Concrete as Affected by the Properties of Coarse Aggregates. Proceeding of the American Concrete Institute, 1959, 55, 1193–1208. [Google Scholar]
- Paktiawal, A.; Alam, M. Experimental evaluation of sorptivity for high strength concrete reinforced with zirconia rich glass fiber and basalt fiber, Materials Today: Proceedings, 2021. [CrossRef]
- Li,B. X; Ke,G.J.; Zhou, M.K. Influence of manufactured sand characteristics on strength and abrasion resistance of pavement cement concrete. Constr Build Mater 2011, 25, 3849–3853.
- Ji, T. ; Chen, C-Y. ; Zhuang, Y-Z.; Chen, J-F. A mix proportion design method of manufactured sand concrete based on minimum paste theory Construction and Building Materials, 2013, 44, 422–626. [Google Scholar]
- Beixing, L.; Guoju, K.; Mingkai, Z. Influence of manufactured sand characteristics on strength and abrasion resistance of pavement cement concrete Construction and Building Materials, 2011, 25, 3849 – 3853.
- Yamei, H.; Lihua, W. Effect of Particle Shape of Limestone Manufactured Sand and Natural Sand on Concrete 6th International Workshop on Performance, Protection & Strengthening of Structures under Extreme Loading, PROTECT2017, 11-, Guangzhou (Canton). 12 December 2017.
- Altuki, R.; Ley, M.T.; Cook, D.; Gudimettla,M. J.; Paul, M. Increasing sustainable aggregate usage in concrete by quantifying the shape and gradation of manufactured sand. Construction and Building Materials, 2022, 321, 125593. [Google Scholar] [CrossRef]
- Sharma, R.; Senthil, K. An investigation on mechanical and microstructural properties of hybrid fiber reinforced concrete with manufactured sand and recycled coarse aggregate, Journal of Building Engineering, 2023, 69, 106236.
- Nanthagopalan, P.; Santhanam, M. Fresh and hardened properties of self-compacting concrete produced with manufactured sand. Cement and Concrete Composites, 2011, 33, 353–358. [Google Scholar] [CrossRef]
- ERMCO, The European Guidelines for Self-Compacting Concrete, ERMCO, 2005.
- Wang, W; Shen, A. ; Lyu, Z.; He, Z; T.Q. Nguyen, K. Fresh and rheological characteristics of fiber reinforced concrete – A review. Construction and Building Materials. 2021, 296, 123734. [Google Scholar] [CrossRef]
- El-Dieb, A. S.; Taha, M. M. R. Flow characteristics and acceptance criteria of fiber-reinforced self-compacted concrete (FR-SCC), Constr. Build. Mater. 2012, 27, 585–596. [Google Scholar] [CrossRef]
- Güneyisi, E; R. Atewi, Y. F.; Hasan, M. Fresh and rheological properties of glass fiber reinforced self-compacting concrete with nanosilica and fly ash blended. Constr. Build. Mater. 2019, 211, 349–362. [Google Scholar] [CrossRef]
- ACI 544.1R-96. ‘State-of-the-Art Report on Fiber Reinforced Concrete’, ACI, 2002.
- Kasagani, H.; Rao, C. B. K. Effect of graded fibers on stress strain behavior of Glass Fiber Reinforced Concrete in tension. Construction and Building Materials, 2018, 183, 592–604. [Google Scholar] [CrossRef]
- Libre, N. A.; Mehdipour, I.; Alinejad, A.; Nour, N. Rheological properties of glass fiber reinforced highly flowable cement paste. The 3rd ACF International Conference- ACF/VCA 2008.
- Jobaer, U.M.; Hasnat, A.; S Islam, M.; F Ahmad, S. Glass fiber polymer on the fresh and hardened properties of concrete. ’ In Proceedings of International Structural Engineering and Construction. July 2018. [Google Scholar]
- Murugan, R.B.; Haridharan, M.K. , Natarajan, C. ; Jayasankar, R. Influence of glass fiber on fresh and hardened properties of self compacting concrete. IOP Conf. Series: Earth and Environmental Science 2017, 80, 012004. [Google Scholar]
- Mehdipoura, I.; Libreb, A.L.; Shekarchib, M.; Khanjanic, M. Effect of workability characteristics on the hardened performance of FRSCCMs, Construction and Building Materials, 2013, 40, 611–621. 611–621.
- Ferrara, L. ; Park, Y-D. ; Shah, S.P. A A method for mix-design of fiber-reinforced self-compacting concrete. Cement and Concrete Research 2007, 37, 957–971. [Google Scholar]
- Peter, I.D.; Crocker, I. Further Investigations into premix GRC, GRCA symposium, Dubai. 2015. [Google Scholar]
- Soni, N.; Shukla, D. K. Analytical study on mechanical properties of concrete containing crushed recycled coarse aggregate as an alternative of natural sand, Construction and Building Materials, 2021; 266, 120595. [Google Scholar]
- Repka, J.; Vlach, T.; Laiblova, L.; Hajek, P.; Zenisek, M.; Kokos, P. Thin Lightweight Panels Made of Textile Reinforced Concrete Article in Solid State Phenomena, 17. 20 May. [CrossRef]
- Yang,S. L;Millard, S.G.; Soutsos, M.N.; Barnett, S.J.; Le, T.T. Influence of aggregate and curing regime on the mechanical properties of ultra-high performance fibre reinforced concrete (UHPFRC) Construction and Building Materials, 2009, 23, 2291–2298.
- Cordeiro, C.G.; Soares, L. M. ; Rocha,C. A. A. Rheological and mechanical properties of concrete containing crushed granite fine aggregate, Construction and Building Materials. 2016, 111, 766–773. [Google Scholar]
- Shen, W.; Yang, Z.; Cao, L.; Cao, L.; Liu, Y.; Yang, H.; Lu, Z.; Ba, J. Characterization of manufactured sand: Particle shape, surface texture and behavior in concrete. Construction and Building Materials. 2016, 114, 595–601. [Google Scholar] [CrossRef]
Figure 1.
Granulometric curves of aggregates.
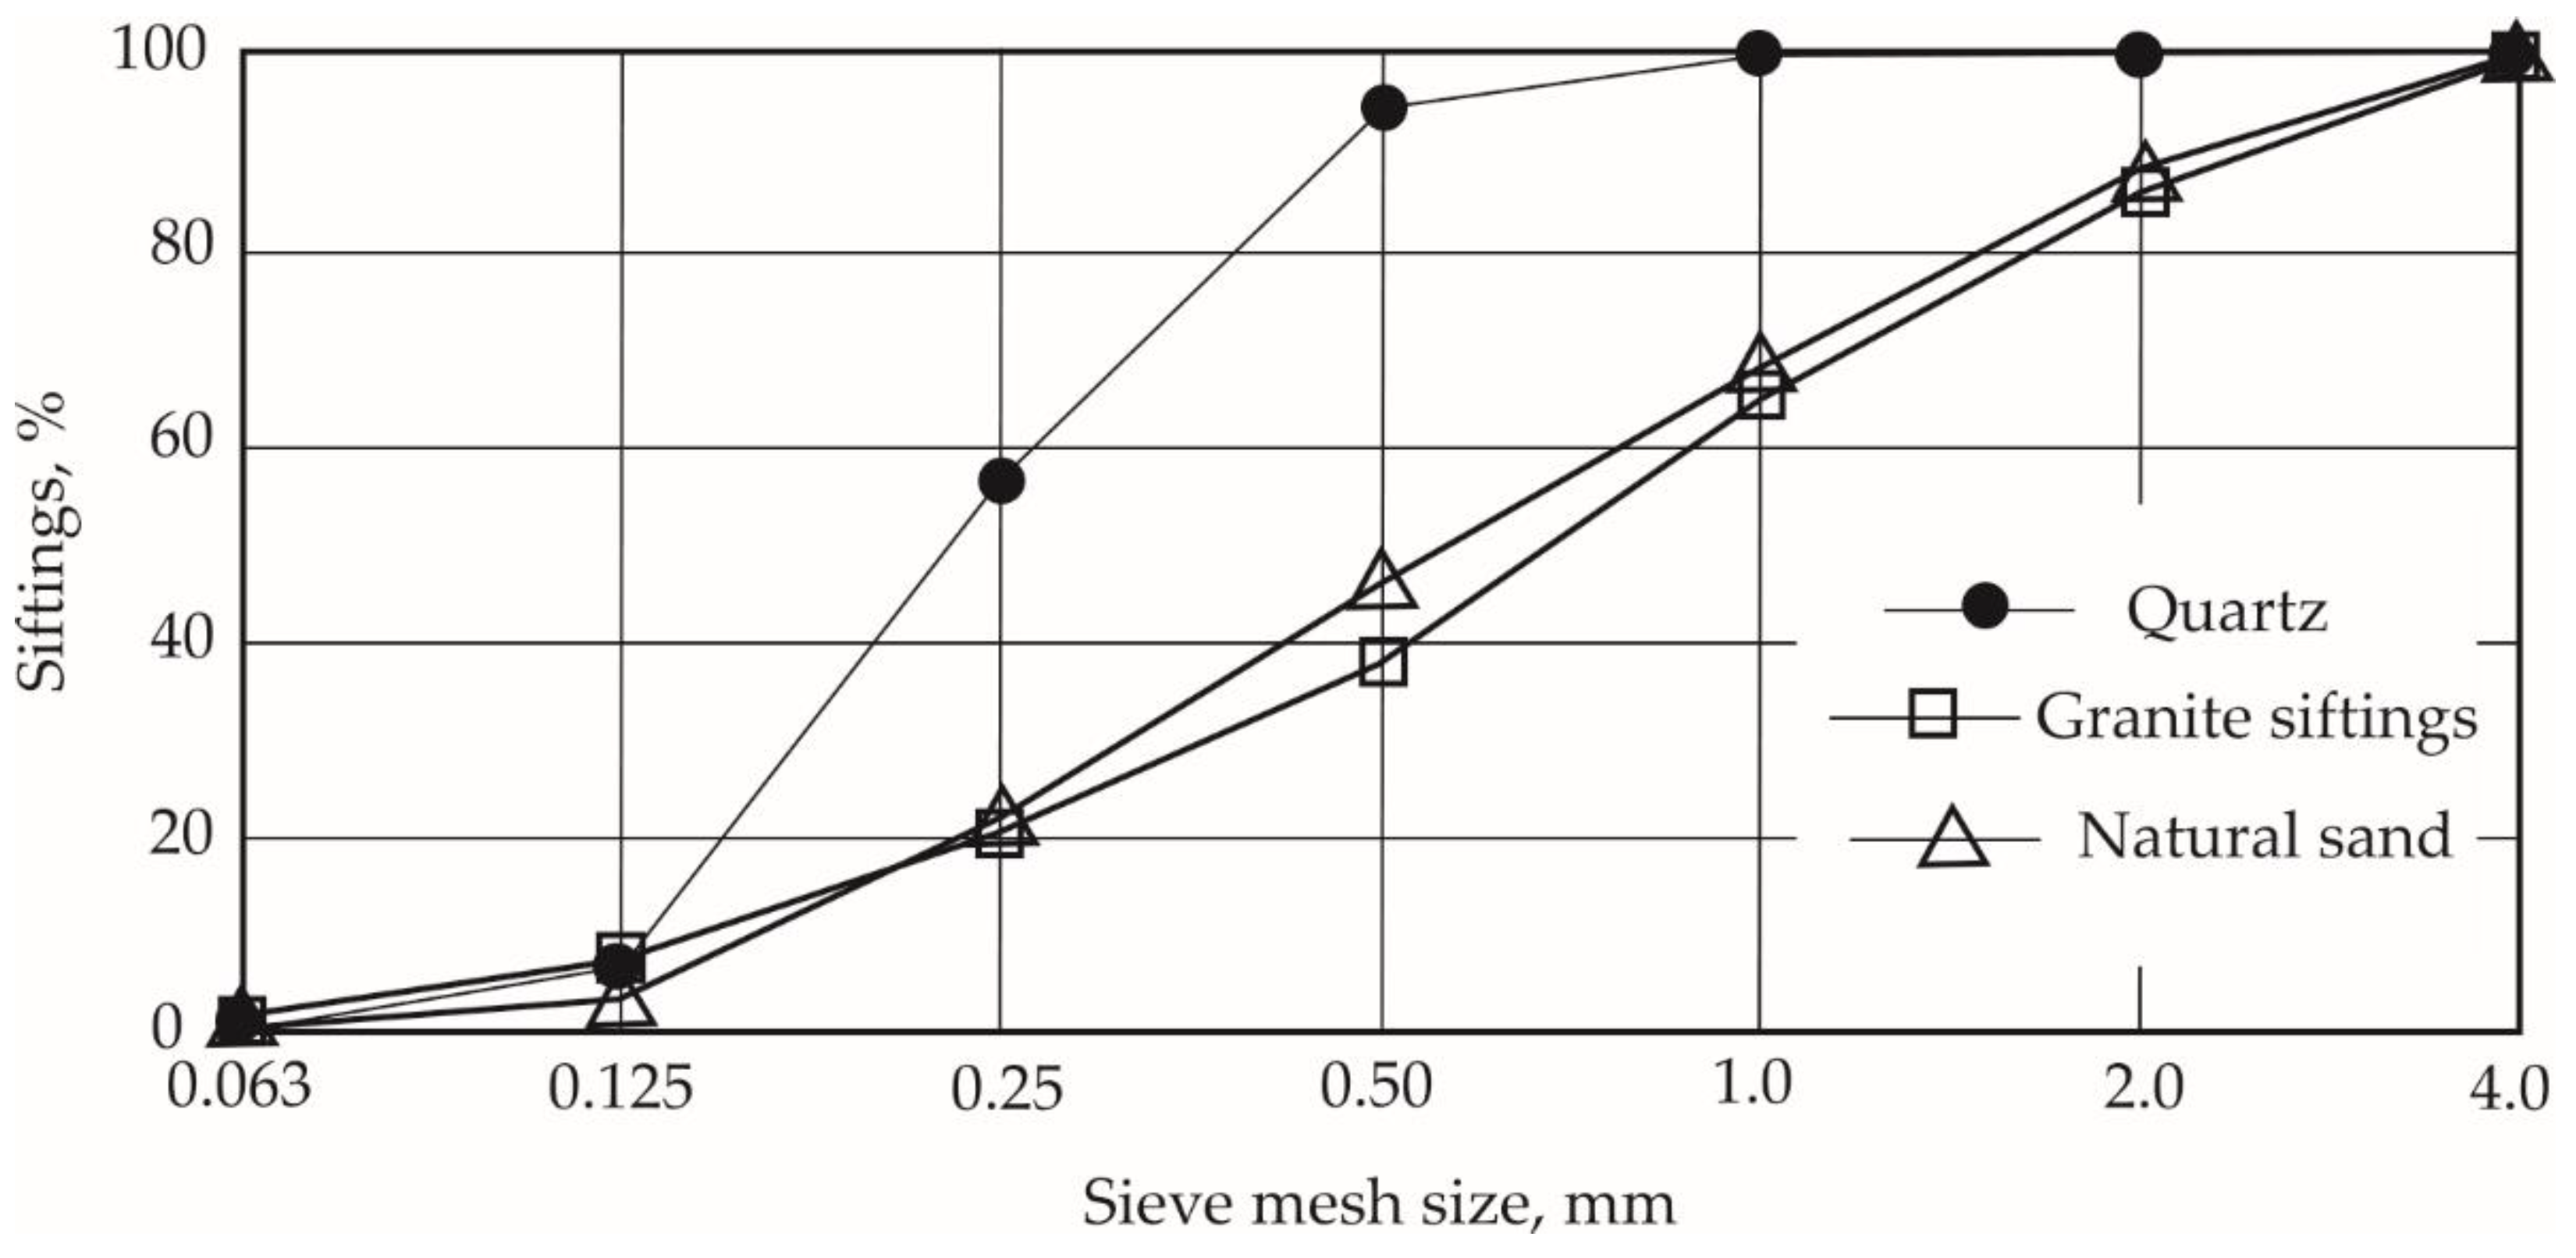
Figure 2.
Additional parameters for evaluation of GRC mix workability.
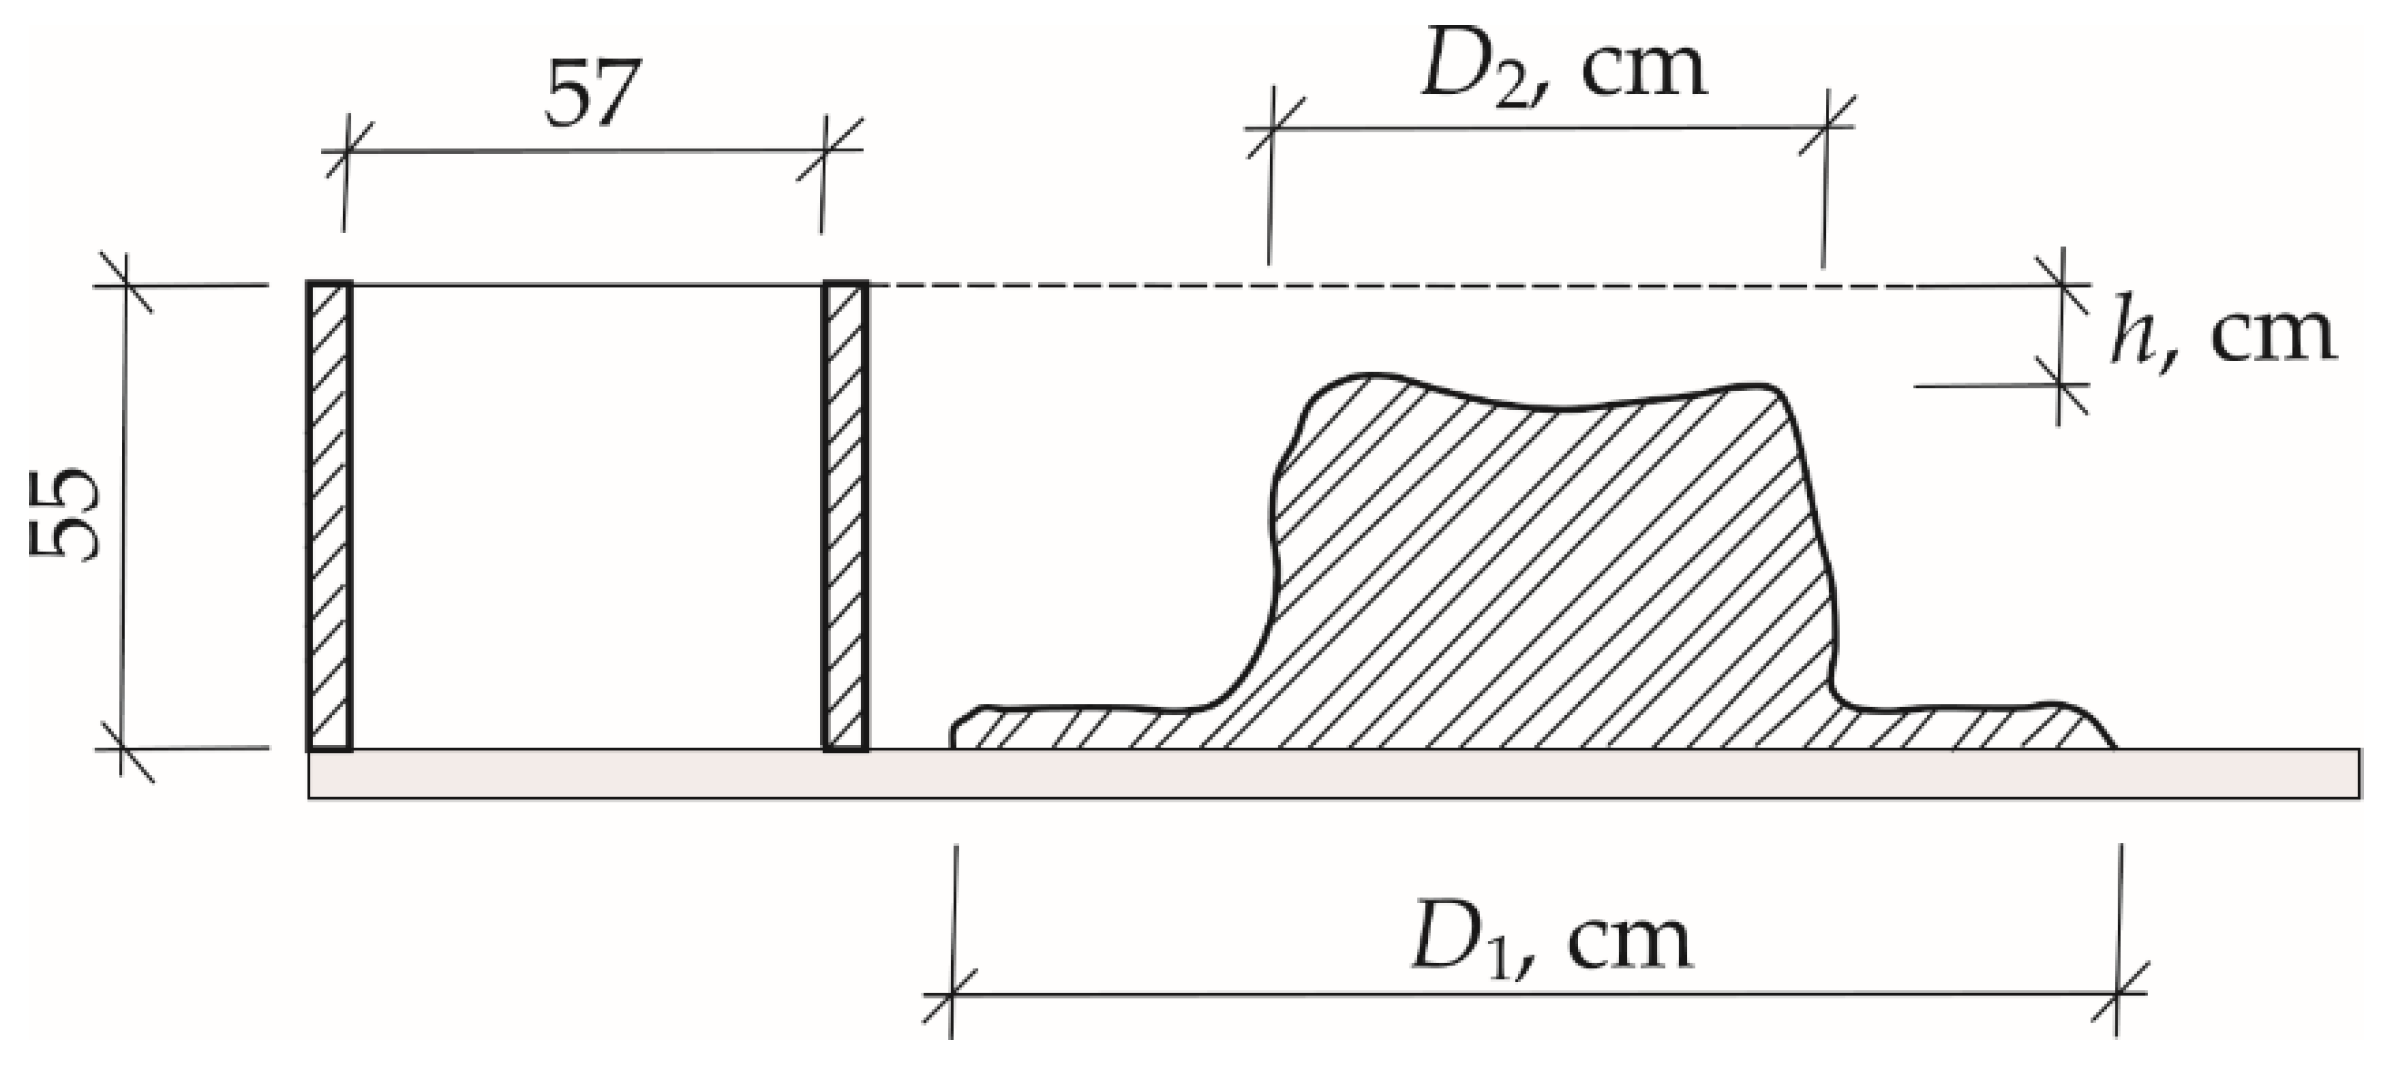
Figure 3.
Segregation of dispersion reinforced fine-grained concrete mix.
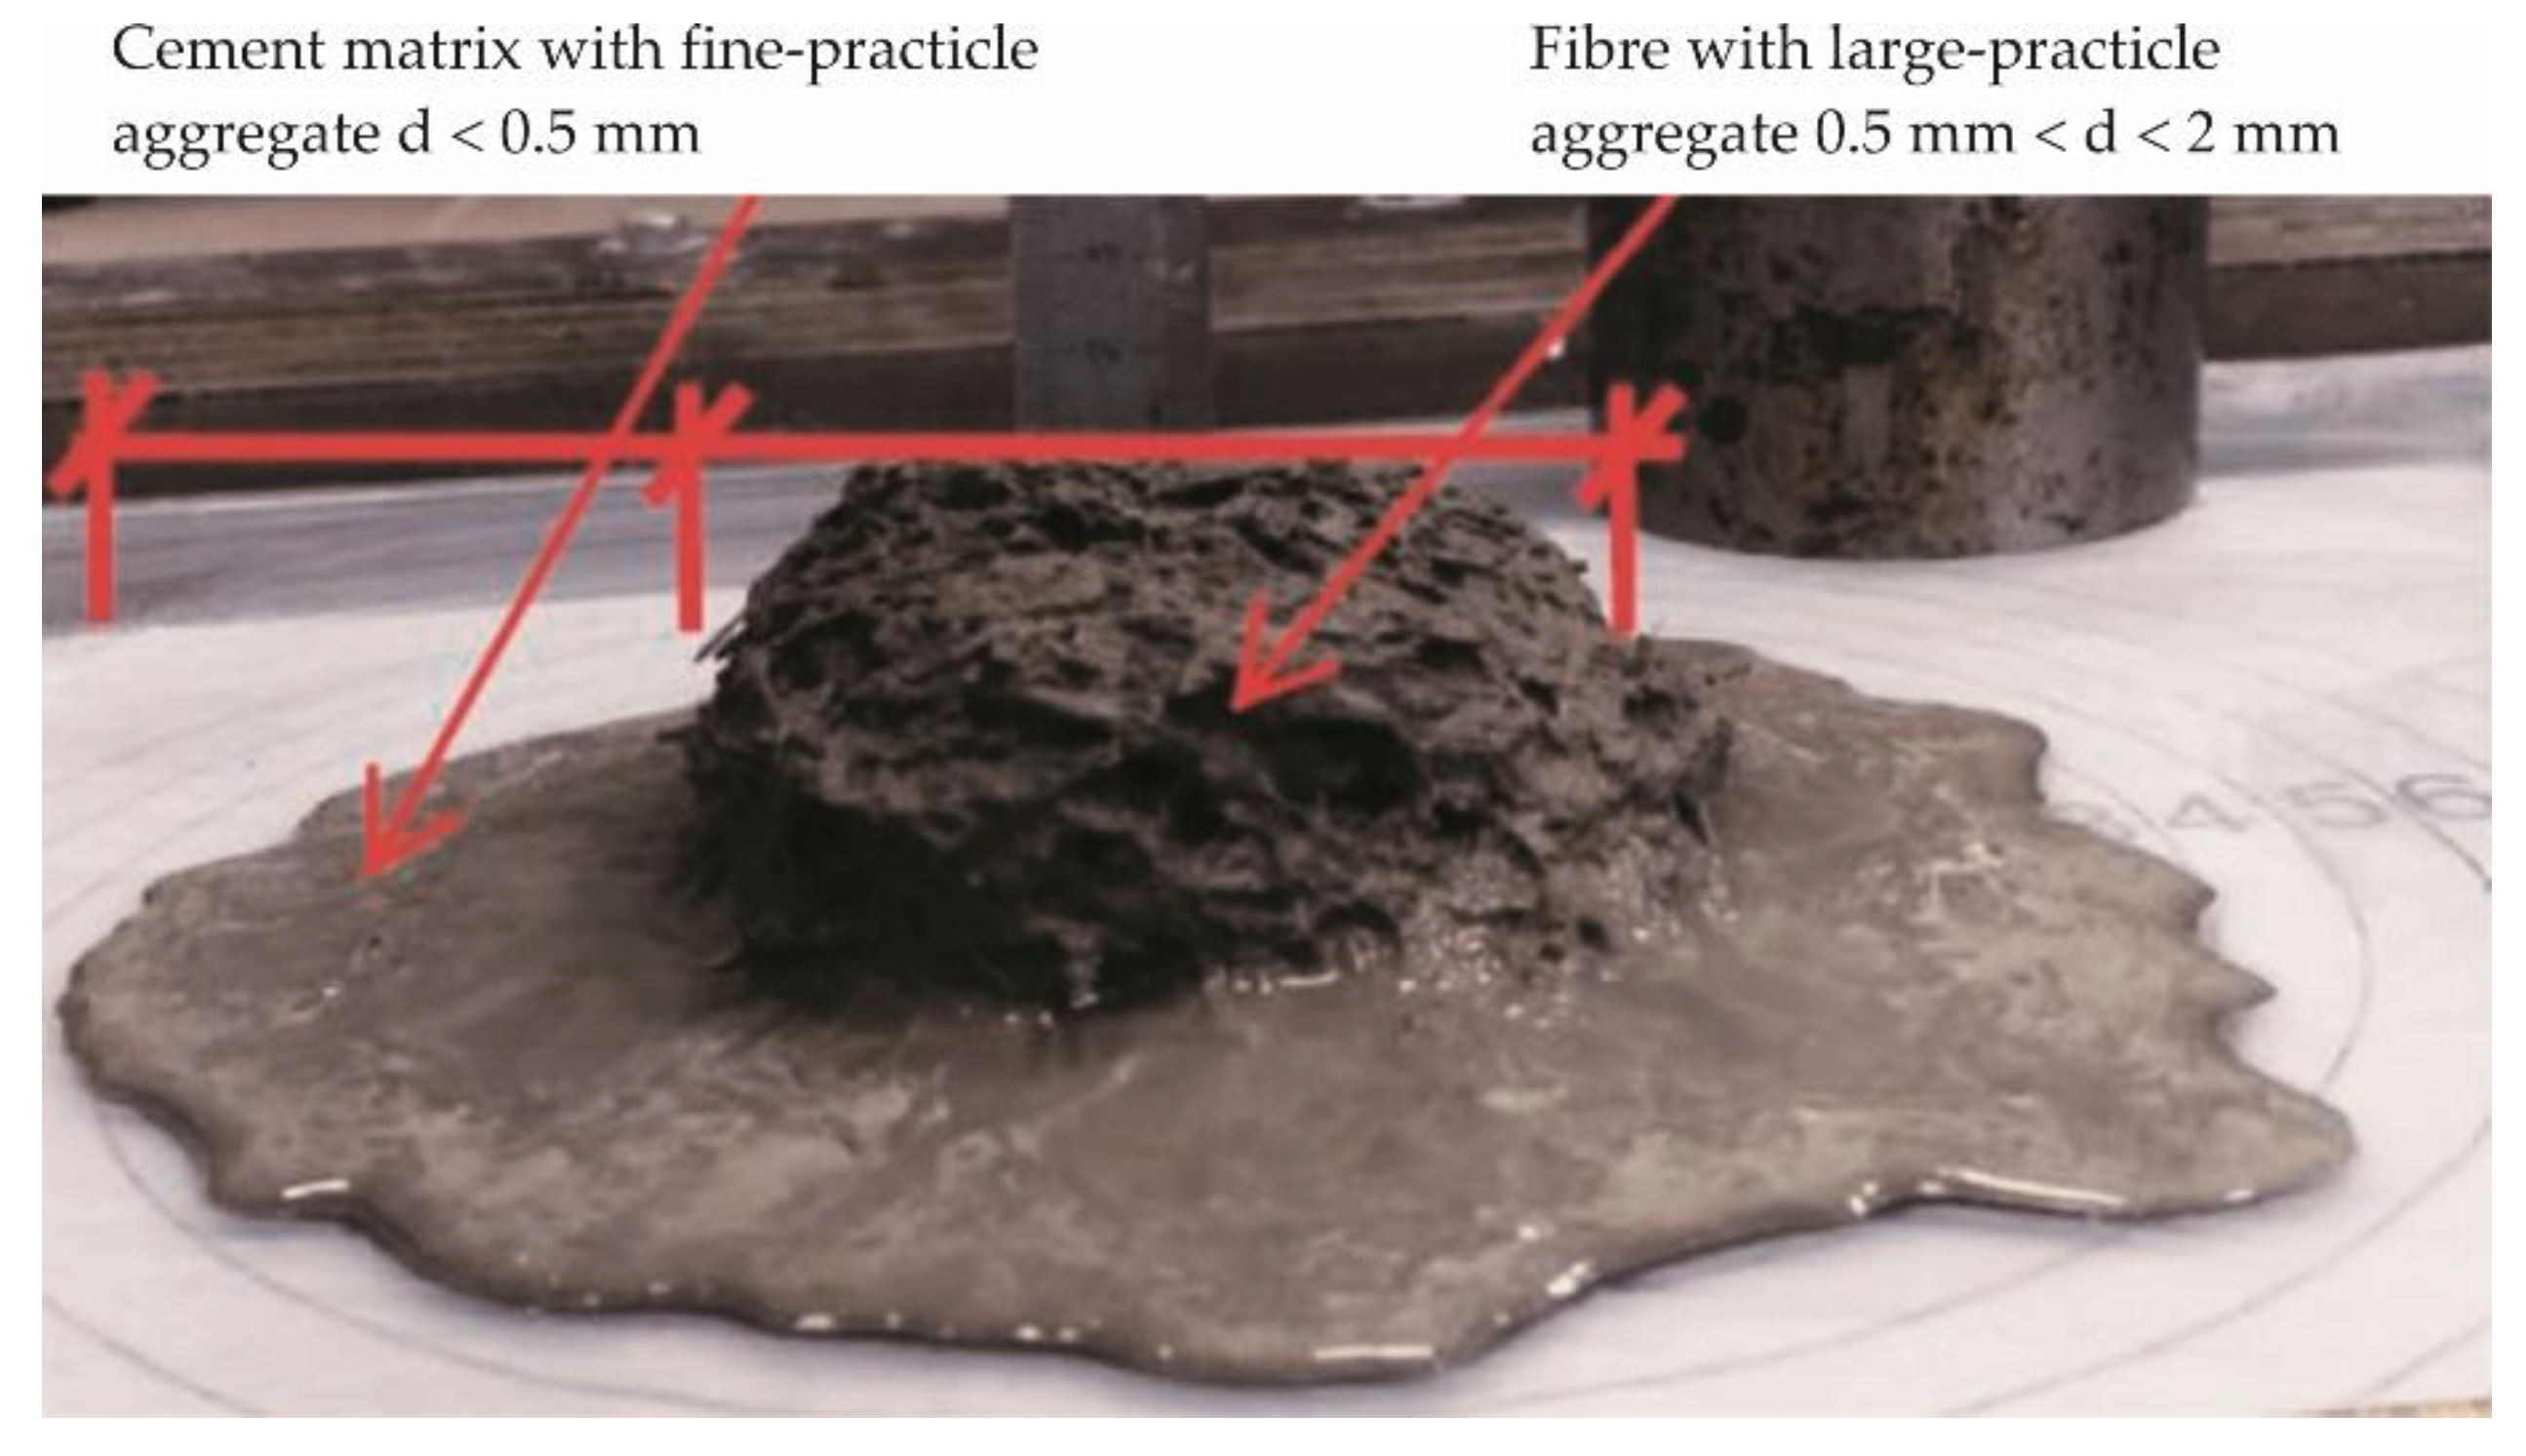
Figure 4.
Photos of workability tests: a) referential quartz matrix (100% quartz filler), b) 50% quartz replaced with granite GS50, c) 50% quartz replaced with natural sand NS50.
Figure 4.
Photos of workability tests: a) referential quartz matrix (100% quartz filler), b) 50% quartz replaced with granite GS50, c) 50% quartz replaced with natural sand NS50.
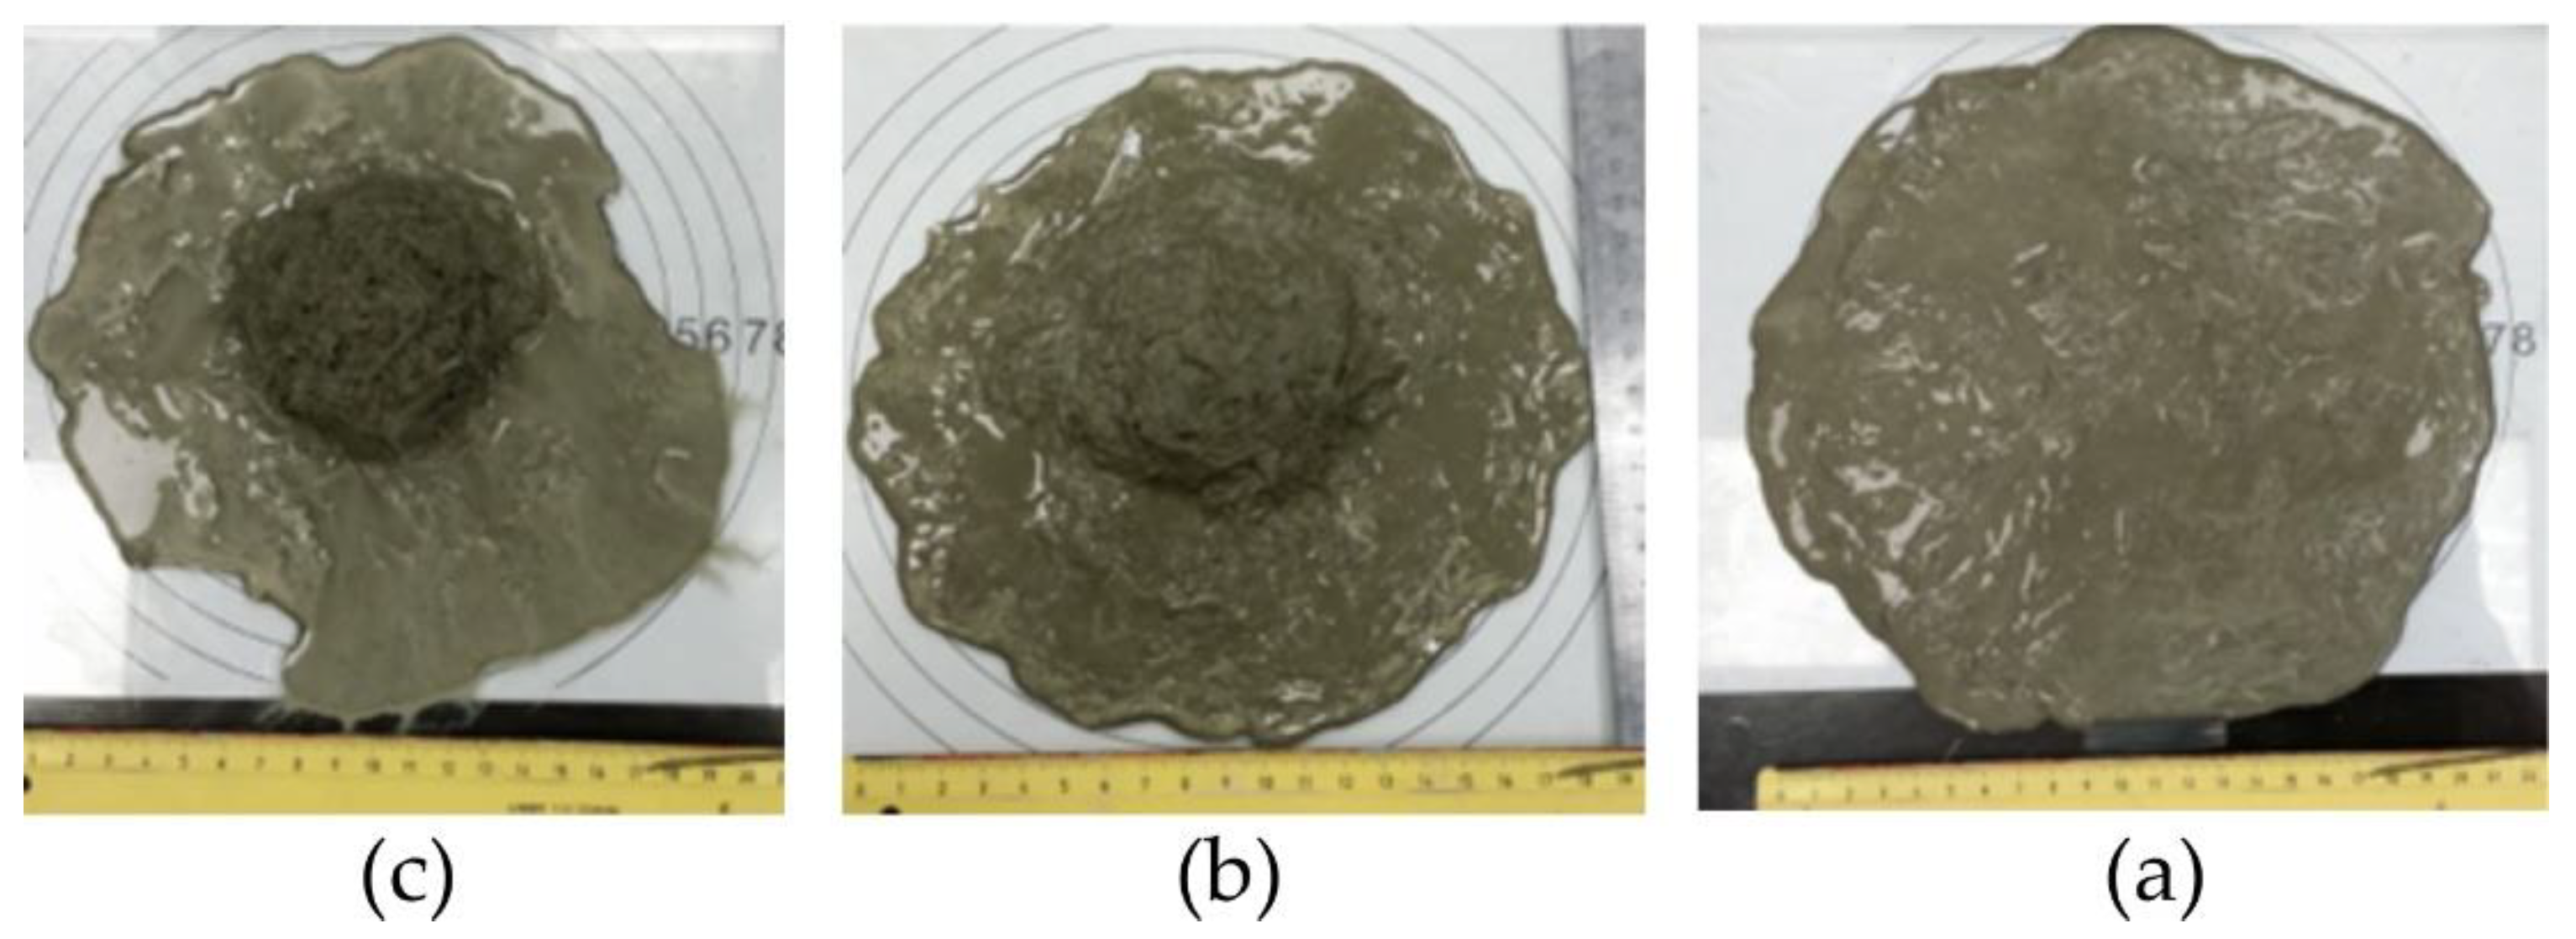
Figure 5.
Dependency of spread of mixes on the amount of granite particles.
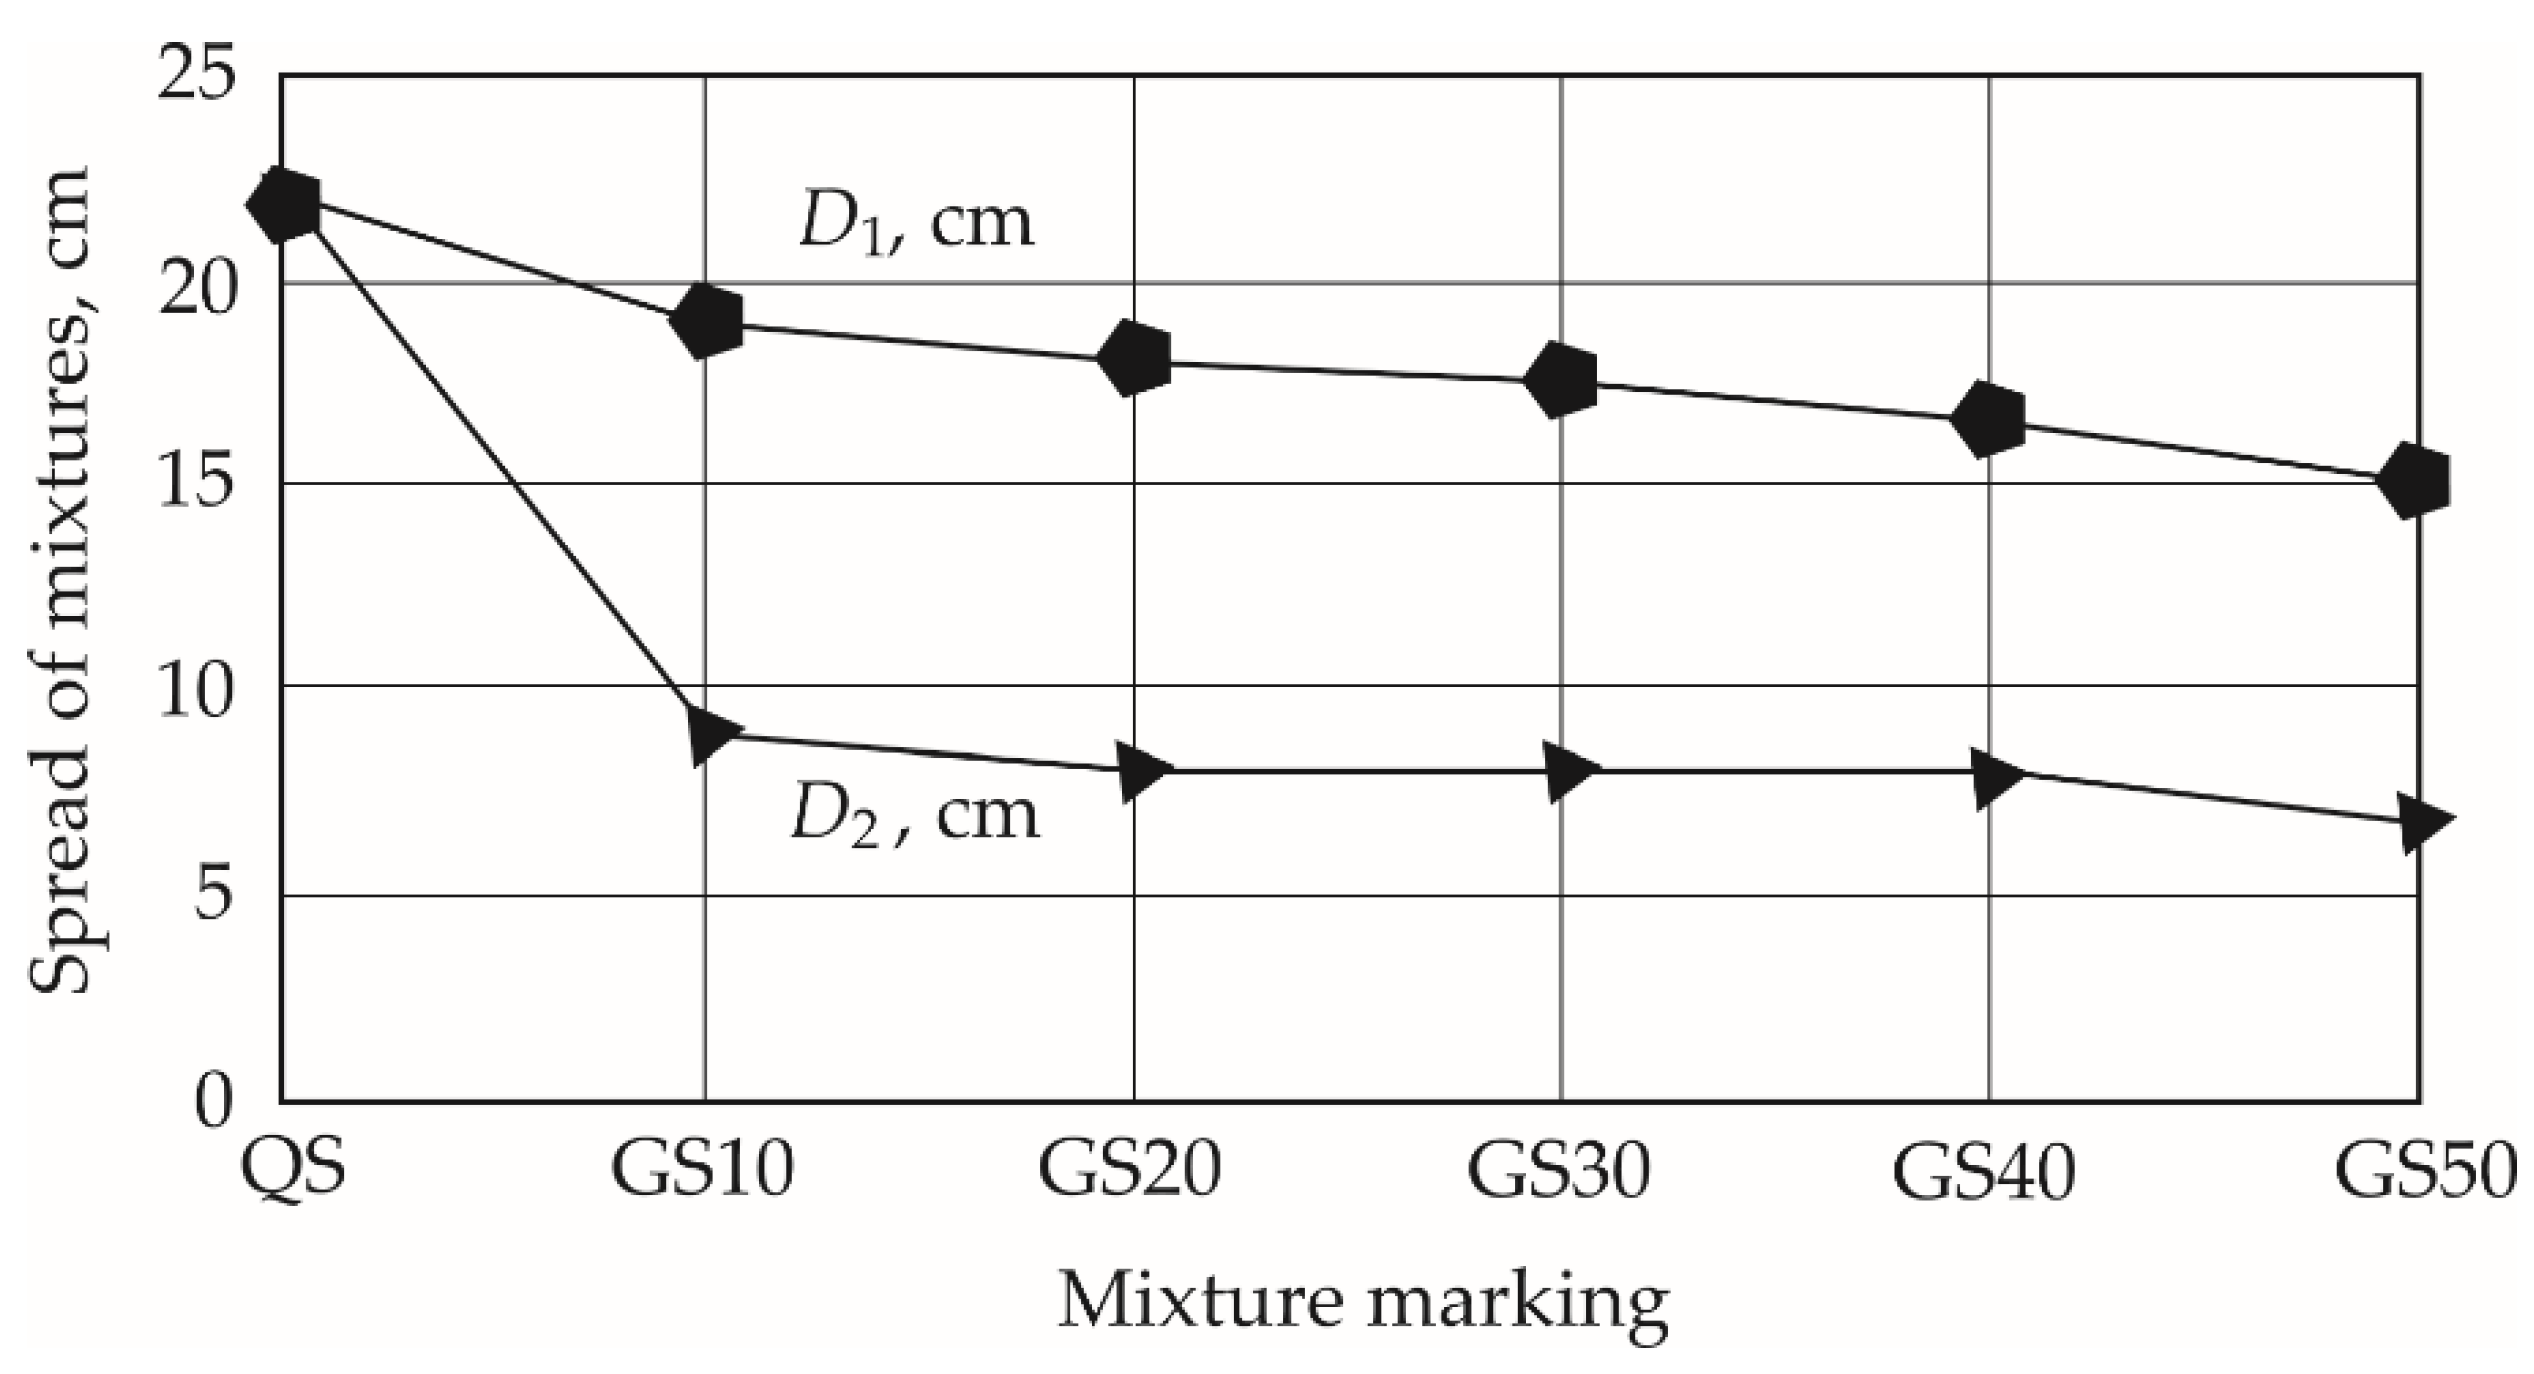
Figure 6.
Dependency of spread of mixes on the amount of natural sand.
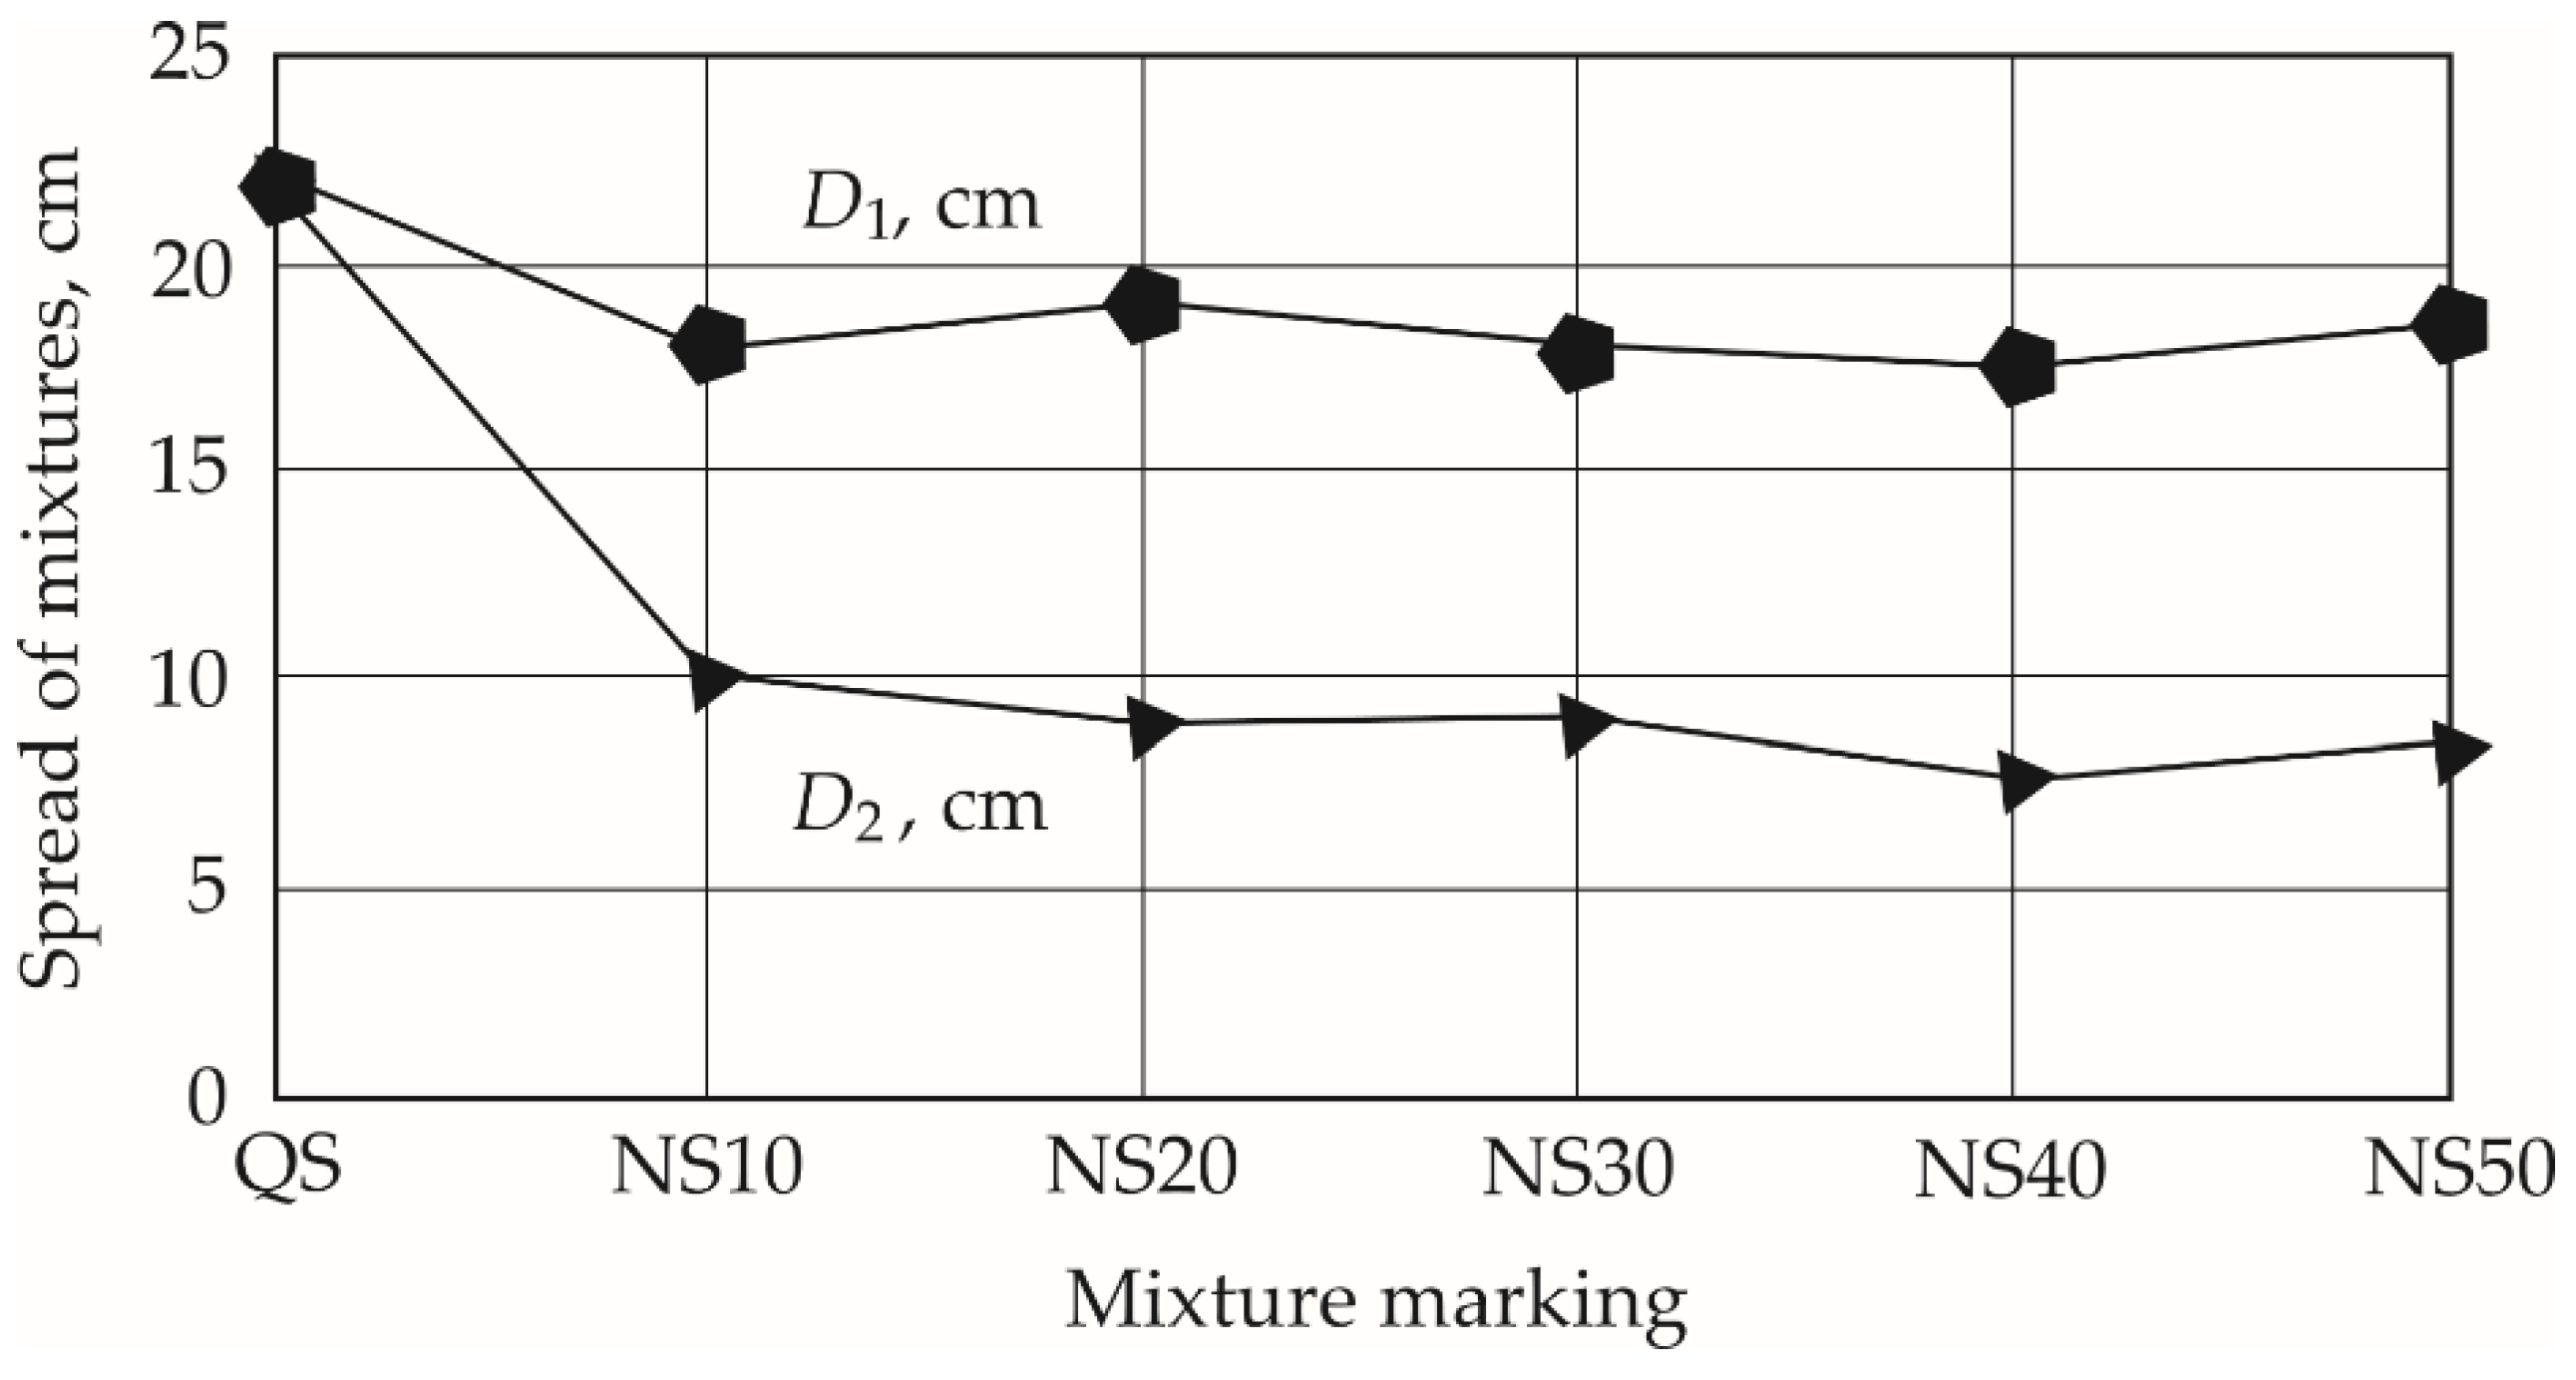
Figure 7.
Dependency of slump of mixes on amount of granite siftings or natural sand.
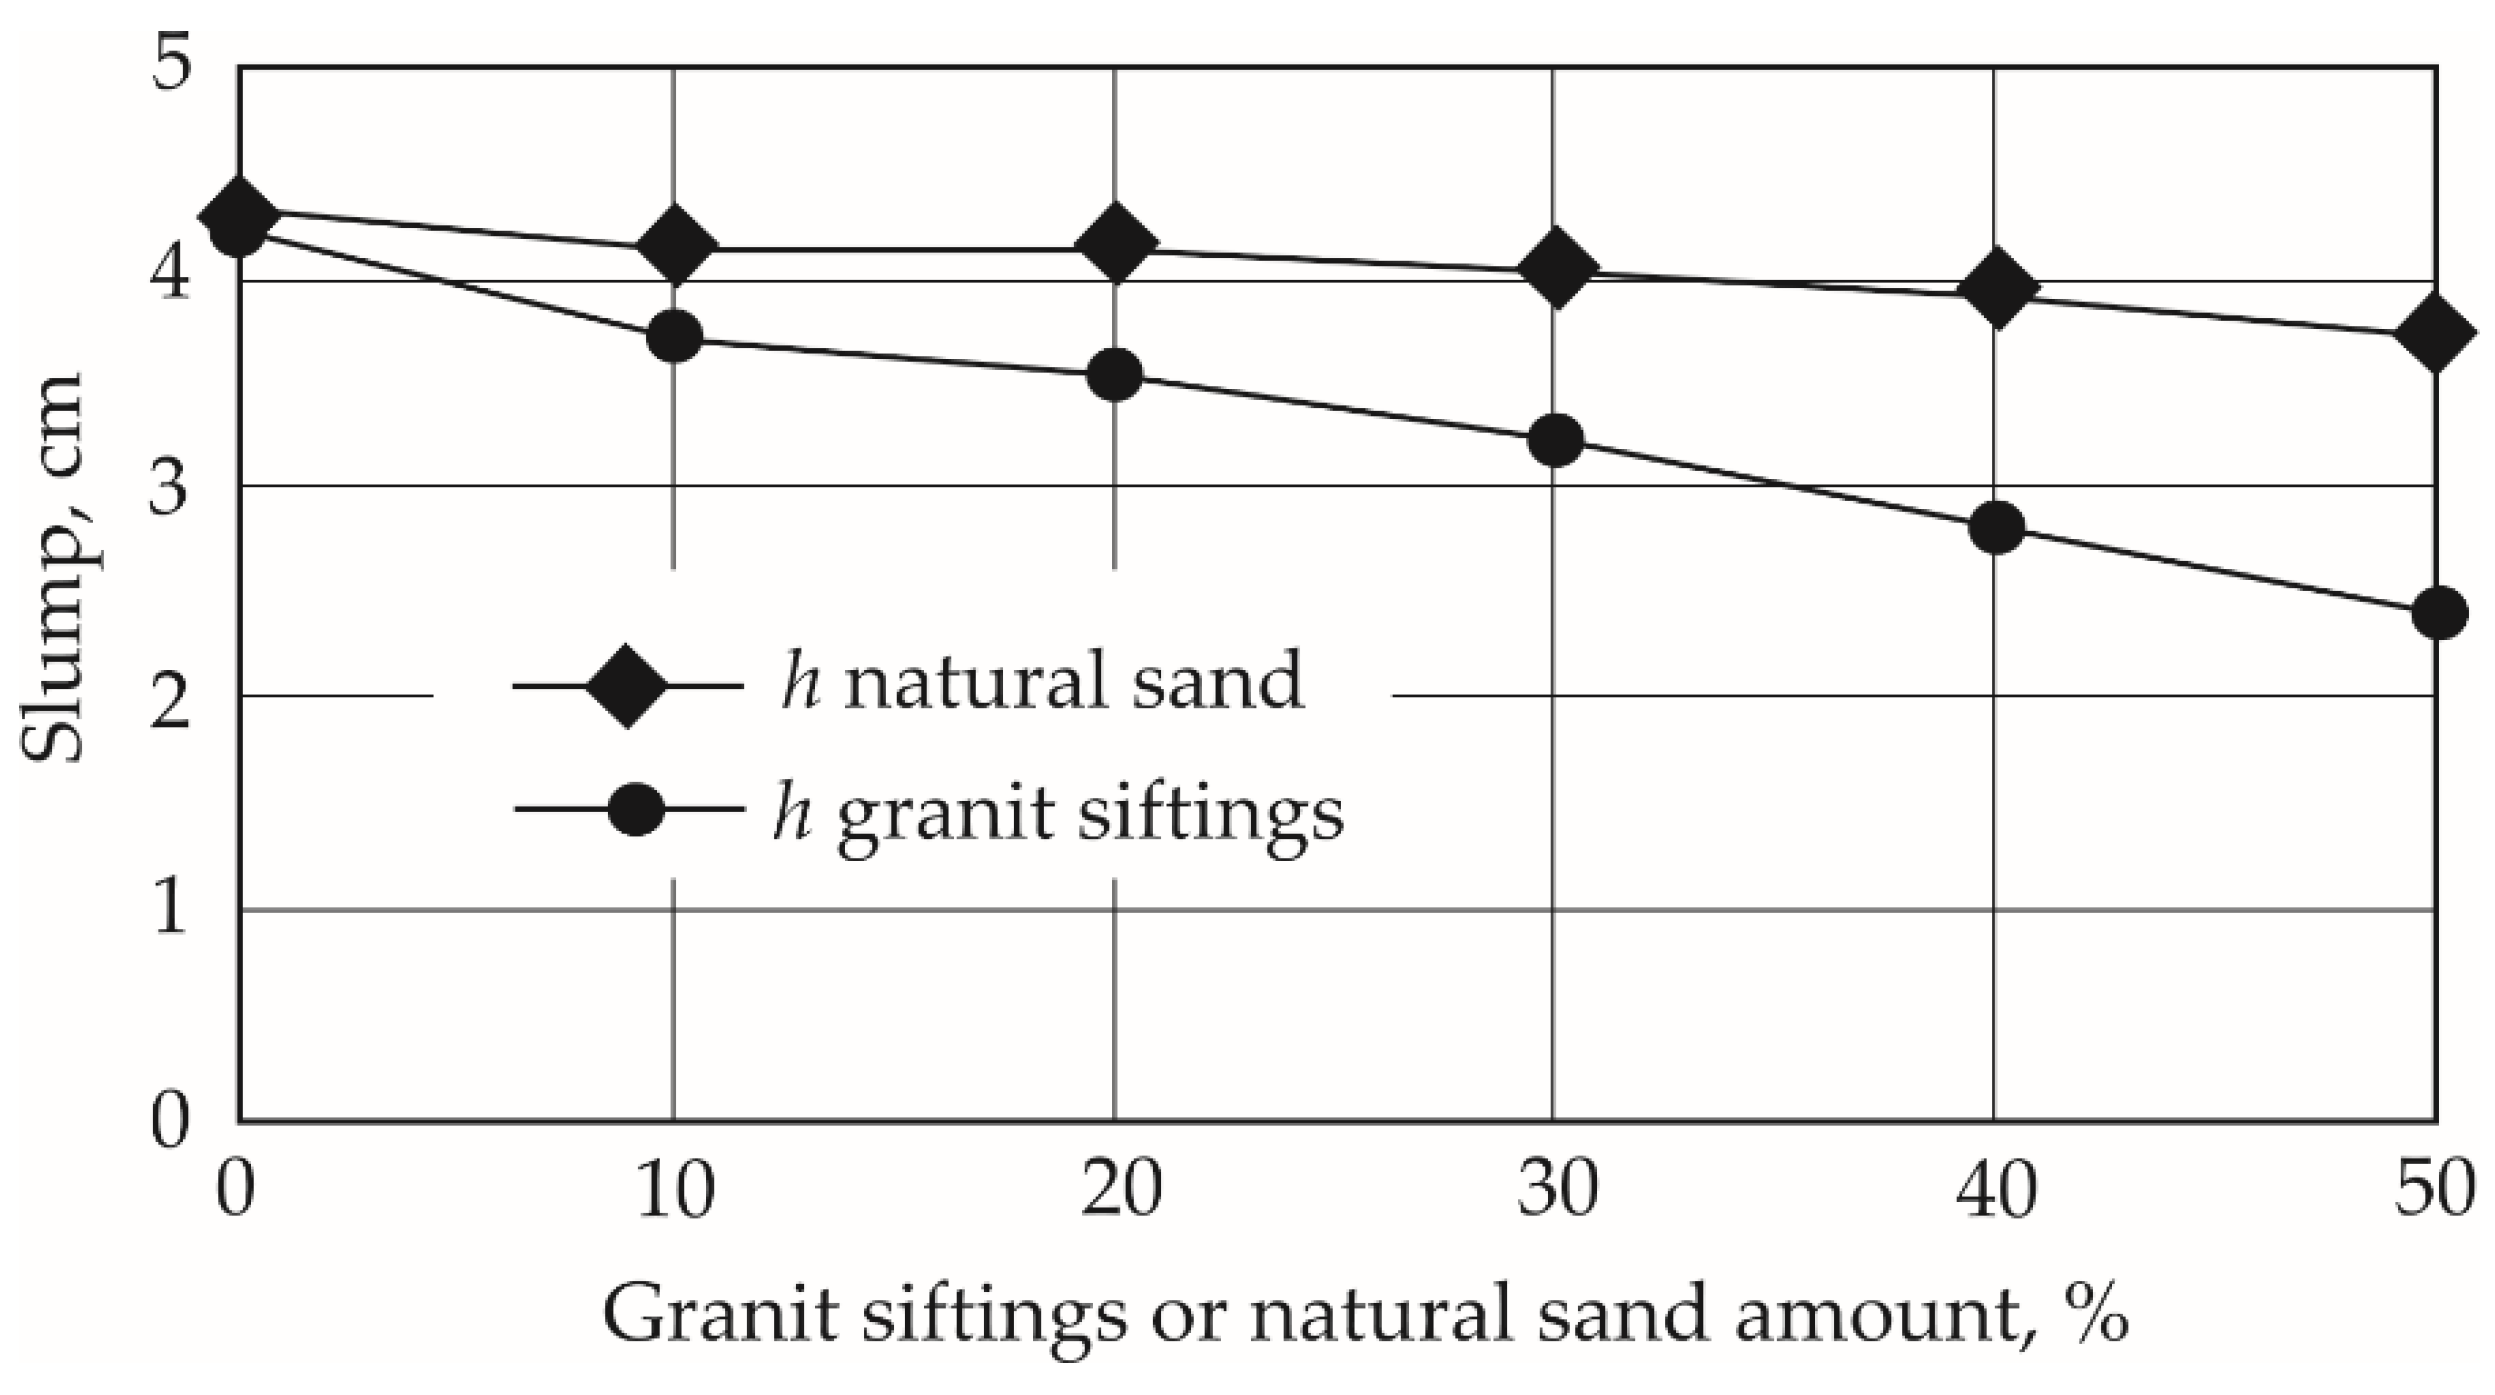
Figure 8.
Aggregate shape analysis under an optical microscope for 1 mm particles (25x magnification): a) granite stiftings; b) natural sand; c) quartz sand.
Figure 8.
Aggregate shape analysis under an optical microscope for 1 mm particles (25x magnification): a) granite stiftings; b) natural sand; c) quartz sand.
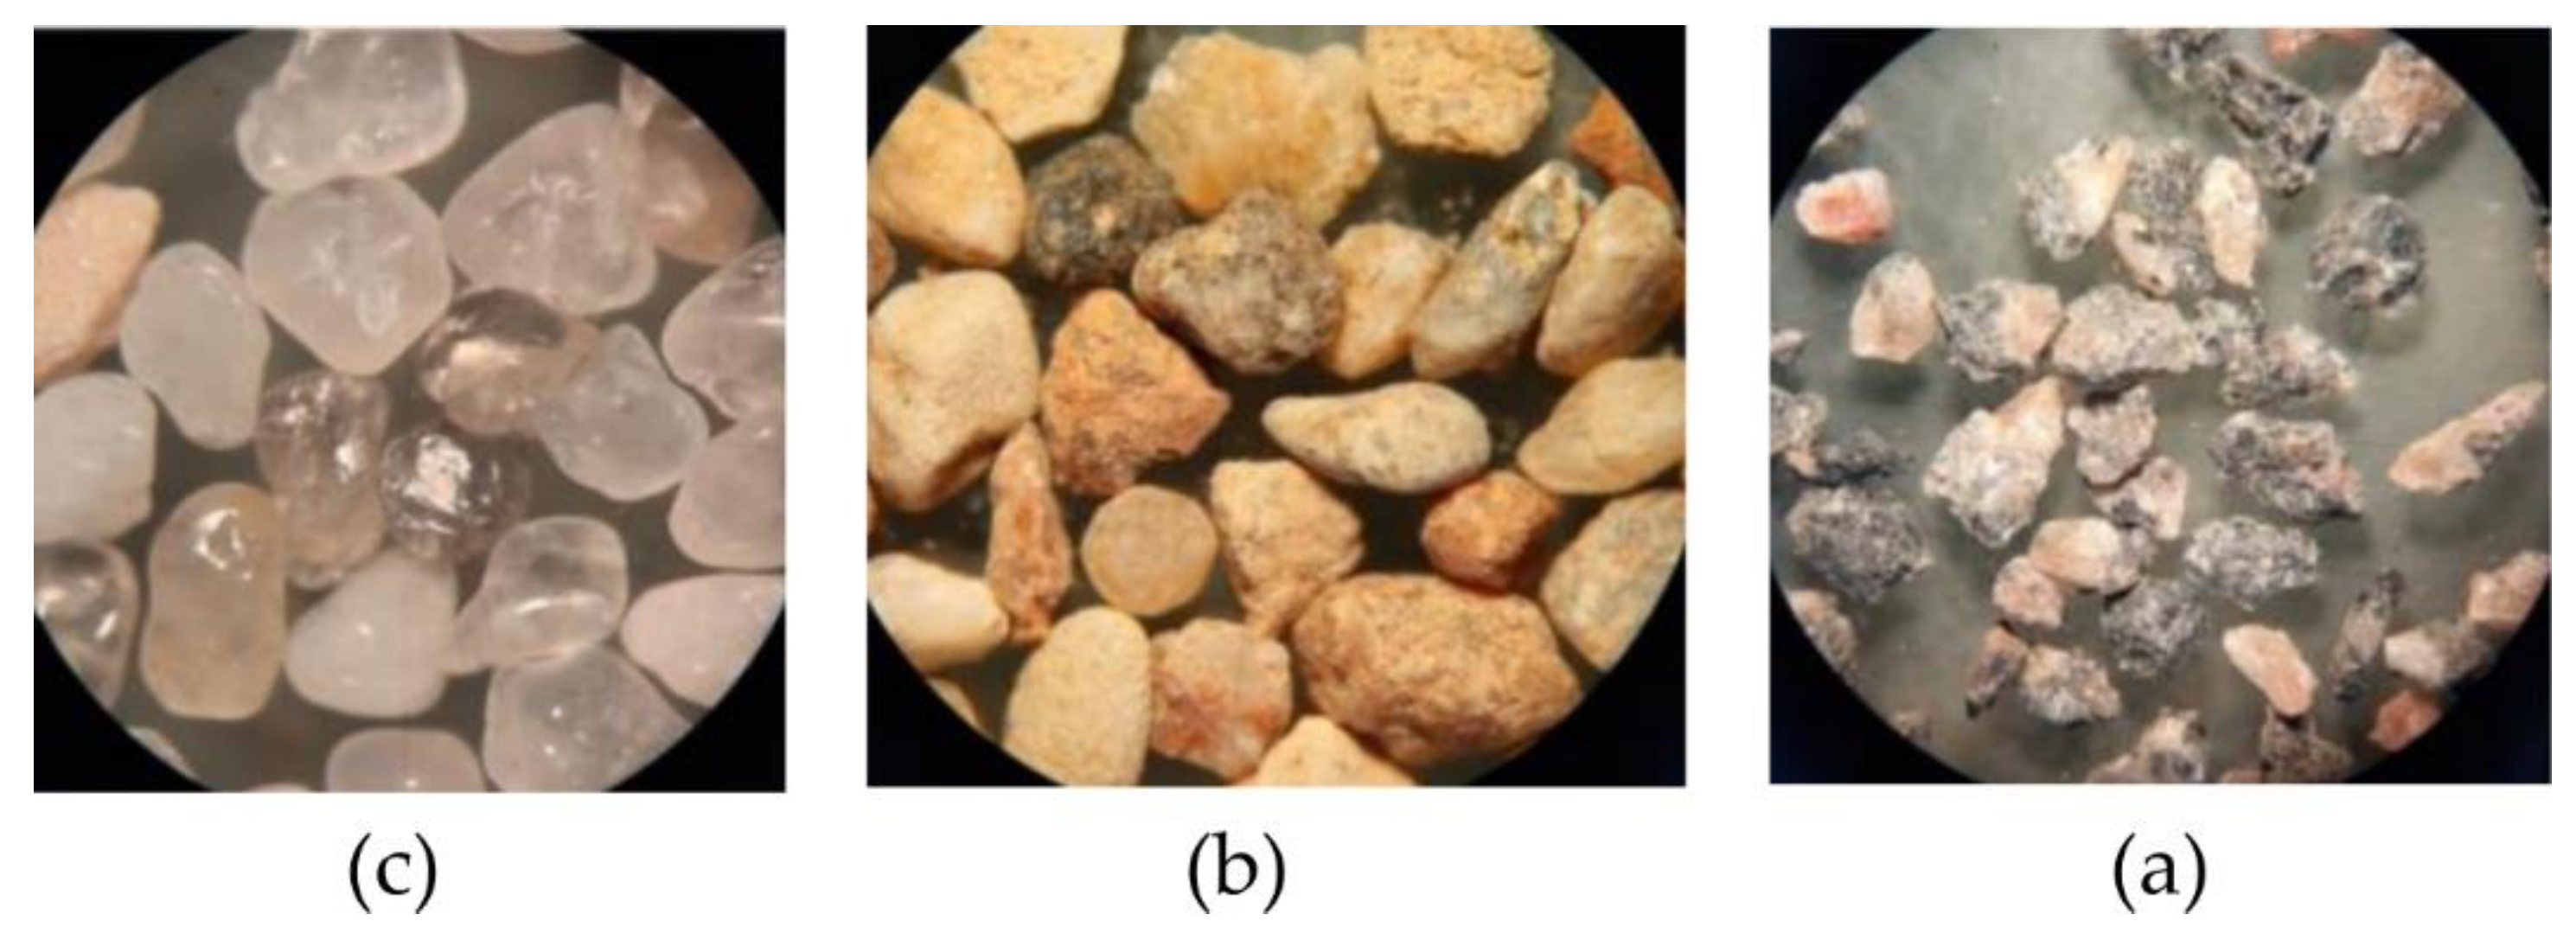
Figure 9.
Segregation indexes for compositions with different quantities of aggregates: granite sifting and natural sand.
Figure 9.
Segregation indexes for compositions with different quantities of aggregates: granite sifting and natural sand.
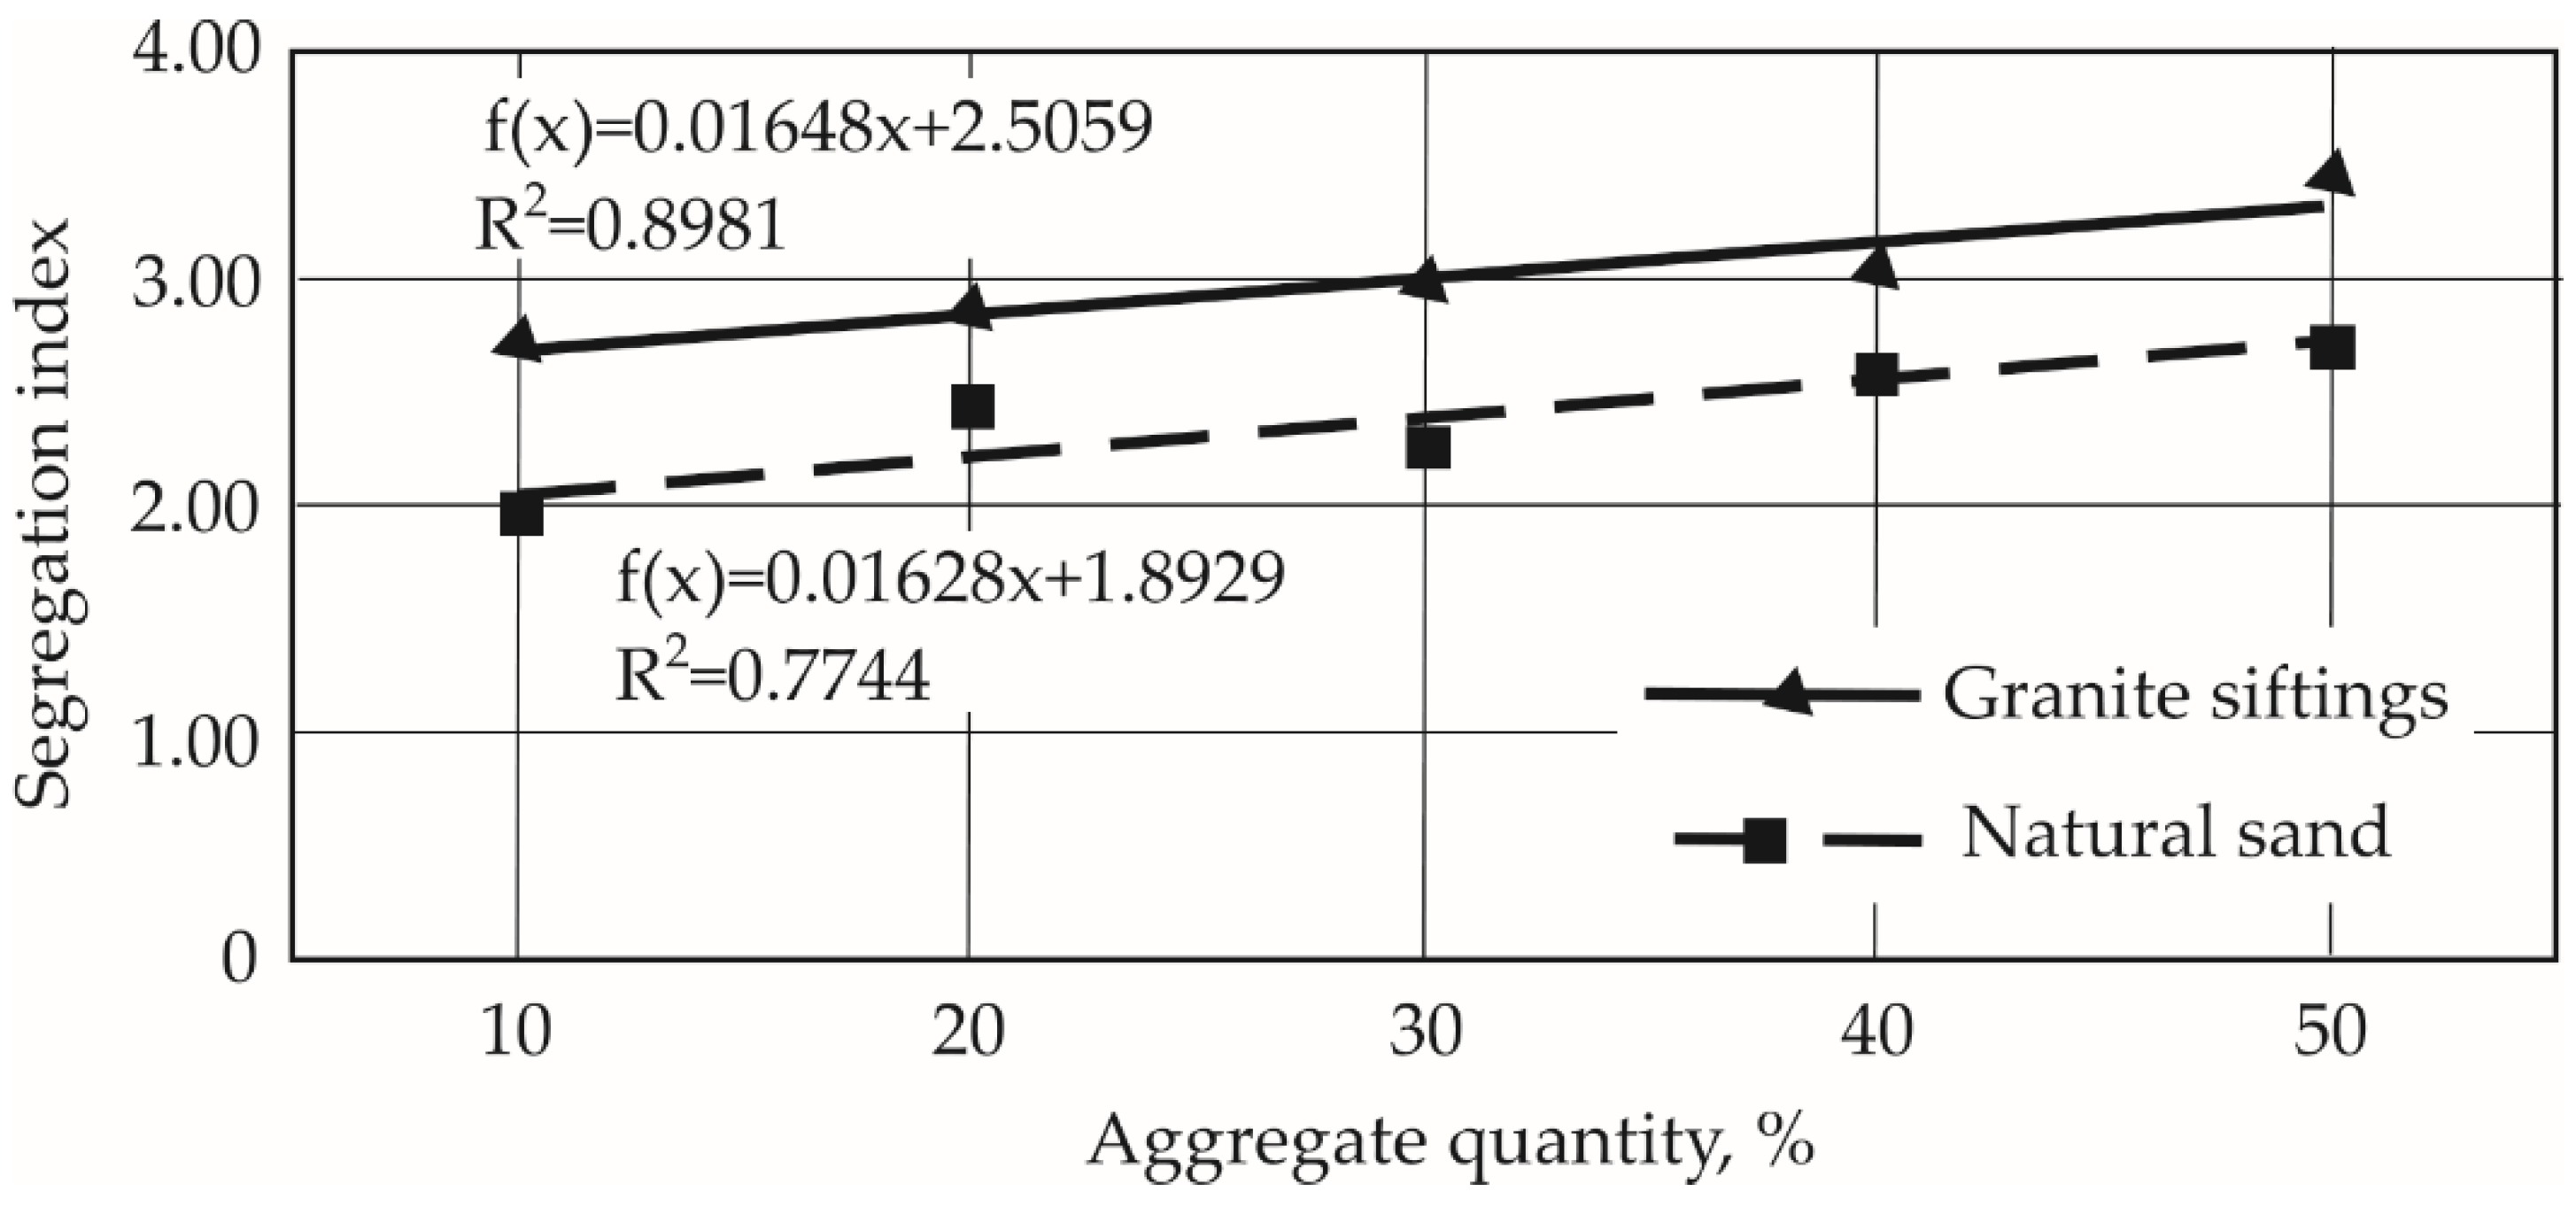
Figure 10.
Dependence of the segregation index (W) on the shape (elongation) and surface roughness parameter (J) of the aggregate particles.
Figure 10.
Dependence of the segregation index (W) on the shape (elongation) and surface roughness parameter (J) of the aggregate particles.
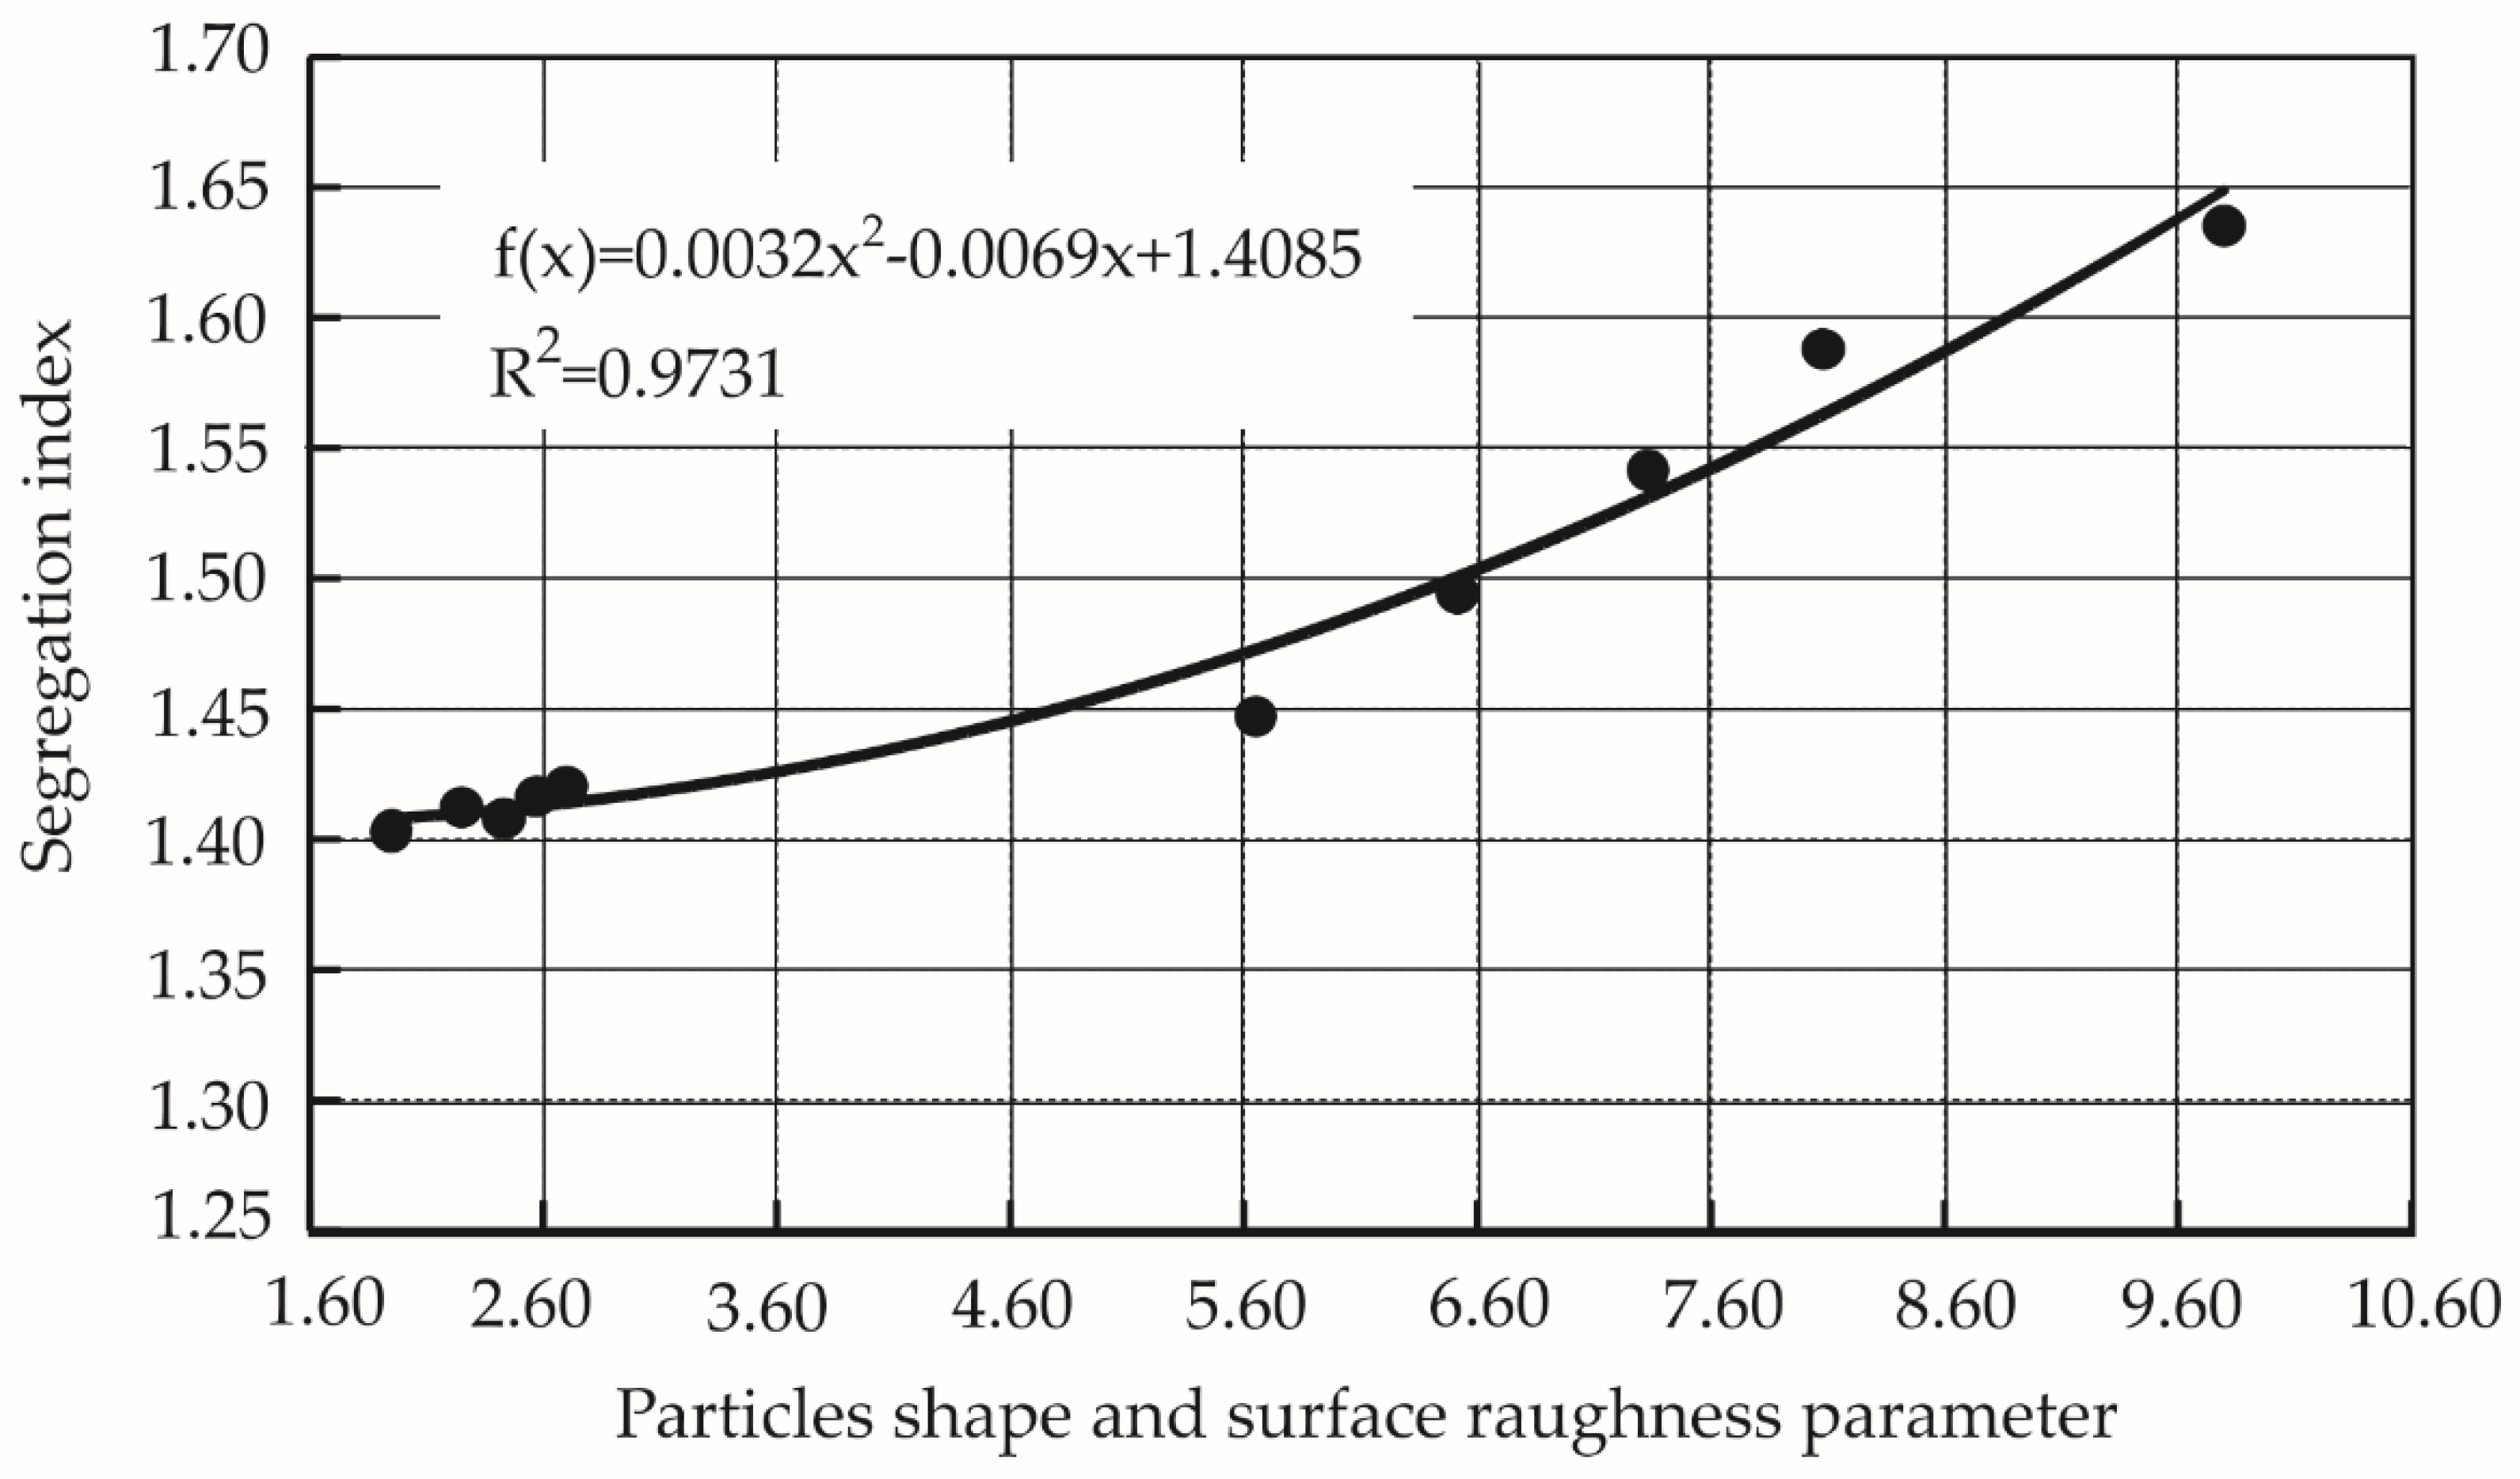

Table 1.
The main physical and chemical characteristics of fine aggregates.
| Natural sand 0/2 |
Granite siftings 0/2 |
Quartz sand 0/1.25 |
Main characteristics |
|---|---|---|---|
| 12.9 1550 2600 90-93 < 3.0 5.16 |
2 1530 2750 70-75 14.4 0 |
1.25 1640 2650 > 98.5 < 0.6 0 |
dmax, mm bulk density, kg/m3 specific density, kg/m3 SiO2, % Al2O3, % CaCO3 +MgCO3, % |
Table 2.
Chemical composition of Portlandcement CEM I 52.5R, %.
| Cr | Na2O | K2O | SO3 | MgO | Fe2O3 | Al2O3 | SiO2 | CaO |
|---|---|---|---|---|---|---|---|---|
| 0.062 | 0.76 | 0.78 | 3.05 | 1.55 | 2.99 | 5.24 | 19.84 | 63.99 |
Table 3.
Mineral composition of Portlandcement CEM I 52,5R, %.
| C4AF | C3A | C2S | C3S |
|---|---|---|---|
| 10.4 | 1.43 | 17.23 | 53.56 |
Table 4.
GRC mixtures composition with granite and regular sand for workability investigation.
| Changed content of quartz sand, % | |||||
|---|---|---|---|---|---|
| 50 | 40 | 30 | 20 | 10 | |
| 853 | 853 | 853 | 853 | 853 | Cement CEM I 52,5R, kg/m3 |
| 427 | 512 | 597 | 682 | 767 | Quartz sand, kg/m3 |
| 427 | 341 | 256 | 171 | 86 | Granite siftings or regular sand kg/m3 |
| 9.38 | 9.38 | 9.38 | 9.38 | 9.38 | Superplasticizer, 1,1% by weight of binder, kg/m3 |
| 0.36 | 0.36 | 0.36 | 0.36 | 0.36 | W/C (water/cement ratio) |
| 49.5 | 49.5 | 49.5 | 49.5 | 49.5 | Glass fibers, 2,9% by weight of solids, kg/m3 |
Table 5.
Determination of particle shape index.
| Granite siftings | Natural sand | Quartz sand | Fraction, mm | ||||
|---|---|---|---|---|---|---|---|
| Elongation index Igs | Quantity, % | Elongation index Ins | Quantity, % | Elongation index Iq | Quantity, % | ||
| 2.00 | 13.9 | 1.38 | 11.8 | 0.00 | 0.0 | 2….4 | |
| 2.20 1.76 1.59 1.97 1.61 1.87 |
20.7 27.6 17.0 12.9 8.0 100 |
1.31 1.32 1.69 1.45 1.4 1.44 |
20.0 22.3 23.3 19.0 3.6 100 |
1.21 1.37 1.34 1.42 1.56 1.40 |
0.3 5.2 37.6 49.5 7.4 100 |
1….2 0.5…1 0.25…0.5 0.125…0.25 0.063…0.125 Total aggregate |
|
Disclaimer/Publisher’s Note: The statements, opinions and data contained in all publications are solely those of the individual author(s) and contributor(s) and not of MDPI and/or the editor(s). MDPI and/or the editor(s) disclaim responsibility for any injury to people or property resulting from any ideas, methods, instructions or products referred to in the content. |
© 2025 by the authors. Licensee MDPI, Basel, Switzerland. This article is an open access article distributed under the terms and conditions of the Creative Commons Attribution (CC BY) license (http://creativecommons.org/licenses/by/4.0/).
Copyright: This open access article is published under a Creative Commons CC BY 4.0 license, which permit the free download, distribution, and reuse, provided that the author and preprint are cited in any reuse.


