Preprint
Article

This version is not peer-reviewed.

Iodoquinoline-Biofortified Lettuce as a Safe and Bioavailable Dietary Iodine Source: In Vivo Study in Rats

Submitted:

20 November 2025

Posted:

21 November 2025

You are already at the latest version

Abstract

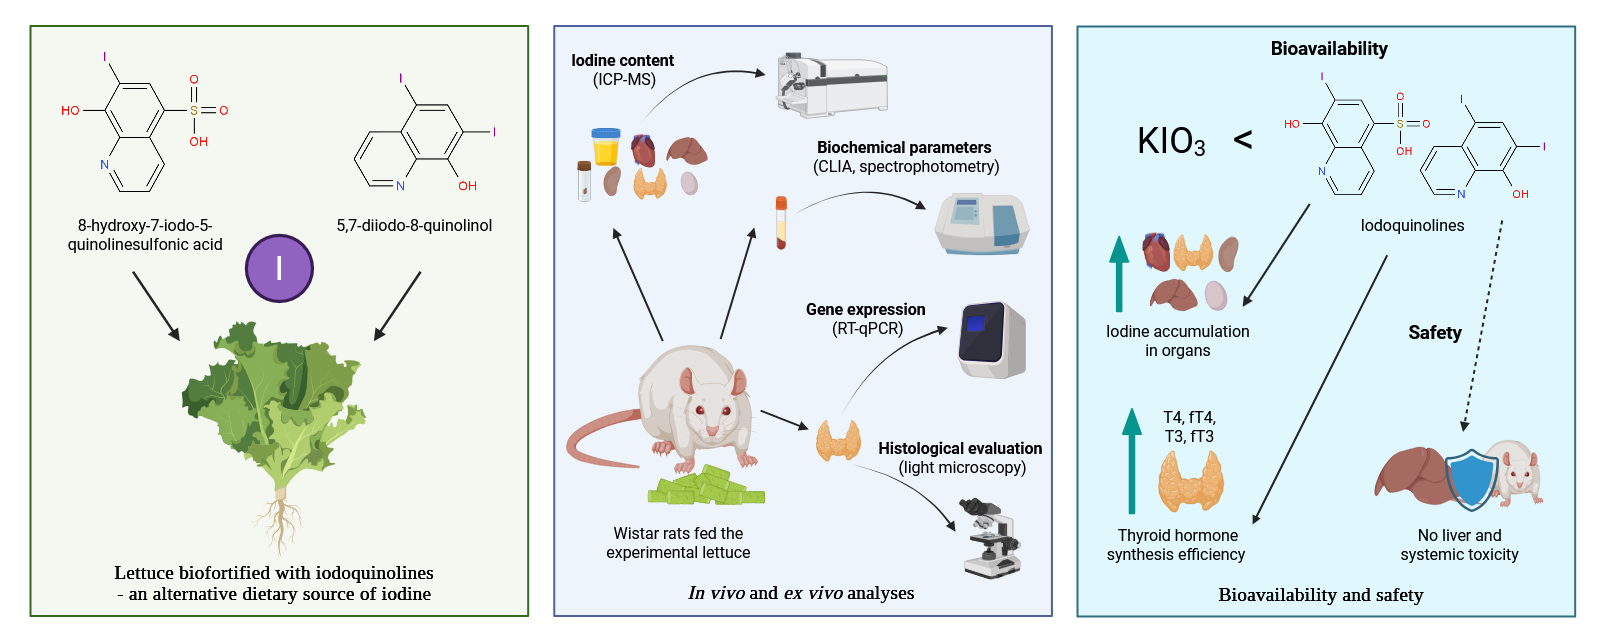
Background/Objectives: Iodine plays a key role in thyroid hormone synthesis and metabolic regulation in vertebrates. This study aimed to evaluate the in vivo bioavailability of iodine and assess selected biochemical parameters and thyroid-related gene expression in male Wistar rats fed lettuce (Lactuca sativa L.) biofortified with iodoquinolines (8-hydroxy-7-iodo-5-quinolinesulfonic acid or 5,7-diiodo-8-quinolinol) or potassium iodate. Methods: Two iodine intake levels were applied: a nutritionally adequate iodine level and a supranutritional level, to evaluate the nutritional safety of iodine obtained from biofortified vegetables. Results: A diet containing lettuce biofortified with iodoquinolines at the adequate level had no significant effect on thyroid hormone concentrations, expression of Dio1, Dio2, Slc5a5, and Tpo genes, or thyroid morphology. While supranutritional iodine intake led to increased levels of T4, fT4, T3, and fT3, all hormone concentrations remained within the physiological range. No elevation in liver enzyme activity (ALT, AST, ALP) was observed, indicating the absence of hepatotoxic effects from high-iodine diets based on biofortified lettuce. Compared to potassium iodate, iodoquinolines demonstrated superior bioavailability, as evidenced by enhanced iodine accumulation in tissues and more efficient thyroid hormone synthesis. Conclusions: To the best of our knowledge, this is the first in vivo nutritional study assessing the physiological effects of supranutritional iodine intake from a biofortified plant source. These findings confirm the nutritional safety and efficacy of iodine biofortification using iodoquinolines and highlight the need for further research, including human nutritional clinical trials.

Keywords: 
;  ;  ;  ;  ;  ;  ;  

1. Introduction

Iodine in various chemical forms is absorbed and utilized by nearly all living organisms, and in chordates it plays the role of an essential micronutrient [1]. In vertebrates, this element is a component of thyroid hormones (3,5,3′,5′-tetraiodo-L-thyronine, T4, and 3,5,3′-triiodo-L-thyronine, T3), and also plays a significant role in energy metabolism, thermoregulation, as well as physical and mental development [2]. The adverse effects of insufficient iodine intake are well documented in the scientific literature and are most commonly referred to as iodine deficiency disorders (IDD) [3].
The World Health Organization’s (WHO) global strategy aimed at eliminating iodine deficiency relies on universal salt iodization (USI) intended for human consumption. However, in practice, USI is rarely fully achieved, as iodized salt is often reluctantly used in the food industry due to concerns about iodine loss during heat processing, storage, and transportation [4]. Consequently, biofortification of vegetables with iodine may become an effective approach to combat iodine deficiency, owing to its high bioavailability (over 90%) from food and efficient absorption. Biofortification aims to increase the concentration of micronutrients in staple crops through optimal cultivation practices and modern biotechnology, representing a cost-effective method to enhance the nutritional value of the diet [5,6]. Nevertheless, for biofortified plants to actually improve health status regarding micronutrient deficiencies, they must deliver mineral compounds that are bioavailable, i.e., easily absorbed by the organism [7]. Considering that the regulated synthesis of thyroid hormones depends on the adequate availability of iodine, before implementing such interventions it is necessary to assess the bioavailability of iodine in fortified plants, as this constitutes a key aspect for predicting the effectiveness of biofortification programs. Therefore, this information helps determine the minimal iodine content required in the plant to ensure effective improvement of the nutritional status of a given population [8]. In vivo studies, both in animals and humans, provide a more comprehensive understanding of how biofortified plants influence mineral absorption and overall nutritional status. Animal models enable analysis of micronutrient absorption throughout the organism, as well as assessment of potential changes in gene expression and the functioning of organs and tissues resulting from consumption of fortified plants, which is crucial for evaluating the health safety of their potential consumers [7,9].
Although iodine deficiency disorders and their prevention remain a fundamental concern, there has been increasing attention recently on health issues arising from excessive iodine intake. From an epidemiological perspective, excessive iodine consumption increases the incidence of hypothyroidism, hyperthyroidism, chronic autoimmune thyroiditis, and other thyroid diseases [10,11]. Excess iodine may contribute to abnormal serum levels of thyroid-stimulating hormone (TSH) and/or thyroid hormones (T3 and T4), raising the risk of thyroid gland disorders. Most studies on the health effects of excessive iodine intake focus on thyroid function. However, recent research suggests that long-term exposure to high iodine levels may also lead to elevated blood glucose, increased blood pressure, and impact lipid metabolism [12].
Our previous study demonstrated that using iodoquinolines for lettuce biofortification, compared to potassium iodate, had a more beneficial effect not only on iodine concentration but also on other chemical constituents (including secondary metabolites) that determine its nutritional and health-promoting value. Moreover, these compounds may have biostimulatory effects on lettuce growth [13].
The aim of the present study is to evaluate the bioavailability of iodine and to analyze selected biochemical parameters and gene expression related to thyroid hormone synthesis and metabolism in Wistar rats fed a diet supplemented with lettuce biofortified with iodoquinolines (8-hydroxy-7-iodo-5-quinolinesulfonic acid or 5,7-diiodo-8-quinolinol) or potassium iodate. In each analysis, the effects of two levels of iodine intake delivered with lettuce were compared – the recommended dose (in accordance with the control AIN-93G diet) and a dose twice as high – in order to assess whether excessive iodine intake affects the analyzed parameters.

2. Materials and Methods

2.1. Plant Material and Growing Conditions

Lettuce (Lactuca sativa L. var. capitata) cv. 'Melodion' was grown hydroponically using the Nutrient Film Technique (NFT). The experiment was conducted in spring 2021 in a greenhouse at the Faculty of Biotechnology and Horticulture, University of Agriculture in Krakow, Poland (50°05'04.1"N 19°57'02.1"E). Organic iodine compounds (iodoquinolines) and an inorganic form of this element (potassium iodate) were introduced into the nutrient solution. The following treatments were analyzed: a) control (no iodine application), b) KIO3, c) 8-hydroxy-7-iodo-5-quinolinesulfonic acid, d) 5-chloro-7-iodo-8-quinolinol, e) 5,7-diiodo-8-quinolinol, and f) 4-hydroxy-8-iodo-3-quinolinecarboxylic acid. All substances were applied at a concentration of 5 µM as molar mass equivalents of each compound. The nutrient solution was applied continuously throughout the entire cultivation period until harvest. Additional information regarding the plant material and growing conditions is provided in our earlier publication [13].

2.1.1. Chemical Composition Analysis of Plant Material

The basic chemical composition of the plant material included in the animals’ diet was determined, i.e., protein, crude fat, digestible carbohydrates, dietary fiber, and ash. Total iodine concentration, iodide content (I), quinoline, individual iodoquinolines, selected macro- and microelements (P, S, Na, K, Mg, Ca, Fe, Cu, Zn, Mn, Mo, B), B vitamins (B1, B2, B3, PP, B5, B6, B9), vitamin C (L-ascorbic acid, dehydroascorbic acid), chlorides, nitrogen compounds (NO3, NO2, NH4+), total polyphenols, and antioxidant activity were also assessed. The methodology and details concerning the chemical composition analysis of iodine-biofortified lettuce in the form of iodoquinolines were described in a separate publication [13].
For further studies, lettuce biofortified with iodine in the form of KIO3, 8-hydroxy-7-iodo-5-quinolinesulfonic acid, and 5,7-diiodo-8-quinolinol was selected, primarily due to the highest iodine content and bioactive compounds, including polyphenolic compounds, L-ascorbic acid, dehydroascorbic acid, as well as the highest antioxidant activity. This selection was made based on our previous research [13].

2.2. Animal Study

The experiment was conducted at the Center for Experimental and Innovative Medicine of the University of Agriculture in Kraków. Male Wistar rats were chosen because this strain is one of the most widely used, versatile, and effective models in nutritional studies. The in vivo model allows investigation of complex metabolic processes in a living organism that cannot be fully assessed using alternative methods such as in vitro techniques, and provides insights relevant to human nutrition. Four-week-old male Wistar rats (n = 56), with an average body weight of 125 ± 10 g, came from the internal breeding facility of the Animal House at the Faculty of Pharmacy, Jagiellonian University in Kraków. All experimental procedures were approved by the 2nd Local Ethics Committee for Animal Experiments at the Institute of Pharmacology of the Polish Academy of Sciences in Kraków (resolution no. 212/2023, dated November 9, 2023). Before the main part of the experiment, the animals underwent a 7-day acclimatization period (to minimize stress associated with the presence of the personnel involved in the study), during which they were fed a standard laboratory diet. After this period, the rats were allocated to eight experimental groups (n = 7 per group) using simple randomisation. Animals were marked at the time of allocation to the respective groups, the assignment was coded, and cages were labeled with the group number. The group size was determined based on standard practices in nutritional studies with Wistar rats, allowing for reliable statistical analysis while minimizing the number of animals used. During the experiment, the animals were fed diets based on the standard AIN-93G formulation [14], modified by the addition of freeze-dried (lyophilized) lettuce. The diets were prepared by ZooLab (Sędziszów, Poland). The types of diets used in the individual groups were as follows: Group 1 – AIN-93G diet (control), the mineral mix contained iodine (in the form of KI) in the amount recommended by Reeves [14]; Group 2 – AIN-93G diet with the addition of lyophilized lettuce not subjected to the iodine biofortification process, the iodine content (as KI) in the mineral mix was the same as in the control diet; Groups 3, 4, 5 – AIN-93G diet (no KI in the mineral mix) with the addition of lyophilized lettuce biofortified with iodine in the form of potassium iodate (Group 3), 8-hydroxy-7-iodo-5-quinolinesulfonic acid (Group 4), and 5,7-diiodo-8-quinolinol (Group 5), providing iodine in the amount recommended for this diet; Groups 6, 7, 8 – AIN-93G diet (no KI in the mineral mix) with the addition of lyophilized lettuce biofortified with iodine in the form of potassium iodate (Group 6), 8-hydroxy-7-iodo-5-quinolinesulfonic acid (Group 7), and 5,7-diiodo-8-quinolinol (Group 8), supplying iodine in an amount twice the recommended level for this diet. The detailed composition of the experimental diets is presented in Table S1, where the diet number corresponds to the number of the experimental group. In addition, the iodine content in the feeds was determined to further verify the level of this element after diet preparation (Table S2). Iodine levels were analyzed using the ICP-MS/MS (Inductively Coupled Plasma Tandem Mass Spectrometry) technique, according to the procedure described by Smoleń et al. [15].
During the acclimatization period and the experiment, the rats were kept in conventional cages. Within each group, they were placed in four cages (in the first, second, and third – two individuals, and in the fourth – one). The only exceptions were the second and seventh weeks of the experiment, when the animals were housed individually in stainless steel metabolic cages. The animals were kept at a temperature of 22°C (± 2°C), relative humidity of 55% (± 10%), and a 12/12 h light/dark cycle. Environmental enrichment was provided in the cages, including wooden blocks (chew toys), tunnels, wooden houses, and bedding/nesting material to provide shelter and reduce stress and aggressive behaviors. Throughout the experiment, the rats had ad libitum access to the tested diet and distilled water (tap water could serve as an additional source of iodine). They were also under continuous observation to assess their behavior and general condition. Rats were not marked by ear notching, ear punching, or microchipping, as these procedures cause pain and additional stress, and are not necessary to obtain experimental results. Diet intake was monitored daily, while body weight gain was recorded once a week. Urine and feces were collected over 5 days during the second and seventh weeks of the experiment (days 8–12 and 44–48, respectively) to evaluate iodine excretion (iodine content determination). Moreover, urine samples were standardized in volume before analysis. At the end of the experiment (after 7 weeks), the animals were fasted and then anesthetized using sodium pentobarbital (Morbital; Biowet Puławy, Poland) at a dose of 1–2 ml kg-1 body weight, administered via intraperitoneal injection. Blood was collected by cardiac puncture into tubes without anticoagulant and centrifuged (1500 × g, 15 min, 4°C) to obtain serum. Feces were collected directly from the colon during the necropsy. The thyroid, liver, heart, kidneys, and testes were isolated and immediately frozen in dry ice. Part of the thyroid glands was fixed in 10% buffered formalin (Chempur, Piekary Śląskie, Poland) and prepared for histological evaluation. The remaining samples were stored at −80°C until further analyses. Selected indicators reflecting the functional state of the thyroid gland were determined in blood serum and the gland itself. These indicators included biochemical parameter analysis and gene expression. Furthermore, iodine levels were measured in all dissected organs.

2.2.1. Assessment of Iodine Content in Urine, Feces, and Selected Organs

Urine samples were thawed and mixed, and 4.8 mL of each sample was transferred to a polypropylene tube. Subsequently, 0.2 mL of tetramethylammonium hydroxide (TMAH) was added. The mixture was incubated, mixed, and diluted 200-fold with triple-distilled water. Iodine content was determined using the previously mentioned ICP-MS/MS method with a triple quadrupole spectrometer (iCAP TQ ICP-MS; ThermoFisher Scientific, Waltham, USA), in accordance with the PN-EN 15111:2008 standard [16] and the procedure described by Smoleń et al. [15].
Feces and organs were lyophilized (Christ Alpha 1-4 LSC plus, Martin Christ Gefriertrocknungsanlagen GmbH, Germany), then weighed and ground using a laboratory mill (type WŻ-1; ZBPP, Sadkiewicz Instruments, Bydgoszcz, Poland). Samples (with particle sizes of approximately 1 mm) prepared in this manner were analyzed for iodine concentration using the same ICP-MS/MS technique as applied for urine analysis.

2.2.2. Analysis of Biochemical Parameters

The study material consisted of blood serum, except for elastase, which was measured in stool samples. Thyroid hormones analysis, including thyroxine (T4), free thyroxine (fT4), triiodothyronine (T3), and free triiodothyronine (fT3), was performed using the chemiluminescent immunoassay method (CLIA) on an Access 2 analyzer (Beckman Coulter Diagnostics, Brea, California, USA). Biochemical parameters such as high-density lipoproteins (HDL cholesterol), total cholesterol (TC), triglycerides (TG), alanine aminotransferase (ALT), aspartate aminotransferase (AST), alkaline phosphatase (ALP), urea, amylase, and lipase were measured spectrophotometrically using a semi-automatic analyzer BA-400 (BioSystems Diagnostics Pvt. Ltd., Sriperumbudur, Tamil Nadu, India). In both cases, dedicated reagent kits were used, according to manufacturers’ protocols. Additionally, low-density lipoproteins and very-low-density lipoproteins (LDL + VLDL cholesterol) levels were estimated by calculating the difference between total cholesterol and HDL cholesterol concentrations [17,18]. Thyroid-stimulating hormone (TSH), malondialdehyde (MDA), and elastase concentrations were measured spectrophotometrically (Infinite 200 Pro microplate reader, Tecan Group Ltd., Männedorf, Switzerland) by enzyme-linked immunosorbent assay (ELISA), using the following kits respectively: Rat TSH ELISA Kit (cat. no. 812-NSL1179r, Sunlong Biotech Co., Ltd., Hangzhou, Zhejiang, China), Rat MDA ELISA Kit (cat. no. 812-NSL1352r, Sunlong Biotech Co., Ltd.), and Rat Elastase 3B ELISA Kit (cat. no. ELK6605, ELK Biotechnology Co., Ltd., Denver, CO, USA).

2.2.3. Gene Expression Analysis

2.2.3.1. RNA Isolation and cDNA Synthesis
Total RNA was isolated from 15 mg of frozen rat thyroid tissue using the AllPrep DNA/RNA Mini Kit (Qiagen, Cat. No. 80204) in accordance with the manufacturer’s protocol. RNA yield and purity were evaluated with a NanoDrop™ 2000/2000c spectrophotometer (Thermo Fisher Scientific, Cat. No. ND-2000). All samples demonstrated A260/A280 ratios ≥ 1.9 and A260/A230 ratios ≥ 2.0, consistent with high-quality RNA. For reverse transcription, 200 ng of total RNA per sample was converted into complementary DNA (cDNA) in a 20 µL reaction using the High-Capacity cDNA Reverse Transcription Kit (Thermo Fisher Scientific, Cat. No. 4368814). Thermal cycling conditions followed the manufacturer’s recommendations: 10 min at 25°C, 120 min at 37°C, and 5 min at 85°C. Following synthesis, cDNA concentration was re-measured using the NanoDrop™ 2000/2000c.
2.2.3.2. Quantitative Real-Time PCR Analysis (qPCR)
Quantitative real-time PCR (qPCR) was performed to assess gene expression levels using TaqMan® Gene Expression Assays (Thermo Fisher Scientific) specific for the following rat genes: Dio1 (Rn00572183_m1), Dio2 (Rn00581867_m1), Slc5a5 (Rn00583900_m1), and Tpo (Rn00571159_m1). The expression of 18S rRNA (Rn01531966_m1) was used as an endogenous control for normalization. Each reaction was carried out in a final volume of 10 µL, comprising 1× TaqMan® Gene Expression Master Mix (Thermo Fisher Scientific), 200 nM of the corresponding probe, and 2 µL of cDNA (approximately 100 ng). The concentration and purity of cDNA were verified using a NanoDrop™ 2000/2000c spectrophotometer (Thermo Fisher Scientific). Amplifications were run on a Roche LightCycler® 96 System using the following thermal profile: initial denaturation at 95°C for 2 minutes, followed by 40 cycles of denaturation at 95°C for 15 seconds and annealing/extension at 60°C for 15 seconds. Each sample was analyzed in technical triplicates. No-template controls (NTCs) were included in each run to monitor for contamination. Each experimental group consisted of four biological replicates, with each replicate comprising pooled material from two individuals. Gene expression levels were normalized to 18S rRNA and calculated using the 2−∆∆Ct method. Data were analyzed with LightCycler® 96 Software (Roche).

2.2.4. Histological Analysis

Formalin-fixed, paraffin-embedded tissue specimens were sectioned at a thickness of 5 µm and processed for histological evaluation. Standard hematoxylin and eosin (HE) staining was employed to assess overall tissue architecture and cytomorphological features with high resolution. In addition, Masson's trichrome staining was conducted using a commercially available kit (Abcam, UK) to enable the specific identification and differentiation of collagenous connective tissue components within the extracellular matrix. Histological analyses were performed using a Leica DMR brightfield microscope (Leica Microsystems, Wetzlar, Germany).

2.3. Statistical Analysis

Collected data are presented as mean ± standard deviation (SD). Data were tested for normality using the Shapiro-Wilk test, and observations were considered independent, with each animal representing a single experimental unit. Statistical analysis was performed using Statistica software version 13.1 (StatSoft Inc., Tulsa, Oklahoma, USA). Differences between groups were assessed using one-way analysis of variance (ANOVA) followed by Tukey’s post hoc test. To compare iodine concentrations in urine and feces between the second and seventh weeks of the experiment within each group, the paired Student’s t-test was used. In both tests, results were considered statistically significant at p ≤ 0.05.

3. Results

3.1. Iodine Content

3.1.1. Iodine Content in Urine and Feces

Table 1 presents the iodine content in the urine and feces of rats fed diets supplemented with the tested lettuce. In the second and seventh weeks of the experiment, an average decrease of 22.08% and 32.71%, respectively, was observed in the iodine content of urine from animals receiving diets containing biofortified lettuce with both potassium iodate (Group 3) and iodoquinoline (Groups 4 and 5), which supplied iodine amounts comparable to the control diet (AIN-93G). The lowest iodine concentration in urine was observed in rats fed diets supplemented with lettuce enriched with 5,7-diiodo-8-quinolinol (Group 5) and 8-hydroxy-7-iodo-5-quinolinesulfonic acid (Group 4) during the second and seventh weeks of the experiment, respectively. The decrease in iodine levels amounted to 29.20% and 38.16%, respectively, compared to the iodine content in urine of animals on the control diet. In both experimental weeks, the urine of rats fed diets containing biofortified lettuce providing iodine at twice the recommended dose of the AIN-93G diet showed an average increase in iodine concentration of 15.98% (second week) and 10.31% (seventh week). The highest iodine content in urine during both weeks was recorded in rats from Group 7, which consumed diets supplemented with lettuce enriched with 8-hydroxy-7-iodo-5-quinolinesulfonic acid. This content was higher by 27.27% (second week) and 20.59% (seventh week) compared to animals in Group 1 (control).
The use of the tested diets also contributed to an increase in iodine levels in the feces of rats in both the second and seventh weeks of the experiment (compared to the control diet). This increase averaged 21.88% and 22.62% for groups receiving iodine at the recommended dose in the AIN-93G diet (Groups 3-5) and 46.08% and 63.92% for groups receiving iodine at twice the recommended dose (Groups 6-8).
Additionally, when comparing iodine concentrations in urine and feces between the second and seventh weeks of the experiment, a significant decrease in urinary iodine levels was observed in rats from Groups 3, 4, 6, 7, and 8 (by 7.28%, 30.10%, 5.47%, 5.07%, and 3.53%, respectively), while an increase in fecal iodine levels was recorded in Groups 6, 7, and 8 (by 9.52%, 16.69%, and 10.06%, respectively).
Description of experimental groups: Group #1 – rats fed the AIN-93G (control) diet; Group #2 – rats fed the AIN-93G diet with the addition of lyophilized non-biofortified lettuce, with KI from the mineral mixture providing iodine in the amount recommended for this diet; Group #3, #4, #5 – rats fed the AIN-93G diet with the addition of lyophilized iodine-biofortified lettuce in the form of potassium iodate (Group #3), 8-hydroxy-7-iodo-5-quinolinesulfonic acid (Group #4), and 5,7-diiodo-8-quinolinol (Group #5), providing iodine in the amount recommended for this diet; Group #6, #7, #8 – rats fed the AIN-93G diet with the addition of lyophilized iodine-biofortified lettuce in the form of potassium iodate (Group #6), 8-hydroxy-7-iodo-5-quinolinesulfonic acid (Group #7), and 5,7-diiodo-8-quinolinol (Group #8), providing iodine in an amount twice that recommended for this diet.

3.1.2. Iodine Content in Selected Organs

The inclusion of biofortified lettuce in the diets led to a number of statistically significant changes in iodine content across selected rat organs (Table 2). Feeding animals with diets containing lettuce biofortified with iodoquinoline, providing iodine in an amount consistent with AIN-93G dietary recommendations, resulted in an average increase in iodine concentration of 34.23% in the liver, 45.89% in the heart, and 18.89% in the testes. In the thyroid and kidneys of rats whose diets included lettuce enriched with 8-hydroxy-7-iodo-5-quinolinesulfonic acid (Group 4), a 7.26% increase and a 20.13% decrease in iodine content were observed, respectively. In contrast, the iodine levels in these organs of rats receiving lettuce fortified with 5,7-diiodo-8-quinolinol (Group 5) did not differ from those in the control group. Meanwhile, rats consuming lettuce enriched with potassium iodate (inorganic iodine; Group 3) exhibited decreased iodine content in the thyroid, liver, kidneys, and testes by an average of 10.71%, 25.46%, 31.91%, and 37.14%, respectively. No significant changes were found in heart iodine content in this group. The use of a diet containing lettuce biofortified with iodoquinoline, providing twice the iodine level of the control diet, led to an increase in iodine levels across all examined organs, amounting to an average of 14.70% in the thyroid, 59.91% in the liver, 12.11% in the kidneys, 73.53% in the heart, and 41.21% in the testes. Furthermore, in animals fed lettuce enriched with potassium iodate (Group 6), heart iodine levels increased by 24.01%, while thyroid, liver, and kidney levels remained comparable to the control values. In contrast, a 31.83% decrease was observed in the testes.
Iodine levels in the urine, feces (at both time points), and all tested organs in the group of rats fed non-biofortified lettuce (Group 2; iodine supplied via mineral mix) did not differ significantly from those in the control group (Table 1 and Table 2).
Description of experimental groups: Group #1 – rats fed the AIN-93G (control) diet; Group #2 – rats fed the AIN-93G diet with the addition of lyophilized non-biofortified lettuce, with KI from the mineral mixture providing iodine in the amount recommended for this diet; Group #3, #4, #5 – rats fed the AIN-93G diet with the addition of lyophilized iodine-biofortified lettuce in the form of potassium iodate (Group #3), 8-hydroxy-7-iodo-5-quinolinesulfonic acid (Group #4), and 5,7-diiodo-8-quinolinol (Group #5), providing iodine in the amount recommended for this diet; Group #6, #7, #8 – rats fed the AIN-93G diet with the addition of lyophilized iodine-biofortified lettuce in the form of potassium iodate (Group #6), 8-hydroxy-7-iodo-5-quinolinesulfonic acid (Group #7), and 5,7-diiodo-8-quinolinol (Group #8), providing iodine in an amount twice that recommended for this diet.

3.2. Biochemical Parameters

3.2.1. Lipid Profile

Feeding rats with diets containing the tested lettuce had a noticeable impact on their lipid profile (Table 3). In the blood serum of animals from all experimental groups, except for Group 2, a decrease in HDL cholesterol and total cholesterol levels was observed, averaging 22.59% and 20.86%, respectively (in Groups 3-5), and 31.64% and 23.68%, respectively (in Groups 6-8). The inclusion of lettuce fortified with potassium iodate and 5,7-diiodo-8-quinolinol in the diet, providing iodine in the same amount as in the control diet (Groups 3 and 5), resulted in a reduction of LDL + VLDL cholesterol in their serum by 14.58% and 27.99%, respectively. On the other hand, in the serum of animals fed with lettuce enriched with potassium iodate containing iodine at a concentration twice as high as in the AIN-93G diet (Group 6), a 20.02% decrease in these cholesterol fractions was noted. However, the addition of lettuce biofortified with 8-hydroxy-7-iodo-5-quinolinesulfonic acid, providing this element in both the recommended and double amounts (Groups 4 and 7), did not result in statistically significant changes in LDL + VLDL cholesterol levels in their serum. Similar findings were observed in the group of animals receiving a double dose of iodine with lettuce enriched with 5,7-diiodo-8-quinolinol (Group 8). The triglyceride concentration in the serum of rats from almost all experimental groups was also comparable to the control group. Only in the serum of animals consuming lettuce biofortified with 5,7-diiodo-8-quinolinol (Group 5) was a 27.12% decrease in triglyceride levels observed, consistent with the trends seen in the other analysed lipid profile parameters.
Description of experimental groups: Group #1 – rats fed the AIN-93G (control) diet; Group #2 – rats fed the AIN-93G diet with the addition of lyophilized non-biofortified lettuce, with KI from the mineral mixture providing iodine in the amount recommended for this diet; Group #3, #4, #5 – rats fed the AIN-93G diet with the addition of lyophilized iodine-biofortified lettuce in the form of potassium iodate (Group #3), 8-hydroxy-7-iodo-5-quinolinesulfonic acid (Group #4), and 5,7-diiodo-8-quinolinol (Group #5), providing iodine in the amount recommended for this diet; Group #6, #7, #8 – rats fed the AIN-93G diet with the addition of lyophilized iodine-biofortified lettuce in the form of potassium iodate (Group #6), 8-hydroxy-7-iodo-5-quinolinesulfonic acid (Group #7), and 5,7-diiodo-8-quinolinol (Group #8), providing iodine in an amount twice that recommended for this diet.

3.2.2. Hormones Regulating Thyroid Function

The addition of lettuce biofortified with iodine compounds providing the element at levels recommended for the AIN-93G diet differently affected the levels of thyroid hormones in the serum of rats (Table 4). The inclusion of lettuce enriched with potassium iodate in their diet (Group 3) led to decreases in T4, fT4, T3, and fT3 concentrations by 16.14%, 32.52%, 10.77%, and 11.02%, respectively, compared to values obtained in the control group. In contrast, feeding rats a diet containing lettuce biofortified with iodoquinoline (Groups 4 and 5) did not result in statistically significant changes in thyroid hormone levels. The exception was the T4 hormone, which showed an average increase of 10.37%. The introduction of lettuce enriched with various iodine forms at concentrations twice those recommended for the AIN-93G diet caused a significant increase in all studied thyroid hormones in serum by an average of 14.79% (T4), 35.85% (fT4), 77.95% (T3), and 32.68% (fT3). Only in the serum of rats receiving lettuce fortified with mineral iodine (Group 6) did the thyroxine content not differ significantly from that in Group 1. The highest levels of fT4, T3, and fT3 hormones were observed in the serum of animals fed with lettuce enriched with 5,7-diiodo-8-quinolinol. These levels were higher than those in the control group by 60.59%, 118.46%, and 52.30%, respectively. The highest thyroxine concentration was found in the serum of rats whose diet included lettuce biofortified with both 5,7-diiodo-8-quinolinol and 8-hydroxy-7-iodo-5-quinolinesulfonic acid. The serum TSH concentration in all experimental groups remained at levels similar to those observed in the control group.
Description of experimental groups: Group #1 – rats fed the AIN-93G (control) diet; Group #2 – rats fed the AIN-93G diet with the addition of lyophilized non-biofortified lettuce, with KI from the mineral mixture providing iodine in the amount recommended for this diet; Group #3, #4, #5 – rats fed the AIN-93G diet with the addition of lyophilized iodine-biofortified lettuce in the form of potassium iodate (Group #3), 8-hydroxy-7-iodo-5-quinolinesulfonic acid (Group #4), and 5,7-diiodo-8-quinolinol (Group #5), providing iodine in the amount recommended for this diet; Group #6, #7, #8 – rats fed the AIN-93G diet with the addition of lyophilized iodine-biofortified lettuce in the form of potassium iodate (Group #6), 8-hydroxy-7-iodo-5-quinolinesulfonic acid (Group #7), and 5,7-diiodo-8-quinolinol (Group #8), providing iodine in an amount twice that recommended for this diet.

3.2.3. Other Biochemical Parameters

The inclusion of the tested lettuce in the diets resulted in a decrease in amylase and urea concentrations in the blood serum of rats from all experimental groups by an average of 18.70% and 5.42% (Group 2), 23.97% and 22.01% (Groups 3-5), and 12.34% (Groups 6-8) and 14.15% (Groups 6 and 8), respectively (Table 5). On the other hand, the urea content in the serum of animals from Group 7, receiving feed supplemented with lettuce fortified with 8-hydroxy-7-iodo-5-quinolinesulfonic acid (iodine at twice the dose recommended in the AIN-93G diet), was comparable to that in the control group. Similar results were observed in this group for MDA concentration. Furthermore, in the serum of rodents from Groups 3-5, whose diet included lettuce supplying iodine at levels comparable to the control group, decreases in ALT and ALP levels were recorded by an average of 16.02% and 18.24%, respectively (Table 5). However, no significant changes in ALP content were found in rats fed diets containing lettuce enriched with 5,7-diiodo-8-quinolinol (Group 5). Additionally, no significant differences were observed in AST, lipase, and MDA serum concentrations in animals from Groups 3-5 (Table 5).
Description of experimental groups: Group #1 – rats fed the AIN-93G (control) diet; Group #2 – rats fed the AIN-93G diet with the addition of lyophilized non-biofortified lettuce, with KI from the mineral mixture providing iodine in the amount recommended for this diet; Group #3, #4, #5 – rats fed the AIN-93G diet with the addition of lyophilized iodine-biofortified lettuce in the form of potassium iodate (Group #3), 8-hydroxy-7-iodo-5-quinolinesulfonic acid (Group #4), and 5,7-diiodo-8-quinolinol (Group #5), providing iodine in the amount recommended for this diet; Group #6, #7, #8 – rats fed the AIN-93G diet with the addition of lyophilized iodine-biofortified lettuce in the form of potassium iodate (Group #6), 8-hydroxy-7-iodo-5-quinolinesulfonic acid (Group #7), and 5,7-diiodo-8-quinolinol (Group #8), providing iodine in an amount twice that recommended for this diet.
Conversely, the use of lettuce biofortified with iodine at twice the recommended AIN-93G dose led to an increase in enzyme concentrations such as ALP and lipase by an average of 28.83% and 25.46%, respectively. Only in the serum of rats consuming feed supplemented with lettuce fortified with 5,7-diiodo-8-quinolinol (Group 8) did ALP levels not differ significantly from those of the control group. Similar results were observed in Group 7 and the previously mentioned group with respect to AST concentration. In contrast, Group 6 showed an 11.59% increase in AST levels. Moreover, Groups 6 and 8 exhibited decreases in MDA levels by 13.75% and 13.48%, respectively. The inclusion of lettuce supplying iodine at twice the control group’s concentration differently affected serum ALT levels depending on the iodine form used for biofortification (Table 5). The addition of lettuce enriched with potassium iodate caused a 23.76% increase in ALT, while lettuce biofortified with 5,7-diiodo-8-quinolinol led to a 13.44% decrease. Lettuce enriched with 8-hydroxy-7-iodo-5-quinolinesulfonic acid had no significant effect on ALT levels.
In the serum of animals fed with non-biofortified lettuce (Group 2), the concentrations of all analyzed biochemical parameters (except for amylase and urea) remained unchanged (Table 3, Table 4 and Table 5).

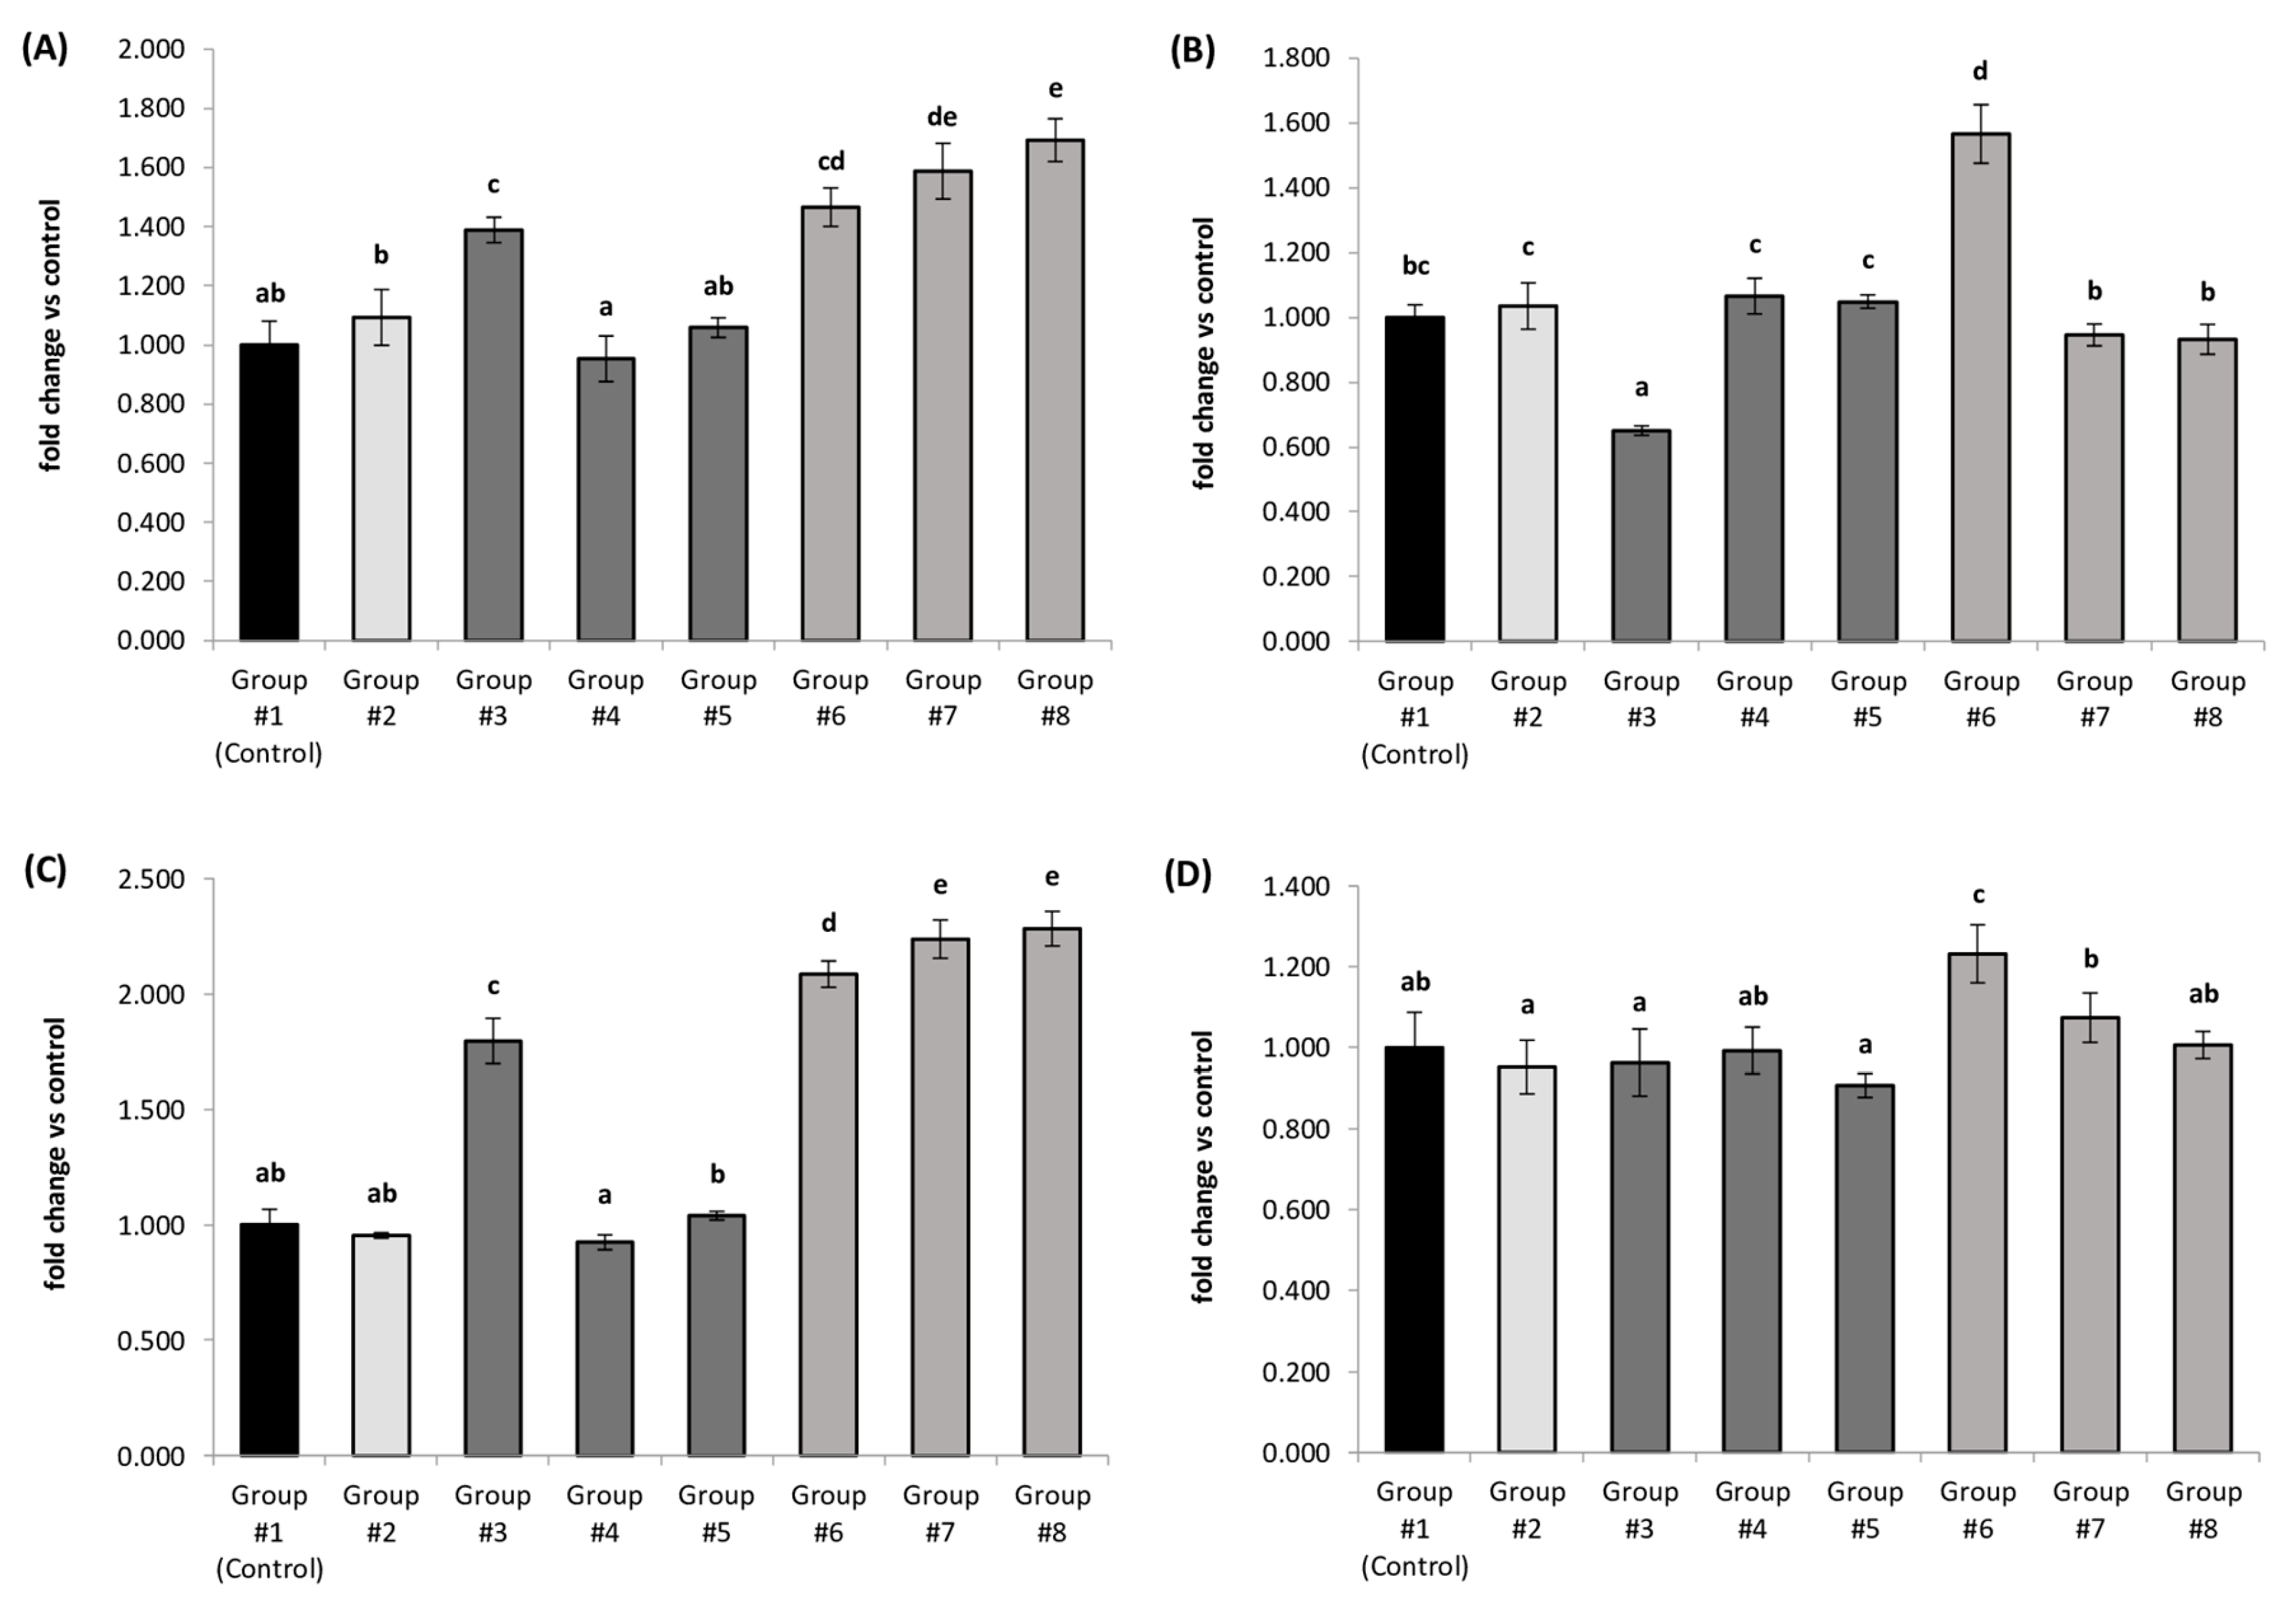
3.3. Relative Expression of Selected Genes Involved in Thyroid Hormone Metabolism

In the thyroid glands of rats fed a diet containing lettuce biofortified with iodoquinoline (Groups 4 and 5), providing iodine at levels equivalent to the AIN-93G diet, no significant differences were observed in the mRNA levels of all analyzed genes: Dio1, Dio2, Slc5a5 (NIS), and Tpo. Conversely, rats receiving a diet with lettuce enriched with potassium iodate (Group 3) were observed to have an up-regulation of Dio1 and Slc5a5 mRNA by 39% and 80%, respectively, and a down-regulation of Dio2 mRNA by 35%. The expression of Tpo remained comparable to that of the control group (Figure 1).
A twofold higher iodine intake from fortified lettuce triggered several significant alterations in gene expression related to thyroid hormone metabolism and synthesis. Animals consuming lettuce biofortified with organic iodine forms (Groups 7 and 8) were found to have up-regulation of Dio1 (by an average of 64%) and Slc5a5 (by an average of 126%) transcripts. The mRNA levels of Dio2 and Tpo in these groups remained similar to controls. In the thyroids of rats fed lettuce enriched with inorganic iodine (Group 6), increased transcriptional activity was noted not only for Dio1 and Slc5a5 but also for Dio2 and Tpo. Specifically, mRNA expression of Dio1, Dio2, Slc5a5, and Tpo increased by 47%, 57%, 109%, and 23%, respectively, compared to the control group (Figure 1).
Additionally, in animals receiving a diet containing non-biofortified lettuce, where iodine was supplied via a mineral mix (Group 2), the gene expression profile was similar to that of the control group (Figure 1).

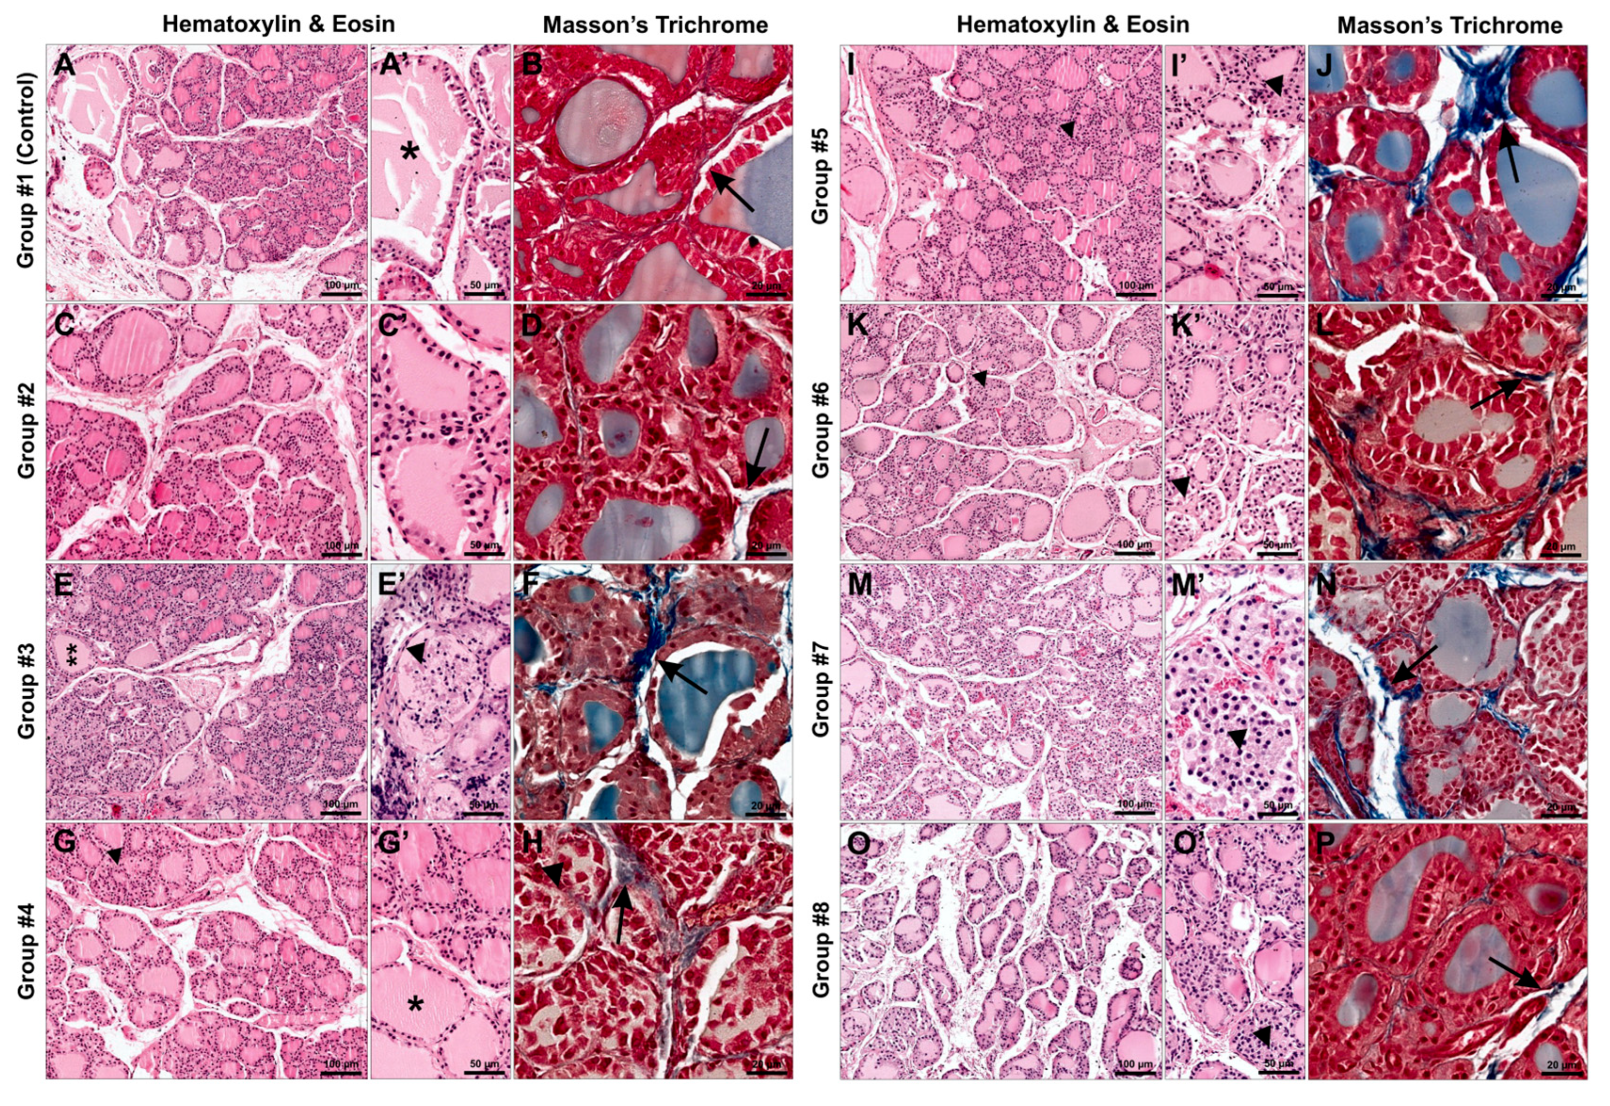
3.4. Histological Analysis

3.4.1. Hematoxylin and Eosin Staining

The thyroids of rats from the control group and the group receiving a diet containing non-biofortified lettuce (with iodine provided by a mineral mix) exhibited preserved architecture, with a clear division of follicles into peripheral and central zones – larger follicles were located peripherally, and smaller and medium-sized ones in the central part (Figure 2A, 2C). In some follicles, foamy colloid was observed, and occasionally detachment of thyrocytes also occurred (Figure 2A-A’, 2C-C’).
In the thyroids of animals receiving feed supplemented with enriched lettuce, providing the recommended amount of iodine (groups 3–5), single large and medium-sized follicles were observed in the central part, whereas in other areas focal or multifocal detachment of thyrocytes into the follicular lumen was noted (Figure 2E-E’, 2G-G’, 2I-I’). In some follicles, foamy colloid was visible (Figure 2E-E’, 2G-G’).
The thyroids of rats from the groups receiving an increased iodine supply along with biofortified lettuce exhibited morphological changes depending on the form of iodine used. In the thyroid glands of rats fed lettuce enriched with potassium iodate (Group 6) as a dietary component, no clear division of follicles into peripheral and central zones was observed. In the central part of the glands, large and medium-sized follicles predominated, and multifocally, thyrocyte detachment into the follicular lumen was noted (Figure 2K-K’). The thyroid gland parenchyma of animals fed a diet supplemented with lettuce biofortified with iodoquinoline (Groups 7 and 8) showed large follicles in the peripheral zone, whereas in the central part small and medium-sized follicles were present, with occasional large ones (Figure 2M, 2O). In some follicles, thyrocyte detachment into the follicular lumen was observed, and the colloid exhibited a distinctly foamy structure (Figure 2M-M’, 2O-O’).

3.4.2. Masson’s Trichrome Staining

In the thyroids of rats from all experimental groups, no changes were observed in the quantity or structure of collagen fibers in the interfollicular and interlobular tissue (Figure 2B, 2D, 2F, 2H, 2J, 2N, 2P). In contrast, mild fibrosis was observed in the thyroid gland of animals from group 6 (Figure 2L).

4. Discussion

In the present study, the bioavailability of iodine from lettuce biofortified with different forms of iodine was evaluated for the first time, and the effects of both adequate and excessive iodine intake (derived from this plant) on the organism of Wistar rats were analyzed. Iodine bioavailability is defined as the proportion of iodine that can be absorbed in the gastrointestinal tract, delivered to the bloodstream, and subsequently utilized for thyroid hormone synthesis or accumulated in body tissues [19,20]. One in vivo method for assessing the absorption of ingested iodine is the analysis of its excretion levels in urine and feces. Excess iodine (in inorganic form; I) is primarily excreted via urine (approximately 90%) and, to a lesser extent, through feces and sweat [21]. Tonacchera et al. [4] demonstrated that biofortification of vegetables (lettuce, potatoes, carrots, and cherry tomatoes) with iodine through foliar feeding contributes to an increase (19.6%) in urinary iodine content in healthy volunteers. Kopeć et al. [22] and Rakoczy et al. [23] observed that rats fed a diet supplemented with iodine-biofortified lettuce (in the form of KI), through soil fertilization and foliar application respectively, excreted less iodine in both urine and feces compared to rats fed the control diet. The iodine content in the feeds used in these experiments corresponded to its concentration in the basal diet. In the experiment conducted by our team, it was found that the level of iodine excreted in urine and feces by rats was more dependent on the iodine content in the fortified lettuce than on the iodine form used for its biofortification. In animals from Groups 3–5, receiving lettuce supplying iodine in the same dose as the control diet, a decrease in iodine concentration in urine was observed, which aligns with findings by Kopeć et al. [22] and Rakoczy et al. [23]. This was presumably due to the biofortification process leading to an almost twofold increase (on average by 96.37%) in polyphenolic compounds content in the plant [13]. The most common polyphenolic compounds in lettuce (Lactuca sativa L.) are phenolic acids (mainly caffeic acid, chlorogenic acid, and their derivatives) and flavonoids (quercetin and kaempferol derivatives) [24,25]. These compounds may interact with iodine, forming complexes that can hinder its subsequent absorption in the intestines, thereby reducing its excretion via urine [26,27]. Nevertheless, in rats from Groups 4 and 5, which were fed diets supplemented with lettuce enriched with iodine in the form of iodoquinoline (8-hydroxy-7-iodo-5-quinolinesulfonic acid and 5,7-diiodo-8-quinolinol, respectively), an increase in iodine content was observed in the liver, heart, testes, and thyroid (in Group 4). This may indicate increased absorption and bioavailability of iodine from the gastrointestinal tract following consumption of lettuce biofortified with organic iodine forms. Additionally, it is likely that most of the available iodine was utilized for thyroid hormone synthesis, which might have contributed to reduced iodine excretion in urine as part of the organism’s effort to maintain iodine homeostasis in rats [28]. The thyroid hormone levels in the serum of rats from Groups 3–5 remained within the reference range established for this species. Conversely, the increased iodine content in the urine of rats from Groups 6–8 probably resulted from the iodine concentration in the feed being twice as high, exceeding the rats’ iodine requirements. The increase in iodine excretion in feces observed in all groups fed diets with biofortified lettuce could result from changes in gut microbiota composition induced by iodine and the increased accumulation of bioactive compounds (mainly polyphenols, B vitamins, and vitamin C) in the plant [13]. In vivo studies have shown that supplementation with polyphenols [29], B vitamins [30], and vitamin C [31] can modulate gut microbiota in animal models, including increasing beneficial microorganisms and reducing harmful ones. Gut microbiota influences thyroid hormone levels by regulating iodine uptake, degradation, and the enterohepatic cycle. It should be noted that thyroid hormones themselves can modulate the composition and activity of gut microbiota, indicating mutual interactions within the gut-thyroid axis [32,33]. Moreover, studies suggest the presence of alternative mechanisms of thyroid hormone metabolism, where bacteria serve as their reservoir. Thyroxine (T4) conjugated with glucuronide can bind to bacteria, be stored by them, and released later for absorption. Unconjugated T4 may also bind to bacteria in the rat intestine. Meanwhile, Escherichia coli bacteria can accumulate triiodothyronine (T3) by strong binding with bacterial thyroid hormone-binding proteins [34]. Therefore, it is highly probable that in this case, the intestinal reservoir serves a protective function and allows the rat’s organism to maintain hormonal balance. However, this study did not assess the impact of consuming biofortified lettuce on the gut microbiota composition of rats. Furthermore, the relationship between gut microbiota and thyroid function remains insufficiently understood. Additionally, in animals from Groups 6–8, increased iodine levels in feces could also be due to the higher iodine intake in their diet.
The total iodine content in the human body is approximately 15–20 mg, of which 70–80% is located in the thyroid gland, while the remaining part is found in organs and tissues such as the liver, kidneys, heart, quadriceps femoris muscle, and adipose tissue [35]. Kirchgessner et al. [36] reported that the overall iodine concentration in the tissues of Sprague-Dawley rats fed a semi-synthetic diet with varying iodine content (in the form of KI) increased proportionally to the level of iodine intake. Piątkowska et al. [37] found that supplementation with raw carrots biofortified with iodine (as KI; via soil fertilization) did not cause significant changes in iodine content in the kidneys, liver, heart, and thigh muscle of Wistar rats. On the other hand, Rakoczy et al. [23] observed an increase in iodine levels in the tissues of rats fed a diet supplemented with iodine-enriched lettuce. In our study, iodine content was analyzed in the thyroid gland, liver, kidneys, heart, and testes. The concentration of this element in these organs depended both on the form of iodine used to fortify the lettuce and on its amount in the feed. In rats from Group 3, which received lettuce biofortified with inorganic iodine (KIO3) in their diet, a decrease in iodine concentration was observed in all examined organs. One potential reason for this outcome may be that the lettuce fortified with iodine in the form of KIO3 had the highest calcium and potassium contents, with increases of 31.12% and 11.99%, respectively, compared to the control lettuce [13]. A higher intake of calcium and potassium in the diet can adversely affect iodine bioavailability [20,27]. Furthermore, among Groups 3–5, the proportion of lettuce in the diet of rats from Group 3 was the highest (10.44 g kg-1) due to the lowest iodine content, as all diets were balanced for iodine concentration. Therefore, at an optimal iodine level in the diet, lettuce as a component contributed the highest levels of K and Ca, which could have further reduced iodine absorption. Moreover, iodine might have accumulated in larger amounts in other parts of the body, such as the skin or fur, which were not assessed in this study. In the experiment by Kirchgessner et al. [36], the highest iodine concentrations in rats, apart from the thyroid, were found in the skin, fur, and carcass. In contrast, the increased iodine concentrations in the liver, heart, and testes of rats from Group 5 could have resulted from elevated levels of iron (16.00%), manganese (136.84%), and zinc (41.36%) in lettuce biofortified with 5,7-diiodo-8-quinolinol [13]. These trace elements may interact with iodine, influencing its absorption in the gastrointestinal tract [5,27]. Absorption can also be modified by competition between iodine and other elements or compounds present in the food matrix for the same transport mechanisms [26]. Conversely, a possible reason for the increased iodine content in the thyroid gland and other examined organs of rats from Group 4 may be explained the lower proportion of lettuce in the diet, which was associated with reduced polyphenol intake. These compounds, as mentioned earlier, can bind iodine and strongly inhibit its absorption [27]. Group 4 also showed a lower iodine content in the kidneys, presumably related to decreased urinary excretion of this element. In rats from Groups 7 and 8, increased iodine accumulation in all analyzed organs likely resulted from the higher iodine intake with the diet. Additionally, it may have been caused by the previously described factors, as in Groups 4 and 5.
Iodine, as the main component of thyroid hormones (T3, T4) and a key regulator of thyroid gland function, plays an essential role in its physiology. Consequently, dietary iodine intake affects the functional activity of the thyroid gland and, in turn, lipid metabolism in the serum. Thyroid hormones can influence all aspects of lipid metabolism, including synthesis, mobilization, and degradation, with degradation being more prominent than synthesis [38]. Some of the best-known effects of thyroid hormones on lipid metabolism include increased utilization of lipid substrates, enhanced synthesis and mobilization of triglycerides stored in adipose tissue, elevated levels of non-esterified fatty acids (NEFA), and increased lipoprotein lipase (LPL) activity [39]. In a study by Zhao et al. [40] evaluating the effects of both iodine deficiency and excess intake on lipid metabolism in Balb/c mice, a reduction in triglyceride (TG) levels in males and total cholesterol (TC) in females was observed in the iodine excess groups. On the other hand, Kopeć et al. [22] reported an increase in TC as well as low- and very-low-density lipoprotein (LDL + VLDL) levels in rats fed a diet containing lettuce biofortified with iodine in the form of KI, while high-density lipoprotein (HDL) and TG levels remained unchanged. However, in the study by Kopeć et al. [22], the iodine concentration in the feed was within the recommended range for rats. Waśniowska et al. [41] noted that administering red kale enriched with iodine in the form of 5,7-diiodo-8-quinolinol to rats contributed to a reduction in TC, HDL, and TG levels in their serum. In our experiment, the serum levels of HDL cholesterol and TC in rats were more dependent on the amount of iodine in the diet than on the chemical form used to biofortify the lettuce. In contrast, the levels of LDL + VLDL cholesterol and TG were more influenced by the iodine form. The observed decrease in HDL levels in the serum of animals from all groups receiving biofortified lettuce was likely the result of increased activity of cholesterol ester transfer protein (CETP) and hepatic lipase (HL), as these proteins are stimulated by thyroid hormones, which accelerate HDL metabolism. CETP transfers cholesterol esters from HDL2 to VLDL, IDL, and chylomicron remnants, while simultaneously transferring TG in the opposite direction – to HDL2. HDL2 is then hydrolyzed and converted into HDL3 by HL, which is the main lipolytic enzyme responsible for converting IDL to LDL and HDL2 to HDL3 [42,43]. Enhanced hydrolysis of triglyceride-rich HDL2 by HL and their conversion to HDL3 leads to the remodeling of HDL particles, which may result in decreased HDL levels [43]. In Groups 6–8, a twofold higher iodine dose provided with the diet resulted in a significant increase in thyroid hormone levels (with the exception of T4 in Group 6), which may have further enhanced the lipolysis process in HDL particles. This may explain the significantly lower HDL levels in the serum of rats from Groups 6–8 compared to those from Groups 3–5. It is well known that alterations in thyroid hormone levels, even fluctuations within the reference range, can have profound effects on lipid metabolism [44]. The decrease in LDL + VLDL concentrations in the serum of rats from Groups 3 and 5 was likely a consequence of the combined effects of polyphenols, other bioactive compounds (mainly B vitamins and vitamin C), and iodine (in an optimal amount) present in the lettuce. Both iodine, as a constituent of thyroid hormones, and the bioactive compounds in the biofortified lettuce can influence the activity of key metabolic enzymes and receptors involved in the regulation of LDL and VLDL synthesis. In rats, the primary mechanism by which thyroid hormones lower serum cholesterol is the induction of LDL receptor (LDL-R) expression in the liver, increasing cholesterol uptake and clearance. Thyroid hormones also stimulate the activity of 3-hydroxy-3-methylglutaryl-CoA reductase (HMGAR) and farnesyl diphosphate synthase (FDPS), thereby supporting cholesterol synthesis. Moreover, they reduce the hepatic level of apolipoprotein B100 (Apo B100), which leads to decreased production of LDL and VLDL [38]. Various types of natural food products, herbal preparations, and dietary supplements containing high concentrations of bioactive compounds (including polyphenols) have been shown to enhance LDL-R activity and inhibit HMGAR expression, thereby reducing LDL levels [45]. Caffeic acid and chlorogenic acid, administered to ICR mice, also demonstrated inhibitory effects on HMGAR [46]. In the liver, thyroid hormones increase the expression of the rat enzyme cholesterol 7α-hydroxylase (CYP7A1), which controls the first step in bile acid synthesis and indirectly regulates cholesterol biosynthesis and blood LDL levels [47,48]. In the study by Tan et al. [49], chlorogenic acid from green tea increased Cyp7a1 mRNA expression in 129/Sv mice. The increase in LDL + VLDL levels in the serum of rats from Group 6 may represent a physiological response to the consumption of a diet containing lettuce biofortified with inorganic iodine (KIO3), in which the iodine content was twice as high as in the control diet. The reduction in TC observed in all experimental groups (except for Group 2) was a result of decreased HDL levels in the serum and, in Groups 3 and 5, also a reduction in LDL + VLDL levels. Therefore, all the above-mentioned factors affecting lipoprotein levels may have contributed to the decrease in TC. Furthermore, in the serum of rats from Group 5, which received lettuce biofortified with iodine in the form of 5,7-diiodo-8-quinolinol, a reduction in TG levels was noted, confirming the findings of Waśniowska et al. [41] for red kale enriched with the same form of iodine. However, in that study, rats received feed with a higher iodine content than the amount present in the diet of the animals from this group. A possible explanation for the TG reduction in Group 5 may be increased LPL activity resulting from the effects of polyphenols and iodine present in the lettuce biofortified with 5,7-diiodo-8-quinolinol. Thyroid hormones are known to reduce hepatic TG synthesis and secretion, as well as regulate their metabolism at the vascular endothelium level [39,50]. LPL plays a key role in TG metabolism by catalyzing their hydrolysis in plasma [51]. Notably, in vivo studies have shown that polyphenol-rich apple extract may reduce TG levels by increasing LPL activity in a model of Triton WR-1339–induced endogenous hyperlipidemia [52].
In the thyroid gland, tyrosyl residues of thyroglobulin are iodinated to form monoiodotyrosine (MIT) and subsequently diiodotyrosine (DIT). The coupling of two DIT molecules results in the formation of thyroxine (T4), while the coupling of DIT with MIT leads to the formation of triiodothyronine (T3) [53]. T3 is the biologically active hormone, whereas T4 is converted to T3 in peripheral tissues by deiodinases, which remove an iodine atom from the T4 molecule [5]. Thyroid hormones are transported in the bloodstream primarily bound to plasma proteins. However, only a small fraction of free (unbound) triiodothyronine (fT3) and thyroxine (fT4) is biologically active and capable of entering target cells to exert physiological effects [54]. Lee et al. [55] reported increased serum levels of T3 and T4 in Holstein dairy cows fed a diet supplemented with brown seaweed waste. In contrast, Franke et al. [56] did not observe statistically significant changes in serum T3 and T4 levels in dairy cows receiving either rapeseed meal or glucosinolate-free feed enriched with two different forms of iodine (potassium iodide or calcium iodate) at seven concentrations (0, 0.5, 1, 2, 3, 4, and 5 mg kg-1 dry matter). Only at the doses of 0.5 mg and 5 mg of iodine per kg of dry feed was the T4 level significantly lower than in the control group. Similar results were obtained by Aoe et al. [57], who investigated the effects of kelp (Laminaria japonica) consumption on thyroid hormone levels (T3, T4, and TSH) in overweight individuals. No increases in serum T3, T4, or TSH were observed after iodine supplementation at a dose of 1.03 mg/day derived from this seaweed. In our study, thyroid hormone concentrations depended equally on the iodine dose in the diet and the form used to fortify the lettuce. The inclusion of lettuce enriched with iodoquinoline, providing iodine in the amount recommended for rats (Groups 4 and 5), did not result in significant changes in the levels of the assessed thyroid hormones. However, an increase in serum T4 levels was observed in animals from Groups 4 and 5, which may have resulted from improved iodine absorption from lettuce biofortified with organic forms of the element and, consequently, more efficient utilization of iodine in T4 synthesis. It can be speculated that the ratio of DIT to MIT was elevated, which favors T4 biosynthesis. In this way, euthyroid status is maintained despite increased iodine uptake by the gland [53,58], particularly given that T4 is the less biologically active form. Different outcomes were noted in rats from Group 3, which were fed a diet containing lettuce fortified with potassium iodate. In this group, as with iodine concentrations in the analyzed organs, a reduction in thyroid hormone levels was recorded. The decrease in serum T3, T4, fT3, and fT4 levels in Group 3 rats may have resulted from the elevated content of antinutritional compounds in the iodate-enriched lettuce, which may inhibit the absorption and/or utilization of iodine after ingestion [59]. Furthermore, multiple interactions may occur between iodine and other elements present in the rats’ diet. As previously mentioned, the diet of this group had higher calcium and potassium levels, which could have affected iodine absorption in the gastrointestinal tract [13]. In general, food undergoes various chemical and physical processes after ingestion that may alter the amount of iodine ultimately reaching systemic circulation [60]. In rats from Groups 6–8, double the iodine intake led to increased thyroid gland stimulation and elevated serum concentrations of all analyzed thyroid hormones. Nevertheless, the values remained within the reference range for these animals, and TSH levels did not change. An exception was the serum fT3 and fT4 levels in Group 8 rats, which were at or slightly above the reference range. The diet of animals in this group contained the highest amount of polyphenolic compounds, and therefore likely also flavonoids. Therefore, one potential explanation for the elevated fT3 and fT4 levels could be the influence of flavonoids present in the lettuce biofortified with 5,7-diiodo-8-quinolinol on the binding of T4 to transthyretin. It has been demonstrated that synthetic flavonoids primarily disrupt this binding with transthyretin (TTR), rather than with thyroxine-binding globulin (TBG) or albumin [61]. In rodents, thyroid hormones are mainly bound to TTR, which limits the ability to compensate for impaired T4 binding to TTR, as is possible in humans. Given that flavonoids (synthetic) can act as strong competitors in the binding of thyroid hormones to TTR, a shift in thyroid hormone homeostasis seems likely if not inevitable in rats [62]. Moreover, rodents may exhibit physiological fluctuations in thyroid hormone levels in response to mild stress, dietary changes, or altered feeding conditions. When combined with the absence of thyroid fibrosis features, this suggests an adaptive rather than pathological nature of the observed changes. Turakulov et al. [63] demonstrated that short-term immobilization of rats causes a significant increase in the secretion of both T3 and T4, with peak serum concentrations occurring during double immobilization. Similarly, studies by Dauncey and Morovat [64] suggest a postprandial rise in the secretion of T3, T4, fT3, and fT4 from the thyroid gland in piglets, dependent on the energy value and nutritional composition of the ingested feed.
Thyroid hormones and thus iodine influence hepatocyte activity and liver metabolism. In turn, the liver plays a key role in the activation, deactivation, transport, and metabolism of thyroid hormones [65]. Alanine aminotransferase (ALT), aspartate aminotransferase (AST), and alkaline phosphatase (ALP) are enzymes present in the liver and serve as biomarkers of its damage [66]. Research by Guo et al. [12] showed that administering iodine (as KIO3) in drinking water at concentrations of 600, 1200, or 2400 µg L-1 to BALB/c mice caused a significant increase in serum ALT and AST levels. In our study, ALT, AST, and ALP activity depended both on the form of iodine used for lettuce biofortification and its amount (excluding Groups 5 and 8) in the feed. The reduction of ALT and ALP levels in the serum of rats from Groups 3–5 and 8, and Groups 3 and 4, respectively, may result from the hepatoprotective effects of bioactive compounds in lettuce. This effect can be attributed to their antioxidant properties and ability to stimulate the endogenous antioxidant defense system. Since oxidative stress is involved in almost all mechanisms of liver injury, it is assumed that the antioxidant properties of these compounds play a significant role in their liver-protective mechanism [67]. Studies indicate hepatoprotective properties of, among others, chlorogenic acid. This compound reduced the levels of ALT, AST, ALP, and bilirubin in the serum of rats with hepatotoxicity induced by methamphetamine and carbon tetrachloride [68,69]. Moreover, a probable cause of the decreased ALT concentration in the serum of rats from Group 8 may be the indirect effect of iodine excess on the reduction of glucose-alanine cycle activity. In this cycle, alanine is produced in muscles through pyruvate transamination and then transported to the liver, where it is converted back to pyruvate by an ALT-catalyzed reaction; pyruvate can then be used in gluconeogenesis [70,71]. Similarly, the increased level of this enzyme in the serum of animals from Group 6 could result from enhanced glucose-alanine cycle activity due to their consumption of twice the amount of iodine present in lettuce enriched with potassium iodate. Meanwhile, the increased ALP activity in the serum of rats from Groups 6 and 7 may have been caused by altered absorption of other minerals, such as zinc and magnesium, due to the doubled iodine intake. The active site of ALP contains three metal ions: two Zn2+ and one Mg2+, which are essential for its enzymatic activity. Therefore, a proper Mg2+/Zn2+ ratio is necessary for the enzyme’s normal function [72]. In turn, the increased serum AST levels observed in rats from Group 6 may be linked to enhanced activity of the malate-aspartate shuttle, triggered by the doubled iodine dose. This shuttle facilitates the transfer of reducing equivalents between the cytoplasm and mitochondria. AST catalyzes the conversion of L-aspartate and α-ketoglutarate into oxaloacetate and L-glutamate, a key step in regulating the NAD+/NADH ratio [70,73]. Excess iodine may influence cellular metabolism by intensifying this process, leading to increased AST release into the bloodstream.
The addition of lettuce to the diet of rats in all experimental groups, including the group receiving non-biofortified lettuce, contributed to a decrease in serum amylase activity. This effect can be primarily attributed to the polyphenolic compounds present in lettuce. It has been demonstrated that the inhibition of α-amylase activity by polyphenols is strongly related to their molecular structure, as it results from binding interactions between these compounds and the enzyme [74]. The strength of interactions between polyphenolic compounds and α-amylase is probably dependent on the formation of hydrogen bonds between hydroxyl groups and the enzyme’s catalytic active site. Furthermore, hydrophobic forces between the aromatic rings of polyphenols and tryptophan residues of α-amylase may influence the strength of this interaction [75]. Nevertheless, in the context of polyphenol binding, a competitive mechanism between polysaccharides and α-amylase has also been suggested [76]. On the other hand, the increase in serum lipase concentration in rats consuming lettuce enriched with iodine at twice the recommended amount (Groups 6-8) could be an adaptive response to alterations in lipid metabolism caused by excessive iodine intake. This interpretation is supported by the absence of significant changes in fecal elastase levels across all experimental groups. Elastase is known for its high specificity to pancreatic function, and its concentration decreases only in cases of pancreatic damage or exocrine insufficiency. Furthermore, the lack of increased amylase activity supports the assumption that excess iodine did not induce a systemic inflammatory response of the pancreas, which typically manifests as a concurrent rise in multiple pancreatic enzyme activities [77].
The urea level, similar to amylase concentration, decreased in the serum of rats from all experimental groups (except Group 7). However, the urea content in the serum of animals fed with non-biofortified lettuce was higher than in rodents receiving biofortified lettuce. Iodine present in the studied lettuce may have limited the activity of enzymes involved mainly in the rate-limiting steps of the urea cycle, such as carbamoyl phosphate synthetase I and argininosuccinate synthetase, as well as the enzyme catalyzing the final step of this cycle, without which urea cannot be produced – arginase I. It is known that the activity of various urea cycle enzymes can act as a regulatory factor for urea synthesis [78]. On the other hand, the activity of the key enzyme of this cycle – arginase I, can be modulated in vivo by changes in manganese concentration. Moreover, it is important to emphasize that metabolic regulation of the activity of enzymes in this cycle is species-specific and may depend on the type of diet to which a given organism is naturally adapted [79].
Importantly, a decrease in malondialdehyde (MDA) concentration was observed in the serum of animals from Groups 6 and 8. It cannot be excluded that the observed effect resulted from the antioxidant properties and synergistic action of both iodine and bioactive compounds present in the biofortified lettuce. As a result, this may have contributed to a reduction in oxidative stress in the rats’ bodies by neutralizing reactive oxygen species and limiting lipid peroxidation [1]. Consequently, the reduced intensity of lipid peroxidation may have led to a decrease in MDA levels, the end product of this process and an important biomarker, which in turn could contribute to minimizing oxidative damage to cellular membranes [80]. It is also worth noting that the lower iodine content in the biofortified lettuce required an increased proportion of this plant in the rats’ diet, which may have resulted in a higher intake of polyphenolic compounds.
In the present study, the mRNA expression levels of genes involved in iodine metabolism and thyroid hormone synthesis were also evaluated, including Dio1, Dio2, Slc5a5, and Tpo (encoding DIO1, DIO2, NIS, and TPO, respectively). DIO1 and DIO2 (type 1 and type 2 deiodinases) are responsible for the conversion of thyroxine (T4) to the active form triiodothyronine (T3), with DIO1 acting mainly in peripheral organs (e.g., liver and kidneys), thereby influencing circulating T3 levels, whereas DIO2 performs a local function within target tissues [81]. In contrast, TPO (thyroid peroxidase) and NIS (sodium-iodide symporter) are essential for thyroid hormone biosynthesis, participating in the iodination of tyrosyl residues in thyroglobulin and the transport of iodide into thyrocytes, respectively [82]. The observed increase in Dio1 mRNA expression accompanied by a decrease in Dio2 expression in the thyroid of rats receiving a diet supplemented with KIO3-biofortified lettuce providing iodine at the recommended level (Group 3) may indicate the activation of a compensatory transcriptional regulatory mechanism triggered by reduced availability of this element. Such adaptive regulation may constitute part of an intracellular homeostatic response aimed at maintaining physiological T3 concentrations within the thyroid, despite decreased DIO2 activity [83]. These observations are partially supported by previous findings. Gereben et al. [84] reported a decrease in Dio2 expression in the thyroid of hypothyroid rats compared to euthyroid animals, while Lavado-Autric et al. [85] noted increased Dio1 and Dio2 mRNA levels in the thyroids of rats maintained on an iodine-deficient diet. The DIO1 enzyme is involved not only in the aforementioned conversion of T4 to T3 but also in the deiodination of rT3 and less active iodothyronines released from thyroglobulin, thereby supporting the recycling of iodine within follicular cells. This additional function may also account for the increased Dio1 mRNA levels observed in Group 3 [86]. Simultaneously, the reduced iodine content in the thyroid may have limited the availability of T4 (the substrate) for DIO2, contributing to the down-regulation of its expression. It is worth noting that the physiological role of DIO2 in the thyroid gland is relatively limited compared to its activity in the central nervous system, brown adipose tissue, or skeletal muscles [87]. In both humans and rats, Dio2 mRNA levels in the thyroid are relatively low, supporting the notion that, under conditions of slight thyroid hormone reduction (within the reference range), Dio2 expression is down-regulated, and the predominant role in regulating intracellular T3 levels is assumed by DIO1 [84]. Such an expression pattern may suggest a shift in the primary site of T3 production control from local synthesis within the thyroid (Dio2) to peripheral tissues (Dio1), which are responsible for maintaining systemic hormone levels [88]. Furthermore, elevated Slc5a5 mRNA expression in this group of animals may indicate an increased capacity of thyrocytes for iodide uptake, potentially supporting thyroid hormone biosynthesis and the up-regulation of Dio1 expression. Despite the simultaneous up-regulation of Slc5a5 and Dio1, the lack of changes in Tpo mRNA levels may result from insufficient activation of nuclear T3 receptors due to its limited availability in the cytoplasm [89]. Moreover, the transcriptional changes in these genes were not accompanied by significant differences in TSH levels, suggesting that the thyroid response was independent of the classical feedback regulation mechanism of the hypothalamic-pituitary-thyroid (HPT) axis and was limited to local adaptation related to iodine transport and metabolism [83]. By contrast, the increased mRNA levels of all analyzed genes in the thyroid of rats receiving lettuce biofortified with the same form of iodine but providing it at twice the recommended amount (Group 6) may have resulted from stimulation of glandular activity and enhanced transcriptional activity in response to mild iodine excess. The increased synthesis of thyroid hormones, observed alongside elevated expression of the Slc5a5 and Tpo genes, leads to greater availability of the substrate (T4), which may induce higher expression of Dio1 and Dio2 within the thyroid gland. This effect may be a consequence of dietary modification and represent a potential cause of metabolic changes occurring in the thyroid. The increased mRNA levels of Slc5a5 and Tpo may also be related to the higher presence of flavonoids in the tested plant. Lettuce predominantly contains various quercetin derivatives, including glycosidic forms structurally related to rutin (quercetin-3-O-rutinoside) [90]. The study conducted by Gonçalves et al. [91] demonstrated that this compound can significantly induce the expression of Slc5a5 and Tpo genes in the thyroid of rats. Although rutin is not present in lettuce in substantial amounts, due to its shared aglycone and structural similarity, it may exhibit biological activity comparable to other quercetin derivatives. Therefore, flavonoids present in lettuce may be involved in the transcriptional regulation of these genes, potentially through analogous molecular pathways. Moreover, the observed up-regulation of Tpo and Dio2 transcripts may, in part, result from improved systemic redox status, as evidenced by significantly reduced serum MDA levels in rats. A lower degree of lipid peroxidation may favor the activation of regulatory pathways dependent on the Nrf2 transcription factor, which indirectly supports Tpo expression by protecting key transcription factors such as TTF-1 and Pax-8 from oxidative damage and functional impairment [92,93]. In the case of Dio2, enhanced cellular reducing capacity may promote the activation of FoxO1 – a redox-sensitive transcriptional regulator that directly enhances the expression of this gene [94]. In contrast, in the thyroids of rats fed with feed containing lettuce biofortified with 8-hydroxy-7-iodo-5-quinolinesulfonic acid (Group 7), the mildly increased iodine intake did not result in significant changes in Tpo and Dio2 mRNA levels, suggesting no up-regulation of these genes. This was likely due to the fact that serum MDA concentrations remained comparable to those in the control group, which may have supported the maintenance of stable gene expression. On the other hand, in the group of animals fed with lettuce enriched with 5,7-diiodo-8-quinolinol (Group 8), the observed decrease in MDA levels might have potentially contributed to the up-regulation of Tpoand Dio2. However, the absence of this effect suggests that the regulation of these genes may also be influenced by factors other than the organism’s redox status, including the chemical structure of the iodine form used for biofortification. The higher content of 5,7-diiodo-8-quinolinol in the lettuce (195.7 µg kg-1) compared to 8-hydroxy-7-iodo-5-quinolinesulfonic acid (9.7 µg kg-1) may have influenced the composition and amount of secondary metabolites in the plant [13], which could, in turn, have altered the bioavailability of active compounds in the diet and indirectly modulated the transcriptional activity of Tpo and Dio2. The observed differences in Dio1, Dio2, Slc5a5, and Tpo gene expression among the groups depend not only on the amount of dietary iodine but also on changes in the plant’s chemical profile resulting from the biofortification process. It is also possible that these effects are mediated by epigenetic mechanisms, such as histone modifications or promoter region methylation, which influence the accessibility of DNA sequences to transcription factors [95].
In the thyroid glands of rats from the control group (Group 1) and the group receiving a diet supplemented with non-biofortified lettuce (Group 2; iodine was supplied via a mineral mix), no pathological changes were observed, confirming normal gland function under adequate iodine supply. Intact follicular structure and physiological distribution of collagen fibers indicated the absence of fibrosis and inflammatory processes. In groups of animals fed lettuce biofortified with potassium iodate (Group 3), 8-hydroxy-7-iodo-5-quinolinesulfonic acid (Group 4), or 5,7-diiodo-8-quinolinol (Group 5), supplying iodine at the recommended dose, the presence of foamy colloid and focal detachment of thyrocytes may indicate activation of the thyroid’s secretory function. The lack of fibrosis signs and preserved follicular architecture suggest that the tested iodine forms were well tolerated by the gland and did not cause degenerative changes. Conversely, histological changes observed in the thyroids of rats fed diets containing lettuce biofortified with potassium iodate (Group 6), 8-hydroxy-7-iodo-5-quinolinesulfonic acid (Group 7), or 5,7-diiodo-8-quinolinol (Group 8), providing twice the recommended iodine amount, may reflect differing biological activities of the individual compounds, influencing the gland’s structure and potentially its function. Group 6 showed mild perivascular and interlobular fibrosis, which may indicate early adaptive processes or thyroid responses to increased iodine levels. In Group 8, no significant fibrosis was observed despite thyrocyte detachment and presence of foamy colloid, suggesting a greater capacity to maintain homeostasis under higher iodine intake. Overall, these observations point to increased secretory activity and adaptive processes in the thyroid gland, without signs of permanent structural damage [96].

5. Conclusions

In summary, this study demonstrated that iodine delivered through lettuce biofortified with iodoquinolines was bioavailable and effectively utilized in vivo in Wistar rats. The organic iodine forms (5,7-diiodo-8-quinolinol and 8-hydroxy-7-iodo-5-quinolinesulfonic acid) led to greater tissue accumulation and enhanced thyroid hormone synthesis compared to the inorganic form (potassium iodate), without inducing hepatic or systemic toxicity.
To the best of our knowledge, this is the first study to intentionally exceed the recommended dietary iodine intake using a plant-based matrix enriched via biofortification. The findings indicate that consumption of iodine incorporated into the lettuce, even at twice the recommended dietary level, does not exert toxic effects in vivo. These results confirm the nutritional safety of iodine biofortification and justify the need for further research, including a human nutritional clinical trial to validate its safety and practical applicability.

6. Patents

The method of biofortification of vegetables in iodine cultivated using traditional, soilless and hydroponic method and the use of 8-hydroxy-7-iodo-5-quinolinesulfonic acid and 5,7-diiodo-8-quinolinol for biofortification of vegetables with iodine. These are patent application number P.443218 and P.443221, respectively for the compounds (Polish Patent Office; December 21, 2022).

Supplementary Materials

The following supporting information can be downloaded at the website of this paper posted on Preprints.org, Table S1: Composition of experimental diets; Table S2: The iodine content in experimental rat feed.

Author Contributions

Conceptualization, A.D. and A.K.; methodology, P.P., A.G., S.S. and A.K.; validation, P.P., A.G. and A.K.; formal analysis, A.D.; investigation, A.D.; resources, P.P., A.G. and S.S; data curation, A.D.; writing – original draft preparation, A.D.; writing – review and editing, P.P. and A.K.; visualization, A.D.; supervision, P.P. and A.K..; funding acquisition, A.D. All authors have read and agreed to the published version of the manuscript.

Funding

This research was funded by the National Science Centre, Poland, grant number UMO-2021/41/N/NZ9/03973 (“Effect of iodoquinolines biofortification on iodine bioavailability and inflammatory response – studies in a rat model”). For the purpose of Open Access, the author has applied a CC-BY public copyright licence to any Author Accepted Manuscript (AAM) version arising from this submission.

Institutional Review Board Statement

The animal study protocol was approved by the 2nd Local Ethics Committee for Animal Experiments at the Institute of Pharmacology of the Polish Academy of Sciences in Kraków (protocol code 212/2023, dated November 9, 2023) and conducted in accordance with the ARRIVE guidelines and Directive 2010/63/EU. Only male rats were used, and the potential influence of sex on the study outcomes was not evaluated.

Informed Consent Statement

Not applicable.

Data Availability Statement

The datasets generated and/or analyzed during the current study are available from the corresponding authors on reasonable request.

Conflicts of Interest

The authors declare the following financial interests/personal relationships which may be considered as potential competing interests: The method of biofortification of vegetables in iodine cultivated using traditional, soilless and hydroponic method and the use of 8-hydroxy-7-iodo-5-quinolinesulfonic acid for biofortification of vegetables with iodine. This is patent application number P.443218 (Polish Patent Office; December 21, 2022). The method of enriching vegetables with iodine grown in a traditional, soilless and hydroponic way and the use of 5,7-diiodo-8-quinolinol for enriching vegetables with iodine. This is patent application number P.44321 (Polish Patent Office; December 21, 2022). If there are other authors, they declare that they have no known competing financial interests or personal relationships that could have appeared to influence the work reported in this paper.

References

  1. Aceves, C.; Mendieta, I.; Anguiano, B.; Delgado-González, E. Molecular iodine has extrathyroidal effects as an antioxidant, differentiator, and immunomodulator. Int. J. Mol. Sci. 2021, 22, 1228. [Google Scholar] [CrossRef] [PubMed]
  2. Ma, R.; Yan, M.; Han, P.; Wang, T.; Li, B.; Zhou, S.; Zheng, T.; Hu, Y.; Borthwick, A.G.L.; Zheng, C.; Ni, J. Deficiency and excess of groundwater iodine and their health associations. Nat. Commun. 2022, 13, 7354. [Google Scholar] [CrossRef] [PubMed]
  3. Blikra, M.J.; Aakre, I.; Rigutto-Farebrother, J. Consequences of acute and long-term excessive iodine intake: A literature review focusing on seaweed as a potential dietary iodine source. Compr. Rev. Food Sci. Food Saf. 2024, 23, e70037. [Google Scholar] [CrossRef] [PubMed]
  4. Tonacchera, M.; Dimida, A.; De Servi, M.; Frigeri, M.; Ferrarini, E.; De Marco, G.; Grasso, L.; Agretti, P.; Piaggi, P.; Aghini-Lombardi, F.; Perata, P.; Pinchera, A.; Vitti, P. Iodine fortification of vegetables improves human iodine nutrition: In vivo evidence for a new model of iodine prophylaxis. J. Clin. Endocrinol. Metab. 2013, 98, E694–E697. [Google Scholar] [CrossRef]
  5. Rohner, F.; Zimmermann, M.; Jooste, P.; Pandav, C.; Caldwell, K.; Raghavan, R.; Raiten, D.J. Biomarkers of nutrition for development – iodine review. J. Nutr. 2014, 144, 1322S–1342S. [Google Scholar] [CrossRef]
  6. Weng, H.X.; Yan, A.L.; Hong, C.L.; Qin, Y.C.; Pan, L.; Xie, L.L. Biogeochemical transfer and dynamics of iodine in a soil-plant system. Environ. Geochem. Health 2009, 31, 401–411. [Google Scholar] [CrossRef]
  7. Dias, D.M.; Costa, N.M.B.; Nutti, M.R.; Tako, E.; Martino, H.S.D. Advantages and limitations of in vitro and in vivo methods of iron and zinc bioavailability evaluation in the assessment of biofortification program effectiveness. Crit. Rev. Food Sci. Nutr. 2018, 58, 2136–2146. [Google Scholar] [CrossRef]
  8. La Frano, M.R.; De Moura, F.F.; Boy, E.; Lönnerdal, B.; Burri, B.J. Bioavailability of iron, zinc, and provitamin A carotenoids in biofortified staple crops. Nutr. Rev. 2014, 72, 289–307. [Google Scholar] [CrossRef]
  9. Van Der Straeten, D.; Bhullar, N.K.; De Steur, H.; Gruissem, W.; MacKenzie, D.; Pfeiffer, W.; Qaim, M.; Slamet-Loedin, I.; Strobbe, S.; Tohme, J.; Trijatmiko, K.R.; Vanderschuren, H.; Van Montagu, M.; Zhang, C.; Bouis, H. Multiplying the efficiency and impact of biofortification through metabolic engineering. Nat. Commun. 2020, 11, 5203. [Google Scholar] [CrossRef]
  10. Leung, A.M.; Braverman, L.E. Consequences of excess iodine. Nat. Rev. Endocrinol. 2014, 10, 136–142. [Google Scholar] [CrossRef]
  11. Taylor, P.N.; Albrecht, D.; Scholz, A.; Gutierrez-Buey, G.; Lazarus, J.H.; Dayan, C.M.; Okosieme, O.E. Global epidemiology of hyperthyroidism and hypothyroidism. Nat. Rev. Endocrinol. 2018, 14, 301–316. [Google Scholar] [CrossRef]
  12. Guo, Y.; Hu, C.; Xia, B.; Zhou, X.; Luo, S.; Gan, R.; Duan, P.; Tan, Y. Iodine excess induces hepatic, renal and pancreatic injury in female mice as determined by attenuated total reflection Fourier-transform infrared spectrometry. J. Appl. Toxicol. 2022, 42, 600–616. [Google Scholar] [CrossRef]
  13. Dyląg, A.; Smoleń, S.; Wisła-Świder, A.; Kowalska, I.; Sularz, O.; Krzemińska, J.; Pitala, J.; Koronowicz, A. Evaluation of the chemical composition and nutritional value of lettuce (Lactuca sativa L.) biofortified in hydroponics with iodine in the form of iodoquinolines. Front. Plant Sci. 2023, 14, 1288773. [Google Scholar] [CrossRef] [PubMed]
  14. Reeves, P.G. Components of the AIN-93 diets as improvements in the AIN-76A diet. J. Nutr. 1997, 127, 838S–841S. [Google Scholar] [CrossRef] [PubMed]
  15. Smoleń, S.; Kowalska, I.; Kováčik, P.; Halka, M.; Sady, W. Biofortification of six varieties of lettuce (Lactuca sativa L.) with iodine and selenium in combination with the application of salicylic acid. Front. Plant Sci. 2019, 10, 143. [Google Scholar] [CrossRef] [PubMed]
  16. PN-EN 15111:2008. Foodstuffs – Determination of trace elements – Determination of iodine content by ICP-MS (Inductively Coupled Plasma Mass Spectrometry); Polish Committee for Standardization: Warsaw, Poland, 2008; Available online: https://sklep.pkn.pl/pn-en-15111-2008p.html (accessed on 16 January 2025).
  17. Oliveira, M.J.A.; van Deventer, H.E.; Bachmann, L.M.; Warnick, G.R.; Nakajima, K.; Nakamura, M.; Sakurabayashi, I.; Kimberly, M.M.; Shamburek, R.D.; Korzun, W.J.; Myers, G.L.; Miller, W.G.; Remaley, A.T. Evaluation of four different equations for calculating LDL-C with eight different direct HDL-C assays. Clin. Chim. Acta 2013, 423, 135–140. [Google Scholar] [CrossRef]
  18. Friedewald, W.T.; Levy, R.I.; Fredrickson, D.S. Estimation of the concentration of low-density lipoprotein cholesterol in plasma, without use of the preparative ultracentrifuge. Clin. Chem. 1972, 18, 499–502. [Google Scholar] [CrossRef]
  19. Blikra, M.J.; Henjum, S.; Aakre, I. Iodine from brown algae in human nutrition, with an emphasis on bioaccessibility, bioavailability, chemistry, and effects of processing: A systematic review. Compr. Rev. Food Sci. Food Saf. 2022, 21, 1517–1536. [Google Scholar] [CrossRef]
  20. Miller, E.R.; Ammerman, C.B. Iodine bioavailability. In Bioavailability of Nutrients for Animals; Ammerman, C.B., Baker, D.H., Lewis, A.J., Eds.; Academic Press: San Diego, USA, 1995; pp. 157–167. [Google Scholar] [CrossRef]
  21. Hlucny, K.; Alexander, B.M.; Gerow, K.; Larson-Meyer, D.E. Reflection of dietary iodine in the 24 h urinary iodine concentration, serum iodine and thyroglobulin as biomarkers of iodine status: A pilot study. Nutrients 2021, 13, 2520. [Google Scholar] [CrossRef]
  22. Kopeć, A.; Piątkowska, E.; Bieżanowska-Kopeć, R.; Pysz, M.; Koronowicz, A.; Kapusta-Duch, J.; Smoleń, S.; Rakoczy, R.; Skoczylas, Ł.; Leszczyńska, T.; Ledwożyw-Smoleń, I. Effect of lettuce biofortified with iodine by soil fertilization on iodine concentration in various tissues and selected biochemical parameters in serum of Wistar rats. J. Funct. Foods 2015, 14, 479–486. [Google Scholar] [CrossRef]
  23. Rakoczy, R.; Kopeć, A.; Piątkowska, E.; Smoleń, S.; Skoczylas, Ł.; Leszczyńska, T.; Sady, W. The iodine content in urine, feces and selected organs of rats fed lettuce biofortified with iodine through foliar application. Biol. Trace Elem. Res. 2016, 174, 347–355. [Google Scholar] [CrossRef]
  24. Kim, M.J.; Moon, Y.; Tou, J.C.; Mou, B.; Waterland, N.L. Nutritional value, bioactive compounds and health benefits of lettuce (Lactuca sativa L.). J. Food Compos. Anal. 2016, 49, 19–34. [Google Scholar] [CrossRef]
  25. Llorach, R.; Martínez-Sánchez, A.; Tomás-Barberán, F.A.; Gil, M.I.; Ferreres, F. Characterisation of polyphenols and antioxidant properties of five lettuce varieties and escarole. Food Chem. 2008, 108, 1028–1038. [Google Scholar] [CrossRef] [PubMed]
  26. Domínguez-González, M.R.; Chiocchetti, G.M.; Herbello-Hermelo, P.; Velez, D.; Devesa, V.; Bermejo-Barrera, P. Evaluation of iodine bioavailability in seaweed using in vitro methods. J. Agric. Food Chem. 2017, 65, 8435–8442. [Google Scholar] [CrossRef] [PubMed]
  27. Fairweather-Tait, S.; Hurrell, R.F. Bioavailability of minerals and trace elements: Members of EC flair concerted action no. 10: Measurements of micronutrient absorption and status. Nutr. Res. Rev. 1996, 9, 295–324. [Google Scholar] [CrossRef]
  28. Kirchgessner, M.; Gabler, S.; Windisch, W. Homeostatic adjustments of selenium metabolism and tissue selenium to widely varying selenium supply in 75Se-labeled rats. J. Anim. Physiol. Anim. Nutr. 1997, 78, 20–30. [Google Scholar] [CrossRef]
  29. Wang, X.; Qi, Y.; Zheng, H. Dietary polyphenol, gut microbiota, and health benefits. Antioxidants 2022, 11, 1212. [Google Scholar] [CrossRef]
  30. Wan, Z.; Zheng, J.; Zhu, Z.; Sang, L.; Zhu, J.; Luo, S.; Zhao, Y.; Wang, R.; Zhang, Y.; Hao, K.; Chen, L.; Du, J.; Kan, J.; He, H. Intermediate role of gut microbiota in vitamin B nutrition and its influences on human health. Front. Nutr. 2022, 9, 1031502. [Google Scholar] [CrossRef]
  31. Li, X.Y.; Meng, L.; Shen, L.; Ji, H.F. Regulation of gut microbiota by vitamin C, vitamin E and β-carotene. Food Res. Int. 2023, 169, 112749. [Google Scholar] [CrossRef]
  32. Gong, B.; Meng, F.; Wang, X.; Han, Y.; Yang, W.; Wang, C.; Shan, Z. Effects of iodine intake on gut microbiota and gut metabolites in Hashimoto thyroiditis-diseased humans and mice. Commun. Biol. 2024, 7, 136. [Google Scholar] [CrossRef]
  33. Virili, C.; Centanni, M. “With a little help from my friends” – the role of microbiota in thyroid hormone metabolism and enterohepatic recycling. Mol. Cell. Endocrinol. 2017, 458, 39–43. [Google Scholar] [CrossRef]
  34. Fröhlich, E.; Wahl, R. Microbiota and thyroid interaction in health and disease. Trends Endocrinol. Metab. 2019, 30, 479–490. [Google Scholar] [CrossRef] [PubMed]
  35. Bouga, M.; Lean, M.E.J.; Combet, E. Contemporary challenges to iodine status and nutrition: the role of foods, dietary recommendations, fortification and supplementation. Proc. Nutr. Soc. 2018, 77, 302–313. [Google Scholar] [CrossRef] [PubMed]
  36. Kirchgessner, B.M.; He, J.; Windisch, W. Homeostatic adjustments of iodine metabolism and tissue iodine to widely varying iodine supply in 125I-labeled rats. J. Anim. Physiol. Anim. Nutr. 1999, 82, 238–250. [Google Scholar] [CrossRef]
  37. Piątkowska, E.; Kopeć, A.; Bieżanowska-Kopeć, R.; Pysz, M.; Kapusta-Duch, J.; Koronowicz, A.A.; Smoleń, S.; Skoczylas, Ł.; Ledwożyw-Smoleń, I.; Rakoczy, R.; Maślak, E. The impact of carrot enriched in iodine through soil fertilization on iodine concentration and selected biochemical parameters in Wistar rats. PLoS ONE 2016, 11, e0152680. [Google Scholar] [CrossRef]
  38. Sinha, R.A.; Singh, B.K.; Yen, P.M. Direct effects of thyroid hormones on hepatic lipid metabolism. Nat. Rev. Endocrinol. 2018, 14, 259–269. [Google Scholar] [CrossRef]
  39. Pucci, E.; Chiovato, L.; Pinchera, A. Thyroid and lipid metabolism. Int. J. Obes. 2000, 24, S109–S112. [Google Scholar] [CrossRef]
  40. Zhao, S.J.; Ye, Y.; Sun, F.J.; Tian, E.J.; Chen, Z.P. The impact of dietary iodine intake on lipid metabolism in mice. Biol. Trace Elem. Res. 2011, 142, 581–588. [Google Scholar] [CrossRef]
  41. Waśniowska, J.; Piątkowska, E.; Pawlicki, P.; Smoleń, S.; Kopeć, A.; Dyląg, A.; Krzemińska, J.; Koronowicz, A. Comparative analysis of iodine levels, biochemical responses, and thyroid gene expression in rats fed diets with kale biofortified with 5,7-diiodo-8-quinolinol. Int. J. Mol. Sci. 2025, 26, 822. [Google Scholar] [CrossRef]
  42. Duntas, L.H.; Brenta, G. The effect of thyroid disorders on lipid levels and metabolism. Med. Clin. North Am. 2012, 96, 269–281. [Google Scholar] [CrossRef]
  43. Duntas, L.H. Thyroid disease and lipids. Thyroid 2002, 12, 287–293. [Google Scholar] [CrossRef]
  44. Post, A.; Garcia, E.; Gruppen, E.G.; Kremer, D.; Connelly, M.A.; Bakker, S.J.; Dullaart, R.P. Higher free triiodothyronine is associated with higher HDL particle concentration and smaller HDL particle size. J. Clin. Endocrinol. Metab. 2022, 107, e1807–e1815. [Google Scholar] [CrossRef]
  45. Mahdavi, A.; Bagherniya, M.; Fakheran, O.; Reiner, Ž.; Xu, S.; Sahebkar, A. Medicinal plants and bioactive natural compounds as inhibitors of HMG-CoA reductase: A literature review. BioFactors 2020, 46, 906–926. [Google Scholar] [CrossRef]
  46. Cho, A.S.; Jeon, S.M.; Kim, M.J.; Yeo, J.; Seo, K.I.; Choi, M.S.; Lee, M.K. Chlorogenic acid exhibits anti-obesity property and improves lipid metabolism in high-fat diet-induced-obese mice. Food Chem. Toxicol. 2010, 48, 937–943. [Google Scholar] [CrossRef]
  47. Lim, M.Y.C.; Ho, H.K. Pharmacological modulation of cholesterol 7α-hydroxylase (CYP7A1) as a therapeutic strategy for hypercholesterolemia. Biochem. Pharmacol. 2024, 220, 115985. [Google Scholar] [CrossRef]
  48. Chambers, K.F.; Day, P.E.; Aboufarrag, H.T.; Kroon, P.A. Polyphenol effects on cholesterol metabolism via bile acid biosynthesis, CYP7A1: a review. Nutrients 2019, 11, 2588. [Google Scholar] [CrossRef] [PubMed]
  49. Tan, Z.; Luo, M.; Yang, J.; Cheng, Y.; Huang, J.; Lu, C.; Song, D.; Ye, M.; Dai, M.; Gonzalez, F.J.; Liu, A.; Guo, B. Chlorogenic acid inhibits cholestatic liver injury induced by α-naphthylisothiocyanate: involvement of STAT3 and NFκB signalling regulation. J. Pharm. Pharmacol. 2016, 68, 1203–1213. [Google Scholar] [CrossRef] [PubMed]
  50. Duntas, L.H.; Brenta, G. A renewed focus on the association between thyroid hormones and lipid metabolism. Front. Endocrinol. 2018, 9, 511. [Google Scholar] [CrossRef] [PubMed]
  51. Wu, S.A.; Kersten, S.; Qi, L. Lipoprotein lipase and its regulators: an unfolding story. Trends Endocrinol. Metab. 2021, 32, 48–61. [Google Scholar] [CrossRef]
  52. Yao, N.; He, R.R.; Zeng, X.H.; Huang, X.J.; Du, T.L.; Cui, J.C.; Hiroshi, K. Hypotriglyceridemic effects of apple polyphenols extract via up-regulation of lipoprotein lipase in triton WR-1339-induced mice. Chin. J. Integr. Med. 2014, 20, 31–35. [Google Scholar] [CrossRef]
  53. Bürgi, H. Iodine excess. Best Pract. Res. Clin. Endocrinol. Metab. 2010, 24, 107–115. [Google Scholar] [CrossRef]
  54. Gerhardt, P.; Begall, S.; Frädrich, C.; Renko, K.; Hildebrandt, T.B.; Holtze, S.; Heinrich, A.; Sahm, A.; Meci, X.; Köhrle, J.; Rijntjes, E.; Henning, Y. Comparative analysis of thyroid hormone systems in rodents with subterranean lifestyle. Sci. Rep. 2023, 13, 3122. [Google Scholar] [CrossRef] [PubMed]
  55. Lee, H.G.; Hong, Z.S.; Li, Z.H.; Xu, C.X.; Jin, X.; Jin, M.G.; Lee, H.J.; Choi, N.J.; Koh, T.S.; Choi, Y.J. Effect of brown seaweed waste supplementation on lactational performance and endocrine physiology in Holstein lactating cows. J. Anim. Sci. Technol. 2005, 47, 573–582. [Google Scholar] [CrossRef]
  56. Franke, K.; Meyer, U.; Wagner, H.; Hoppen, H.O.; Flachowsky, G. Effect of various iodine supplementations, rapeseed meal application and two different iodine species on the iodine status and iodine excretion of dairy cows. Livest. Sci. 2009, 125, 223–231. [Google Scholar] [CrossRef]
  57. Aoe, S.; Yamanaka, C.; Ohtoshi, H.; Nakamura, F.; Fujiwara, S. Effects of daily kelp (Laminaria japonica) intake on body composition, serum lipid levels, and thyroid hormone levels in healthy Japanese adults: a randomized, double-blind study. Mar. Drugs 2021, 19, 352. [Google Scholar] [CrossRef]
  58. Wang, K.; Sun, Y.N.; Liu, J.Y.; Zhang, L.; Ye, Y.; Lin, L.X.; Yan, Y.Q.; Chen, Z.P. The impact of iodine excess on thyroid hormone biosynthesis and metabolism in rats. Biol. Trace Elem. Res. 2009, 130, 72–85. [Google Scholar] [CrossRef]
  59. Van Campen, D.R.; Glahn, R.P. Micronutrient bioavailability techniques: accuracy, problems and limitations. Field Crops Res. 1999, 60, 93–113. [Google Scholar] [CrossRef]
  60. Aquaron, R.; Delange, F.; Marchal, P.; Lognoné, V.; Ninane, L. Bioavailability of seaweed iodine in human beings. Cell. Mol. Biol. 2002, 48, 563–569, https://pubmed.ncbi.nlm.nih.gov/12146713/. [Google Scholar]
  61. Hamann, I.; Seidlova-Wuttke, D.; Wuttke, W.; Köhrle, J. Effects of isoflavonoids and other plant-derived compounds on the hypothalamus-pituitary-thyroid hormone axis. Maturitas 2006, 55, S14–S25. [Google Scholar] [CrossRef]
  62. Vranckx, R.; Rouaze-Romet, M.; Savu, L.; Mechighel, P.; Maya, M.; Nunez, E. A. Regulation of rat thyroxine-binding globulin and transthyretin: studies in thyroidectomized and hypophysectomized rats given tri-iodothyronine or/and growth hormone. J. Endocrinol. 1994, 142, 77–84. [Google Scholar] [CrossRef]
  63. Turakulov, Y.K.; Burikhanov, R.B.; Patkhitdinov, P.P.; Myslitskaya, A.I. Influence of immobilization stress on the level of secretion of thyroid hormones. Neurosci. Behav. Physiol. 1994, 24, 462–464. [Google Scholar] [CrossRef]
  64. Dauncey, M.J.; Morovat, A. Investigation of mechanisms mediating the increase in plasma concentrations of thyroid hormones after a meal in young growing pigs. J. Endocrinol. 1993, 139, 131–141. [Google Scholar] [CrossRef]
  65. Piantanida, E.; Ippolito, S.; Gallo, D.; Masiello, E.; Premoli, P.; Cusini, C.; Rosetti, S.; Sabatino, J.; Segato, S.; Trimarchi, F.; Bartalena, L.; Tanda, M.L. The interplay between thyroid and liver: implications for clinical practice. J. Endocrinol. Invest. 2020, 43, 885–899. [Google Scholar] [CrossRef] [PubMed]
  66. Virgona, N.; Taki, Y.; Yamada, S.; Umegaki, K. Dietary Coleus forskohlii extract generates dose-related hepatotoxicity in mice. J. Appl. Toxicol. 2013, 33, 924–932. [Google Scholar] [CrossRef] [PubMed]
  67. Domitrović, R.; Potočnjak, I. A comprehensive overview of hepatoprotective natural compounds: mechanism of action and clinical perspectives. Arch. Toxicol. 2016, 90, 39–79. [Google Scholar] [CrossRef] [PubMed]
  68. Koriem, K.M.; Soliman, R.E. Chlorogenic and caftaric acids in liver toxicity and oxidative stress induced by methamphetamine. J. Toxicol. 2014, 2014, 583494. [Google Scholar] [CrossRef]
  69. Sun, Z.X.; Liu, S.; Zhao, Z.Q.; Su, R.Q. Protective effect of chlorogenic acid against carbon tetrachloride-induced acute liver damage in rats. Chin. Herb. Med. 2014, 6, 36–41. [Google Scholar] [CrossRef]
  70. Youssef, E.M.; Wu, G.Y. Subnormal serum liver enzyme levels: a review of pathophysiology and clinical significance. J. Clin. Transl. Hepatol. 2024, 12, 428. [Google Scholar] [CrossRef]
  71. Qian, K.; Zhong, S.; Xie, K.; Yu, D.; Yang, R.; Gong, D.W. Hepatic ALT isoenzymes are elevated in gluconeogenic conditions including diabetes and suppressed by insulin at the protein level. Diabetes Metab. Res. Rev. 2015, 31, 562–571. [Google Scholar] [CrossRef]
  72. Sharma, U.; Pal, D.; Prasad, R. Alkaline phosphatase: an overview. Indian J. Clin. Biochem. 2014, 29, 269–278. [Google Scholar] [CrossRef]
  73. Huang, X.J.; Choi, Y.K.; Im, H.S.; Yarimaga, O.; Yoon, E.; Kim, H.S. Aspartate aminotransferase (AST/GOT) and alanine aminotransferase (ALT/GPT) detection techniques. Sensors 2006, 6, 756–782. [Google Scholar] [CrossRef]
  74. Sun, L.; Warren, F.J.; Gidley, M.J. Natural products for glycaemic control: Polyphenols as inhibitors of alpha-amylase. Trends Food Sci. Technol. 2019, 91, 262–273. [Google Scholar] [CrossRef]
  75. Xiao, J.; Ni, X.; Kai, G.; Chen, X. A review on structure–activity relationship of dietary polyphenols inhibiting α-amylase. Crit. Rev. Food Sci. Nutr. 2013, 53, 497–506. [Google Scholar] [CrossRef]
  76. Renard, C.M.; Watrelot, A.A.; Le Bourvellec, C. Interactions between polyphenols and polysaccharides: Mechanisms and consequences in food processing and digestion. Trends Food Sci. Technol. 2017, 60, 43–51. [Google Scholar] [CrossRef]
  77. Kleeff, J.; Whitcomb, D.C.; Shimosegawa, T.; Esposito, I.; Lerch, M.M.; Gress, T.; Mayerle, J.; Drewes, A.M.; Rebours, V.; Akisik, F.; Domínguez Muñoz, J.E.; Neoptolemos, J.P. Chronic pancreatitis. Nat. Rev. Dis. Primers 2017, 3, 1–18. [Google Scholar] [CrossRef]
  78. Wang, H.; Ran, J.; Jiang, T. Urea. In Urea Transporters; Yang, B., Sands, J.M., Eds.; Springer: Dordrecht, The Netherlands, 2014; Volume 73, pp. 7–29. [Google Scholar] [CrossRef]
  79. Morris Jr, S.M. Regulation of enzymes of the urea cycle and arginine metabolism. Annu. Rev. Nutr. 2002, 22, 87–105. [Google Scholar] [CrossRef]
  80. Weismann, D.; Hartvigsen, K.; Lauer, N.; Bennett, K.L.; Scholl, H.P.; Issa, P.C.; Cano, M.; Brandstätter, H.; Tsimikas, S.; Skerka, C.; Superti-Furga, G.; Handa, J.T.; Zipfel, P.F.; Witztum, J.L.; Binder, C.J. Complement factor H binds malondialdehyde epitopes and protects from oxidative stress. Nature 2011, 478, 76–81. [Google Scholar] [CrossRef] [PubMed]
  81. Gereben, B.; McAninch, E.A.; Ribeiro, M.O.; Bianco, A.C. Scope and limitations of iodothyronine deiodinases in hypothyroidism. Nat. Rev. Endocrinol. 2015, 11, 642–652. [Google Scholar] [CrossRef] [PubMed]
  82. Vargas-Uricoechea, H.; Nogueira, J.P.; Pinzón-Fernández, M.V.; Schwarzstein, D. The usefulness of thyroid antibodies in the diagnostic approach to autoimmune thyroid disease. Antibodies 2023, 12, 48. [Google Scholar] [CrossRef] [PubMed]
  83. Luongo, C.; Dentice, M.; Salvatore, D. Deiodinases and their intricate role in thyroid hormone homeostasis. Nat. Rev. Endocrinol. 2019, 15, 479–488. [Google Scholar] [CrossRef]
  84. Gereben, B.; Salvatore, D.; Harney, J.W.; Tu, H.M.; Larsen, P.R. The human, but not rat, Dio2 gene is stimulated by thyroid transcription factor-1 (TTF-1). Mol. Endocrinol. 2001, 15, 112–124. [Google Scholar] [CrossRef] [PubMed]
  85. Lavado-Autric, R.; Calvo, R.M.; de Mena, R.M.; de Escobar, G.M.; Obregon, M.J. Deiodinase activities in thyroids and tissues of iodine-deficient female rats. Endocrinology 2013, 154, 529–536. [Google Scholar] [CrossRef] [PubMed]
  86. St. Germain, D.L.; Galton, V.A.; Hernandez, A. Defining the roles of the iodothyronine deiodinases: current concepts and challenges. Endocrinology 2009, 150, 1097–1107. [Google Scholar] [CrossRef] [PubMed]
  87. Williams, G.R.; Bassett, J.D. Local control of thyroid hormone action: role of type 2 deiodinase. J. Endocrinol. 2011, 209, 261–272. [Google Scholar] [CrossRef]
  88. Russo, S.C.; Salas-Lucia, F.; Bianco, A.C. Deiodinases and the metabolic code for thyroid hormone action. Endocrinology 2021, 162, bqab059. [Google Scholar] [CrossRef]
  89. Bianco, A.C.; Kim, B.W. Deiodinases: implications of the local control of thyroid hormone action. J. Clin. Invest. 2006, 116, 2571–2579. [Google Scholar] [CrossRef]
  90. Kreft, I.; Fabjan, N.; Yasumoto, K. Rutin content in buckwheat (Fagopyrum esculentum Moench) food materials and products. Food Chem. 2006, 98, 508–512. [Google Scholar] [CrossRef]
  91. Gonçalves, C.F.L.; Santos, M.C.; Ginabreda, M.G.; Fortunato, R.S.; Carvalho, D.P.; Freitas Ferreira, A.C. Flavonoid rutin increases thyroid iodide uptake in rats. PLoS ONE 2013, 8, e73908. [Google Scholar] [CrossRef]
  92. Sabatino, L. Nrf2-mediated antioxidant defense and thyroid hormone signaling: a focus on cardioprotective effects. Antioxidants 2023, 12, 1177. [Google Scholar] [CrossRef]
  93. Kambe, F.; Nomura, Y.; Okamoto, T.; Seo, H. Redox regulation of thyroid-transcription factors, Pax-8 and TTF-1, is involved in their increased DNA-binding activities by thyrotropin in rat thyroid FRTL-5 cells. Mol. Endocrinol. 1996, 10, 801–812. [Google Scholar] [CrossRef]
  94. Ferdous, A.; Wang, Z.V.; Luo, Y.; Li, D.L.; Luo, X.; Schiattarella, G.G.; Altamirano, F.; May, H.I.; Battiprolu, P.K.; Nguyen, A.; Rothermel, B.A.; Lavandero, S.; Gillette, T.G.; Hill, J.A. FoxO1-Dio2 signaling axis governs cardiomyocyte thyroid hormone metabolism and hypertrophic growth. Nat. Commun. 2020, 11, 2551. [Google Scholar] [CrossRef]
  95. Acharjee, S.; Chauhan, S.; Pal, R.; Tomar, R.S. Mechanisms of DNA methylation and histone modifications. Prog. Mol. Biol. Transl. Sci. 2023, 197, 51–92. [Google Scholar] [CrossRef]
  96. Treuting, P.M.; Dintzis, S.M.; Montine, K.S. (Eds.) Comparative anatomy and histology: a mouse, rat, and human atlas, 2nd ed.; Academic Press: London, UK, 2017. [Google Scholar]
Figure 1. Relative expression of (A) Dio1, (B) Dio2, (C) Slc5a5 (NIS), and (D) Tpo genes in the thyroid gland of experimental rats. Results are presented as mean ± standard deviation (n = 7). Bars marked with different letters differ significantly at p ≤ 0.05. Description of experimental groups: Group #1 – rats fed the AIN-93G (control) diet; Group #2 – rats fed the AIN-93G diet with the addition of lyophilized non-biofortified lettuce, with KI from the mineral mixture providing iodine in the amount recommended for this diet; Group #3, #4, #5 – rats fed the AIN-93G diet with the addition of lyophilized iodine-biofortified lettuce in the form of potassium iodate (Group #3), 8-hydroxy-7-iodo-5-quinolinesulfonic acid (Group #4), and 5,7-diiodo-8-quinolinol (Group #5), providing iodine in the amount recommended for this diet; Group #6, #7, #8 – rats fed the AIN-93G diet with the addition of lyophilized iodine-biofortified lettuce in the form of potassium iodate (Group #6), 8-hydroxy-7-iodo-5-quinolinesulfonic acid (Group #7), and 5,7-diiodo-8-quinolinol (Group #8), providing iodine in an amount twice that recommended for this diet.
Preprints 186021 g001
Figure 2. Histological image of rat thyroid stained with hematoxylin and eosin (H&E) and Masson’s trichrome. Scale bars: H&E – 100 µm (left panel) and 50 µm (middle panel); Masson’s trichrome – 20 µm (right panel). Legend: ⁎ - foamy collagen structure; → - single collagen fiber; ▼ - detachment of thyrocytes into the lumen; ⁑ - single large follicles in the central zone. Description of experimental groups: Group #1 – rats fed the AIN-93G (control) diet; Group #2 – rats fed the AIN-93G diet with the addition of lyophilized non-biofortified lettuce, with KI from the mineral mixture providing iodine in the amount recommended for this diet; Group #3, #4, #5 – rats fed the AIN-93G diet with the addition of lyophilized iodine-biofortified lettuce in the form of potassium iodate (Group #3), 8-hydroxy-7-iodo-5-quinolinesulfonic acid (Group #4), and 5,7-diiodo-8-quinolinol (Group #5), providing iodine in the amount recommended for this diet; Group #6, #7, #8 – rats fed the AIN-93G diet with the addition of lyophilized iodine-biofortified lettuce in the form of potassium iodate (Group #6), 8-hydroxy-7-iodo-5-quinolinesulfonic acid (Group #7), and 5,7-diiodo-8-quinolinol (Group #8), providing iodine in an amount twice that recommended for this diet.
Preprints 186021 g002
Table 1. Iodine content in the urine and feces of rats in the second and seventh week of the experiment.
Group number Urine [µg dm-3] Feces [µg kg-1 d.w.]
Second week Seventh week Second week Seventh week
Group #1 (Control) 854.59 ± 24.81d 856.25 ± 19.92d 827.47 ± 31.01a 826.02 ± 71.22a
Group #2 864.49 ± 13.99d 873.41 ± 14.88de 855.64 ± 22.93a 851.25 ± 66.13a
Group #3 635.04 ± 9.86b 588.84 ± 7.74b* 965.91 ± 67.72b 965.75 ± 70.15b
Group #4 757.51 ± 12.41c 529.52 ± 10.19a* 1030.54 ± 16.22b 1061.51 ± 64.77b
Group #5 605.05 ± 6.14a 610.07 ± 5.87c 1029.06 ± 40.47b 1011.45 ± 58.29b
Group #6 940.40 ± 33.47e 888.92 ± 9.60e* 1240.73 ± 41.30d 1358.88 ± 13.11c*
Group #7 1087.66 ± 15.71f 1032.51 ± 10.04g* 1169.80 ± 9.21c 1364.99 ± 55.18c*
Group #8 945.39 ± 5.36e 912.06 ± 4.37f* 1215.74 ± 46.68cd 1338.09 ± 21.60c*
Results are presented as mean ± standard deviation (n = 7). Different letters next to the values in the columns indicate significant differences between groups (p ≤ 0.05), while asterisks denote differences compared to the second week within the same groups (p ≤ 0.05); d.w. – dry weight.
Table 2. Iodine content in selected organs of rats.
Group number Thyroid
[mg kg-1 d.w.]
Liver
[µg kg-1 d.w.]
Kidneys
[µg kg-1 d.w.]
Heart
[µg kg-1 d.w.]
Testes
[µg kg-1 d.w.]
Group #1 (Control) 1716.20 ± 82.54b 115.20 ± 11.20b 190.80 ± 4.84c 54.98 ± 2.98a 155.75 ± 11.31b
Group #2 1797.98 ± 110.29bc 118.94 ± 7.00b 187.14 ± 2.77c 45.17 ± 6.34a 155.83 ± 9.20b
Group #3 1532.36 ± 34.02a 85.87 ± 9.69a 129.91 ± 3.95a 51.06 ± 4.22a 97.91 ± 3.75a
Group #4 1840.78 ± 57.63c 156.02 ± 6.14c 152.39 ± 9.73b 74.23 ± 6.83b 171.07 ± 5.64c
Group #5 1825.34 ± 68.90bc 153.24 ± 3.53c 189.79 ± 8.20c 86.19 ± 5.39c 199.27 ± 8.88d
Group #6 1778.71 ± 15.38bc 110.35 ± 5.91b 183.19 ± 5.34c 68.18 ± 8.61b 106.18 ± 5.19a
Group #7 1975.56 ± 10.25d 175.85 ± 2.42d 208.82 ± 8.37d 96.66 ± 2.02d 214.87 ± 1.74e
Group #8 1961.46 ± 71.66d 192.58 ± 4.77e 219.01 ± 3.15d 94.15 ± 7.10cd 224.99 ± 12.05e
Results are presented as mean ± standard deviation (n = 7). Values in columns marked with a different letter are significantly different at p ≤ 0.05; d.w. – dry weight.
Table 3. Lipid profile of rat serum.
Group number HDL cholesterol
[mg dl-1]
LDL + VLDL
cholesterol
[mg dl-1]
Total cholesterol
[mg dl-1]
Triglycerides
[mg dl-1]
Group #1 (Control) 59.98 ± 1.03c 17.08 ± 1.23c 77.06 ± 4.40c 230.48 ± 11.69bc
Group #2 57.99 ± 0.84c 16.26 ± 0.47c 74.25 ± 3.15c 230.70 ± 9.15bc
Group #3 45.16 ± 0.76b 14.59 ± 0.68b 59.75 ± 1.62ab 219.44 ± 3.08b
Group #4 47.35 ± 1.29b 16.78 ± 0.56c 64.13 ± 1.98b 237.15 ± 12.49c
Group #5 46.78 ± 1.77b 12.30 ± 0.81a 59.08 ± 2.37ab 167.98 ± 8.61a
Group #6 40.20 ± 2.18a 20.50 ± 1.14d 60.70 ± 4.01ab 216.20 ± 8.88b
Group #7 42.00 ± 0.62a 17.06 ± 0.97c 59.06 ± 3.35a 225.70 ± 6.14bc
Group #8 40.80 ± 1.57a 15.87 ± 1.11bc 56.67 ± 1.70a 238.27 ± 4.47c
Results are presented as mean ± standard deviation (n = 7). Values in columns marked with a different letter are significantly different at p ≤ 0.05.
Table 4. Hormone levels associated with thyroid function in rats.
Group number Thyroxine (T4) [nmol l-1] Free T4 (fT4) [pmol l-1] Triiodothyronine
(T3) [nmol l-1]
Free T3 (fT3) [pmol l-1] Thyroid-stimulating hormone (TSH)
[mIU l-1]
Group #1 (Control) 101.00 ± 5.46b 21.62 ± 2.81b 1.30 ± 0.03b 7.17 ± 0.18b 4.12 ± 0.15ab
Group #2 101.50 ± 6.17b 20.08 ± 1.89b 1.31 ± 0.06b 7.55 ± 0.53b 4.18 ± 0.19ab
Group #3 84.70 ± 2.88a 14.59 ± 1.01a 1.16 ± 0.04a 6.38 ± 0.16a 4.05 ± 0.11a
Group #4 111.35 ± 3.83cd 18.40 ± 2.45b 1.36 ± 0.11b 7.18 ± 0.29b 4.23 ± 0.26ab
Group #5 111.60 ± 7.02cd 19.55 ± 1.38b 1.23 ± 0.07ab 7.42 ± 0.45b 4.26 ± 0.17ab
Group #6 105.17 ± 1.51bc 25.66 ± 1.15c 1.97 ± 0.14c 8.53 ± 0.72c 4.02 ± 0.08a
Group #7 114.98 ± 4.92d 27.73 ± 1.93c 2.13 ± 0.05d 9.09 ± 0.63c 4.19 ± 0.14ab
Group #8 116.90 ± 7.40d 34.72 ± 1.90d 2.84 ± 0.09e 10.92 ± 0.44d 4.38 ± 0.09b
Results are presented as mean ± standard deviation (n = 7). Values in columns marked with a different letter are significantly different at p ≤ 0.05.
Table 5. Other biochemical parameters related to proper functioning of the rat organism.
Group number Alanine
aminotransferase
[U l-1]
Aspartate
aminotransferase
[U l-1]
Alkaline
phosphatase
[U l-1]
Urea
[mg dl-1]
Group #1 (Control) 40.70 ± 2.25c 95.53 ± 1.71ab 16.20 ± 0.97c 36.90 ± 1.65e
Group #2 40.90 ± 1.4c 97.75 ± 4.54ab 14.57 ± 1.58bc 34.90 ± 0.61d
Group #3 33.99 ± 1.08ab 100.40 ± 8.66bc 12.29 ± 0.40a 32.70 ± 1.23c
Group #4 36.19 ± 3.63b 95.80 ± 6.75ab 14.20 ± 0.49b 26.27 ± 0.58a
Group #5 32.36 ± 0.66a 90.44 ± 2.53a 16.00 ± 0.62c 27.36 ± 0.80a
Group #6 50.37 ± 2.82d 106.60 ± 3.95c 23.60 ± 1.33e 34.13 ± 1.47cd
Group #7 41.06 ± 0.71c 103.72 ± 1.62bc 18.14 ± 0.51d 35.78 ± 1.06de
Group #8 35.23 ± 1.19ab 97.13 ± 5.30ab 16.00 ± 1.08c 29.23 ± 0.94b
Group number Amylase
[U l-1]
Lipase
[U l-1]
Elastase
[ng g-1d.w.]
Malondialdehyde [nmol ml-1]
Group #1 (Control) 681.57 ± 17.15d 187.95 ± 9.43ab 1610.35 ± 37.65a 3.71 ± 0.17bc
Group #2 554.09 ± 19.01b 183.17 ± 6.97a 1627.77 ± 18.78a 3.52 ± 0.23abc
Group #3 581.72 ± 8.71bc 199.14 ± 6.52b 1615.24 ± 77.14a 3.65 ± 0.21bc
Group #4 384.03 ± 13.46a 178.29 ± 4.67a 1565.59 ± 35.74a 3.84 ± 0.14c
Group #5 588.87 ± 9.52c 189.56 ± 5.11ab 1613.19 ± 102.99a 3.54 ± 0.26abc
Group #6 601.00 ± 18.78c 259.32 ± 10.30d 1628.57 ± 48.69a 3.20 ± 0.22a
Group #7 584.25 ± 20.00c 226.29 ± 12.41c 1625.43 ± 63.76a 3.46 ± 0.29ab
Group #8 607.20 ± 27.95c 221.79 ± 8.79c 1587.04 ± 52.26a 3.21 ± 0.23a
Results are presented as mean ± standard deviation (n = 7). Values in columns marked with a different letter are significantly different at p ≤ 0.05; d.w. – dry weight.
Disclaimer/Publisher’s Note: The statements, opinions and data contained in all publications are solely those of the individual author(s) and contributor(s) and not of MDPI and/or the editor(s). MDPI and/or the editor(s) disclaim responsibility for any injury to people or property resulting from any ideas, methods, instructions or products referred to in the content.
Copyright: This open access article is published under a Creative Commons CC BY 4.0 license, which permit the free download, distribution, and reuse, provided that the author and preprint are cited in any reuse.
Prerpints.org logo

Preprints.org is a free preprint server supported by MDPI in Basel, Switzerland.

Subscribe

Disclaimer

Terms of Use

Privacy Policy

Privacy Settings

© 2025 MDPI (Basel, Switzerland) unless otherwise stated