
Submitted:
12 December 2024
Posted:
13 December 2024
You are already at the latest version
Abstract
Iodine is a key micronutrient essential for thyroid hormone synthesis, which regulates metabolic processes and maintains the overall health. Despite its importance, the iodine deficiency is a global health issue, leading to disorders such as goiter, hypothyroidism, and developmental abnormalities. Biofortification of crops with iodine is a promising strategy to enhance the dietary iodine intake, providing an alternative to iodized salt. Curly kale (Brassica oleracea var. sabellica) is a nutrient-rich vegetable, high in vitamins A, C, K, minerals, fiber, and bioactive compounds with antioxidant, anti-inflammatory, and detoxifying properties. This study evaluates the effects of diets containing iodine-biofortified curly kale ('Oldenbor F1' and 'Redbor F1') on iodine content, tissue iodine levels, and various biochemical parameters in laboratory rats. The biofortified curly kale was enriched with 5,7-diiodo-8-quinolinol. The iodine content in the AIN-93G (control) diet and non-biofortified curly kale diets did not differ significantly. However, diets with 5,7-diiodo-8-quinolinol biofortified kale showed significantly higher iodine levels compared to control diets. Tissue analysis revealed the highest iodine concentrations in the liver and kidneys of rats fed diets with biofortified curly kale, indicating better iodine bioavailability. Biochemical analysis showed that rats fed the biofortified kale diet had lower total cholesterol (TC) and triglycerides (TG) levels as compared with rats fed the control diet. Additionally, the biofortified diet improved the liver function markers (ALAT, ASAT) and reduced oxidative stress markers (TBARS). The study also investigated the expression of thyroid-related genes (Slc5A5, Tpo, Dio1, Dio2) in response to diets containing biofortified kale. The results demonstrated significant changes in gene expression, indicating adaptive mechanisms to dietary iodine levels and the presence of bioactive compounds in the biofortified kale. The study also observed variations in uric acid levels, with lower concentrations in rats fed diet with biofortified curly kale. These findings suggest that biofortified curly kale can effectively enhance dietary iodine intake and improve various health parameters, supporting its potential as a nutritional intervention to address iodine deficiency and promote overall health.
Keywords:
curly kale
; biofortification
; iodine
; 5
; 7-diiodo-8-quinolinol
; iodine metabolism
; rats
1. Introduction
Iodine is a key micronutrient required for the synthesis of thyroid hormones, which plays an important role in regulating metabolic processes and maintaining overall health. Despite its importance, iodine deficiency remains a significant global health problem, leading to disorders such as goiter, hypothyroidism and various developmental abnormalities. One strategy to address this is to seek alternatives to iodising table salt. One such alternative is the biofortification of plants with iodoquinolines. It may become an effective strategy to increase the iodine content of foods and thus improve the dietary iodine intake [1,2].
Curly kale (Brassica oleracea var. sabellica) is a nutrient-rich cruciferous vegetable known for its high content of vitamins (A, C, K), minerals (calcium, iron), fibre and bioactive compounds such as glucosinolates, flavonoids and carotenoids [3,4,5,6]. These compounds possess antioxidant, anti-inflammatory and detoxifying properties, rendering kale a valuable addition to a healthy diet. By biofortifying curly kale with iodine in the form of 5,7-diI-8-Q, it is possible to exploit its health benefits while supplementing dietary iodine deficiency [3,7,8].
The introduction of biofortification of vegetables with iodoquinoline compounds such as 5,7-diI-8-Q represents a novel approach to addressing iodine deficiency on a global scale. Biofortification is a process of nutritional enrichment of crops that can significantly improve dietary quality, especially in regions where micronutrient deficiencies are common. Studies have shown that biofortified kale not only provides essential nutrients, but also effectively increases iodine levels in in the body.
Furthermore, the use of 5,7-diI-8-Q in the biofortification process is a pioneering step, as this chemical compound has not been extensively studied in the context of plant iodine fortification. Its efficacy and safety as a biofortification agent represent an interesting area of research that may open up new opportunities in the field of nutrition and public health. Future research could focus on optimising biofortification processes, assessing the long-term effects of consuming such vegetables and their impact on human health, thus contributing to more sustainable and nutritious food systems.
Iodine metabolism and maintenance, other than thyroid functions, depend on the subtleties of molecular mechanisms interplaying at the expression level of key genes involved with iodide transport, synthesis, and activation of hormones. Of these, the gene Slc5A5 encodes sodium/iodide symporter (NIS), which is responsible for iodide transport into thyroid follicular cells and the initial event in thyroid hormone biosynthesis. The Tpo gene also codes for thyroid peroxidase, an enzyme that catalyzes the organification of iodide and the coupling of iodotyrosines, two steps that are critical to thyroid hormone synthesis. Dio1 and Dio2 genes encode deiodinase enzymes, which either inactivate or activate thyroid hormones through their control of availability and activity at the tissue level. Although the function of these genes in the thyroid is well described, their expression under specific dietary conditions, such as on diets supplemented with biofortified compounds, is still poorly explored [9,10,11].
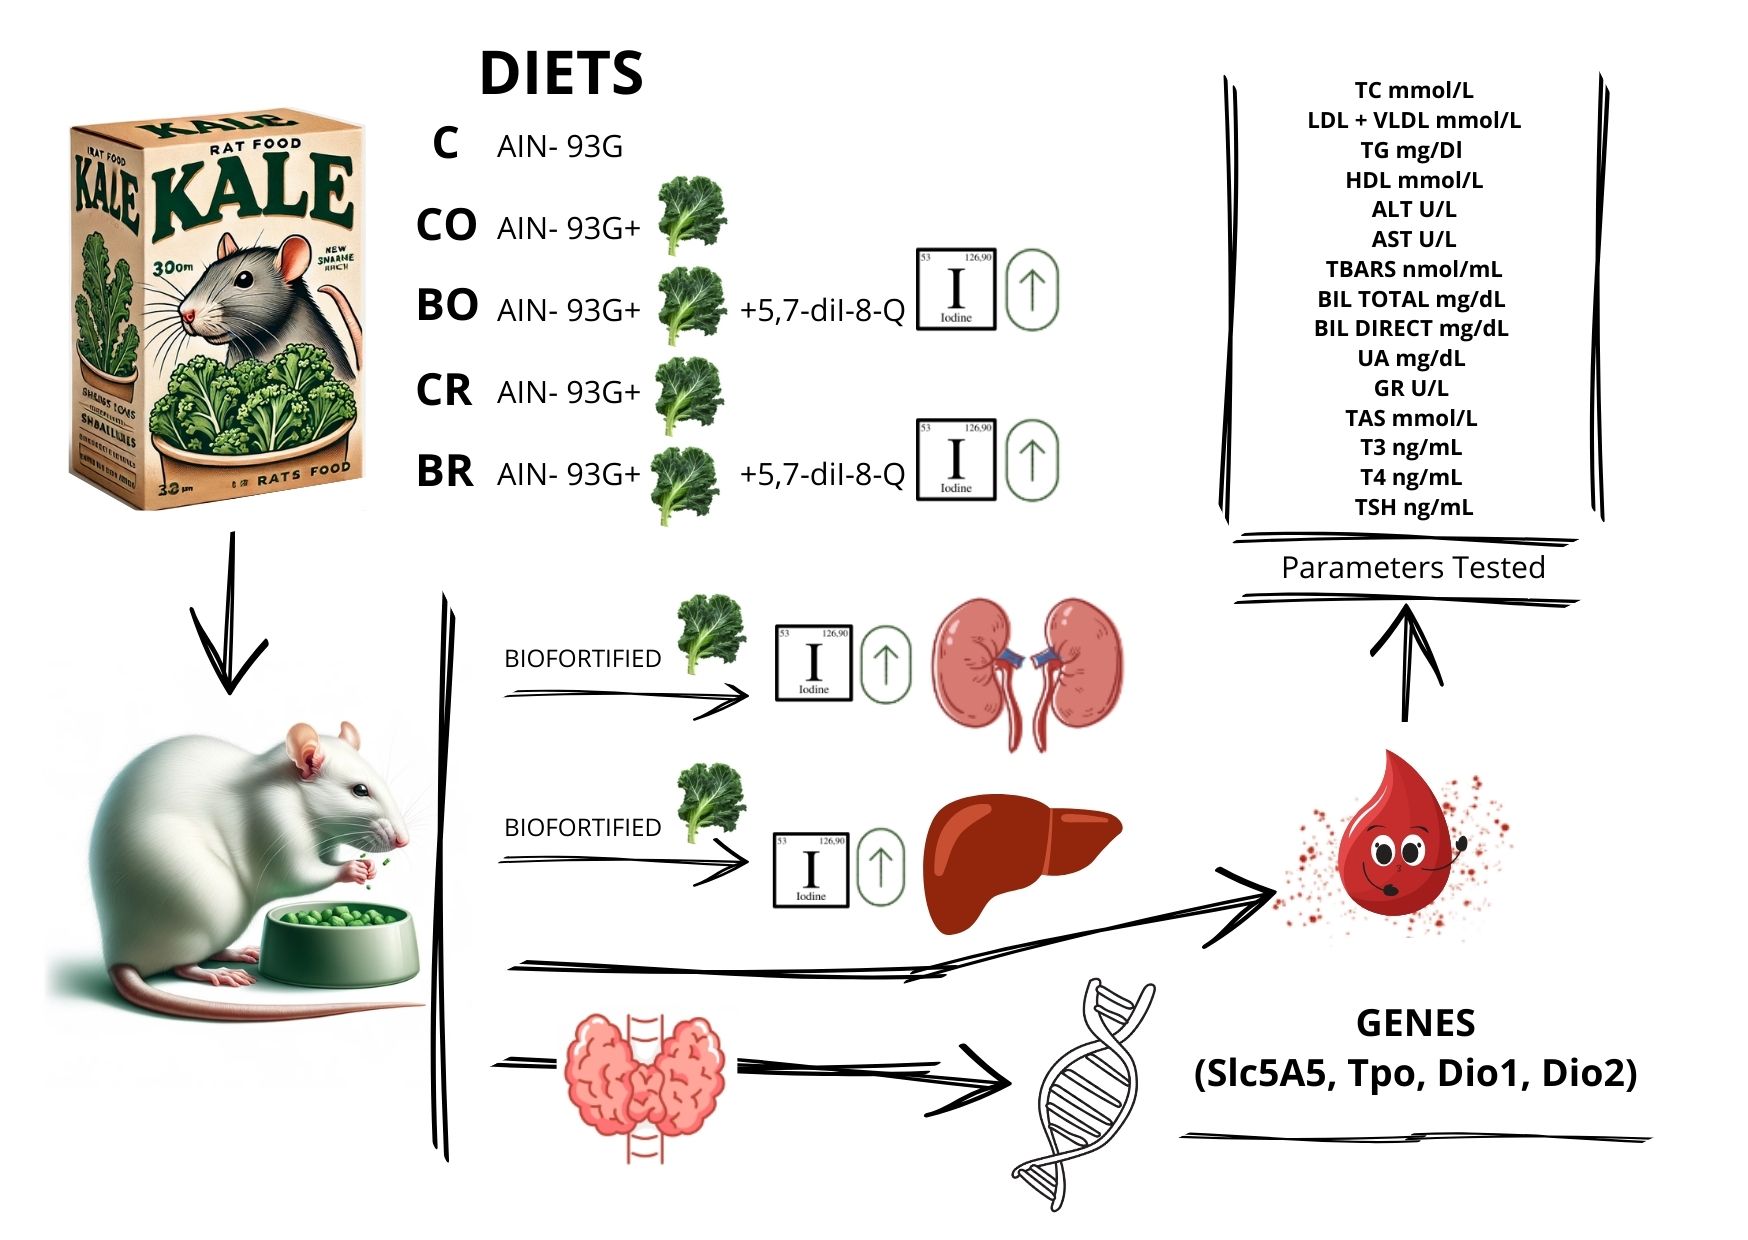
The present study was designed to evaluate the effects of diets containing biofortified curly kale (‘Oldenbor F1’ and ‘Redbor F1’) on the dietary iodine content, tissue iodine levels and various biochemical parameters in laboratory rats. The biofortified kale used in this study was enriched with 5,7-diiodo-8-quinolinol (5,7-diI-8-Q), a compound that is a source of iodine. Comparisons were made with control diets, including the standard AIN-93G diet and diets containing non-biofortified curly kale (‘Oldenbor F1’ and ‘Redbor F1’). Moreover, the study analyzed the expression of genes related to iodine metabolism and thyroid function, to assess how biofortified kale affects iodine transport, metabolism and utilization. This approach was necessary to determine whether biofortified kale not only increases iodine levels, but also supports thyroid hormone synthesis and normal physiological processes, allowing for a comprehensive evaluation of its effectiveness in treating iodine deficiency.
2. Results
2.1. Iodine Content in Rats’ Diets
The iodine content of the AIN-93 G (C, control) diet and diets with curly kale (‘Oldenbor F1’, ‘Redbor F1’) without biofortification was not significantly different. The same was true of diets with curly kale (‘Oldenbor F1’, ‘Redbor F1’) witch biofortification 5,7-diI-8-Q . Significant differences in iodine content were between diets with kale (‘Oldenbor F1’, ‘Redbor F1’) with 5,7-diI-8-Q biofortification vs control diet AIN-93 G and diets with curly kale (‘Oldenbor F1’, ‘Redbor F1’) without biofortification. The iodine content of the C, CO and CR diets was lower than that of the BC and BR diets (Table S1).
2.2. Iodine in Selected Tissues
The kidney and liver tissue iodine content was affected by various dietary treatments (Table 1). The highest tissue iodine levels, e.g., liver and kidney, were found in rats fed diets containing biofortified kale ‘Oldenbor F1’ and ‘Redbor F1’ (BO diet and BR diet) compared with other experimental groups. Whereas the lowest iodine contents (in liver) were determined in animals fed C, CO, CR diets compared to rodents fed diets with biofortified kale (BO diet and BR). A significant difference was observed in the iodine content of the kidneys of rats fed the C diet in compared to those fed the CR diet.
2.3. Selected Biochemical Parameters
Rats fed the BO vs. CO and BR vs. CR diets did not show significant differences within a kale variety with respect to selected biochemical parameters, i.e., TC, LDL + VLDL, TG, HDL, ALT (BR vs. CR) AST, TBARS, BIL TOTAL, BIL DIREC (BO vs. CO), UA, GR, TAS, T3, T4, TSH. On the other hand, significant differences were found for the parameters ALT (BO vs. CO) and BIL DIREC (BR vs. CR).
The rats were fed the diet containing biofortified kale ‘Redbor F1’ (BR diet) had a significantly lower concentration of total cholesterol (TC) in their serum than the rats were fed the control diet (C diet). In the other experimental groups, no significant differences were observed (Table 2). It was also found that animals fed the control diet (C diet) had significantly higher serum HDL concentrations than rats fed the BO, CR, BR diets. (Table 2). The level of LDL was not affected by various dietary treatments (Table 2). The lowest concentration of TG was measured in the serum of rats fed BR diet as compared to the serum of rodents fed C diet.
The highest concentration of ALT was measured in the serum of rats fed C diet as compared to rodents fed BO-, CR- and BR diets. The highest concentration of AST was measured in the serum of rats fed C diet as compared to rodents fed BR diet (Table 2). The highest concentration of TBARS was measured in the serum of rats fed C diet as compared to rodents fed CR diet (Table 2). The highest concentration of BIL TOTAL was measured in the serum of rats fed C diet as compared to other experimental groups. The lowest concentration of BIL TOTAL was measured in the serum of rats fed BO diet as compared to rats fed C-diet (Table 2). No significant differences in BIL DIRECT concentrations were observed between the control diet (C) and the CO, BO, CR and BR diets (Table 2).
The lowest concentration of UA acid was measured in the serum of rats fed BR diet as compared to rodents fed C diet. o significant differences were observed in the concentration of the parameter between the other groups.
2.4. Evaluation of Tpo, Slc5a5, Dio1, and Dio2 Gene Expression Among Experimental Groups
(Figure 1a–d) Expression levels of thyroid-related genes (Tpo, Slc5a5, Dio1, Dio2) were analyzed using digital PCR (dPCR) and expressed as the number of copies per microliter. Type of diet the rats were fed: C control diet (AIN-93G), CO diet containing control curly kale ‘Oldenbor F1’ without biofortified, BO diet containing biofortified curly kale ‘Oldenbor F1’, CR diet containing control curly kale ‘Redbor F1’, BR diet containing biofortified curly kale ‘Redbor F1’. Values in rows with different letters (a, b, c, d) are significantly different, P≤0.05 (One-way analysis (ANOVA), standard error (n =8)
Figure 1a). The highest expression of Tpo mRNA was observed in the CO group (p < 0.05) in comparison to all other study groups. This group exhibited significant differences from the C, BO, CR, and BR groups. In the control group (C), Tpo expression was observed to be lower than in the CO group. However, it was significantly higher than in the BO (p < 0.05), CR (p < 0.05) and BR (p < 0.05) groups. The BO group exhibited Tpo mRNA levels comparable to those observed in the CR group, with no statistically significant difference between the two (p > 0.05). However, both groups demonstrated higher Tpo gene expression than the BR group. The BR group, with the lowest mean Tpo expression (~300 copies/μl), differed significantly from the C, CO, and CR groups (p < 0.05).
Figure 1b). The highest expression of Slc5a5 mRNA was observed in the CO group (p < 0.05) in comparison to all other groups. The CO group exhibited a statistically significant divergence from the C, BO, CR, and BR groups. The control group (C) exhibited a significantly lower Slc5a5 expression than the CO group, yet a higher expression than the other groups (p < 0.05). The Slc5a5 mRNA expression in the CR group was approximately 35 copies/μl, which was significantly higher than in the BO and BR groups (p < 0.05). The BO group exhibited a significantly lower expression level than the C, CO, and CR groups (p < 0.05), while displaying a higher level than the BR group (p < 0.05). The lowest mRNA expression of the Slc5a5 gene was observed in the BR group, with a value of approximately 20 copies/μl. This was significantly lower compared to all other groups (p < 0.05).
Figure 1c). The highest levels of mRNA Dio1 gene were observed in the CO group (p < 0.05), which exhibited a significant divergence from all other study groups. In the CR group, Dio1 expression was observed to be lower than in the CO group, yet significantly higher in comparison to the C, BO and BR groups (p < 0.05). The Dio1 gene expression observed in the C, BO and BR groups was found to be similar and not significantly different between the groups (p > 0.05). Nevertheless, all these groups exhibited significantly reduced expression levels in comparison to the CR and CO groups (p < 0.05).
Figure 1d). The highest mRNA level of Dio2 gene was observed in the CO group (p < 0.05) in comparison to all other study groups, with a mean value of approximately 3.5 copies/μl. The aforementioned group exhibited significant divergence from the C, BO, CR, and BR groups. The second highest expression level was observed in the BR group, which was significantly higher than that observed in the C, BO and CR groups (p < 0.05). The control group (C) exhibited an average Dio2 gene expression of approximately 1.8 copies/μl, which was significantly lower than that observed in the CO, BO and BR groups (p < 0.05). The mean Dio2 gene expression in the BO group was approximately 2 copies/μl, which was higher than in the C and CR groups (p < 0.05). The lowest Dio2 gene expression was observed in the C and CR group. Ther was significantly lower compared to all other study groups (p < 0.05).
3. Discussion
Kale (Brassica oleracea var. sabellica) is one of the most prized cruciferous vegetables. It owes its exceptional nutritional and health properties to its high content of fibre, minerals, vitamins and bioactive compounds, which have detoxifying, anti-inflammatory and antioxidant properties [12,13] . Biofortification, the process of increasing micronutrient levels in crops, is becoming an increasingly popular approach to addressing micronutrient deficiencies worldwide. Kale biofortified with iodine can provide an innovative and effective solution to iodine deficiency, combining the health benefits of consuming this vegetable with an additional source of iodine [7,14].
The majority of iodine in the body is present in thyroid tissues, comprising approximately 70-80% of the total iodine content. The remaining iodine is found in the kidneys, liver, and muscles [15]. Our results showed that the highest iodine concentration in selected organs (liver, kidney) was observed in rats fed the diet with addition of biofortified curly kale. It is likely that this was due to the increased iodine content of these diets. The results demonstrated that the highest concentration of iodine was present in the kidneys (Table 1). This is due to the metabolic function of this organ. The kidneys are vital organs that perform a number of essential functions within the body. These include the filtration of blood, the removal of metabolic by-products, the regulation of electrolyte and acid-base balance, the control of blood pressure and the support of red blood cell production. The precise and complex regulation of these processes is essential for maintaining homeostasis and the health of the entire body [16,17]. There are only a few studies that show changes in the iodine concentration in the tissues. Piątkowska et al. [18] also showed that the kidneys contained the highest concentration of iodine compared to the other tissues analysed (liver, heart, thyroid) in rats fed diet with carrot (raw and cooked) KI-enriched as compared to rats fed control diet. In contrast, Kopeć et al. [19] conducted a study on rats fed dies biofortified KI lettuce, a control diet and a diet containing non-biofortified KI control lettuce. They showed that liver and thigh muscle had the highest tissue levels of this trace element in rats fed biofortified lettuce. In Hou et al. [20] study revealed that iodine concentrations can be high in adult, healthy individuals’ hair and skin. According to some authors, iodine contained in various foods, including fortified products, has a high bioavailability of about 99% [21,22]. In our study, we also observed that iodine levels in different organs, as well as in urine and faeces (citing our previous studies [23]), depended on dietary iodine levels.
The results demonstrated that rats fed a diet containing biofortified ‘Redbor F1’ kale (BR diet) showed a significant reduction in serum total cholesterol (TC) concentrations in comparison to rats on the control diet (Table 2). However, LDL + VLDL level was not affected by different diet treatment. We observed reduced triglycerides levels in rats fed the BR diet compared to those fed the C diet. This may be due to the presence of fiber and other biologically active ingredients such as flavonoids, a group of health-promoting compounds. When consumed, they prevent the oxidation of low-density cholesterol (LDL) fraction, thereby counteracting the formation of atherosclerotic deposits [24]. Another ingredient is tocopherol, a group of vitamin E, which among other things affects the elasticity of blood vessels, contributing to the lowering of serum lipids [25,26]. The higher levels of anthocyanins in ‘Redbor F1’ may have contributed to the reduction in TC and TG levels. Research suggests that consumption of anthocyanin-rich foods may contribute to a reduction in total cholesterol levels. This may be due to a reduction in cholesterol synthesis in the liver and an increase in the excretion of bile acids, which are derivatives of cholesterol. Anthocyanins can affect gene expression and the activity of enzymes involved in lipid synthesis [27,28,29,30]. In particular, they can reduce the activity of enzymes such as diacylglycerol acyltransferase (DGAT), which plays a key role in triglycerides synthesis. In the study, other researchers showed that total cholesterol level was not affected by different diets [18]. In addition, Kopeć et al. [19] showed that in the serum of rats fed biofortified KI or control lettuce, the concentration of TC and LDL + VLDL cholesterol increased significantly. However, Piątkowska et al. [18] showed that the level of LDL+VLDL tended to decrease in the serum of rats fed a diet containing biofortified (KI) iodine raw carrot. Additionally, we discovered that the level of HDL has a tendency to decrease in the serum of rats fed BO, CR and CR diets, but this parameter was still within physiological norm in the serum [31].
ALT activity decrease was affected by BO, CR and BR diets. No significant differences were observed in serum AST levels between the four experimental groups (CO, BO, CR, BR).The decrease in TBARS activity was influenced by the CR and BR diets (Table 2). The reduction in the above parameters may be due to the bioactive compounds found in kale [32]. Sulforaphane, a sulphur compound found in cruciferous vegetables, may have contributed. Studies show that sulforaphane can protect the liver from oxidative and inflammatory damage, which may lead to lower ALT and AST levels [33,34]. Other bioactive compounds found in kale are quercetin and kaempferol, which belong to the group of flavonoids. They have antioxidant, anti-inflammatory and anti-fibrotic effects and help maintain liver health by reducing levels of oxidative stress markers such as TBARS [35,36]. The reduction in the above mentioned parameters may be due to a form of iodine enrichment. 5,7-diiodo-8-quinolinol is a quinoline derivative in which one hydroxyl group (-OH) and two iodine groups (-I) are attached to the quinoline ring. Compounds in this group have various biological and pharmacological activities that are beneficial to health, such as anti-inflammatory, immunomodulatory, antibacterial and antifungal. It is possible that the properties of this group, as well as iodine, play a role in lowering ALT, AST and TBARS parameters. On the other hand, other researchers using vegetables enriched with a different form of iodine (KI) have obtained different results from ours. In an animal study liver parameters (ALT, AST) were shown to increase [18] or not to change after a diet of iodine-fortified (KI) vegetables [18,19]. On the other hand, the TBARS parameter also decreased after diets with biofortified (KI) vegetables (raw carrot and lettuce) [18,19]. The use of iodine-rich herbs such as seaweed in the Gao et al. study showed less damage to thyroid follicular cells compared with excess iodine alone. The study showed that the activity of antioxidant enzymes such as the oxidative stress marker malondialdehyde (MDA) decreased in the iodine-rich herb group. This suggests that iodine-rich plants may reduce oxidative stress in the thyroid [37].
In our study, we also found that total bilirubin levels decreased in the curly kale fortified diets. The greatest reduction was seen in the BO diet with biofortified curly kale with 5,7-diI-8-Q compared to the C control group, In contrast, no significant differences were observed between the control group and the groups fed the curly kale diet without biofortification and with biofortified 5,7-di-8-Q. The glucosinolates found in kale, which are metabolized to active isothiocyanates such as sulforaphane after consumption, may have contributed to these results. These compounds have potent detoxifying properties that can support liver function by inducing phase II detoxification enzymes. Sulforaphane activates enzymes such as glutathione S-transferase (GSTs) and NQO1 (NAD(P)H-oxidoreductase). These enzymes help to neutralise toxins and metabolites, which may support liver health and indirectly affect bilirubin metabolism [38,39,40]
The results indicate a variation in uric acid levels between different groups, with statistical significance indicating notable differences between the group fed a diet based on AIN-93G and the group fed a diet based on BR, which included curly kale biofortified with 5,7-di-8-Q. The higher uric acid levels in rats fed the standard AIN-93G diet compared with those fed the 5,7-di-8-Q-enriched curly kale may be due to the high protein and refined carbohydrate content of the AIN-93G diet, which promotes uric acid production. In contrast, the beneficial properties of curly kale, including antioxidants, fiber and iodine from 5,7-di-8-Q, help to reduce and regulate uric acid levels more effectively [41,42]
The levels of glutathione reductase and total antioxidant status were not affected by the different dietary treatments (Table 2). It indicates a good antioxidant capacity in the body, which may protect against oxidative damage and oxidative stress [43,44,45,46].
Adding biofortified curly kale (‘Oldenbor F1’, ‘Redbor F1’) to experimental diets did not affect T3 and T4 level in the serum of experimental rats, which is an important finding of our study. It can be ascertained that the 5,7-di-8-Q-enriched curly kale, and thus the high iodine content, does not exert a deleterious effect on the health parameters of the rats. In groups of rats fed with kale of the variety ‘Oldenbor F1’ (non-biofortified and biofortified), a decrease in TSH was observed (Table 2). In contrast, no significant changes were observed in the ‘Redbor F1’ variety. Although curly kale is rich in bioactive compounds that may support overall thyroid health, there is no direct evidence that specific compounds in kale lower TSH levels. Similar results were obtained by Piatkowska et al.[18] showed that biofortified carrots (KI) had no effect on T4 levels, while, in contrast to our study, they caused an increase in TSH and T3. In the study conducted by Hussein et al.[47], it was observed that in rats with thiocyanate-induced hypothyroidism, long-term consumption of excess iodine resulted in a significant increase in T3 and T4 levels.
The findings of the present study indicate that biofortified kale witch 5,7-di-8-Q (BO and BR groups) has a notable impact on the expression of crucial genes associated with thyroid function. The genes in question are Slc5a5, Tpo, Dio1 and Dio2. A comparison with the control group (C) and the addition of kale without CO (from Oldenbor F1) and CR (from Redbor F1) biofortification indicates the presence of compensatory mechanisms in response to excess iodine.
The expression of genes in the thyroid, including Slc5a5, Tpo and Dio1 , was observed to be lowest in the BO and BR groups. This finding suggests a clear effect of excess iodine in the diet on the activity of these genes. In a study conducted by Hussein et al. [47] the administration of excess iodine was found to result in a significant decrease in the expression of Dio1, Tpo and Slc5a5 genes in the thyroid gland. A similar outcome was documented in a study conducted by Liang et al. [48], which demonstrated that an excess of iodine influences the diminished expression of Slc5a5 and Tpo in the thyroid gland of rats. An excess of iodine induces a Wolff-Chaikoff effect, which results in decreased expression of these genes [49]. This is a protective mechanism that prevents excessive iodine accumulation in the thyroid gland. These findings do not suggest adverse effects on the thyroid gland, as evidenced by the findings of Ling et al. [48], who demonstrated that a dose of iodine 100 times the norm is only toxic to the body. The high content of glucosinolates and their metabolites in kale may also have influenced the inhibition of gene activity. Conversely, kale’s bioactive compounds, such as isothiocyanates and indole-3-carbinol, may modulate inflammatory and antioxidant pathways by affecting the regulation of these genes [50]. The elevated expression of Dio2 in the BO and BR groups in comparison to the control group (C) may represent a compensatory mechanism in response to the diminished activity of other thyroid genes (Slc5a5, Tpo and Dio1), which are involved in iodine uptake and thyroid hormone synthesis. It is possible that the thyroid gland increases the activity of Dio2 to provide sufficient active T3 under conditions of reduced thyroid hormone production [51].
The CO group (green control kale) exhibited the highest expression values for all genes tested, which may indicate a dietary iodine deficiency or the adverse effect of goitrogens found in kale, thereby hindering its bioavailability. Our findings align with those previously reported by Lavado-Autric et al. [52]. The data presented indicate that a diet deficient in iodine induces an increase in Dio1 mRNA in the thyroid gland. However, the CR group exhibited a markedly lower level of expression than the CO group, despite the absence of 5,7-di-8-Q in kale. These observations necessitate further investigation through a comprehensive analysis of kale composition.
4. Materials and Methods
4.1. Plant Material
Curly kale cultivation and biofortickation with 5,7 diiodo-8-quinolinol was described in our previous publication [23].
4.2. Animal Study
The feeding experiment with laboratory rats was described in our previous publication [12]. It was conducted with the permission of the First Local Ethical Committee in Krakow (Poland, resolution no. 568/2021) on 5 groups of animals (each consisting n = 8). The duration of the experiment was eight weeks.
The experimental diets were prepared based on the AIN-93G diets [20] and were prepared by the company Zoolab (Sędziszów, Poland). The detailed compositions of the diets can be found in Table S2.
Group 1 was fed the AIN-93G (C) diet, which contained the recommended iodine levels for curly kale as outlined by Reeves [53]. Group 2 (CO) was fed the control diet of curly kale ‘Oldenbor F1’, while Group 4 (CR) was fed the control diet of curly kale ‘Redbor F1’. Both diets contained a mineral mixture with iodine. In the diet containing biofortified curly kale (group 3, BO diet with biofortified 5,7-diI-8-Q raw curly kale ‘Oldenbor F1’; and group 5, BR diet), the only source of iodine was kale (mineral mixture did not contain iodine) (Table S2). The only source of iodine in the diet containing biofortified curly kale (group 3, BO diet with biofortified 5,7-diI-8-Q raw curly kale ‘Oldenbor F1’) was kale (the mineral mixture did not contain iodine) (Table S2).
After an 8-week experimental period, fasted rats were anaesthetised (substance used - izofluran 4%; inhaled). Blood was obtained by cardiac puncture and collected in plain test tubes. Blood samples were centrifuged (1500 x g, 15 min) to obtain serum. Hearts, thyroids, livers and kidneys were dissected, washed in 0.9% sodium chloride, dried with laboratory tissue paper and weighed. Serum and tissue samples were kept frozen at -80°C until further analysis.
4.3. Analysis of Iodine in Animal Tissues
The analysis was based on research published by Krzeminska et al. [54]
4.4. Analysis in Serum and Blood
The serum was analysed in order to determine the concentration of total cholesterol (TC) (cat. no. Liquick Cor-CHOL 60 2–204, PZ Cormay S.A., Łomianki, Poland), high-density lipoprotein cholesterol (HDL-cholesterol) (cat. no. Cormay HDL-2–053, PZ Cormay S.A., Łomianki, Poland), and triacylglycerols (TG) (cat. no. Liquick Cor-TG 60 2–253, PZ Cormay S.A., Łomianki, Poland). The differences between TC and HDL were employed in the calculation of the LDL + VLDL (Low-Density Lipoprotein + Very Low-Density Lipoprotein) level [55]. The activity of aspartate aminotransferase (ALT) and alanine aminotransferase (AST) in the serum was determined using the Liquick Cor-ALAT 60 1-216, PZ Cormay S.A., Łomianki, Poland and Cor-ASAT 60 1-214, PZ Cormay S.A., Łomianki, Poland, respectively. In the serum, the level of thiobarbituric acid reactive substances (TBARS) was measured as previously reported by Ohkawa et al. [56]. The results were shown as nmol of malondialdehyde (MDA) per mL. Serum was analysed to determine total bilirubin (BIL TOTAL) (cat. no. Liquick Cor-BIL TOTAL 60 2-245, PZ Cormay S.A. Łomianki), Poland), and direct bilirubin (BIL DIRECT) (cat. no. Liquick Cor-BIL DIRECT MALLOY-EVELYN 60 2-348, PZ Cormay S.A. Łomianki). Uric acid (UA) was also determined (Liquick Cor-UA 60 2-208, PZ Cormay S.A. Łomianki). The parameters such as glutathione reductase (GR) and total antioxidant status (TAS) were determined using the following kits: Manual/RX Monza GR 2368, Randox Laboratories Ltd. UK and Manual NX 2332, Randox Laboratories Ltd. UK, respectively. The concentration of triiodothyronine (T3) and thyroxine (T4) was quantified using the ELISA Kit (cat no. CEA453Ge 96 Test ; CEA452Ge 96 Test; respectively, Cloud-Clone Corp, USA). The level of thyroid-stimulating hormone (TSH) was quantified with the Rat Thyroid Stimulating Hormone Elisa (cat no. RTC007R ,BioVendor – Laboratorní medicína a.s, Brno, Czech Republic).
4.5. Gene Expression Profiling
4.5.1. RNA Extraction and cDNA Synthesis
Total RNA was extracted from 15 mg of frozen rat thyroid tissue using the AllPrep DNA/RNA Mini Kit (Qiagen, Cat. No. 80204) following the manufacturer’s instructions. The RNA concentration and purity were assessed using a NanoDrop™ 2000/2000c Spectrophotometer (Thermo Fisher Scientific, Cat. No. ND-2000). All samples exhibited A260/A280 ratios ≥1.9 and A260/A230 ratios ≥2, indicating high purity. Subsequently, 200 ng of RNA from each sample was reverse-transcribed into cDNA in a 20 µL reaction using the High-Capacity cDNA Reverse Transcription Kit (Thermo Fisher Scientific, Cat. No. 4368814), following the manufacturer’s protocol: 25°C for 10 minutes, 37°C for 120 minutes, and 85°C for 5 minutes. After the reverse transcription reaction, the cDNA concentration was reassessed using the NanoDrop™ 2000/2000c.
4.5.2. Digital PCR Analysis
Gene expression analysis was conducted using digital PCR (dPCR) with TaqMan® probes specific for the target genes: Slc5a5 (Thermo Fisher Scientific, Rn00583900_m1), Dio1 (Thermo Fisher Scientific, Rn00572183_m1), Dio2 (Thermo Fisher Scientific, Rn00581867_m1), and Tpo (Thermo Fisher Scientific, Rn00571159_m1). Each dPCR reaction had a total volume of 12 µL, containing QIAcuity Probe Mastermix (QIAGEN, Cat. No. 250102), 200 nM of the respective TaqMan® probe, and 2 µL of cDNA template (100 ng). The concentration and purity of cDNA were assessed using a NanoDrop™ 2000/2000c Spectrophotometer. Reactions were performed in a QIAcuity Nanoplate 8.5k 24-well (QIAGEN, Cat. No. 250011) using the QIAcuity One system (QIAGEN, Cat. No. 911001), which partitions the sample into approximately 8,500 individual reactions per well, facilitating absolute quantification through Poisson statistics. The thermal cycling conditions were as follows: initial denaturation at 95°C for 2 minutes, followed by 40 cycles of denaturation at 95°C for 15 seconds and annealing/extension at 60°C for 15 seconds. Negative controls, consisting of reactions without cDNA template, were included to monitor for contamination. Each experimental group comprised four biological replicates, with each replicate consisting of pooled material from two individuals. Absolute transcript levels were initially calculated in copies per microliter of PCR. Data analysis was conducted with the QIAcuity Suite software. This methodology ensures high sensitivity and accuracy, eliminating the need for standard curves and minimizing the impact of potential PCR inhibitors.
4.6. Statistical Analysis
Data were presented as mean ± SD. One-way analysis (ANOVA) of variance was used to test for differences at p≤0.05. Differences between the experimental groups were tested using the Duncan test. Comparative analysis of Slc5a5, Tpo, Dio1, Dio2 gene copy numbers between the control group and four experimental groups (n = 8 per group) was performed using Mann Whitney test. Results are presented as means ± standard deviation (SD). In the graphs, statistical significance is indicated by letters, where p < 0.05. Statistical analysis was performed in triplicate using Statistica 13.1 PL and JASP software (Jeffreys’s Amazing Statistics Program, version 0.19.1) to ensure rigorous evaluation of the data.
5. Conclusions
1. Curly kale biofortified with 5,7-di-8-Q (‘Oldenbor F1’,‘Redbor F1’) may help regulate uric acid levels in the body thanks to its antioxidant content.
2. In light of the aforementioned findings, future research should concentrate on the long-term effects of biofortified kale consumption on thyroid function and metabolic health. It is necessary to conduct human clinical trials to assess the effectiveness of biofortified kale on body iodine levels and health parameters such as cholesterol, triglycerides and liver enzymes. It is also essential to analyse the bioavailability of iodine from biofortified kale and to compare it with other iodine sources in order to assess the full potential of this method in improving public health.
3. The biofortified kale, which has an excess of iodine, has been observed to significantly reduce the expression of genes that are related to thyroid function (Slc5a5, Tpo, Dio1, Dio2). This indicates that there are compensatory mechanisms that are in response to the excess iodine and that there is the potential impact of the bioactive compounds, such as glucosinolates.
6. Patents
The method of biofortification of vegetables in iodine cultivated using a traditional, soilless, and hydroponic method, and the use of 5,7-diiodo-8-quinolinol for biofortification of vegetables with iodine. These are covered under patent application number P.443221 for the compounds (Polish Patent Office; 21 December 2022).
Supplementary Materials
The following supporting information can be downloaded at: Preprints.org.
Author Contributions
J.W.: Formal analysis, Investigation, Visualization, Writing—Original Draft. E.P.: Investigation, Writing—Review and Editing. P.P.: Investigation, Writing—Review and Editing. A.Kop.: Conceptualization, Formal Analysis. S.S.: Investigation. A.D.: Investigation. J.K.: Investigation. A.K.: Conceptualization, Formal Analysis, Funding Acquisition, Project Administration, Supervision, Validation, Writing—Review and Editing. All authors have read and agreed to the published version of the manuscript.
Funding
This research was financed by the National Science Centre, Poland (grant no. UMO-2020/37/B/NZ9/02710) “The use of iodoquinolines for biostimulation and biofortification of selected vegetables in iodine and investigation of their anticancer properties in the in vitro breast cancer model”.
Acknowledgments
The authors would like to thank Professor Dorota Zięba-Przybylska for providing the opportunity to use the QIAcuity One digital PCR instrument.
Conflicts of Interest
The authors declare no conflict of interest.
References
- Braun, D.; Schweizer, U. Thyroid Hormone Transport and Transporters. Vitam. Horm. 2018, 106, 19–44. [CrossRef]
- Chen, Z.; Peeters, R.P.; Flach, W.; de Rooij, L.J.; Yildiz, S.; Teumer, A.; et al. Novel (Sulfated) Thyroid Hormone Transporters in the Solute Carrier 22 Family. Eur. Thyroid J. 2023, 12, . [CrossRef]
- Ahad, F.; Ganie, S.A. Iodine, Iodine Metabolism and Iodine Deficiency Disorders Revisited. Indian J. Endocrinol. Metab. 2010, 14, 13–17.
- Visser, T.J. Regulation of Thyroid Function, Synthesis, and Function of Thyroid Hormones. In Endocrinology; Springer International Publishing: Cham, Switzerland, 2018; pp. 3–32.
- Zhang, L.; Shang, F.; Liu, C.; Zhai, X. The Correlation Between Iodine and Metabolism: A Review. Front. Nutr. 2024, 11, 1346452. [CrossRef]
- Hatch-McChesney, A.; Lieberman, H.R. Iodine and Iodine Deficiency: A Comprehensive Review of a Re-Emerging Issue. Nutrients 2022, 14, 3474. [CrossRef]
- Baldassano, S.; Di Gaudio, F.; Sabatino, L.; Caldarella, R.; De Pasquale, C.; Di Rosa, L.; et al. Biofortification: Effect of Iodine Fortified Food in the Healthy Population, Double-Arm Nutritional Study. Front. Nutr. 2022, 9, 871638. [CrossRef]
- Krawczyk, K.K.; Smoleń, S.; Wisła-Świder, A.; Kowalska, I.; Kiełbasa, D.; Pitala, J.; et al. Kale (Brassica oleracea L. var. sabellica) Biofortified with Iodoquinolines: Effectiveness of Enriching with Iodine and Influence on Chemical Composition. Sci. Hortic. 2024, 323, 112519. [CrossRef]
- Le, S.N.; Porebski, B.T.; McCoey, J.; Fodor, J.; Riley, B.; Godlewska, M.; et al. Modelling of Thyroid Peroxidase Reveals Insights into Its Enzyme Function and Autoantigenicity. PLoS ONE 2015, 10, e0142615. [CrossRef]
- Martín, M.; Modenutti, C.P.; Gil Rosas, M.L.; Peyret, V.; Geysels, R.C.; Bernal Barquero, C.E.; et al. A Novel SLC5A5 Variant Reveals the Crucial Role of Kinesin Light Chain 2 in Thyroid Hormonogenesis. J. Clin. Endocrinol. Metab. 2021, 106, 1867–1881. [CrossRef]
- Ferreira, M. Biofortified Diets Containing Algae and Selenised Yeast: Effects on Growth Performance, Nutrient Utilization, and Tissue Composition of Gilthead Seabream (Sparus aurata). Front. Physiol. 2022, 12, . [CrossRef]
- Šamec, D.; Urlić, B.; Salopek-Sondi, B. Kale (Brassica oleracea var. acephala) as a Superfood: Review of the Scientific Evidence Behind the Statement. Crit. Rev. Food Sci. Nutr. 2019, 59, 2411–2422. [CrossRef]
- Khalid, W.; Iqra; Afzal, F.; Rahim, M.A.; Abdul Rehman, A.; Faiz ul Rasul, H.; et al. Industrial Applications of Kale (Brassica oleracea var. sabellica) as a Functional Ingredient: A Review. Int. J. Food Prop. 2023, 26, 489–501. [CrossRef]
- Nestel, P.; Bouis, H.E.; Meenakshi, J.V.; Pfeiffer, W. Biofortification of Staple Food Crops. J. Nutr. 2006, 136, 1064–1067. [CrossRef]
- Pesce, L.; Kopp, P. Iodide Transport: Implications for Health and Disease. Int. J. Pediatr. Endocrinol. 2014, 2014, . [CrossRef]
- De Bhailis, Á.M.; Kalra, P.A. Hypertension and the Kidneys. Br. J. Hosp. Med. 2022, 83, 1–11. [CrossRef]
- Balzer, M.S.; Rohacs, T.; Susztak, K. How Many Cell Types Are in the Kidney and What Do They Do? Annu. Rev. Physiol. 2022, 84, 507–531. [CrossRef]
- Piątkowska, E.; Kopeć, A.; Bieżanowska-Kopeć, R.; Pysz, M.; Kapusta-Duch, J.; Koronowicz, A.A.; et al. The Impact of Carrot Enriched in Iodine Through Soil Fertilization on Iodine Concentration and Selected Biochemical Parameters in Wistar Rats. PLoS ONE 2016, 11, e0152680. [CrossRef]
- Kopeć, A.; Piątkowska, E.; Bieżanowska-Kopeć, R.; Pysz, M.; Koronowicz, A.; Kapusta-Duch, J.; et al. Effect of Lettuce Biofortified with Iodine by Soil Fertilization on Iodine Concentration in Various Tissues and Selected Biochemical Parameters in Serum of Wistar Rats. J. Funct. Foods 2015, 14, 479–486. [CrossRef]
- Hou, X.; Chai, C.; Qian, Q.; Li, C.; Chen, Q. Determination of Bromine and Iodine in Normal Tissues from Beijing Healthy Adults. Biol. Trace Elem. Res. 1997, 56, 225–230. [CrossRef]
- Fordyce, F.M.; Stewart, A.G.; Ge, X.; Jiang, J.Y.; Cave, M. Environmental Controls in IDD: A Case Study in the Xinjiang Province of China. Sci. Total Environ. 2003, 293, 201–215.
- Weng, H.-X.; Yan, A.-L.; Hong, C.-L.; Qin, Y.-C.; Pan, L.; Xie, L.-L. Biogeochemical Transfer and Dynamics of Iodine in a Soil-Plant System. Environ. Geochem. Health 2009, 31, 401–411. [CrossRef]
- Waśniowska, J.; Leszczyńska, T.; Kopeć, A.; Piątkowska, E.; Smoleń, S.; Krzemińska, J.; et al. 7-Diiodo-8-Quinolinol: The Influence of Heat Treatment on Iodine Level, Macronutrient Composition, and Antioxidant Content. Molecules 2023, 28, 3988.
- Aviram, M.; Fuhrman, B. Wine Flavonoids Protect Against LDL Oxidation and Atherosclerosis. Ann. N. Y. Acad. Sci. 2002, 957, 146–161. [CrossRef]
- Sundaram, G.S.; London, R.; Manimekalai, S.; Nair, P.P.; Goldstein, P. α-Tocopherol and Serum Lipoproteins. Lipids 1981, 16, 223–227. [CrossRef]
- Gertig, H.; Przysławski, J. Bromatologia. Zarys Nauki o Żywności i Żywieniu; PZWL: Warszawa, Poland, 2007; pp. 121–123.
- Noonan, W.P.; Noonan, C. Legal Requirements for “Functional Foods” Claims. Toxicol. Lett. 2004, 150, 19–24. [CrossRef]
- Piątkowska, E.; Kopeć, A.; Leszczyńska, T. Antocyjany—Charakterystyka, Występowanie i Oddziaływanie na Organizm Człowieka. Żywność Nauka Technologia Jakość 2011, 18, 22–35.
- Użarowska, M.; Surman, M.; Janik, M. Dwie Twarze Cholesterolu: Znaczenie Fizjologiczne i Udział w Patogenezie Wybranych Schorzeń. Kosmos 2018, 67, 375–390.
- Mohammadi, N.; Farrell, M.; O’Sullivan, L.; Langan, A.; Franchin, M.; Azevedo, L.; et al. Effectiveness of Anthocyanin-Containing Foods and Nutraceuticals in Mitigating Oxidative Stress, Inflammation, and Cardiovascular Health-Related Biomarkers: A Systematic Review of Animal and Human Interventions. Food Funct. 2024, 15, 3274–3299. [CrossRef]
- Herlina, F.; Hayati, F.; Wijaya, D.P.; Belinda, R. Antihyperlipidemia Activity of Ethyl Acetate Fraction from Melinjo (Gnetum gnemon Linn.) Leaf in White Male Wistar Rats Induced by Propylthiouracil. Molecules 2024, 29, 3748.
- Bowen-Forbes, C.; Armstrong, E.; Moses, A.; Fahlman, R.; Koosha, H.; Yager, J.Y. Broccoli, Kale, and Radish Sprouts: Key Phytochemical Constituents and DPPH Free Radical Scavenging Activity. Molecules 2023, 28, 4266. [CrossRef]
- Ruhee, R.T.; Ma, S.; Suzuki, K. Protective Effects of Sulforaphane on Exercise-Induced Organ Damage via Inducing Antioxidant Defense Responses. Antioxidants 2020, 9, 136. [CrossRef]
- El-Shahat, W.; El-Adl, M.; Hamed, M.; El-Saedy, Y. The Protective Effect of Sulforaphane in Rats Fed on High Cholesterol High Fructose Diets. Mansoura Vet. Med. J. 2020, 21, 85–90.
- Chen, X. Protective Effects of Quercetin on Liver Injury Induced by Ethanol. Pharmacogn. Mag. 2010, 6, 135–141.
- Alkandahri, M.Y.; Pamungkas, B.T.; Oktoba, Z.; Shafirany, M.Z.; Sulastri, L.; Arfania, M.; et al. Hepatoprotective Effect of Kaempferol: A Review of the Dietary Sources, Bioavailability, Mechanisms of Action, and Safety. Adv. Pharmacol. Pharm. Sci. 2023, 2023, 1387665. [CrossRef]
- Gao, T.; Shi, R.; Qi, T.; Yin, H.; Mei, L.; Han, X.; et al. A Comparative Study on the Effects of Excess Iodine and Herbs with Excess Iodine on Thyroid Oxidative Stress in Iodine-Deficient Rats. Biol. Trace Elem. Res. 2014, 157, 130–137. [CrossRef]
- Fahey, J.W.; Zhang, Y.; Talalay, P. Broccoli Sprouts: An Exceptionally Rich Source of Inducers of Enzymes That Protect Against Chemical Carcinogens. Proc. Natl. Acad. Sci. USA 1997, 94, 10367–10372. [CrossRef]
- Abel, E.L.; Boulware, S.; Fields, T.; McIvor, E.; Powell, K.L.; DiGiovanni, J.; et al. Sulforaphane Induces Phase II Detoxication Enzymes in Mouse Skin and Prevents Mutagenesis Induced by a Mustard Gas Analog. Toxicol. Appl. Pharmacol. 2013, 266, 439–442. [CrossRef]
- Vitek, L.; Hinds, T.D., Jr.; Stec, D.E.; Tiribelli, C. The Physiology of Bilirubin: Health and Disease Equilibrium. Trends Mol. Med. 2023, 29, 315–328. [CrossRef]
- Zhao, J.; Su, Y.; Zhang, J.-A.; Fang, M.; Liu, X.; Jia, X.; et al. Inverse Association Between Iodine Status and Prevalence of Metabolic Syndrome: A Cross-Sectional Population-Based Study in a Chinese Moderate Iodine Intake Area. Diabetes Metab. Syndr. Obes. 2021, 14, 3691–3701.
- Zhang, Y.; Chen, S.; Yuan, M.; Xu, Y.; Xu, H. Gout and Diet: A Comprehensive Review of Mechanisms and Management. Nutrients 2022, 14, 3525. [CrossRef]
- Kumata, H.; Wakui, K.; Suzuki, H.; Sugawara, T.; Lim, I. Glutathione Reductase Activity in Serum and Liver Tissue of Human and Rat with Hepatic Damage. Tohoku J. Exp. Med. 1975, 116, 127–132. [CrossRef]
- Bastani, A.; Rajabi, S.; Daliran, A.; Saadat, H.; Karimi-Busheri, F. Oxidant and Antioxidant Status in Coronary Artery Disease. Biomed. Rep. 2018, 9, 327–332. [CrossRef]
- Vairetti, M.; Di Pasqua, L.G.; Cagna, M.; Richelmi, P.; Ferrigno, A.; Berardo, C. Changes in Glutathione Content in Liver Diseases: An Update. Antioxidants 2021, 10, 364. [CrossRef]
- Socha, K.; Klimiuk, K.; Naliwajko, S.K.; Soroczyńska, J.; Puścion-Jakubik, A.; Markiewicz-Żukowska, R.; et al. Dietary Habits, Selenium, Copper, Zinc and Total Antioxidant Status in Serum in Relation to Cognitive Functions of Patients with Alzheimer’s Disease. Nutrients 2021, 13, 287. [CrossRef]
- Hussein, A.E.-A.M.; Abbas, A.M.; El Wakil, G.A.; Elsamanoudy, A.Z.; El Aziz, A.A. Effect of Chronic Excess Iodine Intake on Thyroid Function and Oxidative Stress in Hypothyroid Rats. Can. J. Physiol. Pharmacol. 2012, 90, 617–625. [CrossRef]
- Liang, X. Thyroid Function Alterations Attributed to High Iodide Supplementation in Maternal Rats and Their Offspring. J. Trace Elem. Med. Biol. 2018, 47, 89–97. [CrossRef]
- Galanty, A.; Grudzińska, M.; Paździora, W.; Służały, P.; Paśko, P. Do Brassica Vegetables Affect Thyroid Function? — A Comprehensive Systematic Review. Int. J. Mol. Sci. 2024, 25, 3988. [CrossRef]
- Katz, E. Indole-3-Carbinol: A Plant Hormone Combatting Cancer. Biol. Chem. 2018, 100, 34–41.
- NCBI. DIO2 Iodothyronine Deiodinase 2 [Homo sapiens (Human)]. Available online: https://www.ncbi.nlm.nih.gov/gene/1734 (accessed on 4 December 2024).
- Lavado-Autric, R.; Calvo, R.M.; de Mena, R.M.; de Escobar, G.M.; Obregon, M.J. Deiodinase Activities in Thyroids and Tissues of Iodine-Deficient Female Rats. Endocrinology 2012, 154, 529–536. [CrossRef]
- Reeves, P.G. Components of the AIN-93 Diets as Improvements in the AIN-76A Diet. J. Nutr. 1997, 127, 838S–841S. [CrossRef]
- Krzemińska, J.; Piątkowska, E.; Kopeć, A.; Smoleń, S.; Leszczyńska, T.; Koronowicz, A. Iodine Bioavailability and Biochemical Effects of Brassica oleracea var. sabellica L. Biofortified with 8-Hydroxy-7-Iodo-5-Quinolinesulfonic Acid in Wistar Rats. Nutrients 2024, 16, 213578. [CrossRef]
- Friedewald, W.T.; Levy, R.I.; Fredrickson, D.S. Estimation of the Concentration of Low-Density Lipoprotein Cholesterol in Plasma, Without Use of the Preparative Ultracentrifuge. Clin. Chem. 1972, 18, 499–502. [CrossRef]
- Ohkawa, H.; Ohishi, N.; Yagi, K. Assay for Lipid Peroxides in Animal Tissues by Thiobarbituric Acid Reaction. Anal. Biochem. 1979, 95, 351–358. [CrossRef]
Figure 1.
Digital PCR (dPCR) analysis of the expression levels of thyroid-related genes (Tpo, Slc5a5, Dio1, Dio2) in experimental rat groups.
Figure 1.
Digital PCR (dPCR) analysis of the expression levels of thyroid-related genes (Tpo, Slc5a5, Dio1, Dio2) in experimental rat groups.
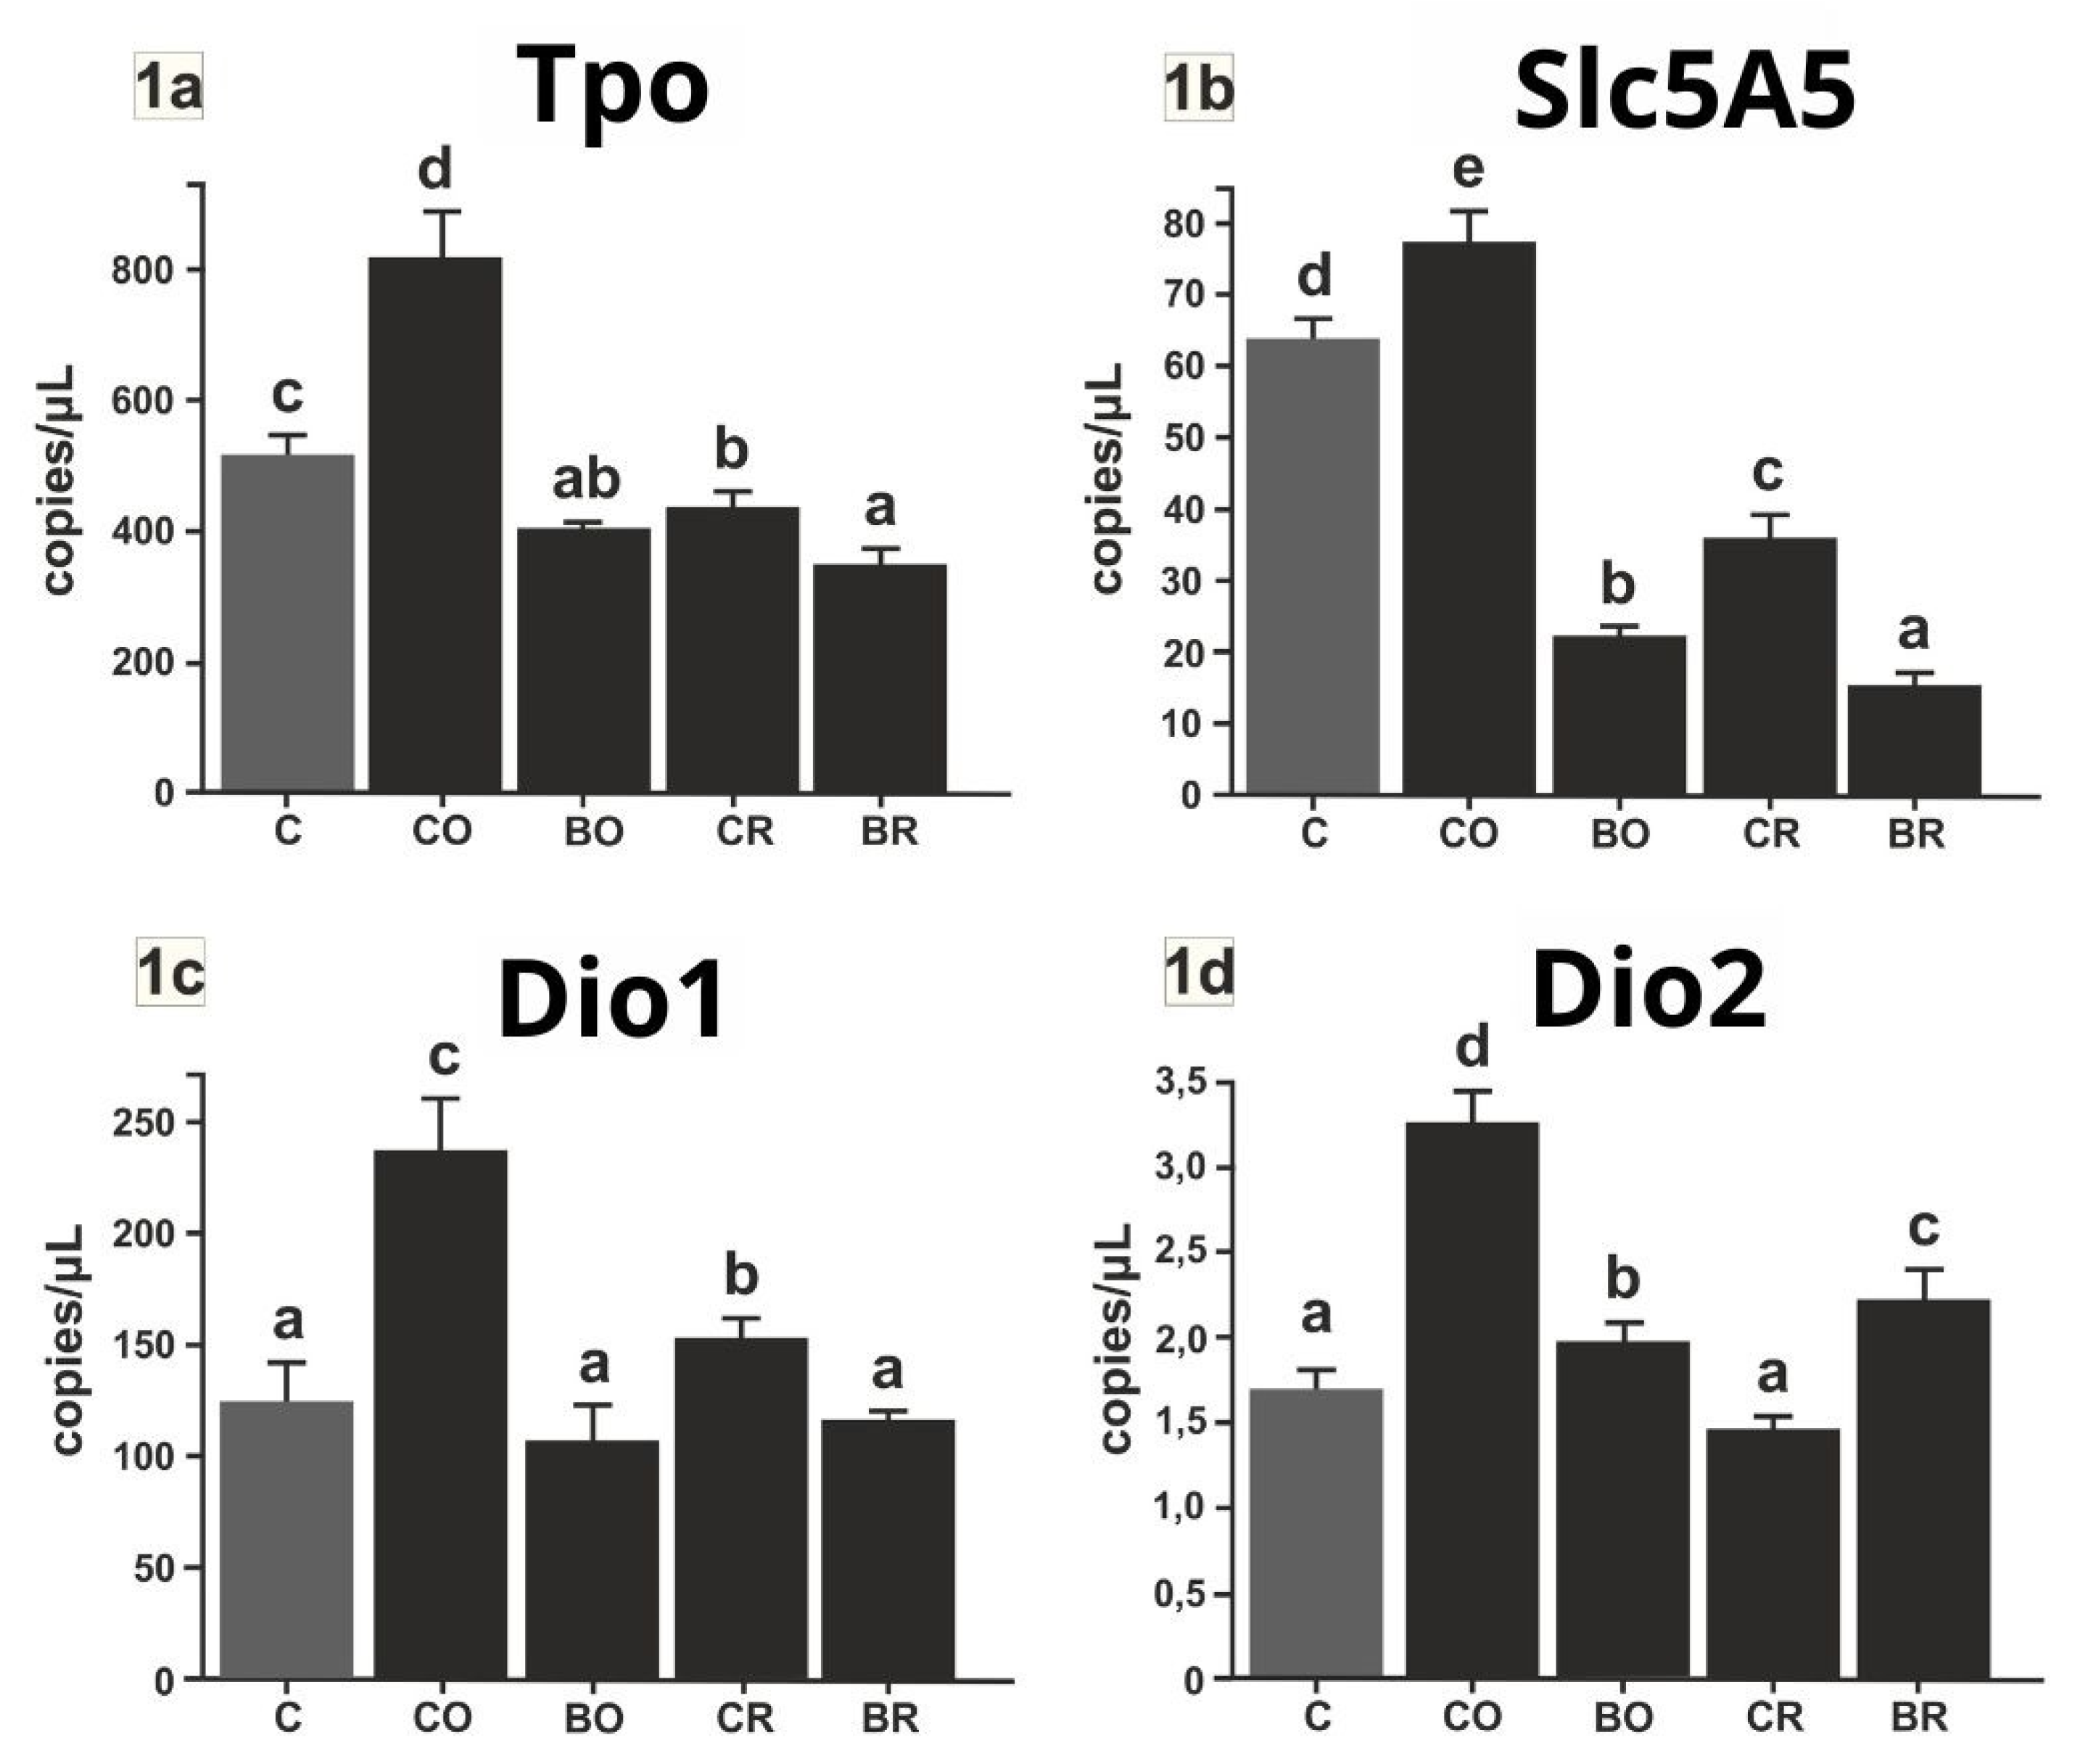

Table 1.
Iodine content in kidney and liver of experimental rats.
| Iodine content | C | CO | BO | CR | BR |
|---|---|---|---|---|---|
| liver mg/kg d.m |
0.12a±0.01 | 0.11a ±0.01 | 0.15b±0.00 | 0.11a±0.00 | 0.14b±0.01 |
| kidney mg/kg d.m |
0.14b±0.00 | 0.13ab±0,01 | 0.19c±0.01 | 0.11a±0.01 | 0.17c±0.01 |
1 Type of diet fed to rats from which tissues were collected: C control diet (AIN-93G), CO diet containing control curly kale ‘Oldenbor F1’ without biofortified, BO diet containing biofortified curly kale ‘Oldenbor F1’, CR diet containing control curly kale ‘Redbor F1’, BR diet containing biofortified curly kale ‘Redbor F1’. ‘Oldenbor F1’, ‘Redbor F1’ . Values in rows with different letters (a, b, c) are significantly different, P≤0.05 (One-way analysis (ANOVA), standard error (n = 0.01).
Table 2.
Selected biochemical parameters in blood serum of experimental rats.
| C | CO | BO | CR | BR | ||
|---|---|---|---|---|---|---|
| TC mmol/L | 3.01b±0.19 | 2.81ab±0.16 | 2.61ab±0.19 | 2.61ab±0.14 | 2.48a±0.11 | |
| LDL + VLDL mmol/L | 1.12a±0.13 | 1.07a±0.12 | 1.06a±0.13 | 1.07a±0.08 | 0.93a±0.11 | |
| TG mg/Dl | 113.75b±16.53 | 122.92b±16.99 | 103.90ab±12.36 | 83.44ab±12.56 | 64.72a±6.44 | |
| HDL mmol/L | 1.89b±0.06 | 1.78ab±0.11 | 1.56a±0.09 | 1.54a±0.10 | 1.57a±0.11 | |
| ALT U/L | 10.13b±3.02 | 8.20b±1.00 | 2.64a±0.27 | 3.96a±0.43 | 2.62a±0.26 | |
| AST U/L | 12.18b±2.18 | 8.00ab±3.00 | 8.95ab±0.60 | 8.97ab±0.87 | 4.74a±0.55 | |
| TBARS nmol/mL | 554.52b±9.67 | 535.31ab±31.40 | 518.56ab±27.46 | 474.93a±22.34 | 469.96a±15.85 | |
| BIL TOTAL mg/dL | 0.60c±0.13a | 0.19ab±0.04 | 0.14a±0.04 | 0.38b±0.09 | 0.22ab ±0.05 | |
| BIL DIRECT mg/dL | 1.34ab±0.24 | 1.50ab±0.43 | 0.62a±0.19 | 0.80a±0.28 | 1.89b±0.28 | |
| UA mg/dL | 2.80b±0.37 | 2.23ab±0.41 | 1.95ab±0.17 | 1.89ab±0.29 | 1.72a±0.26 | |
| GR U/L | 375.72a±72.74 | 348.31a±61.69 | 391.91a±43.02 | 378.96a±52.54 | 331.12a±50.32 | |
| TAS mmol/L | 0.88a±0.07 | 0.86a±0.03 | 0.92a±0.03 | 0.98a±0.03 | 0.95a±0.04 | |
| T3 ng/mL | 3.81ab±0.08 | 3.92b±0.06 | 3.75ab±0.06 | 3.68a±0.04 | 3.85ab±0.02 | |
| T4 ng/mL | 2.75a±0.22 | 2.87a±0.17 | 2.26a±0.25 | 2.59a±0.42 | 2.48a±0.20 | |
| TSH ng/mL | 2.18b±0.06 | 2.02a±0.04 | 2.00a±0.04 | 2.10ab±0.05 | 2.09ab±0.05 | |
2 Type of diet the rats were fed: C control diet (AIN-93G), CO diet containing control curly kale ‘Oldenbor F1’ without biofortified, BO diet containing biofortified curly kale ‘Oldenbor F1’, CR diet containing control curly kale ‘Redbor F1’, BR diet containing biofortified curly kale ‘Redbor F1’. Values in rows with different letters (a, b, c) are significantly different, P≤0.05 (One-way analysis (ANOVA), standard error (n =8).
Disclaimer/Publisher’s Note: The statements, opinions and data contained in all publications are solely those of the individual author(s) and contributor(s) and not of MDPI and/or the editor(s). MDPI and/or the editor(s) disclaim responsibility for any injury to people or property resulting from any ideas, methods, instructions or products referred to in the content. |
© 2024 by the authors. Licensee MDPI, Basel, Switzerland. This article is an open access article distributed under the terms and conditions of the Creative Commons Attribution (CC BY) license (http://creativecommons.org/licenses/by/4.0/).
Copyright: This open access article is published under a Creative Commons CC BY 4.0 license, which permit the free download, distribution, and reuse, provided that the author and preprint are cited in any reuse.


