
Submitted:
19 November 2025
Posted:
20 November 2025
You are already at the latest version
Preprints on COVID-19 and SARS-CoV-2
Abstract
Memory B cells (Bmem) facilitate the generation of renewed and rapid antigen-specific antibody responses long after the initial antigen exposure, at a time when circulating serum antibodies may have declined. As the generation and/or recruitment of Bmem is at the core of most vaccination strategies, the assessment of antigen-specific Bmem is highly informative for forecasting and profiling the elicited B cell immune response. The two prevalent techniques used to detect antigen-specific Bmem cells at single cell resolution are probe-based flow cytometry and B cell ImmunoSpot, while the measurement of B cell-derived antibodies in culture supernatants of stimulated B cells offers a semi-quantitative alternative. To the best of our knowledge, a direct side-by-side comparison of these test systems has not yet been reported. Hence, in a blinded fashion, we compared these three test systems in parallel, aiming to detect SARS-CoV-2 Spike protein- (S-antigen) specific IgG+ Bmem in peripheral blood mononuclear cells (PBMC) samples obtained from well defined cohorts comprising: pre-COVID era “naïve” individuals (negative controls), individuals shortly after recovery from a PCR-verified SARS-CoV-2 infection (positive controls), and a cohort of donor PBMC isolated in 2024 (the experimental group). Our results demonstrate that all three assays are suited for the detection of specific Bmem in antigen-primed individuals when such Bmem occur in the mid- to high frequency range; strengths and weaknesses of the three test systems are discussed.
Keywords:
SARS-CoV-2
; ELISPOT
; FluoroSpot
; ImmunoSpot
; memory B cell measurement
; probebased flow cytometry
; antibody
; ELISA
; immune monitoring
1. Introduction
Immune monitoring aims to measure whether an immune response has been engaged, its quality and magnitude, as well as to further understand the mechanisms involved. Such is required for optimizing diagnostic, prognostic, and therapeutic management of any immune-mediated conditions, including post-infection- or vaccine- induced immunity against microorganisms, allergic and hypersensitivity reactions, the rejection of transplants, elimination of genetically-modified and cancerous cells, and a multitude of autoimmune diseases [1,2,3,4].
Measurements of specific serum antibodies (produced by the plasma cell progeny of B cells) remains the prevalent means of immune diagnostics. However, antibodies in circulation are just one effector arm of the adaptive immune system alongside that mediated by T cells. As antibodies often either do not even play the central role in the immune reaction of interest (e.g., against intracellular pathogens, cancerous cells, and in several autoimmune diseases), or are just one of the contributing defense mechanisms (e.g., immunity to most infectious agents); recently, increasing efforts have been invested into improving T cell immune diagnostics [5,6,7,8,9,10,11,12]. Moreover, it has become clear in recent years that serum antibodies often do not even provide sufficient insights into B cell-mediated humoral defense [13,14].
During immune responses, B cells clonally expand and differentiate either into antibody-producing plasma cells or Bmem (reviewed in [15,16]). The instructive signals for B cell maturation into either of these sublineages are different, and so can be the long-term fate of the two [17]. While both cell types are potentially long-lived, plasma cells’ survival depends on competition for limited niches in the bone marrow whereas Bmem do not have such limitations [18,19]. Moreover, with a half-life of approximately 3 weeks, serum antibody molecules are relatively short-lived in vivo and therefore their continued presence depends on constant replenishment by plasma cells [20,21]. The recent COVID-19 pandemic and mRNA vaccination efforts revealed how fast serum antibody levels can decline [22,23,24,25].
Secreted antibodies and Bmem also have fundamentally different roles in contributing to host defense [17,19]. Existing serum antibodies provide the first line of protection, enabling, by instant binding to antigen, its elimination and the prevention of (re-) infection. When this “first wall of humoral immunity” is insufficient, it is up to Bmem to provide “the second wall” by re-engaging in a secondary-type immune response that will give rise to terminally differentiated plasma cells (and therefore antibodies) and more Bmem [15,16,17]. While Bmem cannot prevent (re-)infection, their somewhat delayed but vigorous engagement can still critically contribute to host defense through curtailing pathogen dissemination and aiding in its clearance. Measuring serum antibodies, therefore, provides only insights into a transient and frequently rapidly fading memory of past immune responses, whereas monitoring of Bmem permits the prediction of the host’s potential to generate a secondary-type antibody response (reviewed in [26].
Monitoring antigen-specific Bmem is challenging because these cells represent, even after the strongest of immune responses, only a small fraction of all B cells recirculating in the blood, that is, in general, they occur in low to very low frequencies among peripheral blood mononuclear cells (PBMC) [14,27,28]. Although detecting antigen-specific Bmem is clearly a challenge for any technology, several methods have emerged as candidates to measure this fundamental immune parameter [29,30]. The classic approaches of growing individual B cell clones/hybrids are limited by the high labor requirements and low throughput [31]. Single cell-paired IgH/IgL sequencing is a new approach, but it is reliable only if the antibodies are recombinantly expressed and tested for their actual antigen binding properties (as only a fraction of the B cells identified may actually be antigen specific) - an effort again too demanding for comprehensive immune monitoring on sizeable donor cohorts [32]. In this communication, we compared two cellular methods of Bmem detection that are scalable and thus have promise to be suitable for the immune monitoring routine. One is staining antigen-specific B cells with fluorochrome-labelled antigen probes followed by their detection via flow cytometric analysis [33]. The other one is ELISPOT/FluoroSpot (collectively called ImmunoSpot) [26]. These two single cell analysis-based methods were compared to the detection of specific antibodies in supernatants of polyclonally-stimulated PBMC [34]. While each of these assays has been used for Bmem detection independently, a systematic side-by-side comparison of their respective lower limits of detection (LLoD) and diagnostic specificity has not been published so far. The data presented here were generated to fill this gap and highlight the strengths and weaknesses of the respective techniques in the context of detecting underlying Bmem reactivity for the SARS-CoV-2 Spike protein (S-antigen).
2. Materials and Methods
2.1. Human Paticipants, as Well as to Further Understanding the Mechanisms Involved
Peripheral blood mononuclear cells (PBMC) originating from CTL’s ePBMC® library (CTL, Shaker Heights, OH, USA ) were obtained from IRB-consented healthy adults by leukapheresis at FDA-registered collection centers and then were sold to CTL identifying donors by code only while concealing the subjects’ identities. PBMC were subsequently cryopreserved according to previously described protocols [35] and were stored in liquid nitrogen for long-term storage until testing. The PBMC samples (n = 36) were shipped to Northumbria University in a liquid nitrogen cryoshipper in preconfigured storage boxes and could only be identified by the experimenting lab using the unique CTL identifying code to maintain blinding of the experimenter. Following receipt of the cryopreserved PBMC samples, they were immediately transferred into a liquid nitrogen cryostorage tank until testing.
The PBMC samples detailed in this study belonged to three separate cohorts (Supplementary Table S1). The pre-COVID-19 cohort comprised (n = 12) PBMC samples that were cryopreserved before the 1st of November 2019 and originate from subjects inferred to be immunologically naïve to the SARS-CoV-2 virus since the first case of SARS-CoV-2 infection in the United States was not reported until January 2020 [36]. The convalescent cohort comprised (n = 12) of PBMC samples that were collected from April – October 2020 from subjects that recently recovered from a PCR-verified SARS-CoV-2 infection and prior to the availability of COVID-19 vaccines. Lastly, (n = 12) PBMC samples collected in the year 2024, at which point the majority of the general population in the United States had either previously received one or more COVID-19 vaccine inoculations and/or were infected with the SARS-CoV-2 virus and hence would be expected to have generated immune memory to S-antigen, comprised the post-COVID 2024 cohort. Notably, all PBMC were tested in a blinded fashion in which the identity of the individual samples and which cohort they belonged to was unknown to the experimenting lab at the time of testing.
2.2. Recombinant Proteins
A full-length SARS-CoV-2 Spike (S-antigen) protein representing the Wuhan-Hu-1 strain with a genetically encoded Avi-tag sequence to ensure site-specific biotinylation was purchased from Sino Biological (Beijing, China) and used to generate tetrameric antigen probe complexes for the flow cytometry experiments. Alternatively, for ImmunoSpot assays an analogous S-antigen protein with a genetically encoded C-terminal histidine (His) tag [37] was acquired from the Center for Vaccines and Immunology (CVI) (University of Georgia, Athens, GA, USA).
2.3. Polyclonal B Cell Stimulation
Cryopreserved PBMC were thawed according to previously described methods [35] and then resuspended in complete (c) RPMI medium composed of RPMI 1640 (Gibco, Thermo Fisher Scientific, Paisley, UK) supplemented with with10% fetal bovine serum,100 U/mL penicillin, 100 U/mL streptomycin, 2 mM L-Glutamine, 1mM sodium pyruvate, 8 mM HEPES (Gibco), and 50 µM β-mercaptoethanol (all from Gibco). Subsequently, 5 × 10⁶ PBMC were subjected to in vitro polyclonal stimulation in 6-well plates at a final density of 2 × 10⁶ cells/mL in cRPMI supplemented with B-Poly-S ™ (CTL) comprising the TLR7/8 agonist R848 and recombinant human interleukin-2. Culture plates were incubated at 37°C, 5% CO2 for 5-days during which time memory B cells (Bmem) underwent proliferation and terminal differentiation into antibody-secreting cells (ASCs). After the 5-days of in vitro culture, the polyclonally-stimulated PBMC were harvested, counted and then plated into B cell ImmunoSpot® assays as detailed below. Alternatively, an independent culture of 4 × 10⁶ PBMC was setup under identical conditions (with B-Poly-S) and the antibody-containing supernatants were collected after 11 days for testing in ELISA for S-antigen-specific IgG.
2.4. ELISA
Detection of S-antigen-specific IgG in plasma samples was performed according to previously described methods with minor modifications [14]. Briefly, ELISA plates (Immulon® 4HBX, flat-bottom, Thermo Fisher Scientific) were coated with 80 μL/well of S-antigen at 2 μg/mL overnight at 4oC. The next day, plates were decanted and blocked with ELISA blocking buffer containing 2% (w/v) bovine serum albumin (BSA) (Sigma-Aldrich) in PBS with 0.1% (v/v) Tween20 for 1 hour at room temperature. After blocking, serially diluted plasma samples were added and incubated overnight at 4oC. The following day, plates were washed with PBS and horseradish peroxidase (HRP)-conjugated anti-human IgG detection reagent (from CTL) was added to the plates, and incubated for 1 hour at room temperature. After washing plates with PBS, 100 µL/well of TMB chromogen solution (Thermo Fisher Scientific) was added to develop the assay. Conversion of the TMB substrate was terminated by the addition of 100 µL/well of 2M HCl, and the optical density was measured at 450 nm using a Spectra Max 190 plate reader (Molecular Devices). Alternatively, for measurement of S-antigen-specific IgG in conditioned culture supernatants, ELISA plates (Nunc Maxisorp, flat-bottomed, Thermo Fisher Scientific) were coated with 80 μL/well of S-antigen at 2 μg/mL or decreasing quantities of purified IgG reference standard (Athens Research and Technology, Athens, GA, USA) starting at 200ng/mL (both in PBS) overnight at 4oC. The next day, plates were washed with PBS containing 0.05% (v/v) Tween-20 (PBS-T) and blocked with 150 µL of 5% (w/v) non-fat milk powder in PBS-T, for 1 hour at room temperature. The plates were washed again before the addition of antibody-containing culture supernatant samples at three-fold dilutions ranging from 1:5 to 1:1215 and plates were incubated for 90 minutes at room temperature. Plates were then washed three times before the addition of anti-IgG-HRP conjugated antibody (Southern Biotech) and incubation for 90 minutes at room temperature. Plates were next washed 3 times before the addition of 100 µL/well of OPD substrate (Sigma-Aldrich, St. Louis, MO, USA). Plates were developed for 10min at room temperature, resulting in a colour change, before the reaction was stopped by the addition of 50 μL/well of 2M H2SO4 stop solution. The absorbance was read at 490nm using a Varioskan lux (Thermo Scientific) with the SkanIt Software (version 7.1). Notably, the titrated quantities of IgG reference standard coated directly into duplicate wells of each ELISA plate enabled interpolation of S-antigen-specific IgG binding titers into IgG equivalents [14,38] using SpotStat Version 1.6.6.0 software (CTL).
2.5. B Cell ELISPOT Assays
ELISPOT plates were coated according to previously described methods [39]. Briefly, for enumeration of pan IgG+ ASC irrespective of antigen specificity, ELISPOT plates were coated with anti-Igκ/λ capture antibody diluted in Diluent A contained in the human IgG Single-Color Enzymatic ImmunoSpot® kit (from CTL) according to the manufacturer’s instructions. Alternatively, for enumeration of SARS-CoV-2 S-antigen-specific IgG+ ASC using the affinity capture coating method [40], ELISPOT plates were first coated with purified anti-His antibody at 10 µg/mL in Diluent A (provided in CTL’s affinity coating kits) overnight at 4oC. The following day, ELISPOT plates were washed once with PBS and then coated overnight at 4oC with the His-tag labeled recombinant S-antigen protein at 10 µg/mL in Diluent A. After overnight incubation, ELISPOT plates were washed again with PBS and then blocked with cRPMI medium for 1 h at 37 °C. The polyclonally-stimulated PBMC samples were harvested from the 6-well culture plates and washed with PBS prior to counting using acridine orange and propidium iodide (AO/PI) (Biotium, Fremont, CA, USA) using a CellDropTM cell counter (DeNovix, Cambridge, UK). Following a centrifugation step, donor PBMC samples were resuspended in cRPMI medium at 5 × 10⁶ live cells/mL for measuring S-antigen-specific IgG+ ASC or 2 × 10⁵ live cells/mL for measuring pan IgG+ ASC. The PBMC were serially diluted 2-fold in round-bottom 96-well tissue culture plates (Sigma-Aldrich, St. Louis, MO, USA) and then immediately transferred into ELISPOT plates. Following PBMC plating, ELISPOT plates were incubated for 4–6 hours at 37 °C, 5% CO2. Plate-bound spot-forming units (SFUs), each representing the secretory footprint of a single IgG+ ASC, were visualized using the detection reagents provided in the human IgG Single-Color Enzymatic ImmunoSpot® kit (from CTL) according to the manufacturer’s instructions.
2.6. ImmunoSpot® Image Acquisition and SFU Counting
Plates were air-dried prior to scanning on an ImmunoSpot® S6 Light M2 Analyzer (CTL). Pan- and S-antigen-specific IgG+ SFUs were then enumerated using ImmunoSpot® Single-color Studio Software Version 1.7.35.1 and the B cell ELISPOT-specific IntelliCount™ algorithm for SFU detection [41]. Assay specific minimal size and intensity thresholds were then applied for more precise enumeration of pan- or S-antigen-specific IgG+ SFUs.
2.7. Flow Cytometry Staining Procedure
The antigen probe (biotinylated Spike protein) was initially incubated at 4 oC for 1hr with either SA-PE (1:100) or SA-APC (1:100) at a 4:1 molecular ratio of WH1-S: streptavidin (SA) in PBS. After thawing, PBMC were washed with PBS. The tetrameric complex of probe-SA-PE or probe-SA-APC was incubated at 4 oC for 1hr with 107 PBMC. An additional decoy probe SA-AF647 was added to remove any non-specific staining to SA. The cells were washed with PBS before the addition of 5 μL LIVE/DEADTM fixable dead cell stain (UV Blue, Thermo Fisher Scientific, 1:40) for 20 min, and then washed with Flow buffer (PBS supplemented with 2% fetal calf serum). To avoid nonspecific binding, the samples were incubated with 5 mL Human TruStain FcX™ and 5 mL True-Stain Monocyte BlockerTM (both BioLegend, San Diego, USA) for 10 min.
Our flow panel was designed to be able to phenotype memory B cells (CD19+, CD20+, IgD-negative), whilst gating out T cells (CD3+), monocytes (CD14+) and NK cells (CD56+). All anti-human monoclonal antibodies were purchased pre-conjugated (See Suppl. Table S2, and were titrated for optimum staining performance. Following the blocking step, antibody cocktail #1 (Suppl. Table S2) was incubated with the cells for 30 min. Antibody incubations were performed at room temperature, in the dark. Following another washing step, fixing was performed using 500 mL of 1% PFA (Biolegend) for 20 min. Cells were then washed with Flow buffer and the pellet resuspended in 300 mL flow buffer. Samples were acquired on a 5-laser Aurora spectral flow cytometer (Cytek, Fremont, California, USA).
2.8. Statistical Methods
Statistically significant differences between the pre-COVID 19, convalescent and 2024 PBMC cohorts in the ELISA, ELISPOT or probe-based flow cytometry assays were determined using a one-way ANOVA (Tukey test). Pearson correlation analysis and regressions were also performed and the R2 values, and p-values, are shown in the corresponding figures. All statistical analyses were performed using version 10.4.0 GraphPad Software (La Jolla, California, USA).
3. Results and Discussion
3.1. Rationale and Study Design
Reference PBMC, comprising negative and positive controls, are critical for assay development and the comparison of test systems. In particular, the availability of negative controls is a challenge for immune monitoring as antigens to which humans have verifiably not been exposed to are rare. Therefore, the emergence of SARS-CoV-2 and its appearance in the USA in January of 2020 [36] provided a unique test system for immune assay comparisons. PBMC isolated and cryopreserved in the USA before November 2019 originate from donors who are unequivocally naïve to this virus and serve as perfect negative controls for measuring immune responses targeting SARS-CoV-2 antigens. Therefore, one of the cohorts included in our studies constituted 12 subjects’ PBMC that were cryopreserved before the spread of this virus; designated the “pre-COVID 19” cohort.
Moreover, the initial intense efforts to identify emerging SARS-CoV-2 infections also provided a unique opportunity for immune monitoring. Namely, PCR-positive donors with clinical symptoms of COVID-19 were verifiably exposed to SARS-CoV-2 and hence serve as the ideal positive control group for detecting an immune response directed against SARS-CoV-2 antigens. PBMC collected from 12 subjects with verified SARS-CoV-2 infections during the first wave of the epidemic in 2020 constituted our positive controls, the “convalescent” cohort. Finally, we tested PBMC collected from 12 subjects in 2024 with unknown histories of SARS-CoV-2 antigen exposure (our 2024 cohort). By this time, however, most subjects can be expected to have either been previously infected and/or vaccinated - in either case developing memory B cell (Bmem) and antibodies to the SARS-CoV-2 Spike protein (S-antigen). The results generated when testing plasma from these subjects for S-antigen-specific IgG are shown in Figure 1. Notably, while none of the pre-COVID 19 donors possessed elevated levels of S-antigen-specific IgG, all subjects in the other two cohorts did, albeit at highly variable levels. Did the latter individuals also develop detectable numbers of S-antigen-specific IgG+ Bmem, and if so, which of the three test systems for monitoring Bmem is best suited to reliably detect and quantify them?
The PBMC were cryopreserved following a protocol that permits recovery of fully functional Bmem after the cells are thawed [27,35]. This was verified for all PBMC tested: data showing the post-thaw viability and pan- (total) IgG+ ASC activity irrespective of antigen specificity following polyclonal stimulation are provided in Suppl. Figure S1A and S1B, respectively. As no significant differences in either of these parameters were seen among the PBMC in the three cohorts, we conclude that they all had been cryopreserved to expectations, and therefore any difference in S-antigen-specific Bmem detection in individual PBMC samples is intrinsic to that donor, rather than a consequence of variable success in PBMC cryopreservation.
The design of our Bmem-detection testing strategy, that was carried out blinded to the laboratory experimenter performing the tests at Northumbria University, is shown in Suppl. Figure S2. Specifically, two vials of PBMC from each donor were thawed, from which 10 × 106 PBMC were allocated for S-antigen probe staining since this technique requires more cells compared to the other two techniques [27,34,42]. Additionally, 5 × 10⁶ or 4 × 10⁶ PBMC were subjected to polyclonal stimulation to transition resting Bmem into antibody-secreting cells (ASCs) for testing in ImmunoSpot assays or generation of antibody-conditioned culture supernatants, respectively.
3.2. Comparison of Sensitivity, Specificity, and False Negative Results Using Three Different Techniques for Bmem Detection
Specificity is defined in clinical diagnostics as the proportion of negative test results out of all truly negative samples. High specificity will identify all samples without the condition of interest (in this case generation of Bmem specific for the SARS-CoV-2 S-antigen), that is, excluding false positive results in pre-COVID 19 samples. As seen in Figure 2A-C, this criterion was met for all three Bmem detection systems. It should be noted, however, that to achieve diagnostic sensitivity, in flow cytometry a negative cutoff of 0.03% Spike+ CD19+ IgDneg events was required for the pre-COVID 19 PBMC samples (Suppl. Figure S3A). Consequently, this detection system required a higher cut-off value be established to achieve diagnostic specificity and this could obscure detection of low frequencies of antigen-specific Bmem. In contrast, testing of pre-COVID 19 samples in ImmunoSpot yielded no detectable spot forming units (SFUs), that is secretory footprints originating from individual S-antigen-specific IgG+ Bmem-derived ASCs even when 5 × 10⁵ PBMC were tested per well (Suppl. Figure S3B).
Sensitivity in clinical diagnostics measures the proportion of positive test results out of all truly positive samples. In our case, each Bmem test’s sensitivity was its ability to correctly identify PBMC of donors who had verifiably been exposed to S-antigen in the convalescent cohort (the true positives), while minimizing the number of false negative results in this cohort. Overall, a 100% sensitivity criterion was met by flow cytometry and by ImmunoSpot for all 12 donors in the convalescent cohort (Figure 2A and 2B) and also by ELISA when measuring antibody-conditioned supernatants (Figure 2C). Representative data from ImmunoSpot and antigen probe-based flow cytometry assays, both which provide single cell resolution, are shown in Figure 3. In all three Bmem assays, however (similar to plasma antibody levels detected by ELISA) considerable inter-individual variations of positivity were seen, to be dissected in the following.
3.3. Inter-Bmem Assay Correlations
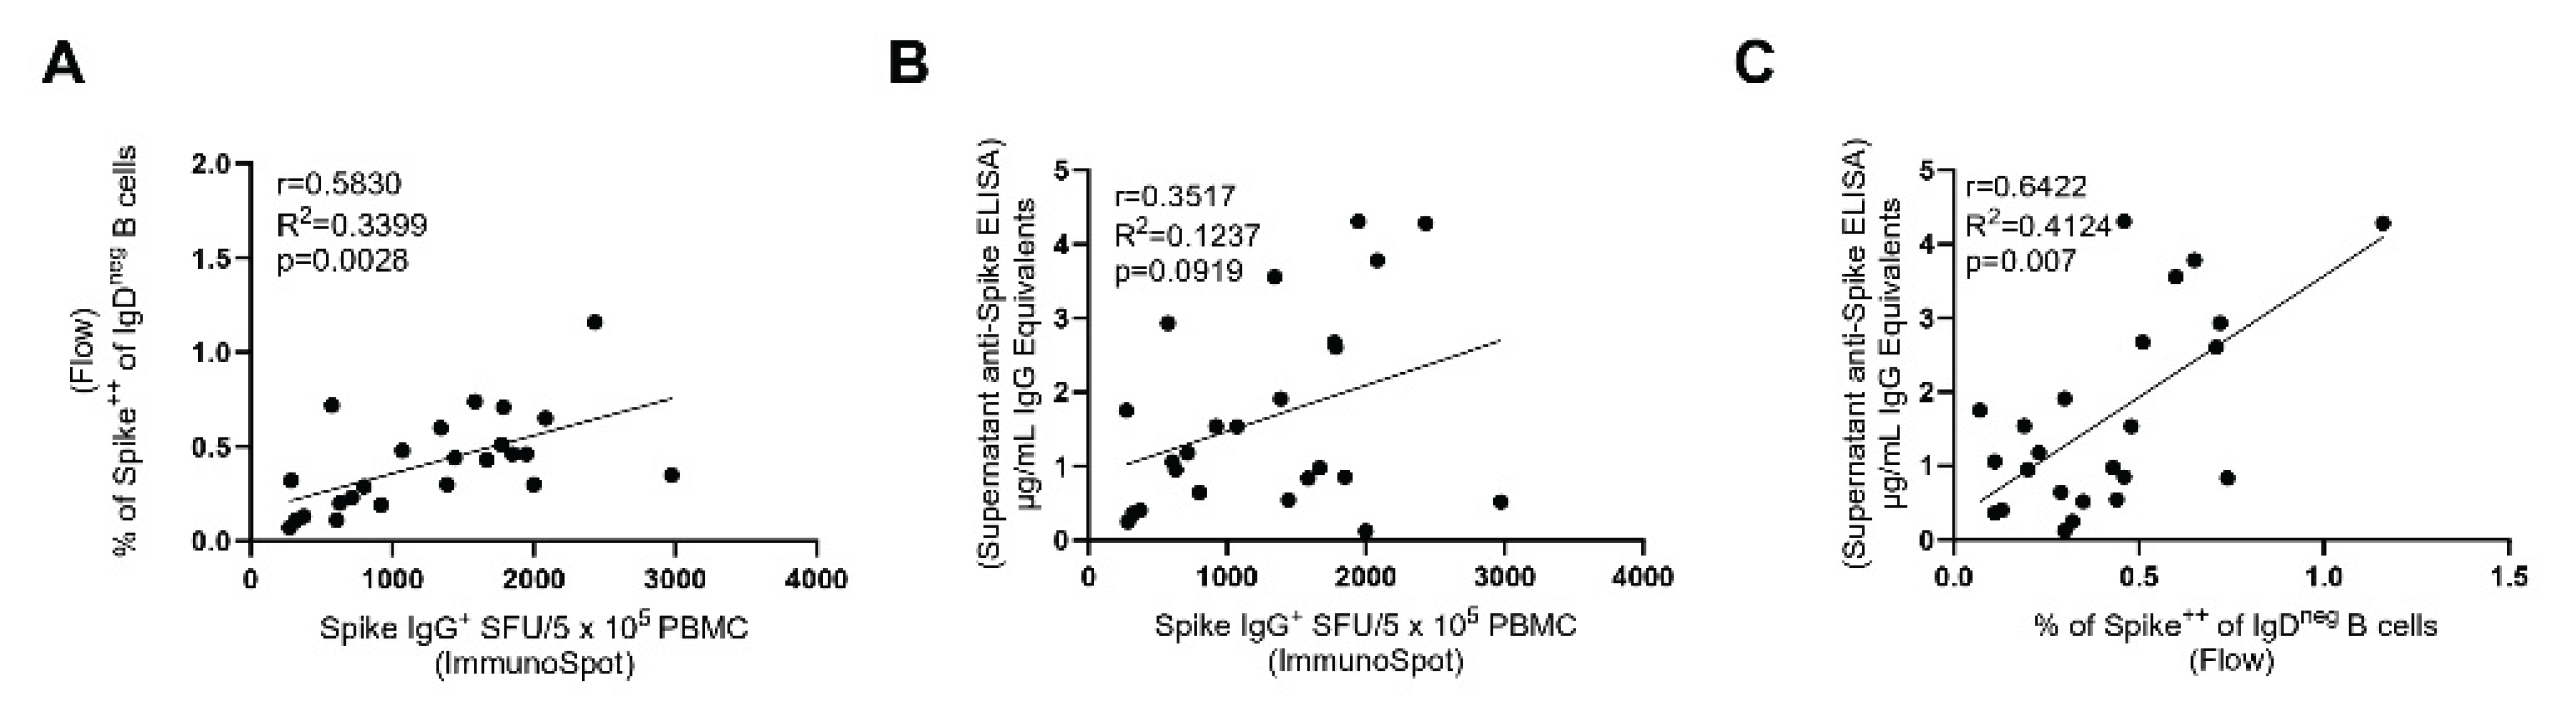
Both antigen probe staining and ImmunoSpot detect individual S-antigen-specific Bmem. However, the two test systems rely on different approaches: in the first, PBMC are stained ex vivo without any prior treatment or culture. For ImmunoSpot the PBMC first need to be polyclonally-stimulated for 5-days to convert resting Bmem (that do not actively secrete antibody) into ASCs whose secretory footprints can be detected (28). For detection of specific antibody reactivity in supernatants from polyclonally-stimulated PBMC, a culture duration of 11 days was found to be optimal [28]. While the magnitude of the positive signal seen within each of these readouts can be expected to depend on the frequency of antigen-specific Bmem present in each test sample, to our knowledge, the extent to which the results provided by each assay qualitatively correlate with each other has not been established. Figure 4A-C shows that the test results obtained using the three approaches correlated with each other (as the pre-COVID 19 samples were all negative, only the convalescent and the 2024 sample cohorts were included in this analysis). While the correlation of the results is not particularly high (as one might expect based on the different means by which Bmem were measured), the three assays were concordant in identifying donors with high, low, and intermediate S-antigen-specific Bmem frequencies.
3.4. Concluding Remarks
A strength of this study is that it leveraged a clearly defined immune monitoring scenario in which naivety vs. exposure to an antigen could be unambiguously verified. There are few antigenic systems for humans to which this scenario applies. Unlike SARS-CoV-2 exposure before the emergence of this virus (and in the meantime no longer even for SARS-CoV-2), most viral infections are endemic to the human population, occur early on in life, and often go clinically undiagnosed. While seropositivity is presently the gold standard in the clinical diagnostic arena for verifying past infections with such viruses, serodiagnostics can also provide false negative data, whereas the presence of antigen-specific Bmem and T cells can reveal prior antigen exposure and the development of immunological memory in seronegative individuals [13,14,43,44,45]. Establishing a naïve vs. primed immune state becomes challenging also with autoantigens, including tumor associated antigens.
One weakness/limitation of this study is that it relied on samples obtained from donors in which the antigen exposure was relatively recent. Consequently, the frequencies of S-antigen-specific Bmem in the test subjects studied were substantially higher than typically measured for other viral antigens (Suppl. Table S3). While our results demonstrate that all three Bmem-detecting test sytems enabled a quantitative (or at least semi-quantitative) assessment of Bmem when the frequency of these cells were in the higher range, at this point it remains an open question which of these assay approaches will be best suited for immune diagnostic when antigen-specific Bmem are present only in the low (and very low) frequency range.
When selecting a Bmem-detecting assay for immune monitoring, additional emphasis may also be placed on the clinically useful information it can provide. For instance, antigen probe staining has the advantage of enabling in-depth phenotypic analysis and positive sorting of antigen probe-binding B cells for downstream sequencing/cloning of B cell receptors. However, this technique has the drawback of an increased cost, technical effort and PBMC sample requirements. Moreover, the immune diagnostic utility of surface phenotyping and genetic repertoire analysis of antigen-specific B cells remains unclear. Furthermore, the high cost of suitable multi-parametric flow cytometry instrumentation, the multitude of staining reagents required, and the personnel expertise required to generate such data also should be considered.
As the only cell type capable of secreting antibodies (immunoglobulins) in the body are B cells, and since IgG is only secreted by Bmem that previously underwent T-helper cell-dependent Ig class switching in vivo, the quantitative (ImmunoSpot) or semi-quantitative (supernatant) measurent of antigen-specific IgG-producing cells provides information on the number of Bmem and their functionality in PBMC without the need for additional phenotypic verification. Furthermore, the simplicity of the ImmunoSpot test procedure, the substantially lower cost of instrumentation and reagents needed, the economic PBMC utilization, and the fully automated image analysis of the assay results are additional arguments favoring this methodology.
Immune monitoring of Bmem is an evolving field and will inevitably improve our understanding of B cell-mediated immune reactions that govern health and disease. The suitability of the different Bmem-detecting test systems, their ease of implementation and the diagnostically relevant information they provide will ultimately influence the preferred method(s) utilized.
Supplementary Materials
The following supporting information can be downloaded at the website of this paper posted on Preprints.org.
Author Contributions
All authors fulfilled the ICMJE recommended criteria for authorship, with their major contributions being as follows: Conceptualization: G.A.K., S.M.T., and P.V.L.; Methodology: G.S., G.A.K. and S.C., Formal analysis: G.S., S.C., and J.T.N; Investigation: G.S., S.C., and S.H.; Data curation: G.S., G.A.K and S.M.T. Writing—original draft preparation: PVL; Writing—review and editing G.A.K., G.S.and S.M.T; Supervision: G.A.K. and S.M.T; Project administration: G.A.K. and S.M.T. All authors have read and agreed to the published version of the manuscript.,This publication serves as part of GS’s doctoral thesis to be submitted to Northumbria University, Newcastle upon Tyne, UK.
Funding
This research was funded by the R&D budget of Cellular Technology Limited (CTL).
Institutional Review Board Statement
PBMC samples from pre- and post-COVID-19-era donors were collected at FDA-registered collection centers from IRB-consented healthy human donors and were sold to CTL identifying donors by code only while concealing the subjects’ identities. PBMC from convalescent COVID-19 donors were obtained either from the American Red Cross (Atlanta, GA, USA), BioIVT (Westbury, NY, USA), or Stem Express (Folsom, CA, USA) with IRB approval and then were sold to CTL identifying donors by code only while concealing the subjects’ identities.
Informed Consent Statement
Not applicable.
Data Availability Statement
The data generated in this study will be made available by the authors, without undue reservation, to any qualified researcher.
Acknowledgments
We thank Dr. Graham Pawelec for editing and proofreading the manuscript. We also want to specifically thank Tibor Baki from CTL and Melissa Sebok, Malachi Wickman, and Jennifer Penfold from the American Red Cross for their help in acquiring PBMC samples.
Conflicts of Interest
P.V.L. is Founder, President, and CEO of Cellular Technology Limited (CTL), a company that specializes in immune monitoring by ImmunoSpot. G.A.K. and J.T.N are employees of CTL. This study was funded by CTL. G.S, S.H. and S.M.T declare no conflict of interest.
Abbreviations
| Bmem | memory B cell(s) |
| PBMC | peripheral blood mononuclear cells |
| LoD | limit of detection |
| ASC | antibody-secreting cell |
| S-antigen | Spike |
References
- Breiteneder H, Peng YQ, Agache I, Diamant Z, Eiwegger T, Fokkens WJ, et al. Biomarkers for diagnosis and prediction of therapy responses in allergic diseases and asthma. Allergy. 2020;75(12):3039-68. [CrossRef]
- Rendeiro AF, Vorkas CK, Krumsiek J, Singh HK, Kapadia SN, Cappelli LV, et al. Metabolic and Immune Markers for Precise Monitoring of COVID-19 Severity and Treatment. Front Immunol. 2021;12:809937. [CrossRef]
- South AM, Grimm PC. Transplant immuno-diagnostics: crossmatch and antigen detection. Pediatr Nephrol. 2016;31(6):897–905. [CrossRef]
- Stylianou G, Kirchenbaum GA, Lehmann PV, Pearce S, Todryk S. Measuring Human Memory B Cells in Autoimmunity Using Enzyme-Linked ImmunoSpot. Biomolecules. 2025;15(5). [CrossRef]
- Bettelli F, Vallerini D, Lagreca I, Barozzi P, Riva G, Nasillo V, et al. Identification and validation of diagnostic cut-offs of the ELISpot assay for the diagnosis of invasive aspergillosis in high-risk patients. PLoS One. 2024;19(7):e0306728. [CrossRef]
- Carreto-Binaghi LE, Nieto-Ponce M, Palencia-Reyes A, Chavez-Dominguez RL, Blancas-Zaragoza J, Franco-Mendoza P, et al. Validation of the Enzyme-Linked ImmunoSpot Analytic Method for the Detection of Human IFN-gamma from Peripheral Blood Mononuclear Cells in Response to the SARS-CoV-2 Spike Protein. Biomolecules. 2024;14(10). [CrossRef]
- Dapporto F, De Tommaso D, Marrocco C, Piu P, Semplici C, Fantoni G, et al. Validation of a double-color ELISpot assay of IFN-gamma and IL-4 production in human peripheral blood mononuclear cells. J Immunol Methods. 2024;524:113588. [CrossRef]
- Jantet-Blaudez F, Ruiz J, Gautheron S, Pagnon A. Evaluation of the viability and functionality of human peripheral blood mononuclear cells cryopreserved up to 2 years in animal-protein-free freezing media compared to the FBS-supplemented reference medium. Front Immunol. 2025;16:1627973. [CrossRef]
- Jerome JR, Wilson KL, Fialho J, Goodchild G, Prakash MD, McLeod C, et al. Optimisation of the cultured ELISpot/Fluorospot technique for the selective investigation of SARS-CoV-2 reactive central memory T cells. Front Immunol. 2025;16:1547220.
- Korber N, Behrends U, Hapfelmeier A, Protzer U, Bauer T. Validation of an IFNgamma/IL2 FluoroSpot assay for clinical trial monitoring. J Transl Med. 2016;14(1):175. [CrossRef]
- Mauthe A, Cedrone E, Villar-Hernandez R, Rusch E, Springer M, Schuster M, et al. IFN-gamma/IL-2 Double-Color FluoroSpot Assay for Monitoring Human Primary T Cell Activation: Validation, Inter-Laboratory Comparison, and Recommendations for Clinical Studies. AAPS J. 2025;27(4):81. [CrossRef]
- Waerlop G, Leroux-Roels G, Pagnon A, Begue S, Salaun B, Janssens M, et al. Proficiency tests to evaluate the impact on assay outcomes of harmonized influenza-specific Intracellular Cytokine Staining (ICS) and IFN-ɣ Enzyme-Linked ImmunoSpot (ELISpot) protocols. J Immunol Methods. 2023;523:113584. [CrossRef]
- Winklmeier S, Eisenhut K, Taskin D, Rubsamen H, Gerhards R, Schneider C, et al. Persistence of functional memory B cells recognizing SARS-CoV-2 variants despite loss of specific IgG. iScience. 2022;25(1):103659. [CrossRef]
- Wolf C, Koppert S, Becza N, Kuerten S, Kirchenbaum GA, Lehmann PV. Antibody Levels Poorly Reflect on the Frequency of Memory B Cells Generated following SARS-CoV-2, Seasonal Influenza, or EBV Infection. Cells. 2022;11(22). [CrossRef]
- Inoue T, Kurosaki T. Memory B cells. Nat Rev Immunol. 2024;24(1):5–17.
- Syeda MZ, Hong T, Huang C, Huang W, Mu Q. B cell memory: from generation to reactivation: a multipronged defense wall against pathogens. Cell Death Discov. 2024;10(1):117. [CrossRef]
- Akkaya M, Kwak K, Pierce SK. B cell memory: building two walls of protection against pathogens. Nat Rev Immunol. 2020;20(4):229–38. [CrossRef]
- Lightman SM, Utley A, Lee KP. Survival of Long-Lived Plasma Cells (LLPC): Piecing Together the Puzzle. Front Immunol. 2019;10:965. [CrossRef]
- Palm AE, Henry C. Remembrance of Things Past: Long-Term B Cell Memory After Infection and Vaccination. Front Immunol. 2019;10:1787. [CrossRef]
- Morell A, Terry WD, Waldmann TA. Metabolic properties of IgG subclasses in man. J Clin Invest. 1970;49(4):673–80. [CrossRef]
- Manz RA, Hauser AE, Hiepe F, Radbruch A. Maintenance of serum antibody levels. Annu Rev Immunol. 2005;23:367–86. [CrossRef]
- Evans JP, Zeng C, Carlin C, Lozanski G, Saif LJ, Oltz EM, et al. Neutralizing antibody responses elicited by SARS-CoV-2 mRNA vaccination wane over time and are boosted by breakthrough infection. Sci Transl Med. 2022;14(637):eabn8057. [CrossRef]
- Jo DH, Minn D, Lim J, Lee KD, Kang YM, Choe KW, et al. Rapidly Declining SARS-CoV-2 Antibody Titers within 4 Months after BNT162b2 Vaccination. Vaccines (Basel). 2021;9(10). [CrossRef]
- Levin EG, Lustig Y, Cohen C, Fluss R, Indenbaum V, Amit S, et al. Waning Immune Humoral Response to BNT162b2 Covid-19 Vaccine over 6 Months. N Engl J Med. 2021;385(24):e84. [CrossRef]
- Seow J, Graham C, Merrick B, Acors S, Pickering S, Steel KJA, et al. Longitudinal observation and decline of neutralizing antibody responses in the three months following SARS-CoV-2 infection in humans. Nat Microbiol. 2020;5(12):1598–607. [CrossRef]
- Kirchenbaum GA, Pawelec G, Lehmann PV. The Importance of Monitoring Antigen-Specific Memory B Cells, and How ImmunoSpot Assays Are Suitable for This Task. Cells. 2025;14(3). [CrossRef]
- Becza N, Yao L, Lehmann PV, Kirchenbaum GA. Optimizing PBMC Cryopreservation and Utilization for ImmunoSpot((R)) Analysis of Antigen-Specific Memory B Cells. Vaccines (Basel). 2025;13(7). [CrossRef]
- Lehmann PV, Karulin AY, Becza N, Yao L, Liu Z, Chepke J, et al. Theoretical and practical considerations for validating antigen-specific B cell ImmunoSpot assays. J Immunol Methods. 2025;537:113817. [CrossRef]
- Boonyaratanakornkit J, Taylor JJ. Techniques to Study Antigen-Specific B Cell Responses. Front Immunol. 2019;10:1694. [CrossRef]
- Bozhkova M, Gardzheva P, Rangelova V, Taskov H, Murdjeva M. Cutting-edge assessment techniques for B cell immune memory: an overview. Biotechnology & Biotechnological Equipment. 2024;38(1):2345119. [CrossRef]
- Smith SA, Crowe JE, Jr. Use of Human Hybridoma Technology To Isolate Human Monoclonal Antibodies. Microbiol Spectr. 2015;3(1):AID-0027–2014.
- Fantin RF, Clark JJ, Cohn H, Jaiswal D, Bozarth B, Rao V, et al. Mapping of human monoclonal antibody responses to XBB.1.5 COVID-19 monovalent vaccines: a B cell analysis. Lancet Microbe. 2025;6(8):101103. [CrossRef]
- Phelps A, Pazos-Castro D, Urselli F, Grydziuszko E, Mann-Delany O, Fang A, et al. Production and use of antigen tetramers to study antigen-specific B cells. Nat Protoc. 2024;19(3):727–51.
- Pinna D, Corti D, Jarrossay D, Sallusto F, Lanzavecchia A. Clonal dissection of the human memory B-cell repertoire following infection and vaccination. Eur J Immunol. 2009;39(5):1260–70. [CrossRef]
- Yao L, Becza N, Maul-Pavicic A, Chepke J, Kirchenbaum GA, Lehmann PV. Four-Color ImmunoSpot((R)) Assays Requiring Only 1–3 mL of Blood Permit Precise Frequency Measurements of Antigen-Specific B Cells-Secreting Immunoglobulins of All Four Classes and Subclasses. Methods Mol Biol. 2024;2768:251–72.
- Holshue ML, DeBolt C, Lindquist S, Lofy KH, Wiesman J, Bruce H, et al. First Case of 2019 Novel Coronavirus in the United States. N Engl J Med. 2020;382(10):929–36.
- Hsieh CL, Goldsmith JA, Schaub JM, DiVenere AM, Kuo HC, Javanmardi K, et al. Structure-based Design of Prefusion-stabilized SARS-CoV-2 Spikes. bioRxiv. 2020.
- Abreu RB, Kirchenbaum GA, Clutter EF, Sautto GA, Ross TM. Preexisting subtype immunodominance shapes memory B cell recall response to influenza vaccination. JCI Insight. 2020;5(1). [CrossRef]
- Yao L, Becza N, Stylianou G, Tary-Lehmann M, Todryk SM, Kirchenbaum GA, et al. SARS-CoV-2 Infection or COVID-19 mRNA Vaccination Elicits Partially Different Spike-Reactive Memory B Cell Responses in Naive Individuals. Vaccines (Basel). 2025;13(9). [CrossRef]
- Koppert S, Wolf C, Becza N, Sautto GA, Franke F, Kuerten S, et al. Affinity Tag Coating Enables Reliable Detection of Antigen-Specific B Cells in Immunospot Assays. Cells. 2021;10(8). [CrossRef]
- Karulin AY, Katona M, Megyesi Z, Kirchenbaum GA, Lehmann PV. Artificial Intelligence-Based Counting Algorithm Enables Accurate and Detailed Analysis of the Broad Spectrum of Spot Morphologies Observed in Antigen-Specific B-Cell ELISPOT and FluoroSpot Assays. Methods Mol Biol. 2024;2768:59–85.
- Weskamm LM, Dahlke C, Addo MM. Flow cytometric protocol to characterize human memory B cells directed against SARS-CoV-2 spike protein antigens. STAR Protoc. 2022;3(4):101902.
- Bjorkander S, Du L, Zuo F, Ekstrom S, Wang Y, Wan H, et al. SARS-CoV-2-specific B- and T-cell immunity in a population-based study of young Swedish adults. J Allergy Clin Immunol. 2022;149(1):65–75 e8. [CrossRef]
- Hafizoglu M, Bas AO, Tavukcuoglu E, Sahiner Z, Oytun MG, Uluturk S, et al. Memory T cell responses in seronegative older adults following SARS-CoV-2 vaccination. Clin Immunol Commun. 2022;2:154–8. [CrossRef]
- Terlutter F, Caspell R, Nowacki TM, Lehmann A, Li R, Zhang T, et al. Direct Detection of T- and B-Memory Lymphocytes by ImmunoSpot(R) Assays Reveals HCMV Exposure that Serum Antibodies Fail to Identify. Cells. 2018;7(5). [CrossRef]
Figure 1.
Serum antibody titers of Spike antigen-specific IgG in the three cohorts studied. (A) Pre-Covid donors, i.e., subjects whose blood was drawn before Noveber 2019. (B) The Convalescent cohort, with blood drawn in 2020, 3–6 months after PCR-verified SARS-CoV-2 infection of the first wave. (C) The 2024 cohort, consisting of random individuals bled during that year by which time SARS-CoV-2 had become endemic. The demographic of these subjects is defined in Suppl. Table 1. The serum of each subject was tested at the dilutions specified on the x-axis with the corresponding OD reading shown on the y-axis. The ELISA was performed as described in Materials and Methods.
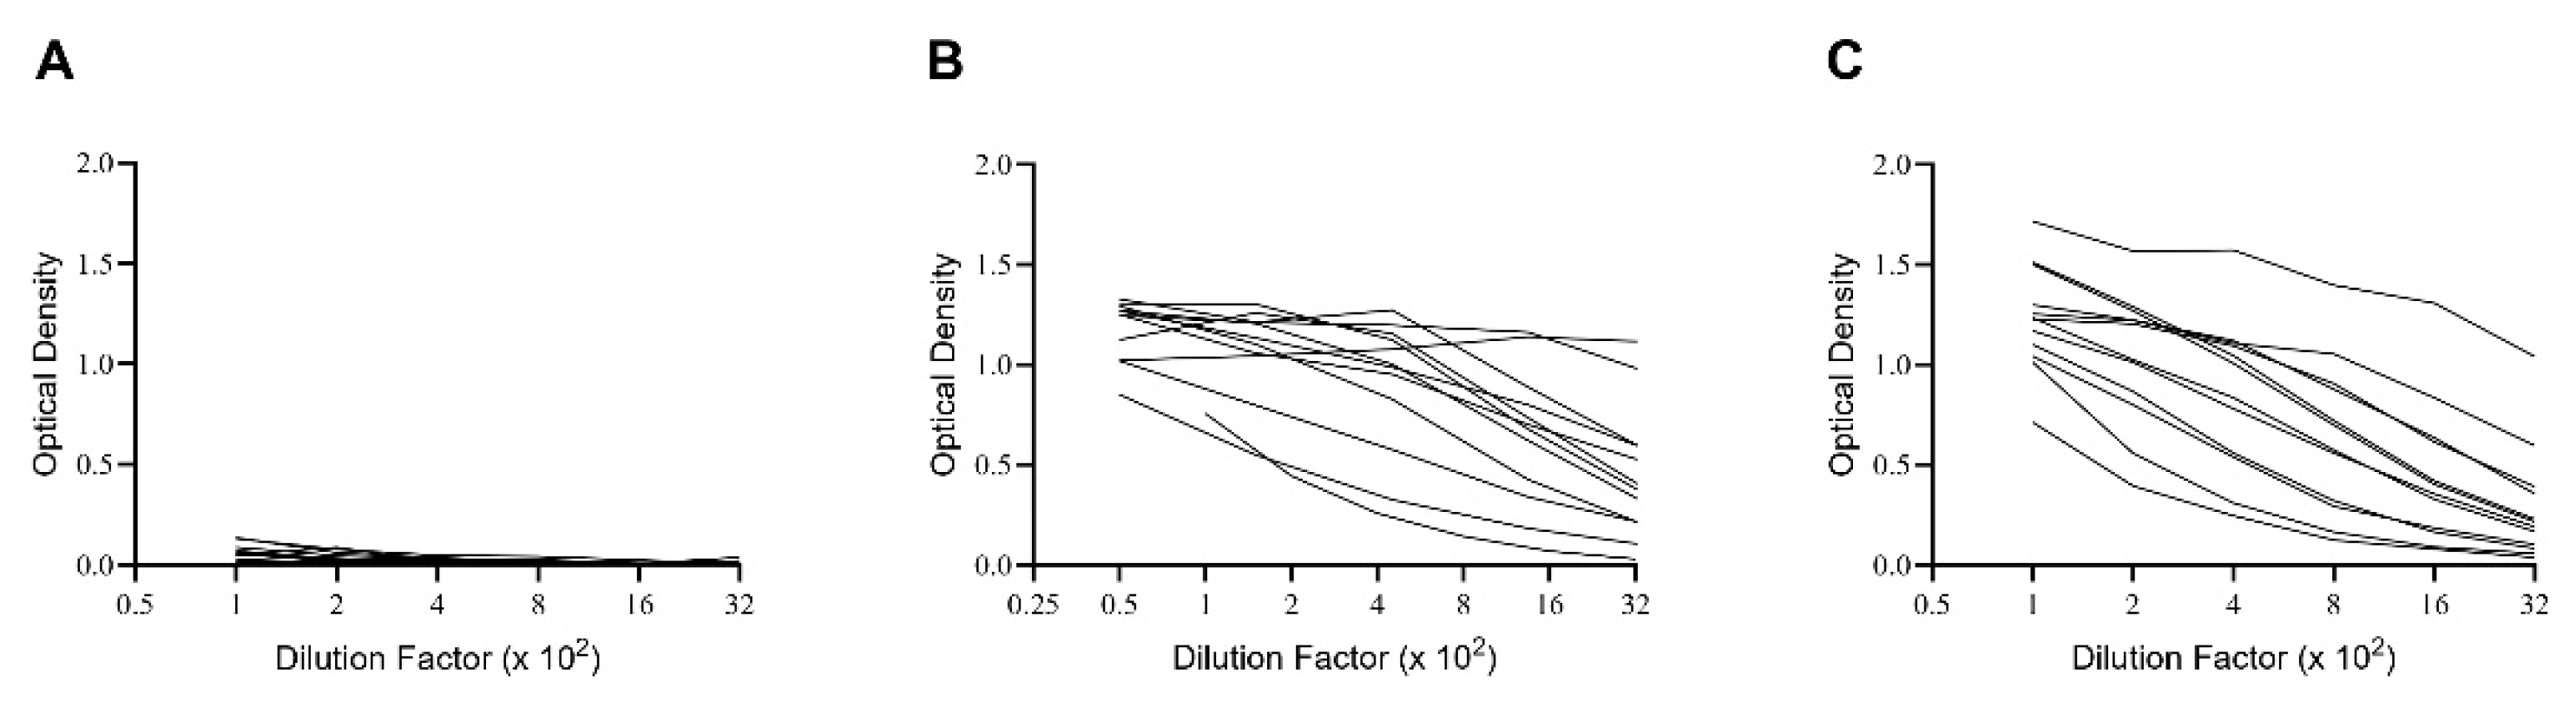
Figure 2.
Spike antigen-specific IgG+ Bmem frequency measurements in the specified cohorts. Frequency of Spike antigen-specific IgG+ Bmem was measured by (A) probe staining, (B) ImmunoSpot and (C) supernatant ELISA. Results for the individual donors are represented by a dot each, with mean + SD shown for each cohort. The three assays were performed as described in Materials and Methods.
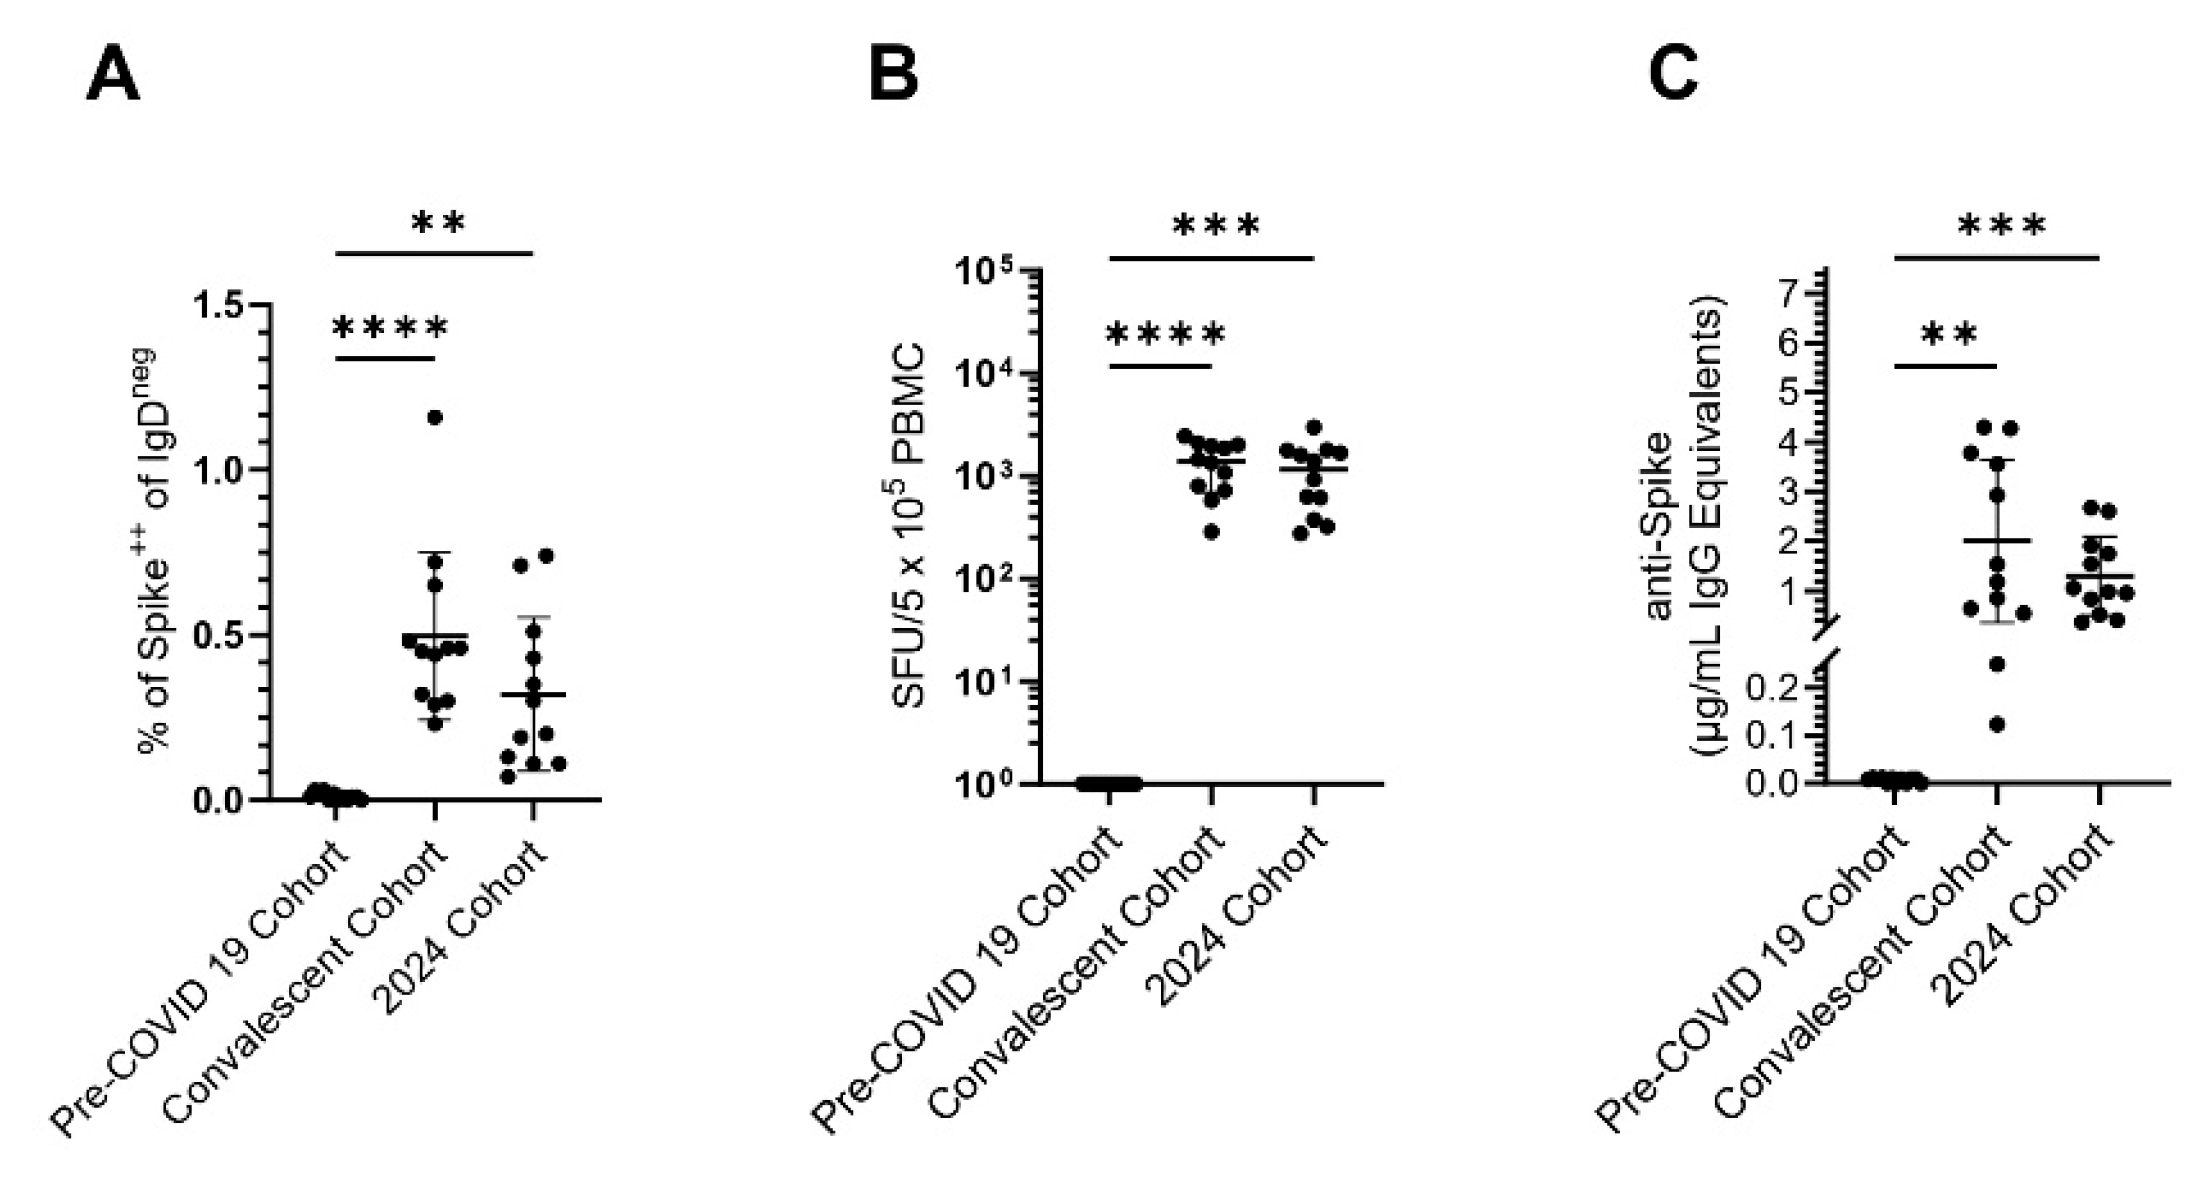
Figure 3.
Representative data obtained by ImmunoSpot® and by probe staining. A: Raw data for a Spike antigen-specific IgG-detecting ImmunoSpot® assay are shown in which the PBMC of a pre-COVID donor (LP 391, on the left) and a Covalescent donor (LP 557 on the right) were plated in the specified serially diluted cell numbers. The secretory footprints (Spot Forming Units, SFUs) as counted automatically for each well by the ImmunoSpot® Software are shown in the upper right corner of each well image. As crowding and ELISA-effects interfere with precise counting of SFUs at high Bmem numbers, the wells in which the PBMC numbers plated per well and SFUs counted relate linearly to each other are automatically identified by the software, and are highlighted by a green field. From the linear (in this case 4) datapoints the software automatically extrapolates the frequency, as shown in Panel (B). Panels (C-G) show the successive gating for the probe staining of the same Convalescent donor’s PBMC.
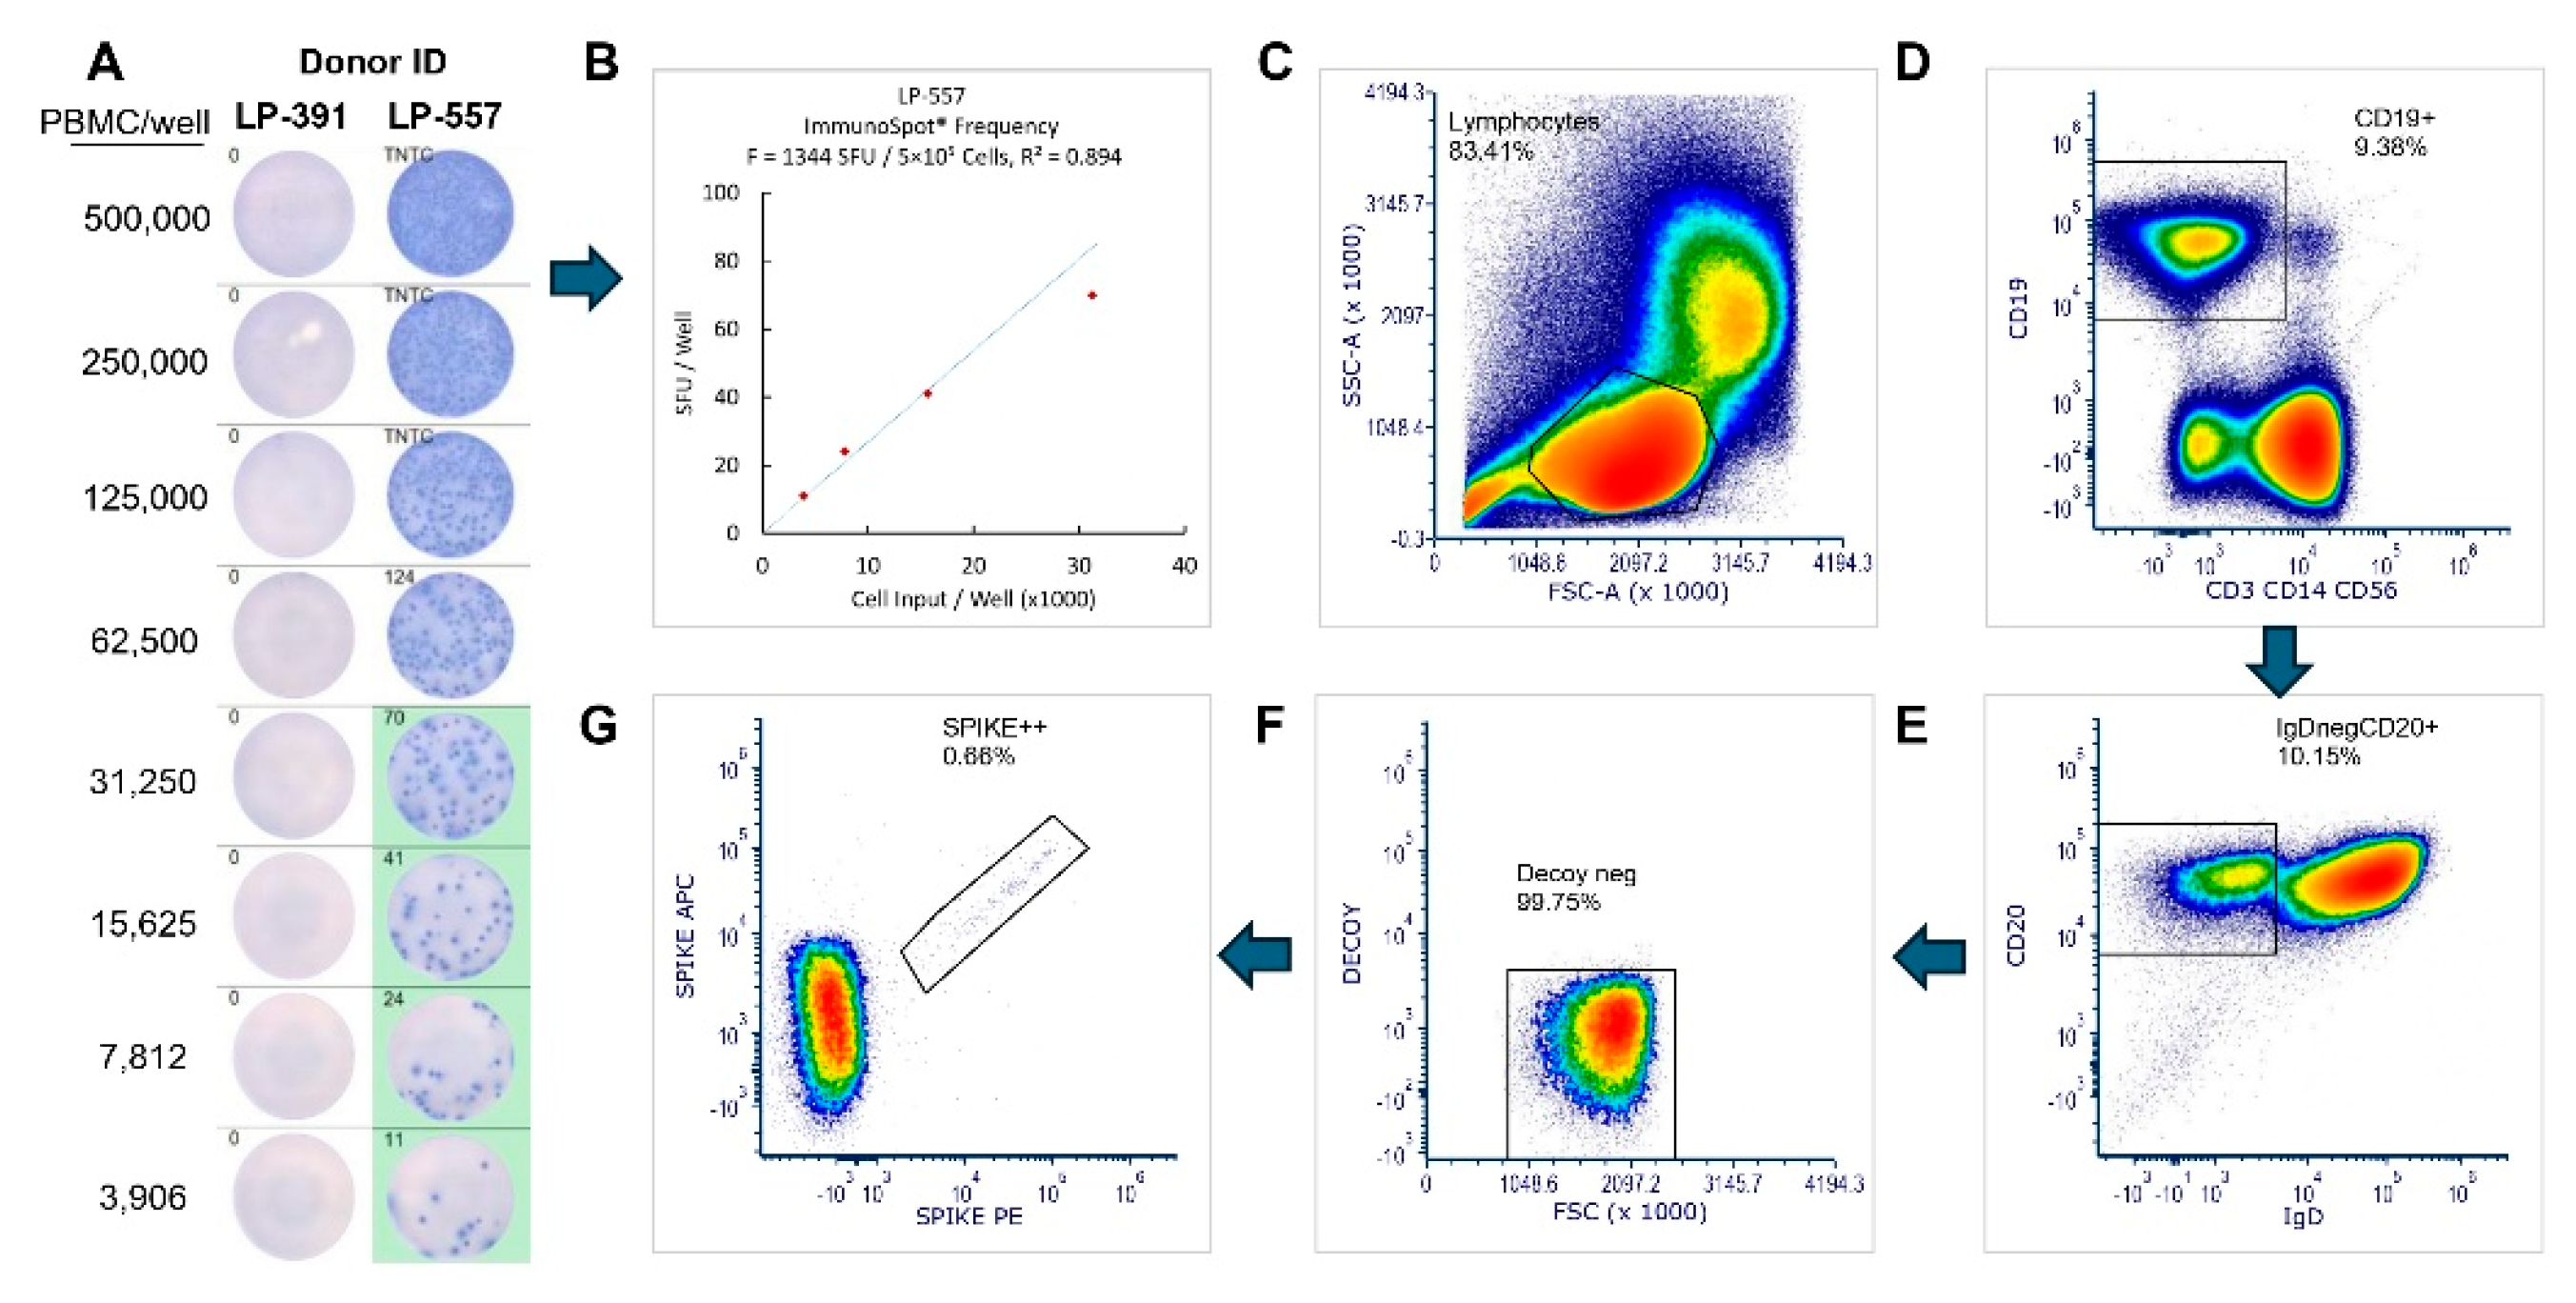
Figure 4.
Correlations for the data obtained in the specified Bmem detection assays. (A) ImmunoSpot vs. probe staining: significant p = 0.0028; (B) ImmunoSpot vs. supernatant p = 0.0919 trend but not significant; and ( C): supernatant vs. probe staining: significant p = 0.007. Each dot represents a PBMC sample of the Convalscent and 2024 Cohorts combined. Pre-COVID 19 samples, all being negative in all assays, have been excluded from the correlation analysis.
Disclaimer/Publisher’s Note: The statements, opinions and data contained in all publications are solely those of the individual author(s) and contributor(s) and not of MDPI and/or the editor(s). MDPI and/or the editor(s) disclaim responsibility for any injury to people or property resulting from any ideas, methods, instructions or products referred to in the content. |
© 2025 by the authors. Licensee MDPI, Basel, Switzerland. This article is an open access article distributed under the terms and conditions of the Creative Commons Attribution (CC BY) license (http://creativecommons.org/licenses/by/4.0/).
Copyright: This open access article is published under a Creative Commons CC BY 4.0 license, which permit the free download, distribution, and reuse, provided that the author and preprint are cited in any reuse.


