Submitted:
20 November 2025
Posted:
20 November 2025
You are already at the latest version
Abstract
In the study, lignin was extracted from coconut pith (CP) using soda pulping method, utilizing Response Surface Methodology to optimize key process parameters. The dependent variables were the extraction temperature and time, and NaOH concentration, with the yield (g lignin/10 g material) as the response. The statistical results identified ex-traction temperature (ρ = 0.0044) and time (ρ = 0.0035) as significant factors. NaOH con-centration, though not significant individually (ρ = 0.757), exhibited interaction effect with time (ρ = 0.006). The theoretical optimal extraction conditions were 159.0 °C, 169.0 min, and 2.1% NaOH, under which an actual coconut pith lignin (CPL) yield of 1.806 g/10 g CP was achieved. Characterization of CPL showed a composition of 92.96 ± 0.32% ac-id-insoluble lignin. To demonstrate its applicability, CPL was incorporated into a phenol-formaldehyde (PF) adhesive formulation, substituting the phenol component. The Adhesive Shear Strength Test demonstrated that the lignin-formaldehyde (LF) adhesive had a mean failing load of 0.819 kg/cm², nearly half that of the prepared PF adhesive at 1.78 kg/cm². The FT-IR spectra of the CPL and LF adhesives revealed notable differences in the 1750 – 1000 cm⁻¹ region, suggesting distinct structure and bond formations. These findings illustrate the potential of CPL as a sustainable phenol substitute in industrial adhesive formulations and in other applications.
Keywords:
coconut pith
; lignin
; soda pulping
; phenol-formaldehyde
; adhesive
1. Introduction
Phenol is a highly valuable industrial chemical and among natural sources, lignin has emerged as one of its most promising natural alternatives [1-3]. Lignin is the second most abundant natural polymer after starch and is primarily composed of substituted phenolic compounds derived from p-coumaryl, coniferyl, and synapyl alcohols [4,5]. It is a common plant polymer that provides structural reinforcement, strengthening the woody parts [6]. It is biosynthesized through enzyme-mediated dehydrogenative polymerization of above- mentioned phenolic compounds that are incorporated into the polymer as the phenylpropanoids p-hydroxyphenyl, guaiacyl, and syringyl [7].
Industrially, lignin is derived as a by-product of pulp and paper manufacturing, extracted mainly through the kraft and sulfite processes [8]. Other more recent extraction technologies have also been developed such as the use of the biomass process, solvents, and soda pulping. Soda pulping is a widely practiced method for non-wood feedstocks such as straw, sugarcane bagasse, and flax [9]. Through this method, lignin may be recovered by precipitation from the effluents or excess liquors generated by pulp mills followed by liquid-solid separation and drying [10].
Lignin has commercial applications and more recent studies have shown that these could further expand [11]. Kraft lignin can be sulfonated to various degrees depending on the process and can be utilized in applications depending on its solubility, molar mass distribution, and hydrophilic character [12]. Among the potential applications of kraft lignin, its use as dispersant and additive for concrete mixtures have shown the best results [13]. In a previous study, softwood lignin was applied as a dispersant and flocculant. Aside from Kraft lignin, other types such as organosolv lignin have also been studied [14]. It has been proposed that this lignin type can be used as partial replacement for phenolic resins that serve as binders in the manufacture of friction products or lubricants [15]. This material has been successfully utilized on a commercial scale by a North American manufacturer of automotive brake pads and moldings.
According to previous reports, coconut husks contain about 33–53% lignin [16, 17]. These values are generally higher than those from common hardwoods (23–30%) and softwoods (26–34%) [18]. Coconut husks hold marginal economic value and are often regarded as waste by many coconut farms and related industries; thus, their conversion into usable products is highly beneficial. The Philippines has nearly half a billion coconut trees and generates an estimated 1.8 million tons of shells and 4.1 million tons of husks annually [19]. While shells and husks are partially utilized in charcoal production alongside wood and bamboo, they still represent a substantial and underutilized lignocellulosic waste stream.
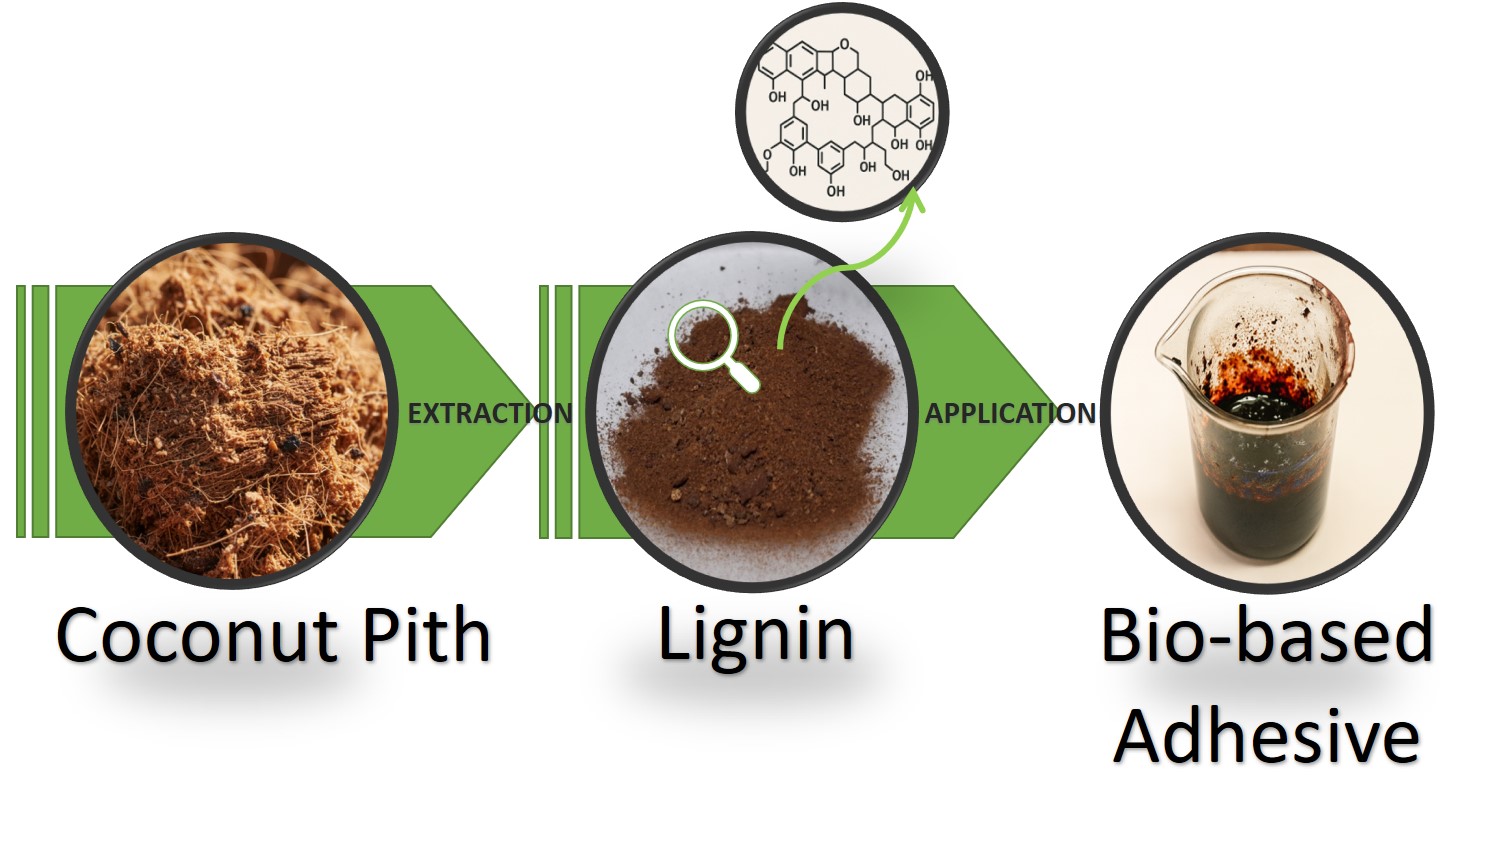
In this study, the researchers aimed to optimize the soda pulping extraction process for isolating coconut pith lignin (CPL). The extracted lignin was subsequently utilized in the formulation of a phenol–formaldehyde (PF) adhesive to evaluate its potential as a sustainable alternative to phenol
2. Materials and Methods
- A.
- Materials
CP was purchased from a local supplier, dried at 60 °C for about 12 hrs or until the moisture content was ≤ 20%, and was then sifted using a USA Standard Testing Sieve No. 16 prior to use. Sodium hydroxide (NaOH) and sulfuric acid (H2SO4) were purchased from Duksan Pure Chemicals. Sodium sulfite (Na2SO3) anhydrous was bought from Loba Chemie Pvt. Ltd. Phenol (C6H5OH) and Urea (CO(NH2)2) were sourced from Techno Pharmchem. Formaldehyde (CH2O) was procured from RCI Labscan. All chemicals used in the study were analytical grade and were utilized without further processing.
- B.
- Soda Pulping Extraction of CPL
Lignin was extracted from the CP via soda pulping method. Exactly 10 g of CP was weighed in a 1 L glass reaction vessel with lid & steel clamp. About 200 mL of NaOH solution was added and the mixture was refluxed with stirring for a set time and temperature, immediately after which approximately 400 mL of distilled water was added. The mixture was mixed then vacuum filtered using a Whatman Filter No. 1. The residue was washed thrice with 100 mL portions of distilled water and all filtrates were collected. The filtrate’s pH was then slowly adjusted to pH 2.0 using 20% H2SO4 and was boiled for approximately 1 hr. The mixture was allowed to cool to room temperature and the resulting precipitate was vacuum filtered using Whatman Filter No. 1. The precipitate was washed thrice with 100 mL portions of distilled water and was dried in a Memmert Oven Model U10 at 70 °C for about 16 hrs. After drying, the extracted lignin was weighed and its yield was calculated. To maximize the yield, process optimization was performed using Stat-Ease® Design Expert Version 7.0. Response Surface Methodology (RSM) was used with Central Composite Design (CCD) having three independent factors (time, temperature, and NaOH concentration) and one response (Yield). Table 1 shows the design summary employed to optimize the soda pulping of CP.
- C.
- Preparation of PF Adhesive
The preparation of the adhesive was based on the method described in a previous study with modifications [20]. Exactly 21.96 g phenol was added with 14.6 mL formaldehyde and heated at 80 °C for 1 hr. Then, 11.9 mL formaldehyde and 1.80 mL 30% NaOH were added and the mixture was heated at 80 °C for 1 hr. Afterwards, the same amount of formaldehyde and 30% NaOH were again added followed by heating at 80 °C for another 1 hr. About 28.80 g urea and 5.10 mL 30% NaOH solution were added and the resulting mixture was heated at 87 °C for 30 min. After heating, the resulting PF adhesive was immediately cooled down to room temperature and was stored in a chiller until further analysis or use.
- D.
- Preparation of Lignin-Formaldehyde (LF) Adhesive
To prepare the LF adhesive, the procedure for preparing the PF adhesive was followed with modifications wherein phenol was substituted by CPL on a per weight basis. Prior to the synthesis, CPL was dissolved in a 30% (w/w) NaOH solution at a CPL-to-NaOH weight-to-volume ratio of 1:8. The mixture was subjected to gentle heating at 50 °C for 1 hr to ensure complete dissolution of the lignin. Once dissolved, the appropriate amount of formaldehyde was added to the solution, and the mixture was heated at 80 °C for 1 hr. Subsequently, a second portion of formaldehyde was introduced, and the heating process at 80 °C was repeated for another 1 hr. A third batch of formaldehyde was then added, followed by an additional 1-hr heating period at 80 °C. Finally, urea was incorporated into the mixture, and the reaction was allowed to proceed at 87 °C for 30 min. Upon completion of the synthesis, the resulting LF adhesive was immediately cooled to room temperature and stored in a chiller until further analysis or application.
- E.
- Chemical and Physical Analyses
- 1.
- CP and CPL characterization
- a.
- Moisture Content
The moisture content of all samples was analyzed using an IR moisture analyzer. The sample was analyzed by drying at 105 °C and the equipment was set and operated based on the recommendation of the manufacturer.
- b.
- Ash Content
The ash contents of the samples were analyzed using a Nabertherm L9/S Furnace. Exactly 1 g of sample was placed in a pre-weighed crucible with cover and was heated to 575 °C for at least 4 hrs. After heating, the ash was allowed to cool down to ambient temperature in a desiccator prior to weighing.
- c.
- Lignin Content
The lignin content of the samples was analyzed using the procedure of a previous work [21]. Exactly 1 g of sample was treated with 15 mL of 72% H2SO4 at 37 °C for 2 hrs. The mixture was then diluted to 3% H2SO4 and refluxed at 80 °C for 4 hrs. Afterwards, the sample was filtered using Whatman Filter No. 1. The residue (insoluble lignin fraction) was dried using a Memmert Oven Model U10 at 100 °C for about 16 hrs. The dried sample was weighed and reported as the insoluble lignin. The filtrate (soluble lignin fraction) was analyzed using a Shimadzu UV Spectrophotometer UV mini-1240 at 280 nm. The soluble lignin was calculated using the formula:
The total lignin content was calculated by adding the results of the insoluble and soluble lignin fractions.
- a.
- Lignin Phenolic Hydroxyl Content
The phenolic content of the samples was measured employing an earlier established method [22]. Approximately 0.1 g of sample was dissolved in 100 mL pH 12 buffer solution (12.4 g boric acid in 2 L 0.1 N NaOH). Then, a 2 mL aliquot was pipetted and diluted to 50 mL with the pH 12 buffer solution. Another 2 mL aliquot was added with 2 mL of 0.1 N H2SO4 and diluted to 50 mL with pH 6 buffer solution (495 mL of 0.2 N KH2PO4 and 113 mL of 0.1 N NaOH diluted to 2 L with distilled H2O). The absorbance of each solution at 280 nm to 400 nm (with 5 nm intervals) was measured using a Shimadzu UV Spectrophotometer UV mini-1240. The difference between the measured absorbances per wavelength was then calculated. The phenolic hydroxyl group content of the lignin samples was calculated using the value of the sample and the following equation:
- a.
- Thermogravimetric Analysis (TGA)
About 0.5 g of sample was submitted to a third-laboratory laboratory for TGA measurements. The samples were analyzed using Perkin Elmer STA 6000 by heating from 30 to 600 °C and then 600 to 900 °C with heating rate of 20 °C/min. Nitrogen was used at 50 mL/min from 30 to 600 °C while oxygen was used from 600 to 900 °C.
- b.
- Fourier Transform-Infrared (FT-IR) Analysis
About 1.0 g of sample was submitted to a third-laboratory laboratory for FT-IR analysis. The testing protocols for FT-IR of the said laboratory were followed.
Adhesive Characterization
Viscosity Measurement
The viscosity of the samples was measured using a Cannon-Fenske Capillary Viscometer. A Koehler KV3000 Series Kinematic Viscosity Bath was used to maintain the temperature at 40 °C and time the viscosity measurements. Prior to taking measurements, the samples were allowed to equilibrate at 40 °C in the viscosity bath.
- b.
- Adhesive Shear Strength
The samples were submitted to a third-party laboratory to test their adhesive strength. To prepare the samples, two strips of hard cardboard each measuring 5 1 (l w) inch were glued together using the prepared adhesives with an overlap of 0.5 in on one end. Ten (10) pairs were prepared for each adhesive sample and were analyzed for shear strength based on the ASTM D1002 standard.
3. Results
- A.
- Extraction of CPL
In the study, CPL was extracted using soda pulping. To maximize the yield, process optimization was conducted using RSM with CCD (see Table A1 in Appendix A for the three (3) variables investigated, their combinations, and their respective experimental responses). Table 3.1 summarizes the ANOVA results of the process optimization while Table 3.2 presents the R-Squared, Adjusted R-Squared, and Predicated R-Squared of the model generated from the experimental data.

Table 2.
1. ANOVA results of lignin extraction using soda pulping.
| Sum of | Mean | F | ρ-value | ||
| Source | Squares | Df | Square | Value | Prob > F |
| Model | 0.37 | 9 | 0.041 | 13.73 | 0.0050 |
| A-Time | 0.072 | 1 | 0.072 | 24.27 | 0.0044 |
| B-Temp | 0.080 | 1 | 0.080 | 26.86 | 0.0035 |
| C-% NaOH | 3.188E-004 | 1 | 3.188E-004 | 0.11 | 0.7570 |
| AC | 3.454E-003 | 1 | 3.454E-003 | 1.16 | 0.0037 |
| Lack of Fit | 2.640E-003 | 3 | 8.800E-004 | 0.14 | 0.9256 |
Table 2.
2. R-squared values of the model generated for the conducted soda pulping.
| R-Squared | 0.9611 |
| Adjusted R-Squared | 0.8911 |
| Predicated R-Squared | 0.8112 |
| Adequate Precision | 15.887 |
The results show that the quadratic model generated (ρ = 0.005; lack of fit is ρ = 0.9256), including the variables time and temperature, are significant (ρ = 0.0044 and 0.0035, respectively). The R-squared values (see Table 2.2) propose that the model is a good fit for the data. Unexpectedly, the NaOH concentration has a ρ-value > 0.05, which contradicts findings commonly reported in the literature. This indicate that the range covered in this study did not have considerable effect on the CPL yield. The Predicted R-Squared of 0.8112 is in reasonable agreement with the Adjusted R-Squared (0.8911), which means that the model has good predictive capability. The Adequate Precision measures the signal to noise ratio and a value higher than 4 is desirable. In this case, its value is 15.887, demonstrating adequate signal.
Figure 1 shows a 3D contour map demonstrating the effect of the experimental time and temperature on the CPL yield. The map illustrates that as the time and temperature increase, the yield also correspondingly rises.
Figure 2 and Figure 3 illustrate how temperature and time individually affect the yield. As shown, the yield exponentially increases with the temperature. In contrast, the yield increases for a certain period but seemingly levels off after 170 min. The results also demonstrate that temperature and time do not interact to affect the yield, suggesting that both variables can be manipulated independently to obtain a target result. Meanwhile, time and NaOH concentration shows significant interaction as illustrated by their plots in Figure 4. Conversely, temperature also interacts with NaOH concentration as shown in Figure 5 but this interaction does not have a significant effect on the yield based on the ANOVA results (data not shown).
The interaction between NaOH concentration and time presents interesting results. The 3D surface plot in Figure 6 shows that time and NaOH concentration affect the yield. An increase in both factors generally results in an improved yield. However, when their interaction is taken into account, an increase in both factors’ values does not necessarily produce the same result (see Figure 4). Conversely, a reduced yield might be expected especially at higher NaOH concentration and time. This result implies that a high NaOH concentration can lead to the possible degradation or modification of the lignin resulting to lower yield after acid precipitation with H2SO4.
The model generated follows Equation (3) given below:
where A is time, B is the temperature, and C is the NaOH concentration. AC, AB, AC, and BC represent the interactions of the variables.
Yield = + 1.50 + 0.12 *A + 0.083 * B - 5.535E-003 * C - 8.425E-003 * AB - 0.026 * AC - 0.12 * BC + 0.029 * A2 - 0.044 * B2 - 0.010 * C2
To obtain maximum yield, the theoretical optimization (see Table A2 in Appendix A) suggested a temperature and time combination of 160.0 °C and 168.11 min using 2.12% NaOH. The theoretical maximum yield was calculated at 1.808 g lignin / 10 g material while the actual yield was 1.806 g / 10 g material (99.8%), demonstrating that the model captured the actual conditions affecting the yield of the optimized lignin extraction process.
- B.
- Characterization of CP and extracted CPL
The physicochemical properties of coconut peat and CPL are presented in Table 3. Upon delivery, the fresh coconut pith was immediately dried using an air convection and a final moisture content of 18.40 ± 0.62% was recorded. The ash content of the dried coconut peat was 6.68 ± 0.13%. The insoluble lignin content was at 45.02 ± 1.72% which is relatively higher compared to other sources. For example, typical hardwoods contain approximately 21–31% lignin, while softwoods range from 27–32% [23]. Herbaceous materials such as grasses generally exhibit 10–20% lignin, and residues like wheat straw, rice straw, and corn stalks often range even lower, between 10–20% [24]. Lignocellulosic coconut coir is reported to contain 37–42% lignin, which underscores the inherently high lignin level of coconut-derived materials [25].
The extracted CPL was a dark brown crystalline solid (ground) as shown in Figure 7. The ash content of the extracted CPL was 1.15 ± 0.04%, which was much lower than that of the raw material. This result is desirable because a high ash content could interfere with the utilization of lignin as a potential industrial chemical. Using the optimized soda pulping process, the study obtained CPL with 92.96 ± 0.32% purity, slightly higher (82.8%) than the results reported in the literature [16]. The phenolic hydroxyl content of CPL was 0.80 ± 0.04%, which was slightly lower compared with those reported in literature for technical and native lignin. Typical phenolic hydroxyl contents for lignin derived from hardwoods and softwoods range between 1–3%, depending on the isolation method and botanical source whereas organosolv and kraft lignin may exhibit even higher values due to structural modifications during pulping [23,26,27]
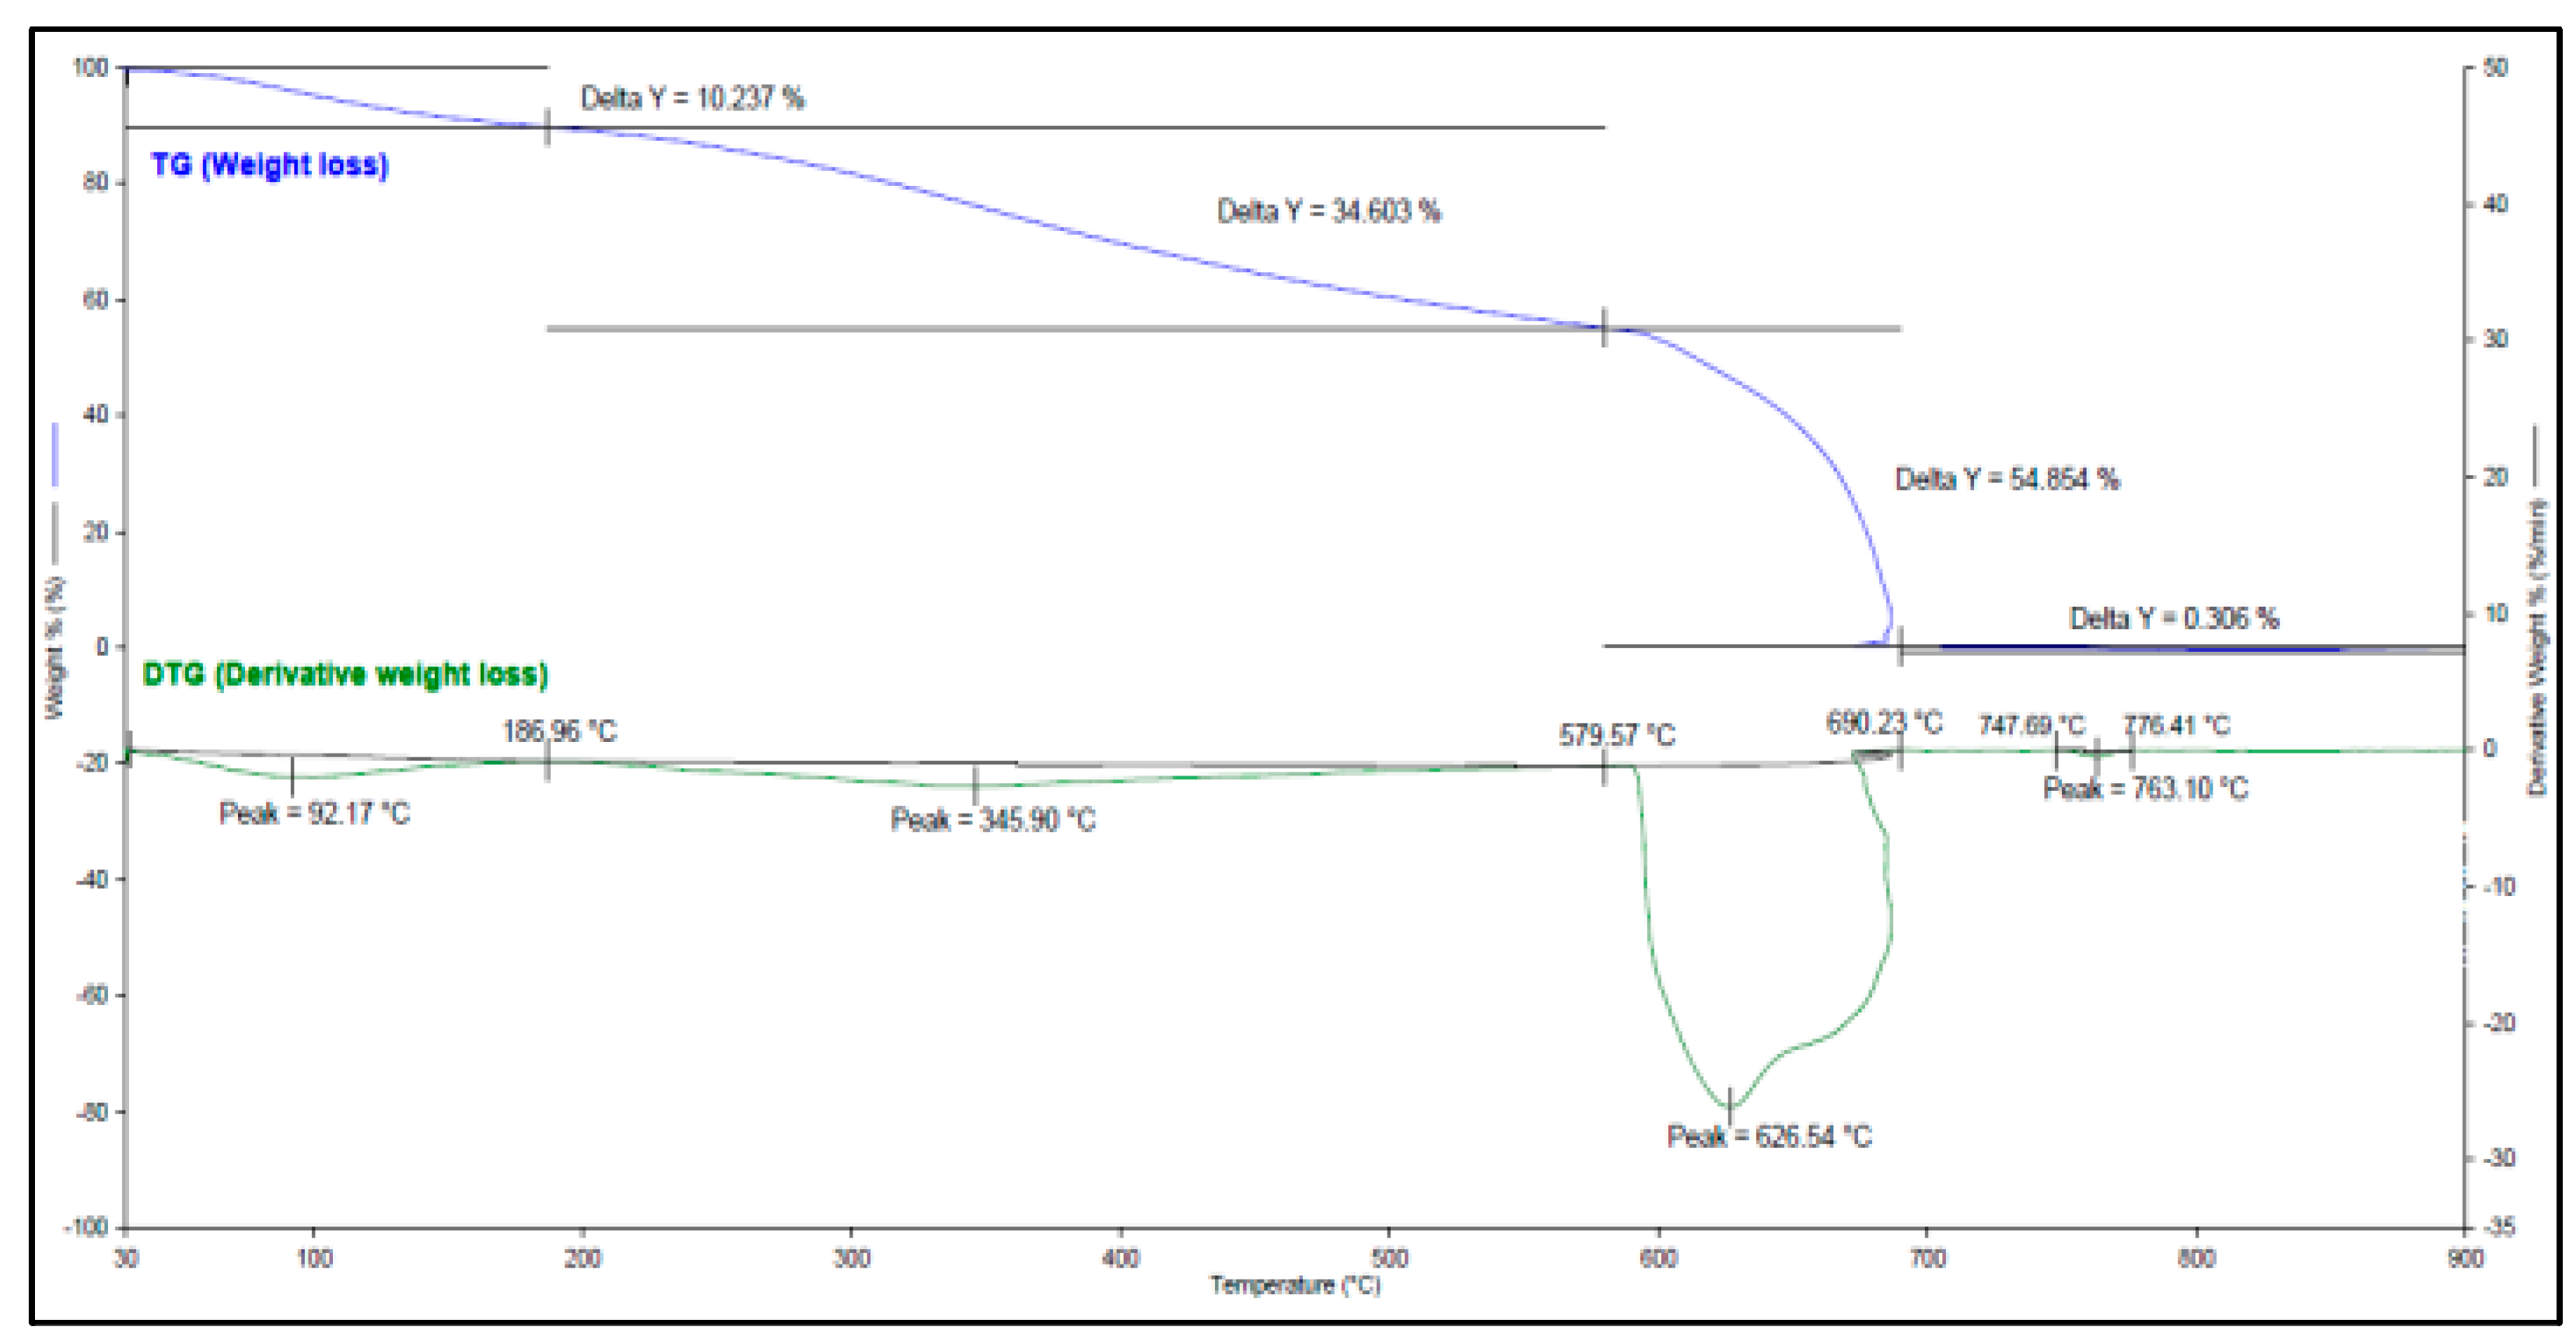
TGA was also conducted on CPL to demonstrate how it specifically loses mass when heat is incrementally applied. The Thermogravimetric and Derivative Thermogravimetric Analysis (TG-DTA) curves are shown in Figure A1 and the data are presented in Table A3 of Appendix A. The wide range of decomposition temperature indicates that CPL is structurally heterogenous. Moreover, the sample presented a high peak temperature which suggests excellent thermal stability.
Figure 8 presents the FT-IR spectrum of CPL which shows a strong and broad band at around 3700–3000 cm-1, indicating phenolic and aliphatic OH groups. There is also a band at about 2924 cm⁻¹ which suggests C–H stretching in alkyl sidechains. The bands at 1605 and 1512 cm⁻¹ are also noticeable and may be attributed to the C=C stretching in the structure’s aromatic skeleton [28]. The band at ~1443 cm⁻¹ suggests aromatic skeletal vibration particularly C–H in-plane deformation. The band at 1211 cm⁻¹ may be related to C–C, C–H, and C=O stretches in the CPL guaiacyl ring; in addition, bands at 1111 and 818 cm⁻¹ might be due to the C–H deformations of the syringyl units [29]. The FT-IR data suggests that CPL extracted in this study has a combination of guaiacyl and syringyl units similar to what other studies were able to attain [28, 30]. Others have reported that their extracted lignin had higher guaiacyl content than syringyl [31].
Characterization of LF Adhesive
One objective of the study was to replace phenol with lignin in adhesives to demonstrate how it can eventually serve as a sustainable alternative to the said petroleum-based chemical. In this study, a standard PF adhesive and LF formulation were prepared and their viscosity and adhesive shear strength were tested. Generally, LF exhibited lower viscosity and adhesive shear strength values than PF (see Table 4). A low-viscosity adhesive can be utilized in various applications requiring high flowability, surface wetting, and precision, examples of which include adhesives used for bonding, sealing, potting, encapsulation and impregnation (Low viscosity adhesives, sealants and coatings). Although the adhesive strength of LF is nearly half that of PF, the result proposes that native and crude CPL has enough phenolic character to replace phenol to a certain extent.
The FT-IR spectrum of the LF adhesive in Figure 9 shows a broad band at 3700–3000 cm⁻¹. This may be assigned to the O–H stretching of the phenolic and aliphatic hydroxyl groups and can be indicative of strong hydrogen bonds and residual OH groups that are important for adhesive interactions [23, 26]. Noticeable absorptions around 2970 and 2824 cm⁻¹ correspond to the aliphatic C–H stretching of –CH₂– and –CH₃ groups from the lignin side chains and methylene bridges formed during condensation [23, 26]. A strong peak at 1582 cm⁻¹ represents aromatic skeletal vibrations, thus suggesting a phenylpropane backbone that contributes to rigidity and thermal stability [32]. Additional aromatic ring vibrations at 1412 cm⁻¹ and a syringyl-associated band at 1350 cm⁻¹ reflect guaiacyl/syringyl substitution patterns in the lignin matrix [23, 26]. The band at 1119 cm⁻¹ further supports syringyl substitution while that at 1041 cm⁻¹ indicates C–O stretching of alcohols and ether linkages [32].
Other studies have reported that absorptions in the 1458-1350 cm-1 region, associated with methylene (-CH2-) deformations, and in the 1257-1149 cm-1 range, assigned to Ar-O-C ether linkages, can help provide evidence of crosslinking reactions between lignin phenolic groups and formaldehyde, and confirm adhesive network formation [33, 34]. In addition, a low-frequency absorption at about 787 cm-1 (aromatic C-H out-of-plane bending) may help confirm the diverse aromatic substitution patterns and the coexistence of guaiacyl and syringyl units [23, 26]. Comparing the spectra shown in Figure 9 and Figure 10, noticeable distinctions can be observed particularly around 1600-800 cm-1, signifying differences in their chemical structure or imply bond formation.
4. Discussion
The aim of the study was to extract CPL and utilize it in an application to demonstrate its capacity as an industrial material. Coconut pith is considered an attractive resource because it has been shown to contain a considerable amount of lignin compared with other woody materials. CPL was extracted using soda pulping due to its relatively simpler and milder conditions compared to other common methods like Kraft and sulfite pulping. Moreover, although previous reports on CPL extraction exist, optimization was performed using a theoretical model to pinpoint the specific conditions for maximum yield and to assess how the different variables interact.
Using the experimental data, a quadratic model (Equation 3) was generated, which provided a specific set of theoretical temperature, time, and NaOH concentration to reach a calculated maximum yield. The actual vs. theoretical yields were nearly identical, demonstrating the model's accuracy, which means it can be applied to target specific responses with a set of preferred variables. It is noteworthy that the yield increases with temperature and time, although the increase with time leveled off after 170 minutes. While similar results have been reported, in this specific study, the NaOH concentration was not a significant factor for CPL extraction, in contrast with findings presented in other works. This result demonstrates that within the selected range of NaOH concentration (2 – 5%), one can expect the same amount of CPL.
The data interestingly revealed that NaOH concentration interacts with time, and this interaction significantly affects the CPL yield. Specifically, at higher NaOH concentrations, time negatively impacts the response, meaning the yield decreases over longer periods. Conversely, when the concentration is lower (roughly about 2%), the yield correspondingly increases with time. Therefore, during production, the manufacturer should prioritize the minimum NaOH concentration to ensure that the yield continues to improve as the reaction time is extended. Although the direct cause of this specific behavior was not investigated in the study, it can presumably be attributed to either the degradation of CPL at higher NaOH concentrations or the high alkali condition negatively affecting the solubility of the extracted CPL.
In the current study, the extracted CPL was applied into a PF adhesive by direct substitution of the phenol portion. This was done to evaluate the performance of CPL as a sustainable alternative to the petroleum-based chemical given that lignin is a phenolic natural polymer. Data from the conducted shear strength test illustrates that the LF adhesive possessed just half the adhesiveness of PF. This may be attributed to the lower phenolic content of CPL, leading to a lesser degree of polymerization with formaldehyde. Nonetheless, it was capable, at least to some degree, of forming an adhesive and partially replacing phenol. This assumption is supported by the FT-IR spectrum of CPL and the LF adhesive, showing key differences and distinct bands. However, to fully realize the potential of lignin as a direct substitute for phenol or other petroleum-based compounds, further research is necessary, focusing mainly on altering the lignin’s chemical structure to improve its functionality and reactivity.
5. Conclusion
This study demonstrated the successful extraction of lignin from CP using the soda pulping method, with process optimization achieved through RSM. The optimized conditions yielded a high proportion of acid-insoluble lignin, confirming CP as a rich lignocellulosic source. When applied as a phenol substitute in PF adhesives, LF adhesive exhibited a shear strength comparable to conventional PF resin, highlighting its potential as a sustainable alternative. FT-IR analysis further highlighted structural differences between PF and LF adhesives, particularly within the hydroxyl and aromatic vibration regions, suggesting unique bond formation during polymerization. Collectively, these findings position coconut pith-derived lignin as a promising renewable resource for adhesive production, supporting both material performance and sustainability objectives in industrial applications.
6. Patents
The technology presented in this article was awarded with a Utility Model Registration with Registration No. 2/2022/051178 and Registration Title “Coco peat Lignin-based Phenol Formaldehyde Adhesive” last 04 January 2023 by the Bureau of Patents, Intellectual Property Office of the Philippines.
Supplementary Materials
Not Applicable.
Author Contributions
The following are the contributions of each author: “Conceptualization, C. A. Bilbao and K. C. Aganda; methodology, C. A. Bilbao; data curation, C. A. G. Bilbao; writing—original draft preparation, C. A. G. Bilbao.; writing—review and editing, C. A. G. Bilbao and K. C. C. Aganda; supervision, K. C. C. Aganda; project administration, K. C. C. Aganda; All authors have read and agreed to the published version of the manuscript.
Funding
This research was fully funded by the Department of Science and Technology - Industrial Technology Development Institute (DOST-ITDI) through its General Appropriations Act Fund with Project Identification No. RDR-CED-2021-01
Institutional Review Board Statement
Not Applicable
Informed Consent Statement
Not Applicable
Data Availability Statement
The data and other information generated through this study are subject to the Freedom of Information (FOI) Program (Executive Order No. 2, s. 2016) and Philippine Technology Transfer Act of 2009 (Republic Act No. 10055). Requests for access may be addressed to the corresponding author, subject for review and approval in compliance with both the FOI's disclosure standards and the requirements of RA 10055.
Acknowledgments
The researchers would like to express their gratitude to DOST-ITDI for providing the necessary resources that made the implementation of this study possible. Sincere appreciation is also extended to the Technical Review Committee of DOST-ITDI for their valuable insights and recommendations that greatly contributed to the refinement of the work. The researchers likewise acknowledge the assistance of the DOST-ITDI’s Standards and Testing Division and the Advanced Materials Testing Laboratory in carrying out several of the analyses required in this study. Also, during the preparation of this manuscript/study, the author(s) used Gemini AI Flash 2.5 variant for the purposes of grammar and proof reading. The authors have reviewed and edited the output and take full responsibility for the content of this publication
Conflicts of Interest
The authors declare no conflicts of interest. The funders had no role in the design of the study; in the collection, analyses, or interpretation of data; in the writing of the manuscript; or in the decision to publish the results.
Abbreviations
The following abbreviations are used in this manuscript:
| ANOVA | Analysis of Variance |
| CCD | Central Composite Design |
| CP | coconut pith |
| CPL | coconut pith lignin |
| FT-IR | Fourier Transform-Infrared |
| LF | lignin-formaldehyde |
Appendix A
Table A1.
Details of the runs conducted including their resulting experimental yield.
|
Extraction Temperature (°C) |
Extraction Time (minutes) |
NaOH Concentration (% w/v) |
Yield (g lignin / g material) |
|
| 173.6 | 115.0 | 3.5 | 1.5781 | |
| 140.0 | 115.0 | 3.5 | 1.5608 | |
| 120.0 | 170.0 | 2.0 | 1.5382 | |
| 140.0 | 207.5 | 3.5 | 1.5244 | |
| 120.0 | 60.0 | 2.0 | 1.1069 | |
| 140.0 | 115.0 | 3.5 | 1.4109 | |
| 140.0 | 115.0 | 1.0 | 1.5028 | |
| 120.0 | 170.0 | 5.0 | 1.3431 | |
| 140.0 | W22.5 | 3.5 | 1.2241 | |
| 160.0 | 60.0 | 5.0 | 1.6223 | |
| 160.0 | 60.0 | 2.0 | 1.6103 | |
| 140.0 | 115.0 | 6.0 | 1.4355 | |
| 120.0 | 60.0 | 5.0 | 1.4237 | |
| 140.0 | 115.0 | 3.5 | 1.5254 | |
| 106.4 | 115.0 | 3.5 | 1.3719 | |
| 160.0 | 170.0 | 2.0 | 1.8060 | |
| 160.0 | 170.0 | 5.0 | 1.5308 | |
Table A2.
Theoretical temperature and time combination suggested by the software based on the model generated for maximum yield.
Table A2.
Theoretical temperature and time combination suggested by the software based on the model generated for maximum yield.
| Name | Goal | Lower Limit | Upper Limit | |
| Time | is in range | 60 | 170 | |
| Temp | is in range | 120 | 160 | |
| % NaOH | is in range | 2 | 5 | |
| Yield | maximize | 1.107 | 1.806 | |
| Solution | ||||
| Number | Time | Temp | % NaOH | Yield |
| 1 | 168.11 | 160.00 | 2.12 | 1.808 |
Table A3.
TG-DTA data for CPL showing the corresponding weight loss per temperature range applied on the sample.
Table A3.
TG-DTA data for CPL showing the corresponding weight loss per temperature range applied on the sample.
| Peak | Peak Temperature (°C) | Weight loss (%) | Temperature Range (°C) | |
| 1 | 92.17 | 10.237 | 30.00 – 186.96 | |
| 2 | 345.90 | 34.603 | 186.96 – 579.57 | |
| 3 | 626.54 | 54.854 | 579.57 – 690.23 | |
| 4 | 763.10 | 0.306 | 747.69 – 776.41 | |
Figure A1.
TG-DTG curve of CPL
References
- Hu, L.; Pan, H.; Zhou, Y.; Zhang, M. Methods to Improve Lignin’s Reactivity as a Phenol Sub-stitute and as Replacement for Other Phenolic Compounds: A Brief Review. BioResources 2011, 6, 3515–3525. [Google Scholar] [CrossRef]
- Vasile, C.; Baican, M. Lignins as Promising Renewable Biopolymers and Bioactive Compounds for High-Performance Materials. Polymers 2023, 15, 3177. [Google Scholar] [CrossRef] [PubMed]
- Kumar, A.; Patil, P.B.; Pinjari, D.V. Eco-Friendly Adhesives for Wood Panels: Advances in Lignin, Tannin, Protein, and Rubber-Based Solutions. Journal of Adhesion Science and Technology 2025, 39, 2628–2669. [Google Scholar] [CrossRef]
- Lintinen, K.; Latikka, M.; Sipponen, M.H.; Ras, R.H.; Österberg, M.; Kostiainen, M.A. Structural Diversity in Metal–Organic Nanoparticles Based on Iron Isopropoxide Treated Lignin. RSC Advances 2016, 6, 31790–31796. [Google Scholar] [CrossRef]
- Matsushita, Y.; Ko, C.; Aoki, D.; Hashigaya, S.; Yagami, S.; Fukushima, K. Enzymatic Dehy-drogenative Polymerization of Monolignol Dimers. Journal of Wood Science 2015, 61, 608–619. [Google Scholar] [CrossRef]
- Saberi Riseh, R.; Fathi, F.; Lagzian, A.; Vatankhah, M.; Kennedy, J.F. Modifying Lignin: A Promising Strategy for Plant Disease Control. International Journal of Biological Macro-molecules 2024, 271, 132696. [Google Scholar] [CrossRef]
- Mankar, S.; Chaudhari, A. Industrial Waste Lignin—a Promising Biomaterial. Bionano Frontier 2012, 5, 337–341. [Google Scholar]
- Alam, M.M.; Greco, A.; Rajabimashhadi, Z.; Corcione, C. Efficient and Environmentally Friendly Techniques for Extracting Lignin from Lignocellulose Biomass and Subsequent Uses: A Re-view. Cleaner Materials 2024, 13, 100253. [Google Scholar] [CrossRef]
- Abolore, R.S.; Swarna, J.; Jaiswal, A. A Comprehensive Review on Sustainable Lignin Extraction Techniques, Modifications, and Emerging Applications. Industrial Crops and Products 2025, 235, 121696. [Google Scholar] [CrossRef]
- Lora, J.; Glasser, W. Recent Industrial Applications of Lignin: A Sustainable Alternative to Nonrenewable Materials. Journal of Polymers and the Environment 2002, 10, 39–48. [Google Scholar] [CrossRef]
- Hasan, Md.S.; Sardar, Md.R.; Shafin, A.; Rahman, Md.S.; Mahmud, Md.; Hossen, Md.M. A Brief Review on Applications of Lignin. Journal of Chemical Reviews 2023, 5, 56–82. [Google Scholar] [CrossRef]
- Kamoun, A.; Jelidi, A.; Chaabouni, M. Evaluation of the Performance of Sulfonated Esparto Grass Lignin as a Plasticizer–Water Reducer for Cement. Cement and Concrete Research 2003, 33, 995–1003. [Google Scholar] [CrossRef]
- Demuner, I.F.; Colodette, J.L.; Demuner, A.J.; Jardim, C.M. Biorefinery Review: Wide-Reaching Products through Kraft Lignin. BioResources 2019, 14, 7543–7581. [Google Scholar] [CrossRef]
- Inwood, J.P.W. Sulfonation of Kraft Lignin to Water-Soluble Value-Added Products, Lakehead University, 2014.
- Nehez, N. Lignin-Based Friction Material 1997.
- Váquez-Torres, H.; Canché-Escamilla, G.; Cruz-Ramos, C.A. Coconut Husk Lignin. I. Extraction and Characterization. Journal of Applied Polymer Science 1992, 45, 633–644. [Google Scholar] [CrossRef]
- Ding, T.Y.; Hii, S.L.; Ong, L. Comparison of Pretreatment Strategies for Conversion of Coconut Husk Fiber to Fermentable Sugars. BioResources 2012, 7. [Google Scholar] [CrossRef]
- Rowell, R.M.; Pettersen, R.; Tshabalala, M. Cell Wall Chemistry. In Handbook of Wood Chemistry and Wood Composites, Second Edition; CRC Press, 2013; pp. 33–72.
- De Silos, P.; Cuevas, R.I.; Perez, E. Converting Coconut Waste into Clean Energy: A Case Study of Pyrolyzed Bio-Oil Utilization with Supercritical Ethanol Transesterification in Quezon Province. In Proceedings of the 2024 Philippine Studies Association National Conference; 2024. [Google Scholar]
- Zhang, W.; Ma, Y.; Xu, Y.; Wang, C.; Chu, F. Lignocellulosic Ethanol Residue-Based Lignin–Phenol–Formaldehyde Resin Adhesive. International Journal of Adhesion and Adhesives 2013, 40, 11–18. [Google Scholar] [CrossRef]
- Galiwango, E.; Abdelrahman, N. Klason Method: An Effective Method for Isolation of Lignin Fractions from Date Palm Biomass Waste. Journal of Food Process Engineering 2018, 57, 46–58. [Google Scholar]
- Goldschmid, O. Determination of Phenolic Hydroxyl Content of Lignin Preparations by Ul-traviolet Spectrophotometry. Analytical Chemistry 1954, 26, 1421–1423. [Google Scholar] [CrossRef]
- Boeriu, C.G.; Bravo, D.; Gosselink, R.J.A.; van Dam, J.E.G. Characterization of Struc-ture-Dependent Functional Properties of Lignin with Infrared Spectroscopy. Industrial Crops and Products 2004, 20, 205–218. [Google Scholar] [CrossRef]
- Servoday Plants & Equipments Limited Detailed List of Various Biomass Materials with Their Lignin Content Percentages: Napier Grass Available online:. Available online: https://napiergrass.in/detailed-list-of-various-biomass-materials-with-their-lignin-content-percentages/ (accessed on 1 May 2025).
- Lebedeva, D.; Hijmans, S.; Mathew, A.P.; Subbotina, E.; Samec, J.S. Waste-to-Fuel Approach: Valorization of Lignin from Coconut Coir Pith. ACS Agricultural Science & Technology 2022, 2, 349–358. [Google Scholar] [CrossRef]
- Faix, O. Classification of Lignins from Different Botanical Origins by FT-IR Spectroscopy. Holzforschung 1991, 45, 21–28. [Google Scholar] [CrossRef]
- Constant, S.; Wienk, H.L.; Frissen, A.E.; de Peinder, P.; Boelens, R.; van Es, D.S.; Grisel, R.J.; Weckhuysen, B.M.; Huijgen, W.J.; Gosselink, R.J.; et al. New Insights into the Structure and Composition of Technical Lignins: A Comparative Characterization Study. Green Chemistry 2016, 18, 2651–2665. [Google Scholar] [CrossRef]
- Anuchi, S.O.; Campbell, K.L.; Hallett, J.P. Effective Pretreatment of Lignin-Rich Coconut Wastes Using a Low-Cost Ionic Liquid. Scientific Reports 2022, 12. [Google Scholar] [CrossRef]
- Sammons, R.J.; Harper, D.P.; Labbé, N.; Bozell, J.J.; Elder, T.; Rials, T.G. Characterization of Organosolv Lignins Using Thermal and FT-IR Spectroscopic Analysis. BioResources 2013, 8. [Google Scholar] [CrossRef]
- Watkins, D.; Nuruddin, M.; Hosur, M.; Tcherbi-Narteh, A.; Jeelani, S. Extraction and Charac-terization of Lignin from Different Biomass Resources. Journal of Materials Research and Technology 2015, 4, 26–32. [Google Scholar] [CrossRef]
- Rencoret, J.; Ralph, J.; Marques, G.; Gutiérrez, A.; Martínez, Á.T.; del Río, J.C. Structural Characterization of Lignin Isolated from Coconut (Cocos Nucifera) Coir Fibers. Journal of Agricultural and Food Chemistry 2013, 61, 2434–2445. [Google Scholar] [CrossRef]
- Pandey, K.K.; Pitman, A.J. FTIR Studies of the Changes in Wood Chemistry Following Decay by Brown-Rot and White-Rot Fungi. International Biodeterioration & Biodegradation 2003, 52, 151–160. [Google Scholar] [CrossRef]
- Poljanšek, I.; Krajnc, M. Characterization of Phenol–Formaldehyde Prepolymer Resins by in-Line FT-IR Spectroscopy. Acta Chimica Slovenica 2005, 52, 238–244. [Google Scholar]
- Galdino, D.S.; Kondo, M.Y.; De Araujo, V.A.; Ferrufino, G.L.; Faustino, E.; Santos, H.F.; Christoforo, A.L.; Luna, C.M.; Campos, C.I. Thermal and Gluing Properties of Phenol-Based Resin with Lignin for Potential Application in Structural Composites. Polymers 2023, 15, 357. [Google Scholar] [CrossRef]
- Aysu, T.; Küçük, M.M. Biomass Pyrolysis in a Fixed-Bed Reactor: Effects of Pyrolysis Parameters on Product Yields and Characterization of Products. Energy 2014, 64, 1002–1025. [Google Scholar] [CrossRef]
- Al-Rubaye, A.H.; Jasim, D.J.; Ameen, H.F.; Al-Robai, H.A.; Al-Assal, J.R. The Impacts of Petroleum on Environment. In Proceedings of the IOP Conference Series: Earth and Environmental Science; 2023; Vol. 1158; p. 032014. [Google Scholar]
- Bobrowski, A.; Grabowska, B. FTIR Method in Studies of the RESOL Type Phenol Resin Structure in the Air Atmosphere in Some Time Intervals. Metallurgy and Foundry Engineering 2015, 41, 107–117. [Google Scholar] [CrossRef]
- Chatterjee, S.; Saito, T. Lignin-Derived Advanced Carbon Materials. ChemSusChem 2015, 8, 3941–3958. [Google Scholar] [CrossRef] [PubMed]
- El-Araby, R. Biofuel Production: Exploring Renewable Energy Solutions for a Greener Future. Biotechnology for Biofuels and Bioproducts 2024, 17. [Google Scholar] [CrossRef]
- Fang, W.; Alekhina, M.; Ershova, O.; Heikkinen, S.; Sixta, H. Purification and Characterization of Kraft Lignin. Holzforschung 2015, 69, 943–950. [Google Scholar] [CrossRef]
- Fini, E.; Ayat, S.; Pahlavan, F. Phenolic Compounds in the Built Environment. In Biochemistry; IntechOpen, 2022.
- Gellerstedt, G.; Tomani, P.; Axegård, P.; Backlund, B. Lignin Recovery and Lignin-Based Products. In Integrated forest biorefineries; Green Chemistry Series; Royal Society of Chemistry, 2012; pp. 180–210.
- Grace, K.; Sundar, P.; Arun, J.; Brindhadevi, K.; Hoang, Q.; Pugazhendhi, A. A Review on Recent Advancements in Extraction, Removal and Recovery of Phenols from Phenolic Wastewater: Challenges and Future Outlook. Environmental Research 2023, 237, 117005. [Google Scholar] [CrossRef]
- Korbag, I.; Saleh, S. Extraction of Lignin from Paper Industry Waste. International Journal of Applied Engineering Research 2014, 9, 19421–19428. [Google Scholar]
- Kun, D.; Pukánszky, B. Polymer/Lignin Blends: Interactions, Properties, Applications. European Polymer Journal 2017, 93, 618–641. [Google Scholar] [CrossRef]
- Li, P.; Xu, Y.; Yin, L.; Liang, X.; Wang, R.; Liu, K. Development of Raw Materials and Technology for Pulping—A Brief Review. Polymers 2023, 15, 4465. [Google Scholar] [CrossRef]
- Li, S.; Jiang, L.; Zhang, H.; Li, Z.; Wang, X. Recycling of Lignin: A New Methodology for Production of Water Reducing Agent with Paper Mill Sludge. Appita Journal 2009, 62, 379–382. [Google Scholar]
- Luo, H.; Abu-Omar, M.M. Chemicals from Lignin. In Encyclopedia of Sustainable Technologies; 2017; pp. 573–585.
- MasterBond Low Viscosity Adhesives, Sealants and Coatings Available online: https://www.masterbond.com/properties/low-viscosity-adhesives-sealants-and-coatings.
- Mohan, D.; Pittman, C.U.; Steele, P.H. Single, Binary and Multi-Component Adsorption of Copper and Cadmium from Aqueous Solutions on Kraft Lignin—a Biosorbent. Journal of Colloid and Interface Science 2006, 297, 489–504. [Google Scholar] [CrossRef] [PubMed]
- Norgren, M.; Edlund, H. Lignin: Recent Advances and Emerging Applications. Current Opinion in Colloid & Interface Science 2014, 19, 409–416. [Google Scholar] [CrossRef]
- Rech, O.; Duterne, H.; Blaizot, M.; Lehner, A.; Carrière, A.; Hiche, C. The Future of Oil Supply in the European Union: State of Reserves and Production Prospects for Major Suppliers. In Pro-ceedings of the The Shift Project; 2021.
- Rosas, J.M.; Berenguer, R.; Valero-Romero, M.J.; Rodríguez-Mirasol, J.; Cordero, T. Preparation of Different Carbon Materials by Thermochemical Conversion of Lignin. Frontiers in Materials 2014, 1. [Google Scholar] [CrossRef]
- Sojinu, S.; Ejeromedoghene, O. Environmental Challenges Associated with Processing of Heavy Crude Oils. In Processing of heavy crude oils – Challenges and opportunities; IntechOpen, 2019.
- Woźniak, A.; Kuligowski, K.; Świerczek, L.; Cenian, A. Review of Lignocellulosic Biomass Pre-treatment Using Physical, Thermal and Chemical Methods for Higher Yields in Bioethanol Production. Sustainability 2025, 17, 287. [Google Scholar] [CrossRef]
Figure 1.
3D surface plot showing effects of temperature (°C) and time (min) on lignin yield (g lignin / 10 g material).
Figure 1.
3D surface plot showing effects of temperature (°C) and time (min) on lignin yield (g lignin / 10 g material).
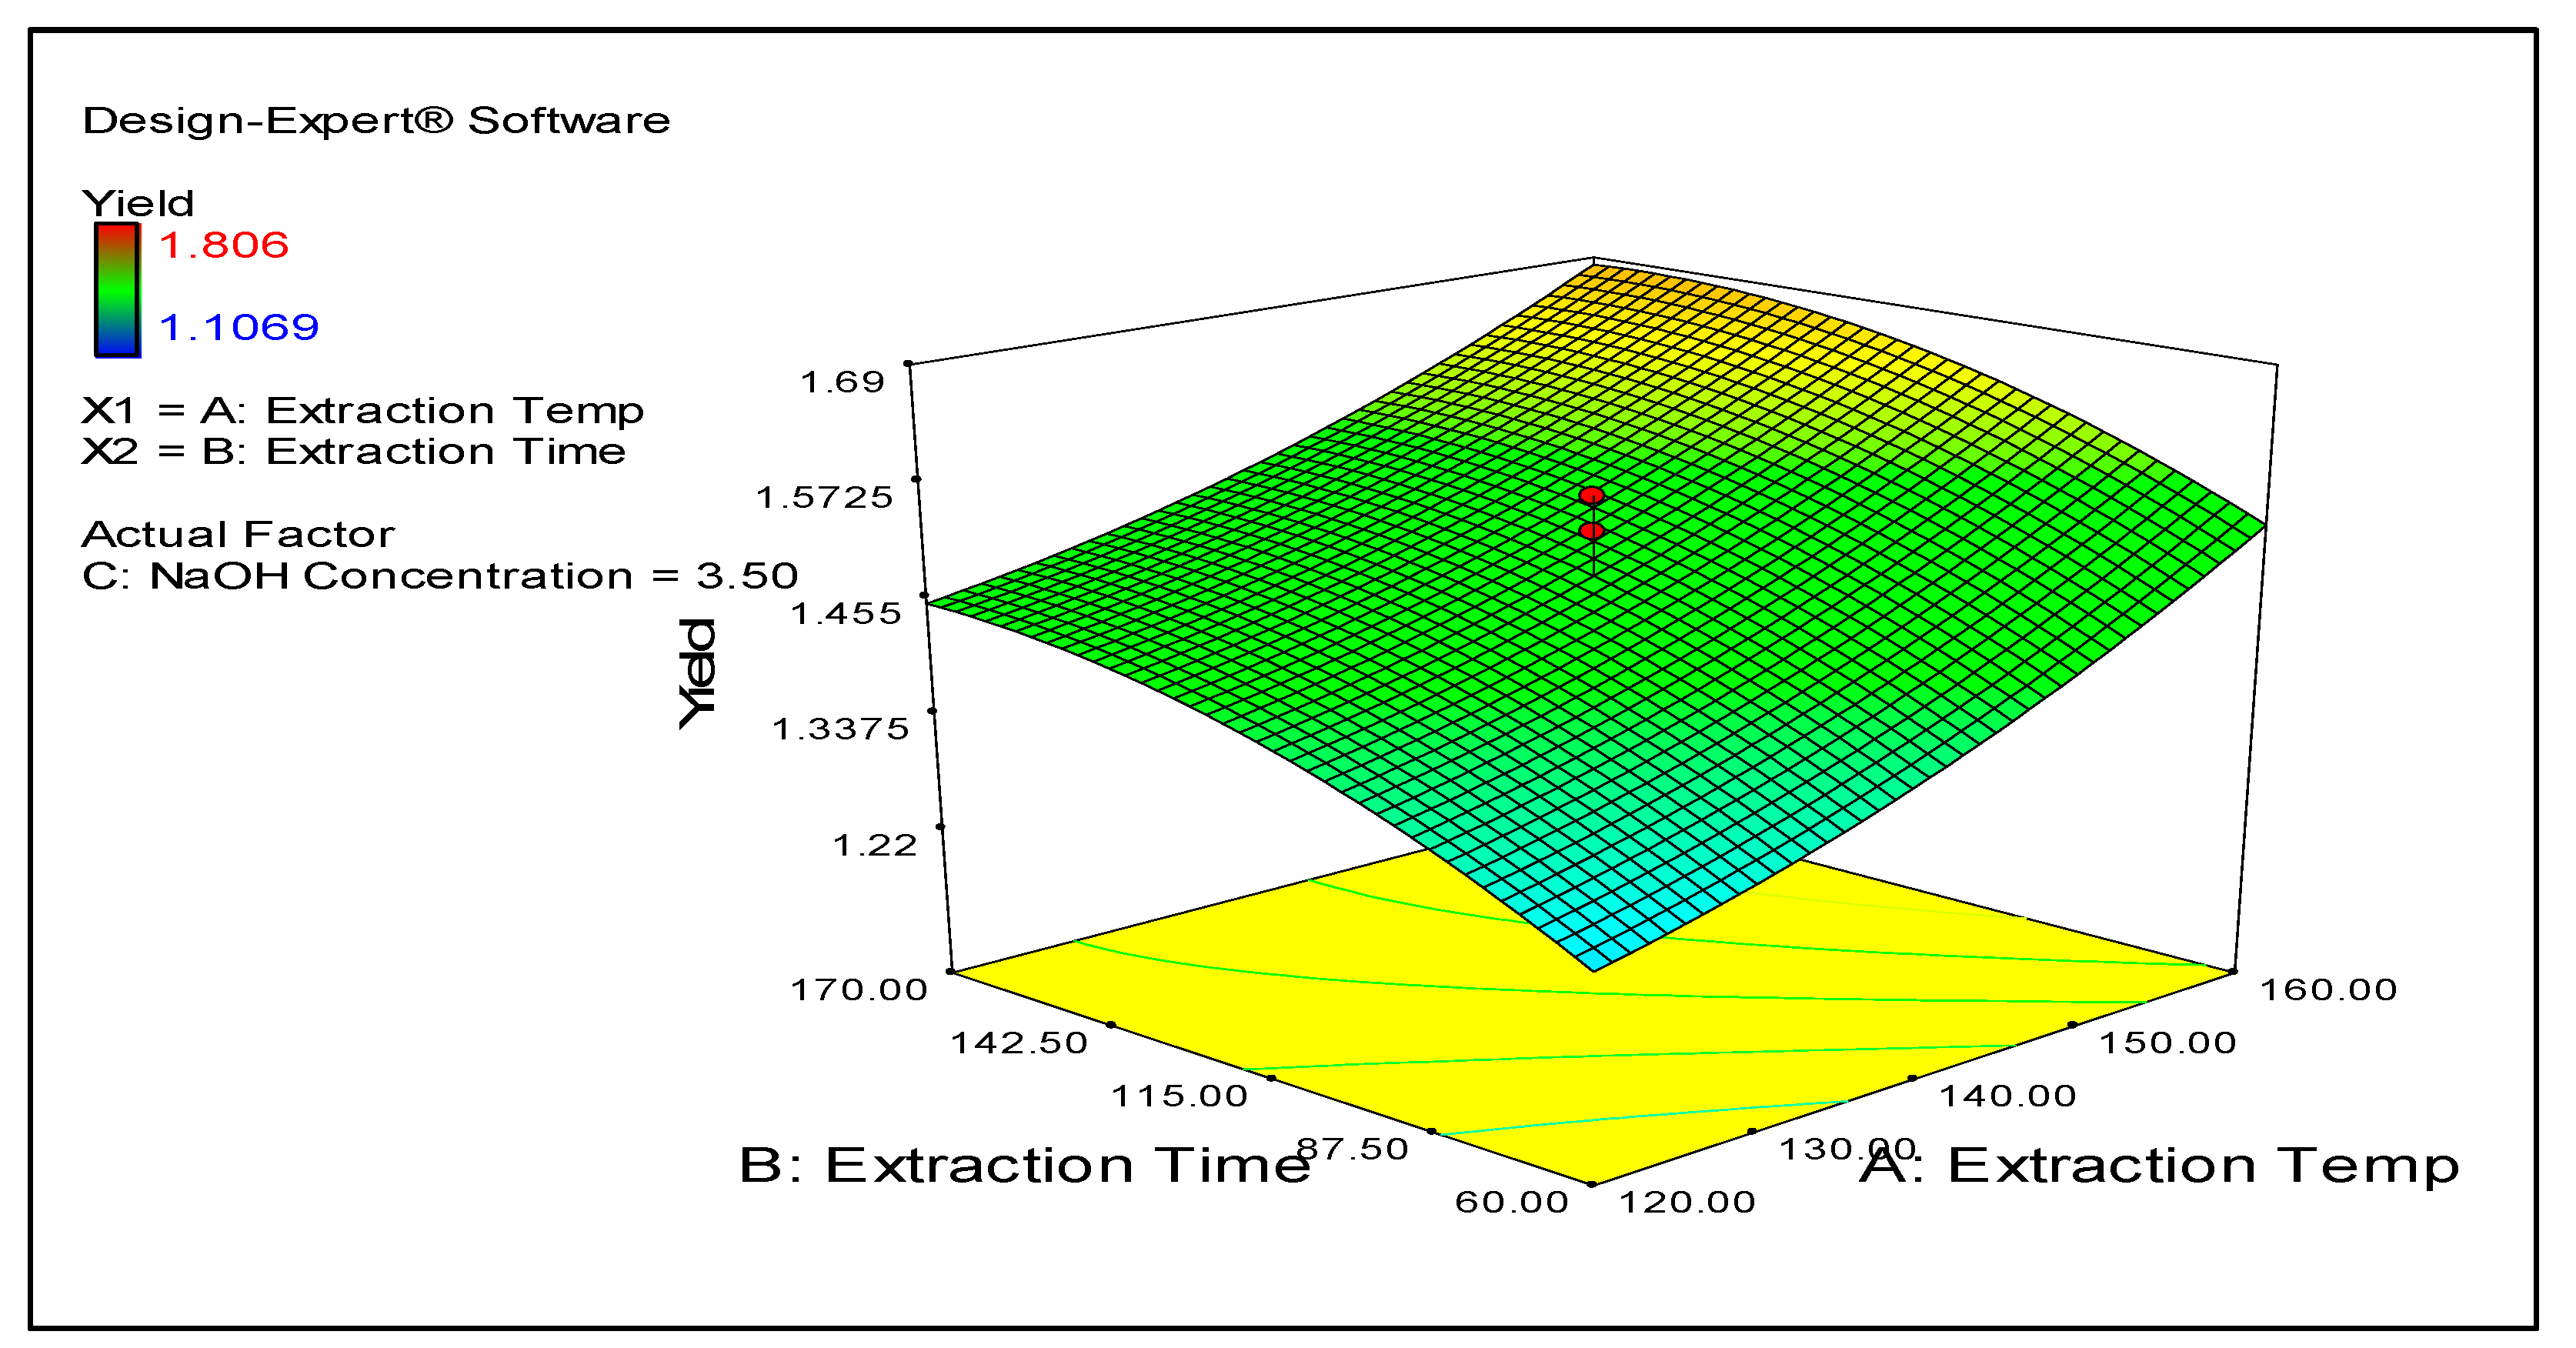
Figure 2.
2D plot showing effect of temperature (°C) on lignin yield (g lignin / 10 g material)
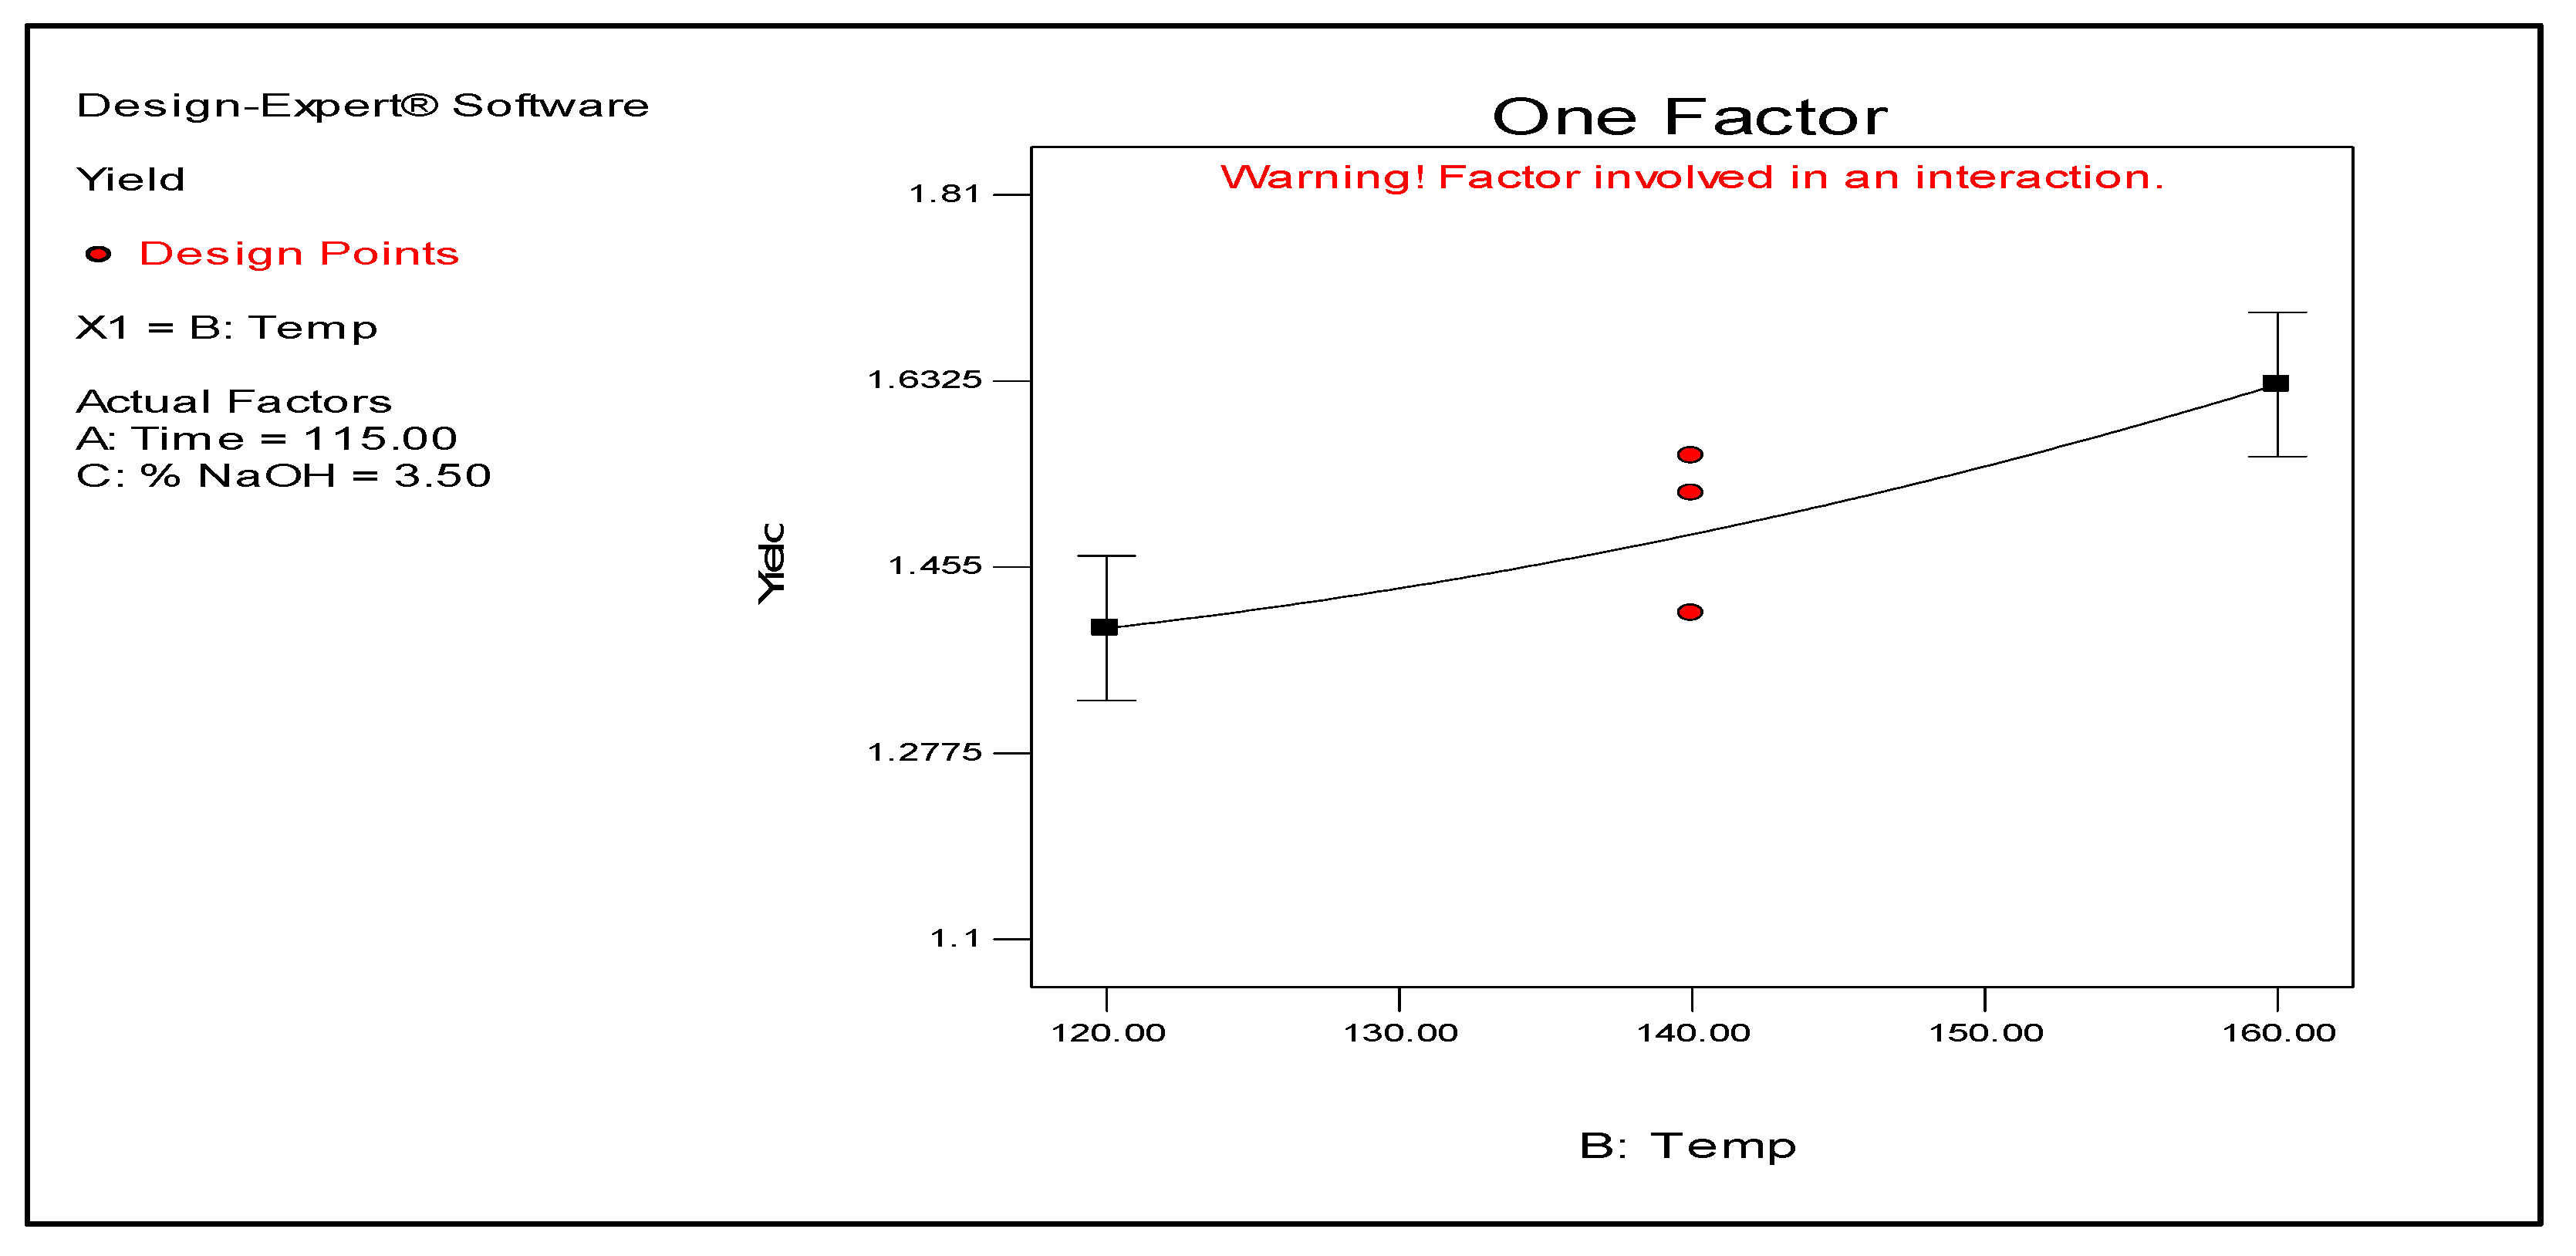
Figure 3.
2D plot showing effect of time (min) on lignin yield (g lignin / 10 g material)
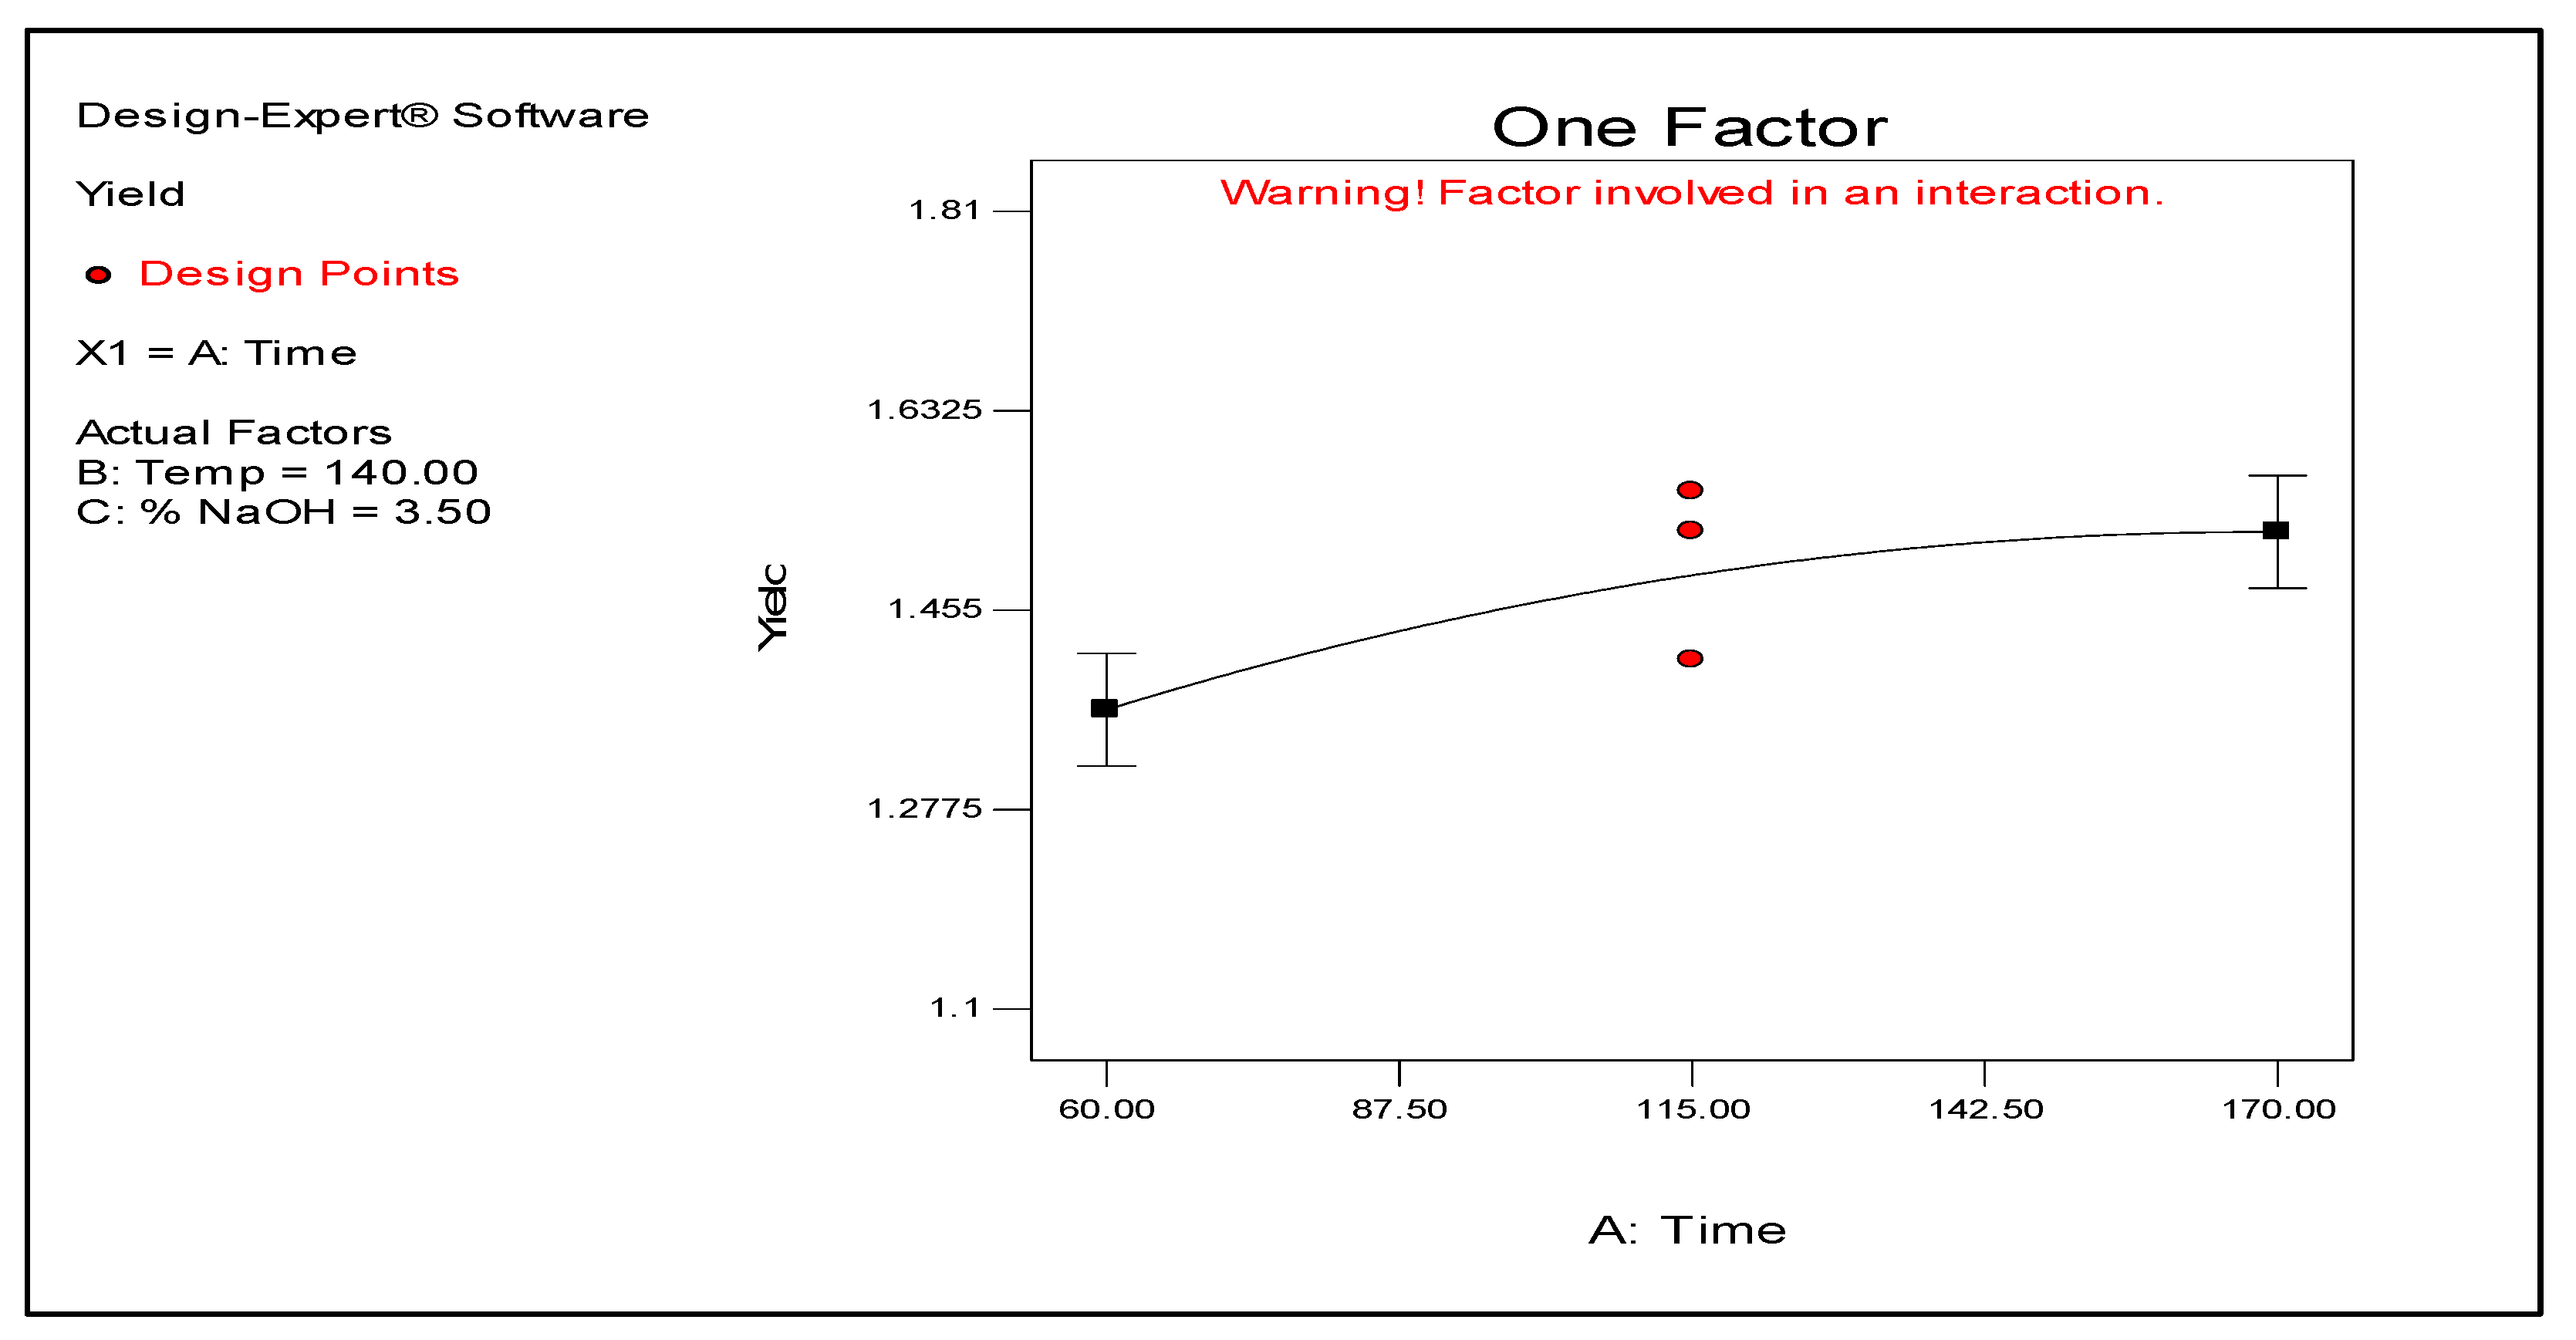
Figure 4.
2D plot showing interaction between time (min) and NaOH concentration (%) and their effect on the lignin yield (g lignin / 10 g material).
Figure 4.
2D plot showing interaction between time (min) and NaOH concentration (%) and their effect on the lignin yield (g lignin / 10 g material).
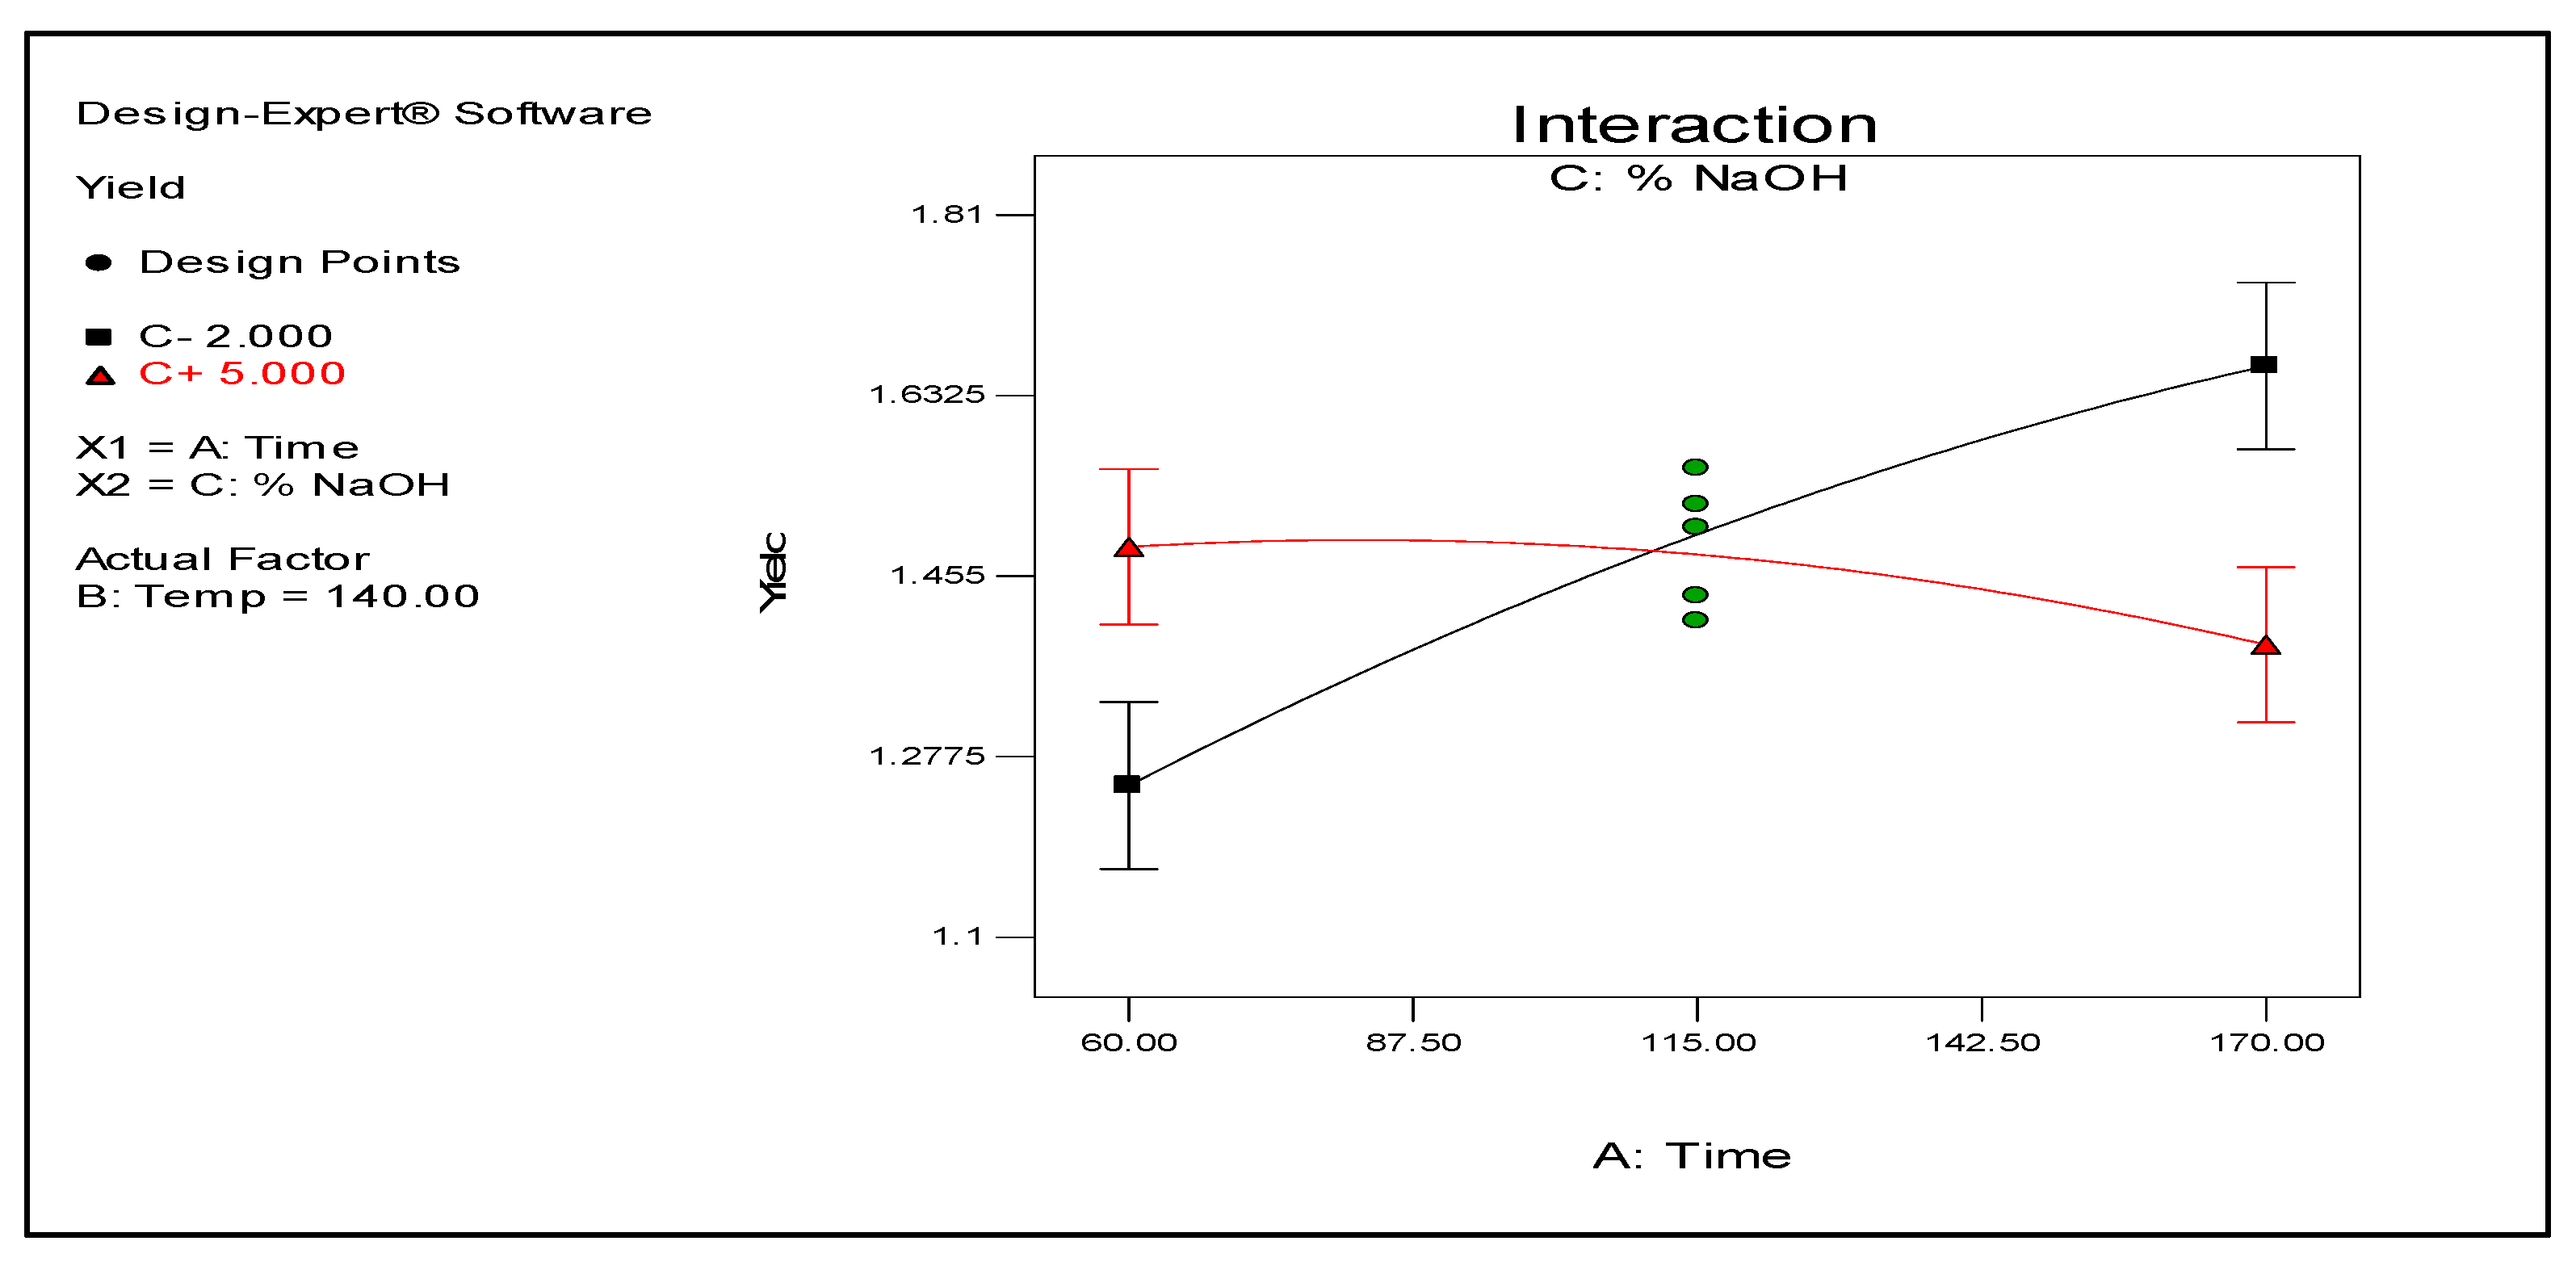
Figure 5.
2D plot showing interaction between temperature (°C) and NaOH concentration (%) and their effect on lignin yield (g lignin / 10 g material)
Figure 5.
2D plot showing interaction between temperature (°C) and NaOH concentration (%) and their effect on lignin yield (g lignin / 10 g material)
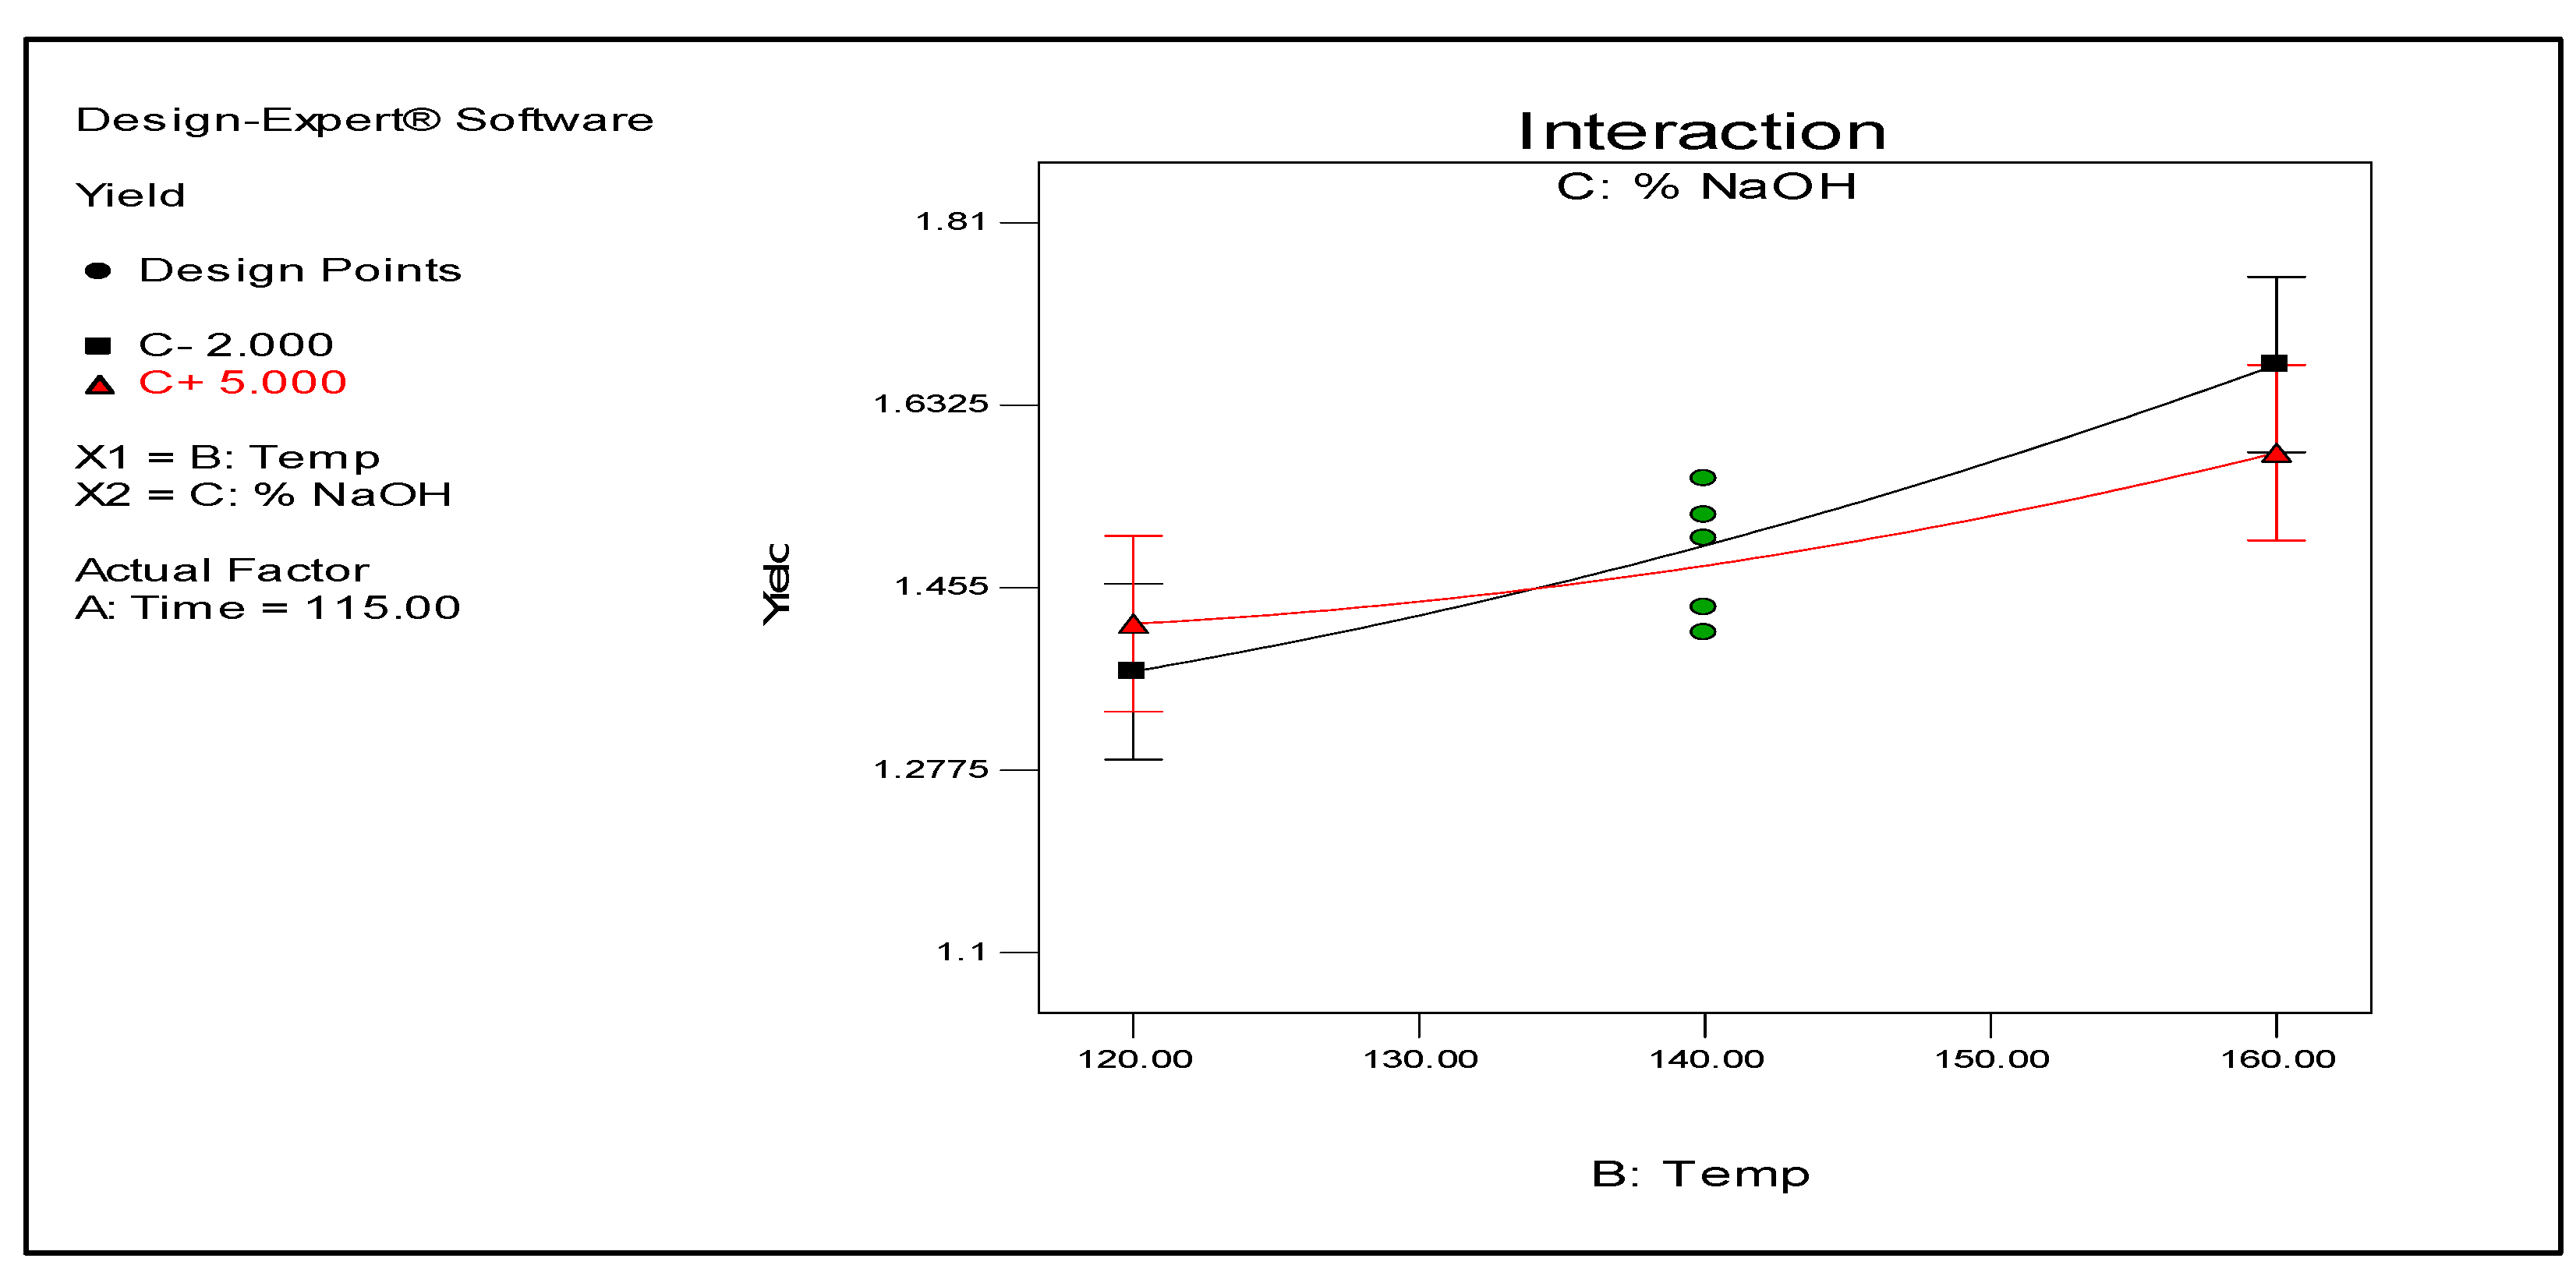
Figure 6.
3D surface plot showing effects of NaOH concentration (%) and time (min) on lignin yield (g lignin / 10 g material)
Figure 6.
3D surface plot showing effects of NaOH concentration (%) and time (min) on lignin yield (g lignin / 10 g material)
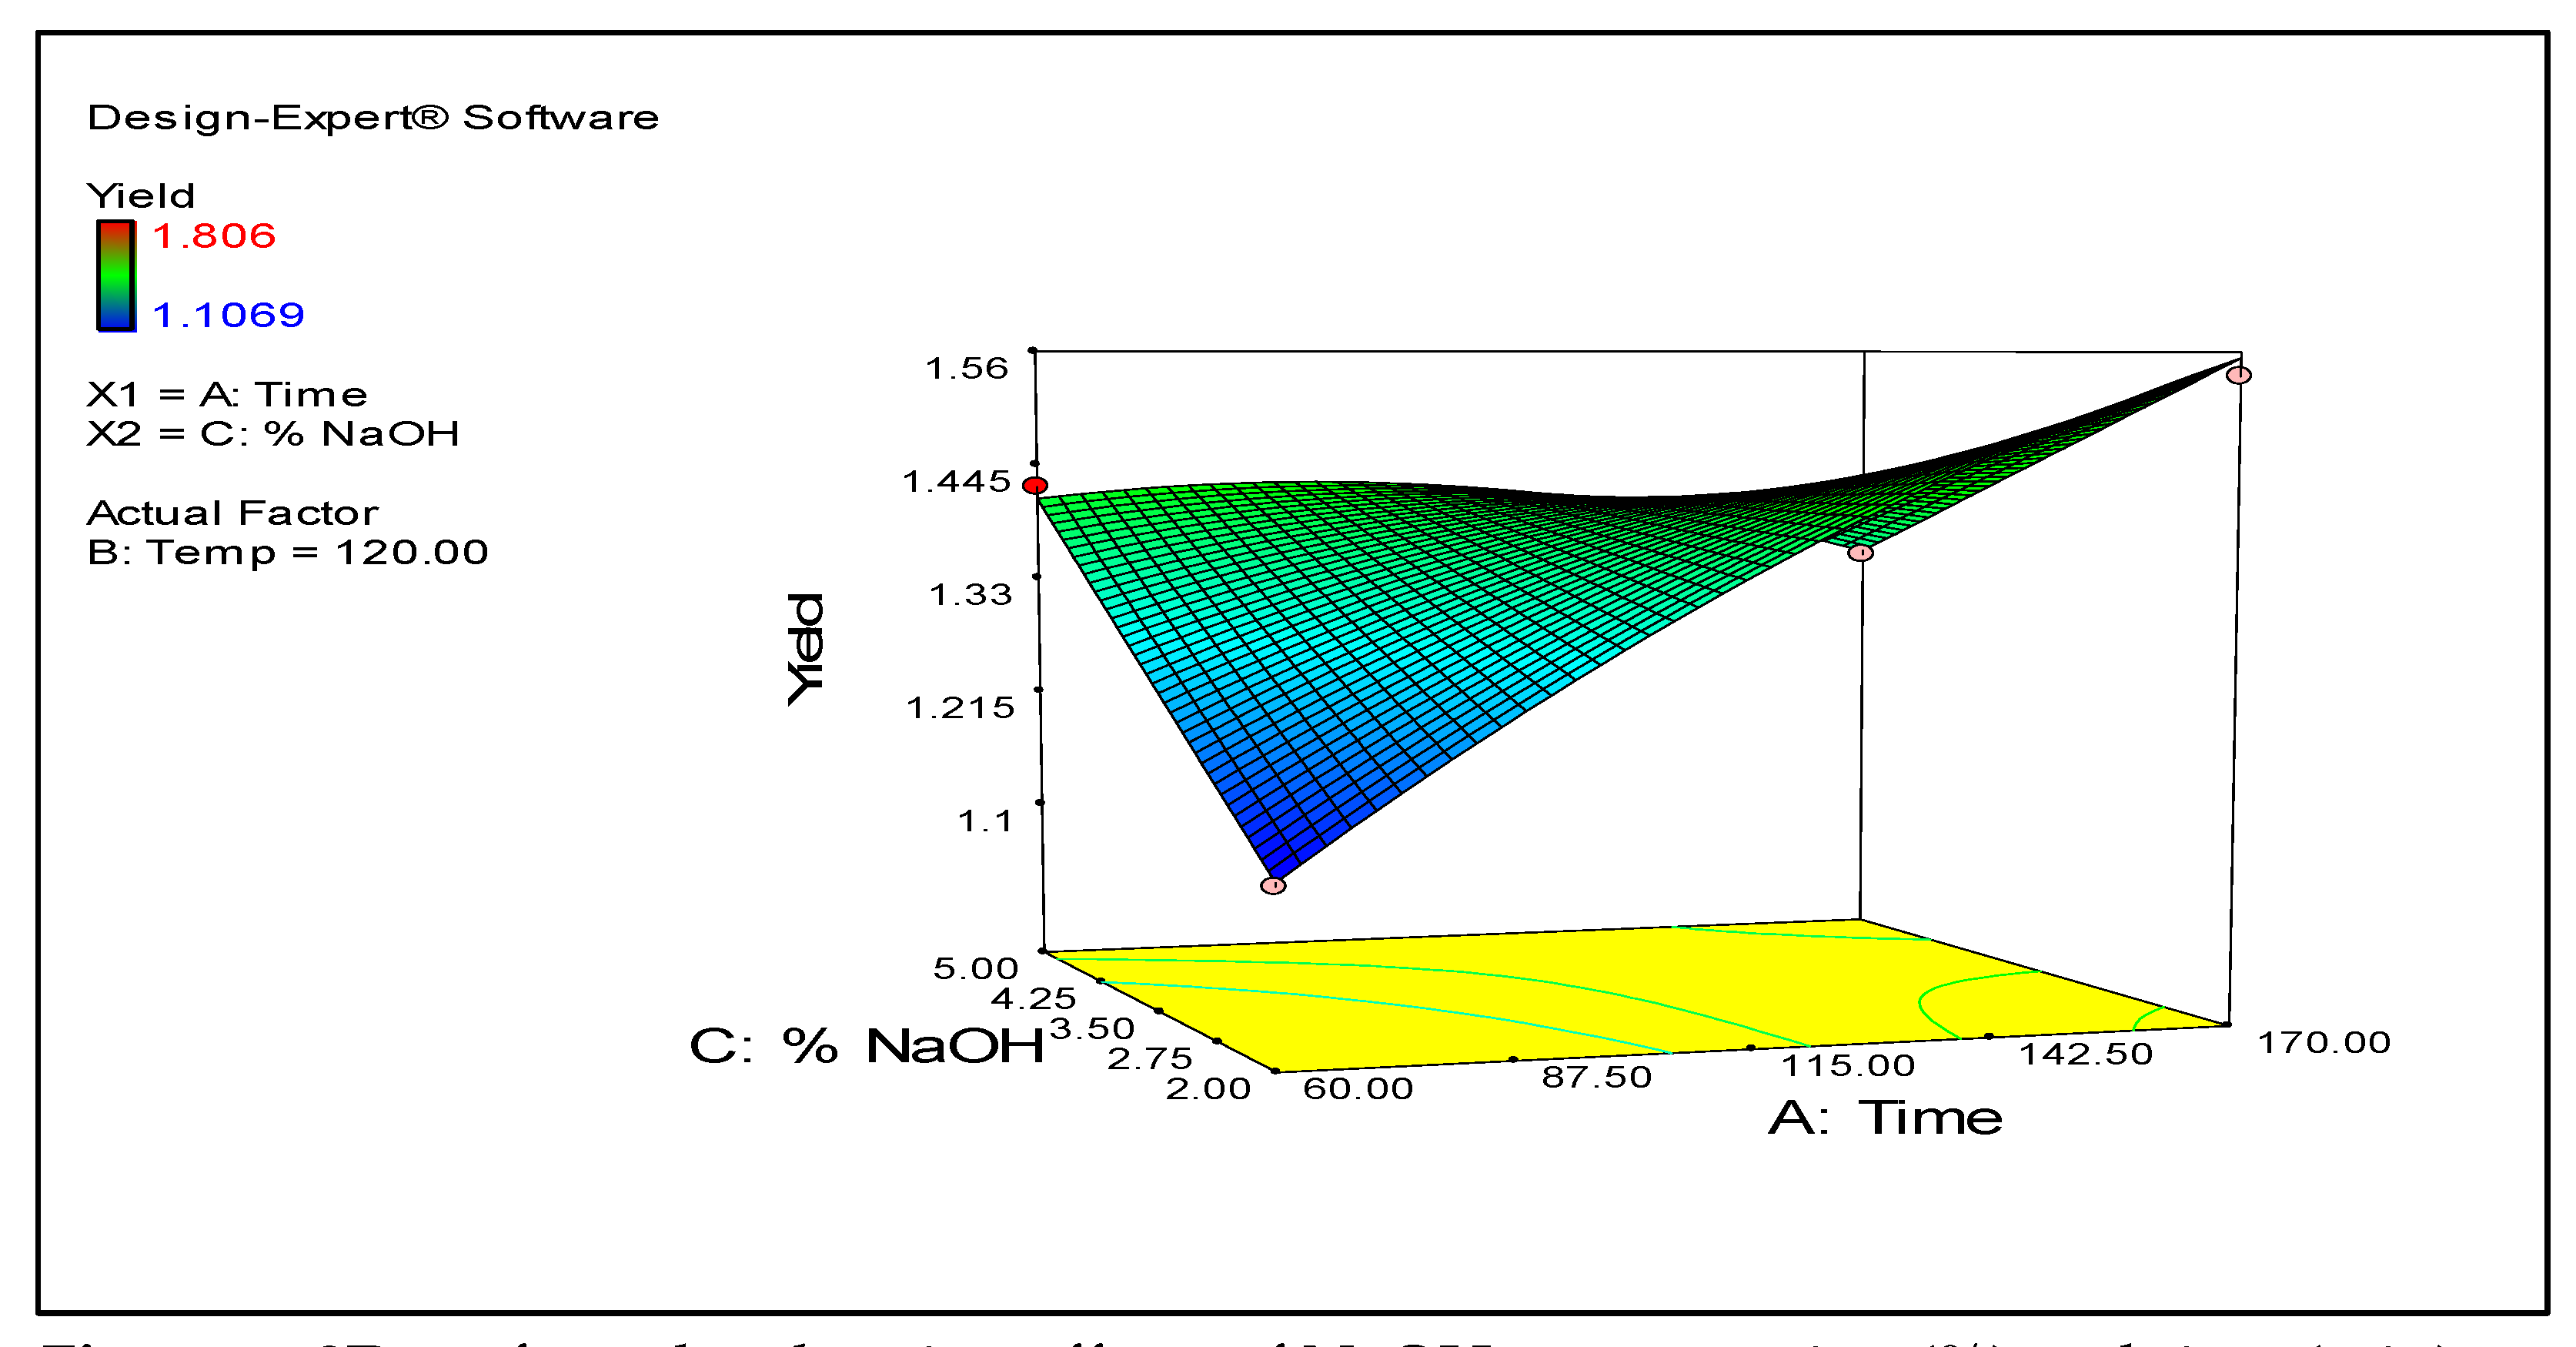
Figure 7.
Photo of ground extracted CPL.
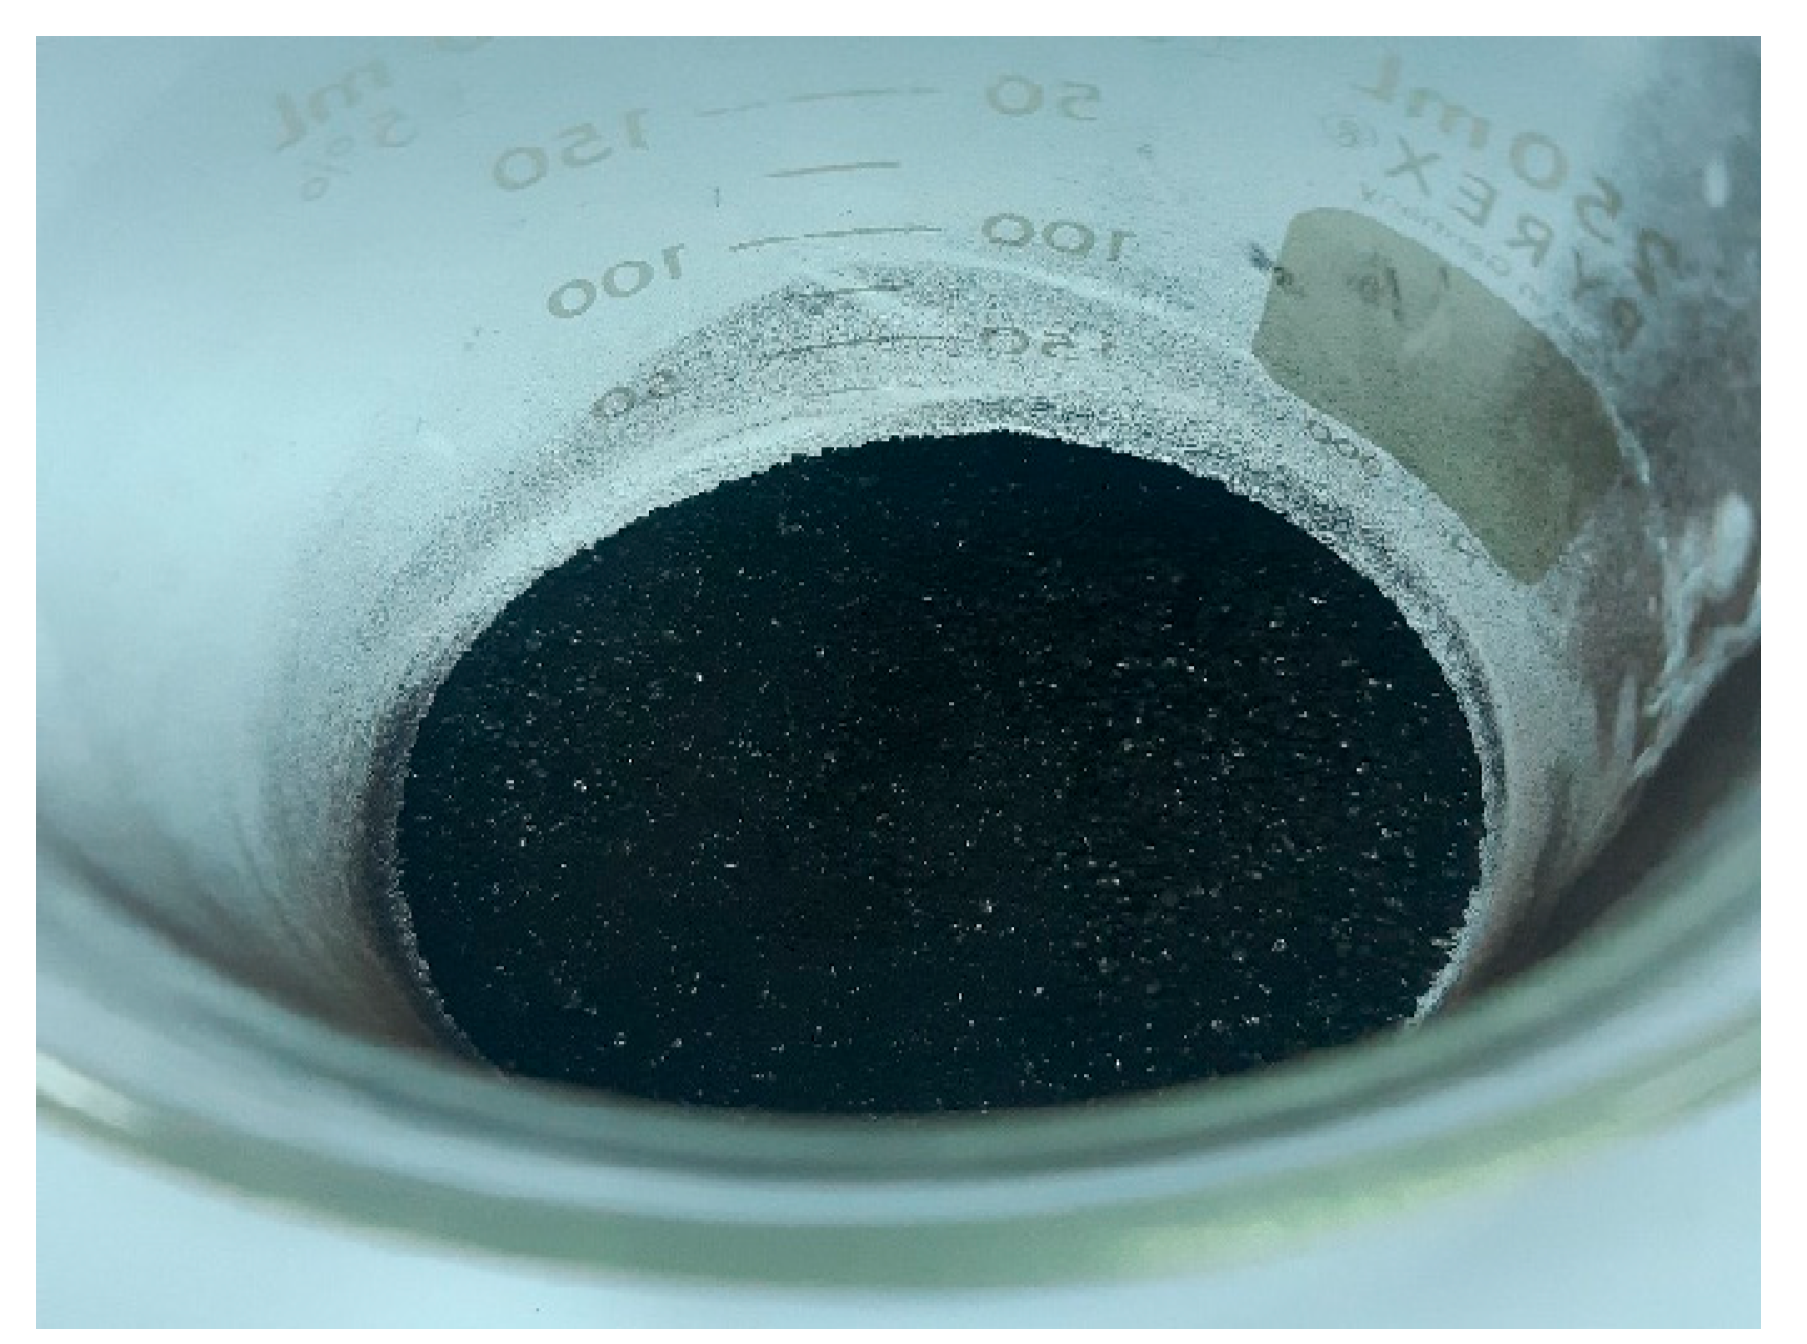
Figure 8.
FT-IR spectrum of CPL extracted via soda pulping method
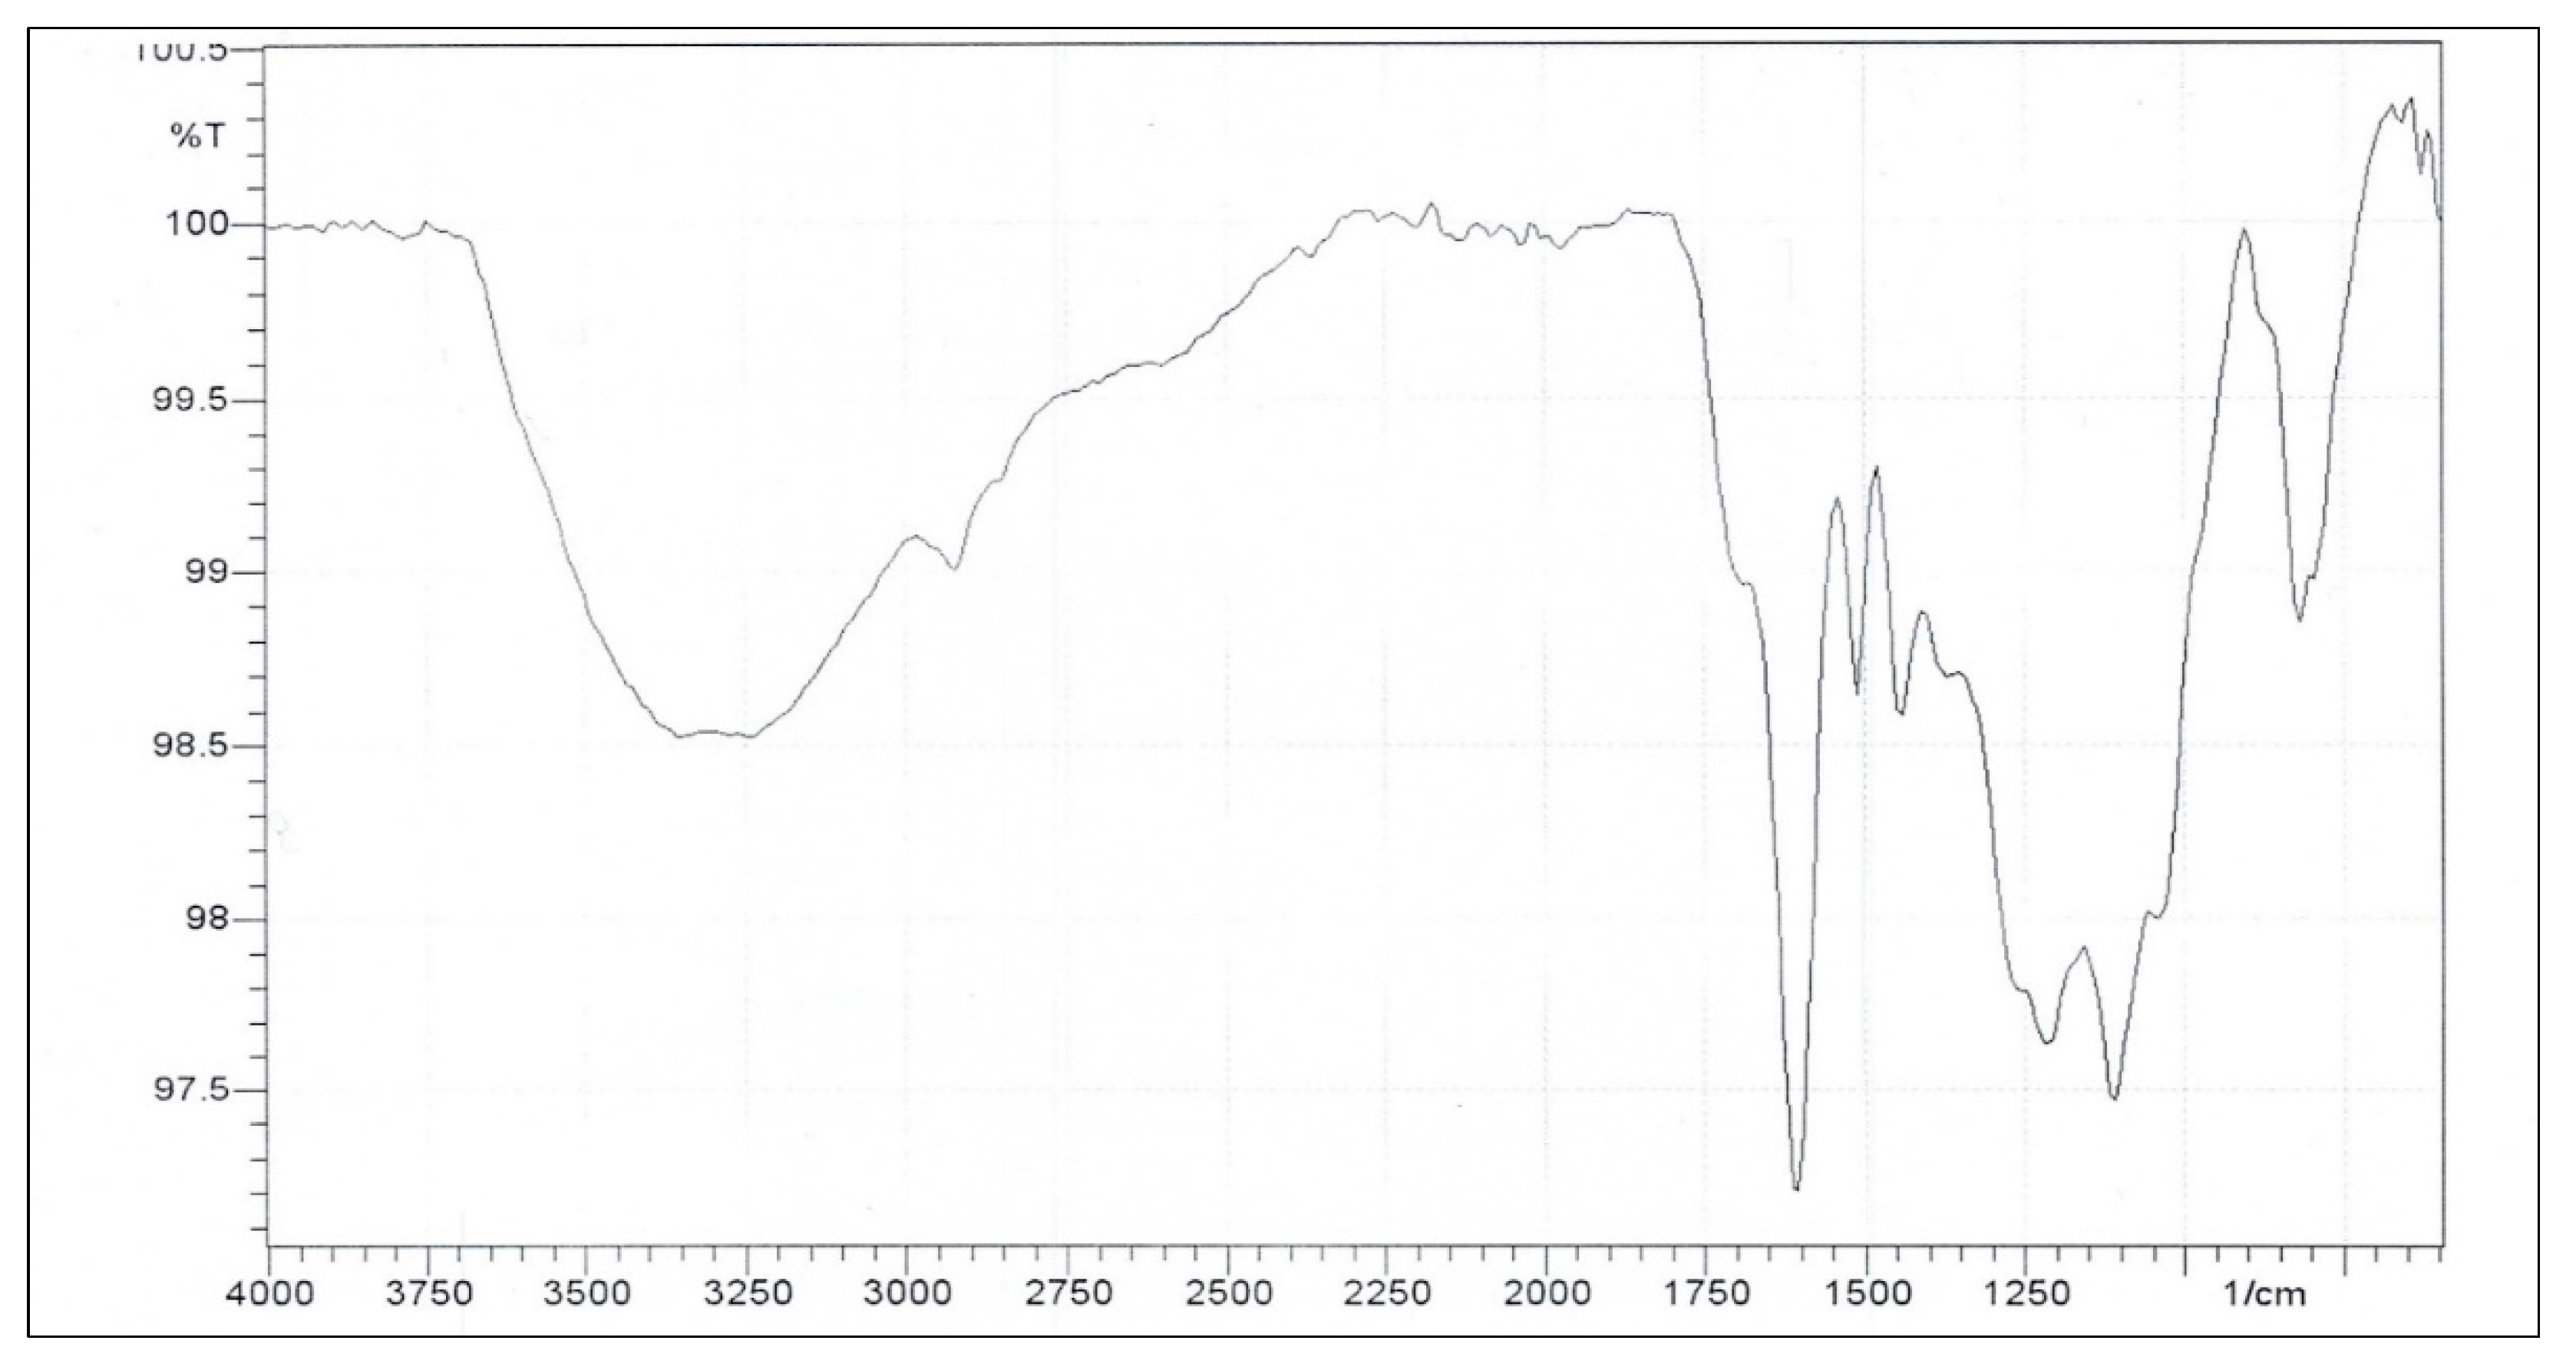
Figure 9.
FT-IR Spectrum of formulated LF Adhesive
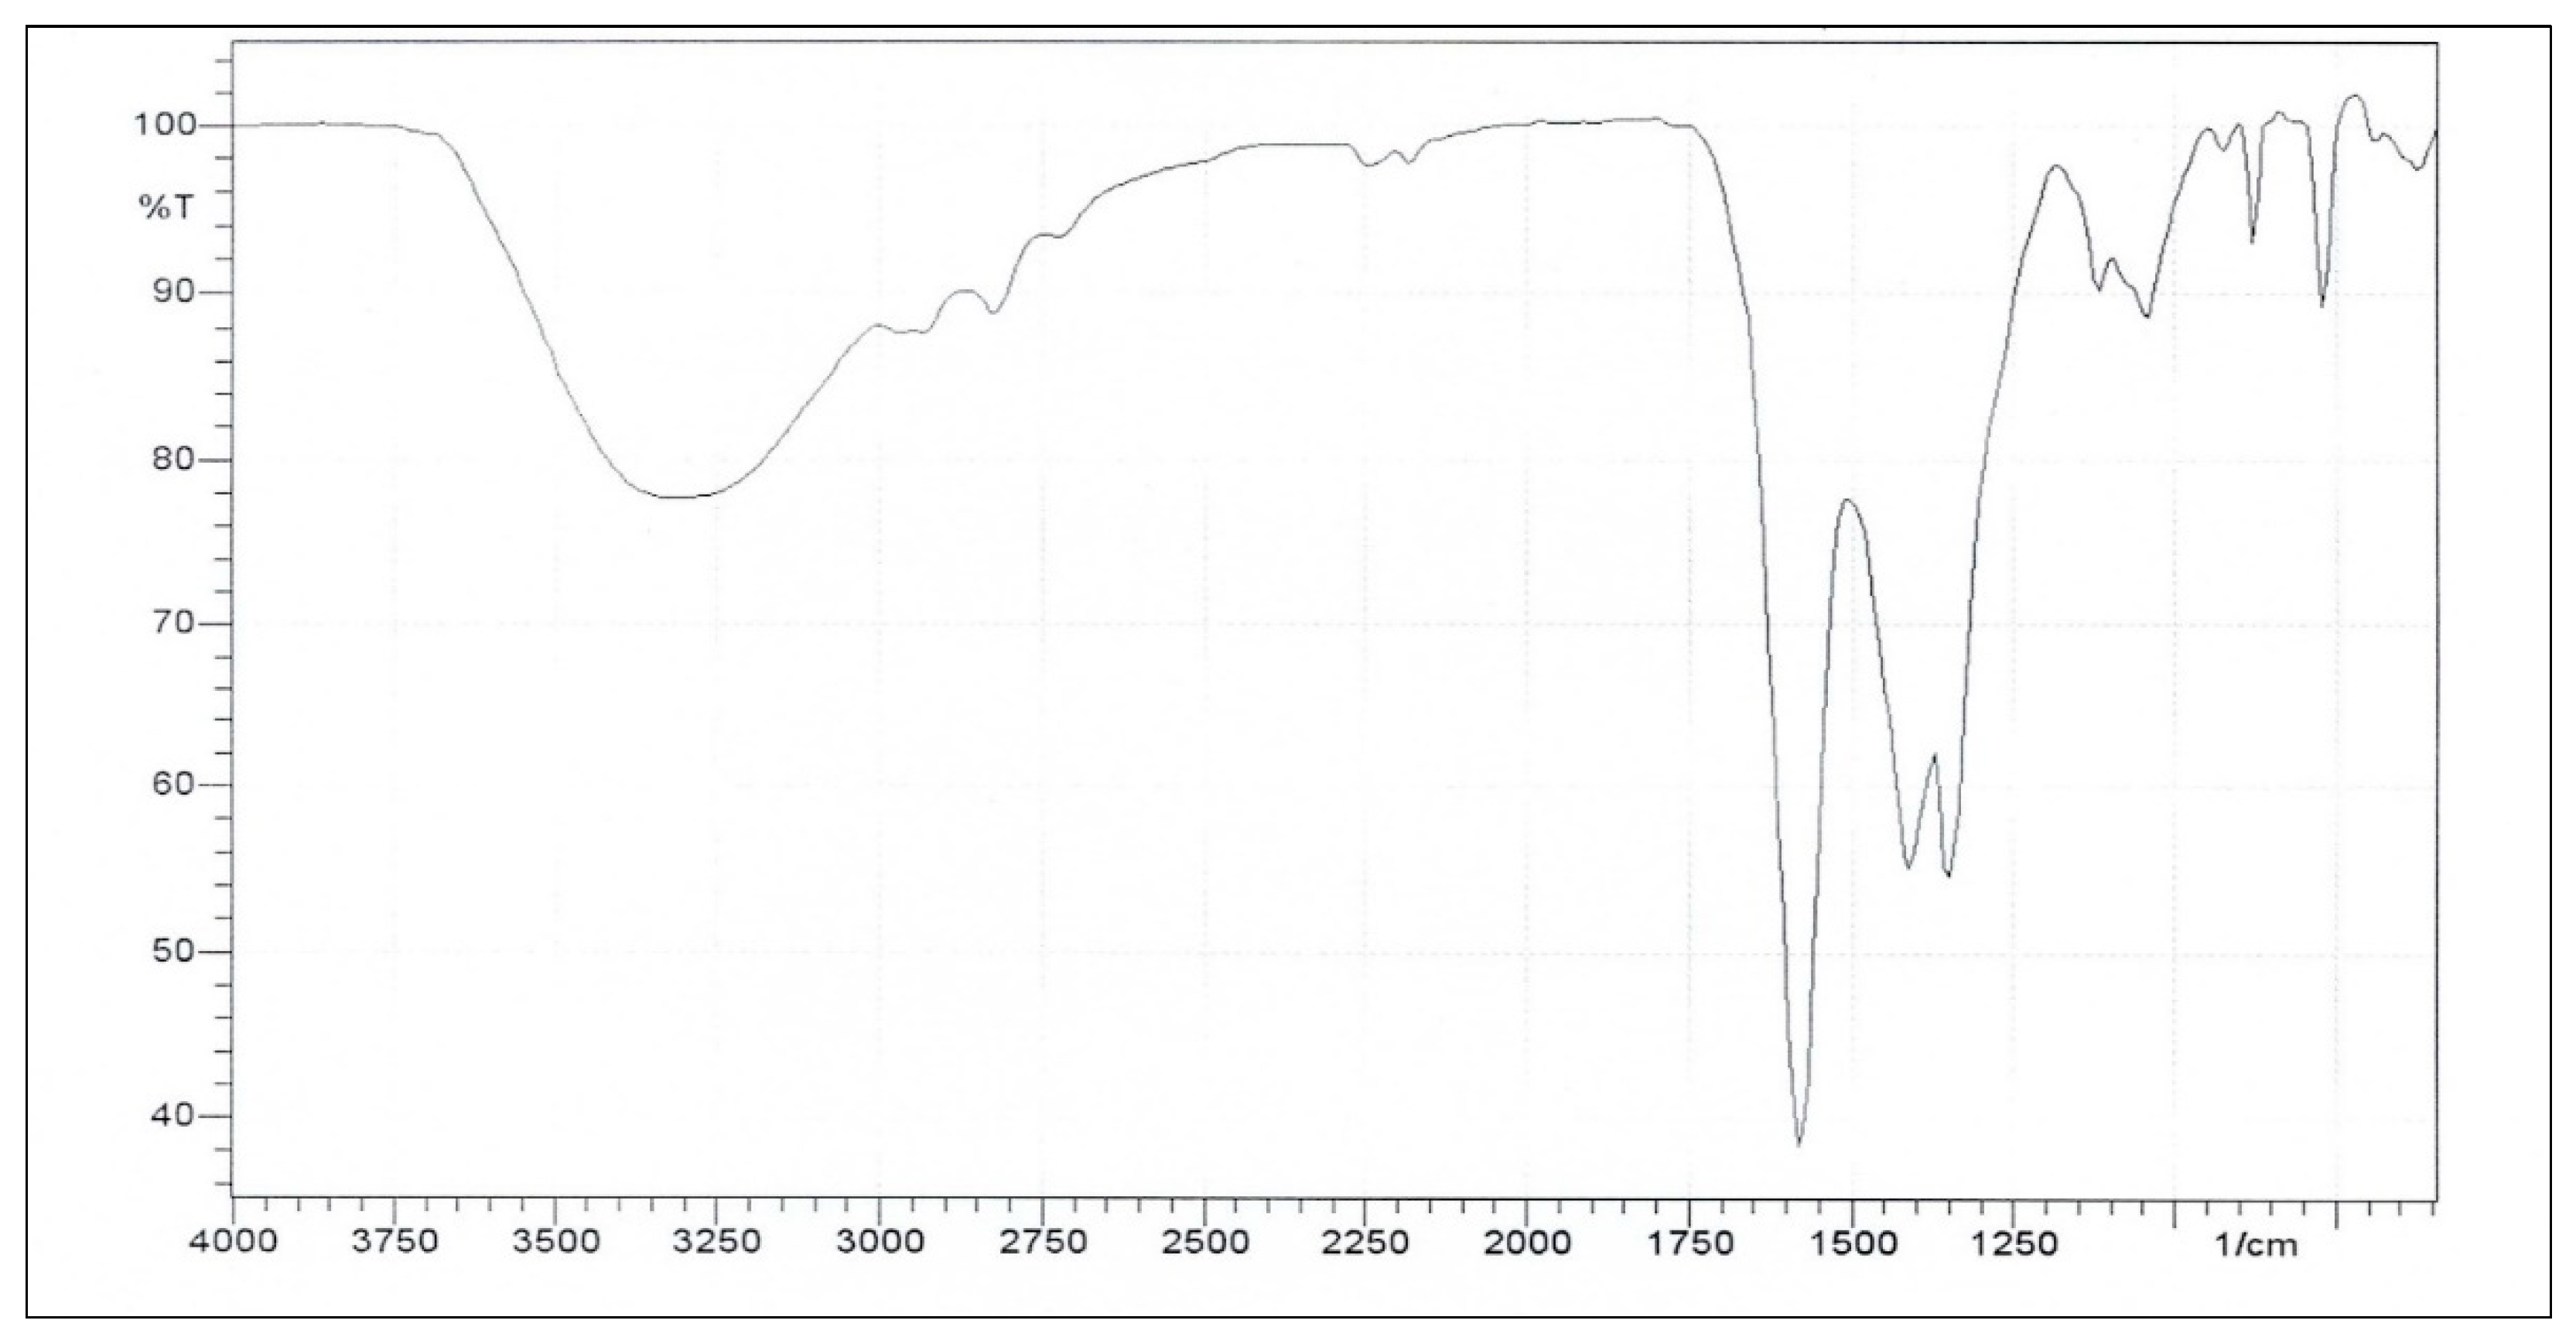
Table 1.
Design summary for soda pulping of CP showing the three (3) independent factors and the chosen response.
Table 1.
Design summary for soda pulping of CP showing the three (3) independent factors and the chosen response.
| Study Type | Response Surface | ||||
| Initial Design | Central Composite | ||||
| Design Model | Quadratic | ||||
| Factor | Name | Units | Type | Low Actual | High Actual |
| A | Time | min | Numeric | 60.00 | 170.00 |
| B | Temp | °C | Numeric | 120.00 | 160.00 |
| C | %NaOH | % | Numeric | 2.00 | 5.00 |
| Response | Units | ||||
| Yield | g lignin / 10 g material | ||||
Table 3.
Physicochemical properties of CP and CPL.
| Property | CP | CPL |
| Moisture Content (%) | 18.40 ± 0.62 | n/a |
| Ash (%) | 6.68 ± 0.13 | 1.15 ± 0.04 |
| Insoluble lignin content (%) | 45.02 ± 1.72 | 92.96 ± 0.32 |
| Acid soluble lignin (%) | 4.05 ± 1.40 | 0.0088 ± 0.0021 |
| Phenolic hydroxyl content | n/a | 0.80 ± 0.04 |
Table 4.
Shear Strength and Viscosity of PF and LF.
| Type | Viscosity (mm2/s) |
Mean Failing Load (Shear Strength, kg/cm2) |
| PF | 33.18 ± 0.25 | 1.78 ± 0.50 |
| LF | 10.90 ± 0.07 | 0.82 ± 0.21 |
Disclaimer/Publisher’s Note: The statements, opinions and data contained in all publications are solely those of the individual author(s) and contributor(s) and not of MDPI and/or the editor(s). MDPI and/or the editor(s) disclaim responsibility for any injury to people or property resulting from any ideas, methods, instructions or products referred to in the content. |
© 2025 by the authors. Licensee MDPI, Basel, Switzerland. This article is an open access article distributed under the terms and conditions of the Creative Commons Attribution (CC BY) license (http://creativecommons.org/licenses/by/4.0/).
Copyright: This open access article is published under a Creative Commons CC BY 4.0 license, which permit the free download, distribution, and reuse, provided that the author and preprint are cited in any reuse.


