Submitted:
19 November 2025
Posted:
20 November 2025
You are already at the latest version
Abstract
Lightning impulse tests are conducted on distribution equipment to assess whether the insulation level meets factory standards and to identify potential insulation defects. Such tests enhance the safety and stability of distribution network operation. Firstly, in order to address the issue of complex types and diverse structures of distribution network equipment, by using portable lightning impulse generators and adopting the method of automatically generating test reports, the requirements for test sites and test procedures have been simplified. Secondly, the generation and regulation of standard lightning waveforms were analyzed, and the influencing factors were pointed out. Finally, several distribution equipment such as disconnectors were subject to on-site impulse tests in accordance with the standards, and the general process of on-site standard lightning impulse tests was summarized.
Keywords:
transformer
; electrical equipment
; lightning impulse
; insulation withstand voltage test
1. Introduction
Lightning is one of the primary external threats to the safe and reliable operation of distribution networks. The resulting lightning overvoltage often lead to equipment insulation breakdown, line tripping, and widespread power outages. Statistics show that insulation damage caused by lightning overvoltage is the most common cause of distribution system operational incidents, severely impacting the continuity and safety of power grids. Lightning impulse testing is widely used to assess the resistance of distribution equipment to lightning. This test simulates the lightning overvoltage process, not only verifying whether the equipment can withstand the effects of lightning overvoltage but also identifying potential insulation defects. Therefore, lightning impulse testing plays an irreplaceable role in the development, type testing, and quality assurance of distribution equipment [1,2,3].
However, with the continuous expansion of distribution networks and the increasing complexity of operating environments, traditional laboratory testing methods are gradually exposing their limitations in practical applications. First, Distribution equipment varies in type—including switchgear, transformers, and vacuum circuit breaker—and their insulation withstand levels differ accordingly. Relying solely on conventional power frequency withstand voltage and impulse tests at the factory stage cannot truly reflect their lightning resistance performance under complex field conditions. Second, in recent years, power grid companies have tightened their supervision of the quality of power supplies and gradually implemented a random inspection system for networked equipment. There is an urgent need for a portable on-site lightning impulse test method to determine the insulation withstand capability of distribution network equipment and identify potential fault hazards [4].
The power distribution equipment is complex. Each type of equipment has different lightning impulse withstand levels. In order to verify the impact of lightning impulse on the insulation performance of different power distribution equipment, It is necessary to establish a standard method for lightning impulse testing. Through the test, the insulation performance of distribution network equipment is evaluated to ensure the insulation performance of the equipment and ensure the safe and stable operation of the distribution equipment during the power distribution process.
Due to the uneven quality levels of power distribution equipment manufacturers, frequent failures in distribution network circuits have seriously affected the reliable operation of distribution network circuits. Before the equipment leaves the factory, the manufacturer will conduct a routine withstand voltage test on the distribution network equipment. The test voltage waveform is generally divided into two types: power frequency voltage and impulse voltage. The power frequency voltage impulse test technology is relatively mature, while the impulse voltage test is difficult to complete at the equipment installation site. Therefore, only the conventional withstand voltage impulse test is often used. However, insulation failures caused by lightning strikes may still occur during the use of the distribution network [5,6,7].
Our study conducts lightning impulse withstand voltage tests on several types of power distribution equipment, based on the standard lightning waveforms specified in GB/T 16927.1 and IEC60060-1, to verify their insulation performance. To facilitate the adoption of more rigorous impulse voltage testing methods during manufacturing, storage, transportation, and field operation, a portable impulse voltage test device was used. An impulse test protocol is proposed for distribution equipment, including switchgear, transformers, and circuit breakers.
2. Distribution of Test Sites and Equipment
2.1. Portable Impulse Generator
The standard lightning impulse is generated by an impulse voltage generator. The impulse voltage generator usually adopts a Marx charge and discharge circuit. A Marx generator is a high-voltage device that uses capacitors to charge in parallel and then discharge in series [8].
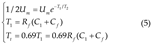
The portable impulse generator used in the test features a single-stage tower structure, consisting of a set of parallel-connected high-voltage capacitors for energy storage. The capacitors are charged by a high-voltage DC power supply and discharged in series through a copper ball and a resistor. Appropriate lightning wave head and tail resistors are selected based on the capacitance of the test specimen, and these resistors are easily removable. The main body is made of epoxy material, and the highest-voltage region is protected against aging and corona discharge, ensuring no visible corona occurs during charging. The device is lightweight and can be moved by a single person [9]. Figure 1 illustrates the portable impulse generator, and the corresponding parameters are presented in the Table 1.
Prior to use, the portable lightning impulse generator is verified for proper grounding, the measuring equipment is calibrated, and multiple no-load tests are conducted to compare voltage waveforms and timing parameters, ensuring data accuracy and stability.
2.2. Distribution of Test Sites
The test site, located in Tangshan, Hebei Province, is 20 meters long and 10 meters wide. The tests were carried out in a plain region, and no altitude correction was necessary. The experiments were performed under summer conditions, with a temperature of 32 °C and a relative humidity of 44 %, which did not require any further environmental adjustments. However, for tests conducted in high-altitude regions or under extreme temperature–humidity conditions, environmental correction factors must be applied to ensure rigorous and accurate results. Round steel is used as the grounding material for the test site grounding system, and the grounding resistance is preferably maintained at approximately 0.5 Ω to prevent the risk of electric shock. During the test, the device housing and portable impulse generator are connected to this grounding point. The equipment under test, the portable lightning impulse generator, and the control console are all located within the site. No other interfering equipment is present. The lightning impulse generator, test product, and control console are positioned within the minimum safe distance for high-voltage testing, and warning signs are posted to prevent unauthorized access. Figure 2 shows the site conditions for the lightning impulse test of power distribution equipment.
3. The Generation Principle Of Standard Lightning Impulse
A standard lightning impulse can be generated using a lightning impulse voltage generator. The standard GB-T16927.1-2011 and IEC60060-1 standards define the standard lightning impulse voltage as a non-periodic transient voltage that rapidly rises to a peak value and then slowly decreases to zero. Three basic parameters are defined to describe the waveform shape: peak voltage, front time and time to half-value. The waveform can be approximated using a double exponential wave: the front time T1=1.2μs±30%, and the time to half-value T2=50μs±20% [10].
3.1. Principle of Lightning Impulse Generator
According to the basic principle of the impulse voltage generator, it can be represented by the equivalent circuit shown in Figure 3. The charging process can be summarized as follows: the main capacitor C0 is charged by the rectified power supply, and then it transfers charge to the wavefront capacitor Cf through Rf. To ensure that the voltage on Cf approaches the original voltage of C0, it is necessary that C0 ≫ Cf. The discharge process proceeds as follows: C₀, Cf, and the resistor Rf form the wavefront discharge circuit, corresponding to loop 3 in Figure 3. After C₀ and Cf become fully charged, they discharge to ground through Rf, thereby generating the wavefront portion of the impulse. Meanwhile, C₀ in series with Rt and Cf in series with Rt constitute two RC networks, represented by loops 1 and 2 in Figure 3. Through these paths, C₀ and Cf discharge jointly to ground via Rt, producing the wavetail. By appropriately selecting the wavefront and wavetail resistances during the combined discharge of C₀ and Cf, the desired standard lightning impulse waveform can be obtained.
The differential equation corresponding to the equivalent circuit of the lightning impulse generator in Figure 3 can be formulated as Equation (1).
Where, , , in the initial state, the voltage across C0 is U0, and the voltage across Cf = 0, so u(0)=0, . Solving the differential equation, the time domain expression is given by (2):
Where, , p1, p2 are the two characteristic roots of the differential equation.
From equation (2), we can see that the standard lightning waveform is type of double exponential function. Figure 4 shows the standard lightning impulse waveform along with its definition.
3.2. The Influence of Wave Modulation Circuit on Lightning Impulse Waveform
The standard GB-T16927.1 defines the front time Tf as 1/0.6 of the time interval between 30% and 90%. The times corresponding to the 30%, 90% and 50% peaks are recorded as t1, t2 and t50 which correspond to points A, B and Q in Figure 4, respectively [11,12,13,14]. The front time can be expressed by (3) as:
The front time of the lightning impulse waveform, corresponding to 30% and 90% of the voltage peak, can be determined from the time-domain expression of the standard lightning impulse waveform, as shown in Equation (4):
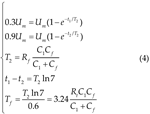
The time to half-value is the time interval from the apparent origin to the moment when the test voltage reaches half its value. When the voltage peak is 50%, the time to half-value is derived from the time-domain representation of the standard lightning impulse waveform, as given in (5):
According to equations (4) and (5), the front time of the lightning impulse voltage generated by the impulse generator is proportional to the wavefront resistance Rf, and the time to half-value is proportional to the wavetail resistance Rt.
4. Experimental Determinations
Traditional on-site lightning impulse tests for power distribution equipment usually rely on bulky and complex test equipment, which makes it difficult to meet the withstand voltage verification requirements under on-site conditions. To address this issue, this paper proposes an on-site impulse test process for power distribution equipment and applies a portable lightning impulse generator to conduct lightning impulse withstand voltage tests on typical power distribution equipment such as transformers, circuit breakers and disconnectors to evaluate their insulation performance when subjected to lightning overvoltage. In order to cope with complex factors such as temperature and humidity changes, electromagnetic interference and construction safety in on-site tests, this paper further establishes a digital test management model to achieve stable data collection, automatic recording and report generation, and effectively reduce the number of high-voltage on-site operators.
4.1. Experimental Simulation Analysis
To evaluate the performance of different distribution equipment under on-site lightning impulse tests, theoretical simulations of common distribution devices were conducted using MATLAB. By simulating the test procedures and parameters in advance, the feasibility of the test scheme was verified, the equipment responses were assessed, and the test parameters were optimized, thereby reducing risks and improving test efficiency and data reliability. Based on the capacitance characteristics of transformers, circuit breakers, and isolators, and following the analysis in Section 3.2, appropriate front- and tail-wave resistance parameters of the lightning impulse generator were determined, and the good agreement between the simulation results and the on-site test results presented below confirms the validity of the theoretical analysis and parameter selection [15]. The specific test parameters for the three types of devices are listed in Table 1, and the simulation results are shown in Figure 5, Figure 6 and Figure 7.

Table 2.
Simulation parameters for the test.
| Name | Wavefront resistance(Ω) | Wavetial resistance(Ω) |
| transformer | 120.00 | 80.00 |
| Vacuum circuit breaker | 250.00 | 34.29 |
| disconnect switch | 100.00 | 37.04 |
4.2. Experimental Data Management and Automated Test Reporting
In actual lightning impulse tests, the field environment is complex and often accompanied by uncertainties such as temperature fluctuations, electromagnetic interference, and operational complexity. These problems not only affect the integrity and accuracy of data records, but also increase the safety risks of personnel approaching high-voltage equipment. To this end, this paper established a test report automatic generation system to improve data reliability and reduce personnel risks [16].
The data management and reporting automation function is developed and implemented based on the Qt platform. By identifying and storing oscilloscope data, the test process data is collected, and data management and reporting are automated. The system can collect key parameters such as impulse peak voltage, front time, and time to half-value in real time. The waveform file is stored in *.DAT format, and the numerical data is saved in Excel format. After the test is completed, the system can automatically generate and save standardized reports, realizing digital management of the entire process from data collection, processing to archiving. Automated recording and remote operation significantly reduce the time personnel stay at the high-voltage site, improving test efficiency while effectively reducing safety risks. The report generation system option interface is shown in Figure 8.
The system consists of a data acquisition module, a real-time data analysis module, a communication module, and a test report generation module. The architecture of the test report automatic generation system is shown in Figure 9.
(1) Data acquisition module: The voltage signal generated during the test is processed by the signal modulation board, the collected data is cached, the test data is collected through oscilloscope channel 2, and the voltage signal obtained by the oscilloscope is imported into the host computer.
(2) Real-time data analysis module: This module identifies, stores, and optimizes the acquired data stream. Due to the large data interference in field tests, the acquired data is subject to large noise interference. Therefore, an anti-interference method is introduced to smooth and denoise the pre-processed waveform, identify the processed data, and obtain the peak value, front time, time to half-value and other data required for the test.
(3) Communication module: The measurement system uses an oscilloscope as the impact test data acquisition device, and a computer as the control platform. The oscilloscope and the computer are connected through the TCP/IP protocol, and the computer is used to control data acquisition and data management.
(4) Test report generation module: By setting the parameters such as the save data type, save path, format, etc. on the computer, the system will automatically generate the impact test report in sequence according to the test time to facilitate the evaluation and management of the test data results.
4.3. Impulse Test of Common Power Distribution Equipment
To verify the withstand voltage of typical distribution network equipment, this study conducted lightning impulse tests in accordance with relevant standards. First, an insulation impulse test was performed on an on-load tap-changing oil-immersed transformer, model SZ20-M.RL400/10, following GB/T 1094.3, Power Transformers – Part 3: Insulation Levels, Insulation Tests, and External Insulation Clearances. The test procedure included one full-wave reference impulse at 50–70% of the rated full voltage, followed by three full-wave impulses at 100% of the rated full voltage [17,18,19]. If an external flashover occurred in the line or bushing gap, or if the oscillogram recorded on the specified measurement channel failed, the impulse test was considered invalid and had to be repeated. The test was deemed successful when no significant differences were observed between the voltage and current transient waveforms recorded at reduced voltage and full voltage. Standard lightning full-wave impulses were also applied to vacuum circuit breakers and disconnectors in accordance with GB/T 11022, Common Technical Requirements for High-Voltage Switchgear and Controlgear Standards [20].
Set the impulse test parameters according to the nameplate parameters of the tested equipment. The nameplate parameters of the tested transformer, circuit breaker, and disconnector are shown in Table 3 and Table 4 respectively.
4.3.1. Transformer On-Site Lightning Impulse Test
The transformer withstand voltage test is carried out using a full-wave lightning voltage of 75 kV. The transformer has two internal winding configurations: a delta connection on the high-voltage side and a Y connection on the low-voltage side. Considering the internal winding arrangement, a standard full-wave lightning impulse is sequentially applied to phases A, B, and C on the high-voltage side [21]. The wiring diagram of the test transformer is shown in Figure 10. Taking the phase A test as an example, phase A is connected to the lightning impulse generator output terminal, while all remaining terminals are grounded.
According to the lightning impulse withstand voltage information on the transformer nameplate, one impulse at 60% of the rated full voltage and three impulses at 100% of the rated full voltage were applied sequentially to the three high-voltage terminals of the transformer. To ensure the rigor of the test, both positive and negative lightning impulses were applied. The specific application parameters for each terminal are listed in Table 5.
Table 6 shows that the lightning impulses applied to the transformer conformed to the standard lightning impulse waveform. No abnormal discharge or flashover was observed during the test, and no odor was detected. The waveform record at the rated full voltage is shown in Figure 11. The test waveform exhibited no distortion, and the overshoot amplitude remained within the standard range. Therefore, the transformer was deemed to have passed the standard lightning impulse test.
4.3.2. Lightning Impulse Test for Switchgear
According to GB/T 11022, Common Technical Requirements for High-Voltage Switchgear and Controlgear Standards, and the nameplate parameters, standard lightning impulses with the specified polarity were applied to the test piece[22,23,24]. If no more than two destructive discharges occurred on the self-recovering insulation and no insulation damage was observed, the vacuum circuit breaker and disconnector were deemed to have passed the lightning impulse withstand voltage test. The test parameters are listed in Table 7.
Impulse tests were carried out on the vacuum circuit breaker and disconnector in both open and closed states, as well as between phases and between phases and ground. No abnormal discharge or smell was observed during the tests. The test data are summarized in Table 8, and the waveforms recorded for the vacuum circuit breaker and disconnector are shown in Figure 12 and Figure 13, respectively.
Based on the measured front time and time to half-value, the applied impulses were confirmed to conform to the standard lightning impulse waveform. The peak voltages satisfied the insulation withstand requirements specified in the nameplate parameters of the circuit breaker and disconnector in Table 7, and the corresponding output waveforms exhibited no distortion. Throughout the test, no flashover or other abnormal discharge phenomena were observed. Therefore, both the circuit breaker and the disconnector are considered to have successfully passed the lightning impulse test.
5. Conclusions
This paper established an on-site lightning impulse test method for distribution equipment and conducts standard withstand voltage tests on typical devices, including transformers, vacuum circuit breakers, and disconnectors. It explains the generation principle of standard lightning impulse waveforms and analyzes the influence of wavehead and wavetail resistances on the impulse waveform. Based on this, a process for on-site lightning impulse testing of typical distribution network equipment is constructed.
The tests employ a self-developed portable lightning impulse generator. This compact and easily transportable device overcomes the site limitations of traditional tests, reduces the cost of equipment transportation and layout, and significantly lowers the demand for on-site operators through automatic generation of test reports. Except for the safety officer, the entire test process can be completed by a single person, thus achieving high efficiency, safety, and cost-effectiveness.
References
- Faria, L.; Silva, E.; Silva, M.; Barbosa, C.; Azevedo, L. Automated evaluation of dynamic performance of impulse voltage measurement systems. Journal of Physics: Conference Series, 2015, 575, 012011. [Google Scholar] [CrossRef]
- Ghosh, P.; Das, A.K.; Dalai, S.; Chatterjee, S. The effects of non-standard lightning impulse on electrical insulation: a review. Electrical Engineering, 2022, 104, 4239–4254. [Google Scholar] [CrossRef]
- Hsu, C.-H. , Experimental results of electromechanical structure proper ties of noise and vibration on power transformers after lightning impulse test. International Journal of Electrical Power & Energy Systems, 2022, 134, 107458. [Google Scholar]
- Okabe, S.; Tsuboi, T.; Ueta, G. Study on lightning impulse test waveform for uhv-class electric power equipment. IEEE Transactions on Dielectrics and Electrical Insulation, 2012, 19, 803–811. [Google Scholar] [CrossRef]
- Pattanadech, N.; Yutthagowith, P. Fast curve fitting algorithm for parameter evaluation in lightning impulse test technique. IEEE Transactions on Dielectrics and Electrical Insulation, 2015, 22, 2931–2936. [Google Scholar] [CrossRef]
- J. Perez and J. Martinez, Digitally recorded lightning impulse with overshoot parameter evaluation by using the kalman filtering method. IEEE transactions on power delivery, vol. 13, no. 4, pp. 1005–1014, 2002.
- I. Petrović, S. Nikolovski, H. R. Baghaee, and H. Glavaš, Determining impact of lightning strike location on failures in transmission network elements using fuzzy decision-making. IEEE Systems Journal, vol. 14, no. 2, pp. 2665–2675, 2019.
- SMAJIC J, STEINMETZ T, RüEGG M, et al. Simulation and measurement of lightning-impulse voltage distributions over transformer windings [J]. IEEE transactions on magnetics, 2014, 50(2): 553-6.
- J. Smajic, T. Steinmetz, M. Rüegg, Z. Tanasic, R. Obrist, J. Tepper, B. Weber, and M. Carlen, Simulation and measurement of lightning impulse voltage distributions over transformer windings. IEEE transac tions on magnetics, vol. 50, no. 2, pp. 553–556, 2014.
- B. Trkulja, A. Drandić, V. Milardić, T. Župan, I. Žiger, and D. Filipović-Grčić, Lightning impulse voltage distribution over voltage transformer windings—simulation and measurement. Electric power systems re search, vol. 147, pp. 185–191, 2017.
- G. Ueta, T. Tsuboi, and S. Okabe, Evaluation of overshoot rate of lightning impulse withstand voltage test waveform based on new base curve fitting methods-application to practical diverse waveforms. IEEE Transactions on Dielectrics and Electrical Insulation, vol. 19, no. 1, pp. 352–362, 2012.
- T. Wen, Q. Zhang, J. Ma, X. Liu, Z. Wu, L. Zhang, J. Zhao, N. Shimo mura, and W. Chen, Research on the detecting effectiveness of on-site lightning impulse test for gis equipment with insulation defects. IEEE Transactions on Dielectrics and Electrical Insulation, vol. 25, no. 2, pp. 551–558, 2018.
- T. Wen, Q. Zhang, J. Ma, Z. Wu, N. Shimomura, and W. Chen, A new method to evaluate the effectiveness of impulse voltage for detecting insulation defects in gis equipment. IEEE Transactions on Dielectrics and Electrical Insulation, vol. 26, no. 4, pp. 1301–1307, 2019.
- T. Wen, Q. Zhang, Y. Qin, J. Zhao, J. Ma, Z. Wu, N. Shimomura, F. Tao, Y. Jia, Y. Yin et al., On-site standard lightning impulse test for 1,100kv gas-insulated switchgear with large capacitance. IEEE Electrical Insulation Magazine, vol. 32, no. 6, pp. 36–43, 2016.
- Şeker, M. Parameter estimation of positive lightning impulse using curve fitting-based optimization techniques and least squares algorithm. Electric Power Systems Research 2022, 205, 107733. [Google Scholar] [CrossRef]
- A. E. Lazzaretti, S. L. F. Santos, K. K. Küster, L. F. R. B. Toledo, M. A. Ravaglio, A. Piantini, and C. L. da Silva Pinto, An integrated monitoring system and automatic data analysis to correlate lightning activity and faults on distribution networks. Electric Power Systems Research, vol. 153, pp. 66–72, 2017.
- H. R. Mirzaei, A simple fast and accurate simulation method for power transformer lightning impulse test. IEEE Transactions on Power Delivery, vol. 34, no. 3, pp. 1151–1160, 2019.
- P.-M. T. Nicolae, I.-D. V. Nicolae, M.-C. Nitu, and M.-S. P. Nicolae, Analysis and experiments concerning surges transferred between power transformer windings due to lightning impulse. IEEE Transactions on Electromagnetic Compatibility, vol. 65, no. 5, pp. 1476–1483, 2023.
- N. M. Nor, S. Abdullah, R. Rajab, and K. Ramar, Field tests: Performances of practical earthing systems under lightning impulses. International Journal of Electrical Power & Energy Systems, vol. 45, no. 1, pp. 223–228, 2013.
- T. Wen, Q. Zhang, L. Zhang, J. Ma, C. Guo, M. Chen, Y. Li, N. Shimomura, and W. Chen, Discussion on lightning impulse test waveform according to breakdown characteristics of sf6 gas gaps. IEEE Transactions on Dielectrics and Electrical Insulation, vol. 24, no. 4, pp. 2306–2313, 2017.
- X. Zhang, M. Shi, C. He, and J. Li, On site oscillating lightning impulse test and insulation diagnose for power transformers. IEEE Transactions on Power Delivery, vol. 35, no. 5, pp. 2548–2550, 2020.
- Y. Zheng, S. Chen, Z. Kang, Y. Wang, and T. He, Effect of residual charges on lightning impulse voltage testing in insulation gaps. IEEE Transactions on Dielectrics and Electrical Insulation, vol. 29, no. 1, pp. 334–342, 2022.
- Kai, N.; Fang-hua, H.; Wei, L.; Hao, N.; Yuan, S.; Xuan-rui, Z.; Jun-hao, L. Research on Oscillating Impulse Voltage Test Technology of Distribution Network Equipment. Advanced Technology of Electrical Engineering and Energy 2022, 41, 24–30. [Google Scholar]
- Radecic, I.; Jancin, S.; Perkovic, M.; Filipovic-Grcic, B.; Jurisic, B.; Filipovic-Grcic, D. Superimposed impulse voltage test on 525 kV HVDC underground cable. Electric Power Systems Research 2026, 251. [Google Scholar] [CrossRef]
Figure 1.
Portable impulse generator.
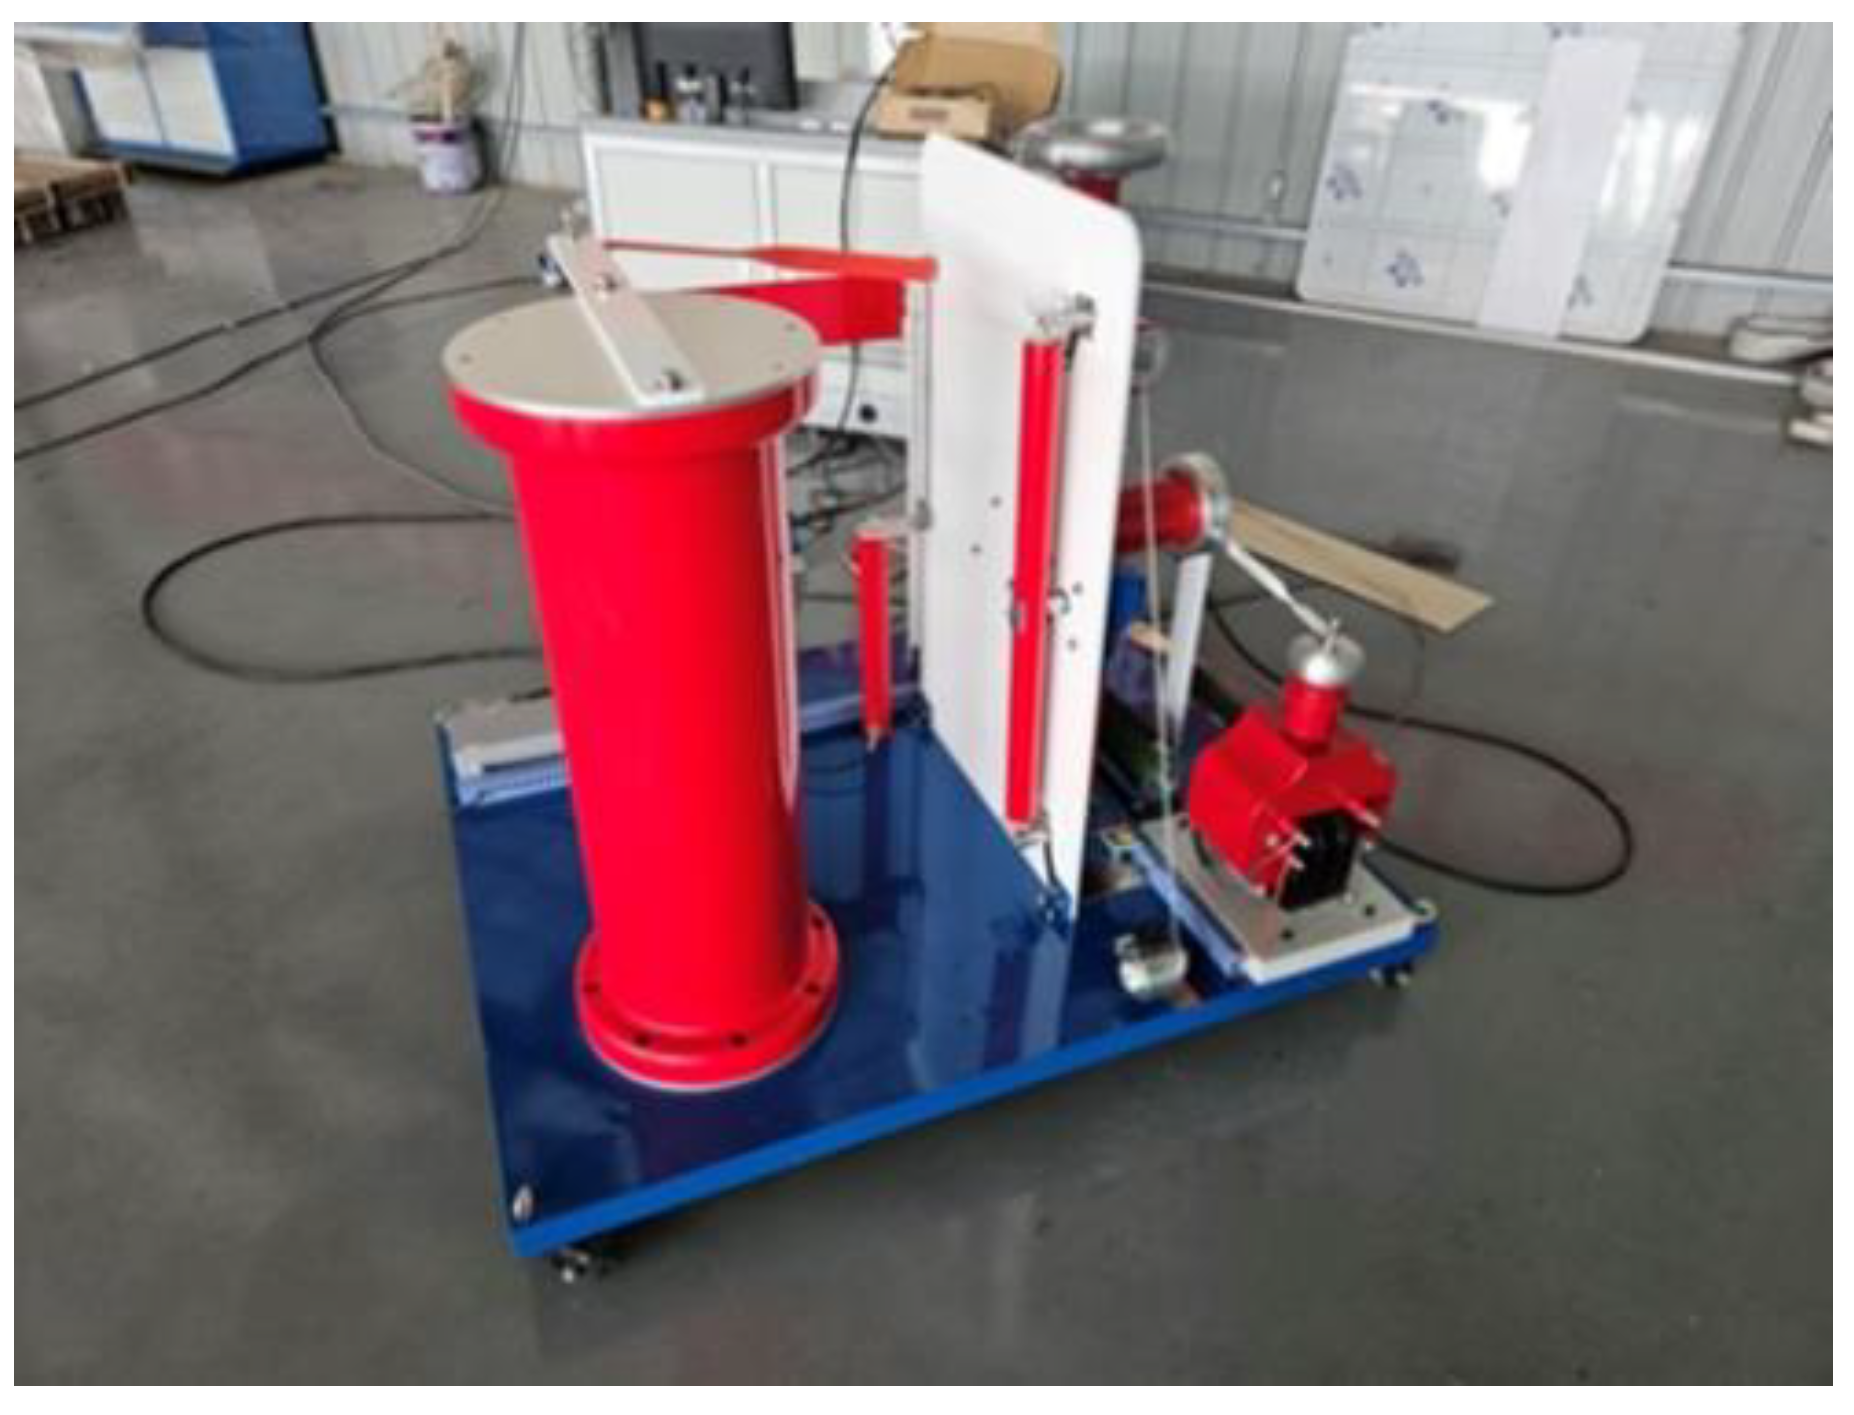
Figure 2.
On-site lightning impulse test of power distribution equipment.
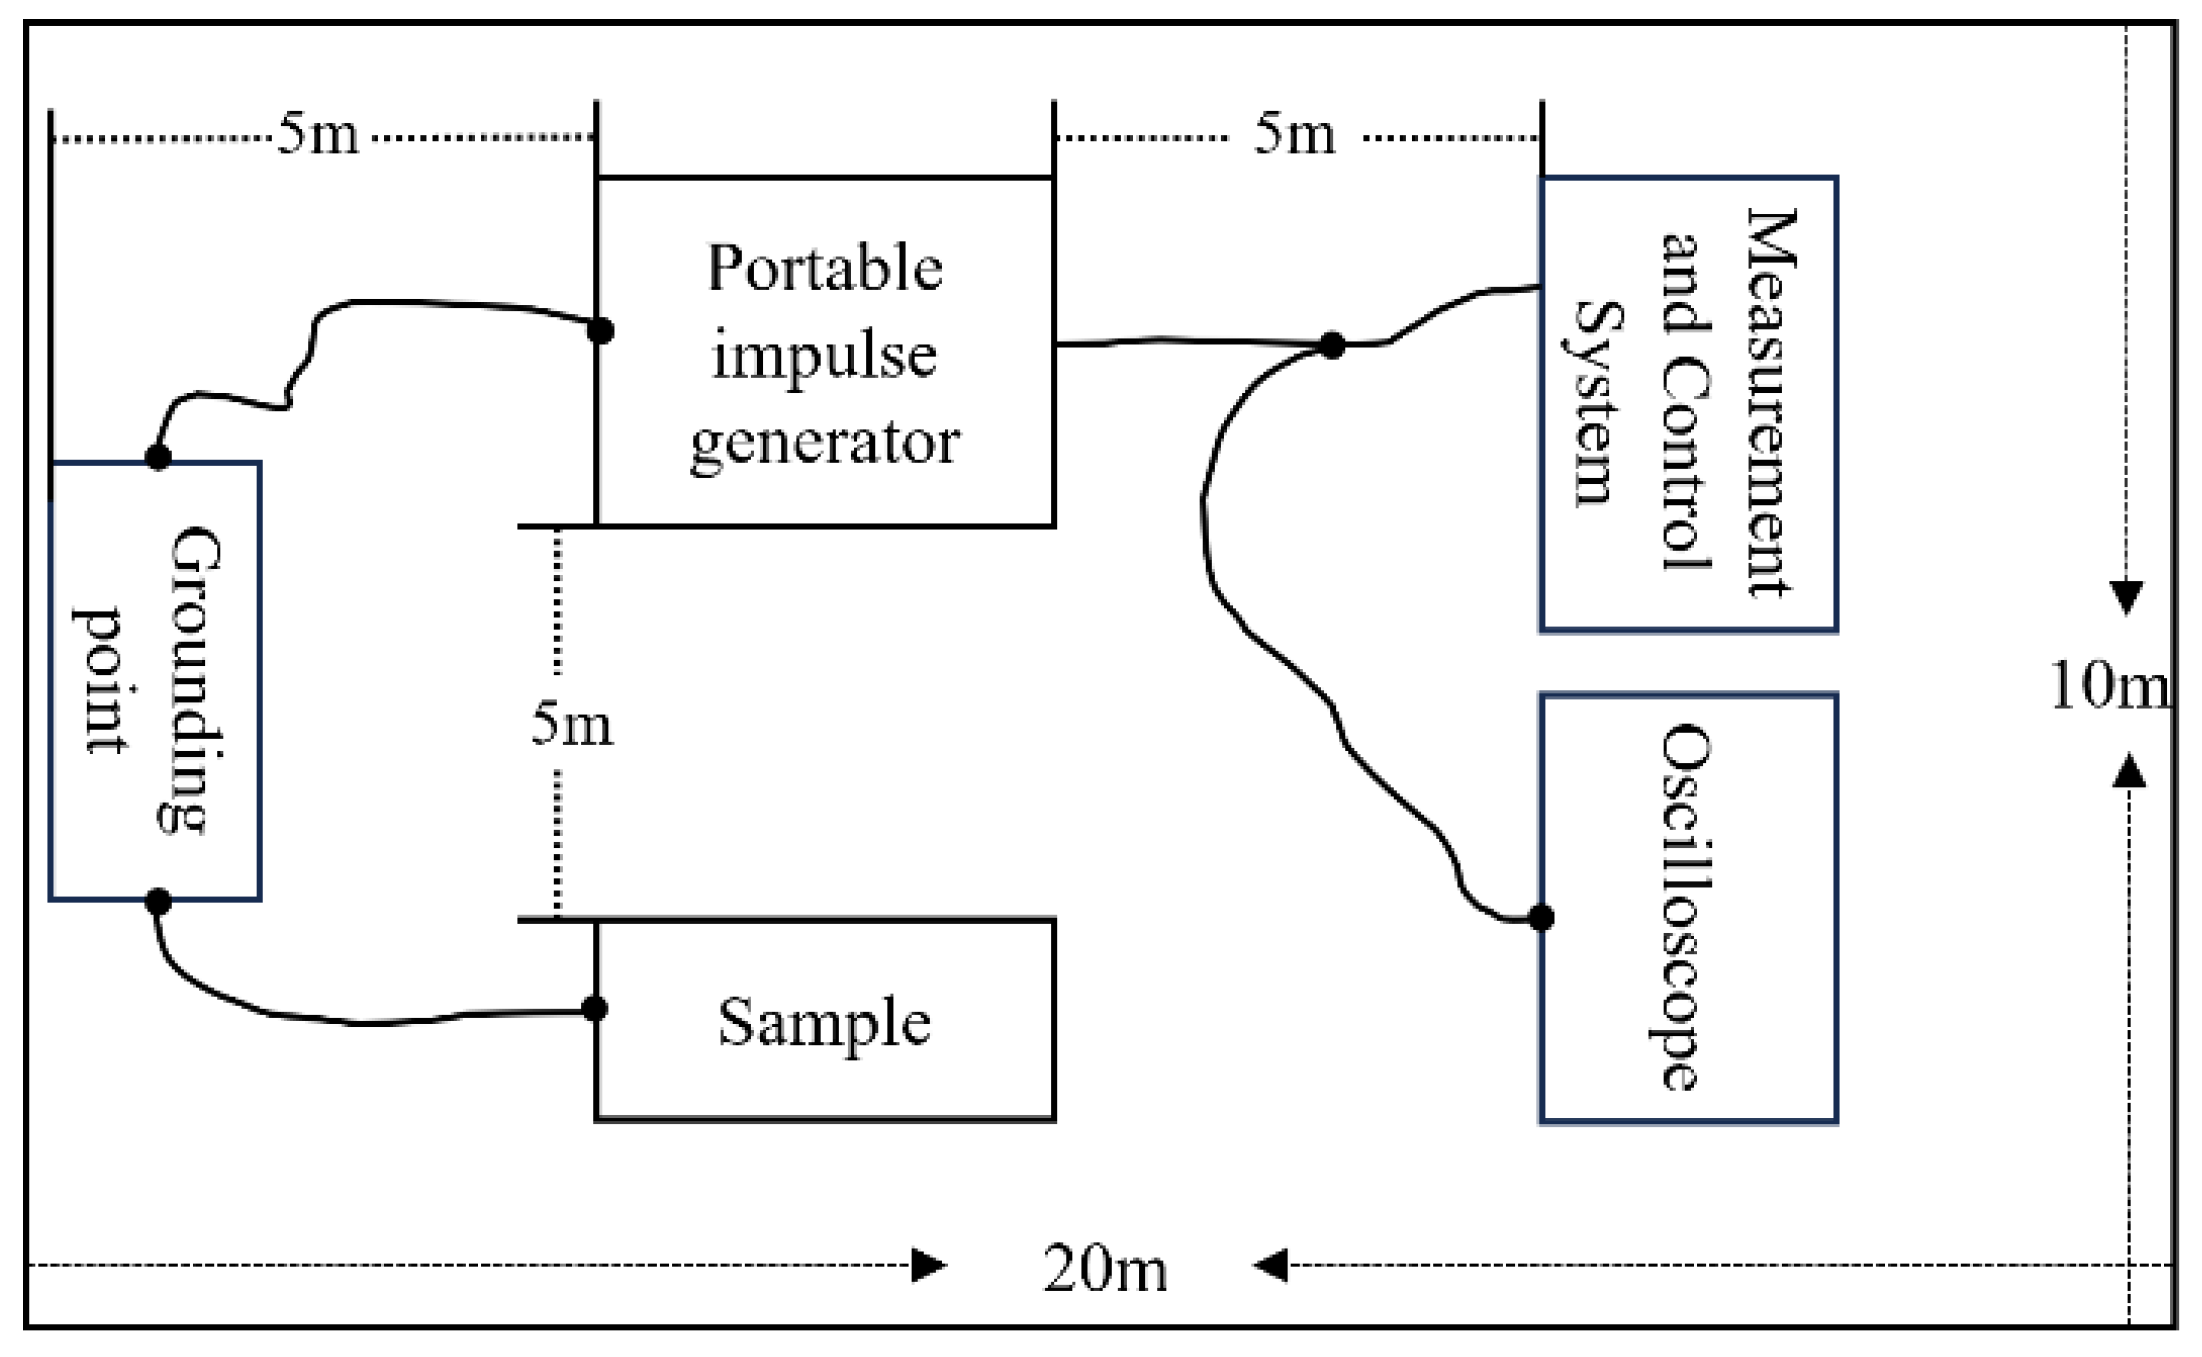
Figure 3.
Equivalent Circuit of Lightning Impulse Generator.
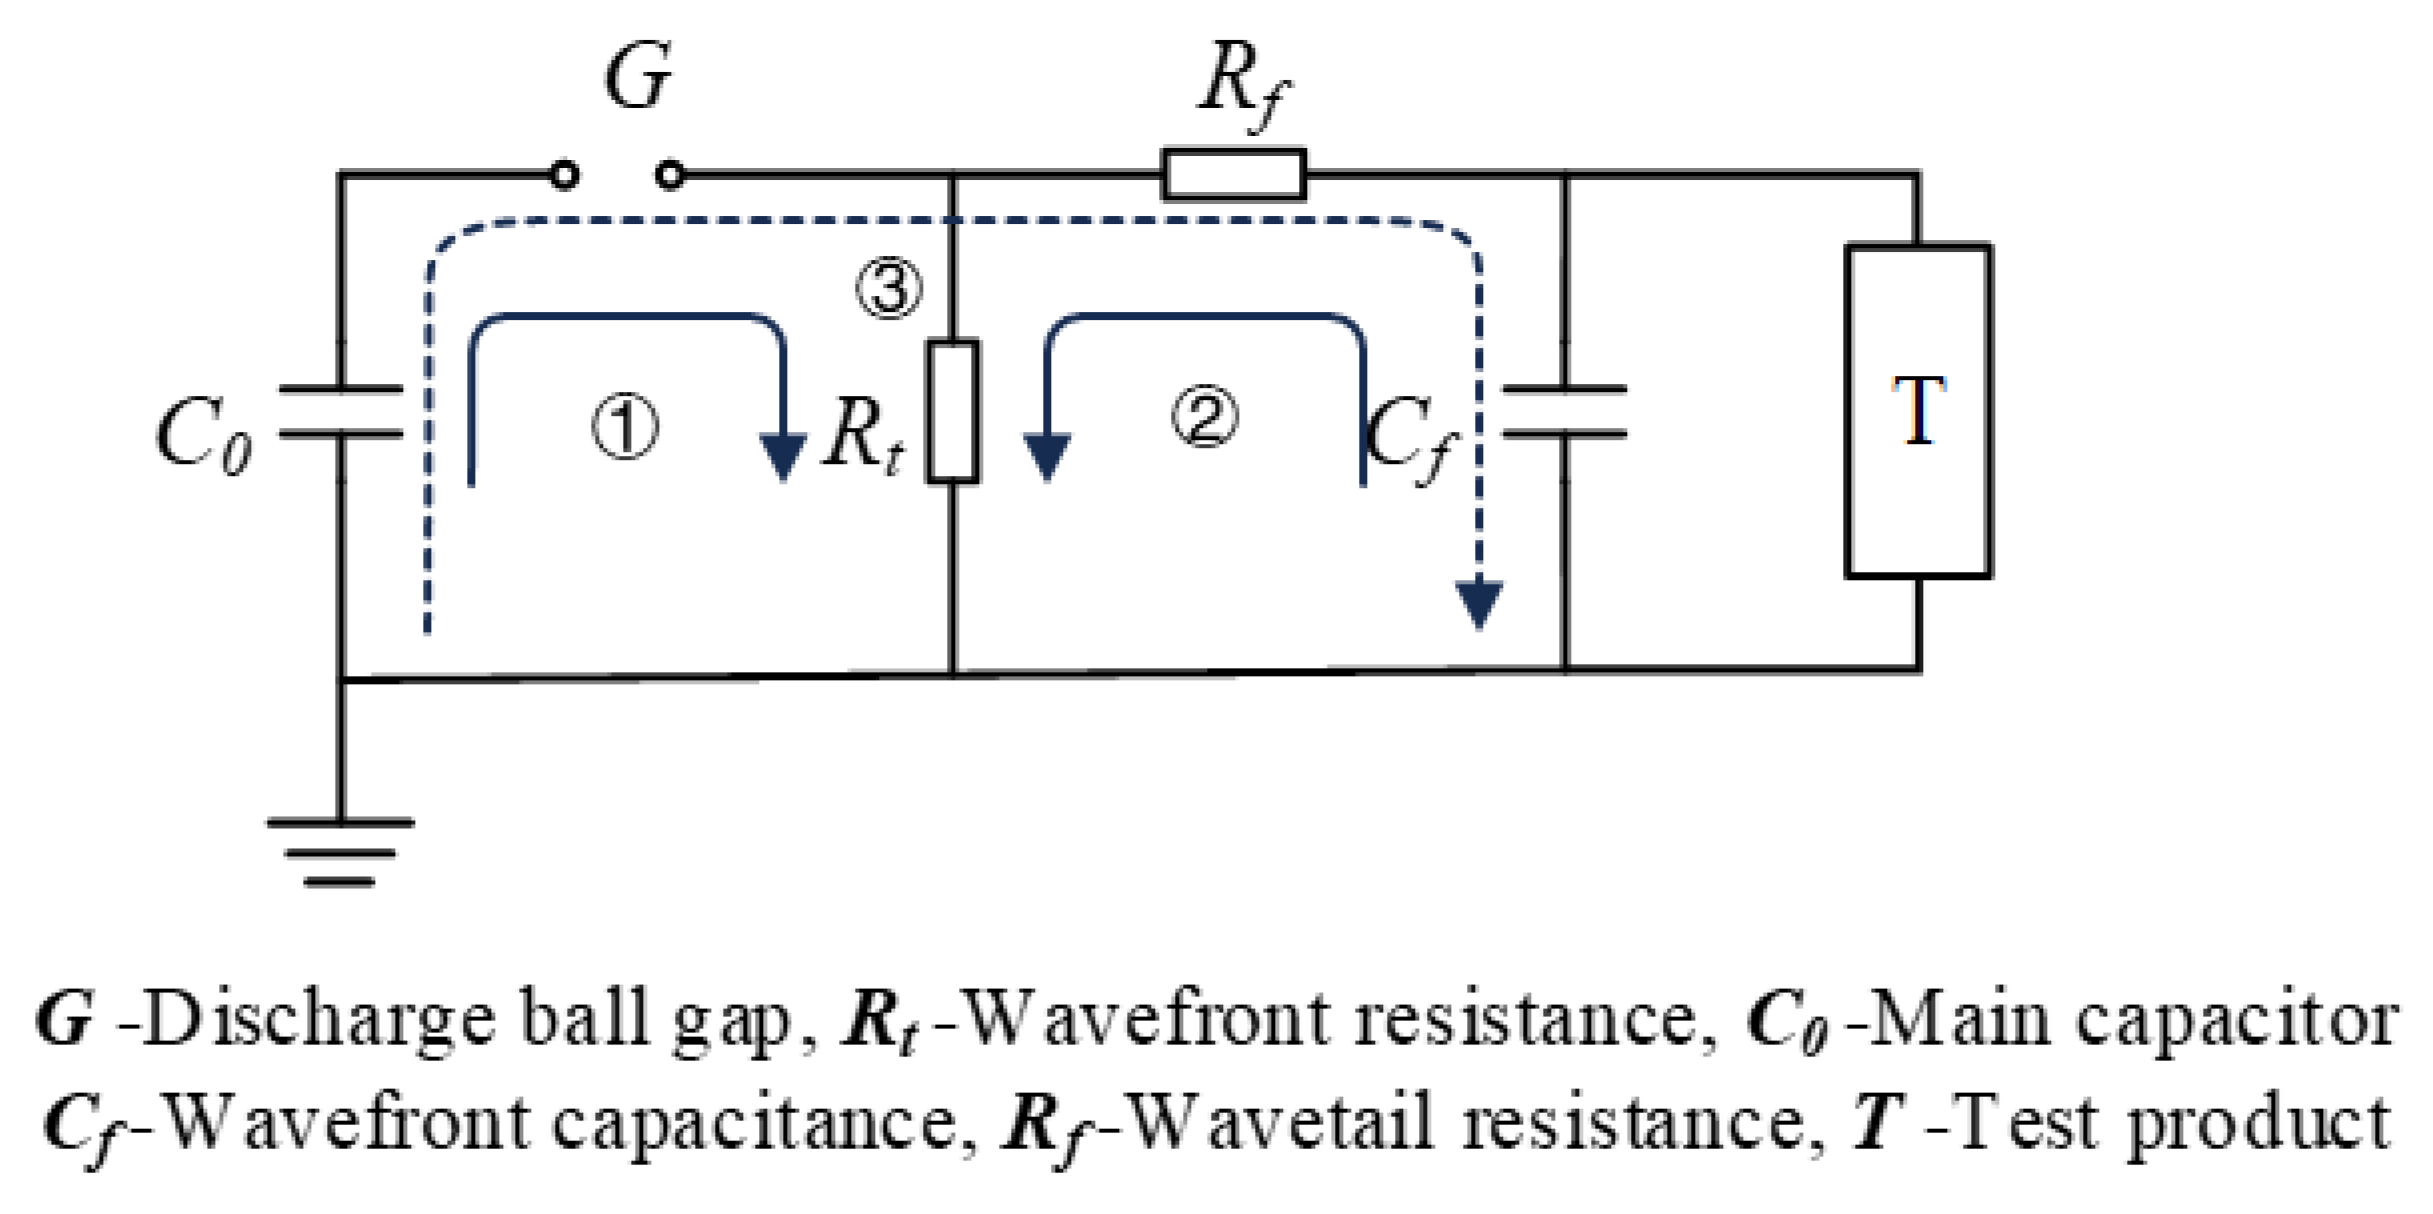
Figure 4.
Standard Lightning Impulse Waveform.
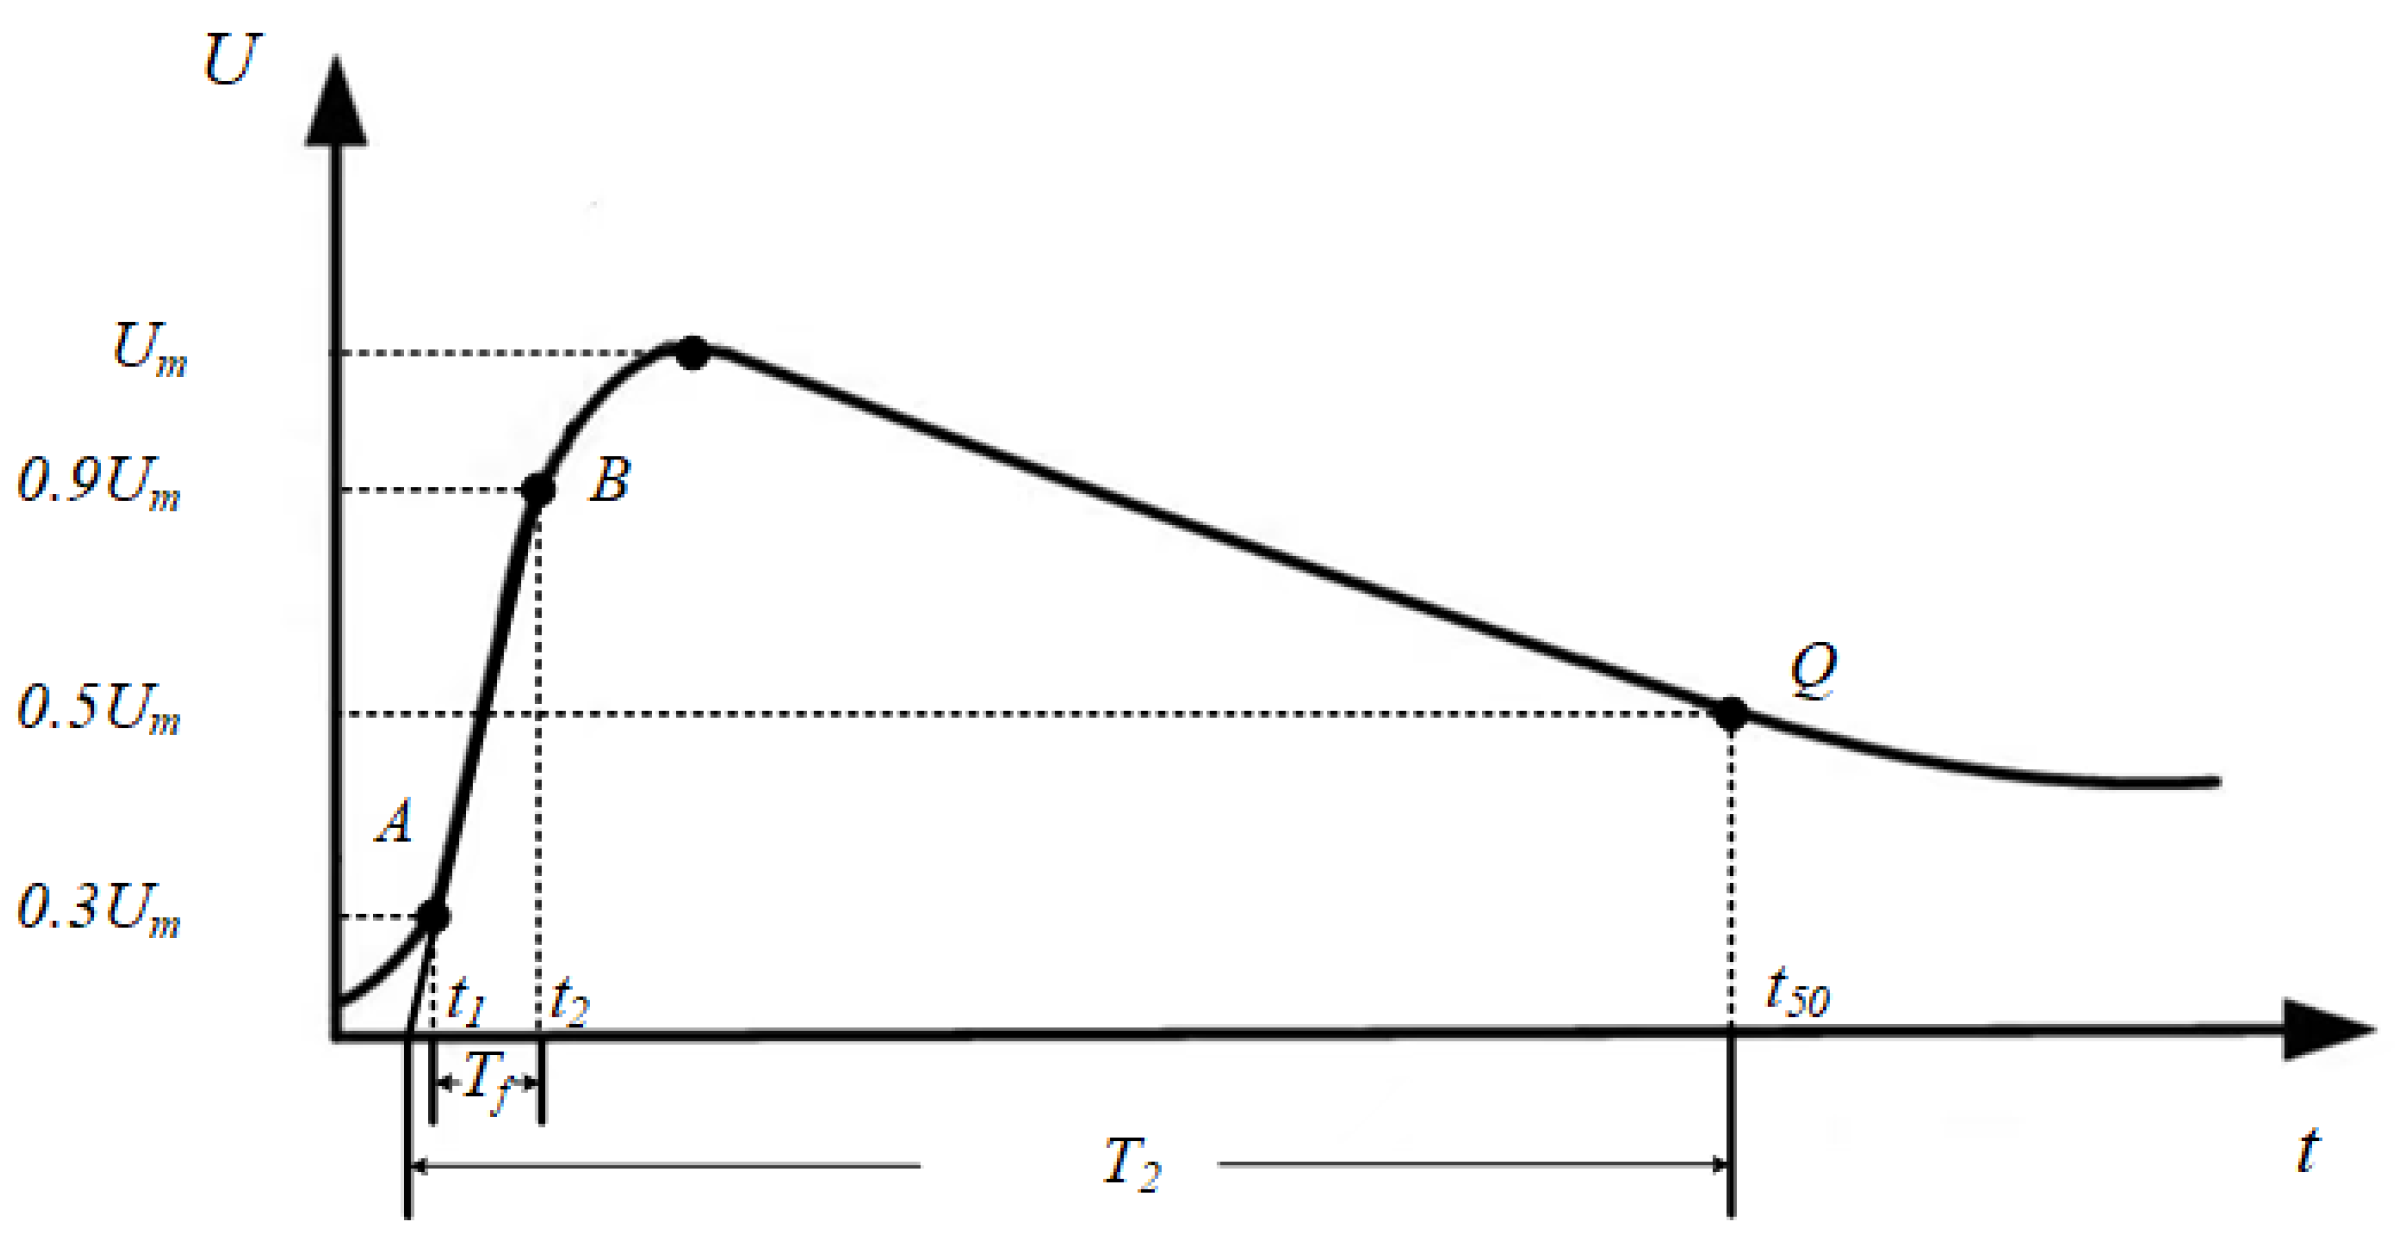
Figure 5.
Simulation results of the transformer lightning impulse test.
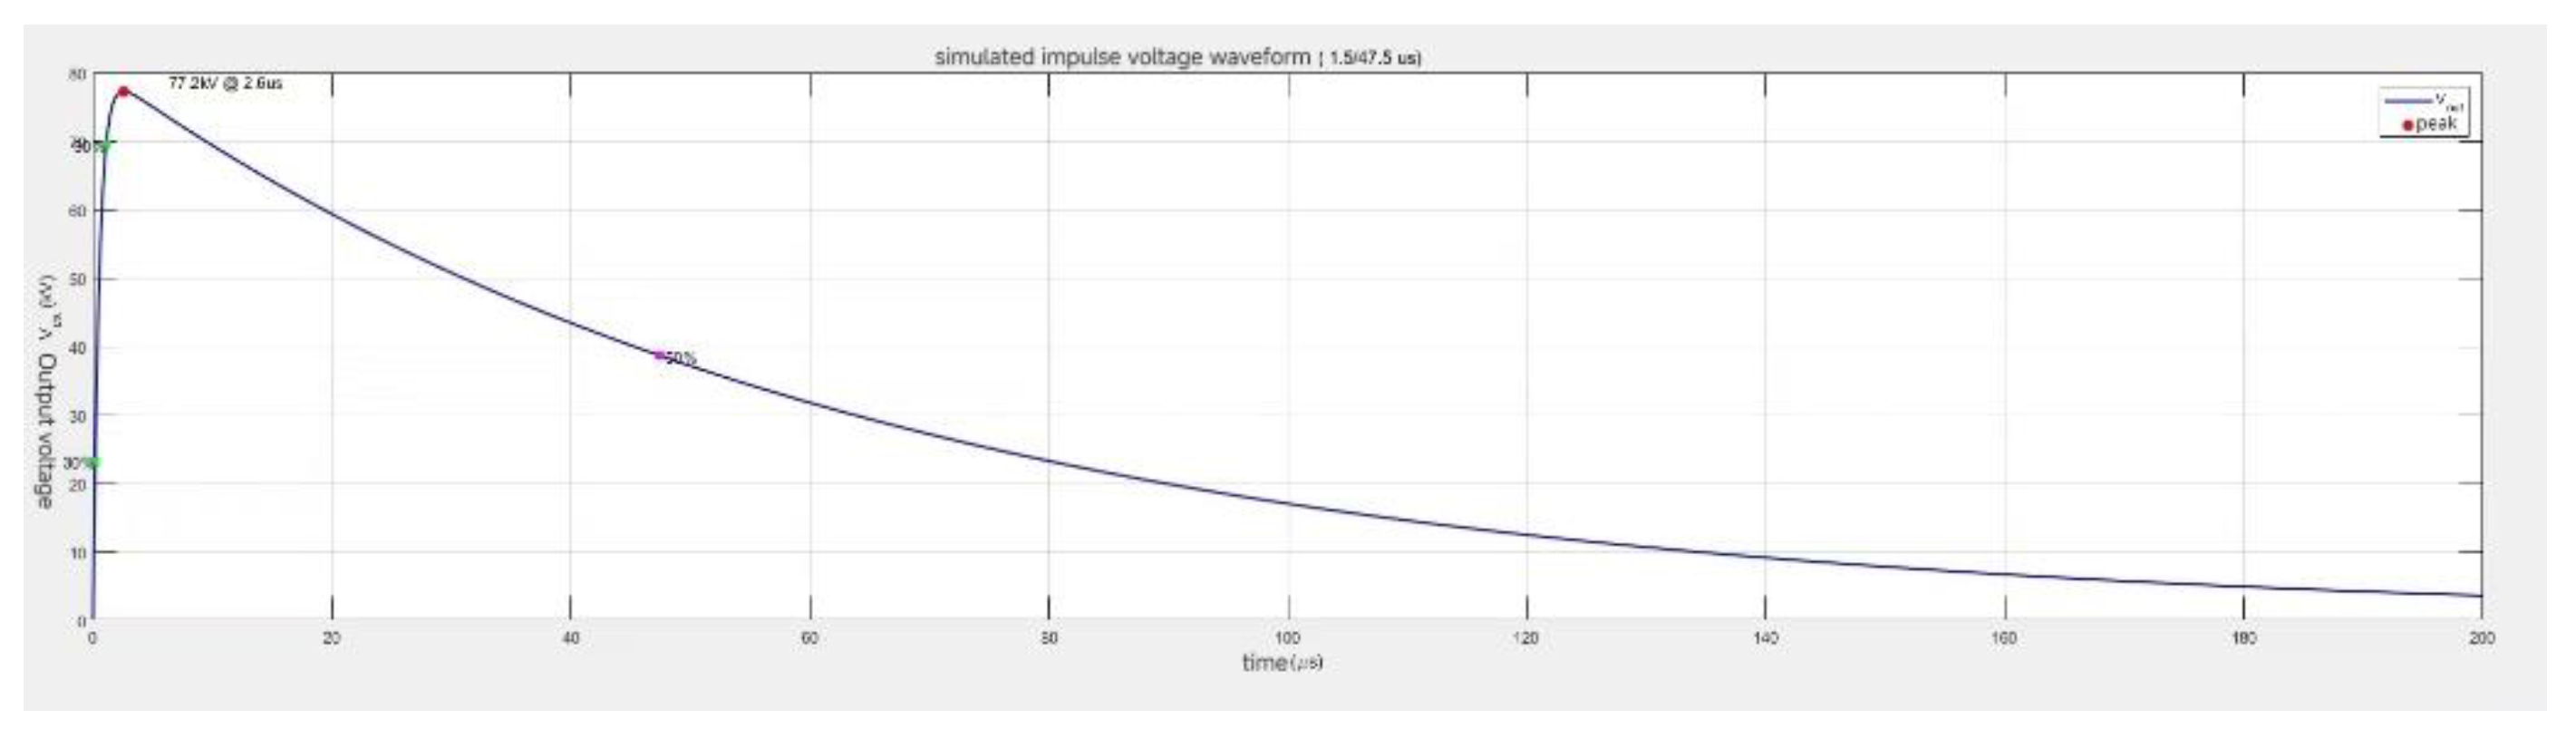
Figure 6.
Simulation results of the vacuum circuit breaker lightning impulse test.
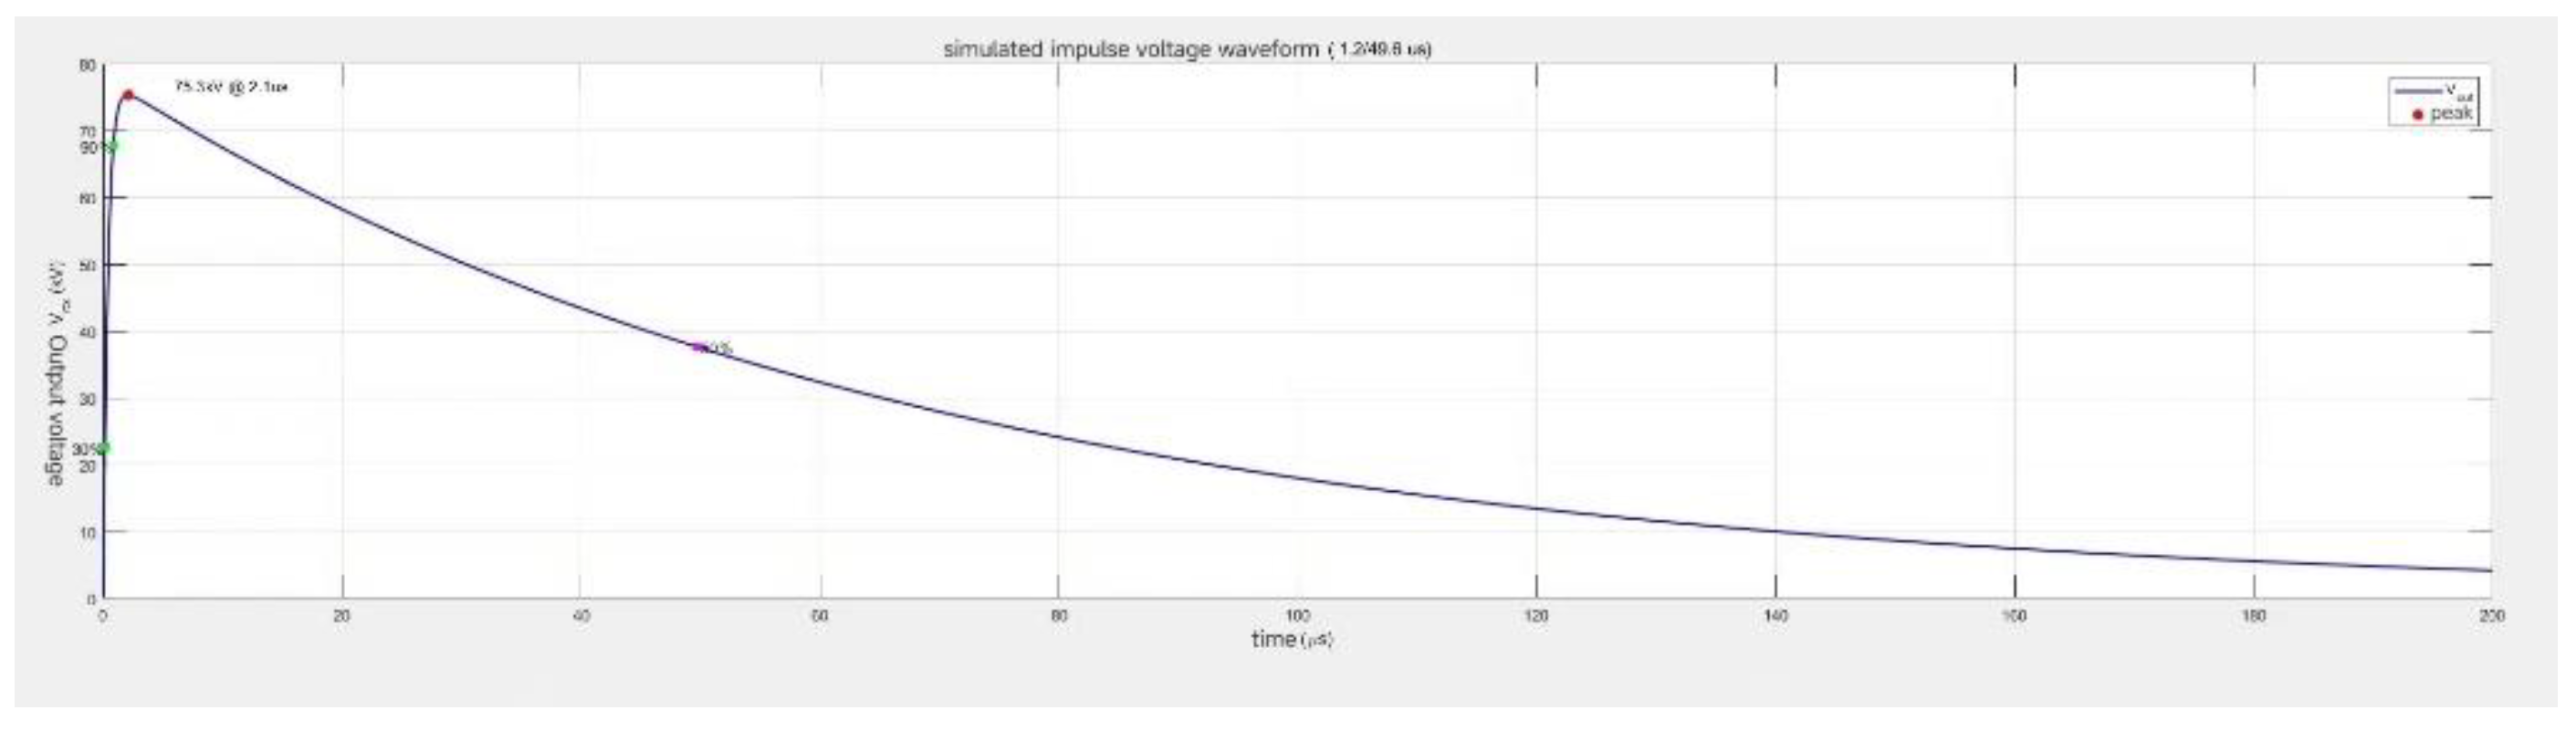
Figure 7.
Simulation results of the disconnect switch lightning impulse test.
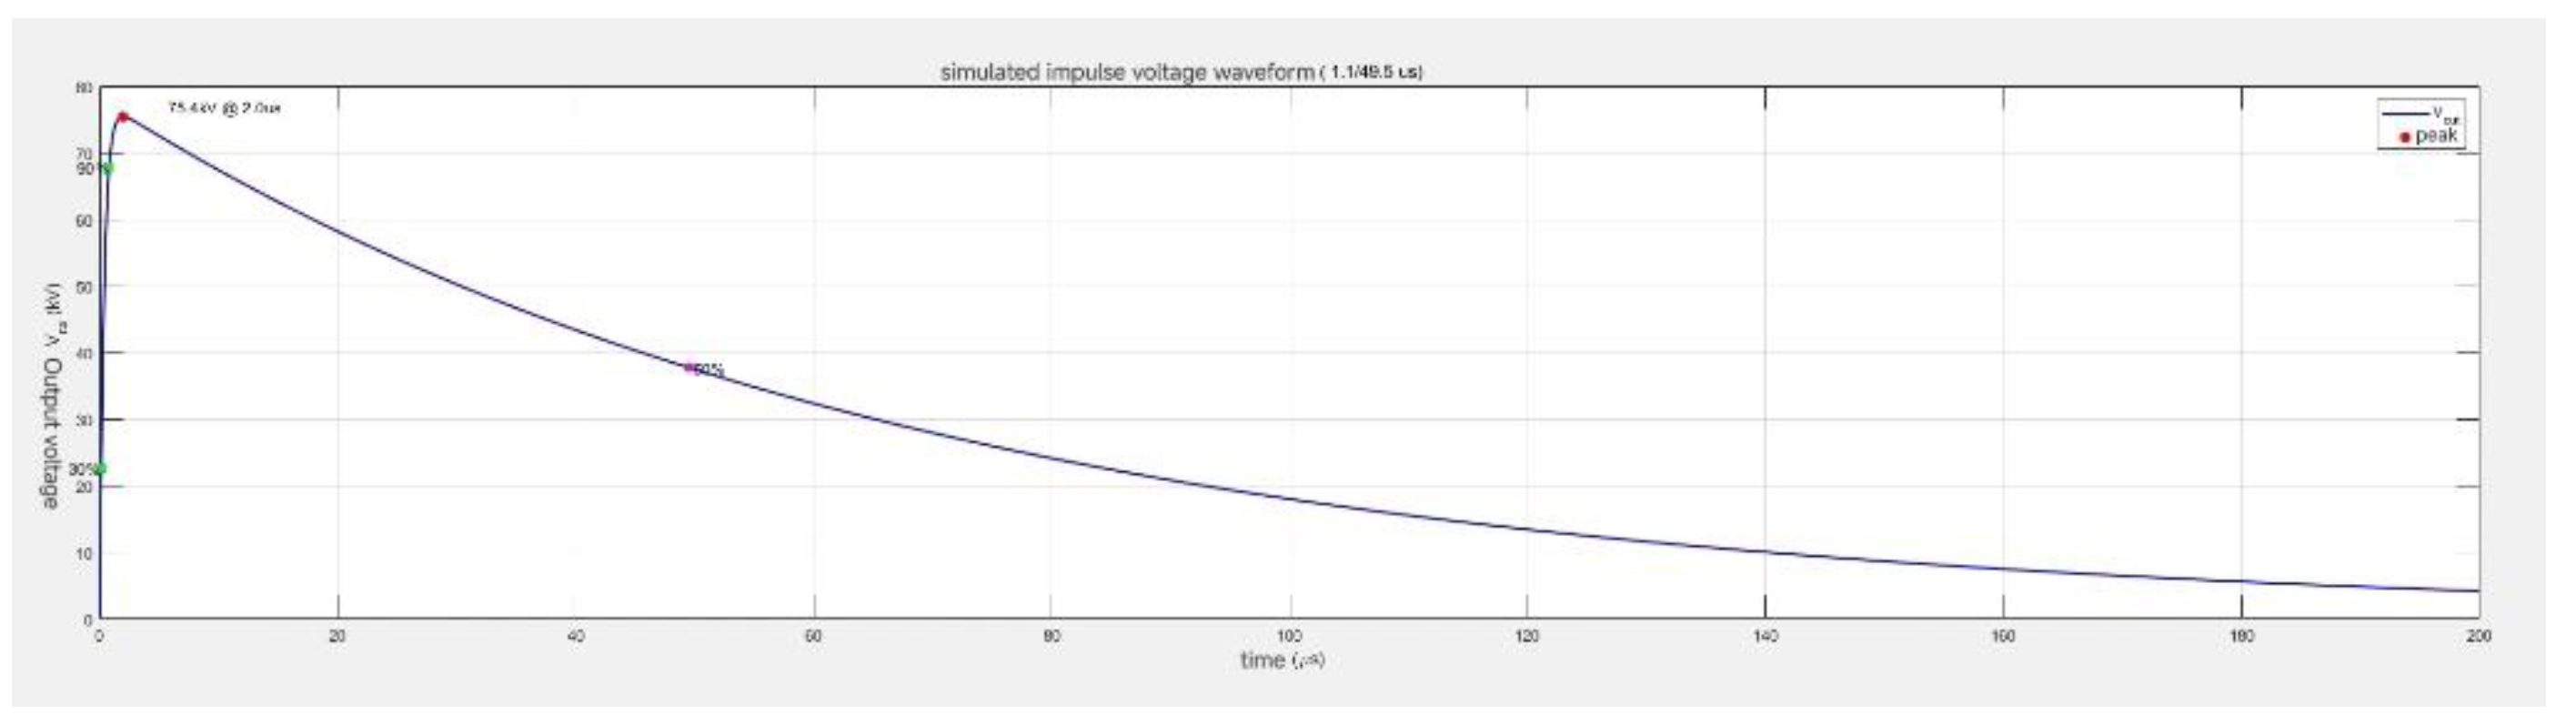
Figure 8.
Test report saving interface.
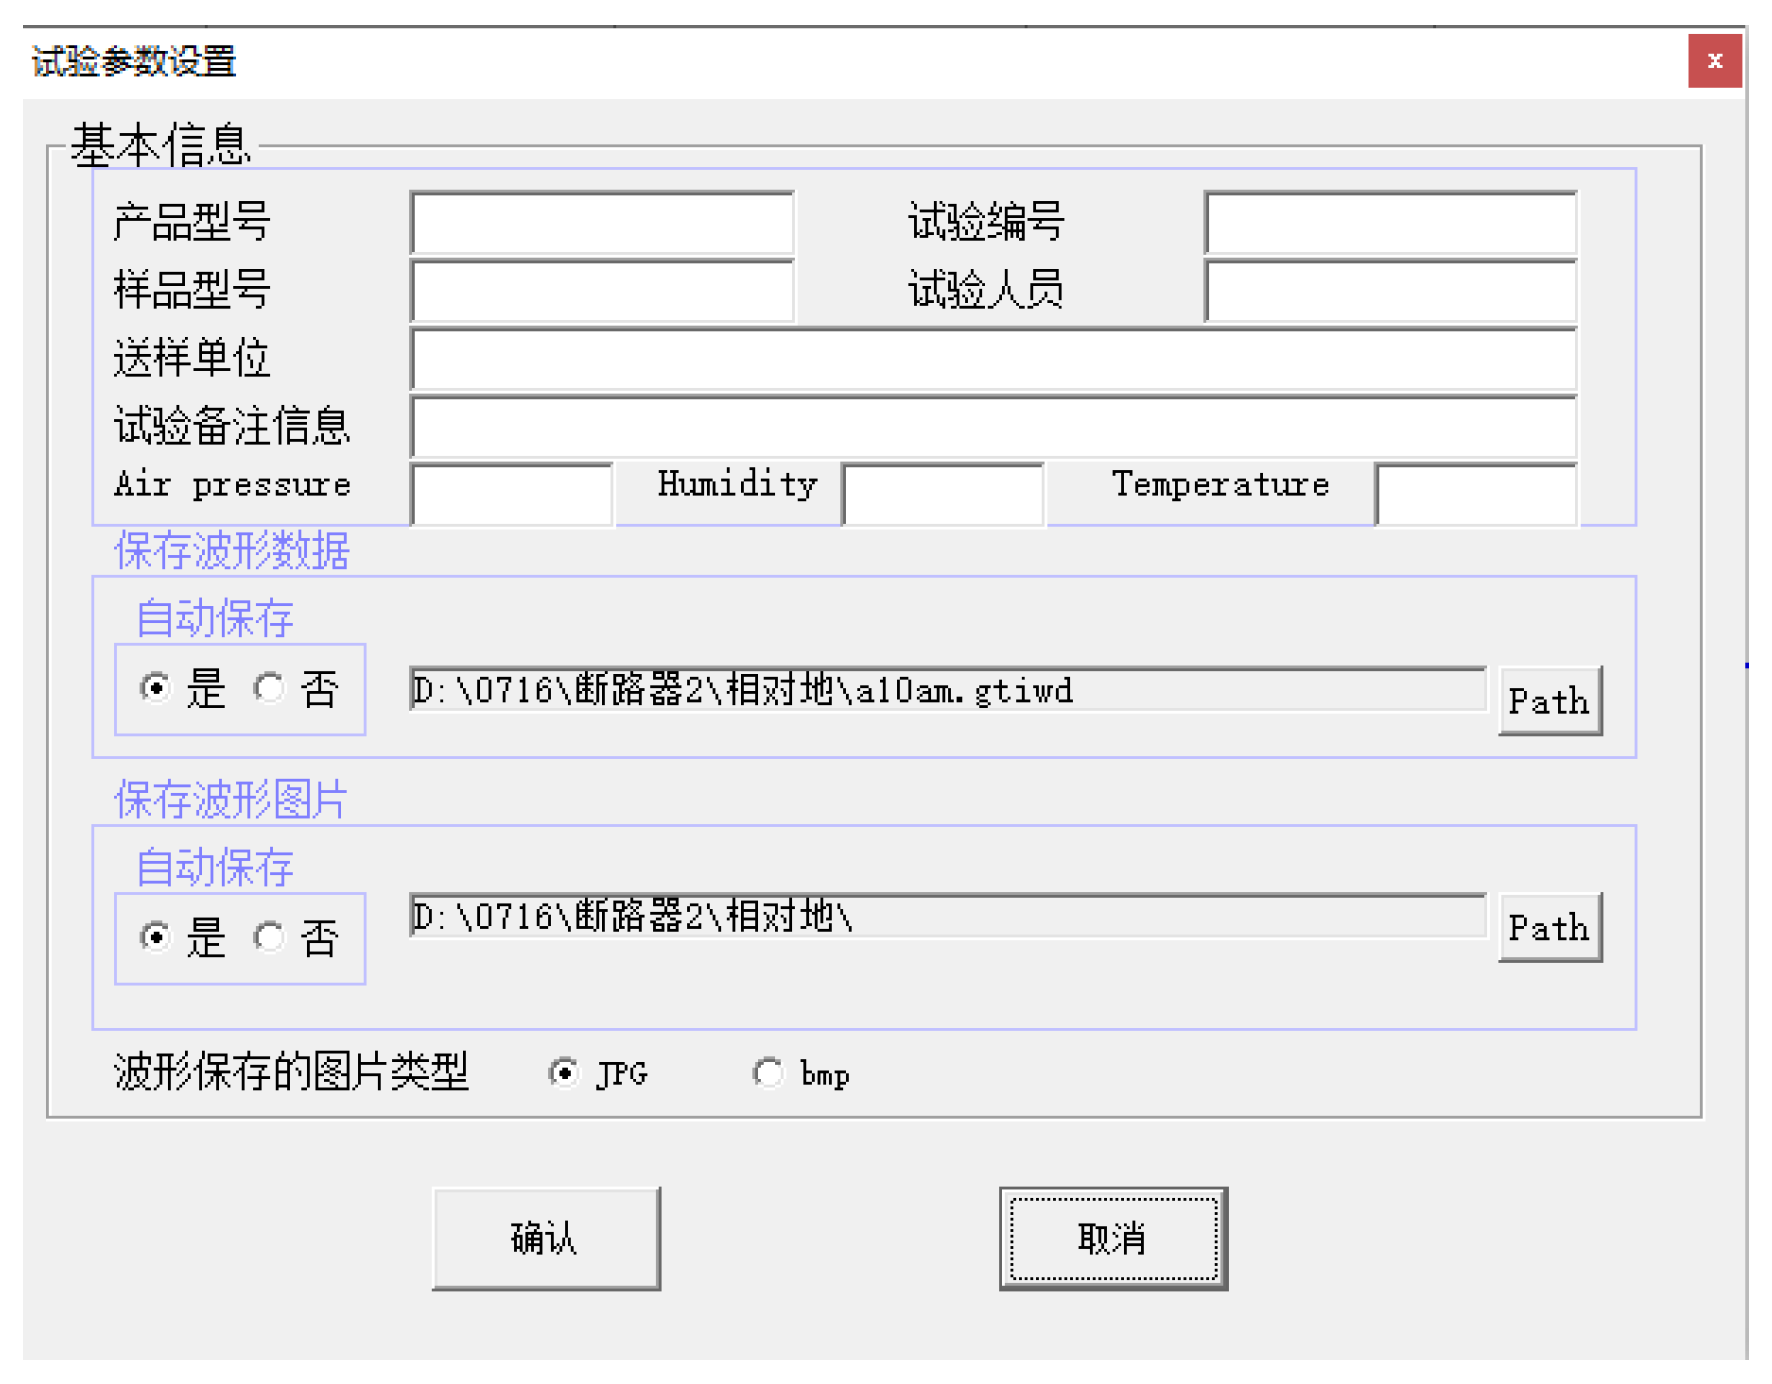
Figure 9.
Architecture of the automated report generation system.
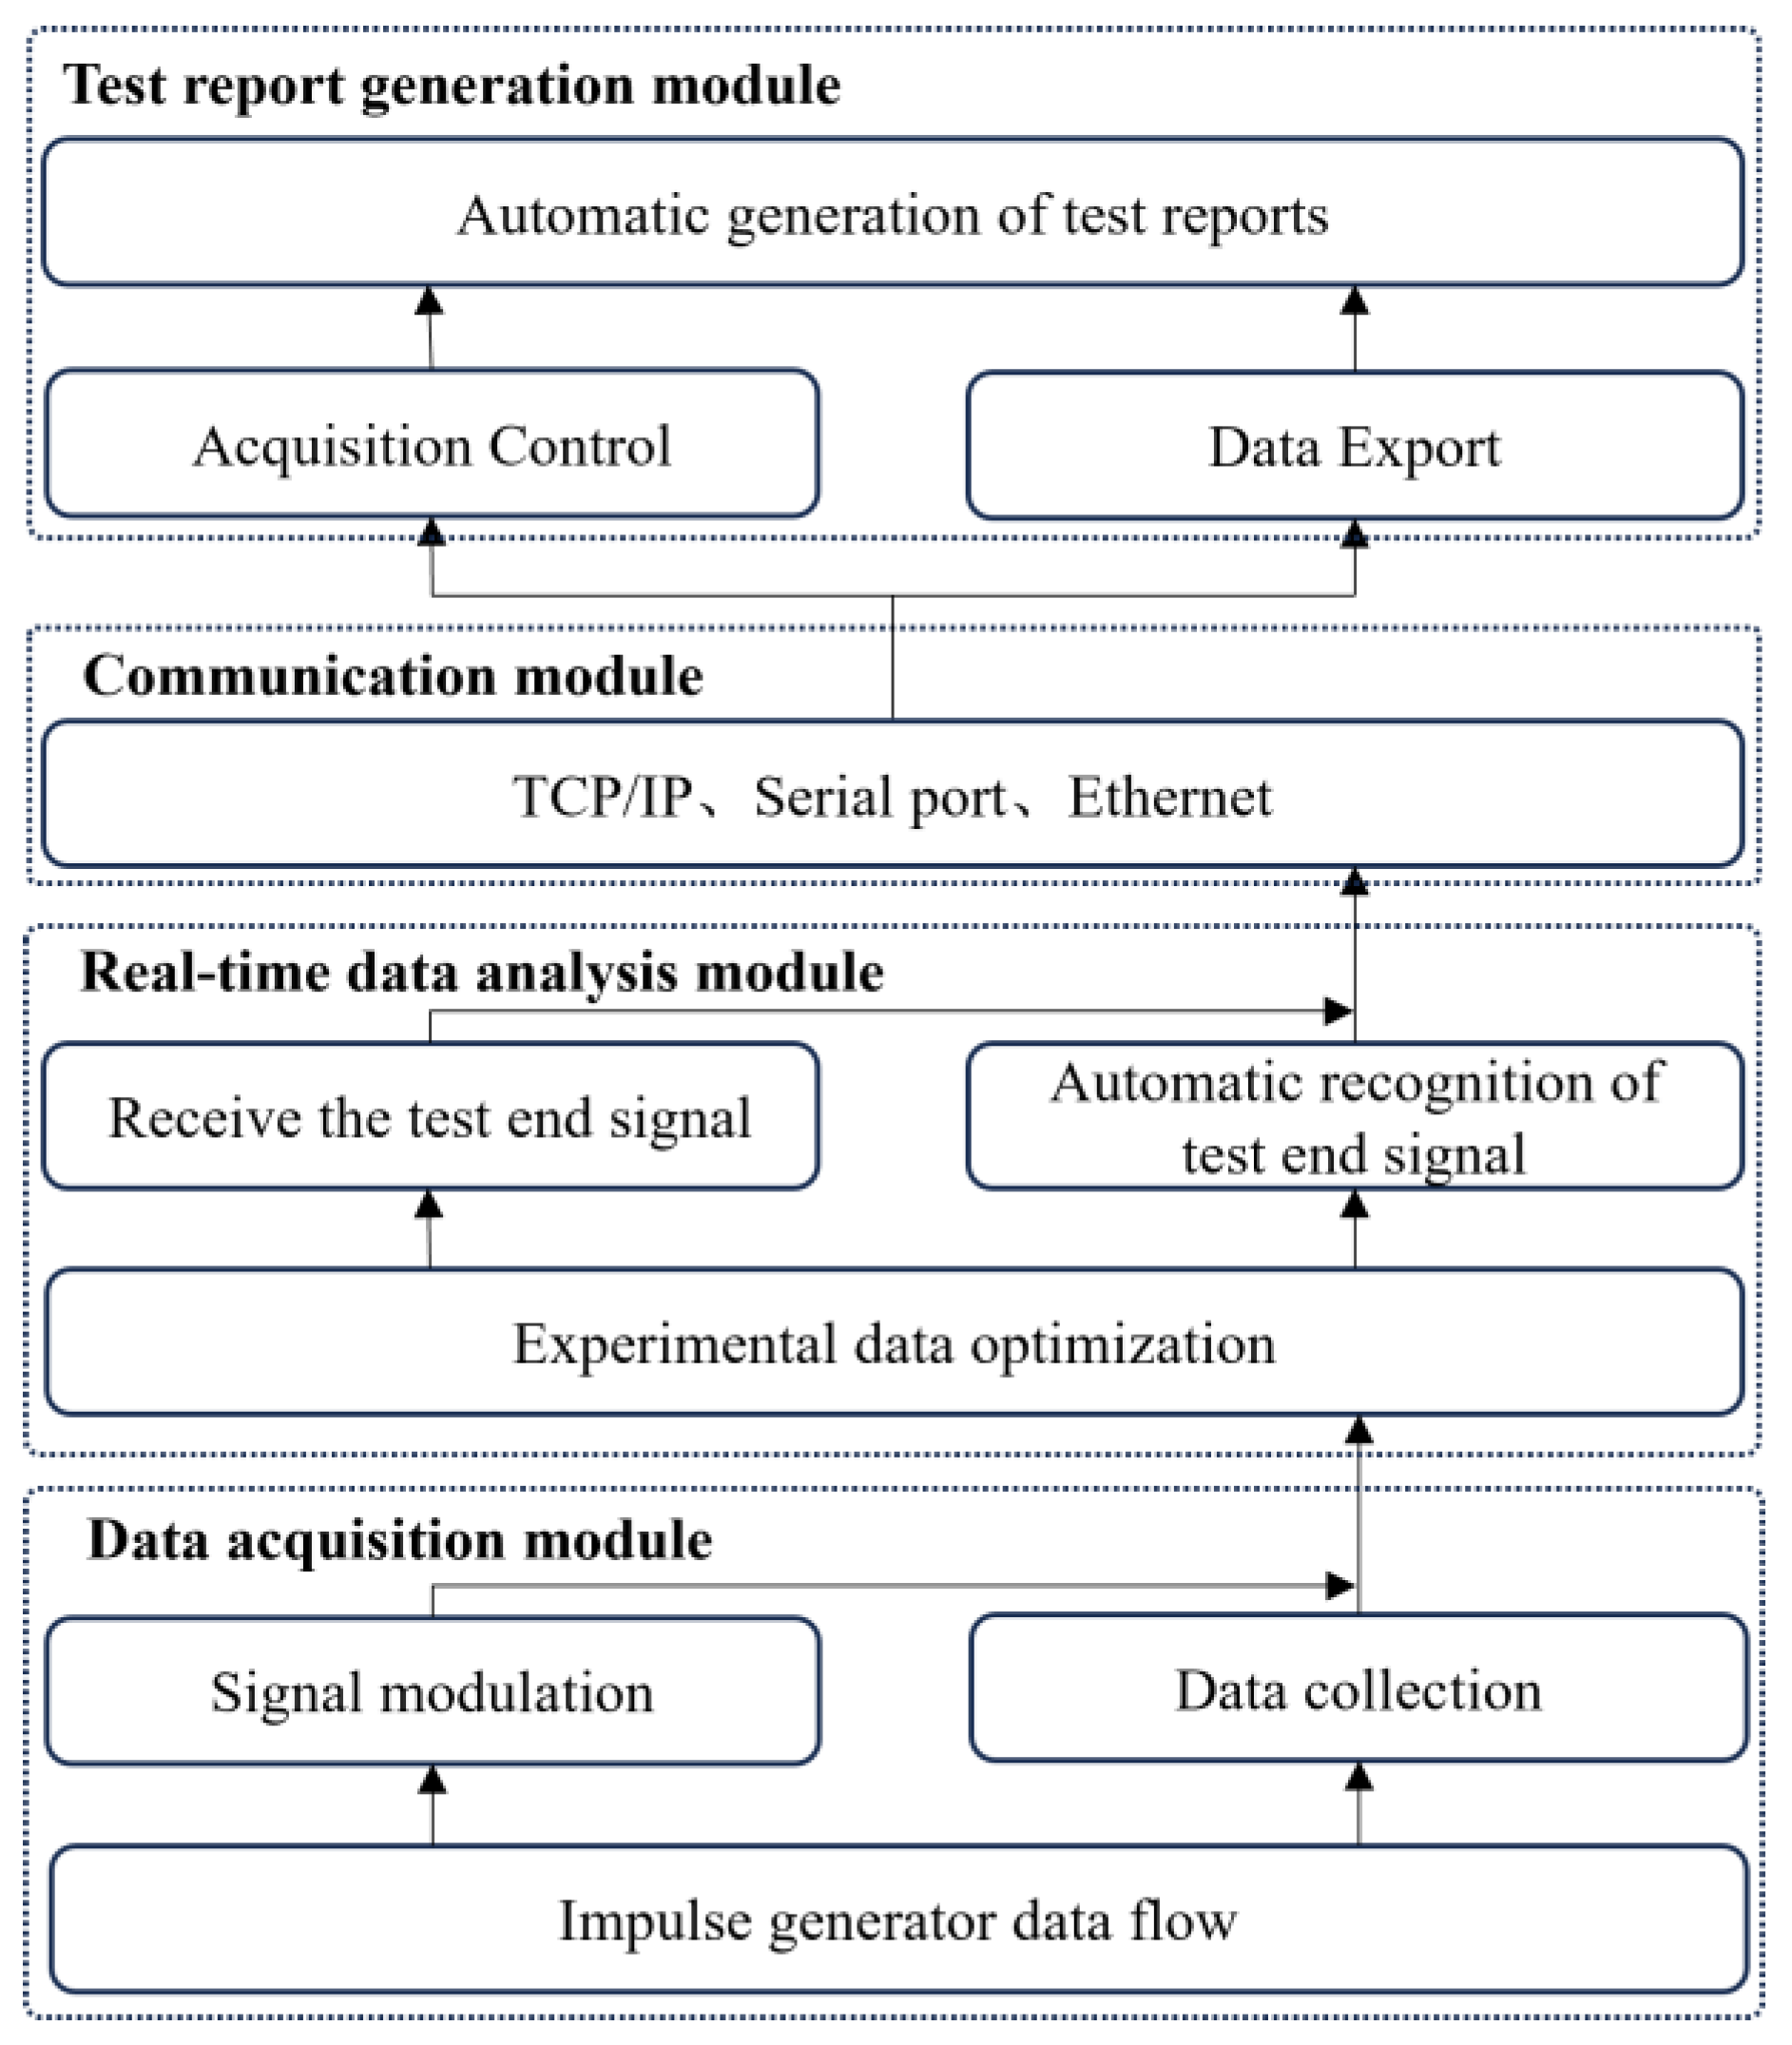
Figure 10.
Transformer lightning impulse test wiring diagram.
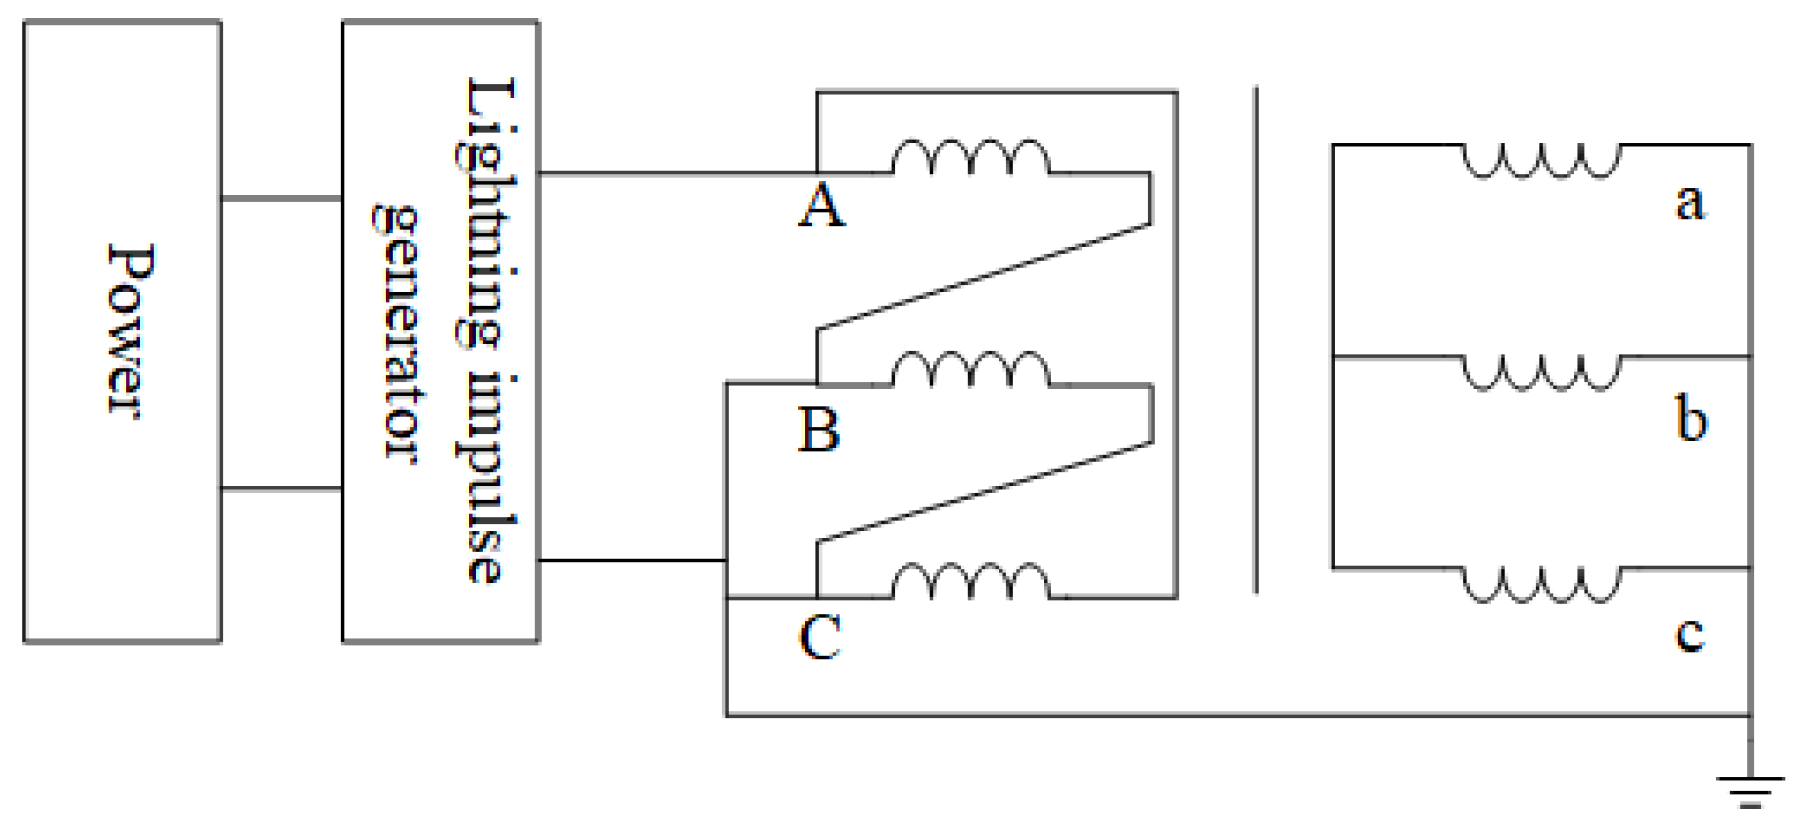
Figure 11.
Waveform recorded at 100% voltage peak.
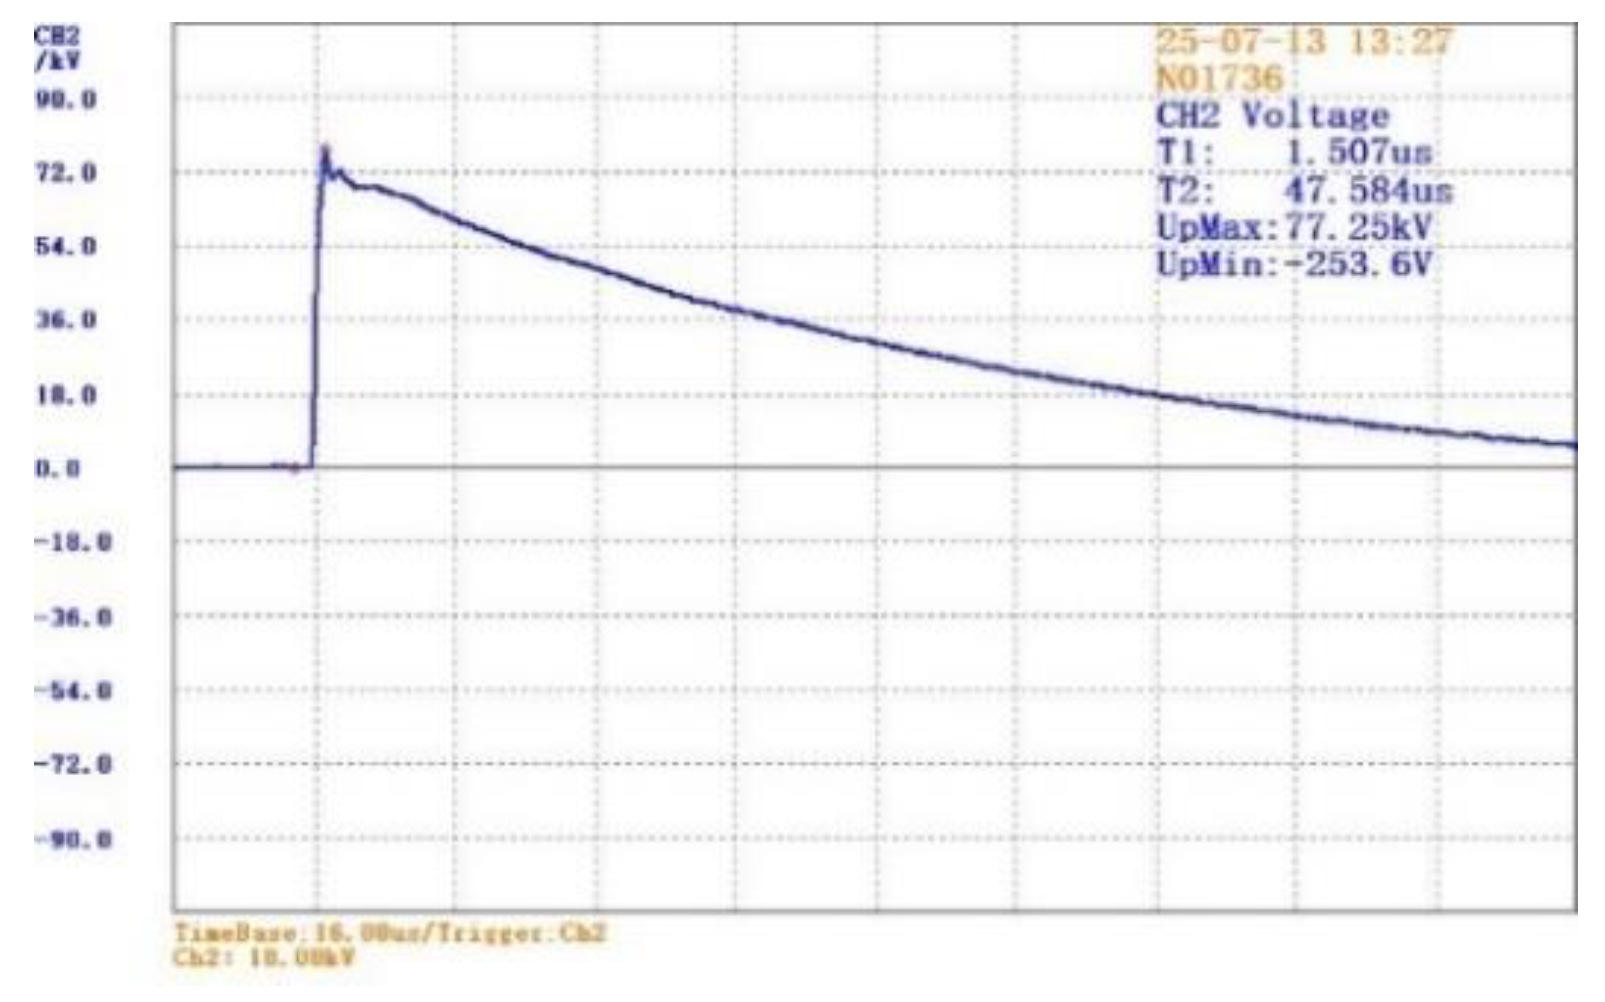
Figure 12.
Waveform recorded when positive polarity lightning impulse is applied to the circuit breaker.
Figure 12.
Waveform recorded when positive polarity lightning impulse is applied to the circuit breaker.
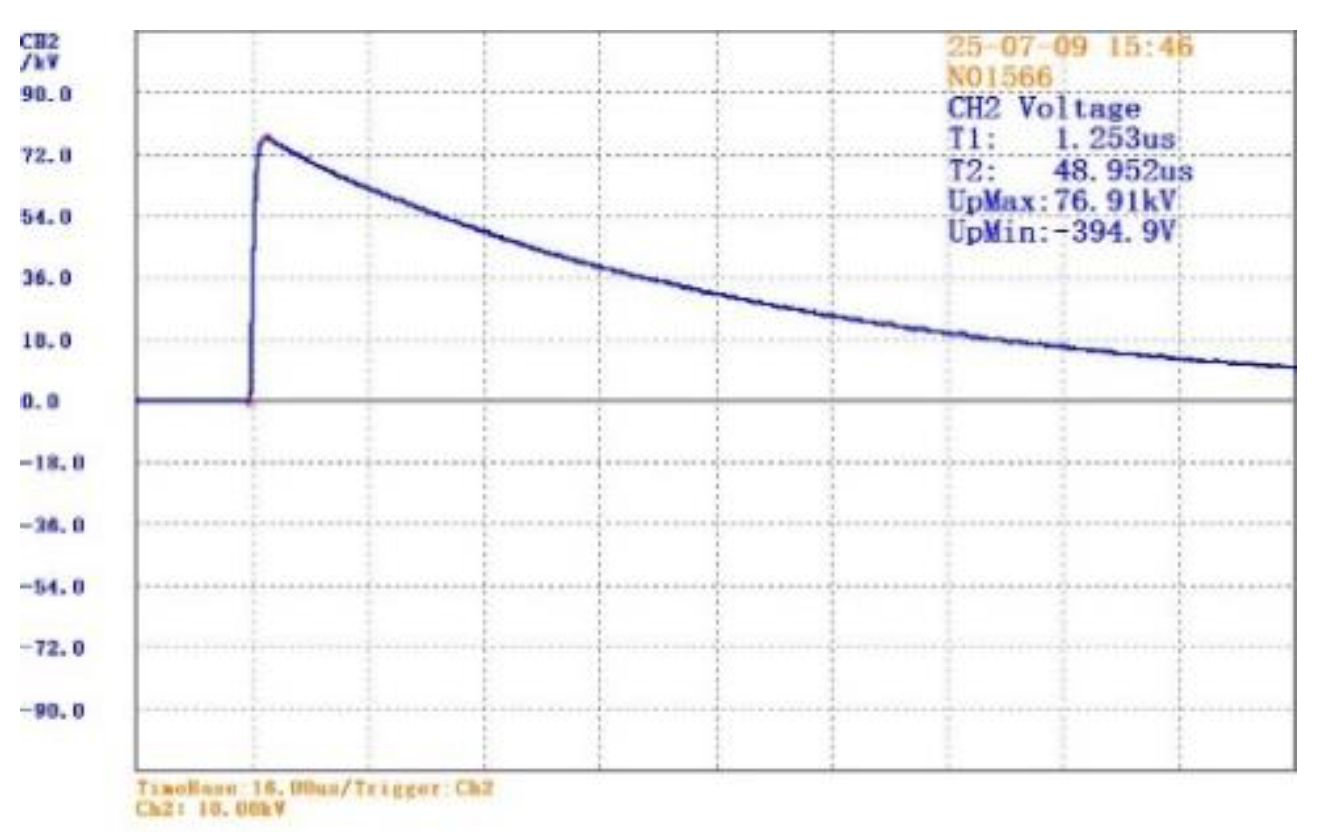
Figure 13.
Waveform recorded when a positive-polarity lightning impulse is applied to the disconnector.
Figure 13.
Waveform recorded when a positive-polarity lightning impulse is applied to the disconnector.
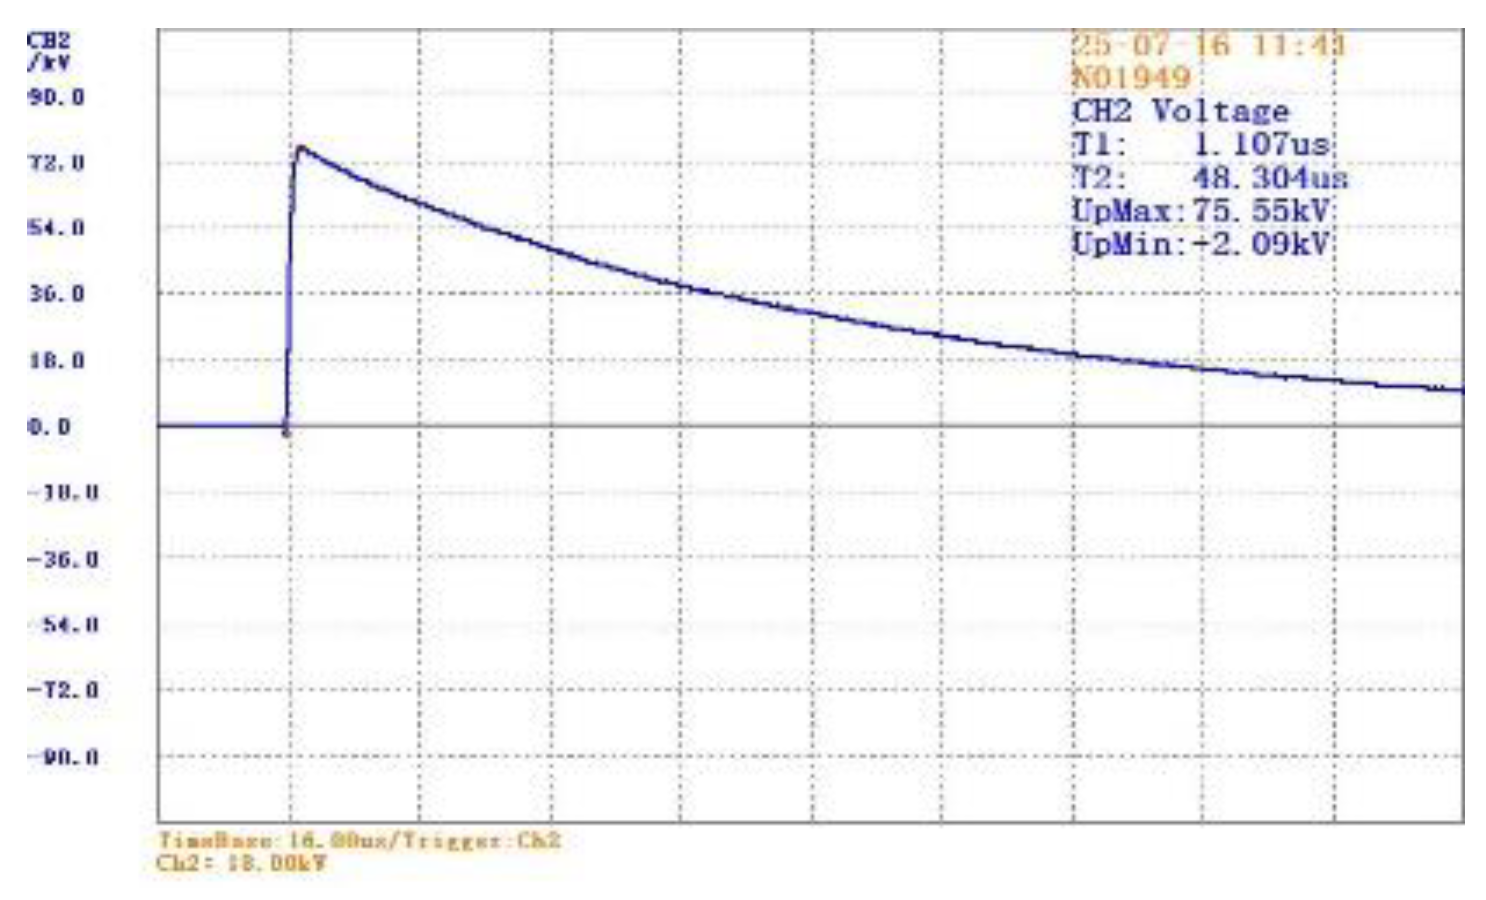
Table 1.
Partial technical specifications of the portable impulse generator.
| No. | Item | Parameter |
| 1 | Nominal voltage (kV) | ±120 |
| 2 | Rated voltage (kV) | ±120 |
| 3 | Rated energy (kJ) | 11 |
| 4 | Impulse capacitance (μF) | 2 |
| 5 | Number of stages | 1 |
Table 3.
Nameplate parameters of the tested transformer.
| Rated capacity (kVA) | Rated voltage (kV) | Lightning impulse withstand voltage (kV) | Winding type |
| 400 | 10 | 75 | Dyn11 |
Table 4.
Nameplate parameters of circuit breakers and disconnect switches.
| Name | Rated voltage (kV) | Lightning impulse withstand voltage (kV) |
| Vacuum circuit breaker |
12 | 75/85 |
| disconnect switch |
10 | 75/85 |
Table 5.
Transformer Lightning Impulse Test Application Parameters.
| Lightning waveform | A(kV) | B(kV) | C(kV) |
| 1.2/50μs(60%) | 45 | 45 | 45 |
| 1.2/50μs(100%) | 75 | 75 | 75 |
| 1.2/50μs(100%) | 75 | 75 | 75 |
| 1.2/50μs(100%) | 75 | 75 | 75 |
Table 6.
Transformer Lightning Impulse Test Results.
| Index | Polarity | Front Time (μs) | Time to Half-Value (μs) | Peak Voltage (kV) |
| 1 | Positive | 1.63 | 48.67 | 46.74 |
| Negative | 1.51 | 47.17 | -49.68 | |
| 2 | Positive | 1.51 | 47.42 | 77.25 |
| Negative | 1.53 | 47.64 | -77.88 | |
| 3 | Positive | 1.53 | 47.01 | 76.95 |
| Negative | 1.52 | 48.32 | -77.33 | |
| 4 | Positive | 1.56 | 47.00 | 77.47 |
| Negative | 1.48 | 47.50 | -77.00 |
Table 7.
Lightning Impulse Test Parameters For Different Switchgear.
| Name | Rated voltage (kV) | General (kV) | Between fractures (kV) |
| Vacuum circuit breaker |
12 | 75 | 85 |
| Disconnect switch |
10 | 75 | 85 |
Table 8.
Lightning Impulse Test Results Of Different Switchgear.
| Type | Positive | Front Time (μs) | Time to Half-Value (μs) | Peak Voltage (kV) |
| Vacuum Circuit breaker | Negative | 1.25 | 48.95 | 76.91 |
| Negative | 1.24 | 50.112 | -76.68 | |
| Disconnect switch | Positive | 1.11 | 48.30 | 75.55 |
| Negative | 1.08 | 49.088 | -76.40 |
Disclaimer/Publisher’s Note: The statements, opinions and data contained in all publications are solely those of the individual author(s) and contributor(s) and not of MDPI and/or the editor(s). MDPI and/or the editor(s) disclaim responsibility for any injury to people or property resulting from any ideas, methods, instructions or products referred to in the content. |
© 2025 by the authors. Licensee MDPI, Basel, Switzerland. This article is an open access article distributed under the terms and conditions of the Creative Commons Attribution (CC BY) license (http://creativecommons.org/licenses/by/4.0/).
Copyright: This open access article is published under a Creative Commons CC BY 4.0 license, which permit the free download, distribution, and reuse, provided that the author and preprint are cited in any reuse.


