
Submitted:
19 November 2025
Posted:
21 November 2025
You are already at the latest version
Abstract
The viscoelastic properties of ultraviolet radiation-curable polymer coatings of optical fibers were studied experimentally and numerically. The test setup was completed, and a series of natural experiments were conducted for an extended temperature range from –110 °C to +120 °C using a dynamic mechanical analyzer. Discrete dependencies of the complex module on temperature and frequency of kinematic loading were obtained. The problem of multiparametric optimization was solved. Defining relations were obtained for protective coating polymers, making it possible to describe the thermomechanical behavior of the glass-forming materials under consideration in a wide temperature range, including relaxation transition. The optimal solution was found for 18 series terms at the selected reference temperature Tr = −70 °C, C1 = 20.036, C2 = 32.666 for the DeSolite 3471-1-152A material. The optimal solution was found for 60 series terms at the selected reference temperature Tr = 0 °C, C1 = 40242.2827, C2 = 267448.888 for the DeSolite DS-2015 material. The models were verified according to the data of creep experiments. The capabilities of the viscoelastic model were demonstrated by the example of a numerical experiment of free thermal heating/cooling of a Panda-type optical fiber.

Keywords:
polarization-maintaining fiber
; panda fiber
; polymer
; protective coating
; geometric configuration
; material behavior models
; deformation behavior
; thermomechanics
; viscoelasticity
1. Introduction
Since 1996 to the present day, there has been active development in the field of microstructural and special optical fibers [1]. This trend is associated with a permanent increase in requirements for the characteristics of optical fibers used for creating unique sensors and fiber systems designed for measuring various physical parameters. A separate class of widely-spread optical fibers can be distinguished, namely, polarization-maintaining fibers (PMFs). They are used as sensing elements in sensor systems [2]. Modern measuring instruments make it possible to obtain data on various physical values at specific points of a structure and, if necessary, to record physical parameters continuously along the entire fiber [3,4,5,6]. Fiber-optic measuring systems are unique in their operational properties. A very wide range of sensors allows for high-precision measurement of magnetic and electric field strength, angular rate of rotation, temperature, displacement and strains, gas concentration and fluid flow rate, pressure and vibrations, and many other parameters [7,8,9,10]. A special single-mode optical fiber of the Panda type is used as a sensing element in a fairly large number of sensors [8,9,10]. Optical fibers of this type are used, in particular, to create optical gyroscopes [11].
Special optical fibers usually comprise structures made of doped fused silica in a shell of 1–2 layers of a polymer protective coating [12,13]. Deposition and modified chemical vapor deposition (MCVD) are used to produce optical fiber preforms [14]. Alternative production methods are being considered [15], though at the moment MCVD remains the main method of optical fiber preform production [14,15]. Optical fibers are then formed from the preforms using a high-temperature drawing process [15]. However, during the drawing process, microdefects may appear on the surface of the quartz base. In the work [16], a number of defects were identified in the fiber manufacturing technology, which significantly affect its strength. Defects resulting from the technological process can be minimized by applying special protective coatings to the optical fibers [14]. Such protective coatings reduce the negative effect of both mechanical impact and aggressive attack of the environment. Besides, they have a significant impact on the optical characteristics of optical fiber. When choosing a protective coating, it is necessary to take into account its application field and further usage conditions [15]. One of the major challenges for protective coatings is to reduce negative effects of the mechanical impacts associated with abrasion, microbending, distributed and concentrated loads, and strength [17].
There is a fairly wide range of coatings for various operating conditions, taking into account thermal/force effects, environmental conditions, and many other factors. Carbon [18,19], acrylate, silicone, polyimide [18], and metal coatings are currently used to protect optical fibers from temperature, force effects, and various environmental influences [18]. The choice of a specific option depends on the specific use of the fiber.
The most widely spread polymer coatings can lead to a decrease in the optical parameters of the fiber when it is used in difficult operating conditions, for example, at low subzero or high above-zero temperatures. This is due to the limited temperature range in which the properties of the polymers used are stable [20]. At the same time, the fiber often must operate for significant periods of time at elevated or lowered temperatures, or in conditions of cyclic temperature changes, including in aggressive environments. The reasons for possible failures may be associated with a decrease in resistance to microbending due to glass transition processes in the internal damping coating, thermal shrinkage of the coatings, and formation of axial stresses in the fiber, a decrease in the coating mechanical characteristics, ensuring fiber resistance to external forces, chemical or physical ageing, or polymer degradation. Analysis of the thermomechanical properties of coating materials, making it possible to make a scientifically based choice of material based on the conditions of its further operation and the target optical characteristics of the products, is an extremely important area of research.
Single-layer protective coatings of acrylates were originally created [17]. Subsequently, two-layer options most often began to be used, in which the outer layer of the coating provides protection from mechanical impacts of the internal damping layer and the fiber itself [20]. Urethane acrylates are often used for manufacturing two-layer coatings. Coatings of this type effectively protect optical fiber from microbending. Coating thickness can be from several tens to hundreds of microns. Thickness and properties of the coating, as well as the ratio of layer thicknesses, affect the operational characteristics of the fiber [21]. Primary coatings must have a low glass transition temperature and low elastic modulus at low (subzero) temperatures [22]. Secondary coatings must have higher strength and sufficiently high glass transition temperature, providing sufficient protection of the internal layers over the entire operating temperature range. The composition of the polymer coating [23] and the technology of its curing on the fiber [24] also have a significant effect on the thermomechanical behavior of the materials, which in turn affects the optical characteristics of the fiber and optical sensors comprising such fibers.
Polymer coatings not only perform a protective function, but can also act as a low-index optical medium to control light by providing total internal reflection [25]. Studying the temperature stability of the fiber-coating system is relevant, which implies conducting experiments on the thermophysics and thermomechanics of the materials. The study of the viscosity of polymer coatings of optical fibers is relevant for rationalizing their application technology [26]. The mechanical strength and stability of the fiber (ability of the fiber to maintain high operational reliability) depend on the properties of the protective coating and the phenomena observed at the interfaces of the glass base and coatings of different types [27]. Stable operation of the coatings in a wide temperature range ensures an increased service life of the optical fiber. Good adhesion of the coatings is required to form a stable contact at the interface of the materials. Fiber protective coatings must have excellent deformability, that is, they must withstand loads without the formation of ruptures and cracks. The main function of protective coatings is to maintain the operational properties of the fiber, even in a wide range of temperature and force effects in environments of various natures.
The importance of proper selection of coatings for specific operating conditions, as well as accumulation of empirical data on their mechanical behavior, including over a wide range of temperatures and force loads, is noted in [15,17].
All these facts make it urgent to develop mathematical models describing the thermomechanical properties of polymers for research, optimization, and improving the accuracy of fiber optic sensors. Solving such problems requires a significant amount of experimentation.
Selection of optical fiber materials, including polymer protective coatings, has a significant impact on their performance and functionality [28]. Data on the behavior of the materials, including over a wide temperature range, are also required to predict the performance of optical fibers and sensors comprising such optical fibers. It is known that temperature has a significant effect on glass-forming materials, and consequently, on the properties of optical fibers [29]. Studies of the temperature effect on the behavior of the materials optical fibers are made from are required to optimize the design of the induced polarization optical fibers, to ensure their durability and the formation of specified operational characteristics. Information on the thermomechanical properties of the materials makes it possible to determine the operating temperature range and to make a reasonable decision on the applicability of a particular structure, taking into account the operational characteristics [18]. It is known that relaxation processes, for instance, softening of polymers at high temperatures and glass transition at low temperatures, affect the behavior of the materials and systems in which they are used [30]. The study of such temperature effects is important for understanding the functional characteristic features of fiber optical products. Determination of the temperature effects is important for optimizing the performance of optical systems in operating conditions. Studies of polymer properties are also important for improving existing technological processes, since it makes it possible to refine data on thermal stresses, which have a significant effect on the properties of induced polarization optical fibers.
An accurate and reliable specification of the complex nonlinear behavior of polymer coatings as a function of temperature and strain rates is required to improve the accuracy of the interpretation of data obtained from the fiber optic sensors. This, in turn, makes the task of generating behavior models of coating materials over a wide range of temperatures and strain rates. Such models also make it possible to use numerical analysis and simulation methods, including the finite element method, to analyze the behavior of PMF products under operating conditions or as a part of complex products [11,31,32]. Creation of effective digital models of optical systems implies not only a large amount of empirical studies, but also the formation of behavior models of the materials. Formulation of defining relations adequately predicting the thermomechanical behavior of the materials over a wide temperature range, including relaxation transitions, is urgent and necessary for the development of the scientific field.
In the present article, experimental studies are described of the two-layer protective coating materials of Panda-type optical fiber. New qualitative and quantitative patterns of the nonlinear behavior of the materials over the operating temperature range were established. A mathematical model of the thermomechanical behavior of the materials was formulated based on the experimental data, taking into account thermophysics. The said mathematical model was tested in the analysis of the stress-strain state of a real structure. The work is of high practical importance in terms of accumulating data on the mechanical behavior of the coatings, including over a wide range of temperatures and force loads. The current study results also form a database for creating digital shadows and twins of optical fibers and monitoring systems in which they are used.
2. Materials and Methods
2.1. Panda-Type Optical Fiber
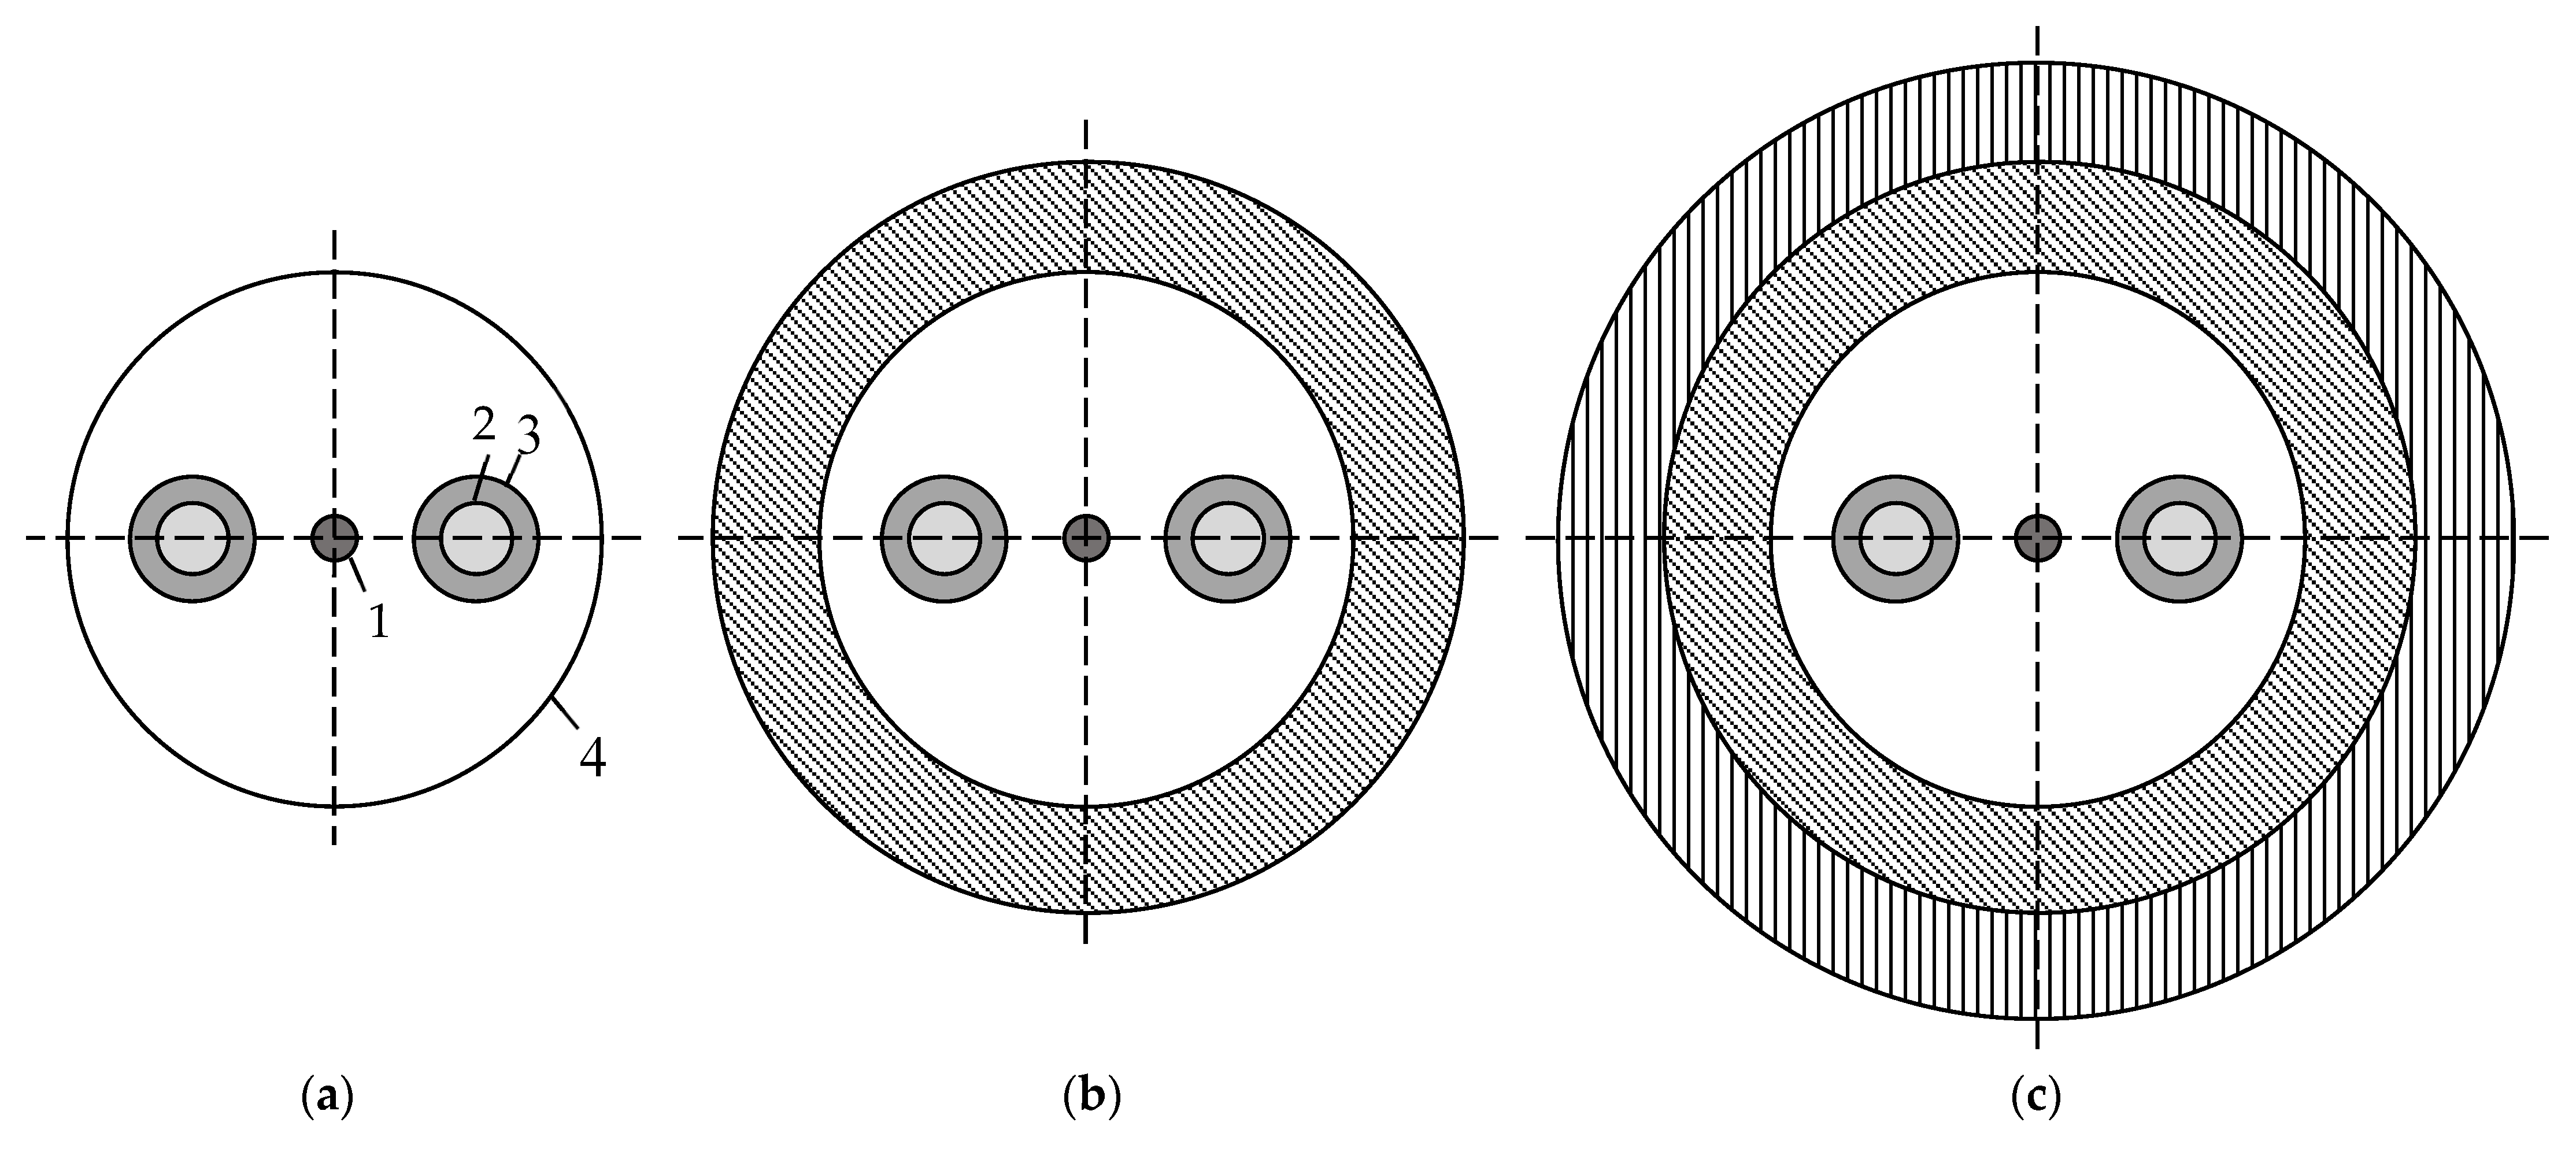
Polarization-maintaining fiber (PMF) is a heterogeneous structure consisting of doped fused silica. It is a special single-mode optical fiber maintaining the polarization of light. Panda optical fiber relates to PMF (see Figure 1). Panda fiber comprises not only differently doped fused silica elements, but also protective polymer coatings. The protective coating can be either single-layer or double-layer. The geometry of the coating depends on the materials and operating conditions.
The optical fiber preform is manufactured using MCVD technology [33,34]. This makes it possible to introduce doping additives to the light-conducting core and power rods. The blanks of the light-conducting core and power rods are manufactured separately. These blanks undergo additional process steps to create the final fiber blank. The light-conducting core blank is built up with pure quartz layers to the required diameter. Holes for power rods are drilled in the obtained blank. Pure quartz layers in the blank are peeled off as much as possible by applying stress to the rods. This is necessary to form the required preform geometry with the established position of the elements. The preform is assembled by inserting rods into a blank with a light-conducting core. After that, the preform is subjected to high-temperature drawing. The optic preform is subjected to the drawing process at the fiber draw tower at high temperatures [35]. The macro-sized preform is drawn into a thin optical fiber of microscopic size under its own weight as a result of softening [34]. During the drawing process, a protective coating is applied to the optical fiber [36]. The coating is polymerized by ultraviolet radiation. The process is technologically and economically efficient [37].
The thermomechanical and thermophysical behavior of the primary (DeSolite 3471-1-152A) and secondary (DeSolite DS-2015) polymer protective coating materials from DSM Desotech Inc. (Elin, IL, USA) are considered in these studies [38,39]. The above-mentioned materials are qualified as acrylates. Experimental studies formed the basis for numerical analogues of the materials, formulated within the scope of the viscoelasticity theory. Models of materials are of practical interest and can be used for predictive analysis of technological processes of manufacturing and operation of optical fibers.
Figure 1.
Panda-type optical fiber: a is fiber without protective coating; b is fiber in a single-layer protective coating; c is fiber in a two-layer protective coating; 1 is light-conducting core; 2 is inner layer of the power rod; 3 is outer layer of the power rod; 4 is quartz glass.
Figure 1.
Panda-type optical fiber: a is fiber without protective coating; b is fiber in a single-layer protective coating; c is fiber in a two-layer protective coating; 1 is light-conducting core; 2 is inner layer of the power rod; 3 is outer layer of the power rod; 4 is quartz glass.
2.2. Materials of Polymer Coating
A protective coating is applied to the fiber during the drawing process and is cured by UV radiation. These polymers absorb light well in the UV range. This affects the formation of specimens of the required quality. It is problematic to produce a homogeneous massive specimen with a uniform polymerization degree. UV-induced degradation of the material can occur in the outer layers when exposed sufficiently to polymerize the inner layers. Therefore, in the current work, the procedure was developed for creating film specimens close in size to the thickness of optical fiber coatings.
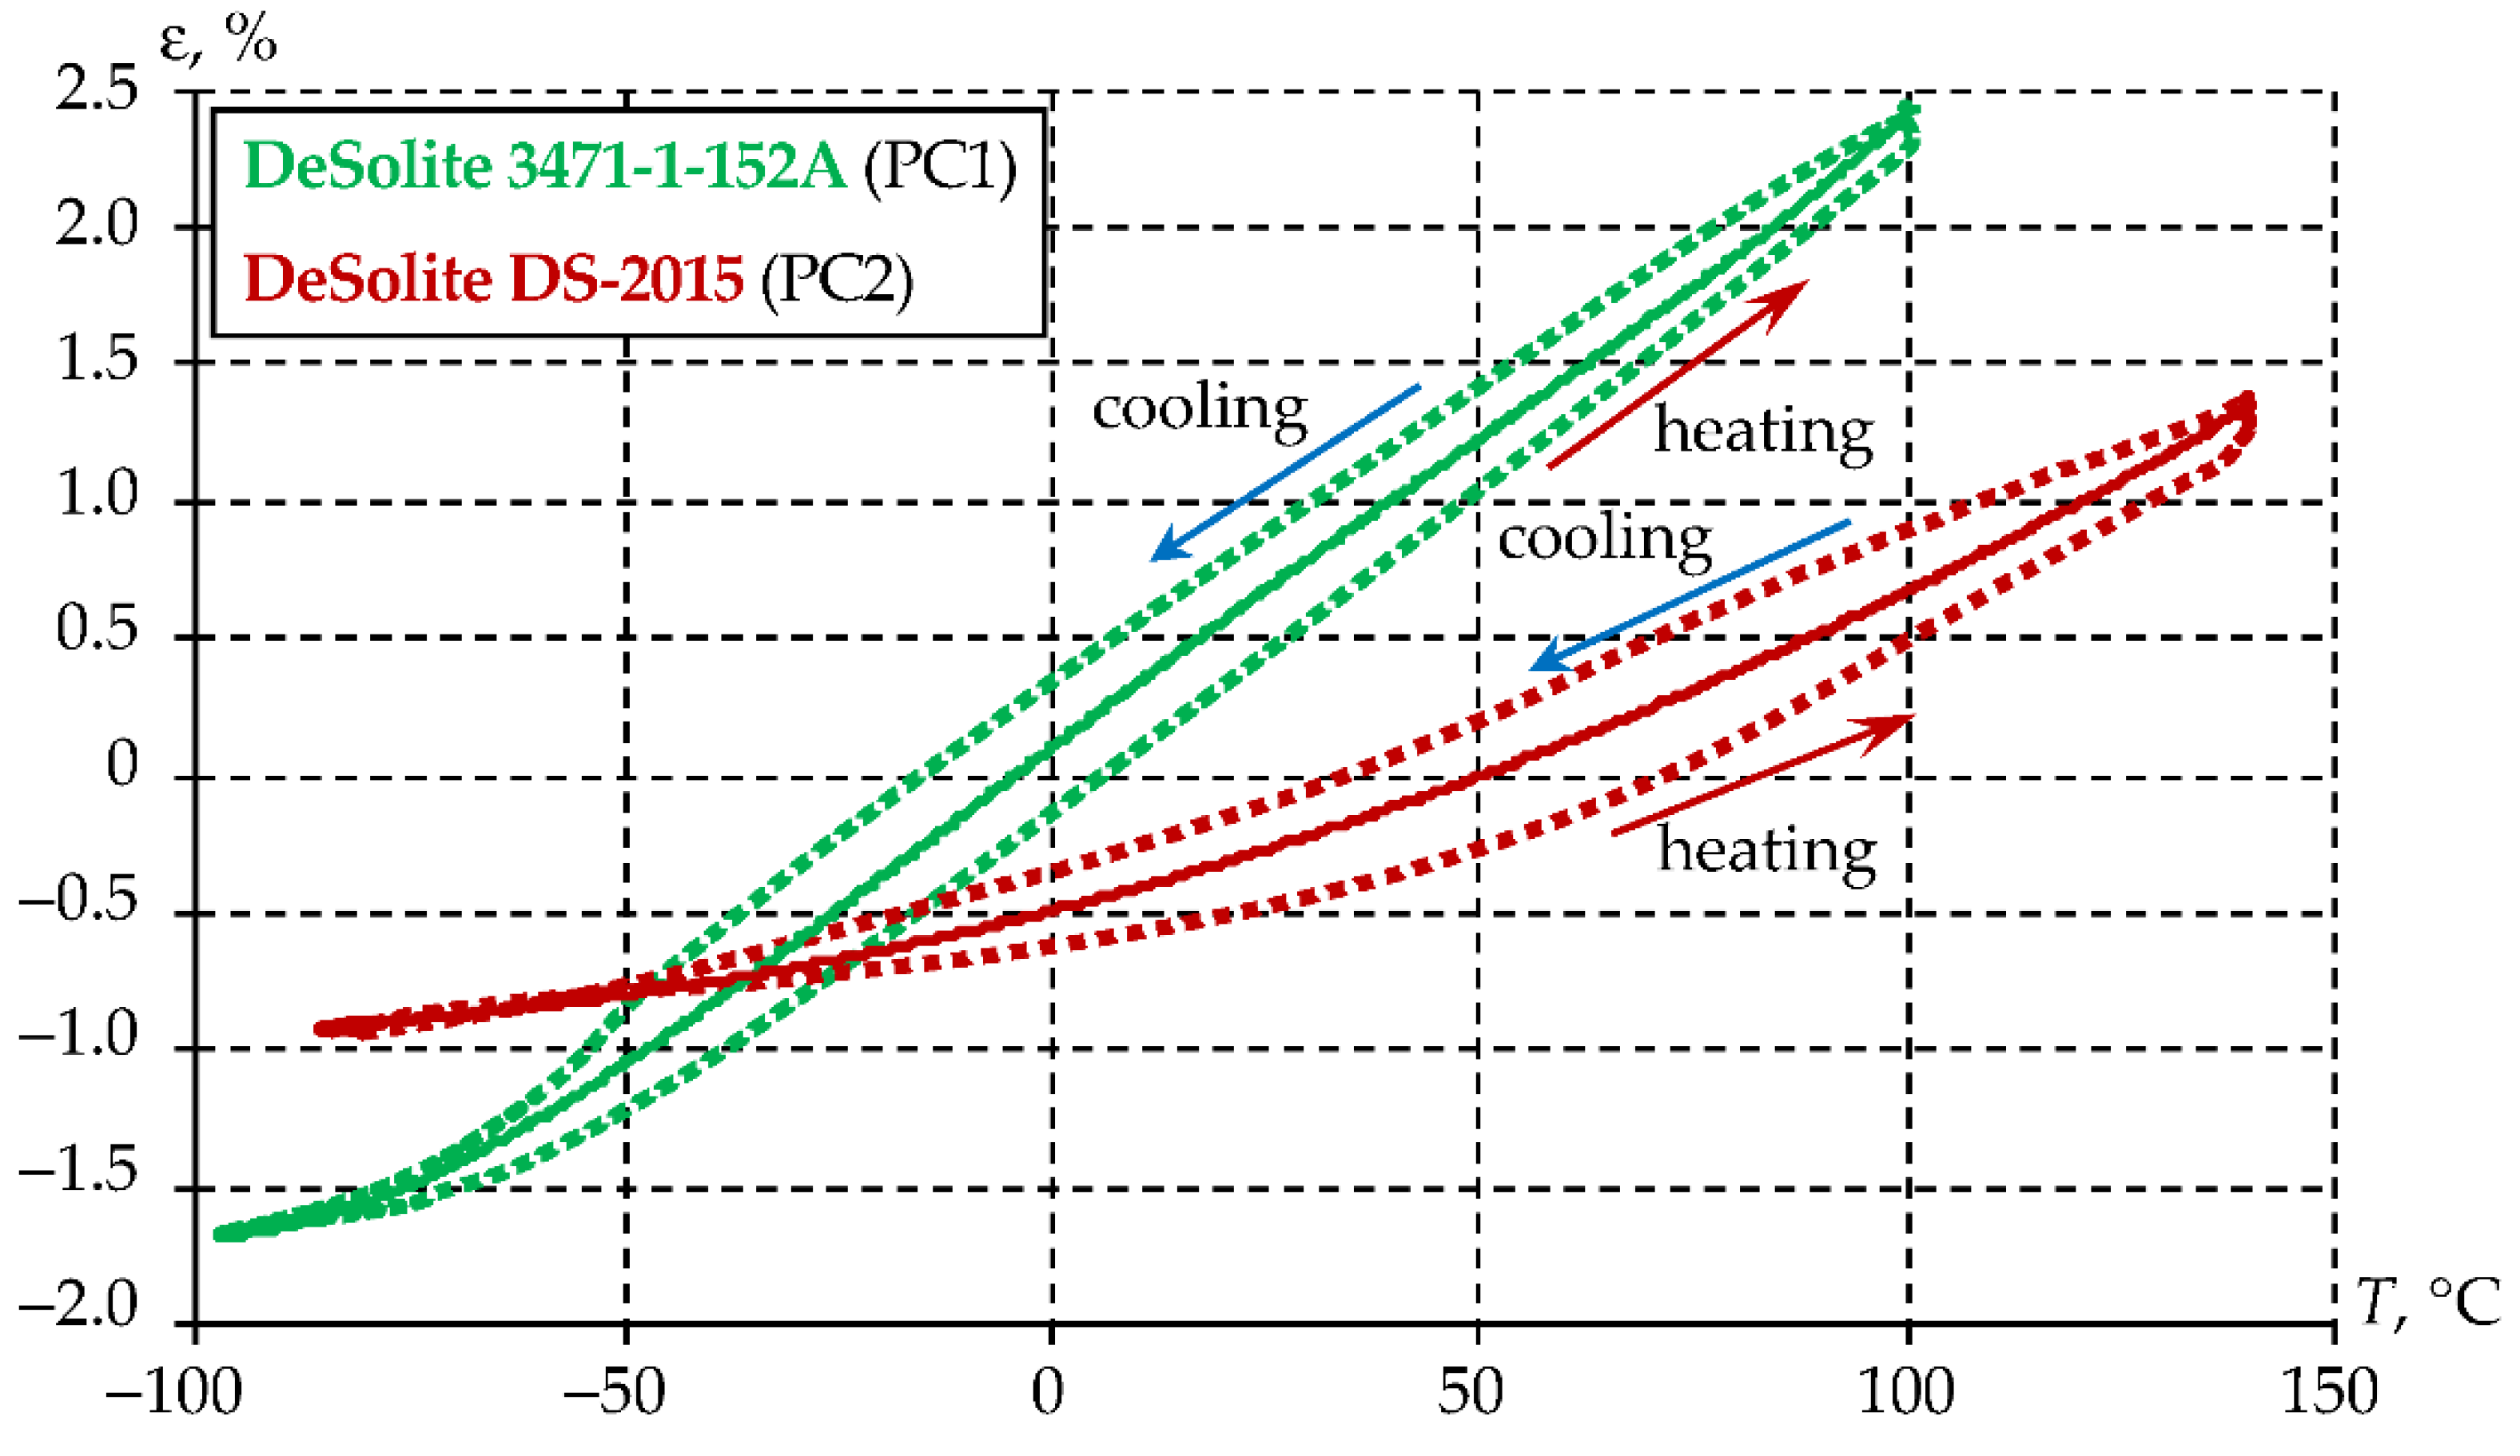
A study of the complex module on specimens of polymer protective coatings (PC) DeSolite 3471-1-152A and DeSolite DS-2015, used in a number of fiber optic applications, was carried out within the scope of the present work. The obtained results show that relaxation transitions fall within the operational temperature range °C (see Figure 2). Thermoviscoelasticity models must be used to correctly describe the thermomechanical response of such materials to thermal force effects.
on temperature.
The viscoelastic behavior of the materials was studied on films with characteristic thicknesses comparable in values with a real coating, and on plates when he rigidity of the films was insufficient.
2.3. Experimental Study
An experimental study of the thermomechanical behavior of protective coating materials was carried out using the equipment of the Plastic Laboratory (Perm National Research Polytechnic University, Perm, Russia).
2.3.1. Equipment
The study of the physical and mechanical properties of the polymer coatings DeSolite 3471-1-152A and DeSolite DS-2015 was carried out using a DMA Q800 dynamic mechanical analyzer (TA Instruments Inc., New Castle, USA) with a GCA (gas cooling accessory) liquid nitrogen cooling system. The measuring system makes it possible to perform automatic monitoring of applied forces and displacements occurring in the specimens under the influence of various levels of loads and temperatures. The range of measured linear displacements is 0 to 10 mm with an accuracy of 1 nm. The controlled load can be set in the range of 0.001 to 18 N. The GCA liquid nitrogen cooling system allows for programmable heating and cooling of the specimens in the temperature range from –150 to +600 °C. Cold nitrogen gas, obtained by evaporating liquid nitrogen from a Dewar flask during its controlled heating. is used for cooling. High temperatures are provided by the electric heating elements of the thermal chamber. Special accessory equipment was used to fix the test specimens. The heating rate can be set in the range of 0.1 to 20 °C/min. The cooling rate can be set in the range of 0.1 to 10 °C/min and more.
2.3.2. Specimen Preparation
Specimens in two options were manufactured for the study: films up to 250 µm in thickness and plates with characteristic dimensions of 2×6×20 mm. The starting materials were photopolymers DeSolite DS-2015 and DeSolite 3471-1-152A (in liquid, uncured state).
The specimens in the form of plates were produced in the following sequence: before casting into molds, the polymer was heated in a furnace to a temperature of 35…40 °C to reduce viscosity. Then, after casting into fluoroplastic molds, the specimens were polymerized by UV radiation with an exposure of at least 1 J/cm2. The obtained blanks were kept for several days at room temperature and then placed into a DMA Q800 thermal chamber and kept for 2 hours at 80 °C (DeSolite 3471-1-152A) and 110 °C (DeSolite DS-2015) to relieve residual stress. After that, they were naturally cooled for several hours in a closed thermal chamber to room temperature. Specimens 6.25 mm wide were formed from the films using a cutting press.
Besides, film specimens were produced using the method described below. The specimens were polymerized with a DRT-400 UV lamp (Open Joint-Stock Company LISMA – All-Russian Research, Design and Technological Institute of Light Sources named after A.N. Lodygin, Saransk, Russia). The working platform was positioned so as to ensure radiation intensity on the specimen surface of at least 5 mW/cm2. Radiation intensity was measured using a TKA-01/3 luxometer-UV radiometer (LLC Scientific and Technical Enterprise TKA, St. Petersburg, Russia). The following preliminary operations were carried out in advance: 1–2 drops of the OP-7 auxiliary substance (nonylphenol ethoxylates–based surface-active agent) were applied to a substrate made of polyethylene terephthalate film and rubbed with a cotton cloth so that an extremely thin layer of the substance stayed on the surface of the films. A small amount of the composition was applied to the treated substrate and then covered with another layer of film and pressed down with a weight to distribute the liquid composition in a thin layer of 0.05…0.25 mm. After removing the load, the blank was placed in a radiation zone for the time required to form the exposure specified by the manufacturer; then the polyethylene terephthalate film was removed from the cured polymer.
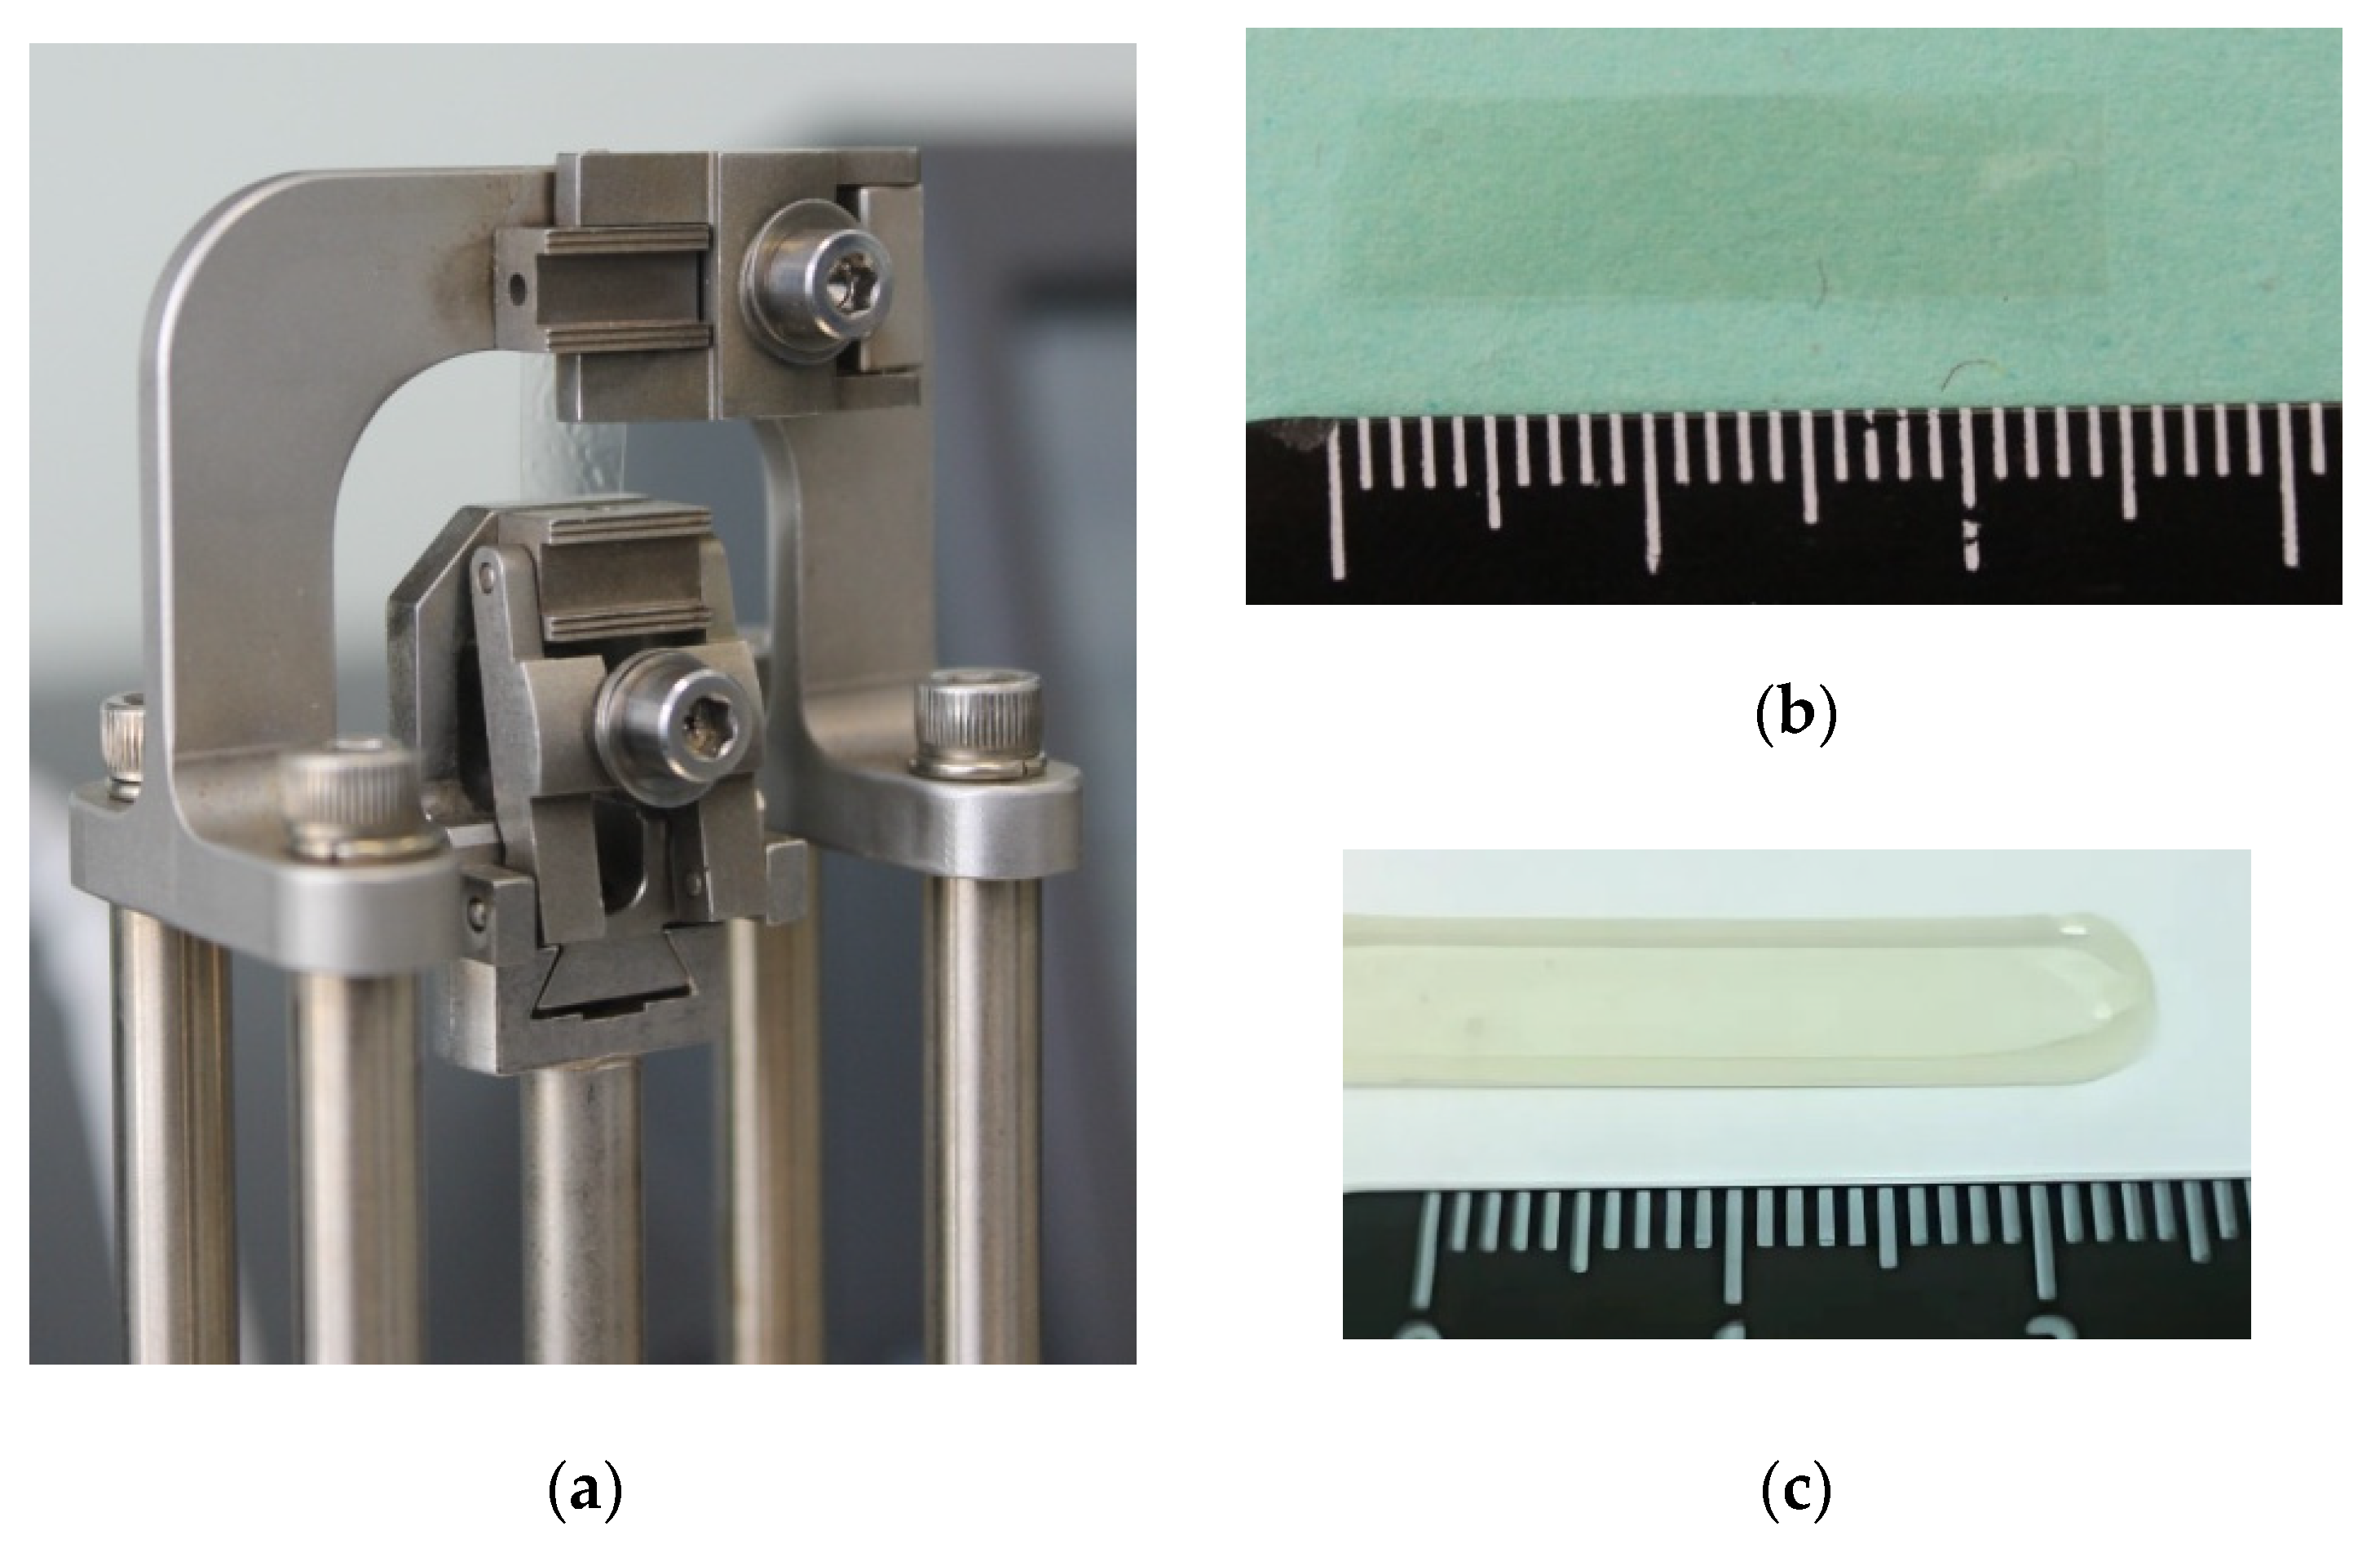
The obtained specimens, as well as the equipment used in the experiments, are presented in Figure 3.
Figure 3.
Experimental studies: a is experimental equipment with accessories; b, c are specimens; b is film specimens; c is plate specimens.
Figure 3.
Experimental studies: a is experimental equipment with accessories; b, c are specimens; b is film specimens; c is plate specimens.
The specimens and their geometric configurations are described in Section 3 "Results and discussion". This is due to the need to conduct experiments with different geometries of the specimens due to the sensitivity of materials to loading conditions, especially in temperature zones close to the structural and relaxation transitions of polymers.
2.3.3. Experiment Setup
The studied polymers are in different relaxation states at room temperature. DeSolite 3471-1-152A is in a rubbery state. DeSolite DS-2015 is in a glassy state. According to the manufacturer’s data [38,39], relaxation transitions in protective coating polymers occur in the operating temperature range −60÷60°C. However, the criterion that determines the relaxation transition area by storage modulus change from 1000 to 100 MPa provides only an approximate estimate. The width of the temperature range in which the relaxation state of the material changes is described approximately. To determine the range of temperature change required for a qualitative description of the thermomechanics of the materials, pilot experiments were carried out.
Transition of DeSolite 3471-1-152A from rubbery to glassy state takes place at temperatures close to the lower limit of the range. According to the manufacturer’s data, glass transition occurs at temperatures from −54 °C to −65 °C [38]. Pilot experiments also demonstrated that the temperature range in which the relaxation transition occurred extended below −60 °C (see Figure 2). The studied temperature range was extended in the area of negative temperatures to −80 °C, and in some experiments, the specimens were cooled below −105 °C. This was done to more fully describe the viscoelastic behavior.
DeSolite DS-2015 begins to devitrify in the upper part of the operating temperature range. Relaxation transition temperatures in the range from +40 to +80 °C are specified by the manufacturer [39]. According to the pilot experiments’ results (see Figure 2), the range of the temperatures studied for DeSolite DS-2015 should be extended to +110 °C.
In both cases, extending the temperature range studied is necessary to cover the entire relaxation transition range. This will allow for the accurate determination of the long-term and instantaneous elastic moduli and, consequently, the correct description of the viscoelastic behavior of the material.
2.3.4. Experimental Procedure and Design
2.3.4.1. Determination of the Relaxation Transition Temperature Range of Polymer Coatings
It is necessary to know the relaxation transition temperatures of the materials for the correct design of experiments to determine the viscoelastic parameters of polymers. Relaxation transitions of the UV-curable polymers DeSolite were studied in a series of natural experiments using a dynamic mechanical analyzer (DMA) in the current work. Temperature dependencies of the complex module E* were determined. The method used to determine the range of glass transition temperatures is similar to the procedure for determining the range of glass transition temperatures in polymers described in ISO 6721-11.
The temperature change rate affects the viscoelastic response of the material. This is taken into account in standard methods for determining the glass transition temperature of plastics. It is known that different temperature change rates correspond to different values of the glass transition temperature. The obtained experimental data at different heating rates are extrapolated to a zero rate of temperature change. Subsequently, it is used as one of the physical characteristics of the material for comparing some polymers with others without reference to the experimental conditions.
The following procedure was used for the express analysis of glass transition temperatures and relaxation transition temperature range:
- The specimens in the form of films or plates, fixed in special grips (see Figure 3), were heated significantly above the glass transition temperature.
- The study of the complex modulus is performed under oscillating load. It is superimposed on a constant force greater in magnitude than the amplitude of the harmonic component. After applying a constant load, operators waited for the complete realization of the deformation processes in the specimens, the end of which was determined by reaching a "shelf" of deformation on the time dependency diagram, at the temperature of the upper limit of the studied range, before starting the temperature changing process.
- The specimen was cooled down to the lower limit of the range at a constant rate of 2 °C/min under the influence of a harmonic force with a frequency of 1 Hz, and was kept until the deformation reached the above-mentioned "shelf", whereupon it was heated at the same rate to the initial temperature.
- Displacements, temperature, and force were recorded throughout the experiment. The dependencies of the storage and loss moduli and their ratio (_) were calculated on the basis of the data obtained for the hardware-software complex used.
Characteristic temperatures characterizing relaxation transition in the polymers at a zero rate of temperature change were determined as a result of such an experiment, providing averaged data on heating and cooling.
The method described seems to be a more convenient analogue of the procedure described in ISO 6721-11, because within the scope of one experiment, data are obtained for two different rates of temperature change, and averaging of the obtained results provides the desired dependence for the zero rate of temperature change, in contrast to the standard procedures, where it is determined by extrapolating data of several experiments.
2.3.4.2. Creep Experiment at a Constant Temperature and a Fixed Load
Traditional for glass-forming materials relaxation or creep experiments can be used to test the DMA-obtained viscoelastic properties of the materials. A series of natural creep experiments at a constant load, at various temperature values, was performed in the framework of the presented work. The study was performed according to the following procedure:
- The specimens in the form of films or plates were fixed in special grips of DMA Q800.
- The required temperature was set.
- Operators waited for the complete realization of the deformation processes in the specimens, caused by temperature deformations, the end of which was determined by reaching a "plateau" of deformation in a time dependency diagram.
- A load was applied, the value of which was constant throughout the entire subsequent experiment.
- The dependence of displacements (deformations) on time was recorded.
The data obtained in this way at different temperatures and loads can be compared to numerical simulation results for verification. For example, the data on the viscoelastic behavior of the materials obtained from the results of the study of the dependence of the complex modulus on frequency and temperature, as well as basing on them defining relations.
2.4. Numerical Simulation and Its Realization
The numerical simulation was implemented on the basis of the Laboratory of Digital Engineering of the Advanced Engineering School "High School of Aircraft Engine Production" (Perm National Research Polytechnic University, Perm, Russia). Computing stations with Intel Core i9-10900F processor, 128 Gb RAM and 4 Tb SSD were used for the numerical solution of the problem.
2.4.1. Thermomechanics of Panda-Type Optical Fiber
Figure 4 presents the design diagram of Panda-type optical fiber in a two-layer protective polymer coating.
Figure 4.
Design scheme of a fiber with a two-layer protective coating.
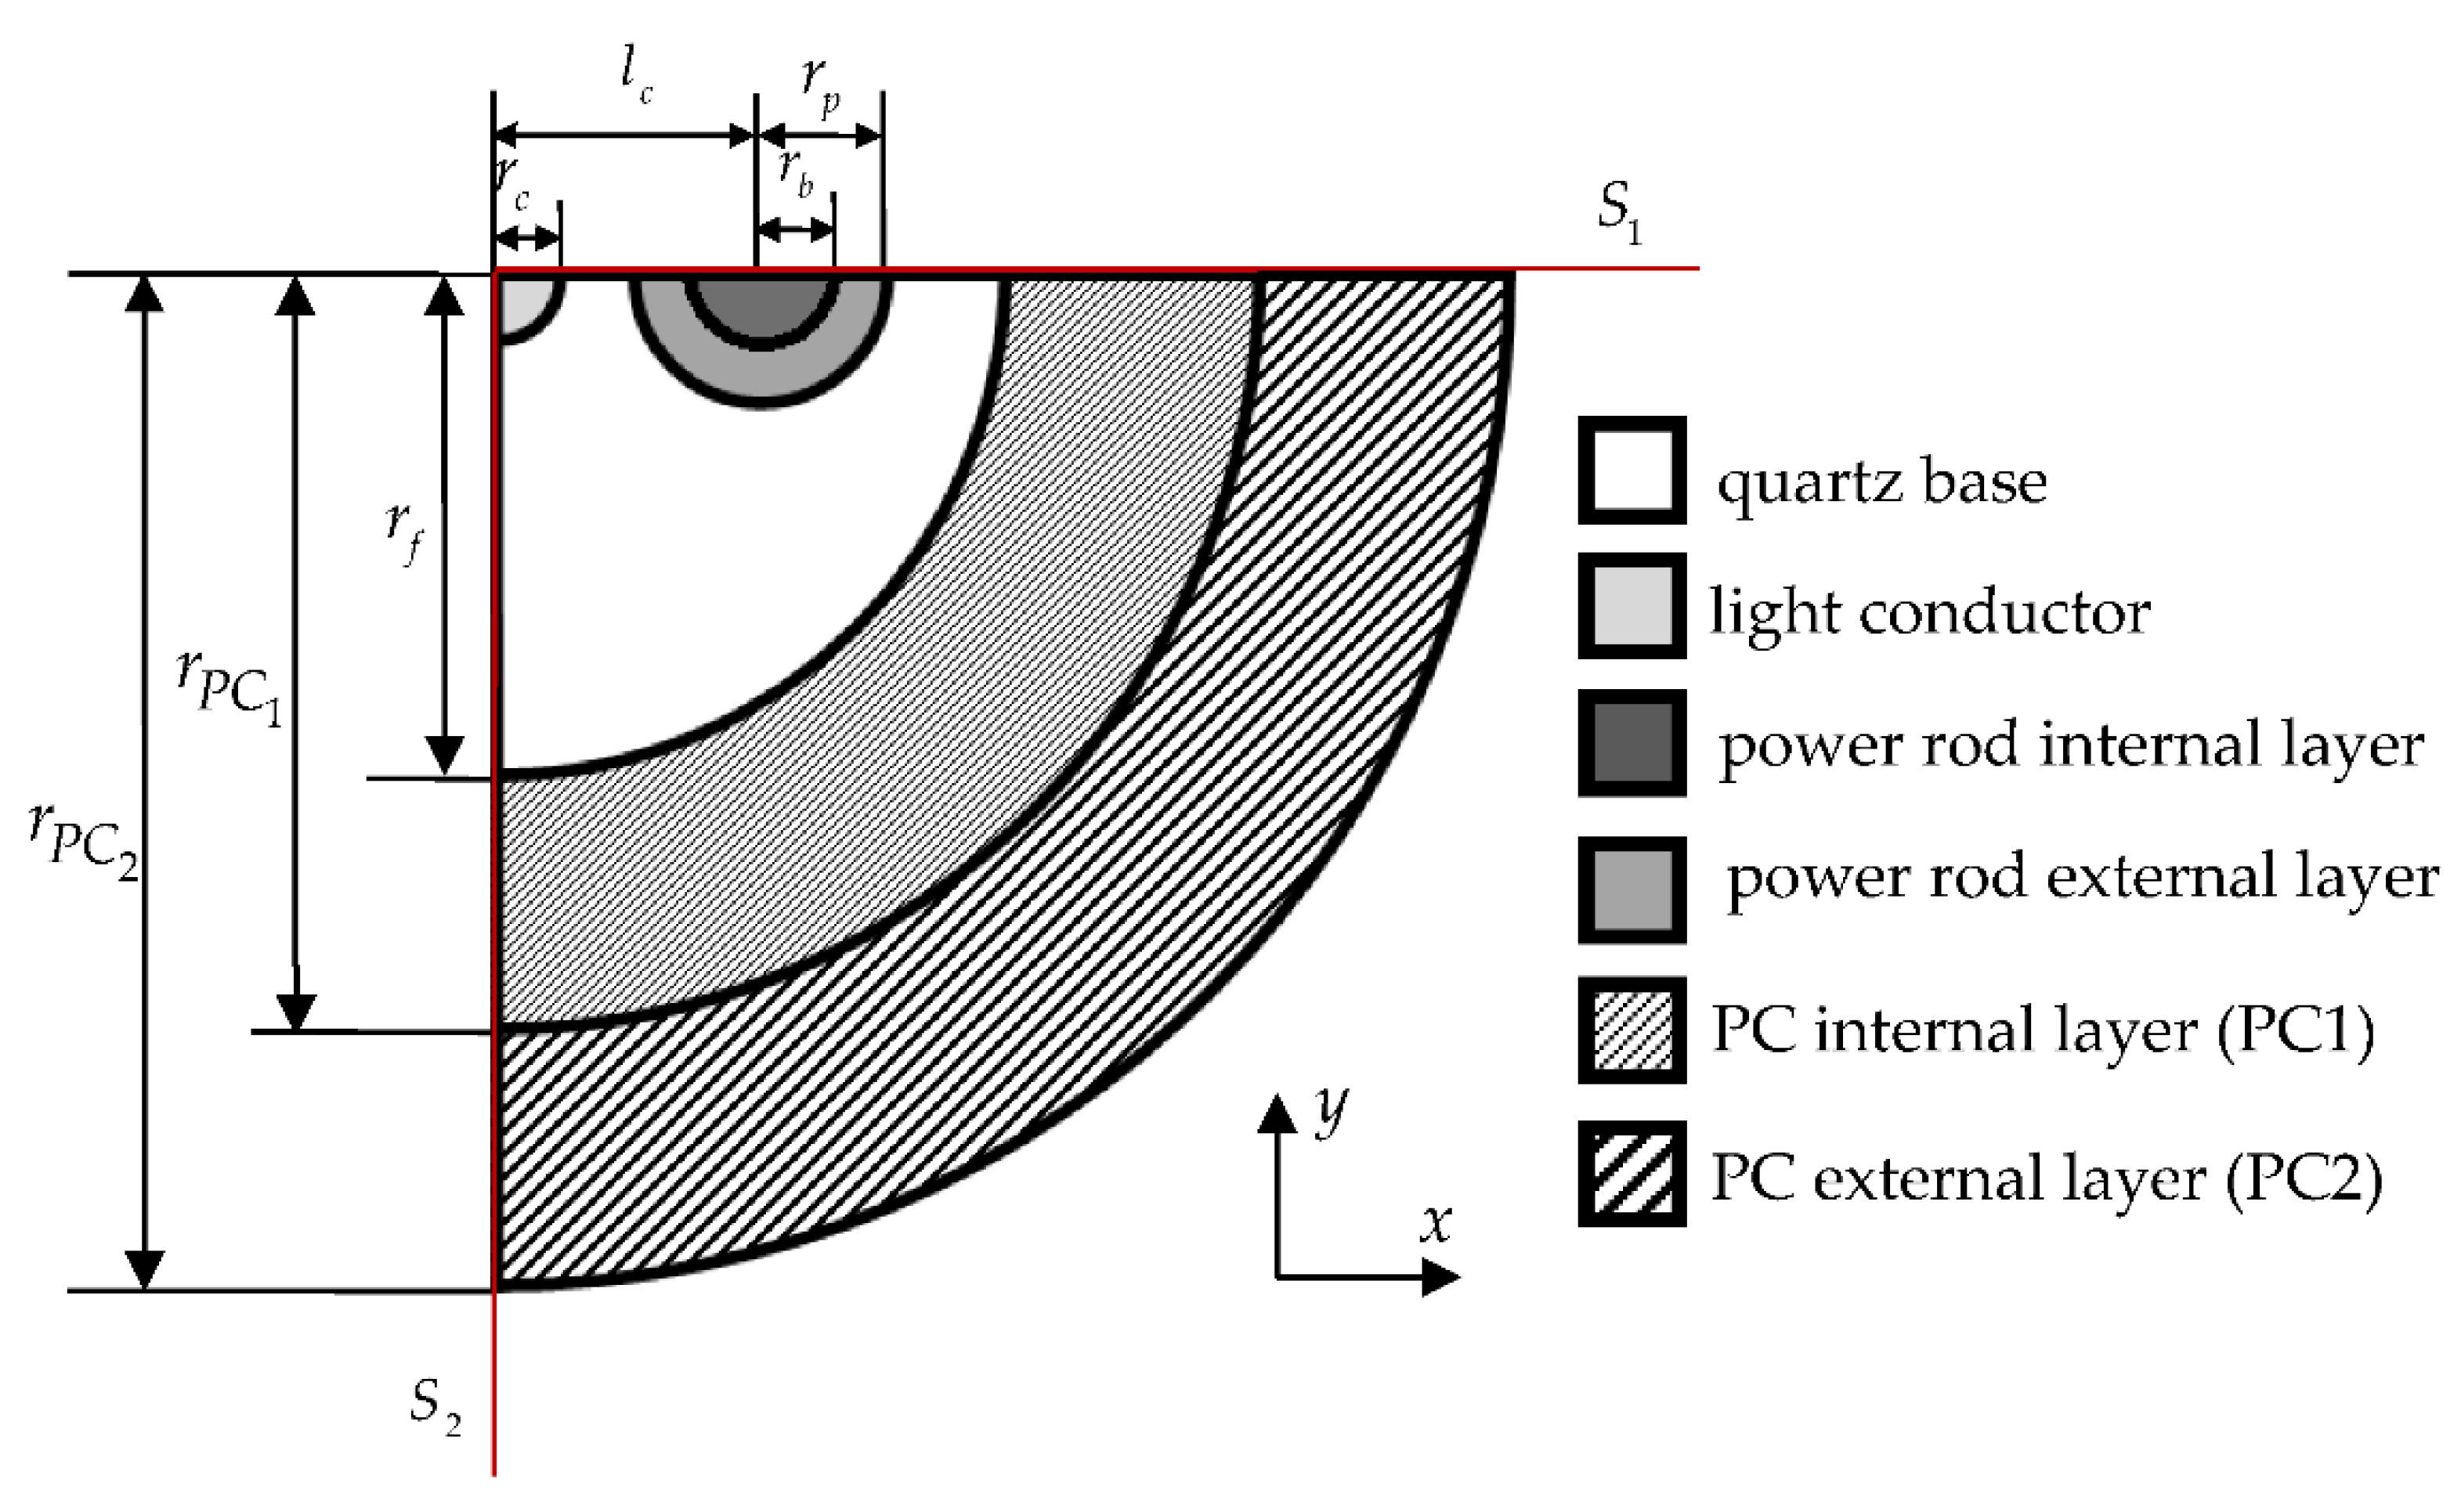
Panda type optical fiber model: quartz base SiO2; the light conductor is quartz doped GeO2; the power rod internal layer is quartz doped B2O3; the power rod external layer is quartz doped B2O3 and P2O5; the PC internal layer is made of polymer material (PC1 – DeSolite 3471-1-152A); the PC external layer is made of polymer material (PC2 – DeSolite DS-2015). Within the scope of the present work, the ideal geometric cross-section of Panda-type optical fiber was simulated. The geometric parameters of the design diagram are presented in Table 1.

Table 1.
Geometric parameters.
| Parameter | Value | Parameter | Value |
| 40 μm | 15 μm | ||
| 65 μm | 7.5 μm | ||
| 83.5 μm | 3.5 μm | ||
| 3 μm | 4 μm |
The thermoelastic properties of the materials were previously described in [40]. A viscoelastic model of the protective coating materials taking into account the thermal expansion coefficient dependence on temperature is considered in the current work. The simulation was implemented in the ANSYS Mechanical APDL 2021R2 software suite (Livermore, CA, USA).
Heating and cooling of the optical fiber were performed according to the specified cycle (see Figure 5). The thermal cycle was implemented in the operating temperature range of the optical fiber and included the following zones: I – heating from +23 to +60 °C, II – exposure for 30 seconds at the maximum positive temperature +60 °C, III – cooling from +60 to −60 °C, IV – exposure for 30 seconds at the maximum negative temperature −60 °C, V – heating from −60 to +23 °C. Three thermal cycles with different heating and cooling rates were considered. The duration of each thermal cycle is presented in Table 2. The task was implemented to evaluate the operation of the viscoelastic behavior model of the protective coating materials.
Figure 5.
Temperature cycle. The values of the t1 … t5 parameters are presented in Table 2.
Figure 5.
Temperature cycle. The values of the t1 … t5 parameters are presented in Table 2.
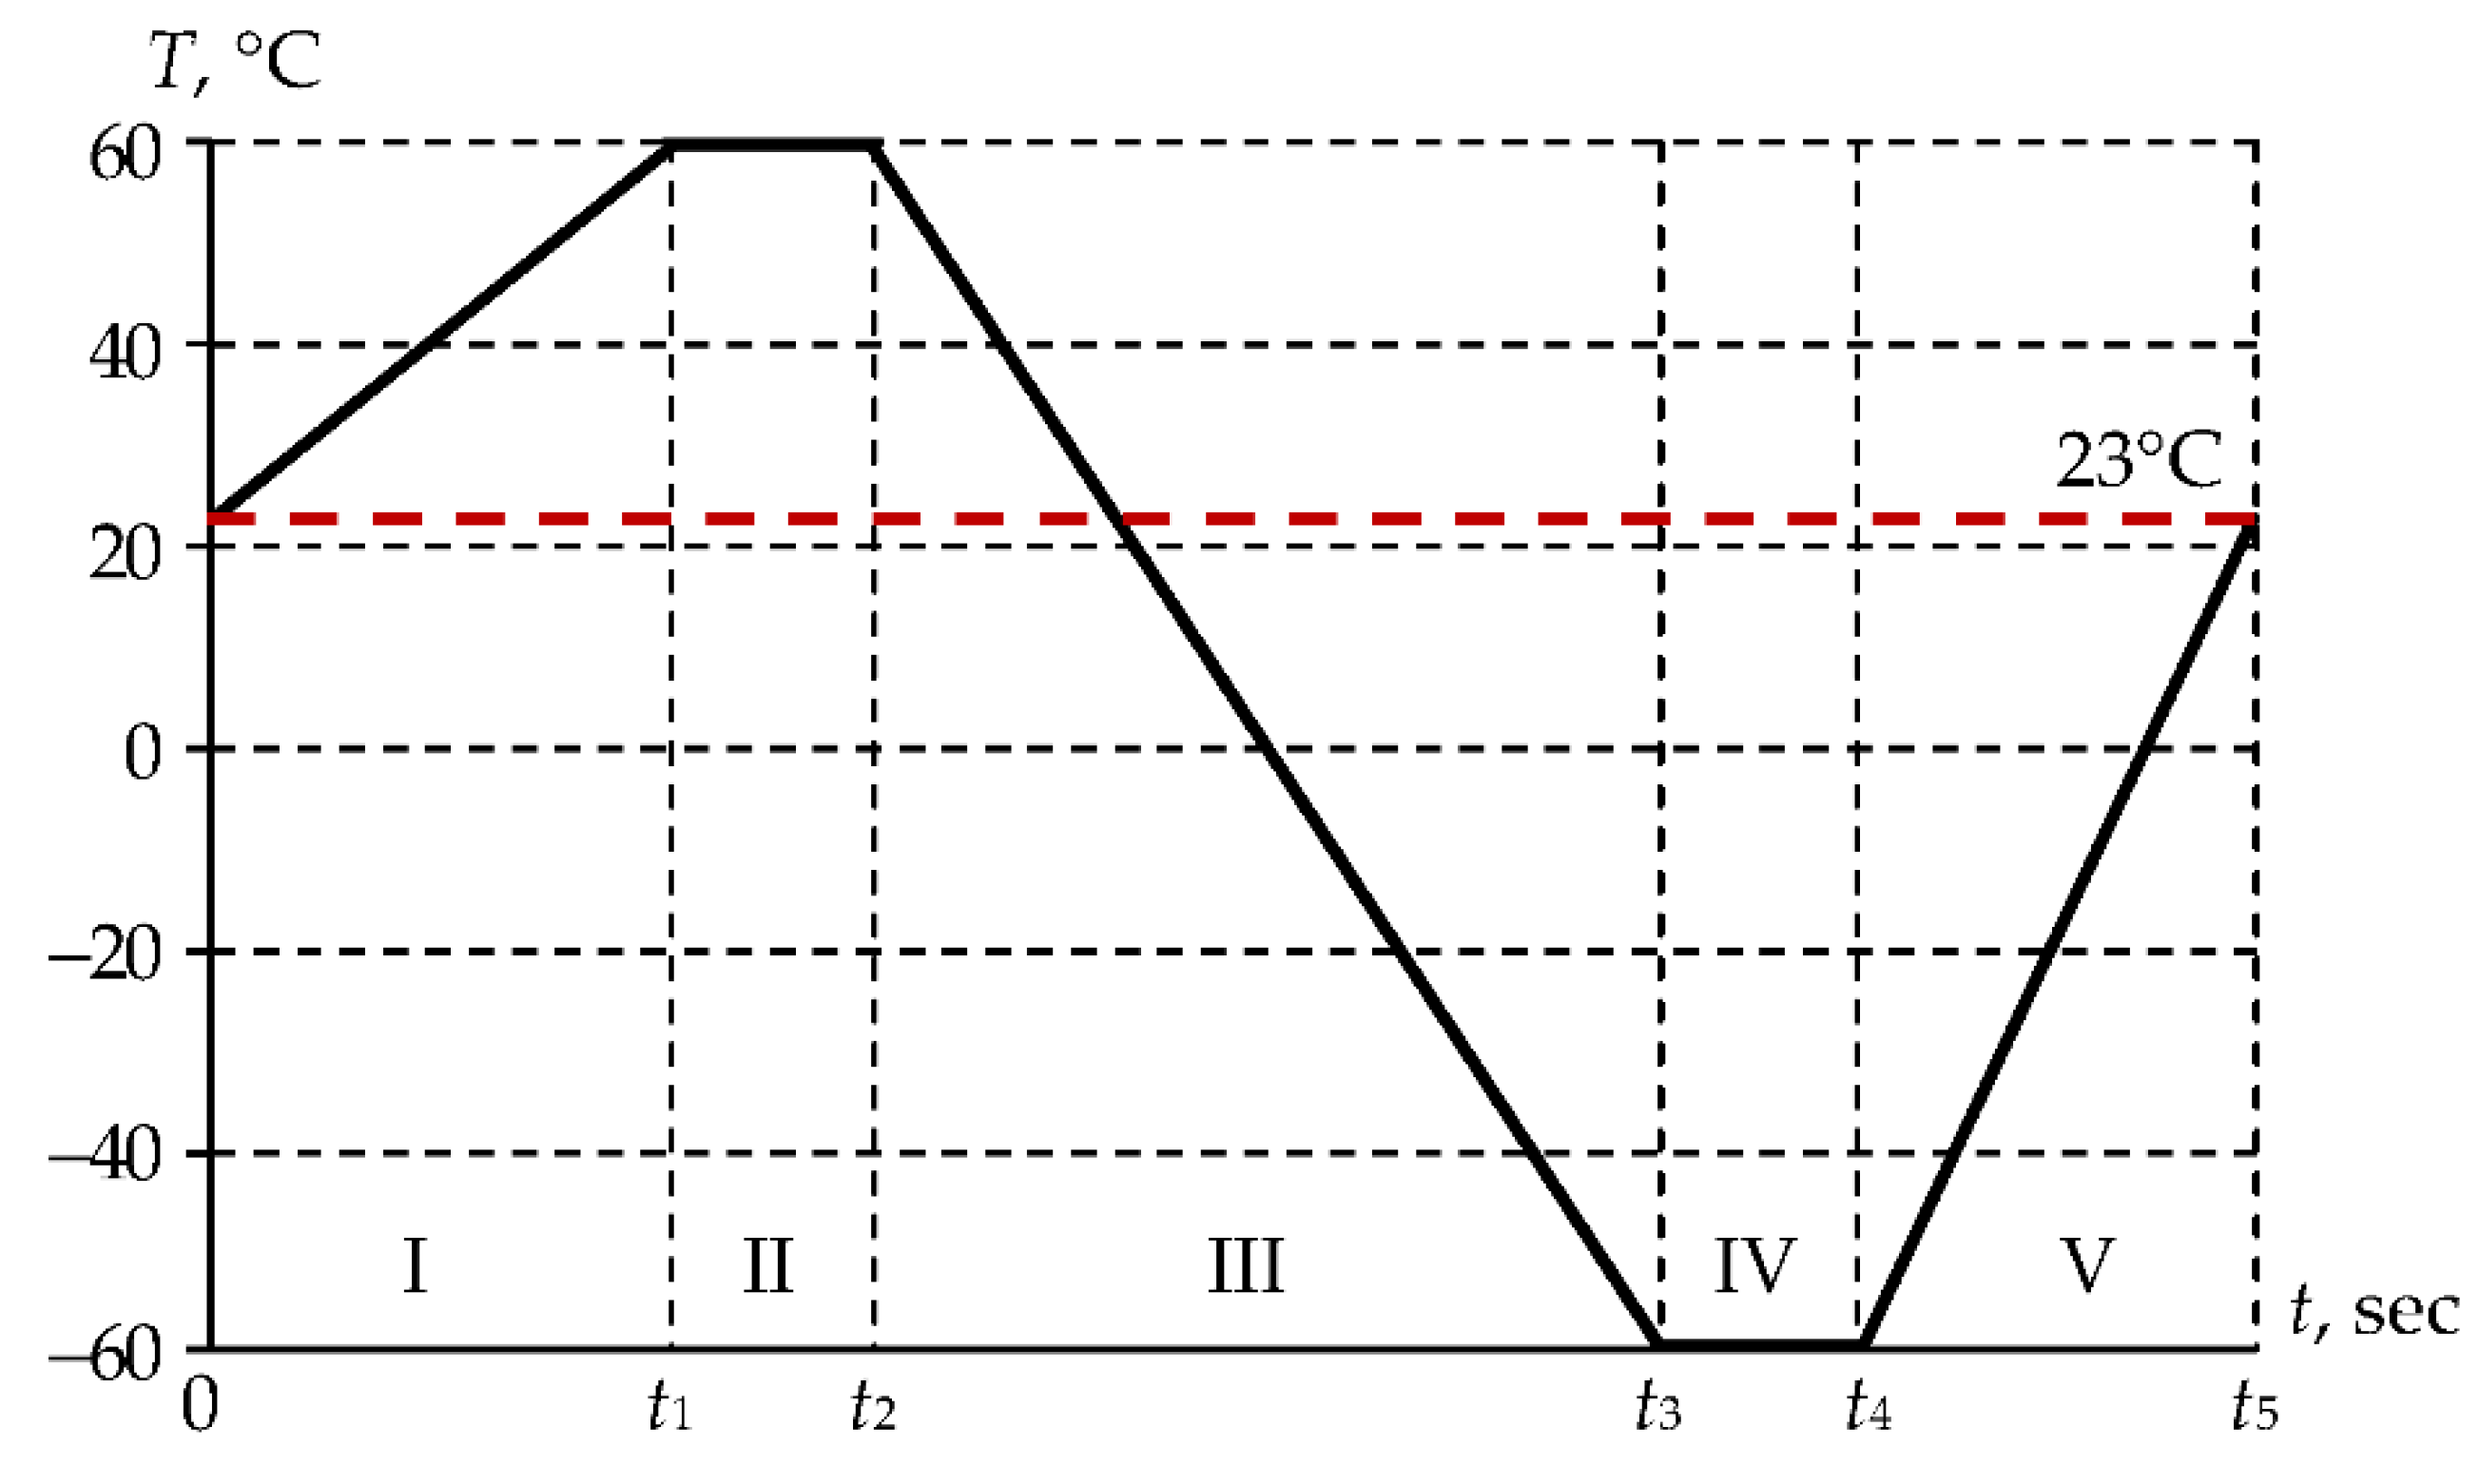
Table 2.
Parameters of temperature cycles.
| Temperature cycle | t1, sec | t2, sec | t3, sec | t4, sec | t5, sec |
| cycle 1 | 40 | 70 | 130 | 160 | 190 |
| cycle 2 | 70 | 100 | 220 | 250 | 310 |
| cycle 3 | 130 | 160 | 400 | 430 | 550 |
Ideal contact is realized at the interface of the optical fiber elements , , , , where 1, 2 are symbols of the interface bodies, , are normal and tangential displacements, , are normal and tangential stresses.
Free thermal heating/cooling of the optical fiber in a planar configuration is considered. The fiber symmetry conditions are taken into account in the model. The boundaries with discarded parts of the system are fixed to implement the flat cross-sections hypothesis: at ; at .
The convergence of the finite-element solution of the problem was formerly studied in the context of the problem of optical fiber contact with a polished metal surface [40]. The finite-element splitting of the free thermal heating/cooling model is performed similarly. The characteristic dimension of glassy elements is . The characteristic dimension of the polymer coating elements is .
3. Results and Discussion
3.1. Experimental Studies
3.1.1. Glass Transition Temperature
The glass transition/devitrification process takes place in a temperature range and is accompanied by a sharp change in a number of physical properties of the material: heat capacity, thermal conductivity, viscosity, compressibility, etc. The relaxation transition can be characterized by a change in the deformation pattern of a specimen. The term "glass transition temperature" is a considerably formal term. It was introduced for the convenience of comparing materials. Its value is not a material constant, like the phase transition temperature (melting point, crystallization temperature, etc.), and depends on the kinematic characteristics of the loading. As an example, the curves E', E'', and for the two temperature change rates (+2 °C/min and −2 °C/min) are shown in Figures 6, 7. The curves shift to the right along the temperature axis during heating, and to the left during cooling. The inflection point of the storage modulus curve E' in the relaxation transition region is considered to be the glass transition temperature in accordance with ISO 6721-11:2012 (“Plastics — Determination of dynamic mechanical properties — Part 11: Glass transition temperature”) [41,42]. Glass transition temperature is also determined by the peaks on the loss modulus curve E'' and the mechanical loss tangent [42,43]. The value at which the viscosity η = 1012.3 Pa⋅s is taken as the glass transition temperature (Tg) when measuring the rheological properties of the materials [44,45]. The temperature at which the relaxation time is 100 s is assumed as in dielectric spectroscopy [46]. As a rule, different glass transition temperature values correspond to different evaluation criteria. Using several evaluation criteria makes it possible to estimate the width of the temperature range in which the relaxation transition occurs. It is also useful for interpreting the processes taking place in the polymer.
Determination of the glass transition temperatures and the relaxation transition width of the protective coating materials was performed by measuring dynamic mechanical properties using the method of linear scanning in heating mode in accordance with the ISO 6721 series of standards.
The experimental results for DeSolite DS-2015 and DeSolite 3471-1-152A are presented in Figure 6 and Figure 7, respectively. Glass transition temperatures determined by some of the above-mentioned criteria, for both heating and cooling modes, are shown in the diagrams.
The range of change in the glass transition temperatures of the optical fiber protective coating materials, determined by different criteria, is fairly wide. This is associated with the influence of many factors on the behavior of polymer materials and different approaches to determining the glass transition temperature [47,48].
3.1.2. Viscoelastic Behavior of the Materials
The viscoelastic response of polymers to deformation depends on temperature and loading history [49,50]. Natural experiments providing various deformation modes are necessary for the identification of properties [50,51]. Kinematic action on the polymer in accordance with the specified program is one of the options for such tests. The loading mode, in which the deformation of the specimen was set, varying in time according to the harmonic law , where is an amplitude, is a circular frequency (, and is the linear frequency), was implemented on the DMA Q800 as part of the study. A series of experiments was carried out in the uniaxial tension mode of specimens with a frequency in the range of 1…25 Hz at different temperatures. The value was determined from a series of pilot experiments in order to estimate the limit of the tension deformations in the context of the linear viscoelasticity theory. The experiments were performed in accordance with the ISO 6721 series of standards. The specimens in the form of films and plates were subjected to stretching at a frequency of 1 Hz with increasing strain amplitude within the operating temperature range. The characteristic dependence of the storage modulus E’ vs. strain amplitude is shown in Figure 8. The results are given for DeSolite 3471-1-152A at a frequency of 1 Hz and a temperature of T=30 °C.
Analysis of the obtained dependencies demonstrated that the properties of the protective coating polymers were characterized by the linear viscoelasticity theory at tensile strains up to 2%.
The dependence of the storage modulus E’ vs. deformation can be described by a 6th-order polynomial. For deformations of 1 to 10%, the discrepancy between the parameter values for the three specimens considered is insignificant. Specimen number 2 withstood a significantly lower level of deformation. Specimen number 3 at the strain level of loss than 1% had significant differences from the other two considered specimens. The sensitivity of the material to deformation was previously identified in [52]. The material is sensitive to loading conditions.
Pilot experiments also demonstrated that increasing the load action frequency at a constant temperature resulted in an increase in the dynamic elastic modulus by approximately 1–2 orders of magnitude. A decrease in the temperature within the considered range resulted in a change in the modulus by about 3 orders of magnitude. The force generated by the device was insufficient in the subzero temperature range due to the rigidity of the DeSolite 3471-1-152A specimens in the form of plates. Quite the reverse, film specimens were too yieldable in high temperature regions and did not provide acceptable measurement accuracy over the entire frequency range being considered.
Therefore, specimens of different thicknesses and geometries were used to collect data on the properties of the materials. Specimens in the form of plates with characteristic dimensions of 14×6×2 mm were studied in the temperature range from -20 to +80 °C. Film-shaped specimens with characteristic dimensions of 10×6.25×0.1 mm were studied in the temperature range from –80 to –20 °C.
DeSolite DS-2015 proved to be more resistant to temperature changes. Specimens in the form of films with characteristic dimensions of 10×6.25×0.05 mm were used for studying DeSolite DS-2015 over the entire frequency and temperature ranges.
Discrete dependencies of the storage and loss moduli on temperature and frequency for DeSolite 3471-1-152A and DS-2015 were obtained as a result of a series of tests on DMA Q800 (see Figure 9).
The obtained data of the dependence of the storage modulus and loss modulus on the temperature and frequency of the kinematic action correspond qualitatively to the known data for other cross-linked polymers [53]. This is also consistent with the data presented in Figure 6 and Figure 7. It can be noted that studies of thermomechanical properties of polymers are often carried out in a wide temperature range. However, often these are only negative [54] or positive [55,56] temperature ranges at constant frequencies. The dependencies of the storage modulus and loss modulus are in good agreement with the main functions of the viscoelastic materials [53].
Figure 9.
Experimental data of the dependence of the storage modulus (a, c) and loss modulus (b, d) on frequency and temperature: a, b are for DeSolite 3471-1-152A; c, d are for DeSolite DS-2015.
Figure 9.
Experimental data of the dependence of the storage modulus (a, c) and loss modulus (b, d) on frequency and temperature: a, b are for DeSolite 3471-1-152A; c, d are for DeSolite DS-2015.
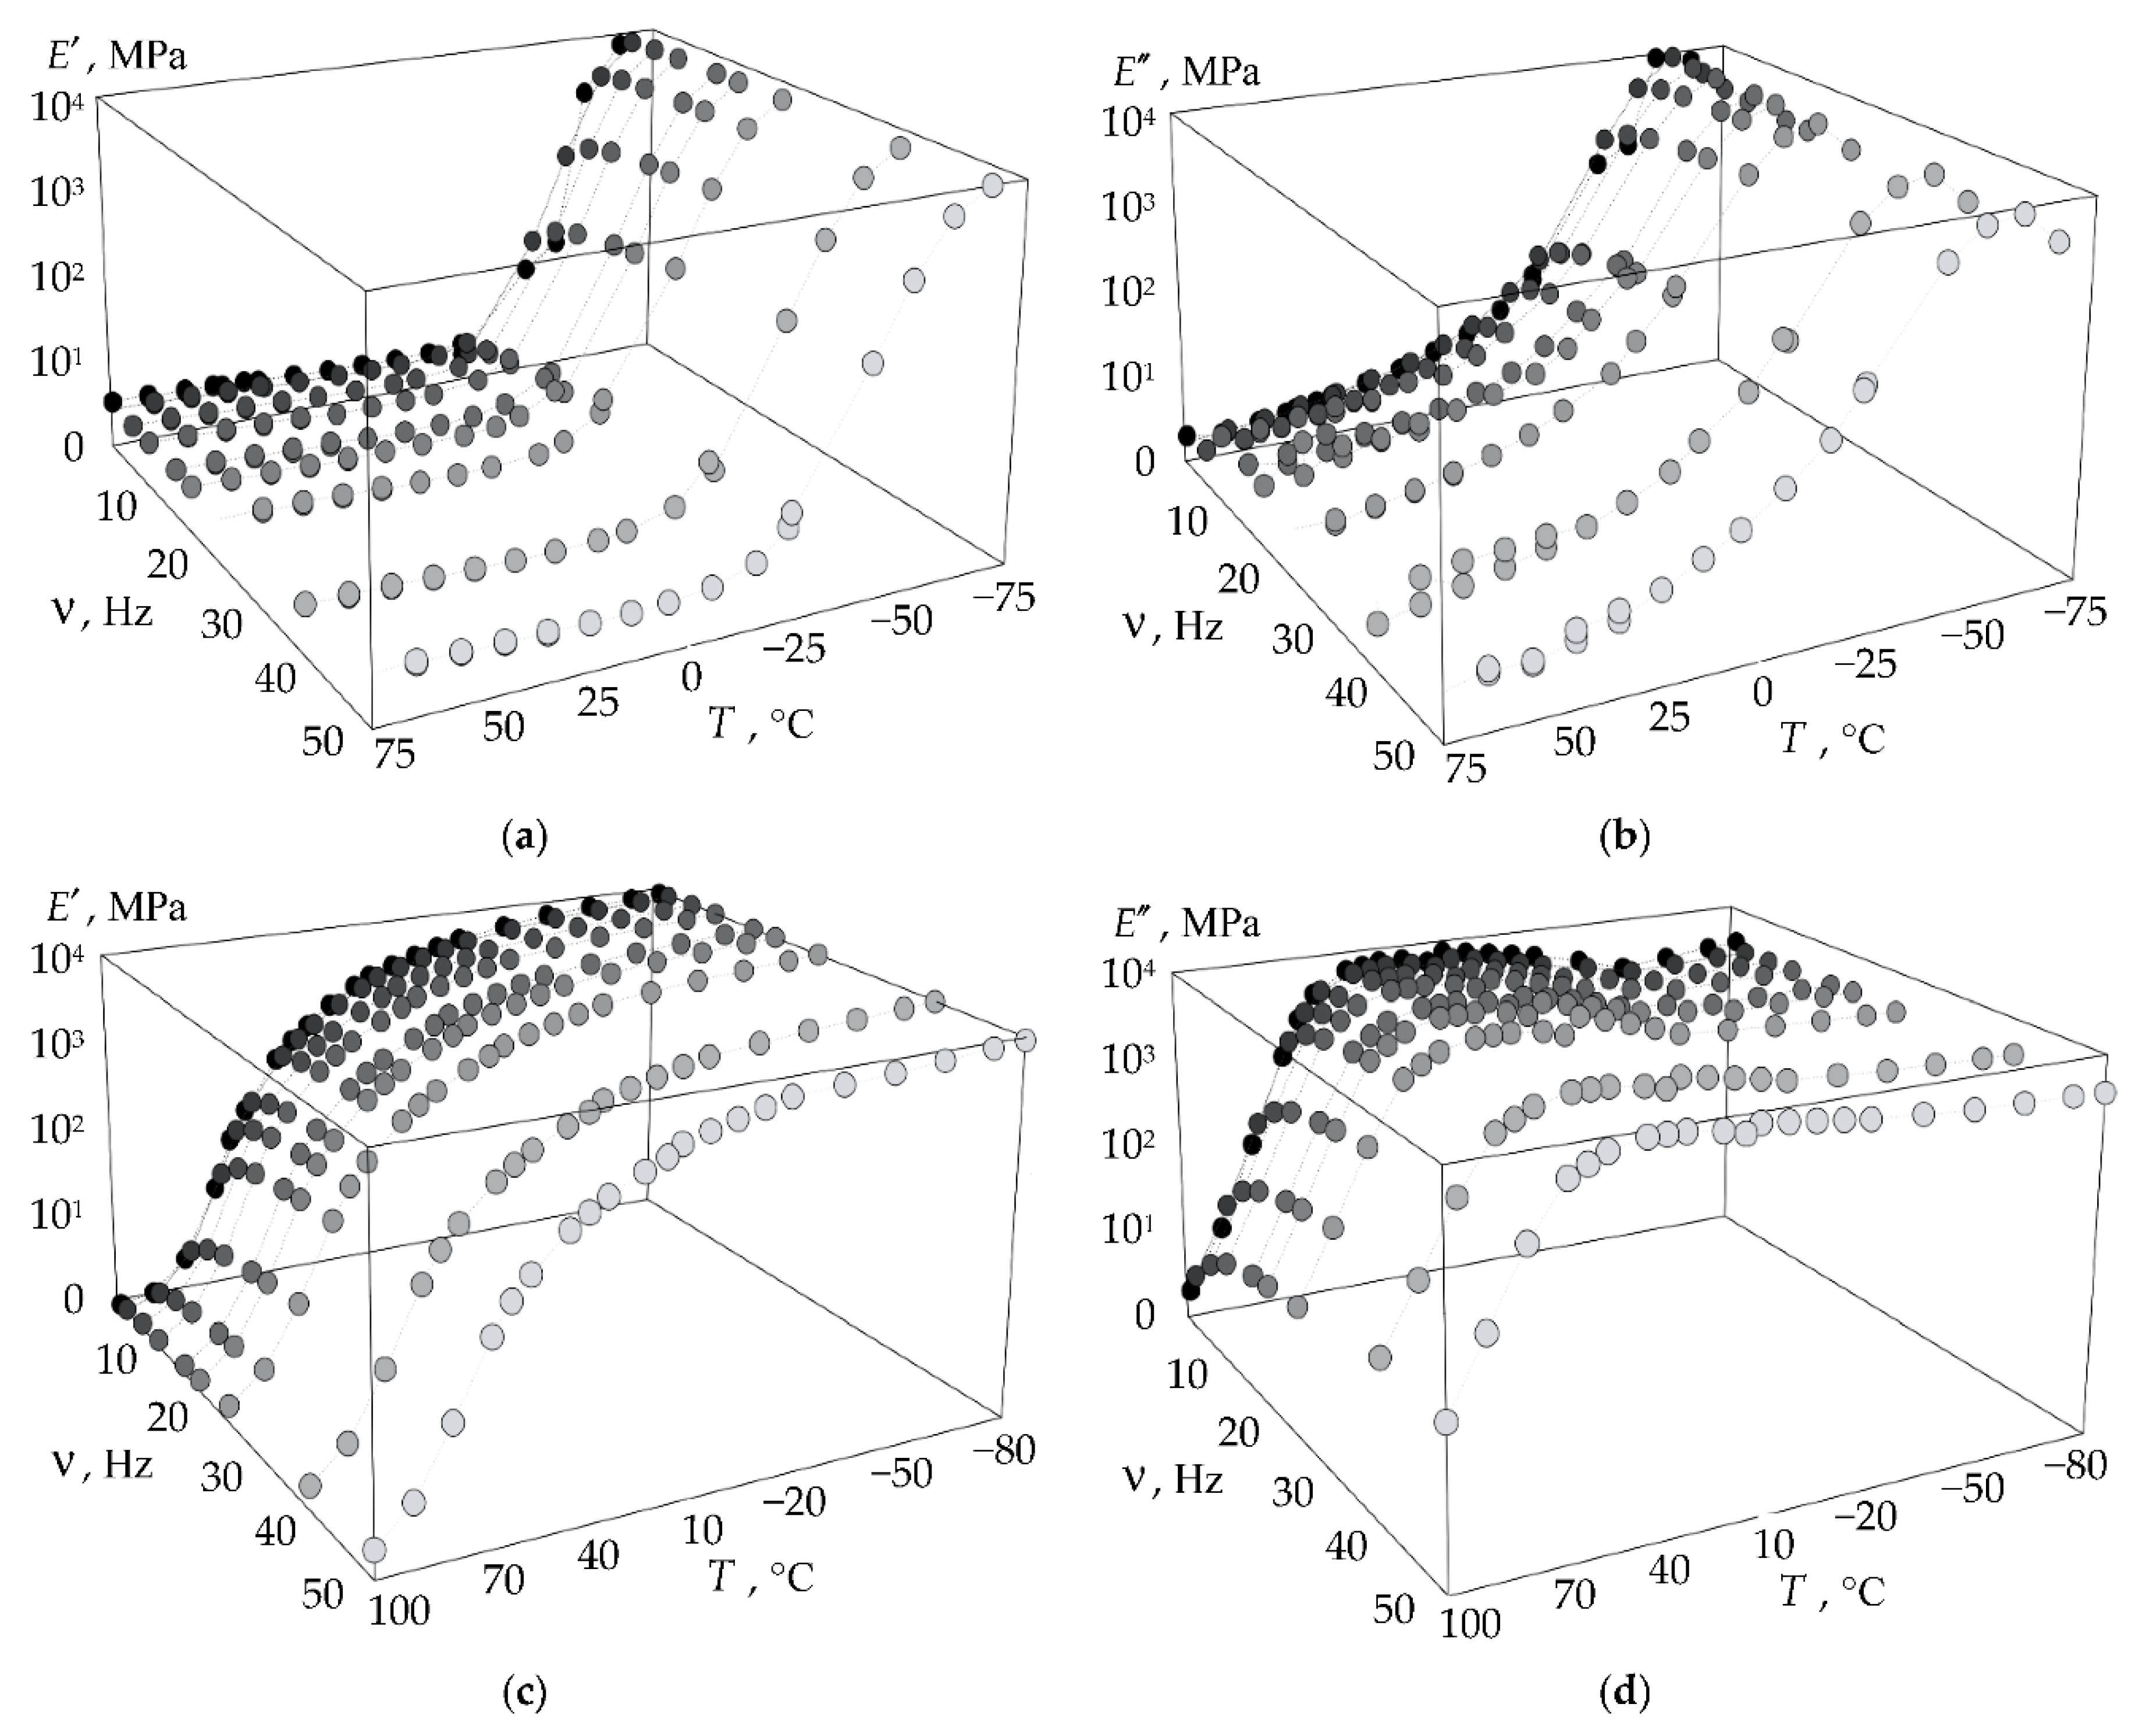
It should be noted that the maximum values of the loss modulus of DeSolite 3471-1-152A are in the negative temperature region. The glass transition of the material occurs at temperatures close to −60 °C, at which point the material loses its mobility, and its structure loses its ability to undergo large deformations. This can negatively affect the behavior of the optical fiber and signal transmission quality, since in such a state, the protective coating no longer protects the optical fiber from power actions. A similar maximum of DeSolite DS-2015 is in the positive temperature range of +20 to +60 °C, and with an increase in the frequency of exposure, it shifts to the left. These results allow us, for example, to assume that if such fibers are used as acoustic sensors, in the regions of maximum loss modulus, their sensitivity will decrease, which is due to the more efficient dissipation of oscillation energy in polymers due to dissipative effects.
The dependence of the storage modulus and loss modulus on deformation frequency is nonlinear for protective coating materials. This is due to the rheology of the polymer and the structural state changes of the material. The storage and loss moduli reach a plateau with increasing frequency, which is typical for many viscoelastic materials [57,58].
The experimental data allowed us to determine the range of linear viscoelasticity (deformations up to 2%), as well as to obtain information on the rheological characteristics and relaxation times spectrum. Based on the experimental studies, numerical analogues of the materials were formulated in the framework of relations of the generalized Maxwell model. Nonlinear behavior models of the optical fiber protective coating materials are necessary to minimize the deviation of numerical simulation of the systems, in which they are used, from real objects [59].
3.1.3. Thermal Expansion of the Materials
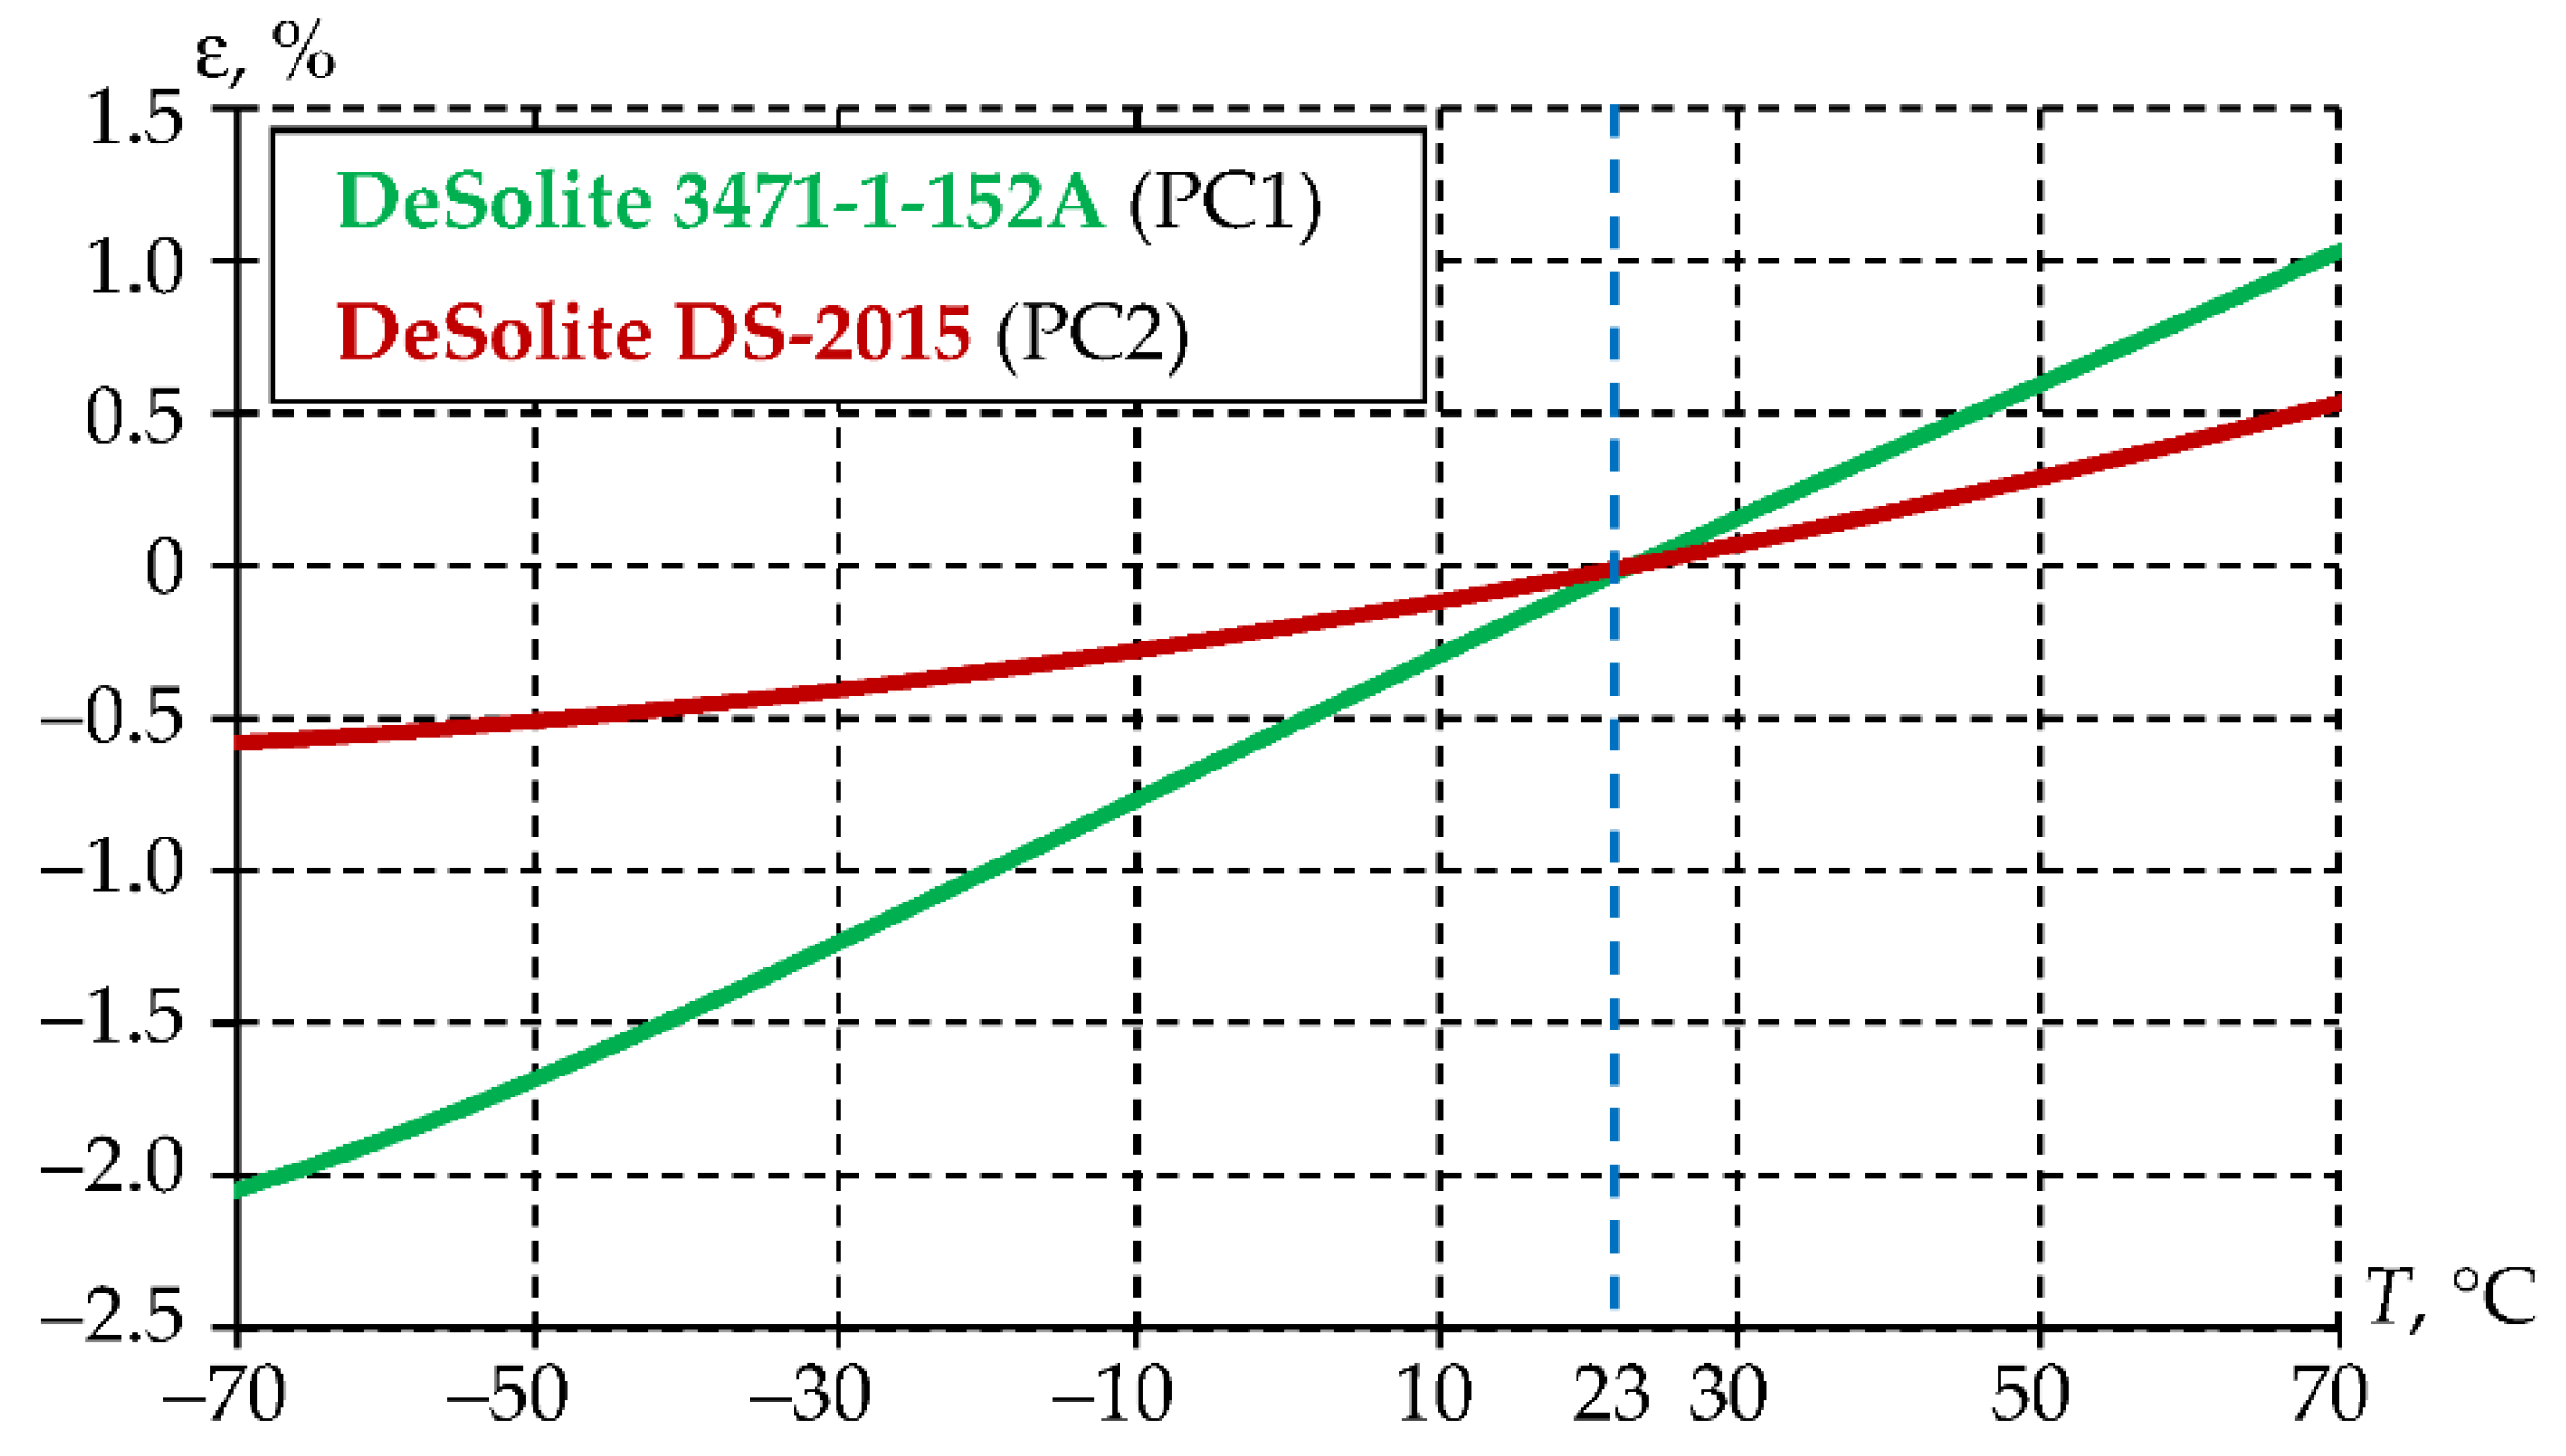
The thermal expansion coefficient (TEC) is considered a basic thermophysical characteristic reflecting the performance of the protective coating materials. The experiment was performed on film specimens at a constant tension force in the range from 0.001 to 0.005 N. This allowed us to maintain the straight geometry of the specimens, while introducing less than 5% error into the experimental data. The experimental studies and their verification are described in more detail in [60]. Deformation vs. temperature dependencies for protective coating materials were obtained after processing the experimental data (see Figure 10).
Figure 10.
Dependence of the thermal deformation of the materials on temperature: dotted line is experimental data, solid line is polynomial approximation.
Figure 10.
Dependence of the thermal deformation of the materials on temperature: dotted line is experimental data, solid line is polynomial approximation.
The approximating dependencies of thermal deformation on T are presented in the form of polynomials (1) for DeSolite 3471-1-152A and (2) for DeSolite DS-2015.
(1)
(2)
The dependence of TEC on temperature can be obtained by differentiating these dependencies.
3.2. Numerical Analogue of Polymer Protective Coating Materials
3.2.1. Prony Series
For the mathematical description of the thermomechanical behavior of polymer products, taking into account the temperature change in a specified range and a strain history, the generalized Maxwell model was chosen [61]. The model uses an approximation of the relaxation function by an exponential Prony series [62,63,64]. The model is convenient for implementation since it is commonly used in finite element analysis software packages [65].
Defining relations for the generalized Maxwell model in integral form, assuming that bulk relaxation in the considered materials is negligible, will be of the following form [64]:
, (3)
wherein – stress tensor; and − current and past time; – strain deviator; – second-rank unit tensor; − bulk deformation; – the shear relaxation function of the material, the approximation of which we express as a sum of exponentials:
, (4)
, (5)
wherein – the number of Prony series term; – the required approximation constants; – relaxation time; – instantaneous shear modulus.
The long-term shear modulus and the corresponding coefficient _will be obtained from the relation (5) at :
, (6)
(7)
Elastic (storage) and loss moduli in the context of the chosen model are of the following form:
, (8)
(9)
To describe the temperature effect on the viscoelastic behavior of the materials, the Williams-Landel-Ferry equation [66] is used, with the help of which we introduce relaxation time vs. temperature dependence into relations (8), (9):
, (10)
(11)
wherein , – material constants; – reference temperature.
Multicriteria optimization problems satisfying the condition of minimum discrepancy between experimental and calculated data were solved to find constants , , by the Nelder-Mead method [67]. Thus, approximations of the discrete dependences were obtained.
The optimal solution for DeSolite 3471-1-152A material was found for (18 Prony series terms) at the selected reference temperature °C. , , are presented in Table 3.
Table 3.
Material constants of the generalized Maxwell model for DeSolite 3471-1-152A.
| 1 | 3.14×10⁻³ | 1.29×10⁻⁴ | 7 | 2.80×10⁻¹ | 5.99×10² | 13 | 4.43×10⁻⁴ | 2.78×10⁹ |
| 2 | 2.83×10⁻² | 1.67×10⁻³ | 8 | 3.23×10⁻² | 7.74×10³ | 14 | 1.06×10⁻³ | 3.59×10¹⁰ |
| 3 | 1.57×10⁻¹ | 2.15×10⁻² | 9 | 3.24×10⁻¹ | 1.00×10⁵ | 15 | 2.07×10⁻⁴ | 4.64×10¹¹ |
| 4 | 6.38×10⁻⁴ | 2.78×10⁻¹ | 10 | 2.81×10⁻² | 1.29×10⁶ | 16 | 8.22×10⁻⁵ | 5.99×10¹² |
| 5 | 3.03×10⁻² | 3.59E×100 | 11 | 6.21×10⁻³ | 1.67E×107 | 17 | 3.84×10⁻⁵ | 7.74×10¹³ |
| 6 | 6.28×10⁻² | 4.64×101 | 12 | 4.36×10⁻² | 2.15E×108 | 18 | 2.30×10⁻⁵ | 1.00×10¹⁵ |
The optimal solution for the DeSolite 3471-1-DS-2015 material was found for i=60 (60 Prony series terms) at the selected reference temperature Tr = 0 °C. , , are presented in Table 4.
A master curve can be plotted based on the Williams-Landel-Ferry (WLF) temperature-time analogy principle using the obtained dependencies of E' and E'' on frequency [66,68]. The master curve describes the behavior of the material over a wide frequency (time) range. According to the WLF principle, there is a relationship between the frequency (time) and temperature dependence of the viscoelastic properties of the material. The procedure for processing the mechanical test results is illustrated in Figure 11. The result of processing the experimental data taking into account the previously defined constants is shown in Figure 12.
The nonlinear dependence of the storage modulus and loss modulus on the oscillation frequency during DMA with reaching a plateau is a characteristic feature of the cross-linked polymer rheology in the linear viscoelasticity region [58].
The relaxation transition on frequency dependency for DeSolite DS-2015 material is illustrated in Figure 13. It can be seen that with increasing frequency, the relaxation transition shifts to the right along the temperature scale.
The storage modulus of DeSolite DS-2015 at temperatures ≥ +85 °C decreases by 3 orders of magnitude, approaching 2 MPa for all the considered oscillation frequencies of the specimens. The oscillation frequency has a greater influence on the storage modulus at high temperatures; so at sub-zero temperatures, an increase in the oscillation frequency by 50 times leads to an increase in the storage modulus by no more than 5%. The oscillation frequency has the maximum effect on the storage modulus at temperatures above +60 °C; at temperatures from 80 to 90 °C, the storage modulus increases almost threefold with an increase in the oscillation frequency from 1 to 50 Hz.
3.2.2. Dependence of Thermal Deformation on Temperature
A user-defined program module has been developed that allows setting the dependence of coating material thermal deformation on temperature. The program makes it possible to recalculate an intercept depending on the choice of the initial stress-free state of the structure using formulas (1) and (2).
The dependencies of thermal deformation on temperature for polymer protective coating materials integrated into viscoelastic model of the material are shown in Figure 14. The structure in the stress-free state is at 23 °C. For this purpose, intercept values in formulas (1) and (2) are taken as –0.5307 and –0.203, correspondingly.
Figure 14.
Dependence of thermal deformations on temperature (according to the numerical simulation data of the materials).
Figure 14.
Dependence of thermal deformations on temperature (according to the numerical simulation data of the materials).
3.2.3. Verification of the Numerical Analogue of Material Behavior
A series of natural creep experiments at a constant load and different temperature values were carried out to verify the obtained defining relations (see Figure 15). The data obtained were compared to the numerical calculation results; the comparison demonstrated a fairly good agreement. The results are presented for the external protective coating material DeSolite DS-2015. The range of negative operating temperatures was considered.
Figure 15.
Deformation vs. time dependencies for DeSolite DS-2015 obtained during empirical and numerical studies.
Figure 15.
Deformation vs. time dependencies for DeSolite DS-2015 obtained during empirical and numerical studies.
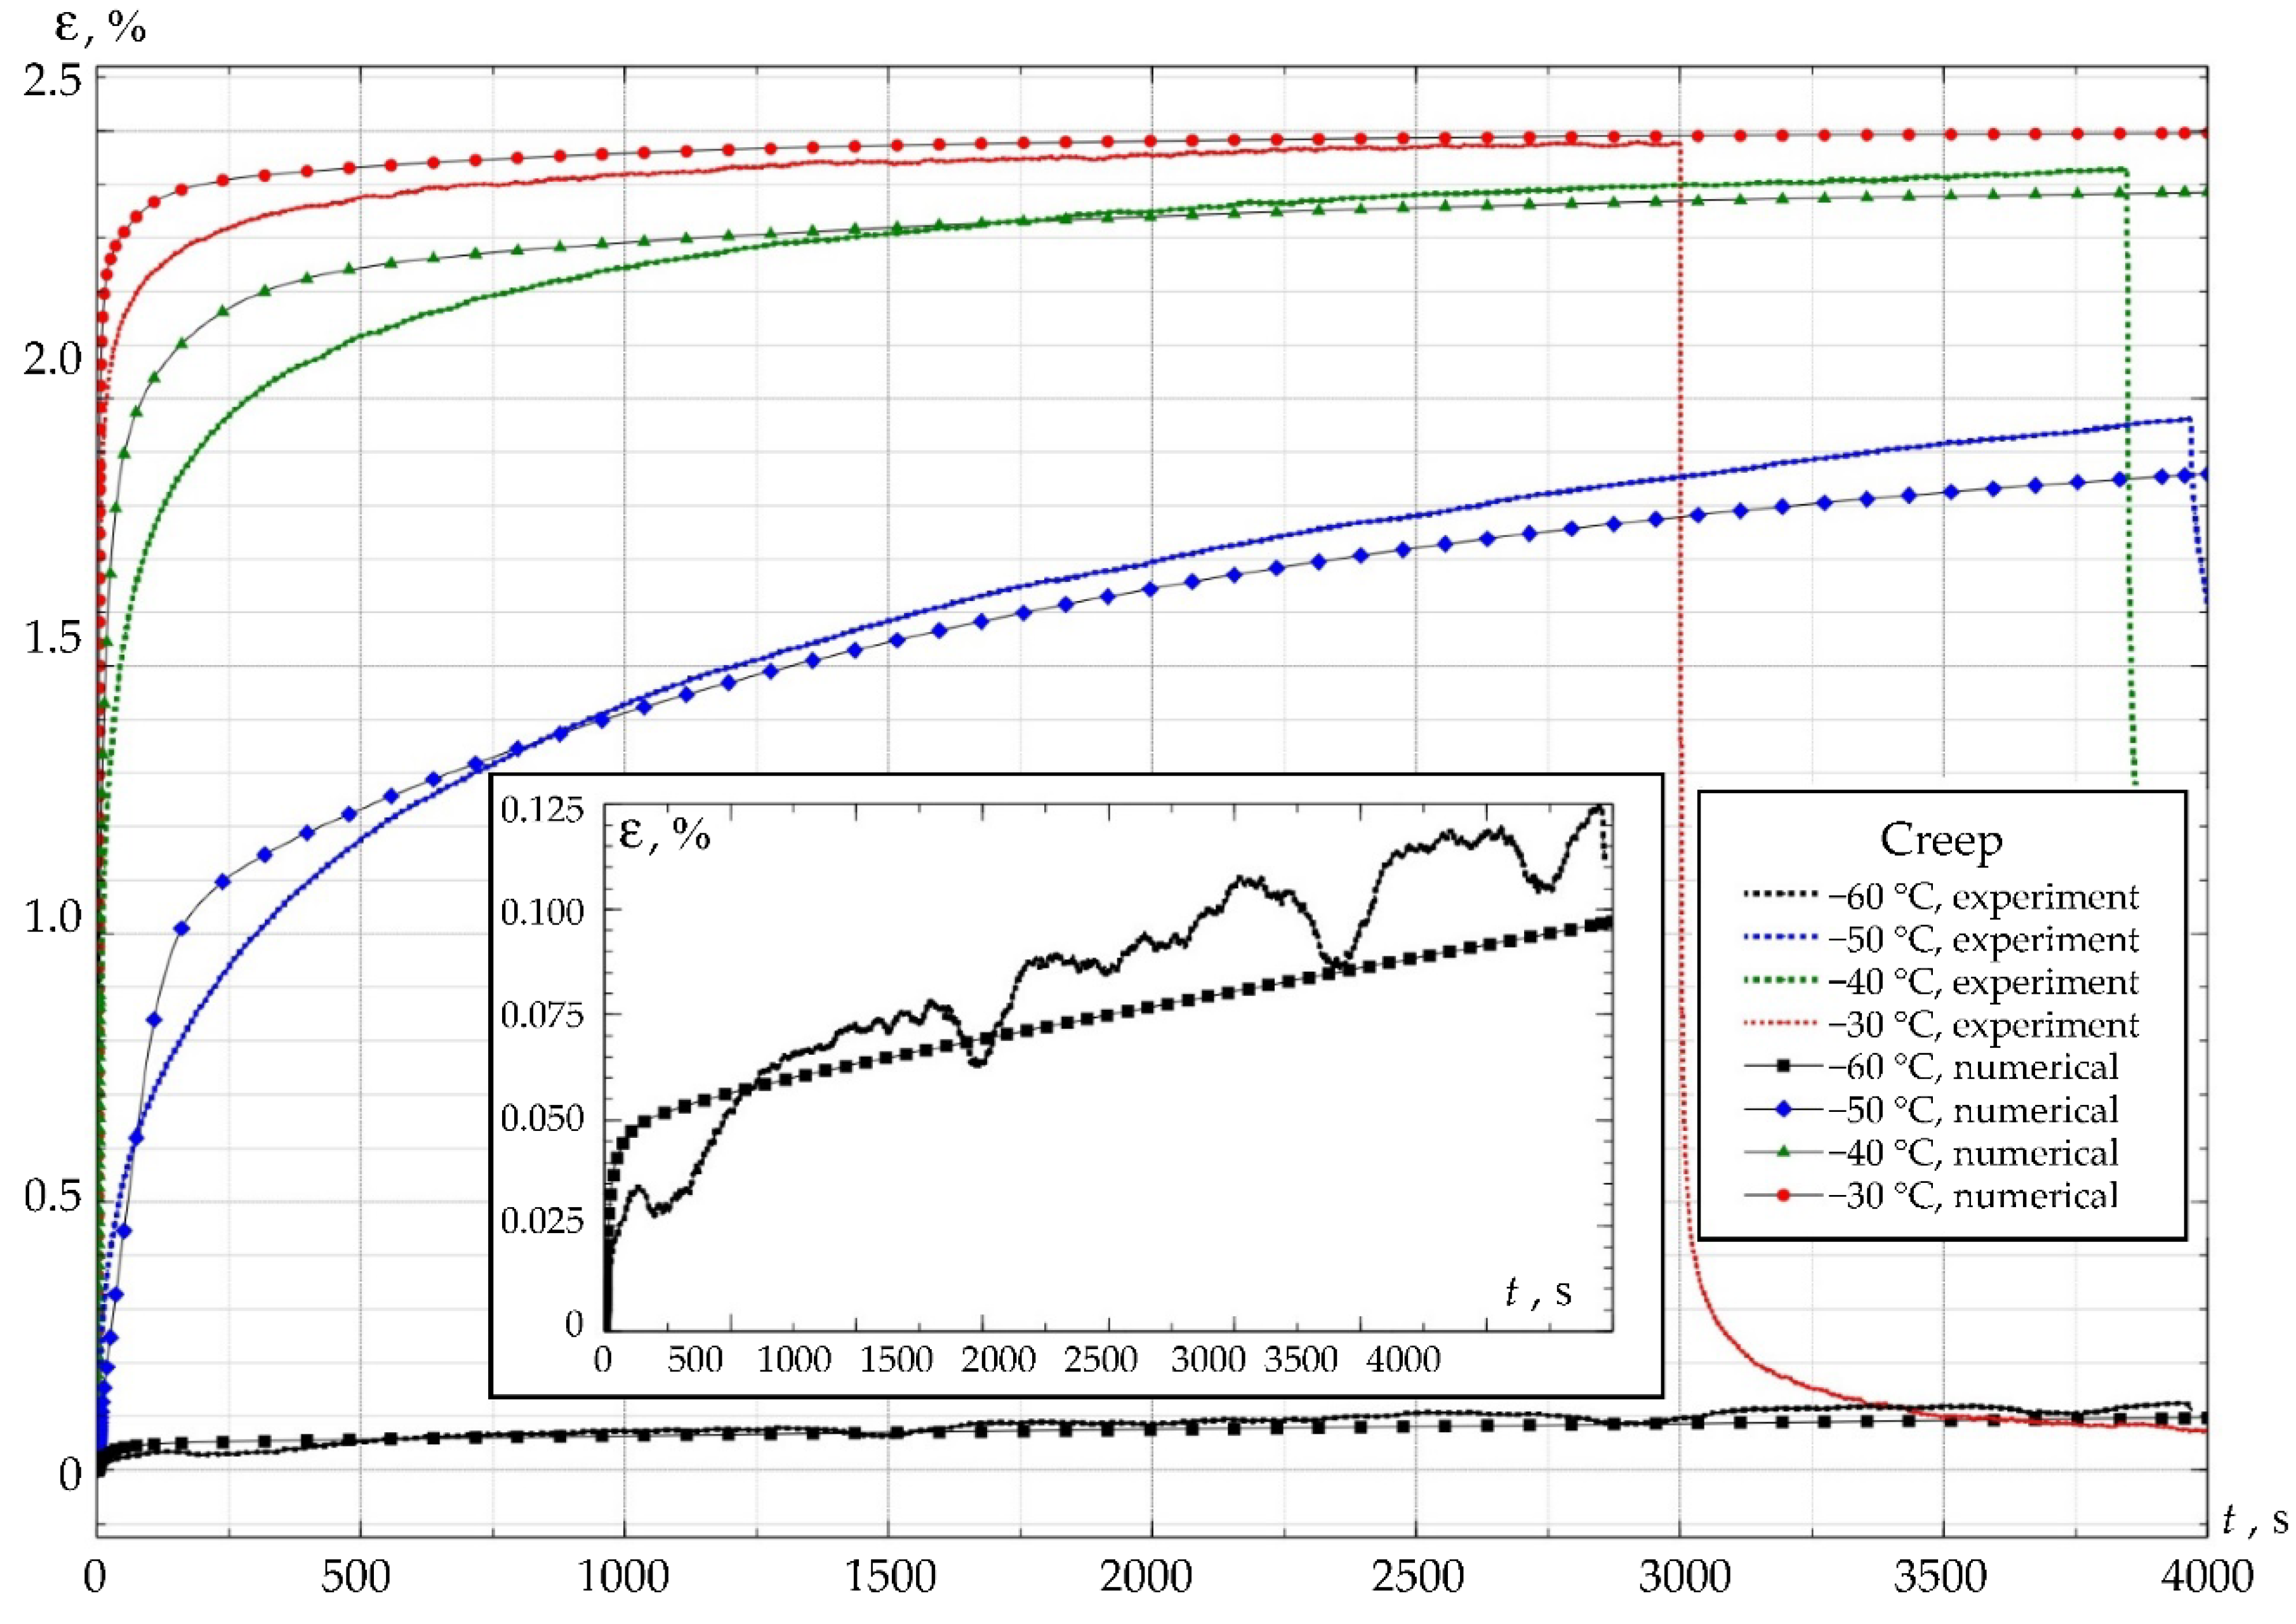
Temperature has a significant effect on the deformation level in the specimens; at a temperature of −60 °C, the deformation level does not exceed 0.1%; at −30 °C, it is 2.4 %. The creep curve reaches an asymptote at a temperature of −30 °C, i.e. at times of more than 2000 s, all relaxation processes are completed. This effect is not observed at temperatures below −30 °C. The slowdown of relaxation processes with an increase in negative ambient temperatures is associated with glass transition processes. The dependencies of creep deformation on time, as well as the characteristic phenomena, are consistent with studies of polymer materials of various types [69,70,71].
3.3. Numerical Model of Thermomechanics of Panda-Type Optical Fiber Protective Coatings
As part of the current work, the application of the developed viscoelastic models of the protective coating materials was considered. The thermal expansion coefficient of the protective coatings was considered in two ways: as a constant coefficient K-1 and K-1 for PC1 and PC2, respectively [40], and as a temperature-dependent coefficient, characterized by the plot in Figure 14.
The dependencies of the stress-strain state on time and temperature were obtained for each thermal cycle shown in Table 2. The dependencies of the stress intensity maximum value in the external polymer coating (PC2) on time and temperature are presented in Figure 16. The faster the heating/cooling processes occur, the higher the stress level in the material (see Figure 16a). The maximum stress level is achieved at subzero temperatures in zone III. The decrease in the maximum stress level from cycle 1 to cycle 3 does not exceed 2.25%. Visible differences in the material behavior with constant and variable TEC are observed only in zone III: by 3.77, 4.02, and 4.27% for cycles 1, 2, and 3, respectively. Stress relaxation in PC2 at −60 °C practically does not occur; the level comprises no more than 0.43%.
Figure 16b shows the dependence of stresses on temperature in the range not lower than +23 °C (zones I, II, the starting area of zone III). The stress level here does not exceed 5 MPa. When heated (in zone I), the stress intensity increases up to a temperature of about +45 °C. When cooled (in zone III), the stress intensity increase begins at a temperature of approximately +50 °C.
The dependencies of the stress intensity maximum value in the inner polymer coating (PC1) on time and temperature are presented in Figure 17.
The faster the heating/cooling processes occur, the higher the stress level in the material (see Figure 17a). Taking into account the TEC practically does not affect the stress-strain state behavior. The maximum stress level is achieved at a temperature of –60 °C, but only in the starting area of zone III, similar to PC2. Significant stress relaxation occurs during exposure at −60 °C. Table 5 shows the values of stress level reduction in zone III. The lower the heating/cooling rate, the smaller the stress reduction value during exposure at −60 °C.
The heating and cooling zones in the °C temperature range are shown in Figure 17b. Heating and cooling proceed differently. It is obvious that the optical properties of the system in certain cases will depend not just on the current temperature, but on the temperature change history.
4. Conclusions
In the present work, the viscoelastic properties of the polymer materials used as protective coatings for Panda-type optical fiber operating in the temperature range from–60 °C to +60 °C were studied.
Specimens in two options were manufactured for the experimental study: films with a thickness of up to 250 µm and plates with characteristic dimensions of 2×6×20 mm. Two different types of specimens were used because of the sensitivity of materials to the loading conditions, especially in temperature zones close to the structural and relaxation transitions of polymers. The experiments were performed for an extended temperature range from –110 to +120°C, including relaxation transitions, to correctly describe the behavior of the materials.
The glass transition temperatures and the relaxation transition width of the protective coating materials were determined by measuring dynamic mechanical properties using the method of linear scanning in heating mode in accordance with the ISO 6721 series of standards.
Glass transition of DeSolite 3471-1-152A material occurs at temperatures close to −60 °C, at which point the material loses its mobility, and its structure loses its ability to undergo large deformations. Devitrification of the DeSolite DS-2015 material occurs in the positive temperature range of +20 to +60 °C, and with an increase in the frequency of exposure, it shifts to the left.
A series of experiments in the uniaxial tension mode of specimens with a frequency in the range of 1…50 Hz at different temperatures was carried out to determine the viscoelastic properties of the polymers. Discrete dependencies of the storage and loss moduli on temperature and frequency were obtained. The analysis of the obtained dependencies demonstrated that the properties of the protective coating polymers were characterized by the linear viscoelasticity theory at tensile strains of up to 2%. The validity of the obtained results was confirmed by creep experiments.
Defining relations for the considered polymers were formulated using the Maxwell model through multicriteria optimization by the Nelder-Mead method. The optimal solution was found for 18 series terms at the selected reference temperature °C, , , for the DeSolite 3471-1-152A material. The optimal solution was found for 60 series terms at the selected reference temperature °C, , for the DeSolite DS-2015 material.
The application of the obtained polymer behavior models was studied in the framework of free thermal heating/cooling of Panda-type optical fiber in the operating temperature range, taking into account the constant and temperature-variable TEC. Three thermal cycles with different heating/cooling rates were considered. The highest stress level in both polymers was observed at –60 °C. The stress level depends on the temperature change rate: the faster the heating/cooling processes occur, the higher the stress level is.
Author Contributions
Conceptualization, A.N.T.; methodology, A.N.T., A.A.K., and Yu.I.L.; experiments, A.N.T. and Yu.I.L.; software, A.N.T., A.A.K., and Yu.I.L.; validation, A.N.T., A.A.K., and Yu.I.L.; writing—original draft preparation, A.N.T., A.A.K., and Yu.I.L.; writing—review and editing, A.N.T., A.A.K., and Yu.I.L.; visualization, A.N.T., A.A.K., and Yu.I.L.; funding acquisition, A.A.K. All authors have read and agreed to the published version of the manuscript.
Funding
This research was funded by Ministry of science and higher education of the Russian Federation (Project № FSNM- 2023-0007).
Institutional Review Board Statement
Not applicable.
Informed Consent Statement
Not applicable.
Data Availability Statement
The original contributions presented in this study are included in the article. Further inquiries can be directed to the corresponding author.
Conflicts of Interest
The authors declare no conflict of interest.
References
- Xue, P.; Liu, Q.; Lu, Sh.; Xia, Y.; Wu, Q.; Fu, Y. A review of microstructured optical fibers for sensing applications. Optical Fiber Technology 2023, 77, 103277. [Google Scholar] [CrossRef]
- Liu, Z.; Zhang, Z.; Tam, H.-Y.; Tao, X. Multifunctional Smart Optical Fibers: Materials, Fabrication, and Sensing Applications. Photonics 2019, 6(2), 48. [CrossRef]
- Balageas, D.; Fritzen, C.; Güemes, A. Structural Health Monitoring. Wiley: Hoboken, USA, 2006.
- Koyamada, Y.; Imahama, M.; Kubota, K.; Hogari, K. Fiber-optic distributed strain and temperature sensing with very high measurand resolution over long range using coherent OTDR. Journal of Lightwave Technology 2009, 27(9), 1142–1146. [CrossRef]
- Koyamada, Y. Novel Fiber-Optic Distributed Strain and Temperature Sensor with Very High Resolution. IEICE Transactions on Communications 2006, 89-B(5), 1722–1725. [CrossRef]
- Murayama, H.; Wada, D.; Igawa, H. Structural health monitoring by using fiber-optic distributed strain sensors with high spatial resolution. Photonic Sensors 2013, 3(4), 355–376. [CrossRef]
- Yin, S.; Ruffin, P.; Yu, F.T. Fiber Optic Sensors, Second Edition. CRC Press: Boca Raton, USA, 2017. [CrossRef]
- Sun, L.; Li, Y.; Meng, J.; Chen, X.; Li, Q.; Liu, Z.; Wang, S.; Wang, J. High sensitivity measurement of seawater velocity based on panda fiber coupled aluminum-cantilever. Optik 2024, 313, 171983. [Google Scholar] [CrossRef]
- Gao, L.; Jiang, C.; Hu, C.; Guo, Z.; Han, B.; Guo, X.; Sun, S. Ultra-sensitive strain sensor based on Sagnac interferometer with different length panda fiber. Infrared Physics & Technology 2024, 141, 105445. [Google Scholar] [CrossRef]
- Cai, M.; Chen, H.; Shi, R.; Li, H.; Zhang, S.; Jia, S.; Hu, J.; Li, S. Cryogenic temperature sensor based on fiber optic Sagnac interferometer with a panda polarization-maintaining fiber. Optics & Laser Technology 2025, 180, 111477. [Google Scholar] [CrossRef]
- Lesnikova, Y.I.; Trufanov, A.N.; Kamenskikh, A.A. Analysis of the Polymer Two-Layer Protective Coating Impact on Panda-Type Optical Fiber under Bending. Polymers 2022, 14, 3840. [Google Scholar] [CrossRef]
- Mendez, A.; Morse, T.F. Specialty Optical Fibers Handbook; Elsevier Inc.: Butlington, USA, 2007. [Google Scholar] [CrossRef]
- Azanova, I.S.; Shevtsov, D.I.; Vokhmyanina, O.L.; Saranova, I.D.; Smirnova, A.N.; Bulatov, M.I.; Pospelova, E.A.; Sharonova, Yu.O.; Dimakova, T.V.; Kashaykin, P.F.; Tomashuk, A.L.; Kosolapov, A.F.; Semenov, S.L. Experience of the Development of Heat-resistant, Radiation-resistant and Hydro-resistant Optical Fibre. Photonics 2019, 13(5), 444–450. [Google Scholar] [CrossRef]
- Bernard, R.; Pastre, A.; Griboval, A.; Andrieux, V.; Técher, K.; Laffont, G.; Lago-Rached, L. High-temperature resistant boron nitride-based coatings for specialty silica optical fibers. Optics & Laser Technology 2025, 181, 111855. [Google Scholar] [CrossRef]
- Schuster, K.; Unger, S.; Aichele, C.; Lindner, F.; Grimm, S.; Litzkendorf, D.; Kobelke, J.; Bierlich, J.; Wondraczek, K.; Bartelt, H. Material and technology trends in fiber optics. Advanced Optical Technologies 2014, 3, 447–468. [Google Scholar] [CrossRef]
- Kasik, I.; Barton, I.; Kamradek, M.; Podrazky, O.; Aubrecht, J.; Varak, P.; Peterka, P.; Honzatko, P.; Pysz, D.; Franczyk, M.; Buczynski, R. Doped and structured silica optical fibres for fibre laser sources. Optics Communications 2025, 577, 131437. [Google Scholar] [CrossRef]
- Janani, R.; Majumder, D.; Scrimshire, A.; Stone, A.; Wakelin, E.; Jones, A.H.; Wheeler, N.V.; Brooks, W.; Bingham, P.A. From acrylates to silicones: A review of common optical fibre coatings used for normal to harsh environments. Progress in Organic Coatings 2023, 180, 107557. [Google Scholar] [CrossRef]
- Bulatov, M.I.; Sosunov, A.V.; Grigorev, N.S.; Spivak, L.V.; Petukhov, I.V. Thermal stability of carbon/polyimide coated optical fiber dried in hydrogen atmosphere. Optical Fiber Technology 2023, 81, 103556. [Google Scholar] [CrossRef]
- Amorebieta, J.; Pereira, J.; Franciscangelis, C.; Durana, G.; Zubia, J.; Villatoro, J.; Margulis, W. Carbon-coated fiber for optoelectronic strain and vibration sensing. Optical Fiber Technology 2024, 85, 103794. [Google Scholar] [CrossRef]
- Stolov, A.A.; Popelka, M.; Caviasca, J.A. Lifetime prediction for polymer coatings via thermogravimetric analysis. Journal of Coatings Technology and Research 2025, 22, 195–209. [Google Scholar] [CrossRef]
- Li, C. , Yang, W., Wang, M., Yu, X., Fan, J., Xiong, Y., Yang, Y., Li, L. A review of coating materials used to improve the performance of optical fiber sensors. Sensors 2020, 20(15), 4215. [Google Scholar] [CrossRef]
- Shen, G.; Qu, X.; She, W.; Yu, X.; Sun, Q.; Chen, H. Study of UV-curable coatings for optical fibers. Journal of Coatings Technology 1999, 71, 53–57. [Google Scholar] [CrossRef]
- Fu, J.; Wang, L.; Yu, H.; Haroon, M.; Haq, F.; Shi, W.; Wu, B.; Wang, L. Research progress of UV-curable polyurethane acrylate-based hardening coatings. Progress in Organic Coatings 2019, 131, 82–99. [Google Scholar] [CrossRef]
- Canning, J.; Canagasabey, A.; Groothoff, N. UV irradiation of polymer coatings on optical fibre. Optics Communications 2002, 214, 141–145. [Google Scholar] [CrossRef]
- Rioux, M.; Ledemi, Y.; Morency, S.; de Lima Filho, E.S.; Messaddeq, Y. Optical and electrical characterizations of multifunctional silver phosphate glass and polymer-based optical fibers. Scientific Reports 2017, 7, 43917. [Google Scholar] [CrossRef] [PubMed]
- Zamyatin, A.A.; Makovetskii, A.N.; Milyavskii, Y.S. A Procedure for Measuring the Viscosity of Formulations Based on Oligourethane Acrylates for UV-Curable Protective Coatings of Fiber Light Guides. Russian Journal of Applied Chemistry 2002, 75, 1683–1687. [Google Scholar] [CrossRef]
- Zabegaeva, O.N.; Kosolapov, A.F.; Semjonov, S.L.; Ezernitskaya, M.G.; Afanasyev, E.S.; Godovikov, I.A.; Chuchalov, A.V.; Sapozhnikov, D.A. Polyamide-imides as novel high performance primary protective coatings of silica optical fibers: Influence of the structure and molecular weight. Reactive and Functional Polymers 2024, 194, 105775. [Google Scholar] [CrossRef]
- Bhardwaj, R.; Chanana, G.; Khurana, S.; Kumar, N. Introduction of Optical Fiber: Fundamentals and Applications. In: Bhardwaj, V., Kumar, S., Kishor, K., Rai, A. (eds) Optical Fiber Sensors and AI. Progress in Optical Science and Photonics 2025, 34, 1–14. [Google Scholar] [CrossRef]
- Xu, F.; Li, L.; Jing, P.; Yu, Z.; Zhang, J.; Liu, S. Experimental Study on the Characterization of Aging Resistance Properties of Optical Cables in the Hydrogen-Containing Downhole Environment. Sensors 2024, 24, 1655. [Google Scholar] [CrossRef]
- Lim, J.W. Polymer Materials for Optoelectronics and Energy Applications. Materials 2024, 17, 3698. [Google Scholar] [CrossRef]
- Grzesiak, M.; Poturaj, K.; Makara, M.; Mergo, P. Optical fiber with varied flat chromatic dispersion. Optical Fiber Technology 2024, 88, 103972. [Google Scholar] [CrossRef]
- Qiao, Y.; Wang, C. Panda-type elliptical-core fiber with flat and low normal-dispersion at 1.5–2.5 µm. Optik 2022, 270, 169949. [Google Scholar] [CrossRef]
- Sharif, K.A.M.; Omar, N.Y.M.; Zulkifli, M.I.; Yassin, S.Z.M.; Abdul-Rashid, H.A. Fabrication of Alumina-Doped Optical Fiber Preforms by an MCVD-Metal Chelate Doping Method. Appl. Sci. 2020, 10, 7231. [Google Scholar] [CrossRef]
- Pervadchuk, V.; Vladimirova, D.; Gordeeva, I.; Kuchumov, A.G.; Dektyarev, D. Fabrication of Silica Optical Fibers: Optimal Control Problem Solution. Fibers 2021, 9, 77. [Google Scholar] [CrossRef]
- Pervadchuk, V.; Vladimirova, D.; Derevyankina, A. Mathematical Modeling of Capillary Drawing Stability for Hollow Optical Fibers. Algorithms 2023, 16, 83. [Google Scholar] [CrossRef]
- Rattan, K.; Jaluria, Y. Simulation of the flow in a coating applicator for optical fiber manufacture. Computational Mechanics 2003, 31(5), 428-436. [CrossRef]
- Paek, U.C. Free drawing and polymer coating of silica glass optical fibers. Journal of Heat Transfer 1999, 121(4), 774-787. [CrossRef]
- DSM Desotech Inc. Product Data. DeSolite 3471-1-152A; DSM Desotech Inc.: Elgin, IL, USA, 2015. Available online: https://drive.google.com/file/d/1MODJPy0jBUxYzSzJmQPEaVqoyI-70dBc/view?usp=sharing (accessed on 10 August 2022).
- DSM Desotech Inc. Product Data. DeSolite DS-2015; DSM Desotech Inc.: Elgin, IL, USA, 2015. Available online: https://focenter.com/wp-content/uploads/documents/AngstromBond---Fiber-Optic-Center-AngstromBond-DSM-DS-2015-UV-Cure-Secondary-Coating-(1Kg)-Fiber-Optic-Center.pdf (accessed on 31 July 2022).
- Kamenskikh, A.A.; Sakhabutdinova, L.; Strazhec, Y.A.; Bogdanova, A.P. Assessment of the Influence of Protective Polymer Coating on Panda Fiber Performance Based on the Results of Multivariant Numerical Simulation. Polymers 2023, 15, 4610. [Google Scholar] [CrossRef]
- Startsev, O.V.; Lebedev, M.P.; Vapirov, Y.M.; Kychkin, A.K.Comparison of Glass-Transition Temperatures for Epoxy Polymers Obtained by Methods of Thermal Analysis. Mechanics of Composite Materials 2020, 56(2), 227-240. [CrossRef]
- Lewis, B.; Dennis, J.M.; Park, C.; Shull, K.R. Glassy dynamics of epoxy-amine thermosets containing dynamic, aromatic disulfides. Macromolecules 2024, 57, 7112−7122. [Google Scholar] [CrossRef]
- Ghori, S.W.; Rao, G.S. Mechanical and thermal properties of date palm/kenaf fiber-reinforced epoxy hybrid composites. Polymer Composites 2021, 42(5), 2217-2224. [CrossRef]
- Lorenz, N.; Dyer, W.E.; Kumru, B. Exploring the Cure State Dependence of Relaxation and the Vitrimer Transition Phenomena of a Disulfide-Based Epoxy Vitrimer. Journal of Polymer Science 2025, 0, 1–13. [Google Scholar] [CrossRef]
- Kruchinin, D.Yu.; Farafontova, E.P. Physical Chemistry of the Glassy State. Publishing House of the Ural Federal University named after the first President of Russia B.N. Yeltsin: Ekaterinburg, Russia, 2021. (In Russian).
- Zhuravlev, V.I. Structure of Polyatomic Alcohols: The Cluster Model and Dielectric Spectroscopy Data. Russian Journal of Physical Chemistry A 2019, 93(5), 873-879. DOI 10.1134/S0036024419050376. [CrossRef]
- Chen, G.; Tao, L.; Li, Y. Predicting Polymers’ Glass Transition Temperature by a Chemical Language Processing Model. Polymers 2021, 13, 1898. [Google Scholar] [CrossRef]
- Ulitin, N.V.; Shadrina, G.R.; Anisimova, V.I.; Rodionov, I.S.; Baldinov, A.A.; Lyulinskaya, Y.L.; Tereshchenko, K.A.; Shiyan, D.A. Interpretation of the Structure–Glass Transition Temperature Relationship for Organic Homopolymers with the Use of Increment, Random Forest, and Density Functional Theory Methods. Journal of Structural Chemistry 2025, 66, 1095–1109. [Google Scholar] [CrossRef]
- Song, P.; Trived, A.R.; Siviour, C.R. Mechanical response of two different molecular weight polycarbonates at varying rates and temperatures. EPJ Web of Conferences 2021, 250, 06013. [Google Scholar] [CrossRef]
- Bartenev, G.M. Relaxation Transitions in Poly (methyl methacrylate) as Shown by Dynamic Mechanical Spectroscopy, Thermostimulated Creep, and Creep Rate Spectra. Polymer Science, Series B 2001, 43(7-8), 202-207.
- Nemilov, S.V.; Balashov, Y.S. The peculiarities of relaxation processes at heating of glasses in glass transition region according to the data of mechanical relaxation spectra (Review). Glass Physics and Chemistry 2016, 42(2), 119-134. [CrossRef]
- Naymusin, I.G.; Trufanov, N.A.; Shardakov, I.N. Numerical analysis of deformation processes in the optical fiber sensors. PNRPU Mechanics Bulletin (In Russian). 2012, 1, 104–116. [Google Scholar]
- Müller-Pabel, M.; Rodríguez Agudo, J.A.; Gude, M. Measuring and understanding cure-dependent viscoelastic properties of epoxy resin: A review. Polymer Testing 2022, 114, 107701. [Google Scholar] [CrossRef]
- Liu, F.; Wang, J.; Long, S.; Zhang, H.; Yao, X. Experimental and modeling study of the viscoelastic-viscoplastic deformation behavior of amorphous polymers over a wide temperature range. Mechanics of Materials 2022, 167, 104246. [Google Scholar] [CrossRef]
- Liang, Z.; Li, J.; Zhang, X.; Kan, Q. A viscoelastic-viscoplastic constitutive model and its finite element implementation of amorphous polymers. Polymer Testing 2023, 117, 107831. [Google Scholar] [CrossRef]
- Li, J.; Liang, Z.; Chen, K.; Zhang, X.; Kang, G.; Kan, Q. Thermo-mechanical deformation for thermo-induced shape memory polymers at equilibrium and non-equilibrium temperatures: Experiment and simulation. Polymer 2023, 270, 125762. [Google Scholar] [CrossRef]
- Kuryashov, D.A.; Bashkirtseva, N.Y.; Diyarov, I.N.; Philippova, O.E.; Molchanov, V.S. Temperature effect on the viscoelastic properties of solutions of cylindrical mixed micelles of zwitterionic and anionic surfactants. Colloid Journal 2010, 72(2), 230-235. [CrossRef]
- Matveenko, V.N.; Kirsanov, Y.A. Interpretation of rheological curves of polymer melts in the region of linear viscoelasticity. Cifra. Chemistry 2025, 2(5), 1 (In Russian). [CrossRef]
- Pan’kov, A.A.; Pisarev, P.V. Numerical modeling of electroelastic fields in the surface piezoelectricluminescent optical fibersensor todiagnose deformation of composite plates. PNRPU Mechanics Bulletin 2020, 2, 64–77. [Google Scholar] [CrossRef]
- Shardakov, I.N.; Trufanov, A.N. Identification of the Temperature Dependence of the Thermal Expansion Coefficient of Polymers. Polymers 2021, 13, 3035. [Google Scholar] [CrossRef] [PubMed]
- Lin, C.Y. Rethinking and researching the physical meaning of the standard linear solid model in viscoelasticity. Mechanics of Advanced Materials and Structures 2023, 31(11), 2370–2385. [Google Scholar] [CrossRef]
- Chen, T. Determining a Prony Series for a Viscoelastic Material from Time Varying Strain Data; TM-2000-210123; NASA Langley Technical Report Server: Washington, DC, USA, 2000.
- Alejandro, T.-R.M.; Mariamne, D.-G.; Edmundo, L.-U.L. Prony series calculation for viscoelastic behavior modeling of structural adhesives from DMA data Cálculo de Series de Prony a partir de datos de DMA para modelado de comportamiento viscoelástico de adhesives. Ingeniería Investigación y tecnología 2020, 21(2), 1-10. [CrossRef]
- Mottahedi, M.; Dadalau, A.; Hafla, A.; Verl, A. (2011). Numerical Analysis of Relaxation Test Based on Prony Series Material Model. In: Fathi, M., Holland, A., Ansari, F., Weber, C. (eds) Integrated Systems, Design and Technology 2010. Springer, Berlin, Heidelberg. [CrossRef]
- Kamenskikh, A.A.; Nosov, Y.O.; Bogdanova, A.P. The Study Influence Analysis of the Mathematical Model Choice for Describing Polymer Behavior. Polymers 2023, 15, 3630. [Google Scholar] [CrossRef]
- Williams, M.L.; Landel, R.F.; Ferry, J.D. The temperature dependence of relaxation mechanisms in amorphous polymers and other glass-forming liquids. Journal of the American Chemical Society 1955, 77(14), 3701-3707. [CrossRef]
- Nelder, J.A.; Mead, R. A simplex method for function minimization. The Computer Journal 1965, 7(4), 308-313. [CrossRef]
- van Krevelen, D.W.; te Nijenhuis, K. Properties of polymers (Fourth Edition) Elsevier: Boston, USA, 2009.
- Hao, J.; Lomov, S.V.; Fuentes, C.A.; van Vuure, A.W. Creep behaviour and lifespan of flax fibre composites with different polymer matrices. Composite Structures 2025, 367, 119246. [Google Scholar] [CrossRef]
- Peschanskaya, N.N.; Yakushev, P.N.; Shpeǐzman, V.V.; Smolyanskiǐ, A.S.; Shvedov, A.S.; Cheremisov, V.G. Inhomogeneity of the strain rate of polymer materials with different supramolecular structures. Physics of the Solid State 2010, 52(9), 1972-1975.
- Shao, M.; Tam, L.; Wu, C. A universal creep model for polymers considering void evolution. Composites Part B: Engineering 2025, 297, 112280. [Google Scholar] [CrossRef]
Figure 2.
Dependence of complex Young’s modulus of polymer coatings E', E'' and
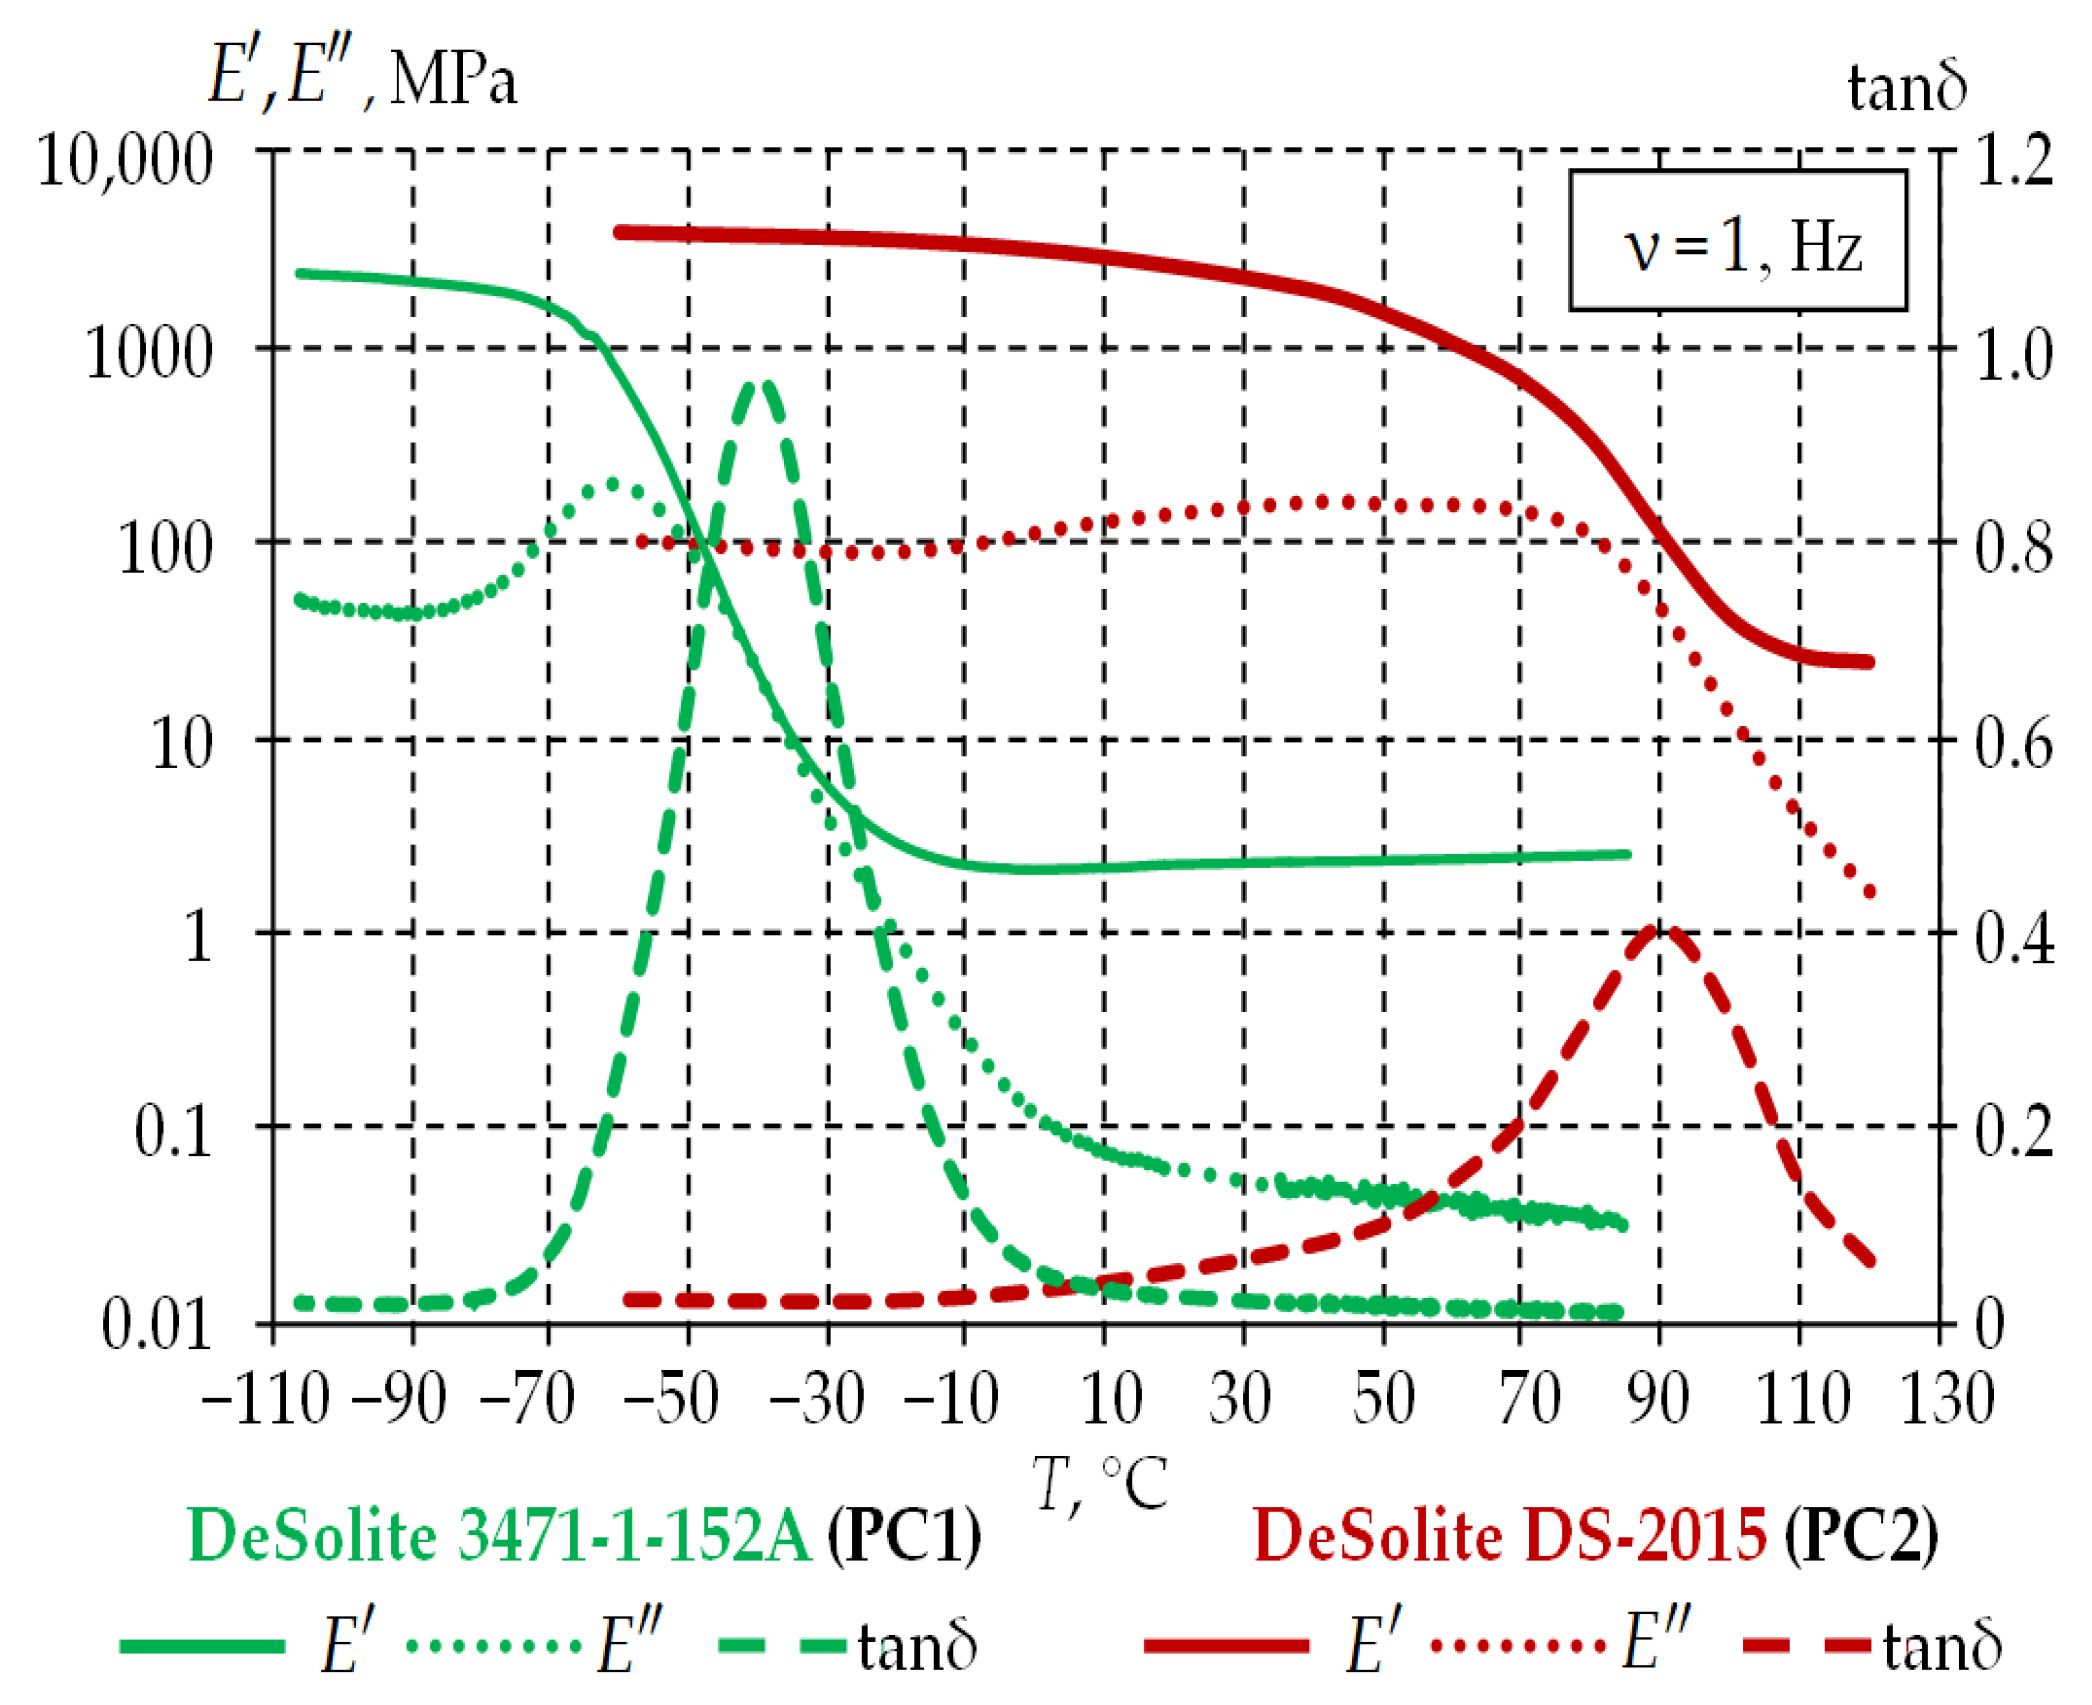
Figure 6.
Experimental data of the dynamic elastic modulus, loss modulus, and mechanical loss tangent tg δ vs. temperature for DeSolite 3471-1-152A at a frequency of 1 Hz, cooling and heating rate of 2 °C/min.
Figure 6.
Experimental data of the dynamic elastic modulus, loss modulus, and mechanical loss tangent tg δ vs. temperature for DeSolite 3471-1-152A at a frequency of 1 Hz, cooling and heating rate of 2 °C/min.
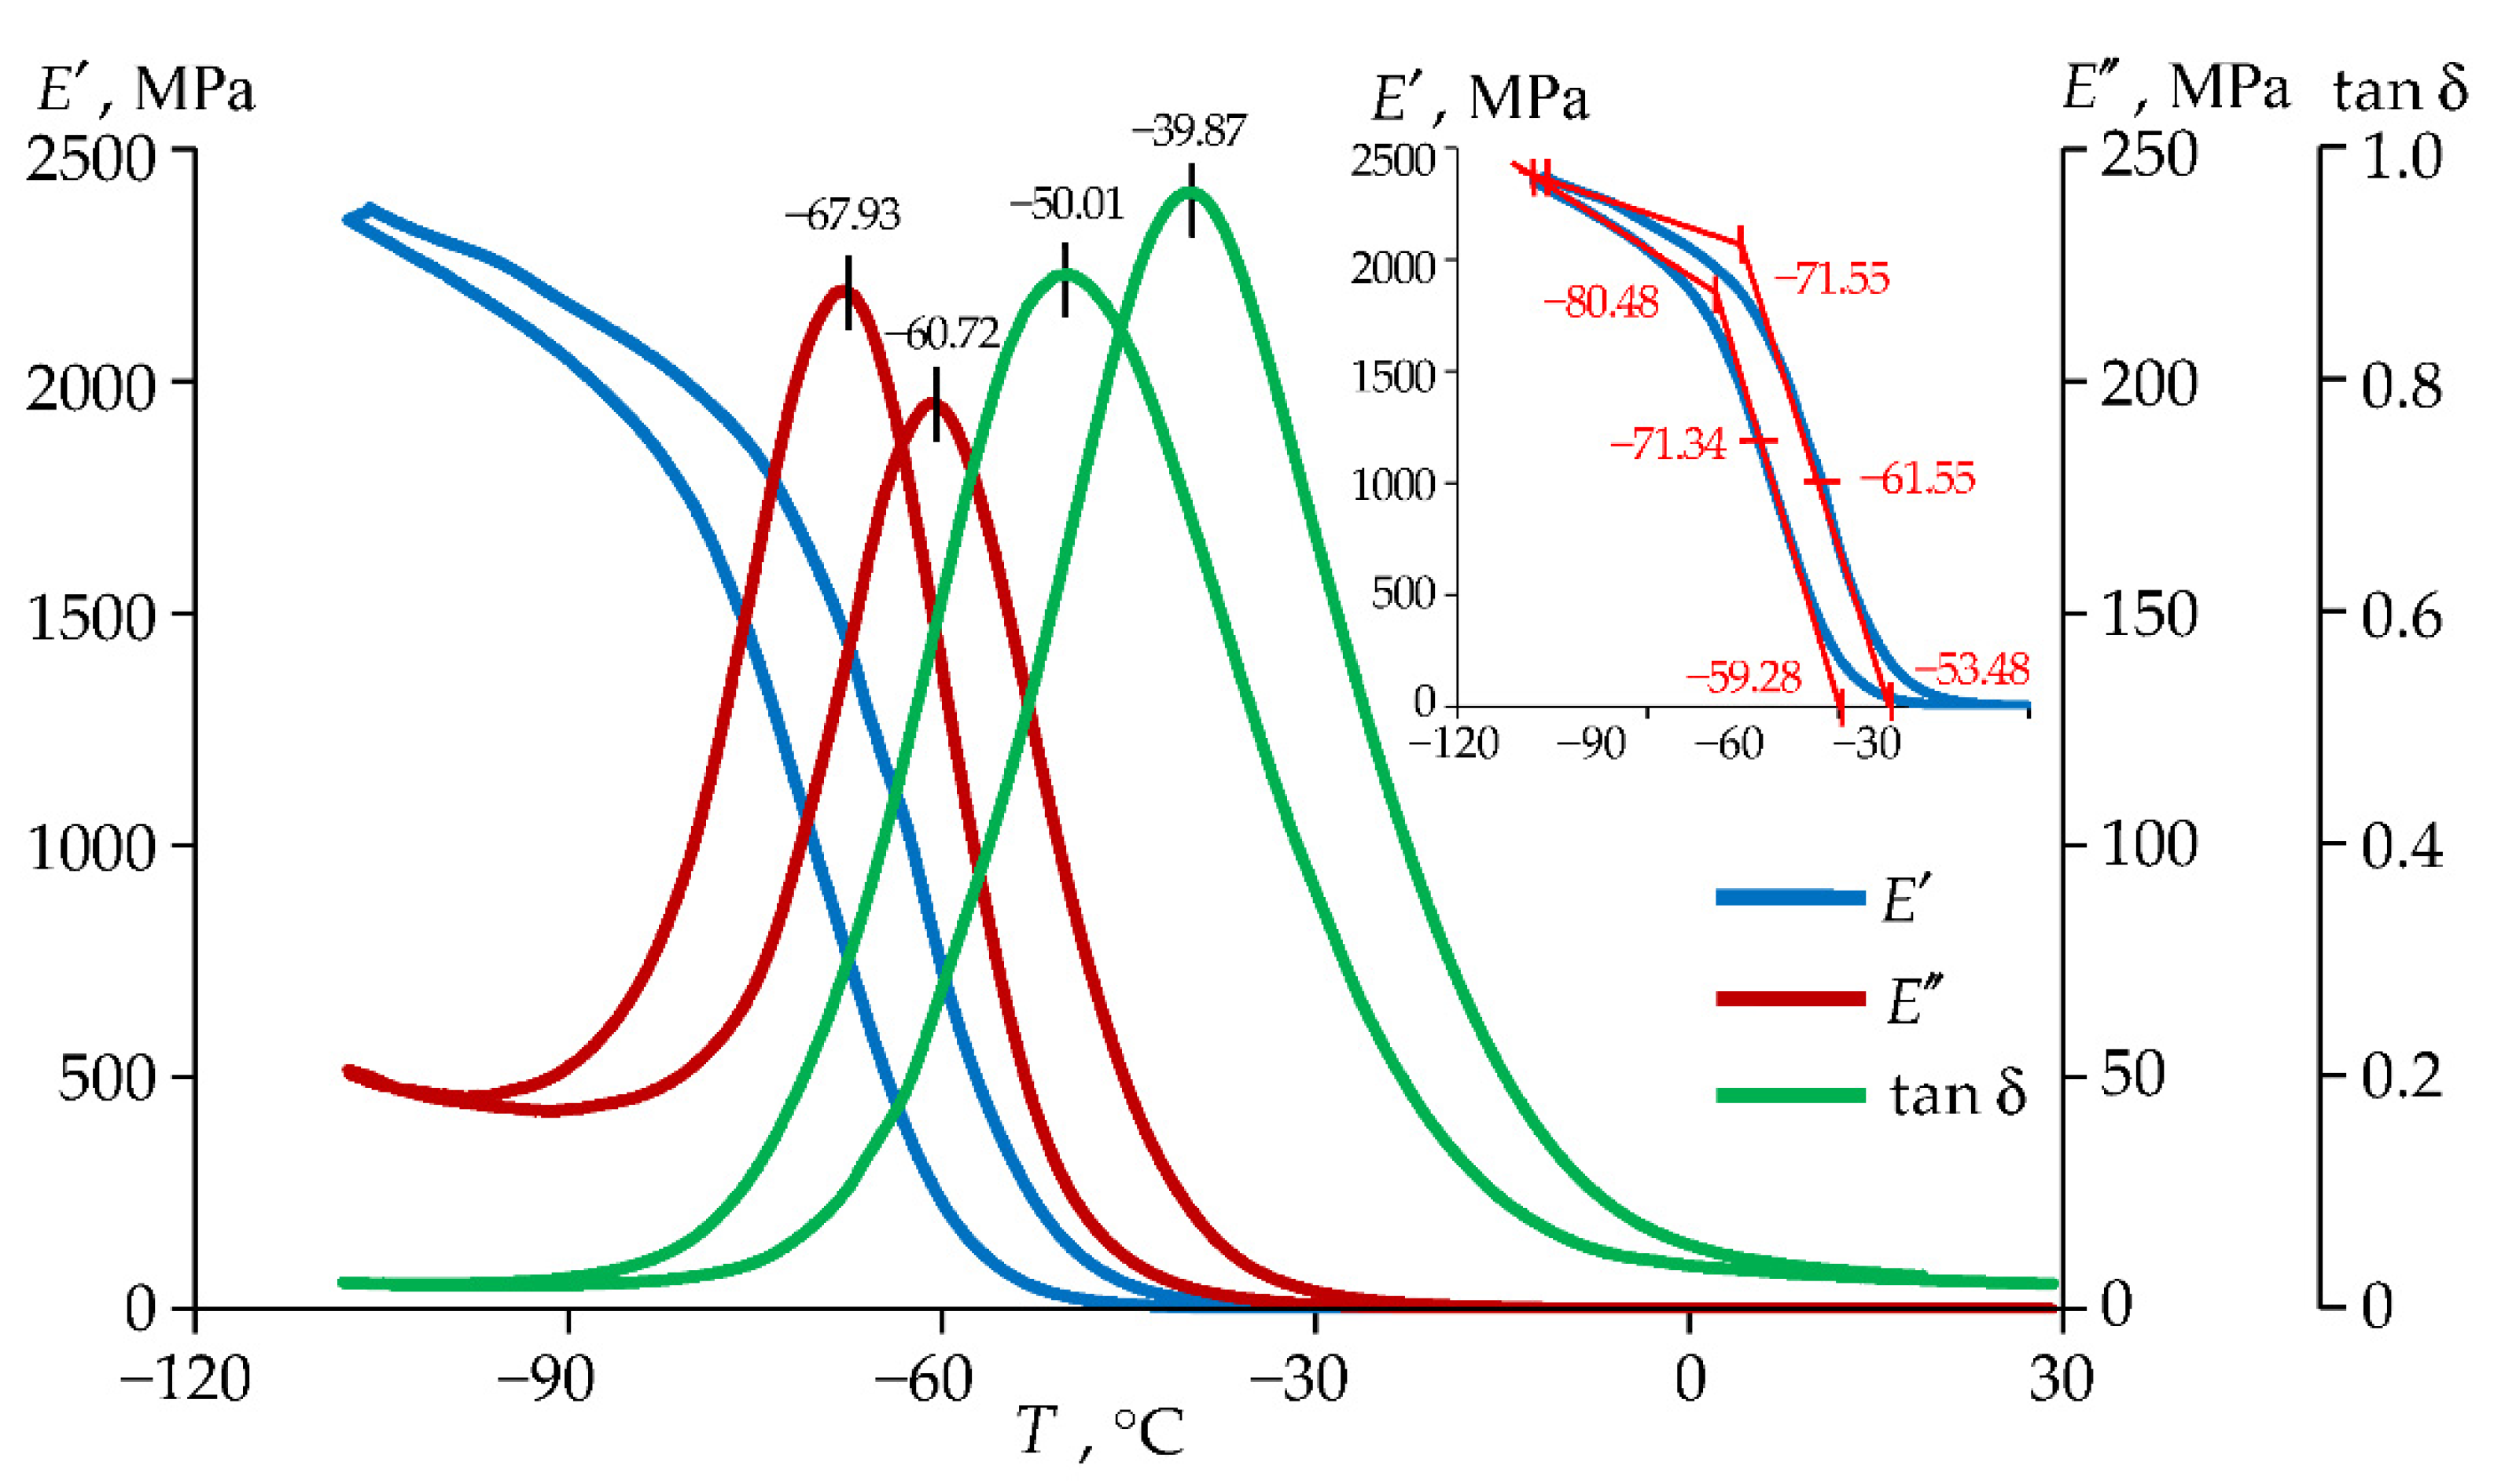
Figure 7.
Experimental data of the dynamic elastic modulus, loss modulus, and mechanical loss tangent tg δ vs. temperature for DeSolite DS-2015 at a frequency of 1 Hz, cooling and heating rate of 2 °C/min.
Figure 7.
Experimental data of the dynamic elastic modulus, loss modulus, and mechanical loss tangent tg δ vs. temperature for DeSolite DS-2015 at a frequency of 1 Hz, cooling and heating rate of 2 °C/min.
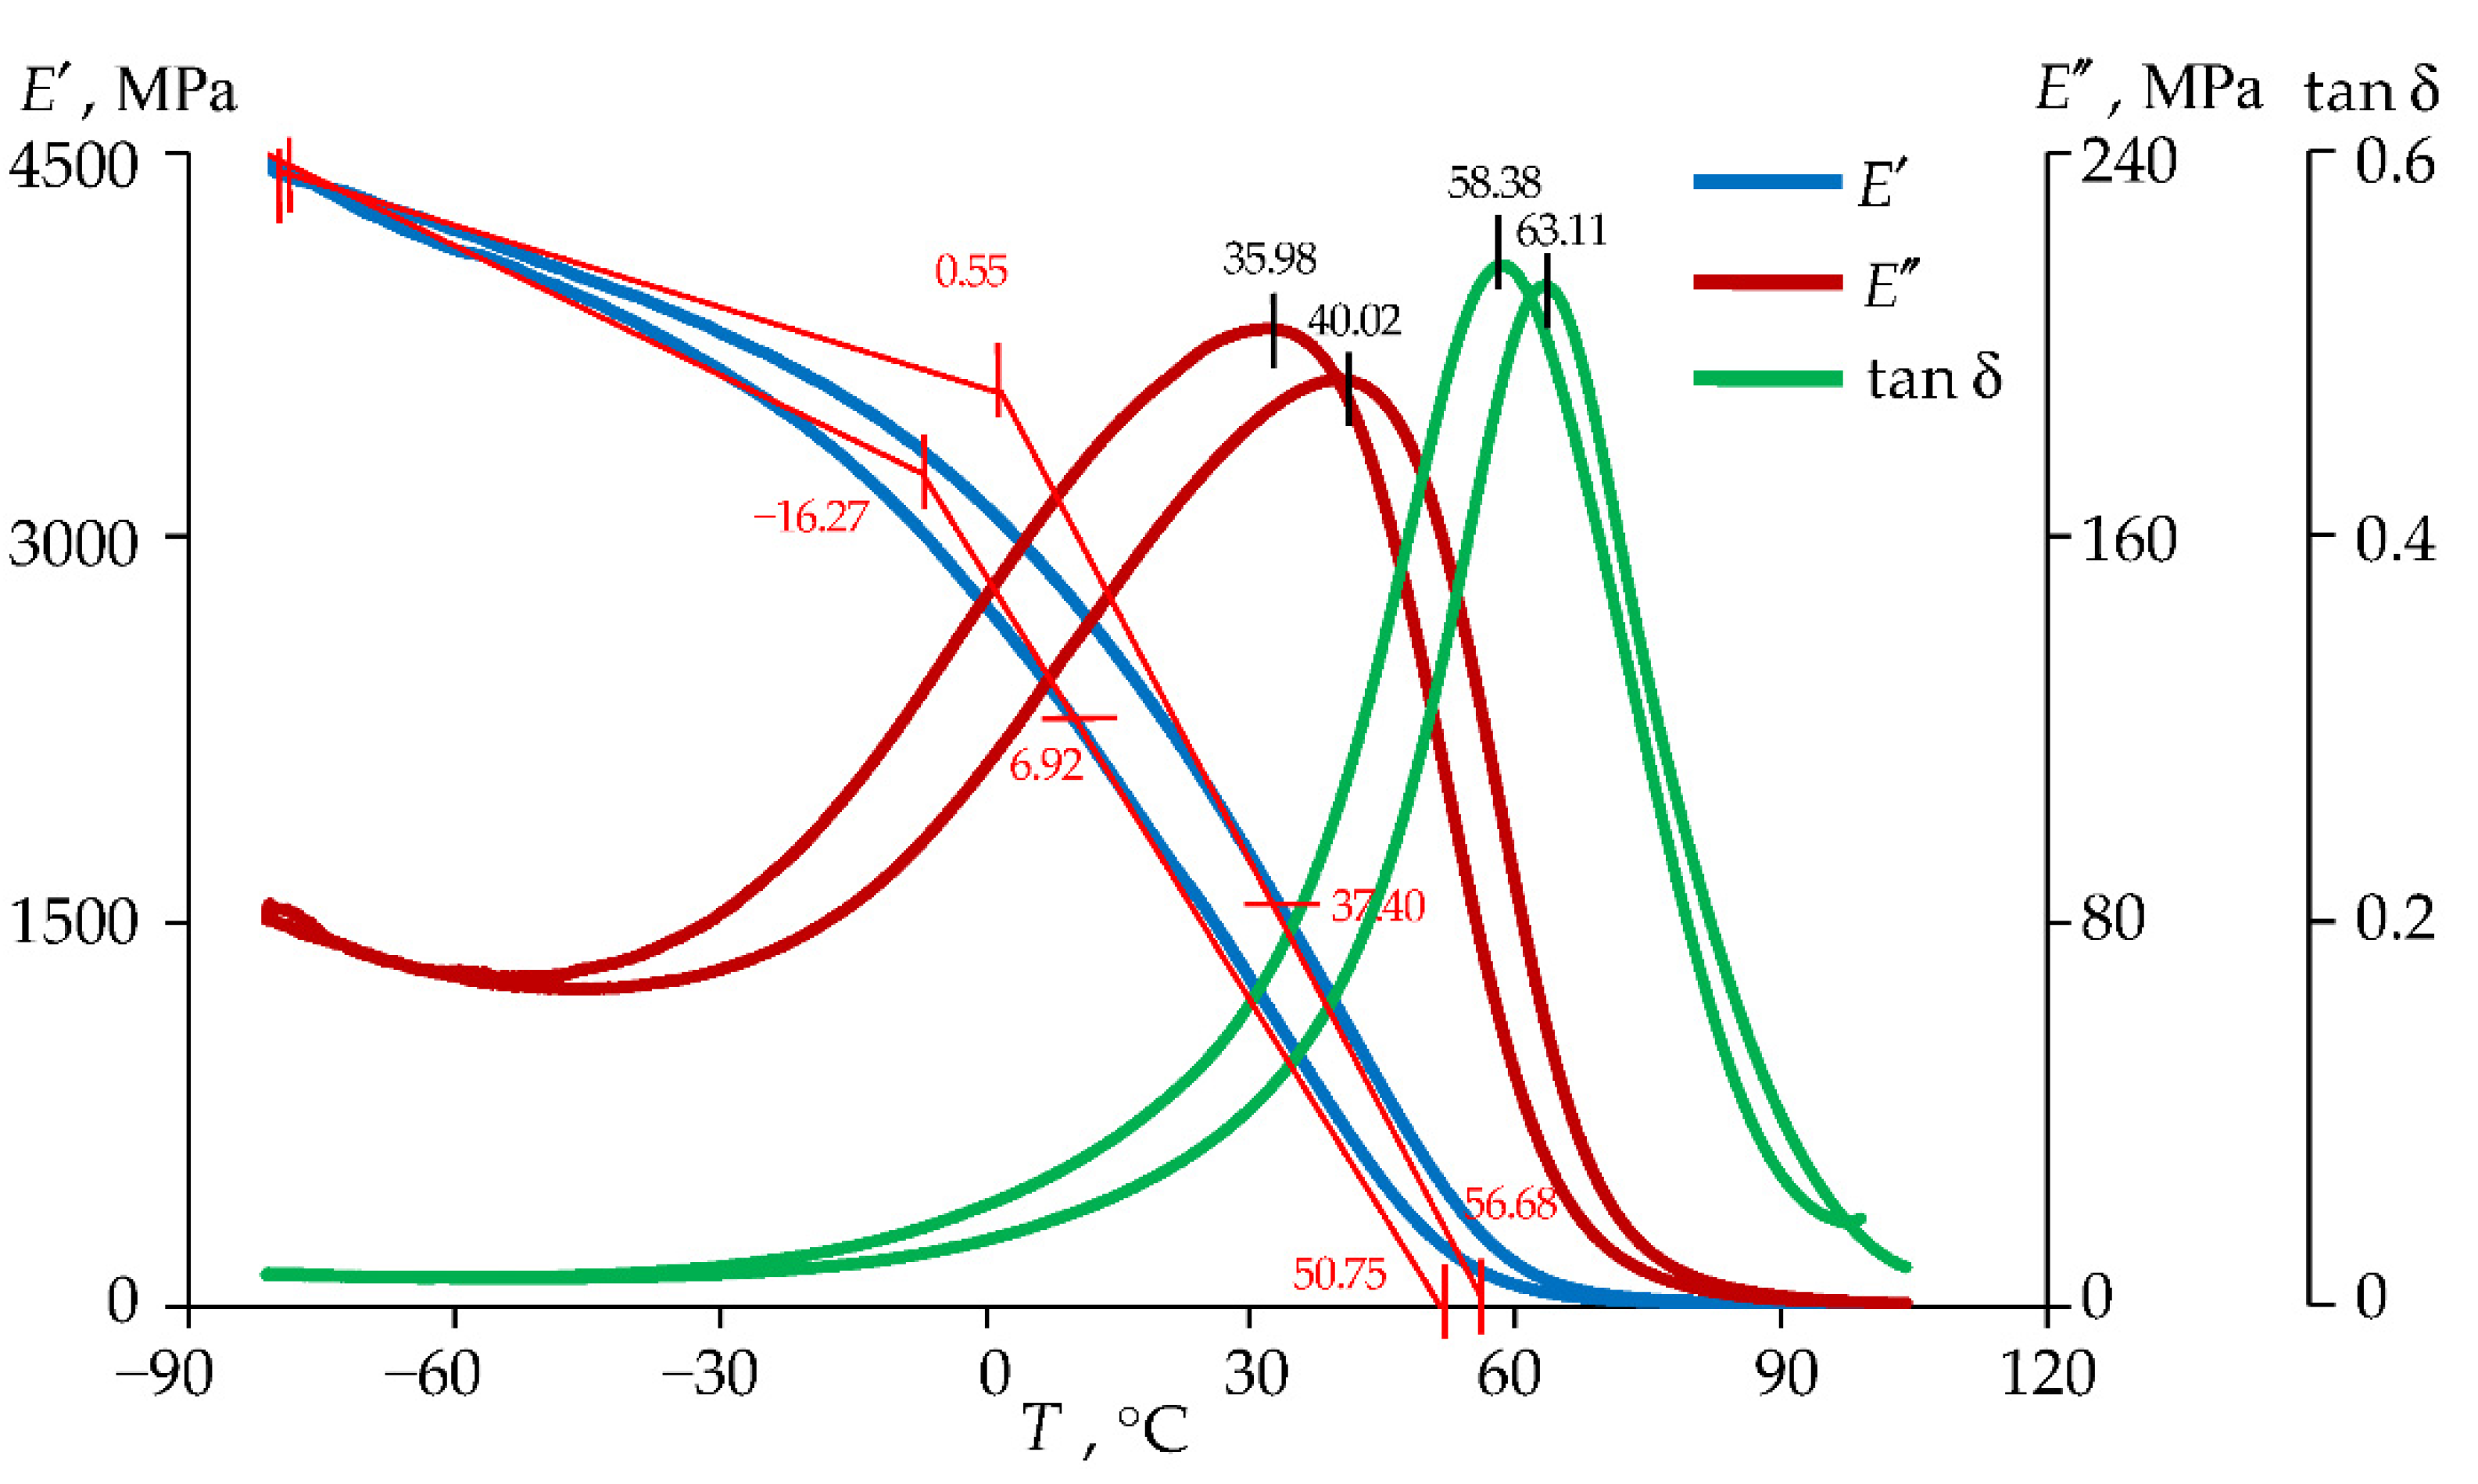
Figure 8.
E' vs. strain amplitude dependence diagram for DeSolite 3471-1-152A at a frequency of _1 Hz and a temperature of T=30 °C: a is results for three experiments; b is specimen 1; c is specimen 2; d is specimen 3.
Figure 8.
E' vs. strain amplitude dependence diagram for DeSolite 3471-1-152A at a frequency of _1 Hz and a temperature of T=30 °C: a is results for three experiments; b is specimen 1; c is specimen 2; d is specimen 3.
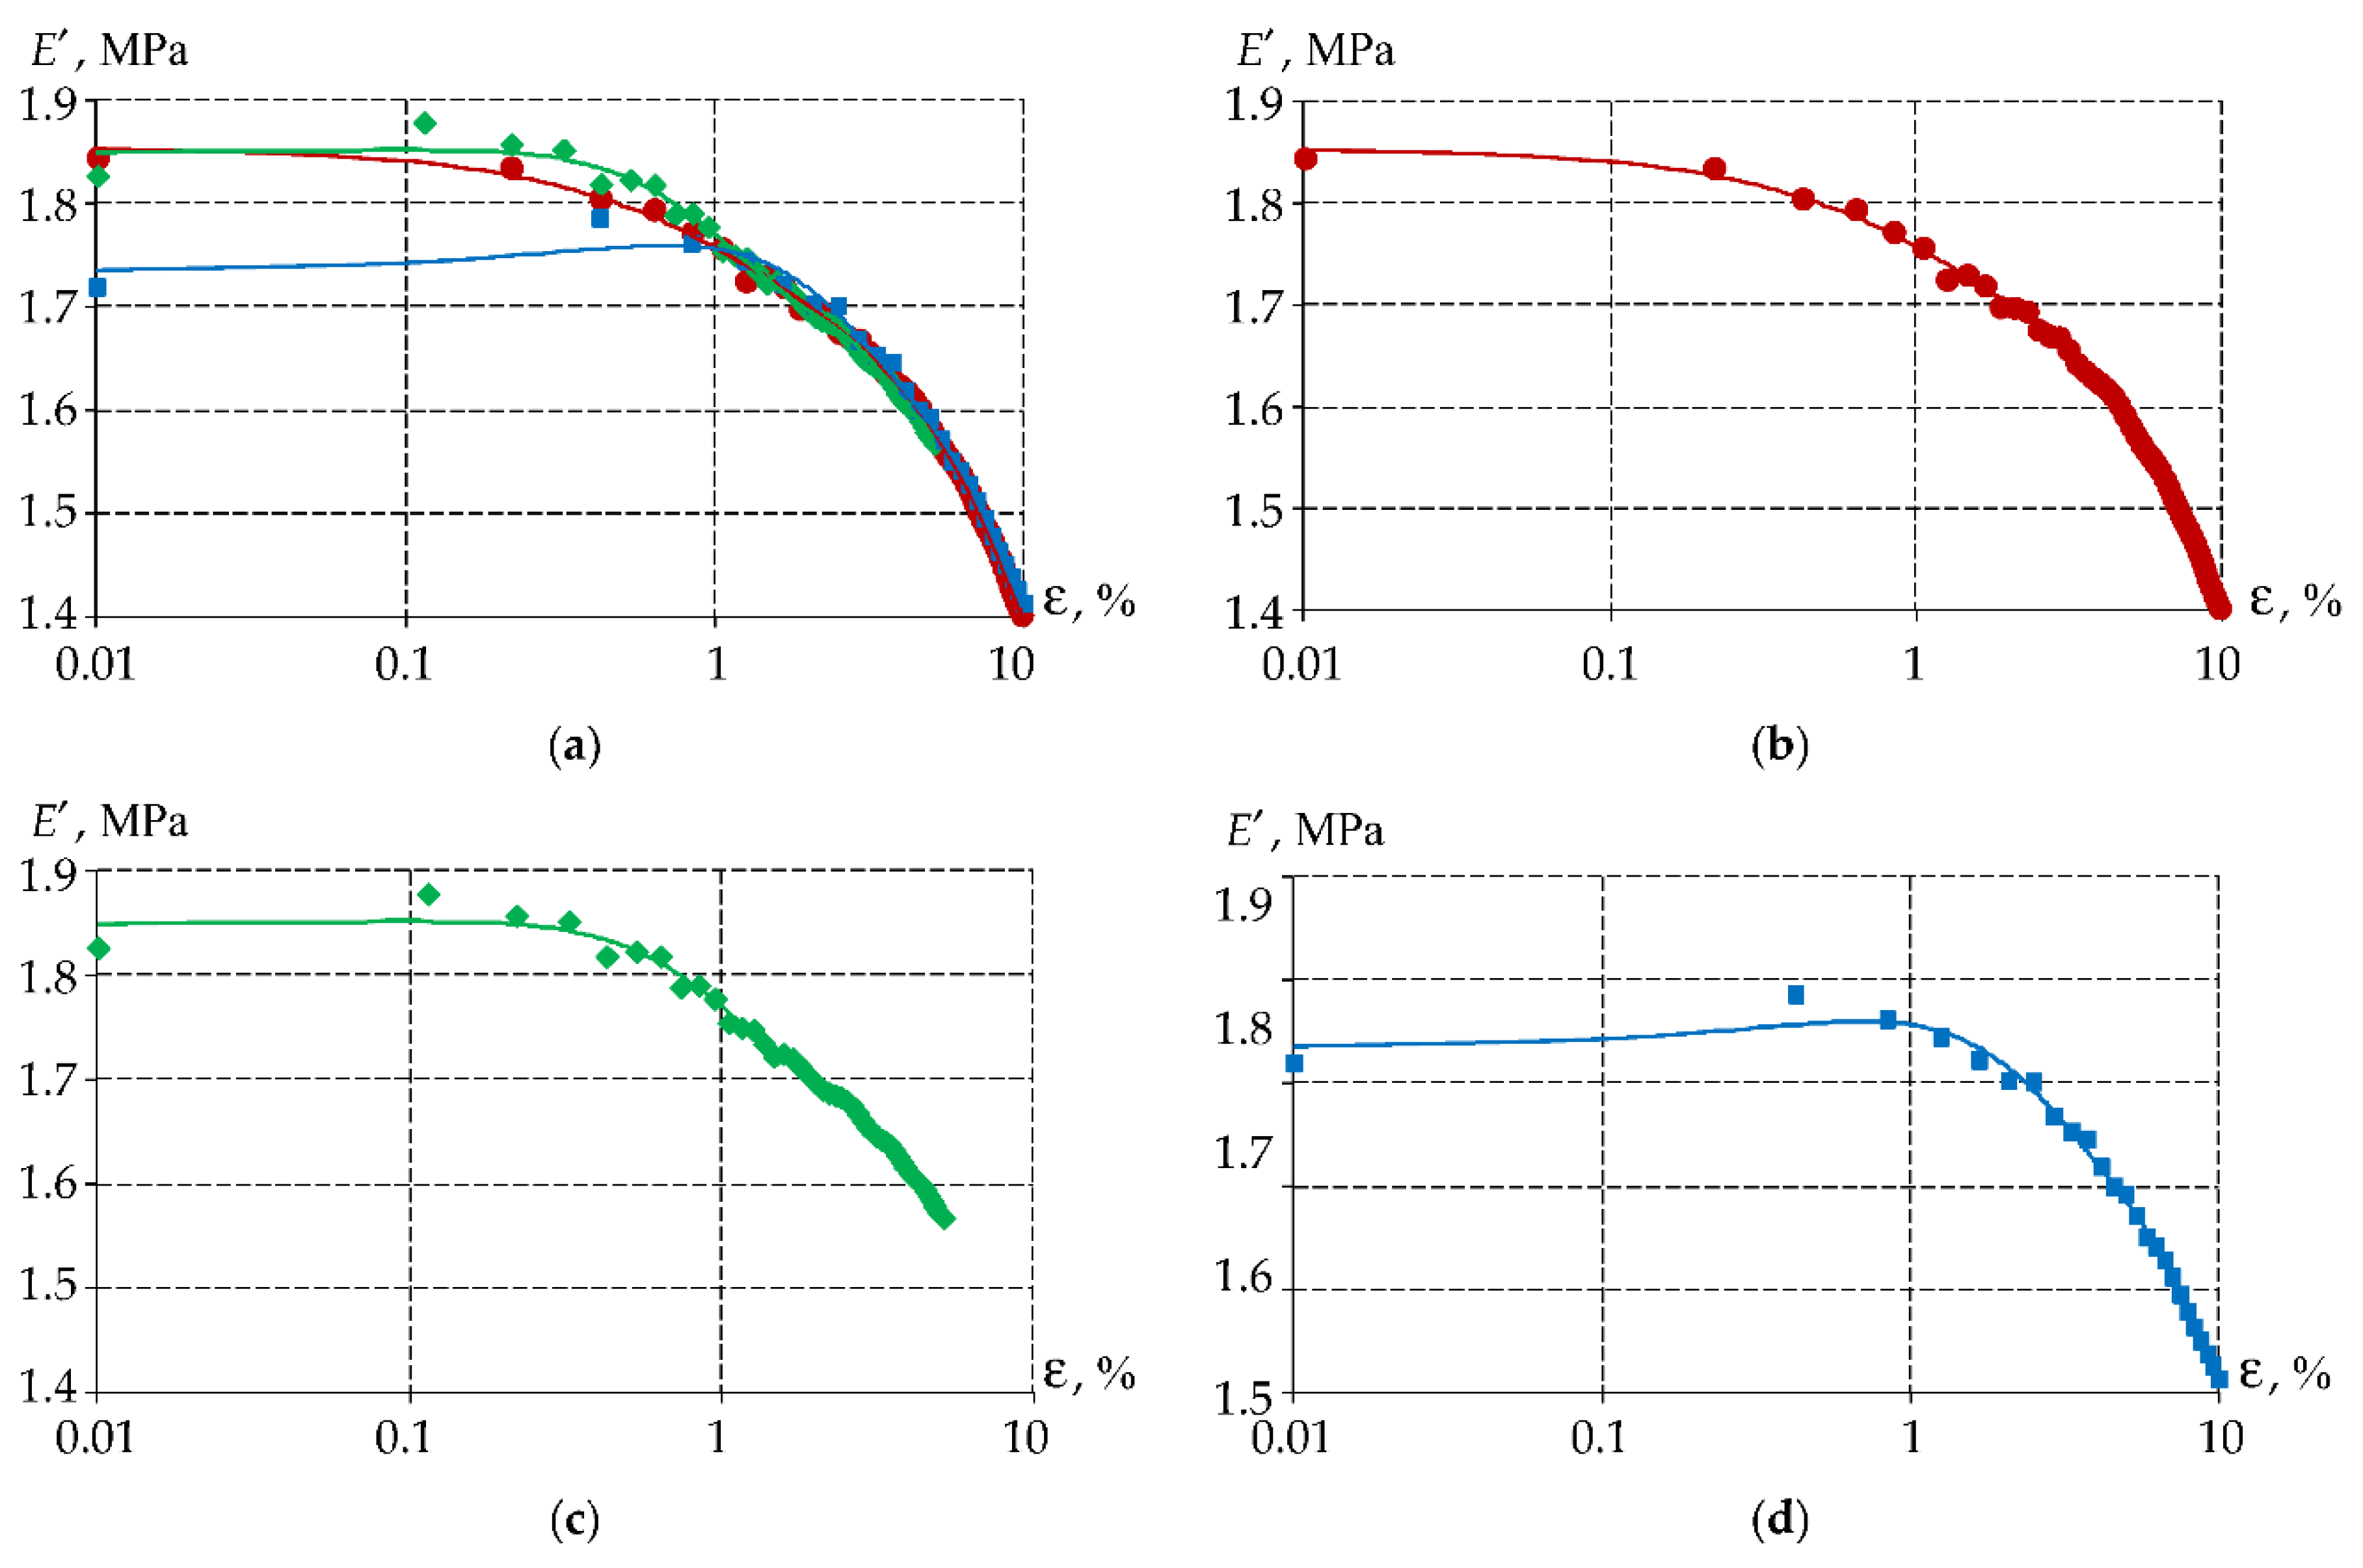
Figure 11.
Processing the results based on the temperature-time analogy principle: a is initial data; b is plotting a master curve based on experimental data at the equivalent oscillation frequency.
Figure 11.
Processing the results based on the temperature-time analogy principle: a is initial data; b is plotting a master curve based on experimental data at the equivalent oscillation frequency.
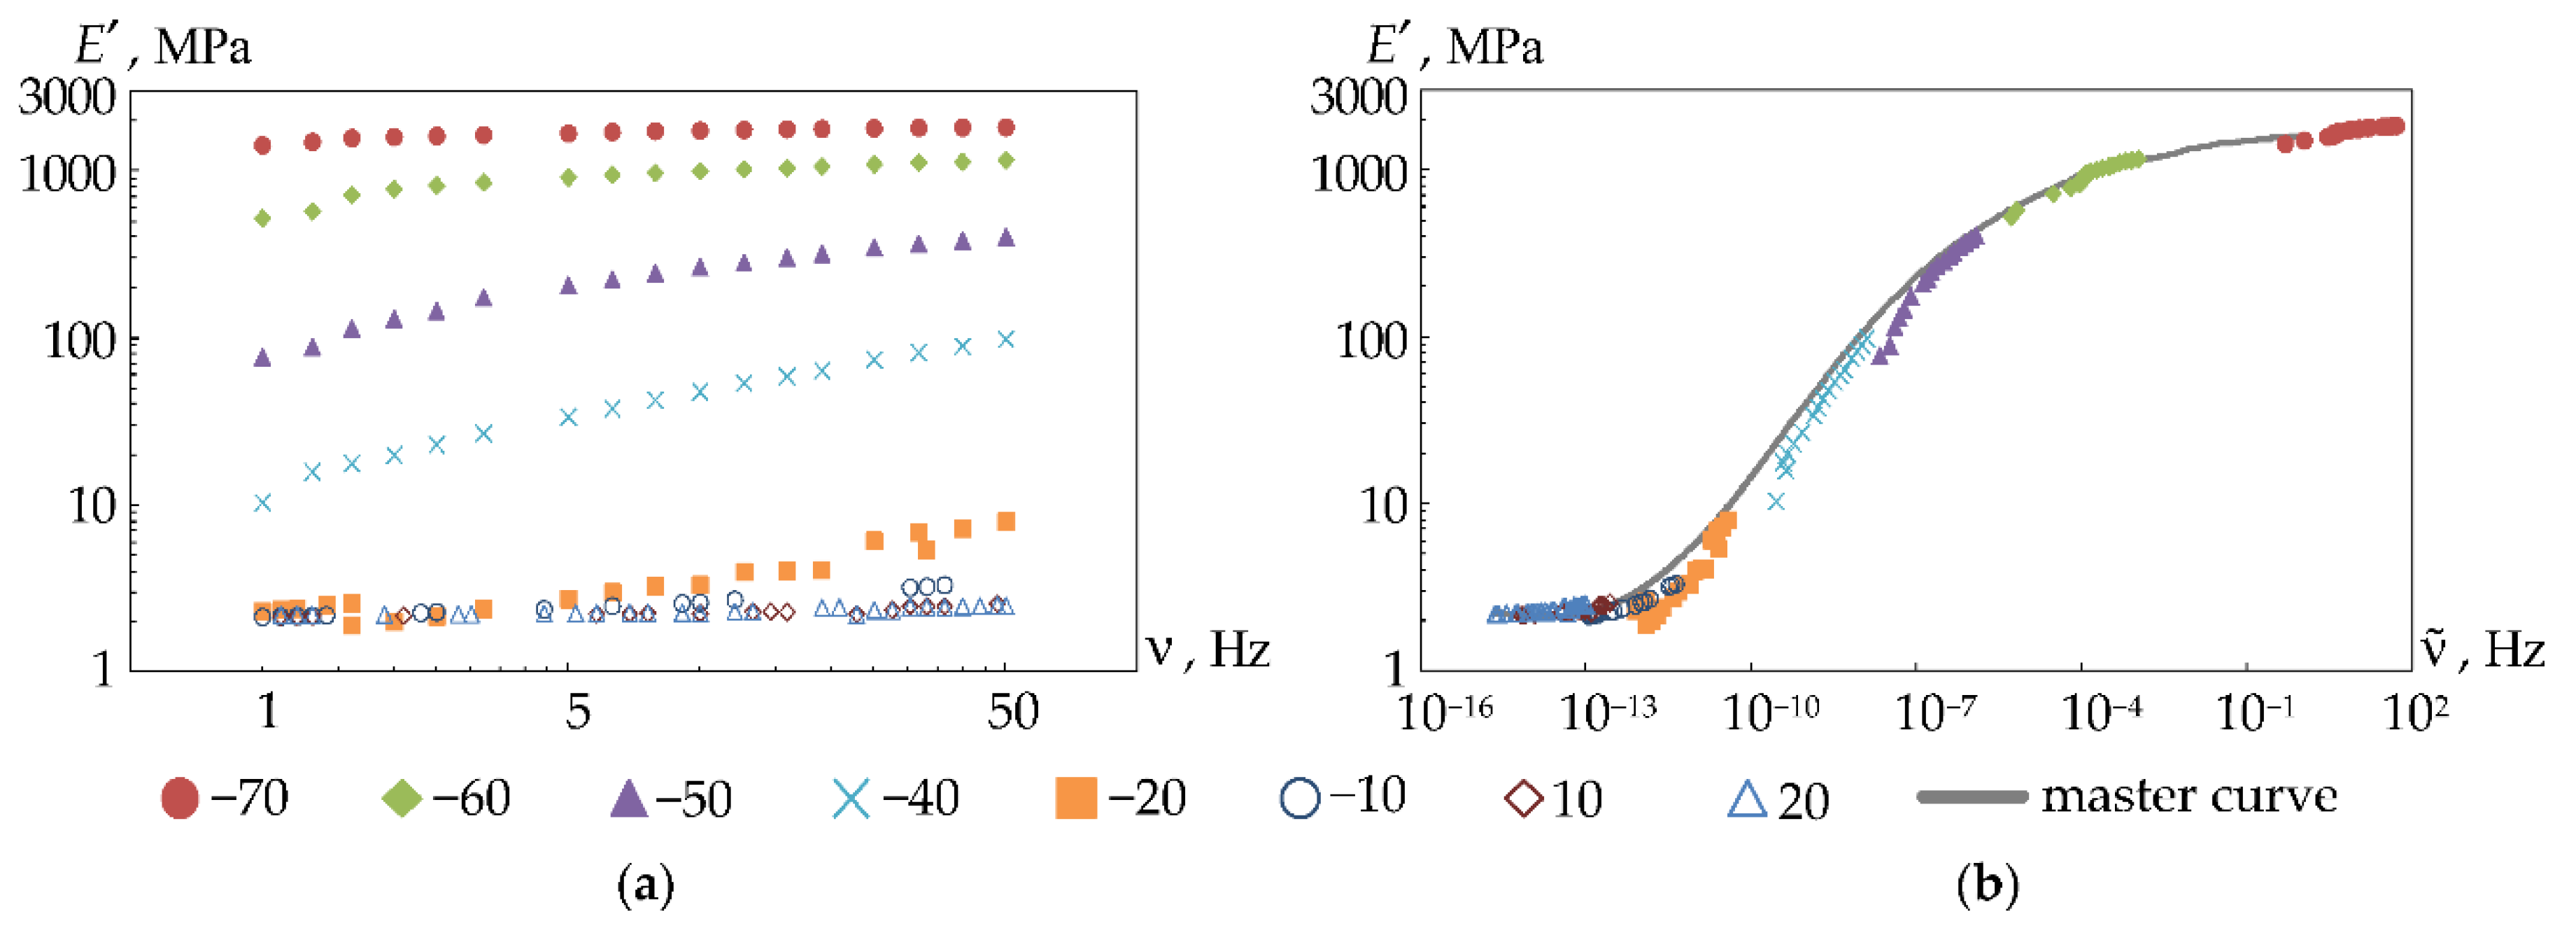
Figure 12.
Dependence of the storage modulus (a) and loss modulus (b) on frequency (for DeSolite DS-2015): blue is experimental data; red is approximation of the experimental data.
Figure 12.
Dependence of the storage modulus (a) and loss modulus (b) on frequency (for DeSolite DS-2015): blue is experimental data; red is approximation of the experimental data.
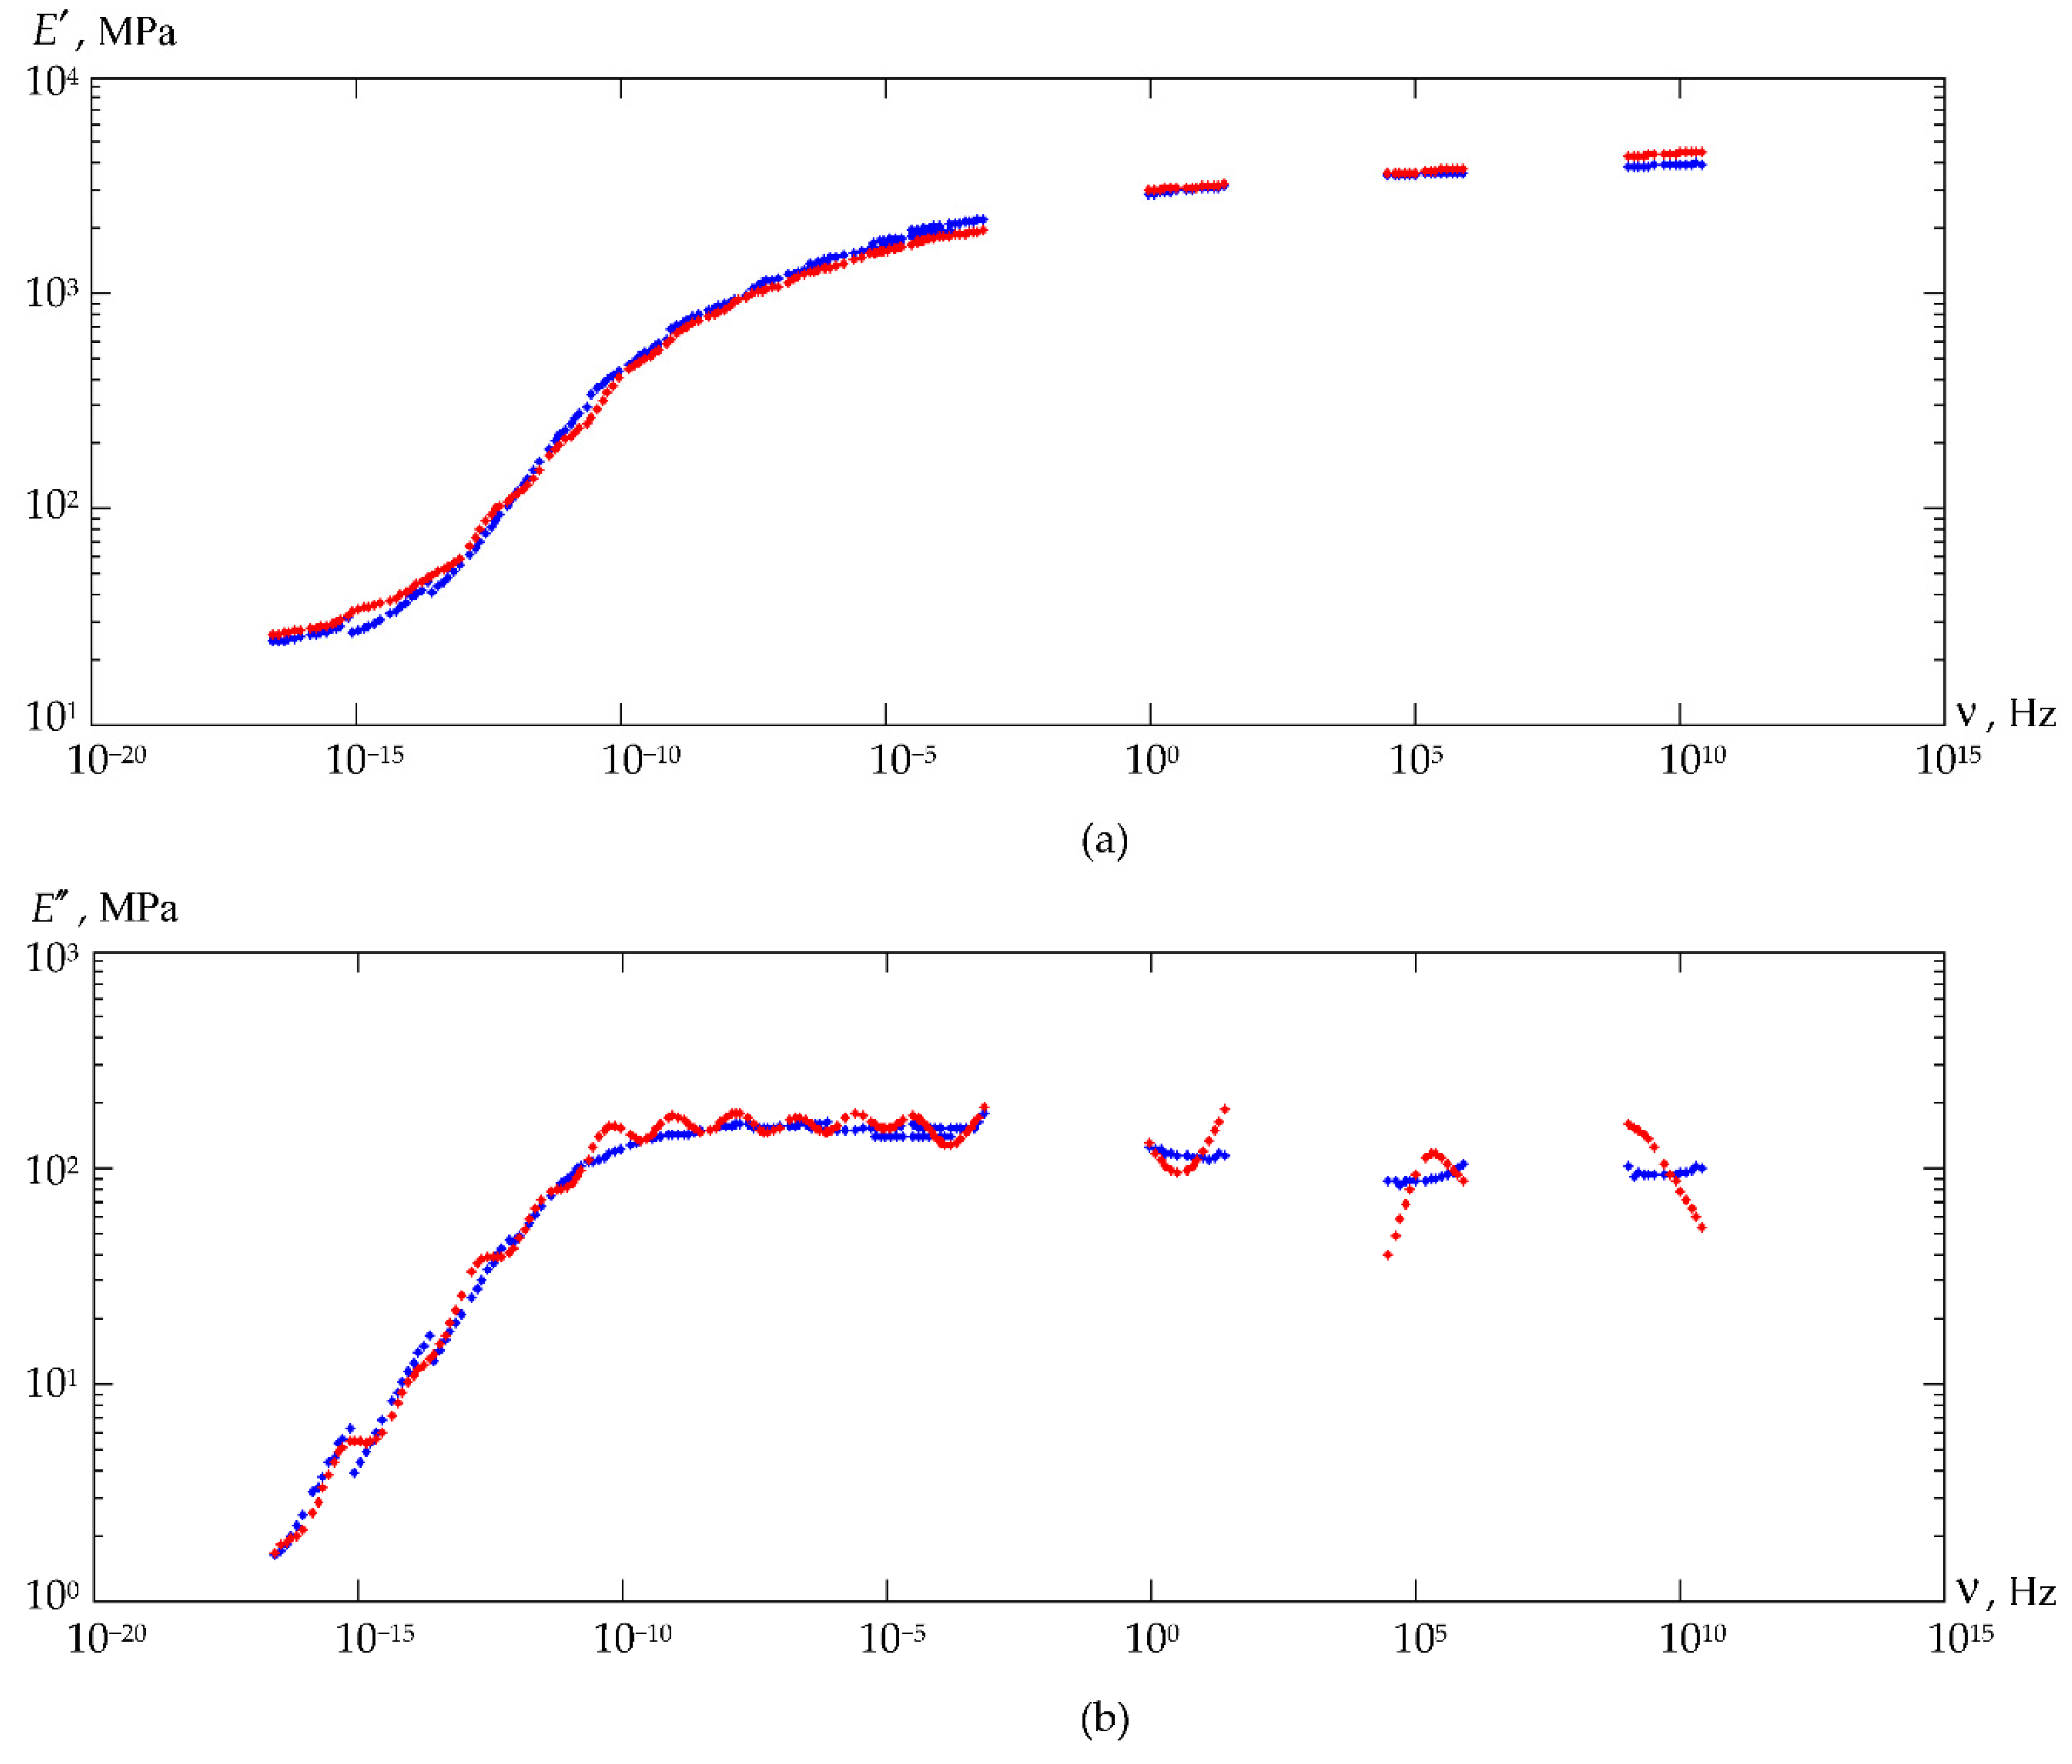
Figure 13.
Dependence of E' on temperature (for DeSolite DS-2015).
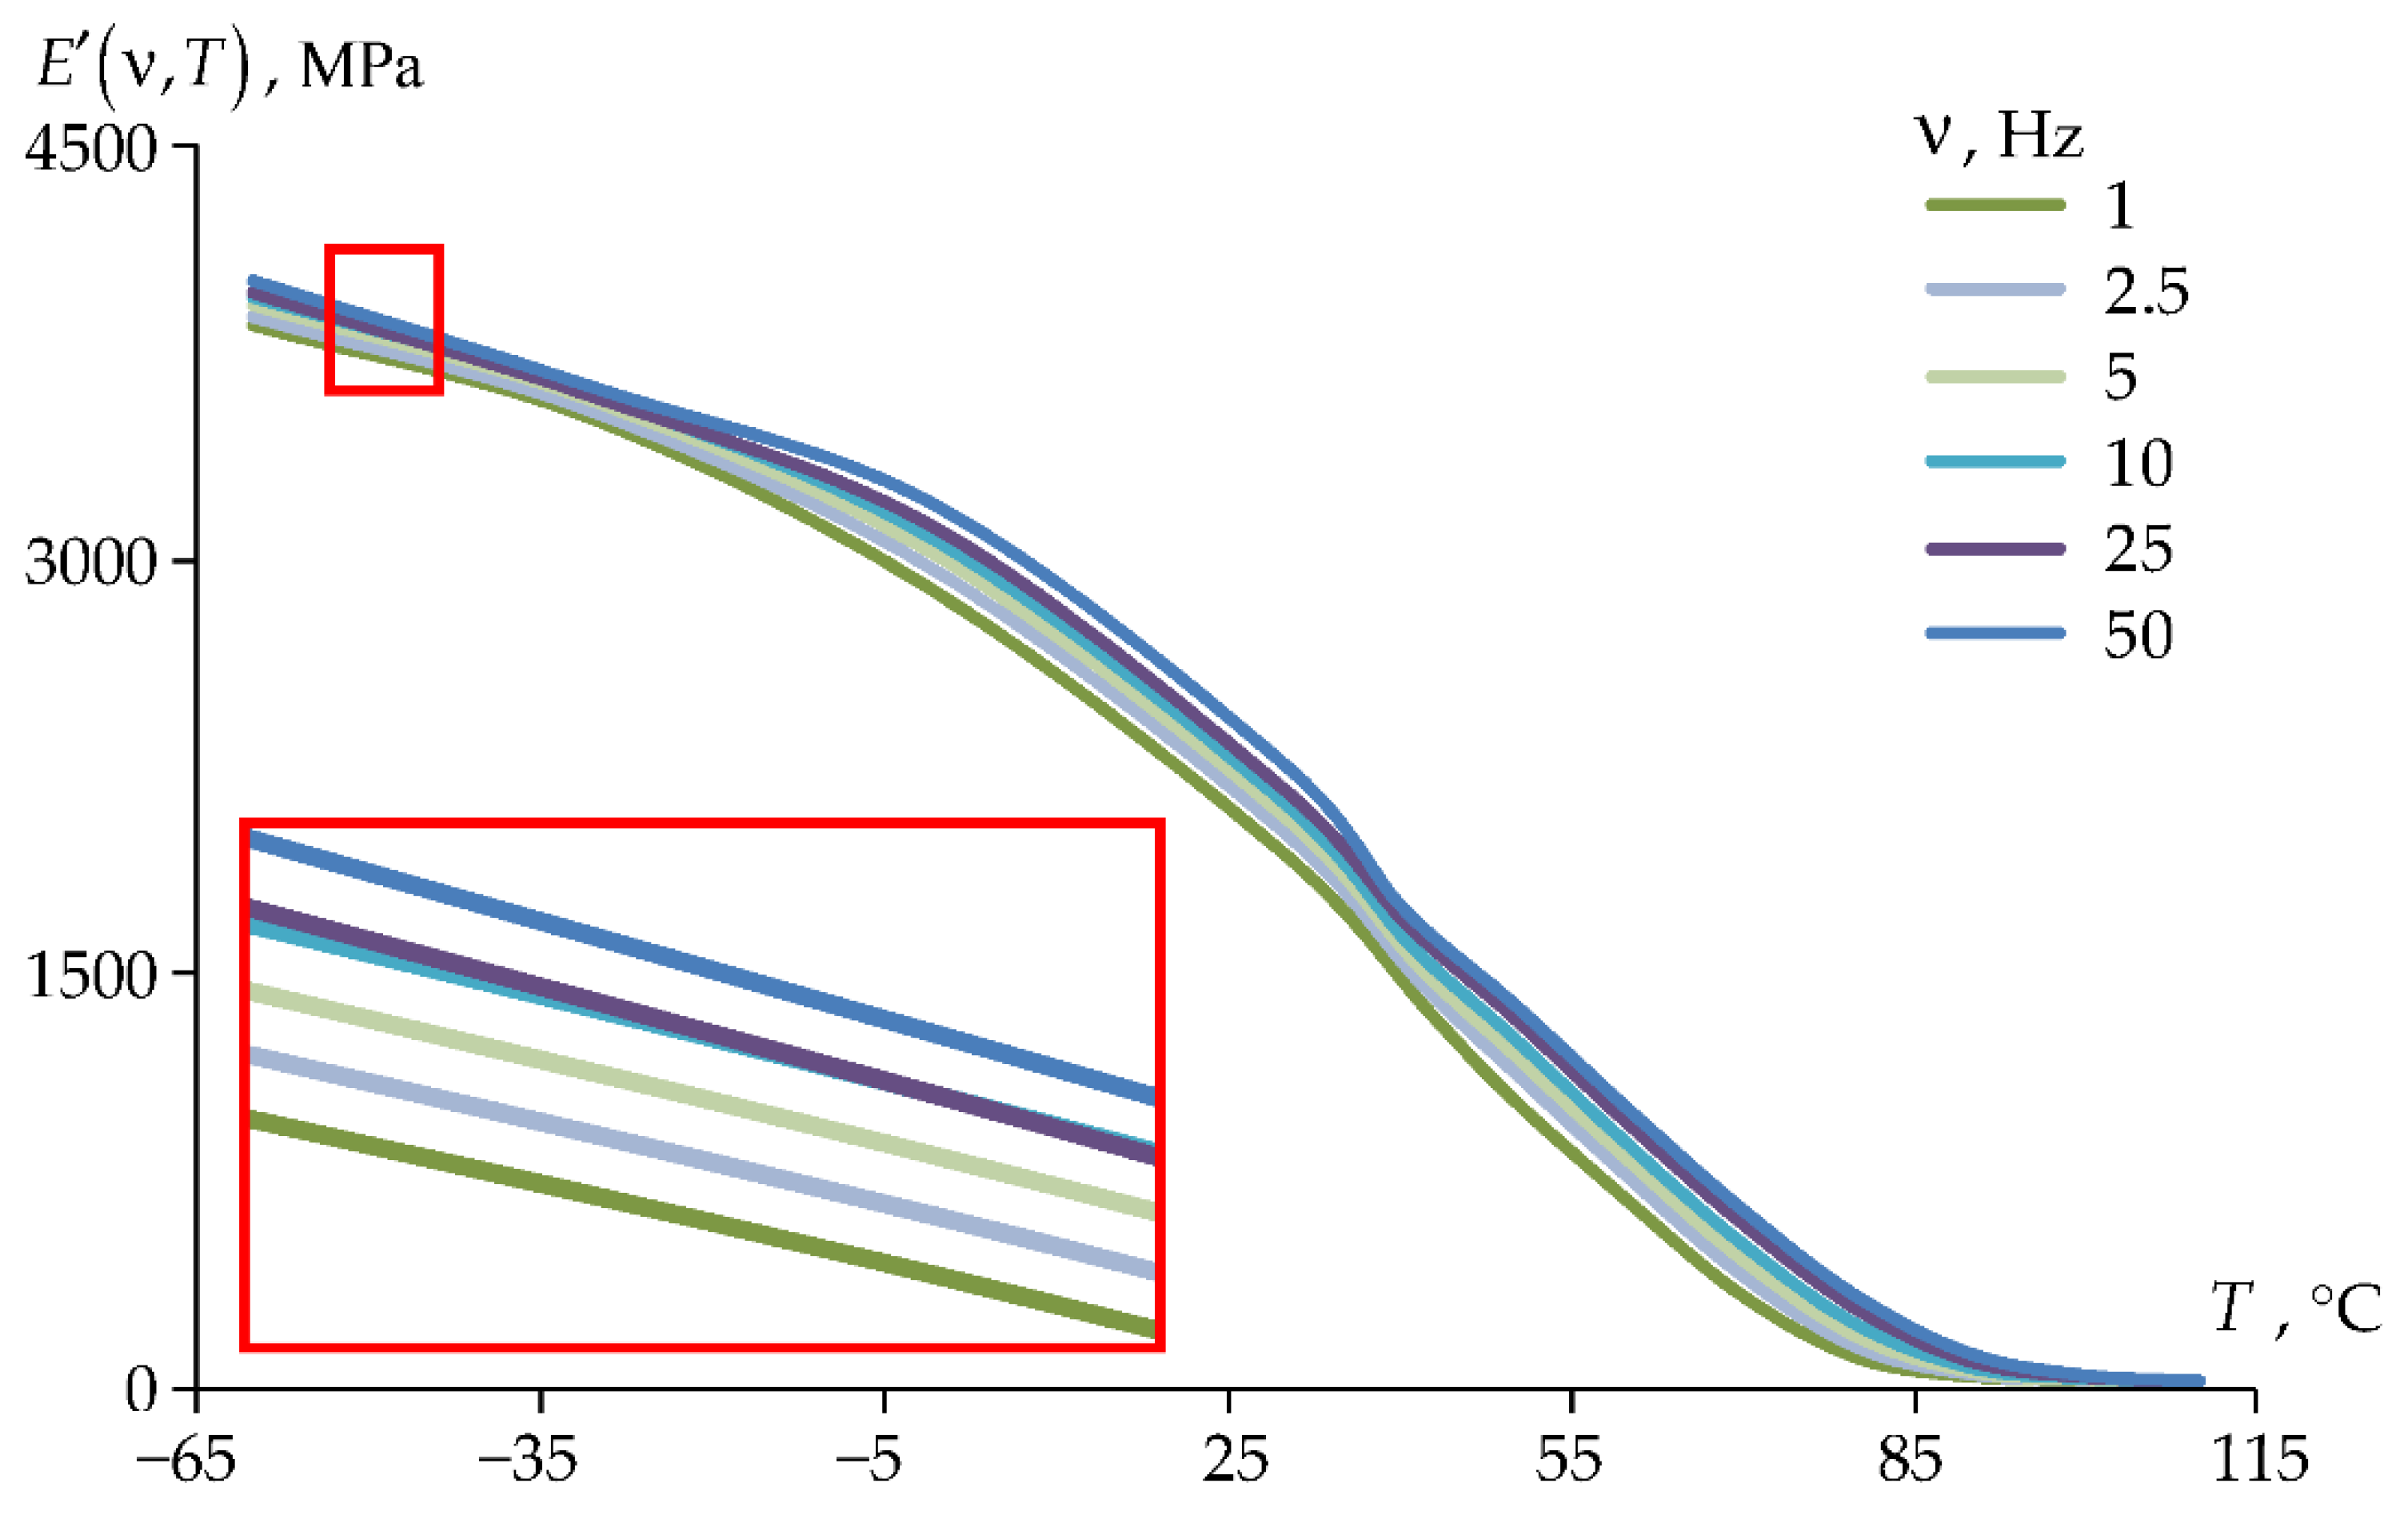
Figure 16.
Dependencies of the maximum stress intensity in the external protective coating: a is dependence on time; b is dependence on temperature. Red line is cycle 1; black line is cycle 2; green line is cycle 3; dashed line is constant TEC; solid line is temperature-variable TEC.
Figure 16.
Dependencies of the maximum stress intensity in the external protective coating: a is dependence on time; b is dependence on temperature. Red line is cycle 1; black line is cycle 2; green line is cycle 3; dashed line is constant TEC; solid line is temperature-variable TEC.
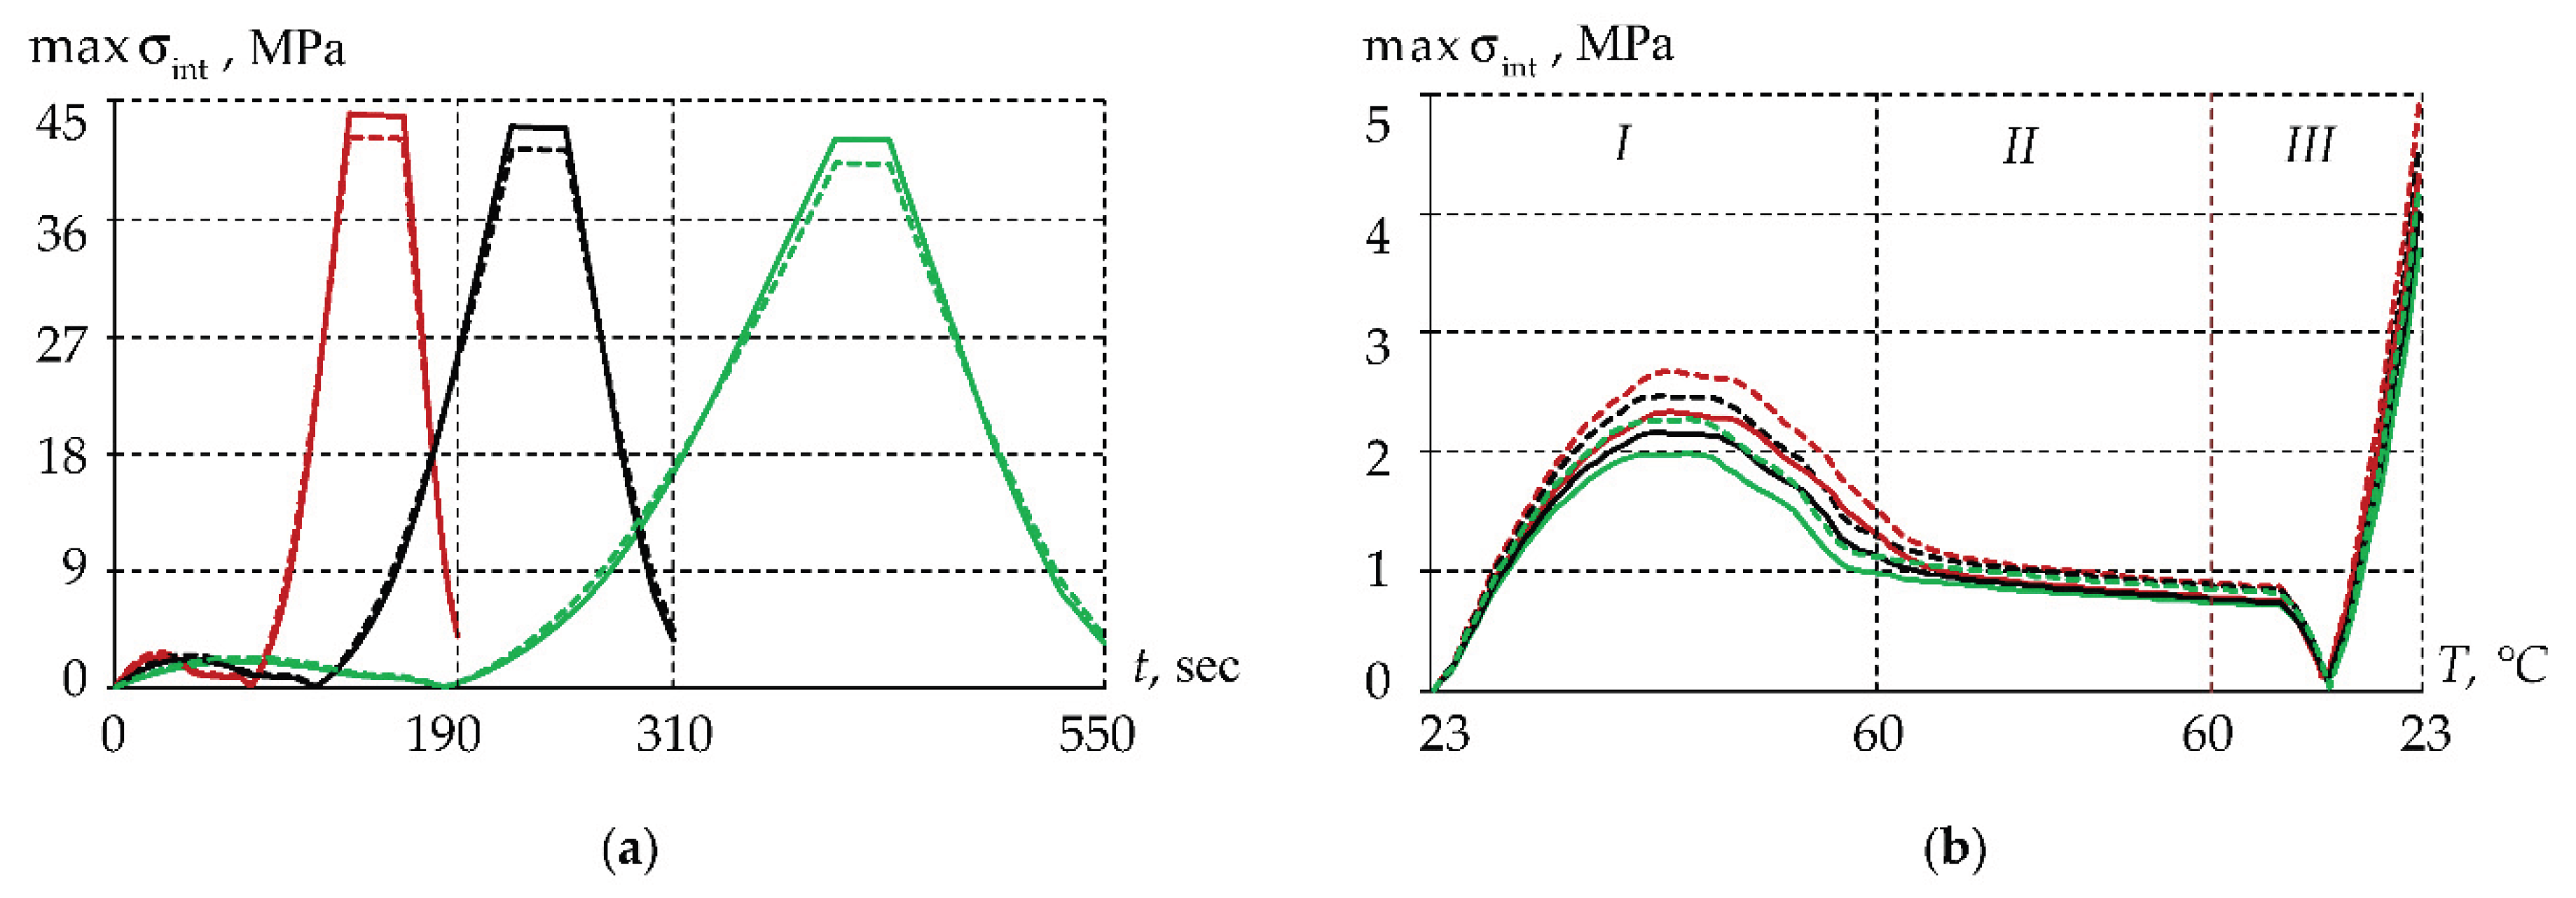
Figure 17.
Dependencies of the maximum stress intensity in the inner protective coating: a is dependence on time; b is dependence on temperature; red line is cycle 1; black line is cycle 2; green line is cycle 3. Dashed line is constant TEC; solid line is temperature-variable TEC.
Figure 17.
Dependencies of the maximum stress intensity in the inner protective coating: a is dependence on time; b is dependence on temperature; red line is cycle 1; black line is cycle 2; green line is cycle 3. Dashed line is constant TEC; solid line is temperature-variable TEC.
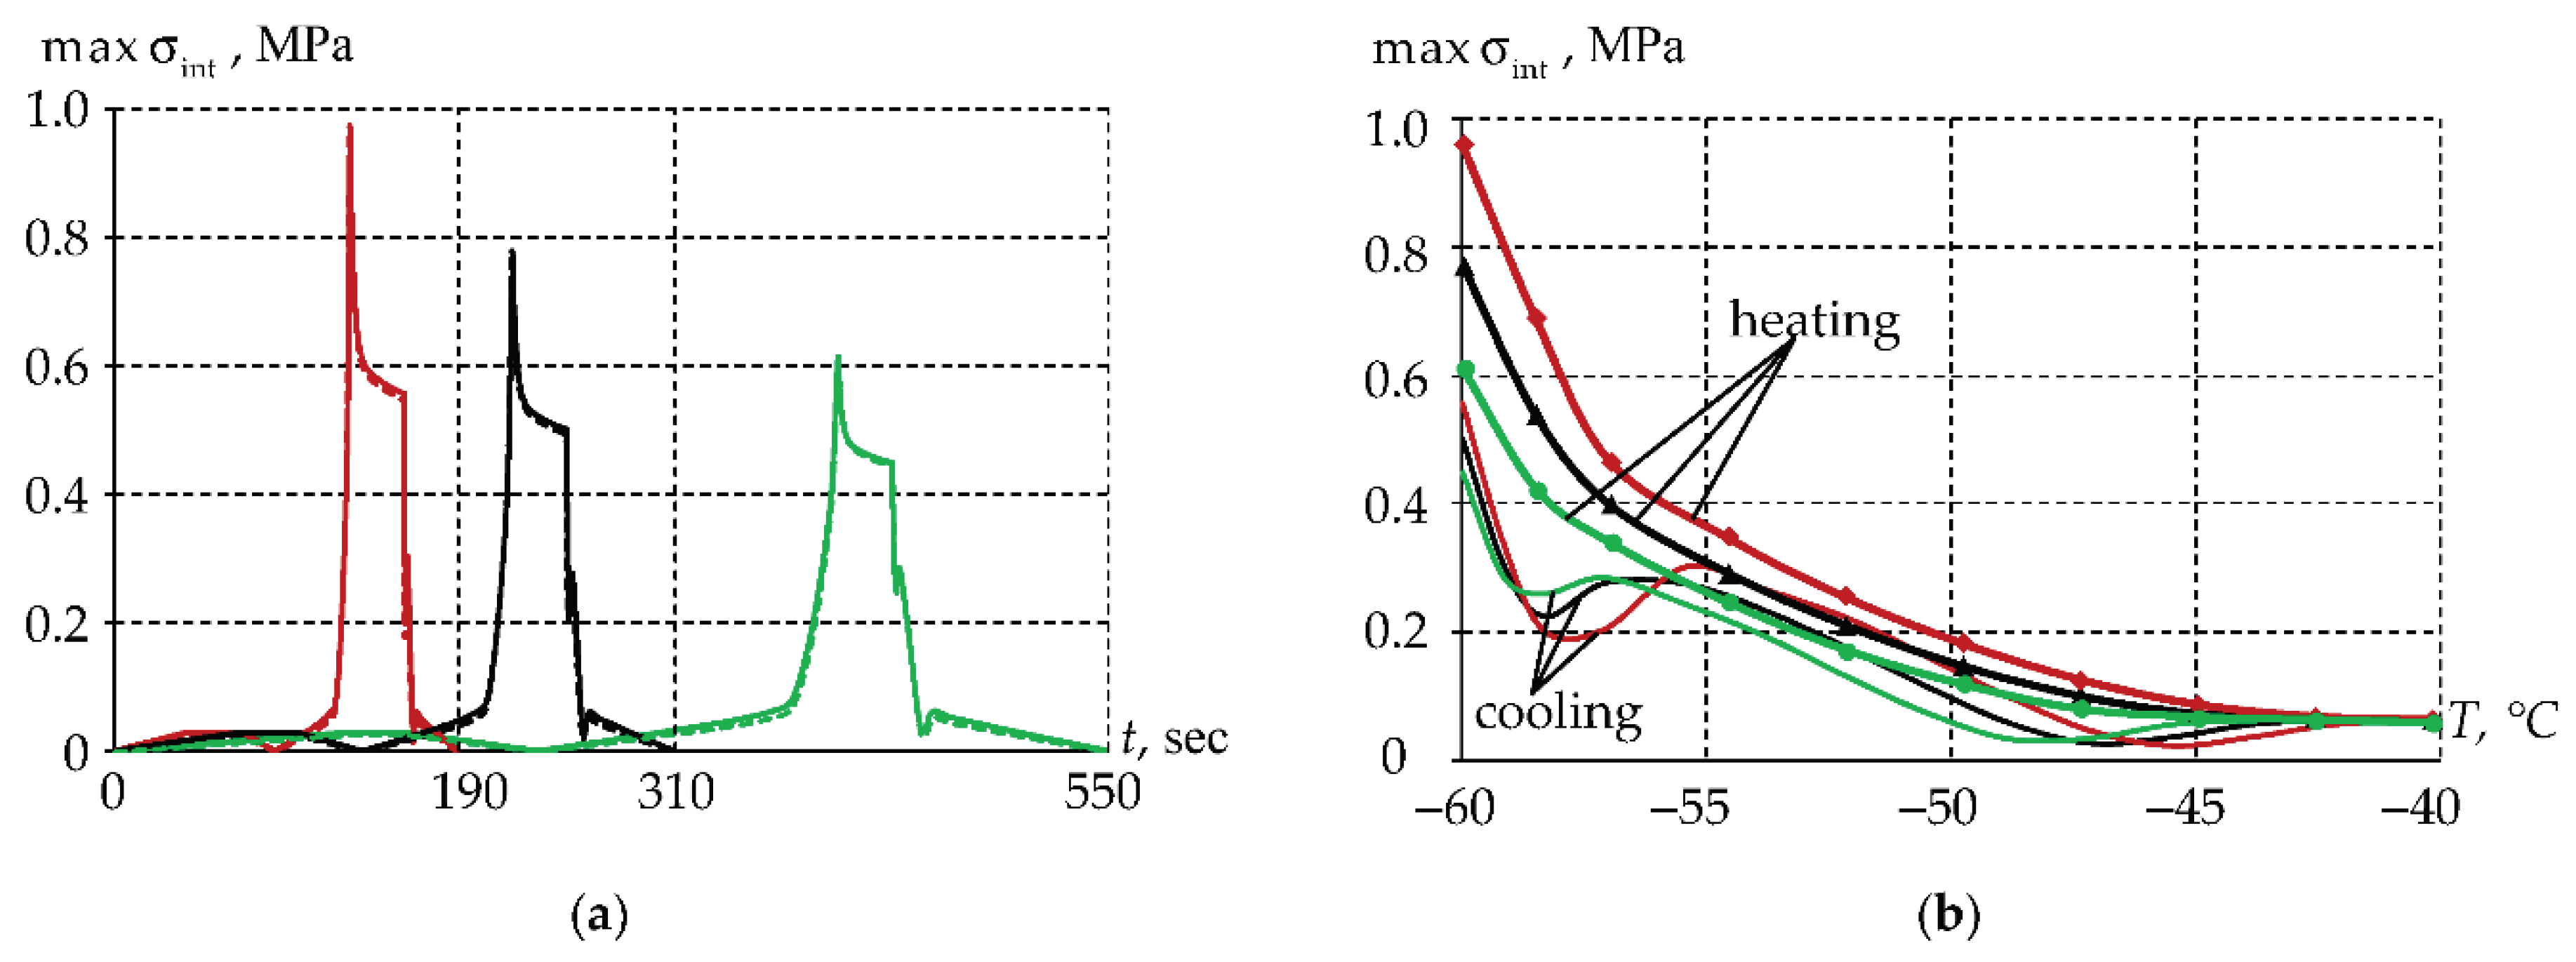
Table 4.
Material constants of the generalized Maxwell model for DeSolite DS-2015.
| 1 | 4.86×10⁻³ | 1.03×10⁻²³ | 16 | 3.35×10⁻² | 6.99×10⁻²¹ | 31 | 2.08×10⁻⁴ | 4.76×10⁻¹³ | 46 | 3.38×10⁻³ | 3.24×100 |
| 2 | 1.29×10⁻² | 1.11×10⁻²³ | 17 | 2.98×10⁻² | 1.63×10⁻²⁰ | 32 | 4.45×10⁻³ | 2.39×10⁻¹² | 47 | 1.04×10⁻¹ | 3.50×101 |
| 3 | 3.59×10⁻³ | 1.26×10⁻²³ | 18 | 3.73×10⁻³ | 3.98×10⁻²⁰ | 33 | 7.41×10⁻³ | 1.26×10⁻¹¹ | 48 | 1.49×10⁻² | 3.98×10² |
| 4 | 2.10×10⁻⁴ | 1.51×10⁻²³ | 19 | 1.01×10⁻² | 1.03×10⁻¹⁹ | 34 | 2.21×10⁻² | 6.99×10⁻¹¹ | 49 | 3.46×10⁻² | 4.76×10³ |
| 5 | 4.25×10⁻² | 1.90×10⁻²³ | 20 | 2.34×10⁻² | 2.78×10⁻¹⁹ | 35 | 3.33×10⁻² | 4.08×10⁻¹⁰ | 50 | 3.49×10⁻² | 5.99×10⁴ |
| 6 | 2.73×10⁻³ | 2.51×10⁻²³ | 21 | 6.15×10⁻³ | 7.94×10⁻¹⁹ | 36 | 2.87×10⁻³ | 2.51×10⁻⁹ | 51 | 3.28×10⁻² | 7.94×10⁵ |
| 7 | 5.56×10⁻³ | 3.50×10⁻²³ | 22 | 9.26×10⁻³ | 2.39×10⁻¹⁸ | 37 | 2.04×10⁻² | 1.63E×10−8 | 52 | 3.62×10⁻² | 1.11×10⁷ |
| 8 | 2.64×10⁻² | 5.14×10⁻²³ | 23 | 2.94×10⁻² | 7.55×10⁻¹⁸ | 38 | 7.08×10⁻³ | 1.11×10⁻⁷ | 53 | 3.50×10⁻² | 1.63×10⁸ |
| 9 | 5.99×10⁻⁵ | 7.94×10⁻²³ | 24 | 5.20×10⁻³ | 2.51×10⁻¹⁷ | 39 | 2.68×10⁻² | 7.94×10⁻⁷ | 54 | 3.37×10⁻² | 2.51×10⁹ |
| 10 | 7.64×10⁻³ | 1.29×10⁻²² | 25 | 2.28×10⁻³ | 8.80×10⁻¹⁷ | 40 | 6.81×10⁻⁴ | 5.99×10⁻⁶ | 55 | 1.42×10⁻² | 4.08×10¹⁰ |
| 11 | 1.74×10⁻² | 2.21×10⁻²² | 26 | 4.68×10⁻² | 3.24×10⁻¹⁶ | 41 | 1.31×10⁻³ | 4.76×10⁻⁵ | 56 | 7.62×10⁻³ | 6.99×10¹¹ |
| 12 | 5.14×10⁻³ | 3.98×10⁻²² | 27 | 3.96×10⁻² | 1.26×10⁻¹⁶ | 42 | 6.85×10⁻³ | 3.98×10⁻⁴ | 57 | 1.86×10⁻³ | 1.26×10¹³ |
| 13 | 8.18×10⁻³ | 7.55×10⁻²² | 28 | 2.22×10⁻² | 5.14×10⁻¹⁵ | 43 | 5.09×10⁻² | 3.50×10⁻³ | 58 | 1.11×10⁻³ | 2.39×10¹⁴ |
| 14 | 1.24×10⁻² | 1.51×10⁻²¹ | 29 | 2.10×10⁻³ | 2.21×10⁻¹⁴ | 44 | 6.82×10⁻³ | 3.24×10⁻² | 59 | 3.26×10⁻⁴ | 4.76×10¹⁵ |
| 15 | 3.28×10⁻³ | 3.16×10⁻²¹ | 30 | 1.39×10⁻³ | 1.00×10⁻¹³ | 45 | 3.36×10⁻² | 3.16×10⁻¹ | 60 | 5.48×10⁻⁵ | 1.00×10¹⁷ |
Table 5.
Stress intensity reduction values in zone III.
| TEC | cycle 1 | cycle 2 | cycle 3 |
| 76.83% | 57.35% | 38.28% | |
| 72.49% | 54.26% | 36.31% |
Disclaimer/Publisher’s Note: The statements, opinions and data contained in all publications are solely those of the individual author(s) and contributor(s) and not of MDPI and/or the editor(s). MDPI and/or the editor(s) disclaim responsibility for any injury to people or property resulting from any ideas, methods, instructions or products referred to in the content. |
© 2025 by the authors. Licensee MDPI, Basel, Switzerland. This article is an open access article distributed under the terms and conditions of the Creative Commons Attribution (CC BY) license (http://creativecommons.org/licenses/by/4.0/).
Copyright: This open access article is published under a Creative Commons CC BY 4.0 license, which permit the free download, distribution, and reuse, provided that the author and preprint are cited in any reuse.


