
Submitted:
18 November 2025
Posted:
20 November 2025
You are already at the latest version
Abstract
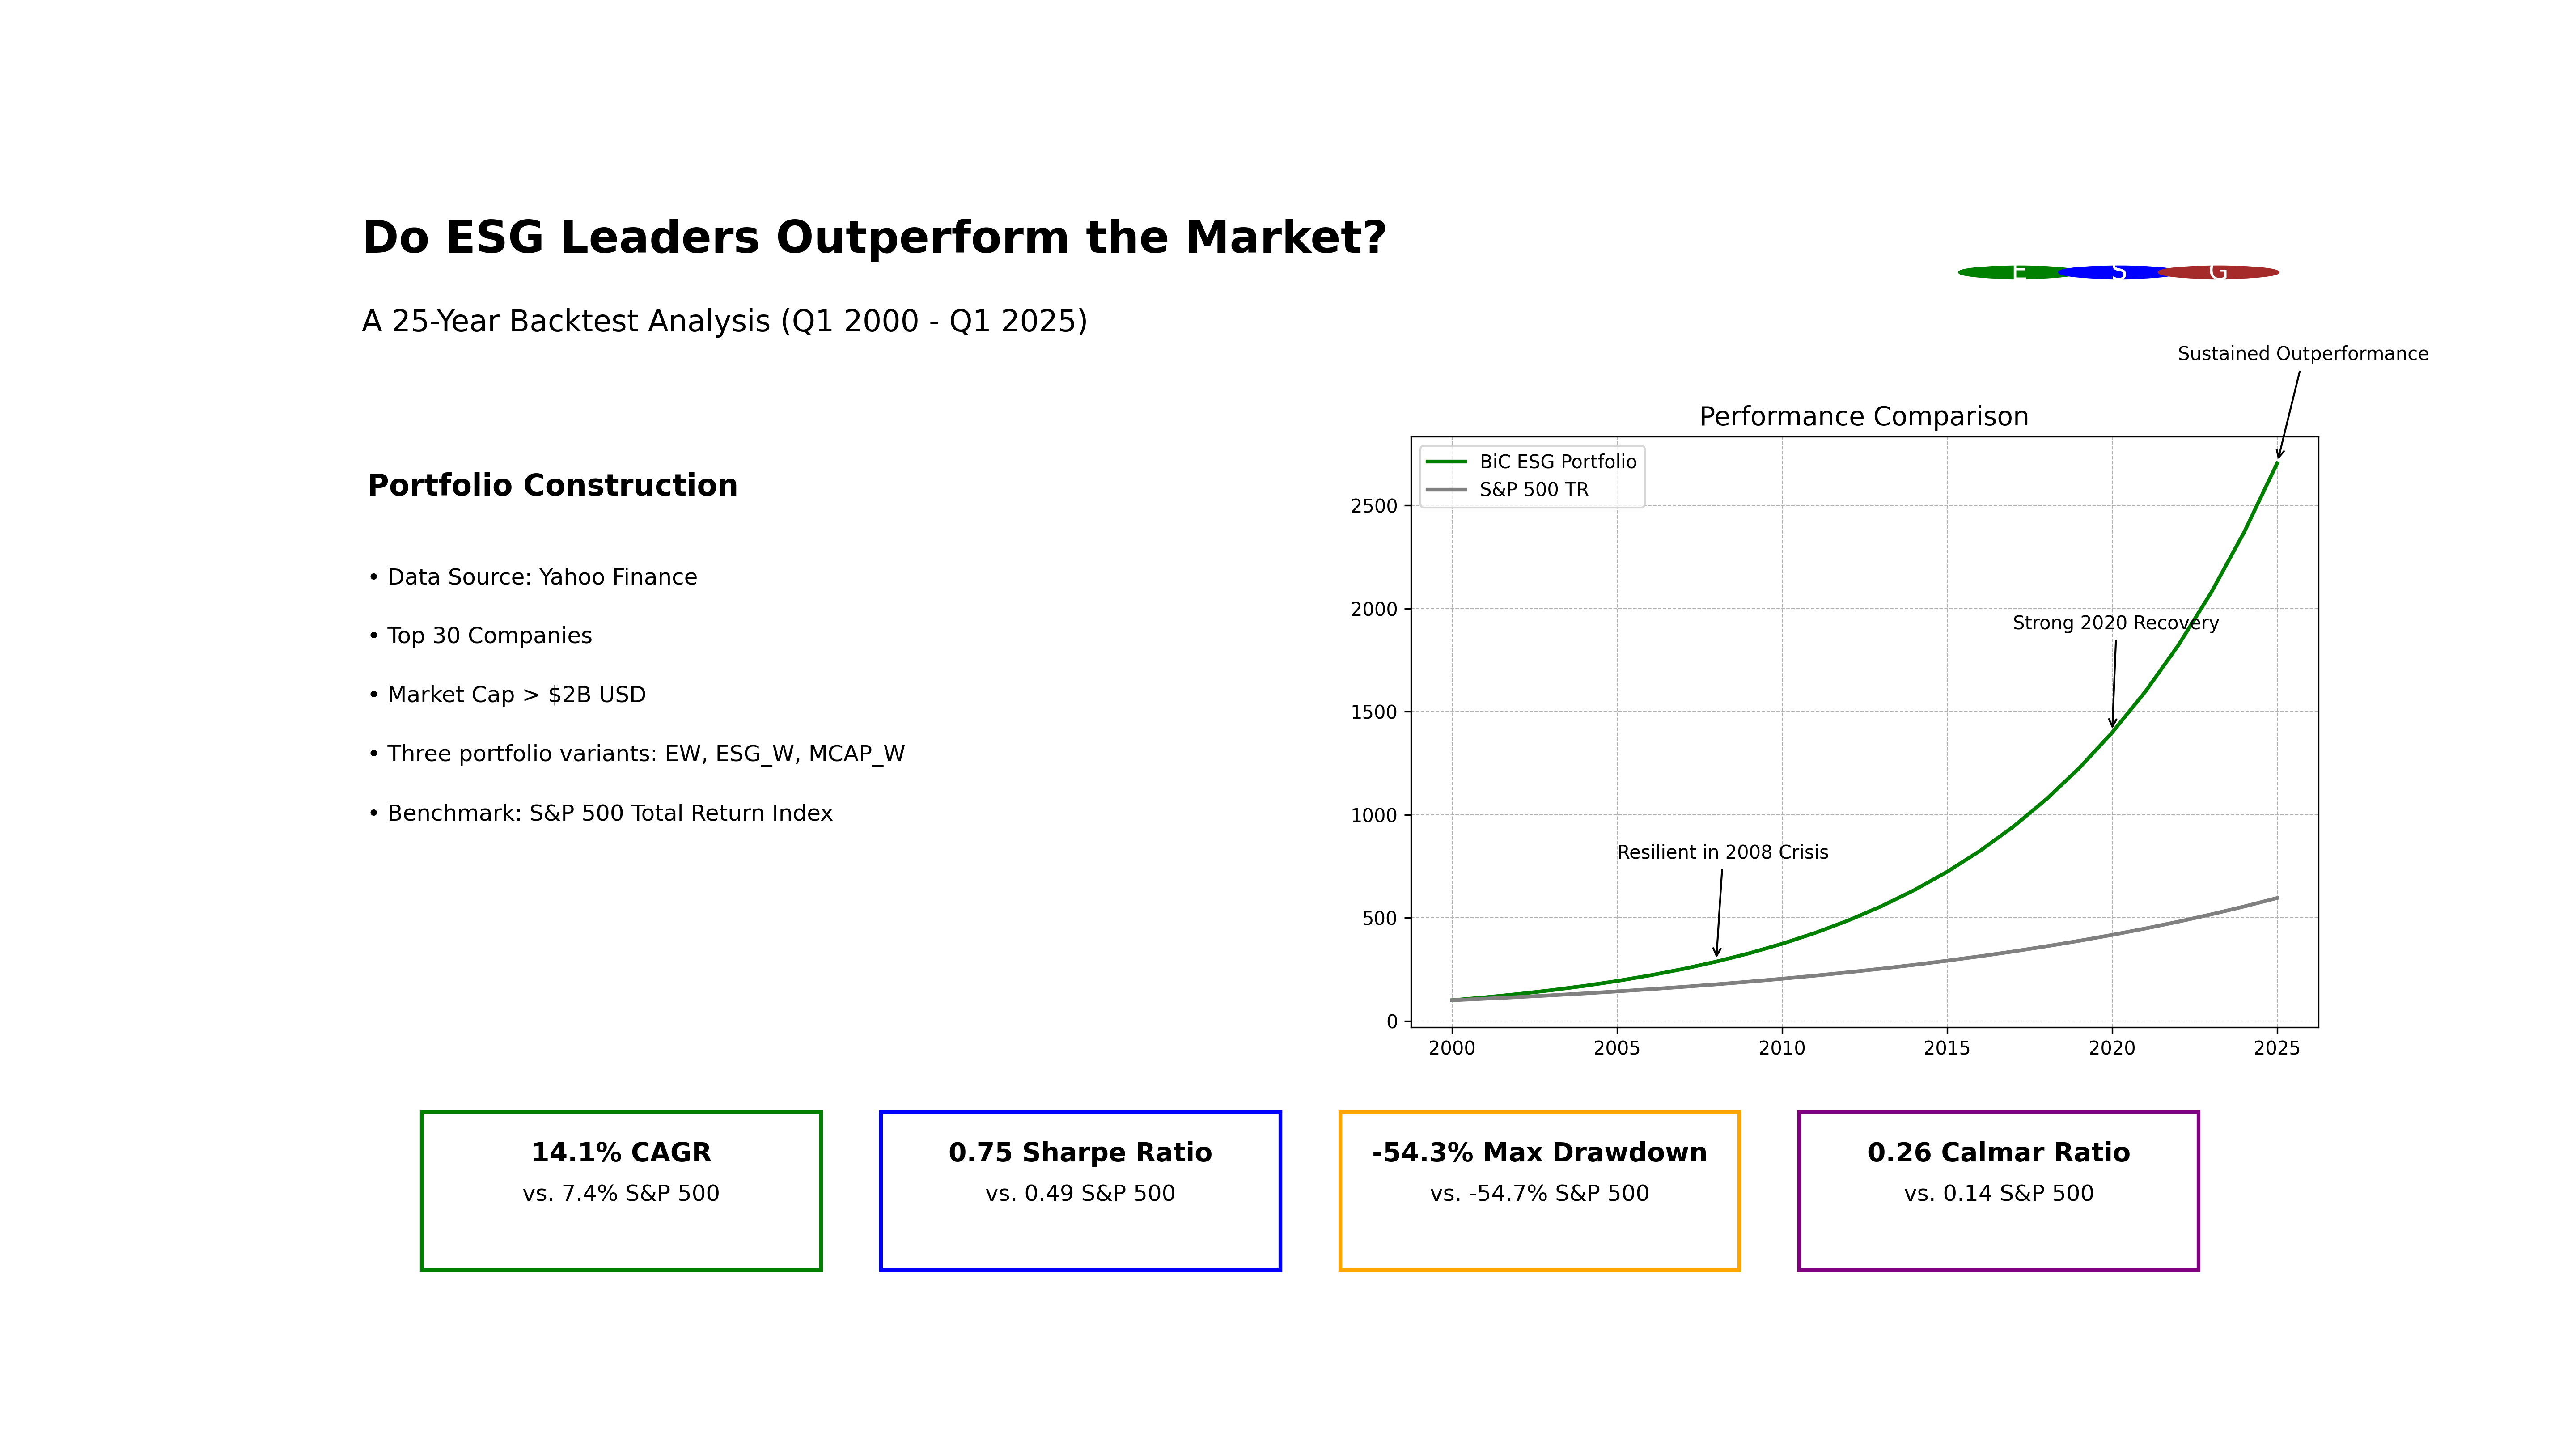
In the context of the growing prominence of socially responsible investment, the debate over whether sustainable corporate practices translate into sustained shareholder value has intensified. As a key tool for aligning their investment portfolios with responsible/sustainable corporate practices, investors rely on listed companies’ Environmental, Social, and Governance (ESG) ratings. This study aims to investigate the long-term impact of ESG practices on the stock performance of listed companies. We perform a Q1 2000 – Q1 2025 backtest to analyse the comparative performance of a Best-in-Class ESG portfolio, constructed by the top 30 listed companies with market capitalisations above USD 2 billion ranked by Morningstar Sustainalytics’ ESG Risk Ratings as of 31 March 2025 against the S&P 500 Total Return index. We found that ESG leaders exhibited superior risk-adjusted performance, outperforming the S&P 500 Total Return Index. The Best-in-Class portfolios achieved a substantially higher CAGR and Sharpe ratio, while maintaining maximum drawdowns that remained comparable to the benchmark S&P 500 Total Return index. We also found that ESG advantages were more pronounced in market downturns, with the Best-in-Class ESG portfolio showing better CAGR and Sortino ratios. The findings of this study demonstrate that responsible governance and management create benefits for all stakeholders, including investors, society and nature, in the broadest sense of these terms.
Keywords:
environmental
; social
; and governance (ESG) principles
; ESG ratings
; stock market
; corporate financial performance
; portfolio management
; sustainable investment
; socially responsible investment
; corporate governance
; sustainability
1. Introduction
In recent years, sustainability concerns have attained heightened significance across diverse domains of public life and the economy. Environmental, Social, and Governance (ESG) principles have been established as a critical factor for evaluating corporate governance, strongly influencing companies’ sustainable development and operations, risk exposure, and long-term value creation (Bamford et al., 2026; Bani-Khaled et al., 2025; Berg et al., 2022; Christensen et al., 2022; Del Gesso, & Lodhi, 2025), regardless of size or (un)profitability scope of the company (Štrukelj & Dankova, 2025; Štrukelj et al., 2020; 2023). This shift reflects an extensive transformation on a global economic plane, where regulators, investors, and stakeholders are increasingly demanding greater accountability, transparency, integrity and ethical conduct from companies (Atz et al., 2022; Pedersen et al., 2021; Weiss, 2021; Zdolšek et al., 2022).
The focus on sustainability has attracted the interest of investors, with a greater amount of assets being directed towards sustainable investing. A growing number of investors are taking into consideration the United Nations' Sustainable Development Goals (SDGs) when constructing their portfolios, with a particular emphasis on Climate Action (SDG 13) and Affordable and Clean Energy (SDG 7), thus recognizing that addressing global challenges can create long-term value while also contributing to societal welfare (Arora & Sarker, 2023; Bekaert et al., 2023; US SIF, 2024). As a key tool for aligning their investment portfolios with responsible governance, strategies, and practices, investors rely on ESG ratings (Berg et al., 2022). It is evident that all investors, including those who prioritise sustainability, seek to achieve a favourable return on their investments. Thus, the relationship between ESG ratings and corporate financial performance has become increasingly central to both investment practice and academic research.
As the global value of ESG assets is rising, and as the tendency for incorporating sustainability considerations into the financial decision-making process is increasing, it is becoming ever more essential to understand the role of ESG ratings in corporate financial results and their implications for policymakers, investors, and corporate directors/managers (Friede et al., 2015; Nian & Said, 2025). The present study aims to investigate the long-term impact of Environmental, Social, and Governance (ESG) practices on the stock performance of listed companies. To address this, we pose the following research question: Do cumulative ESG practices of listed companies affect their stock market valuations over the 2000–2025 period? We analyse the comparative performance of a Best-in-Class (BiC) ESG portfolio, constructed by the top 30 listed companies ranked by their Morningstar Sustainalytics’ ESG Risk Ratings as of March 31, 2025, against the S&P 500 Total Return index. We design a robust framework to examine the long-term association between ESG leadership and market valuation to perform a Q1 2000 – Q1 2025 backtest.
In Section 2 of this article, the authors present the theoretical background, including the Environmental, Social, and Governance (ESG) concept, ESG ratings, sustainable investment, relationship between ESG ratings and corporate financial performance, and formulate two hypotheses. Section 3 delineates the methodological framework employed in the study, including data and asset universe, portfolio construction, evaluation periods, performance metrics, and robustness check. The main findings are presented and discussed in detail in Section 4, followed by Section 5, where conclusions and research recommendations are outlined.
2. Theoretical Background
Environmental, Social, and Governance (ESG) is a holistic framework that measures corporate ethical and sustainability standards beyond financial indicators (Li et al., 2021; Linnenluecke, 2022). First introduced by the United Nations Global Compact in 2004, ESG has become a central pillar of corporate governance, strategies, business practice and investment decision-making. It aims to guide organisations to operate responsibly across three key domains: environmental responsibility, social equity via social responsibility, and governance integrity for financial stability.
From a theoretical standpoint, ESG can be best understood through several complementary theories. The stakeholder theory posits that, in order to maintain legitimacy and long-term success, companies must consider the interests of all their various stakeholders, rather than only those of their shareholders (Freeman, 1984; Freeman, 2010; Freeman et al., 2010; see also Bottenberg et al., 2017; Carroll & Brown, 2022; Civera et al., 2023; Weiss, 2021). This standpoint supports the prevailing principles of ESG by highlighting the interdependence between corporate actions and their societal outcomes. The legitimacy theory posits that ESG practices can assist organisations in aligning with societal norms and expectations, thereby acquiring social permission to operate (Del Gesso & Lodhi, 2025; O'Donovan, 2002). The agency theory offers a financial perspective, positing that ESG disclosures can reduce information asymmetry and diminish agency conflicts between managers and investors (Bani-Khaled et al., 2025; Rau & Yu, 2024).
The primary instruments utilised by professionals to assess corporate sustainability performance are ESG ratings, which measure and quantify a company’s exposure to environmental, social, and governance risks, as well as its ability to manage those risks effectively. In the context of financial decision-making, investors apply ESG ratings to complement traditional financial metrics and gain insights into long-term resilience and ethical alignment. Major ESG ratings providers include MSCI, Morningstar Sustainalytics, S&P Global, LSEG, Moody's ESG, ISS ESG, Bloomberg, and CDP (Berg et al., 2022; Christensen et al., 2022; Gibson et al., 2021). The methodologies employed by these rating agencies are distinctive in nature with regard to the assessment of environmental, social, and governance dimensions (Avramov et al., 2022; Billio et al., 2021; Chatterji et al., 2016).
ESG ratings can be examined through the prism of the information asymmetry theory. In markets where sustainability data is non-transparent or fragmented, ratings help reduce uncertainty by providing investors with credible information (Christensen et al., 2022). However, whether the transmission of information would be efficient would be contingent upon the transparency and rigour of the rating methodology. Critics argue that the lack of transparency of ESG rating models can unintentionally enable greenwashing, where companies receive favourable ratings despite engaging in questionable practices. Regulators are becoming increasingly engaged in addressing these challenges. For example, to foster trust and consistency across the market, the European Commission has proposed measures to increase transparency and oversight of ESG rating providers (European Commission, 2023). These developments reflect a broader shift towards accountability and standardisation in the ESG landscape.
Sustainable investment signifies a considerable transformation in the way investors evaluate prospects, transcending conventional financial metrics to encompass a more comprehensive evaluation of societal and environmental ramifications within the framework of decision-making processes. Sustainable investment involves a variety of investment approaches that integrate ESG factors alongside traditional financial analysis in portfolio selection and management (Berry & Junkus, 2013; Camilleri, 2021; Global Sustainable Investment Alliance, 2022). Various terms are used interchangeably to refer to sustainable investment, including socially responsible investing, ethical investing, responsible investing, impact investing, and ESG investing (Capelle-Blancard & Monjon, 2021; Kräussl et al., 2024).
The launch of the Domini 400 Social Index (subsequently MSCI KLD 400) in 1990 provided the first comprehensive benchmark for socially responsible equity performance, thus marking a crucial step towards mainstreaming sustainable investment (Kurtz, 2005). In the following years, sustainable investment evolved into a mainstream investment approach, with a significant turning point in 2006 by the launch of the United Nations Principles for Responsible Investment (UNPRI, 2006), which provided a globally recognised framework for incorporating ESG factors into investment processes. As of March 2024, the organisation had 5,345 signatories (comprising 4,827 investors and 518 service providers) representing approximately USD 128.4 trillion in assets under management (UNPRI, 2024).
Sustainable investment acknowledges the significance of ESG issues as material factors with the potential to influence long-term portfolio performance (UNPRI, 2023), and it has been shown to exhibit a favourable correlation between the generation of financial returns and the contribution to positive societal outcomes (Bekaert et al., 2023; Flammer, 2021). A number of studies have documented the finding that green companies generate lower returns than brown companies, consistent with equilibrium models that predict lower returns for high-ESG assets due to investor preferences (Baker et al., 2022; Bolton & Kacperczyk, 2021; Hsu et al., 2023; Zerbib, 2020). Other research supports that ESG integration can enhance long-term financial performance through various channels, including improved innovation capacity, enhanced employee retention and motivation, increased resilience during crises, and lower cost of capital (Eccles et al., 2014; Flammer, 2021; Friede et al., 2015).
A substantial body of research has been conducted on the correlation between ESG ratings and corporate financial performance (Sun & Zhao, 2024). A significant positive correlation was found between ESG performance and Return on Equity (ROE), Return on Assets (ROA), and market valuations in an extensive study of Shanghai and Shenzhen A-share listed companies from 2011 to 2020 (Zhang, 2025). A 1% increase in ESG ratings has been found to improve the productivity level of manufacturing companies by 0.124%, providing empirical evidence that ESG is financially material (Ding & Lee, 2024). A comprehensive review of 3,332 listed companies over the 2011–2020 period has also revealed positive correlations between ESG scores and company performance across various industries (Chen et al., 2023). A mediation analysis reveals that ESG ratings improve company performance by mitigating financing constraints (Gong et al., 2025).
The construction of sustainable investment portfolios is a matter of some complexity, and recent evidence provides nuanced guidance on the matter. ESG screening approaches – negative screening excluding controversial industries versus positive screening selecting ESG leaders – generate different risk-return profiles (Bennani et al., 2018; Cornell, 2021).
As Atz et al. (2022) discovered, ESG investing provides asymmetric benefits, particularly during social or economic crises. Furthermore, Broadstock et al. (2020) found that ESG performance mitigates financial risk during a financial crisis. Corporate governance mechanisms and transparency also play a vital role in this context (Li et al., 2022). Risk-adjusted return analyses reveal that correlation between ESG ratings and Sharpe ratios turned significantly positive in recent years, particularly when removing lowest-rated stocks, indicating that excluding ESG laggards improves risk-adjusted performance (Friede et al., 2015; Liang & Renneboog, 2020). Dynamic portfolio strategies responding to ESG rating changes rather than static ESG levels may enhance performance (Berg et al., 2020; Gibson et al., 2020). Given the asymmetric effects of rating changes – downgrades generating significant negative returns while upgrades produce modest positive effects – investors should prioritize avoiding downgrades over chasing upgrades (Murata & Hamori, 2021; Serafeim & Yoon, 2023).
In accordance with the research question stipulated in the Introduction section and the theoretical framework delineated in this section, the authors have formulated the following two hypotheses:
H1: Listed companies with best ESG ratings do not underperform the S&P 500 Total Return benchmark in long-run risk-adjusted returns.
H2: ESG advantages are more pronounced in market downturns.
The attainment of a high ESG rating is a long-term process that necessitates a considerable investment of time and financial resources on the part of the company. Consequently, it can be assumed that companies with high ESG ratings as of 31 March 2025 have invested in ESG over the years. This study is intentionally designed as a retrospective test anchored in 2025. First, we identify the ESG leaders as of 31 March 2025, and then we trace their market performance back to 1 January 2000. We do not seek to simulate an investor's ex ante decisions as made in 2000; rather, we examine whether companies that ultimately emerge as ESG leaders exhibit a pattern of superior market performance over the long term. Thus, we test the persistence and market recognisability of ESG leadership rather than the historical tradability of ESG signals.
3. Materials and Methods
This research is structured as a backward-looking analysis based in 2025. The methodology employed in this study begins with the identification of ESG frontrunners as of 31 March 2025, followed by a retrospective evaluation of their market performance starting from 1 January 2000 onwards. The objective is not to replicate an investor's forward-looking choices from 2000, but rather to ascertain whether companies that eventually emerge as ESG leaders demonstrate consistent outperformance in the market over the long term. We assess the durability and market acknowledgment of ESG leadership, as opposed to the past practicality of ESG indicators for investment purposes.
Data and Asset Universe
In this study, we backtest a Best-in-Class (BiC) ESG portfolio, constructed from the top 30 companies ranked by their Morningstar Sustainalytics’ ESG Risk Ratings as of 31 March 2025 (Table 1), and we compare its performance to the S&P 500 Total Return index (SPX_TR). We choose the S&P 500 Total Return Index as the benchmark because it accounts for both capital gains and dividends, providing a comprehensive measure of market performance.
The asset universe covers publicly traded companies with Morningstar Sustainalytics’ ESG Risk Ratings and market capitalizations above USD 2 billion as of 31 March 2025, to emphasize on liquidity and data quality while minimizing small-cap biases. Additionally, we restrict the selection to companies with stock price history starting no later than 1 January 2000, as verified through adjusted close prices from Yahoo Finance. This ensures comprehensive coverage of the backtest period and mitigates survivorship issues from subsequent listings. We use weekly returns for calculation of the portfolio metrics, derived by aggregating daily adjusted Friday’s closes.
Portfolio Construction
The BiC portfolio consists of the fixed top 30 constituents, ranked by Morningstar Sustainalytics’ ESG Risk Ratings as of 31 March 2025, with the base case being an Equally Weighted (EW) portfolio, allocating wi= 1/N to each (approximately 3.33%), where N is the number of companies in the portfolio (N = 30). This straightforward method (DeMiguel et al., 2009) serves as our primary perspective, emphasizing the ESG selection without introducing size or score-based biases. For a robustness check, we incorporate two variants into our analysis:
- ESG-Weighted (ESG_W), where wi= , to further emphasize the effect of the higher-rated companies and test the effects of sustained ESG integration driving performance;
- Market Cap-Weighted (MCAP_W), where wi = , to assess size-related influences similar to those in broad market indices like the S&P 500 Total Return Index (SPX_TR) and ensure the ESG-driven returns are not solely due to equal weighting.
Evaluation Periods
The backtest period covers the span from1 January 2000 to 31 March 2025, using weekly data obtained from Yahoo Finance adjusted Friday closing prices. We use the yfinance and pandas libraries to evaluate the full period and non-overlapping five-year subperiods (2000–2004, 2005–2009, 2010–2014, 2015–2019, 2020–2024), plus a partial 2025 segment (January–March). These timeframes, selected to reflect critical market regimes such as the dot-com crash of 2000–2002, the 2008 global financial crisis, the post-crisis recovery from 2010 to 2014, the low-interest-rate growth phase of 2015–2019, and the COVID-19 pandemic with its subsequent recovery from 2020 to 2024, provide a robust framework for assessing ESG performance resilience across diverse economic conditions. The 2025 segment incorporates the most recent data to align with the static weighting derived from Morningstar Sustainalytics’ ESG Risk Ratings as of 31 March 2025.
The construction of our Best-in-Class (BiC) ESG portfolio is based on the modern portfolio theory (Elton & Gruber, 1995; Markowitz, 1959) and is consistent with meta-analytic evidence of positive links between ESG and financial performance (Friede et al., 2015). We extend modern portfolio theory by incorporating ESG factors as a non-diversifiable risk that influences long-term financial performance and cost of capital.
Performance Metrics
For each portfolio and time window within the backtest spanning 1 January 2000 to 31 March 2025, standard return and risk measures are computed from weekly returns, with annualization applied using a factor of √52, reflecting the typical number of trading weeks in a year:
- Compound Annual Growth Rate (CAGR) serves as a key metric, representing the geometric average growth of capital over the sample period, assuming full reinvestment (Merton, 1980). It converts the total period return into an equivalent per-year % rate and is path-independent:
CAGR = (VT – V0)1/T - 1
where V0, VT are initial and final values of the portfolios and the benchmark and Ƭ is the length of the test period in years.
- Annualized Volatility (AnnVol) quantifies total return variability and is calculated as the standard deviation of returns, scaled to an annual frequency (Markowitz, 1952). Higher values imply a wider dispersion and typically larger interim losses. With daily returns, the standard deviation sd(rt) is annualized by √52:
AnnVol = sd(rt) ×
- Sharpe Ratio (Sharpe, 1966) calculates the excess return earned per unit of volatility. In our implementation the risk-free rate is set to zero, so it reduces to the annualized mean divided by annualized volatility:
Sharpe = (mean(rt) × ) / (sd(rt) × )
- Maximum Drawdown (MaxDD) represents the largest drop from a peak to a trough in the equity curve of an asset or portfolio, reflecting the capital impairment risk that keeps investors on edge (Magdon-Ismail et al., 2004). It is a path dependent measure and complements the dispersion-based metrics, such as volatility, to provide explanation of how sustainable those returns might be over the long run. What makes it particularly useful is capturing the order of gains and losses, proving its worth when evaluating how well strategies, like the ESG portfolios, hold up through those rough market phases:
MaxDD = max t∈[0,T] (1−Vt/peakt)
- Sortino Ratio (Sortino & van der Meer , 1991)improves the Sharpe Ratio by substituting total volatility with downside deviation focusing exclusively on negative return variations to better capture risk from losses. It is often more informative than Sharpe for portfolios exhibiting positively skewed returns, such as those influenced by ESG rebalancing or sector tilts, as it provides a more accurate assessment of downside risk:
Sortino = (mean(rt) × ) / (sddown(rt) × )
- Calmar Ratio (Young, 1991) connects long-run growth to the worst realized loss, offering a measure of how effectively a strategy converts drawdown risk into compounded returns over time. Higher values are generally preferred, though it’s worth noting that the denominator represents a single extreme drawdown, which can skew the metric if that event is unusually severe. However, this is a valuable indicator, especially for risk averse investors:
Calmar = (mean(rt) × ) / MaxDD
We use this set of portfolio performance metrics because it balances long-run performance with risk. CAGR captures the geometric growth of capital, while the remaining measures explain the risk taken to achieve this return. Annualized volatility summarizes overall dispersion. That is why we add the Sharpe ratio, which converts return into a risk-adjusted efficiency score under symmetric risk, and the Sortino ratio that takes into account only downside moves.
Robustness Check
The Equally Weighted (EW) is our base case and it is the cornerstone of our BiC ESG portfolio analysis. To test the robustness of the analysis results, we construct two alternative weighting schemes: ESG-Weighted (ESG_W) and Market Cap-Weighted (MCAP_W). This approach enables us to probe the stability of the ESG selection process, testing whether the superior performance of the ESG portfolio is a result of the inherent quality of the top 30 companies (ranked by Morningstar Sustainalytics’ ESG Risk Ratings as of March 31, 2025) or the specific weighting mechanics applied. By comparing performance metrics, such as CAGR, AnnVol, Sharpe Ratio, Sortino Ratio, MaxDD, and Calmar Ratio across these three porfokio variants, we aim to identify persistent patterns that support the notion that ESG integration drives returns, regardless of whether weights are distributed equally, based on ESG scores or market capitalization. The MCAP_W portfolio is constructed in the same as the broad market benchmarks (e.g., S&P 500 Total Return Index) and provides additional arguments to validate our findings.
4. Results and Discussion
We examine the market performance of a Best-in-Class (BiC) ESG portfolio selected by Morningstar Sustainalytics’ ESG Risk Ratings as of 31 March 2025 relative to a traditional market benchmark (S&P 500 Total Return Index), using weekly data from Q1 2000 to Q1 2025. The methodological choices are deliberate: (i) a static 2025 ESG snapshot to proxy long-horizon ESG leadership, (ii) an S&P 500 total-return benchmark to ensure dividends are captured, and (iii) robustness via two additional portfolio weighting schemes (ESG-weighted, and market-cap-weighted). The backtest results demonstrate that the BiC ESG portfolios, constructed from the top 30 Morningstar Sustainalytics’ ESG Risk Ratings companies with price history from 2000, consistently outperform the S&P 500 Total Return benchmark for the full backtest period (Table 2) and for most subperiods (Table 3) based on weekly returns data.
The base case Equally Weighted (EW) portfolio has a full-period CAGR of 14.09%, substantially exceeding the benchmark's 7.43% (Figure 1), with modestly higher volatility (20.53% vs. 17.74%). Robustness checks through the ESG-Weighted (ESG_W) and Market Cap-Weighted (MCAP_W) variants confirm these findings, with CAGRs of 14.36% and 15.64%, respectively. When expressed as differences in CAGR, the ESG portfolios outperform SPX_TR by +6.66 pp (EW), +6.93 pp (ESG_W), and +8.21 pp (MCAP_W). Within the ESG portfolio variants, MCAP_W leads, exceeding ESG_W by +1.28 pp and EW by +1.55 pp (with ESG_W ahead of EW by +0.27 pp). Risk-adjusted metrics further underscore this advantage as the Sharpe Ratio ranges from 0.75 to 0.76 for the ESG portfolios, well above the S&P 500 Total Return benchmark’s 0.49, while the Sortino Ratio, reflecting downside risk, spans from 1.00 to 1.07 versus 0.63 for SPX_TR, confirming the enhanced efficiency. Maximum drawdowns remain comparable (-52.69% to -54.32% vs. -54.71%) and the related Sortino ratios ((0.26–0.30 vs. 0.14) support the notion that ESG portfolios exhibit superior risk-adjusted performance during times of market turbulence where the ESG strategies demonstrate resilience.
Sub-period analysis (Table 3) reveals that the performance of ESG portfolios depends on the market regime. They performed better in the volatile early periods, but have shown mixed results in recent bull markets. Table 3 summarizes portfolio metrics for the base case Equally Weighted (EW) portfolio and the robustness variants (ESG_W and MCAP_W), alongside the S&P 500 Total Return Index (SPX_TR) benchmark, highlighting consistent relative outperformance in most intervals despite changing market dynamics.
The cumulative returns for the full period and subperiods are presented in Figure 2 (EW vs SPX_TR), Figure 3 (ESG_W vs SPX_TR), and Figure 4 (MCAP_W vs SPX_TR).
In the turbulent 2000–2004 dot-com bust period, the EW and ESG_W portfolios posted impressive CAGRs of 19.62% and 20.62%, far surpassing the benchmark's -2.10% and even the MCAP_W's 11.87%, underscoring ESG's defensive edge in downturns. Their Sharpe ratios, ranging from 0.54 to 1.1 vs. -0.02 for the benchmark index, confirm this observation. The 2005–2009 period, marked by the 2008 World Financial Crisis, shows continued outperformance of the ESG portfolios, with EW at 8.56% and ESG_W at 8.70% against the benchmark's near-flat 0.61%, while MCAP_W edged ahead at 11.39% due to the resilience of larger companies. During the same period, the maximum drawdowns reached their highest levels across the entire backtest (-54.3% to -52.7% for the ESG portfolios vs. -54.7% for the benchmark), underscoring market turbulence, yet the ESG portfolios posted superior Calmar ratios (0.16-0.21) relative to the benchmark (0.01), highlighting their ability to translate such deep losses into more efficient long-term compounded returns. Recovery years (2010–2014) showed balanced gains, with ESG variants nearly matching or slightly exceeding the benchmark (15.49%), and MCAP_W leading at 21.08%. The 2015–2019 bull market highlighted MCAP_W's dominance at 19.13%, while EW (13.36%) and ESG_W (13.68%) still outperformed SPX_TR's 11.40%. In the period 2020–2024, amid COVID-19 pandemic volatility and recovery, MCAP_W (16.12%) and the benchmark (14.75%) scored higher returns, while the EW and ESG_W portfolios held steady around 11.6–11.7%. The brief 2025 segment reflected broad market declines during Q1, with ESG variants (-9.19% to -9.34%) faring better than the benchmark's -22.66%. These patterns of portfolio returns and risk confirm the value of ESG in volatile regimes while noting market-cap advantages in sustained bull markets, with robustness checks ensuring that weighting choices do not drive the core outperformance.
H1 posited that listed companies with best ESG ratings in 2025 do not underperform the S&P 500 Total Return benchmark in long-run risk-adjusted returns. Across the three portfolio variants (EW, ESG_W, and MCAP_W), the BiC approach exhibits higher efficiency (return per unit of total and downside risk) and stronger compounding relative to the benchmark over the complete sample. The results of the equal-weight base case portfolio test are of particular importance because they demonstrate the isolated effect of ESG leadership, unaffected by company size (market capitalisation) or the magnitude of ESG ratings.
H2 posited that companies with strong ESG practices perform better during challenging market periods, such as the .com bubble burst (subperiod 2000–2004), world financial crisis (subperiod 2005–2009), or the volatility caused by the COVID-19 pandemic (subperiod 2020–2024). The findings of this study corroborate H2, particularly in the context of periods of heightened stress and during the early stages of recovery. However, in circumstances where market dynamics are characterised by a bull trend marked by robust momentum and liquidity, the relationship between ESG portfolios and market performance becomes more complex. During periods of broad risk-off behaviour and earnings pressure, the BiC portfolios tend to offer enhanced protection to investors' capital, facilitating the conversion of early recoveries into stronger, risk-balanced gains. Conversely, during extended risk-on phases driven by a small number of mega-cap companies the market-capitalisation-weighted ESG portfolio has been shown to capture upside most effectively (Shapiro & Zheng, 2021). In contrast, we found that both the equal-weighted and the ESG-weighted portfolio variants underperformed the broader market, nevertheless they continued to perform efficiently.
This pattern is consistent with a “resilience-first, beta-second” approach. It has been demonstrated that companies with robust ESG practices are better equipped to limit significant losses and to manage operational challenges more effectively (Chen et al., 2023; Oyetade et al., 2025). This results in greater stability of their stock prices during periods of market turbulence. However, when financial markets are characterized by the predominance of a small number of major players and long-term growth trends, the advantages of this stability can be superseded by more significant surges in the market. In such cases, a market-cap-weighted ESG portfolio has been shown to align more closely with the prevailing market trends, thereby facilitating the portfolio's ability to maintain pace with the most successful performers.
For long-term investors, the results of this study support integrating BiC ESG strategies as a strategic structural allocation rather than a tactical overlay. The equal-weighted variants are indicative of the efficacy of the selection process and serve to mitigate concentration risk. ESG-weighted variants allow investors with strong sustainability convictions to allocate more funds to ESG leaders. Market-cap-weighted variants maintain benchmark adjacency and minimize tracking-error concerns in growth-led cycles. The fundamental conclusion drawn from this analysis of the various portfolio variants is that ESG leadership and strong financial performance are not, in fact, incompatible. Long-term ESG practices clearly appear to operationalize the same attributes – discipline, transparency, resiliency – that modern risk-aware portfolio construction seeks to achieve.
5. Conclusions
This paper aimed at investigating the long-term effect of Environmental, Social, and Governance (ESG) practices on listed companies' stock performance. We explored whether long-term, responsible and sustainable corporate governance, encompassing the ESG principles, can be aligned with the interests of investors/shareholders by maintaining or even increasing the value of their investment in the company, as measured by stock market performance. We constructed a BiC portfolio from the top Morningstar Sustainalytics rated companies as of 31 March 2025 and backtested on weekly data for 1 January 2000 – 31 March 2025. We incorporated ESG factors as a non-diversifiable risk influencing long-term financial performance and the cost of capital. Our selection of the top 30 ESG leaders via a single 2025 Morningstar Sustainalytics’ ESG rating snapshot applied positive screening, based on the assumption that consistent ESG excellence indicates superior governance and resilience, resulting in higher risk-adjusted returns over time. Our results indicate that ESG leaders did not experience a market valuation penalty, in fact, they achieved higher risk-adjusted performance than the S&P 500 Total Return Index. Over the full 25-year-period, the ESG portfolios achieved materially higher CAGR and Sharpe ratios, while maintaining drawdowns that were comparable to the benchmark.
The research findings of this study corroborated our two working hypotheses to a strong degree. First, we proved that listed companies with best ESG ratings in 2025 did not underperform the S&P 500 Total Return benchmark in long-run risk-adjusted returns (H1). Over the period of the backtest, companies that ultimately ranked as ESG leaders (as of 31 March 2025) did not suffer a valuation penalty; rather, they achieved superior risk-adjusted performance in comparison to the S&P 500 Total Return Index. In the full period, the BiC portfolios achieved a substantially higher Compound Annual Growth Rate (CAGR) and Sharpe ratio, while maintaining maximum drawdowns that remained comparable to the benchmark S&P 500 TR. It has been established that EW ESG portfolio outperforms SPXTR by +6.66 pp (EW), while CAGR of ESG_W and MCAP_W were +6.93 pp and +8.21 pp higher than that of the market benchmark, respectively.
Second, the hypothesis that ESG advantages were more pronounced in downturns was also validated, with the Best-in-Class ESG portfolio showing better CAGR and Sortino ratios (H2). The evidence suggests that the ESG advantage is most significant in environments of market stress and during the early stages of recovery. (e.g., 2000–2004 and 2005–2009), where the ESG portfolios exhibited better downside control and faster compounding. During the post-dot-com period and the Global Financial Crisis, the ESG portfolios preserved capital more effectively and recovered faster than the benchmark. In extended, narrow bull markets characterised by mega-cap dominance, the disparity in performance narrows, and the cap-weighted ESG strategy exhibits a greater ability to capitalise on market uptrends.
This paper aimed at assessing the long-term market consequences of sustained ESG practices. By fixing the ESG leadership portfolio at a single point in time (Q1 2025) and examining its behaviour over an extended period (Q1 2000 – Q1 2025), we demonstrate that publicly listed companies that emerge as ESG leaders in 2025 are rewarded by the markets across multiple cycles.
The methodological approach adopted in this paper is subject to several limitations. In this study, we focused on the overall performance of the portfolios, not on specific factors like portfolios’ size, growth, or structure. Exploring further these factors in future studies would help figure out if ESG leadership is the primary driver or merely follows other market patterns. This would enhance the robustness of the results and render them more useful for different markets. Furthermore, our portfolios do not change much in terms of company or weight allocation, and we only show gross results. Adding realistic costs and assessing the practicality of these portfolios for large-scale investment would make them more relevant for major investors.
Author Contributions
Conceptualisation, S.M., P.D. and T.Š.; methodology, S.M. and P.D.; formal analysis, S.M. and P.D.; software, S.M.; data curation, S.M.; investigation, S.M., P.D., and T.Š.; validation, S.M., P.D. and T.Š.; project management, T.Š.; writing—original draft preparation, S.M., P.D. and T.Š.; writing—review and editing, S.M., P.D. and T.Š.; visualisation, S.M.; supervision, P.D. All authors have read and agreed to the published version of the manuscript.
Funding
The corresponding author reports financial support from the Slovenian Research Agency (research core funding No. P5–0023 “Entrepreneurship for Innovative Society” and research core funding No. BI-BA/24-25-001 “Sustainable development goals for the sustainable development of the company”).
Institutional Review Board Statement
Not applicable.
Informed Consent Statement
Not applicable.
Data Availability Statement
All information in this research is based on publicly available data. More information about the data analysed in this research is available from the first author.
Acknowledgements
The authors would like to extend their sincere gratitude to the journal editors and anonymous reviewers.
Conflicts of Interest
The authors declare no conflicts of interest.
References
- Arora, R. U., & Sarker, T. (2023). Financing for Sustainable Development Goals (SDGs) in the Era of COVID-19 and beyond. The European Journal of Development Research, 35, 1–19. [CrossRef]
- Atz, U., Van Holt, T., Liu, Z. Z., & Bruno, C. C. (2022). Does sustainability generate better financial performance? Review, meta-analysis, and propositions. Journal of Sustainable Finance & Investment, 13(1), 802–825. [CrossRef]
- Avramov, D., Cheng, S., Lioui, A., & Tarelli, A. (2022). Sustainable investing with ESG rating uncertainty. Journal of Financial Economics, 145(2), 642–664. [CrossRef]
- Bamford, C. E., Hoffman, A. N., Wheelen, T. L., & Hunger, J. D. (2024). Strategic Management and Business Policy: Globalization, Innovation and Sustainability. 16th Edition. London: Pearson.
- Bani-Khaled, S., Azevedo, G., & Oliveira, J. (2025). Environmental, social, and governance (ESG) factors and firm value: A systematic literature review of theories and empirical evidence. AMS Review, 15, 228–260. [CrossRef]
- Baker, M., Bergstresser, D., Serafeim, G., & Wurgler, J. (2022). The pricing and ownership of US green bonds. Annual Review of Financial Economics, 14, 415–437. [CrossRef]
- Bekaert, G., Rothenberg, R., & Noguer, M. (2023). Sustainable investment—Exploring the linkage between alpha, ESG, and SDGs. Sustainable Development, 31(5), 3831–3842. [CrossRef]
- Bennani, L., Le Guenedal, T., Lepetit, F., Ly, L., Mortier, V., Roncalli, T., & Sekine, T. (2018). How ESG investing has impacted the asset pricing in the equity market. SSRN Electronic Journal. [CrossRef]
- Berg, F., Kölbel, J. F., & Rigobon, R. (2022). Aggregate confusion: The divergence of ESG ratings. Review of Finance, 26(6), 1315–1344. [CrossRef]
- Berry, T. C., & Junkus, J. C. (2013). Socially Responsible Investing: An Investor Perspective. Journal of Business Ethics, 112, 707–720. [CrossRef]
- Billio, M., Costola, M., Hristova, I., Latino, C., & Pelizzon, L. (2021). Inside the ESG ratings: (Dis)agreement and performance. Corporate Social Responsibility and Environmental Management, 28(5), 1426–1445. [CrossRef]
- Bolton, P., & Kacperczyk, M. (2021). Do investors care about carbon risk? Journal of Financial Economics, 142(2), 517–549. [CrossRef]
- Bottenberg, K., Tuschke, A., & Flickinger, M. (2017). Corporate governance between shareholder and stakeholder orientation: Lessons from Germany. Journal of Management Inquiry, 26(2), 165–180. [CrossRef]
- Broadstock, D. C., Chan, K., Cheng, L. T., & Wang, X. (2020). The role of ESG performance during times of financial crisis: Evidence from COVID-19 in China. Finance Research Letters, 38, 101716. [CrossRef]
- Camilleri, M. A. (2021). The market for socially responsible investing: a review of the developments. Social Responsibility Journal, 17(3), 412–428. [CrossRef]
- Capelle-Blancard, G., & Monjon, S. (2021). Trends in the literature on socially responsible investment: Looking for the keys under the lamppost. Business Ethics: A European Review, 21(3), 239–250. [CrossRef]
- Carroll, A. B., & Brown, J. (2022). Business and society: Ethics, sustainability, and stakeholder management (11th ed.). Cengage Learning.
- Chatterji, A. K., Durand, R., Levine, D. I., & Touboul, S. (2016). Do ratings of firms converge? Implications for managers, investors and strategy researchers. Strategic Management Journal, 37(8), 1597–1614. [CrossRef]
- Chen, S., Song, Y., & Gao, P. (2023). Environmental, social, and governance (ESG) performance and financial outcomes: Analyzing the impact of ESG on financial performance. Journal of Environmental Management, 345, 118829. [CrossRef]
- Christensen, D. M., Serafeim, G., & Sikochi, A. (2022). Why is corporate virtue in the eye of the beholder? The case of ESG ratings. The Accounting Review, 97(1), 147–175. [CrossRef]
- Civera, C., Cortese, D., Dmytriyev, S., & Freeman, R. E. (2023). Letters to stakeholders: An emerging phenomenon of multi-stakeholder engagement. Business Ethics, the Environment & Responsibility, 34(1), 246–259. [CrossRef]
- Cornell, B. (2021). ESG preferences, risk and return. European Financial Management, 27(1), 12–19. [CrossRef]
- DeMiguel, V., Garlappi, L., & Uppal, R. (2009). Optimal versus naive diversification: How inefficient is the 1/N portfolio strategy? The Review of Financial Studies, 22(5), 1915–1953. [CrossRef]
- Del Gesso, C., & Lodhi, R. N. (2025). Theories underlying environmental, social and governance (ESG) disclosure: A systematic review of accounting studies. Journal of Accounting Literature, 47(2), 433–461. [CrossRef]
- Ding, H., & Lee, W. (2024). ESG and Financial Performance of China Firms: The Mediating Role of Export Share and Moderating Role of Carbon Intensity. Sustainability, 16(12), 5042. [CrossRef]
- Eccles, R. G., Ioannou, I., & Serafeim, G. (2014). The impact of corporate sustainability on organizational processes and performance. Management Science, 60(11), 2835–2857. [CrossRef]
- Elton, E. J., & Gruber, M. J. (1995). Modern Portfolio Theory and Investment Analysis. New York: John Wiley and Sons Inc.
- European Commission. (2023). Proposal for a regulation of the European parliament and of the council on the transparency and integrity of Environmental, Social and Governance (ESG) rating activities. European Union: COM/2023/314 final. Retrieved from https://eur-lex.europa.eu/legal-content/EN/TXT/?uri=celex:52023PC0314.
- Flammer, C. (2021). Corporate green bonds. Journal of Financial Economics, 142(2), 499–516. [CrossRef]
- Freeman, R. E. (1984). Strategic management: A stakeholder approach. Boston: Pitman Publishing.
- Freeman, R. E. (2010). Strategic management: A stakeholder approach. Cambridge University Press.
- Freeman, R. E., Harrison, J. S., Wicks, A.C., Parmar, B. L., & De Colle, S. (2010). Stakeholder theory: The state of the art. Cambridge University Press.
- Friede, G., Busch, T., & Bassen, A. (2015). ESG and financial performance: Aggregated evidence from more than 2000 empirical studies. Journal of Sustainable Finance & Investment, 5(4), 210–233. [CrossRef]
- Gibson, R., Krueger, P., & Schmidt, P. S. (2021). ESG rating disagreement and stock returns. Financial Analysts Journal, 77(4), 104–127. [CrossRef]
- Global Sustainable Investment Alliance. (2022). Global sustainable investment review 2022. Available at: https://www.gsi-alliance.org/members-resources/gsir2022/ [Accessed: 30/09/2025].
- Gong, Q., Gu, J., Kong, Z., Shen, S., Dong, X., Li, Y., & Li, C. (2025). The Impact of ESG Ratings on Corporate Sustainability: Evidence from Chinese Listed Firms. Sustainability, 17(13), 5942. [CrossRef]
- Hsu, P. H., Li, K., & Tsou, C. Y. (2023). The pollution premium. Journal of Finance, 78(3), 1343–1392. [CrossRef]
- Kräussl, R., Ruenzi, S., & Weigert, F. (2024). A review on ESG investing: Investors' expectations, beliefs and perceptions. Journal of Economic Surveys, 38(2), 476–502. [CrossRef]
- Li, C., Wu, M., Chen, X., & Huang, W. (2022). Environmental, social and governance performance, corporate transparency, and credit rating: Some evidence from Chinese A-share listed companies. Pacific-Basin Finance Journal, 76, 101806. [CrossRef]
- Li, T. T., Wang, K., Sueyoshi, T., & Wang, D. D. (2021). ESG: Research progress and future prospects. Sustainability, 13(21), 11663. [CrossRef]
- Liang, H., & Renneboog, L. (2020). The global sustainability footprint of sovereign wealth funds. Oxford Review of Economic Policy, 36(2), 380–426. [CrossRef]
- Linnenluecke, M. K. (2022). Environmental, social and governance (ESG) performance in the context of multinational business research. Multinational Business Review, 30(1), 1–16. [CrossRef]
- Markowitz, H. (1952). Portfolio selection. The Journal of Finance, 7(1), 77–91. [CrossRef]
- Markowitz, H. M. (1959), Portfolio Selection: Efficient Diversification of Investments. Yale University Press, 1959. JSTOR. https://www.jstor.org/stable/j.ctt1bh4c8h.
- Merton, R. C. (1980). On estimating the expected return on the market: An exploratory investigation. Journal of Financial Economics, 8(4), 323–361. [CrossRef]
- Murata, R., & Hamori, S. (2021). ESG Disclosures and Stock Price Crash Risk. Journal of Risk and Financial Management, 14(2), 70. [CrossRef]
- Nian, H., & Said, F. F. (2025). The impact of ESG on firm risk and financial performance: A systematic literature review. Journal of Scientometric Research, 13(3s), s144–s155. [CrossRef]
- O’Donovan, G (2002). Environmental disclosures in the annual report: Extending the applicability and predictive power of legitimacy theory. Accounting, Auditing & Accountability Journal, 15(3), 344–371. [CrossRef]
- Oyetade, J. A., Igbalawole, O., & Johnson-Rokosu, S. F. (2025). From Shareholder Value to Stakeholder Impact: Integrating ESG Considerations into Financial Decisions. International Journal of Research and Innovation in Social Science, IX(II), 239–255. [CrossRef]
- Pedersen, L. H., Fitzgibbons, S., & Pomorski, L. (2021). Responsible investing: The ESG-efficient frontier. Journal of Financial Economics, 142(2), 572–597. [CrossRef]
- Rau, P. R., & Yu, T. (2024). A survey on ESG: investors, institutions and firms. China Finance Review International, 14(1), 3–33. [CrossRef]
- Serafeim, G., & Yoon, A. (2023). ESG rating changes and stock returns. Journal of Financial Economics, 167(2), 460-484. [CrossRef]
- Shapiro, R., & Zheng, F. (2021). Recent Large-Cap Stock Outperformance and Its Impact on US Equities. The Journal of Investing, 30(5), 95–106. [CrossRef]
- Sharpe, W. F. (1966) Mutual Fund Performance. Journal of Business, 1, 119–138. [CrossRef]
- Sortino, F. A., & van der Meer, R. (1991). Downside risk: Capturing what's at stake in investment situations. Journal of Portfolio Management, 17(4), 27–31. [CrossRef]
- Štrukelj, T., & Dankova, P. (2025). Ethical leadership and management of small- and medium-sized enterprises: the role of AI in decision making. Administrative sciences, 15(7), [article no.] 274, 1–27. [CrossRef]
- Štrukelj, T., Dankova, P., & Hrast, N. (2023). Strategic Transition to Sustainability: A Cybernetic Model. Sustainability, 15(22), 15948. [CrossRef]
- Štrukelj, T., Nikolić, J., Zlatanović, D., & Sternad Zabukovšek, S. (2020). A Strategic Model for Sustainable Business Policy Development. Sustainability, 12(2), 526. [CrossRef]
- Sun, Y., & Zhao, Z. (2024). Responsible investment: Institutional shareholders and ESG performance. Pacific-Basin Finance Journal, 85, 102357. [CrossRef]
- UNPRI. (2024). United Nations Principles for Responsible Investment. Annual report 2024. https://www.unpri.org/annual-report-2024.
- Weiss, J. W. (2021). Business ethics: A stakeholder and issues management approach (7th ed.). Berrett-Koehler Publishers.
- Zdolšek, D., Jagrič, V., Štrukelj, T., & Taškar Beloglavec, S. (2022). The path towards international non-financial reporting framework. In Grima, S., Özen, E., & Romānova, I. (Eds.), Managing risk and decision making in times of economic distress, part B (pp. 37–60). Bingley: Emerald. Contemporary studies in economics and financial analysis, vol. 108. [CrossRef]
- Zerbib, O. D. (2020). A Sustainable Capital Asset Pricing Model (S-CAPM): Evidence from Environmental Integration and Sin Stock Exclusion [Asset pricing with liquidity risk]. Review of Finance, 26(6), 1345–1388.
- Zhang, L.-S. (2025). The impact of ESG performance on the financial performance of companies: Evidence from China's Shanghai and Shenzhen A-share listed companies. Frontiers in Environmental Science, 13, 1507151. [CrossRef]
Figure 1.
CAGR full period (Q1 2000 – Q 2025) portfolio variants.
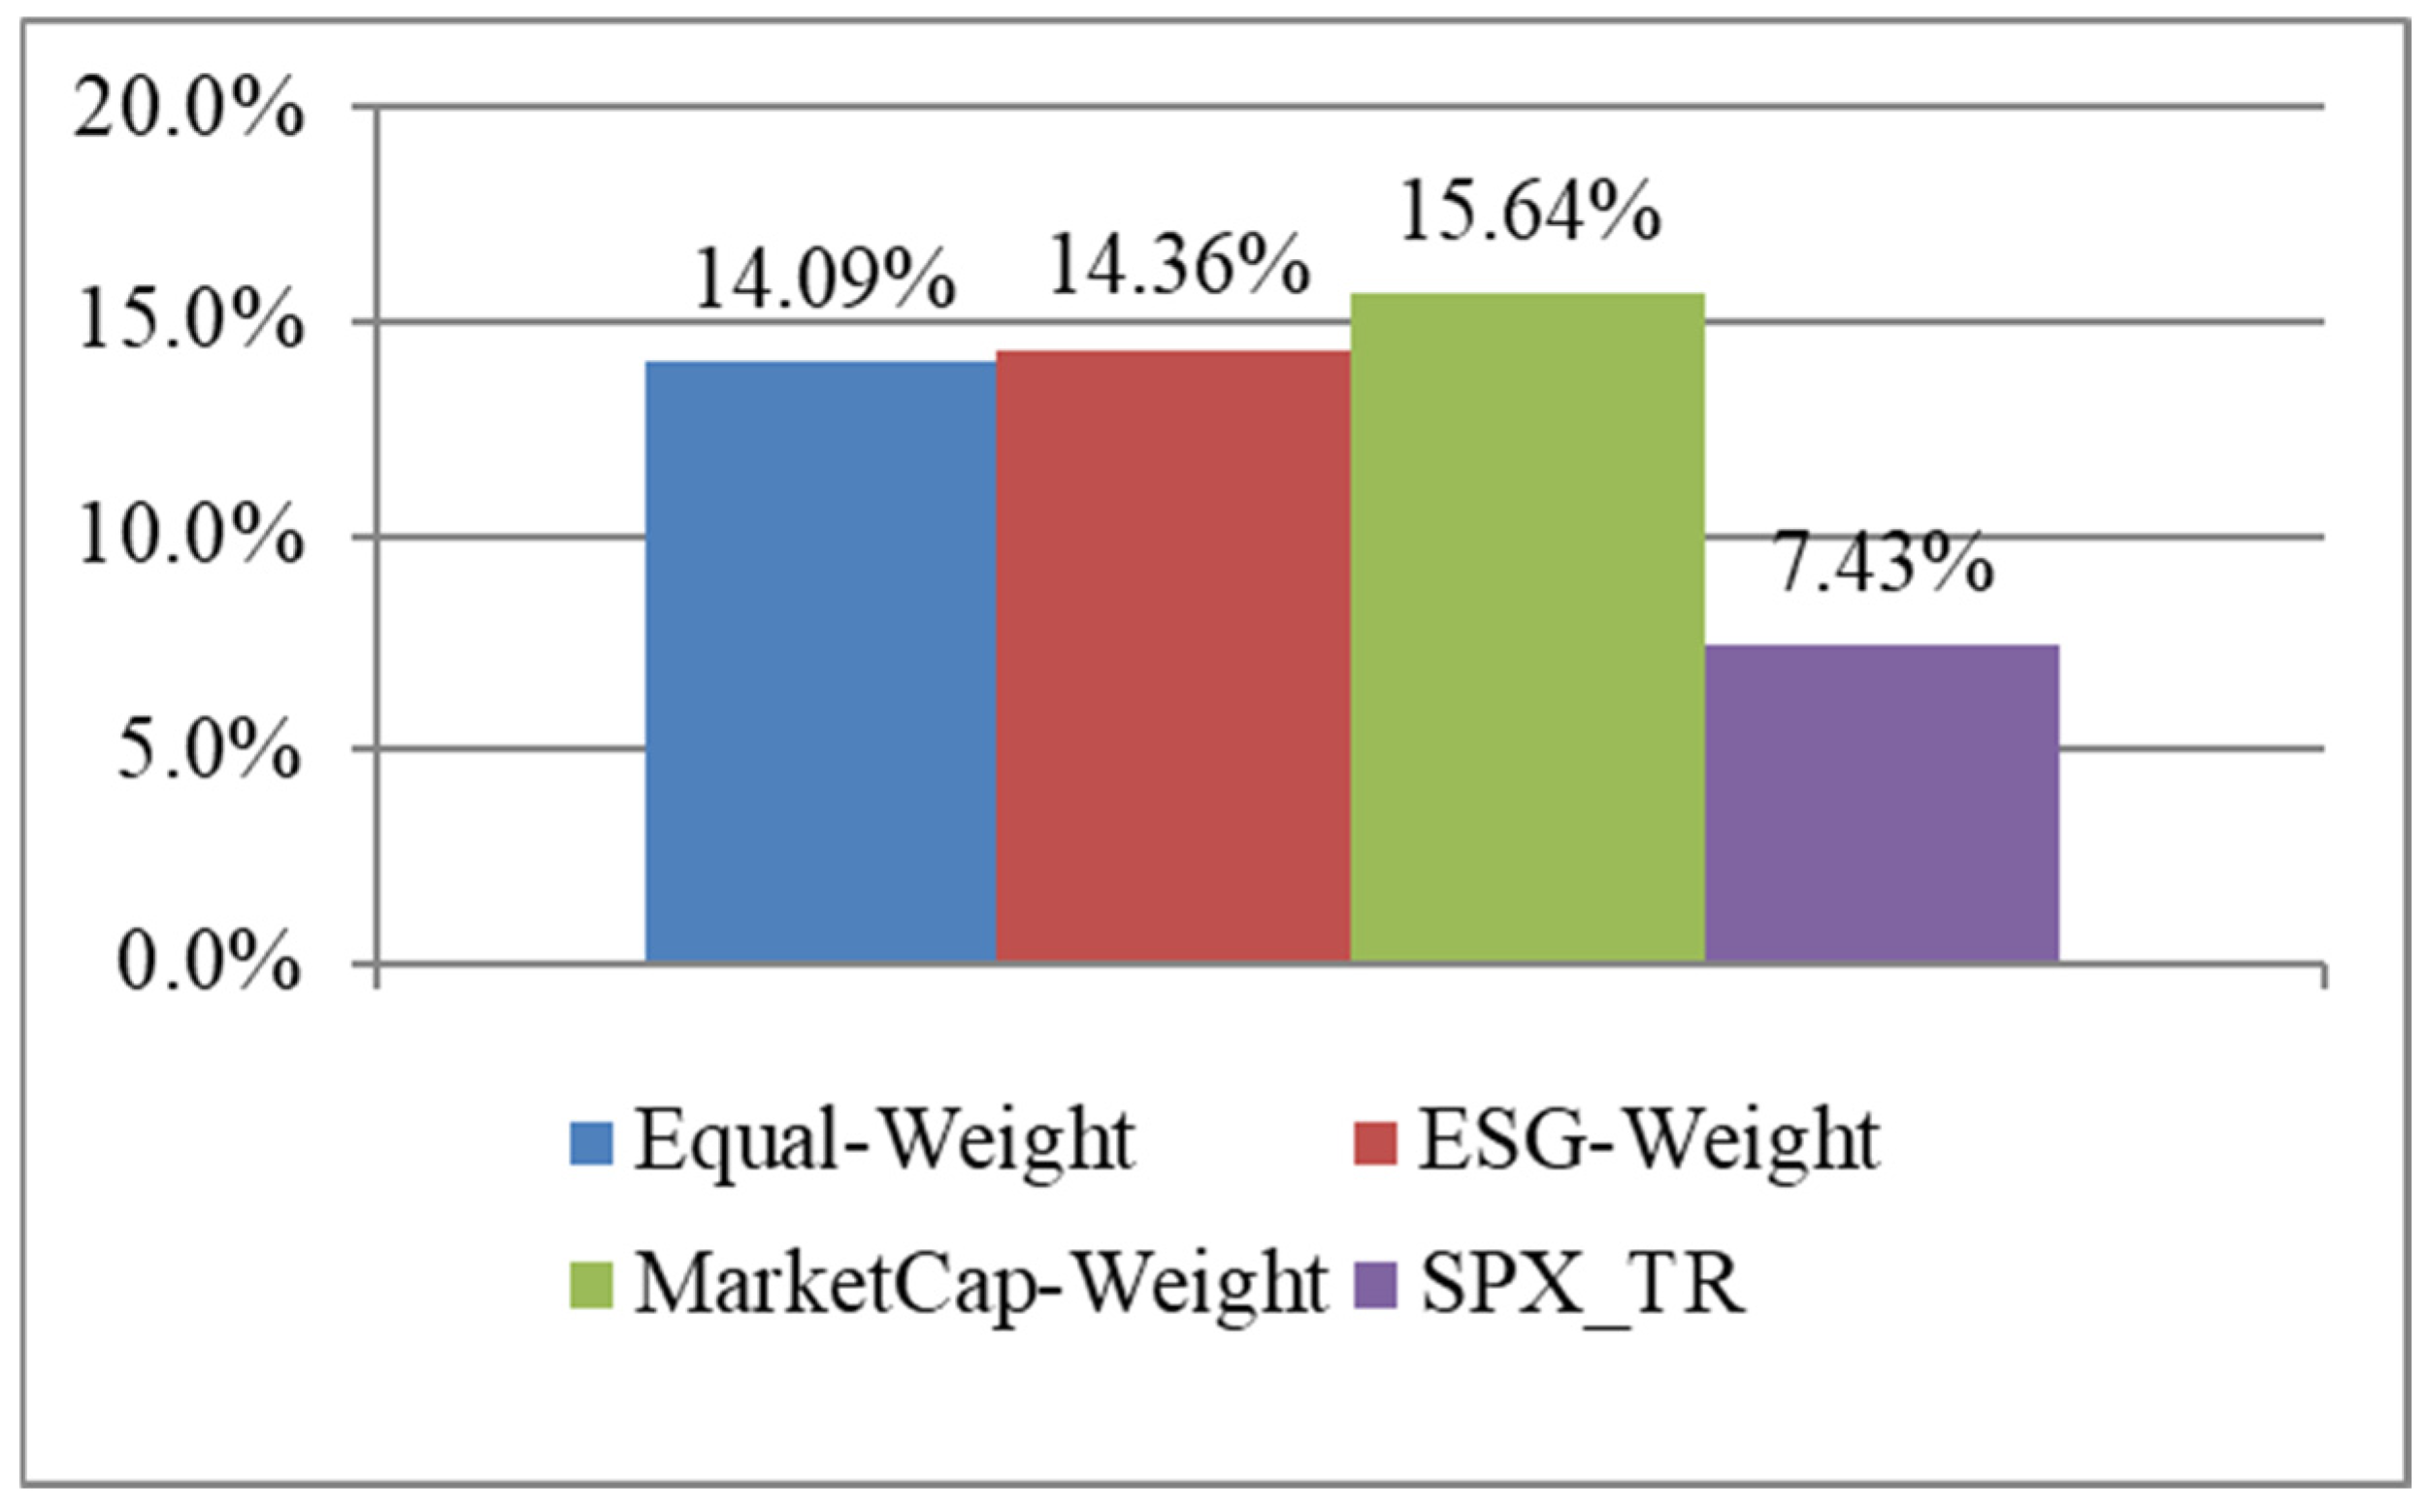
Figure 2.
Full period (Q1 2000 – Q 2025) cumulative returns for EW vs SPX_TR.
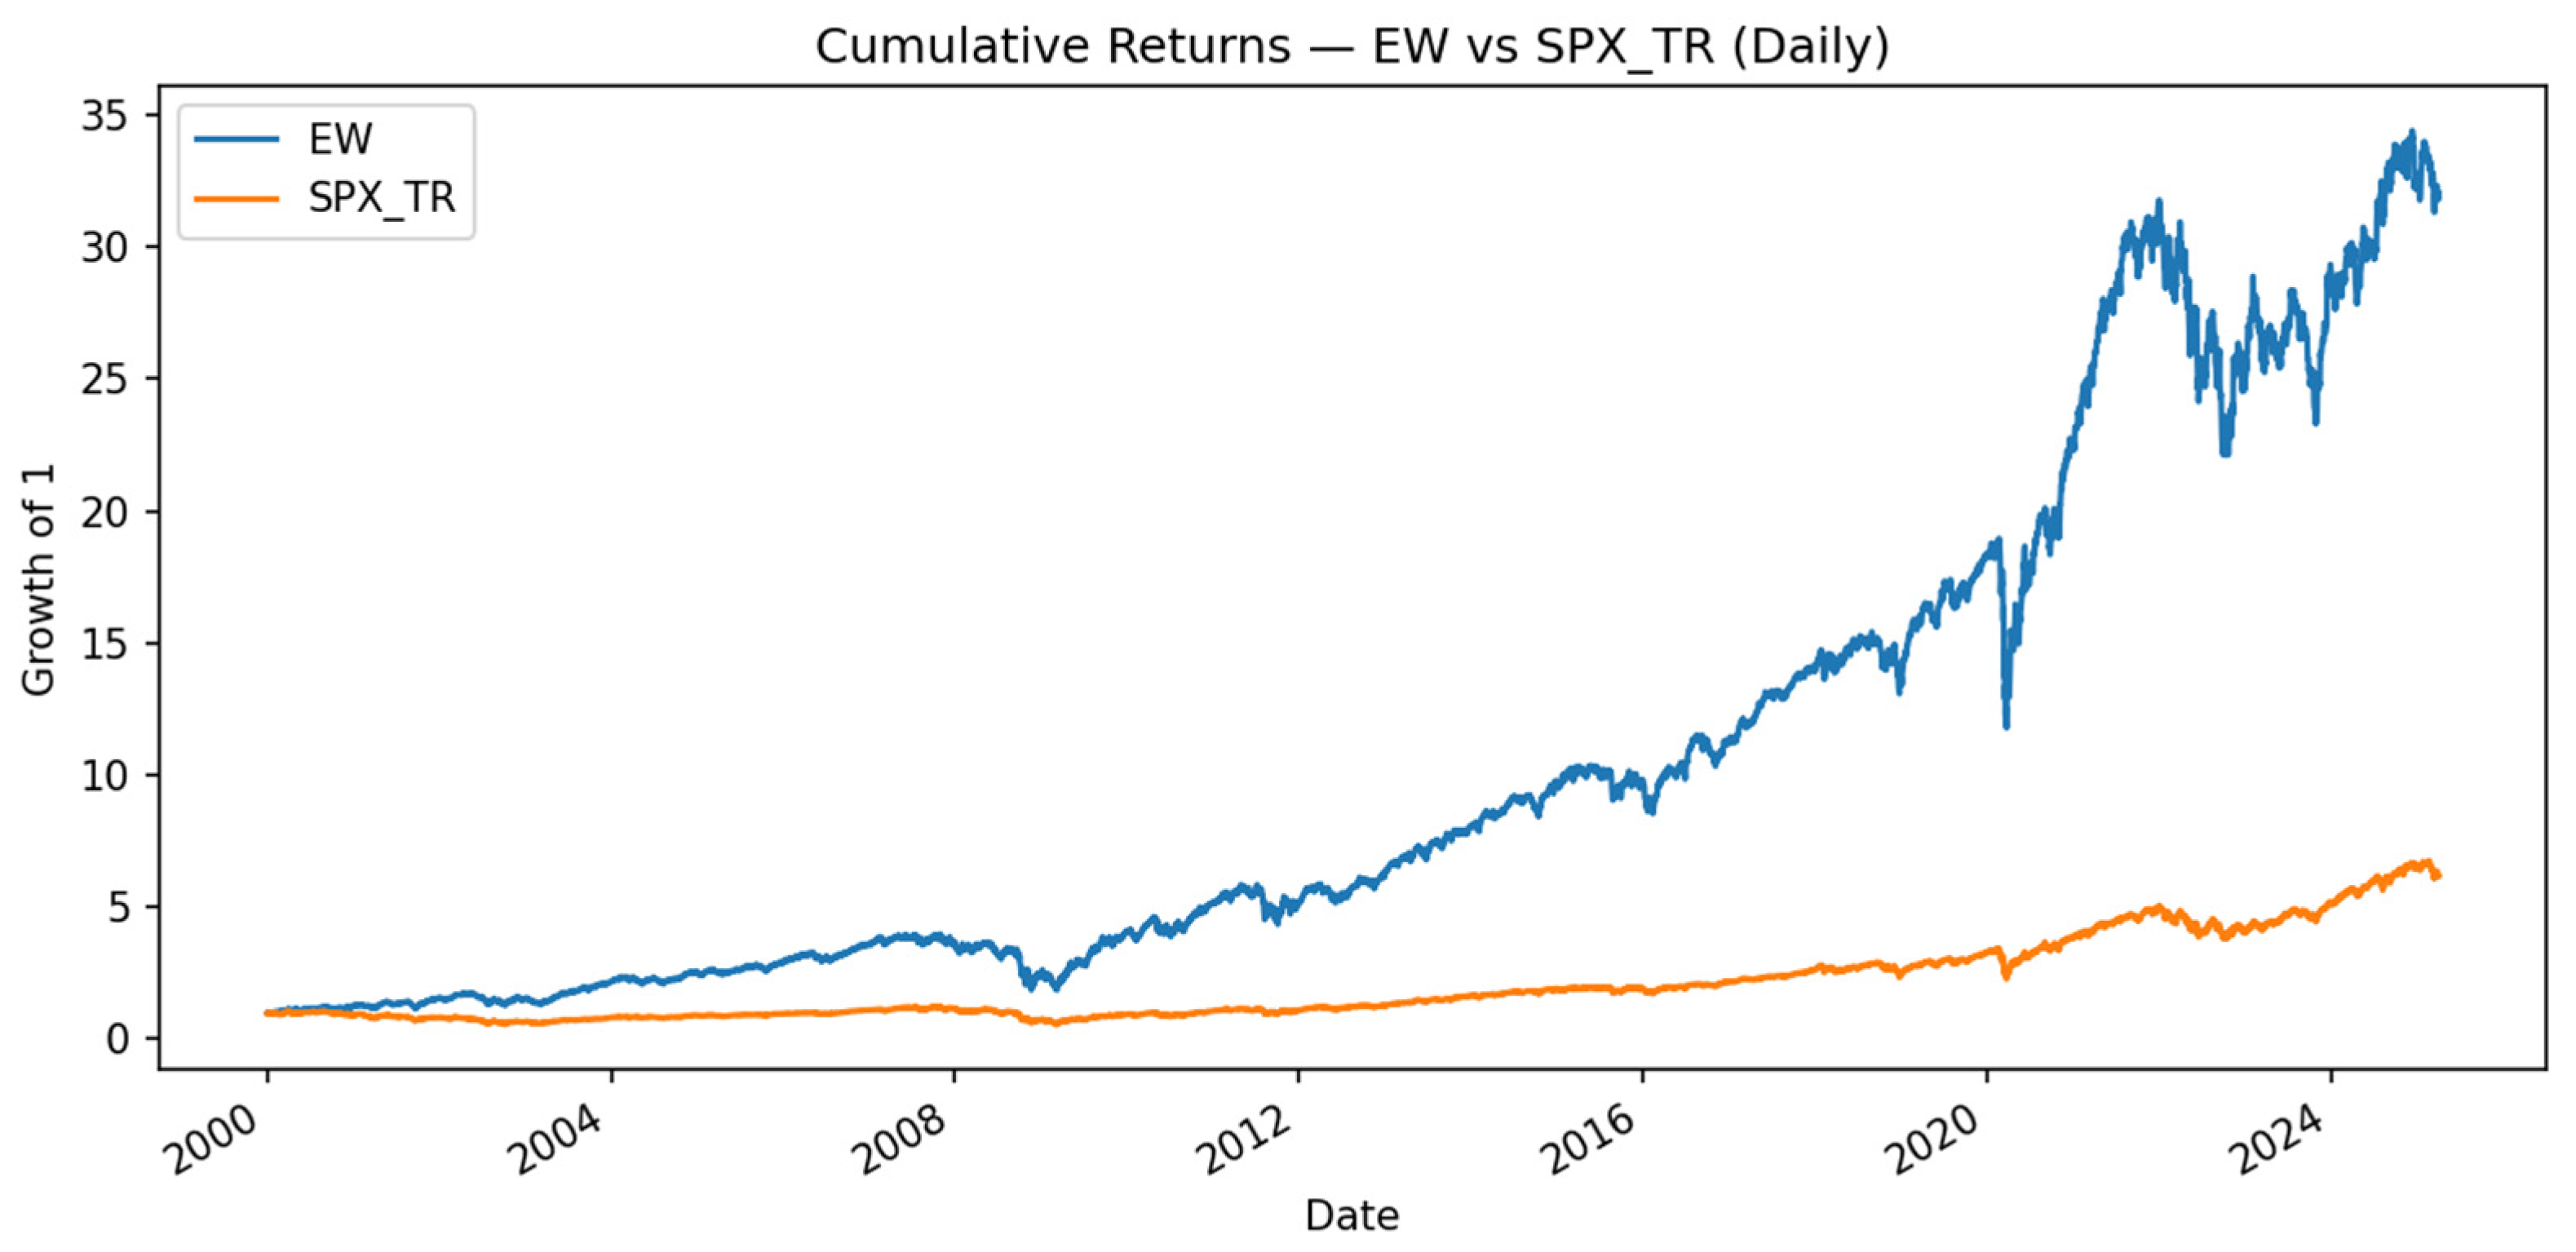
Figure 3.
Full period (Q1 2000 – Q 2025) for ESG_W vs SPX_TR.
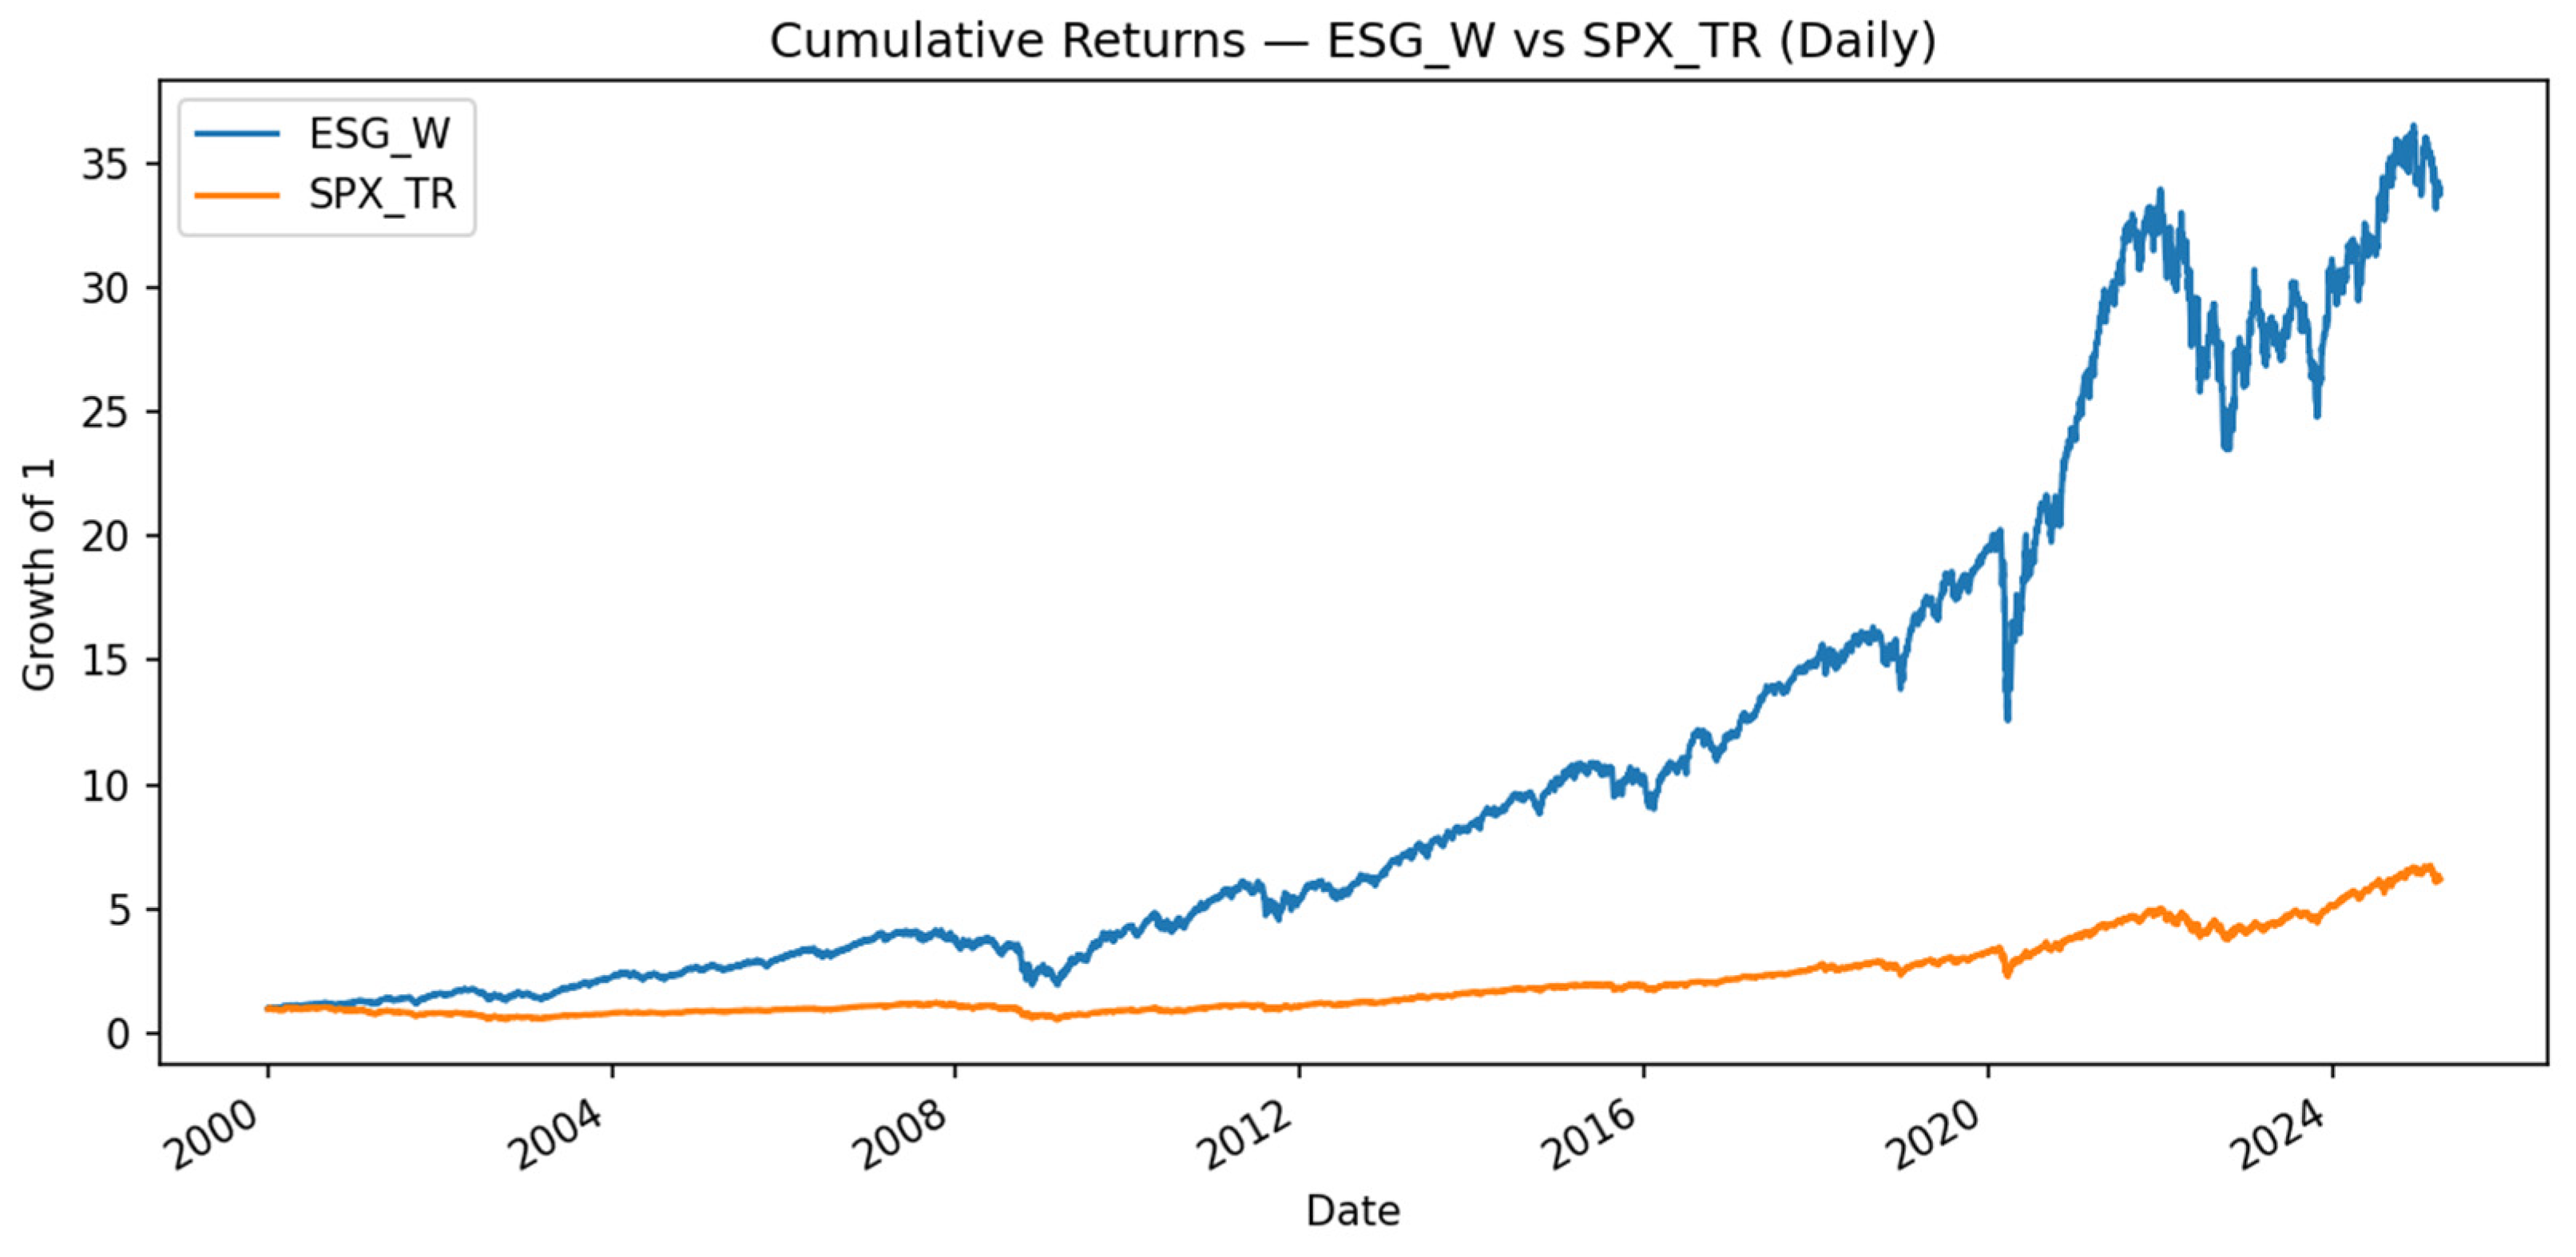
Figure 4.
Full period (Q1 2000 – Q 2025) for MCAP_W vs SPX_TR.
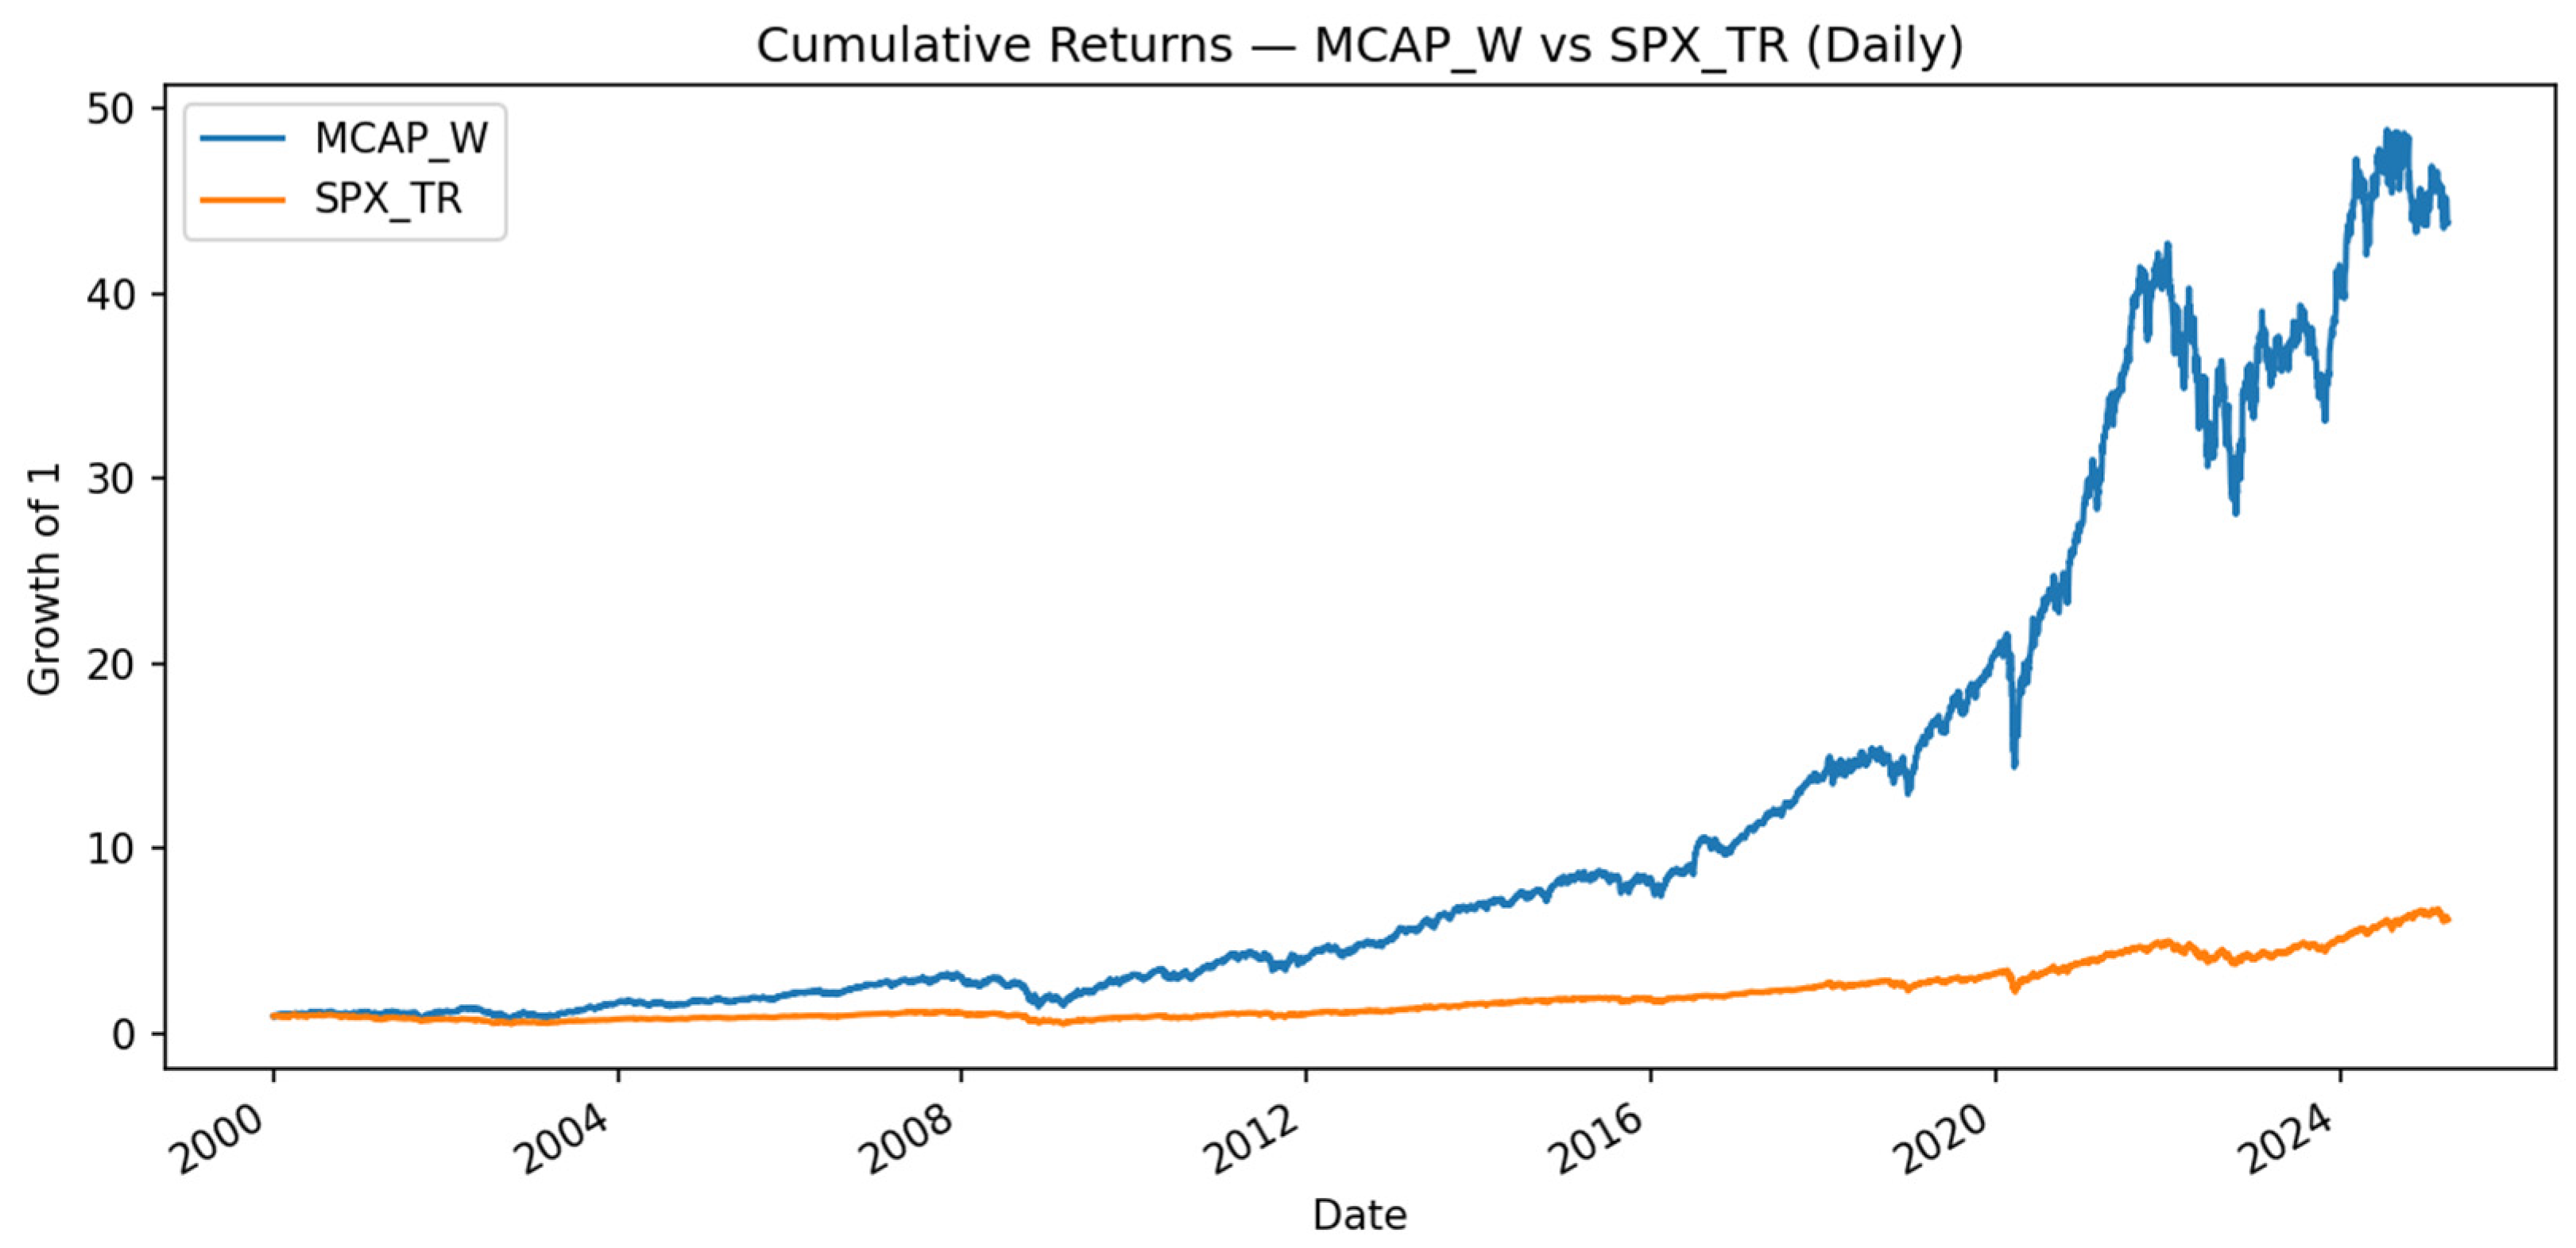

Table 1.
Top 30 companies by Morningstar Sustainalytics’ ESG Risk Ratings as of 31 March 2025.
|
Company Ticker |
Company Name | ESG Rating |
Market Capitalisation (billion USD) |
| PSO | Pearson plc | 6.9 | 10.51 |
| JLL | Jones Lang LaSalle Incorporated | 7.39 | 10.57 |
| RYN | Rayonier Inc. | 7.72 | 3.74 |
| RELX | RELX PLC | 7.8 | 99.01 |
| NLY | Annaly Capital Management, Inc. | 8.32 | 11.61 |
| DHR | Danaher Corporation | 8.52 | 135.91 |
| ASML | ASML Holding N.V. | 8.6 | 293.93 |
| IPG | The Interpublic Group of Companies, Inc. | 8.73 | 8.86 |
| WPP | WPP plc | 9.4 | 8.72 |
| LXP | LXP Industrial Trust | 9.47 | 2.54 |
| WAT | Waters Corporation | 9.56 | 20.78 |
| ZBRA | Zebra Technologies Corporation | 9.94 | 14.74 |
| NYT | The New York Times Company | 10.01 | 9.31 |
| A | Agilent Technologies, Inc. | 10.09 | 31.78 |
| LAD | Lithia Motors, Inc. | 10.19 | 8.25 |
| NOK | Nokia Corporation | 10.3 | 28.13 |
| AVB | AvalonBay Communities, Inc. | 10.39 | 29.44 |
| POOL | Pool Corporation | 10.59 | 11.30 |
| HPQ | HP Inc. | 10.59 | 23.39 |
| CDP | COPT Defense Properties | 10.68 | 3.17 |
| MTD | Mettler-Toledo International Inc. | 10.73 | 24.01 |
| CIGI | Colliers International Group Inc. | 10.9 | 6.07 |
| RGLD | Royal Gold, Inc. | 10.93 | 11.72 |
| PLD | Prologis, Inc. | 10.93 | 100.77 |
| KMX | CarMax, Inc. | 10.98 | 9.82 |
| AVY | Avery Dennison Corporation | 10.98 | 13.89 |
| AZO | AutoZone, Inc. | 10.98 | 62.43 |
| FMS | Fresenius Medical Care AG & Co. KGaA | 11.1 | 17.04 |
| VTR | Ventas, Inc. | 11.16 | 29.01 |
| KIM | Kimco Realty Corporation | 11.22 | 14.38 |
Table 2.
Full-Period (Q1 2000 – Q1 2025) Portfolio Performance Metrics (Weekly Frequency).
| Portfolio variant | CAGR (%) | AnnVol (%) | Sharpe | MaxDD (%) | Sortino | Calmar |
| Equal-Weight | 14.09% | 20.53% | 0.75 | -54.32% | 1.00 | 0.26 |
| ESG-Weight | 14.36% | 20.54% | 0.76 | -54.30% | 1.01 | 0.26 |
| MarketCap-Weight | 15.64% | 23.10% | 0.75 | -52.69% | 1.07 | 0.30 |
| SPX_TR | 7.43% | 17.74% | 0.49 | -54.71% | 0.63 | 0.14 |
Table 3.
Portfolio Performance Metrics by Subperiod (Weekly Frequency).
| Period | Portfolio | CAGR | AnnVol | Sharpe | MaxDD | Sortino | Calmar |
| 2000–2004 | EW | 19.62% | 18.50% | 1.062453 | -23.75% | 1.533313 | 0.82632 |
| ESG_W | 20.62% | 18.33% | 1.116212 | -23.04% | 1.622145 | 0.895295 | |
| MCAP_W | 11.87% | 27.99% | 0.54087 | -40.09% | 0.843906 | 0.296141 | |
| SPX_TR | -2.10% | 18.78% | -0.0188 | -45.83% | -0.02616 | -0.04588 | |
| 2005–2009 | EW | 8.56% | 25.83% | 0.446355 | -54.32% | 0.618559 | 0.157664 |
| ESG_W | 8.70% | 25.94% | 0.450408 | -54.30% | 0.62231 | 0.160271 | |
| MCAP_W | 11.39% | 25.51% | 0.549981 | -52.69% | 0.789226 | 0.216213 | |
| SPX_TR | 0.61% | 20.97% | 0.135314 | -54.71% | 0.16523 | 0.011227 | |
| 2010–2014 | EW | 18.87% | 17.69% | 1.067894 | -22.80% | 1.354647 | 0.827852 |
| ESG_W | 18.90% | 17.66% | 1.070714 | -22.78% | 1.355697 | 0.829881 | |
| MCAP_W | 21.08% | 18.74% | 1.116317 | -20.21% | 1.573874 | 1.043348 | |
| SPX_TR | 15.49% | 14.98% | 1.037466 | -17.04% | 1.426511 | 0.908891 | |
| 2015–2019 | EW | 13.36% | 13.09% | 1.024383 | -15.86% | 1.462744 | 0.842373 |
| ESG_W | 13.68% | 13.07% | 1.047776 | -15.40% | 1.494988 | 0.888829 | |
| MCAP_W | 19.13% | 15.02% | 1.242395 | -14.33% | 1.849648 | 1.334888 | |
| SPX_TR | 11.39% | 12.84% | 0.905692 | -17.09% | 1.093556 | 0.666604 | |
| 2020–2024 | EW | 11.71% | 25.18% | 0.56542 | -36.57% | 0.77717 | 0.32026 |
| ESG_W | 11.61% | 25.27% | 0.560687 | -36.72% | 0.766381 | 0.316158 | |
| MCAP_W | 16.12% | 26.20% | 0.70093 | -34.27% | 1.036461 | 0.4704 | |
| SPX_TR | 14.75% | 20.03% | 0.788462 | -31.66% | 1.01277 | 0.465847 | |
| 2025–2025 | EW | -9.19% | 11.84% | -0.75921 | -6.00% | -1.3511 | -1.53282 |
| ESG_W | -9.34% | 11.84% | -0.77346 | -5.98% | -1.34057 | -1.56309 | |
| MCAP_W | -4.48% | 10.81% | -0.37393 | -5.74% | -0.79371 | -0.77988 | |
| SPX_TR | -22.66% | 12.55% | -1.98391 | -8.57% | -3.85989 | -2.64388 |
Disclaimer/Publisher’s Note: The statements, opinions and data contained in all publications are solely those of the individual author(s) and contributor(s) and not of MDPI and/or the editor(s). MDPI and/or the editor(s) disclaim responsibility for any injury to people or property resulting from any ideas, methods, instructions or products referred to in the content. |
© 2025 by the authors. Licensee MDPI, Basel, Switzerland. This article is an open access article distributed under the terms and conditions of the Creative Commons Attribution (CC BY) license (http://creativecommons.org/licenses/by/4.0/).
Copyright: This open access article is published under a Creative Commons CC BY 4.0 license, which permit the free download, distribution, and reuse, provided that the author and preprint are cited in any reuse.


