
Submitted:
19 November 2025
Posted:
20 November 2025
You are already at the latest version
Abstract
The rapidly growing interest in travel, coupled with the risks associated with it, compels travelers to consider purchasing travel insurance. This research analyzes detailed data on tourists’ choices, interests, and travel history to predict travel insurance behavior. The goal is to uncover patterns and develop a predictive model that assists in identifying the best insurance options for travelers using machine learning algorithms. This study examines feature importance, model performance, and decision-making strategies to effectively target potential customers. Experimental results were obtained using machine learning algorithms such as Decision Tree, Random Forest, KNN, and Naïve Bayes. The effectiveness of ensemble methods and deep learning techniques was also evaluated in achieving high prediction accuracy. Among all the algorithms tested, the Random Forest model achieved the highest accuracy of 83.39%, with a precision of 91.30% and a recall of 96.87%. These findings provide actionable insights for data-driven decision-making in the travel insurance industry, promoting enhanced customer engagement and operational efficiency.
Keywords:
travel insurance
; machine learning
; tourist behavior
; predictive modeling
; random forest
; ensemble methods
; deep learning
1. Introduction
In this fast-growing era, travel has become an integral part of everyone’s life. People are frequently moving from one place to another due to various circumstances. As a result, the demand for travel insurance has increased significantly, mainly due to the numerous risks associated with traveling, such as flight cancellations, medical emergencies, and travel interruptions. Travelers engaging in adventure or high-risk activities are especially inclined to seek specialized insurance coverage for protection. In particular, the COVID-19 pandemic has heightened awareness and demand for travel insurance especially for policies covering health emergencies and trip cancellations due to health-related restrictions [1]. Estimating travel insurance buyers has become an important task for insurance providers. Figure 1 illustrates the reasons for purchasing travel insurance and highlights the importance of such policies in preventing financial or health-related losses. Predictive models are now being used to understand customer behavior and forecast the likelihood of travel insurance purchases [13].
By utilizing conjoint and cluster analysis methods, consumer groups can be segmented based on their travel preferences. This segmentation helps insurers design more targeted insurance plans [2]. Today, travelers prefer flexible policies that can be adjusted according to changing travel restrictions and personal health needs. Machine learning algorithms play a critical role in supporting these efforts [14]. Tour and travel companies are increasingly focusing on services that address travelers’ key concerns, such as medical emergencies, personal belongings, lost luggage, flight delays, and cancellations [15]. Several studies have shown that tourists’ purchasing habits regarding travel services are evolving due to health concerns and safety risks associated with travel destinations [3]. Due to the increasing risks associated with traveling, travel insurance has become more important than ever. It safeguards global travelers by covering expenses related to medical emergencies and unforeseen circumstances during trips [4]. Figure 2 presents a graph that illustrates the interest in travel insurance among different age groups [16].
As a result, insurance companies are now focusing on customizing their plans to align with customer needs based on factors such as age, travel frequency, and preferred destinations. Figure 3 presents a forecast visualization of reasons for purchasing travel insurance. The pie chart reveals that medical concerns occupy the largest portion, indicating that health-related issues are the most significant factor influencing travel insurance purchases [17].
To improve the accuracy of travel insurance prediction, various machine learning algorithms can be applied using tools such as RapidMiner. This platform simplifies the process of training and testing datasets while allowing for performance evaluation. Several machine learning [18,19,20] methods have been employed to assess model accuracy. Among these, the Random Forest algorithm delivered the highest accuracy, forming the foundation of the proposed prediction model.
The structure of the paper is organized as follows:
- Section II reviews past studies related to travel insurance prediction.
- Section III outlines the methodology adopted in this study.
- Section IV presents and analyzes the experimental results.
- Section V concludes the paper and provides suggestions for future research.
This structure is illustrated in Figure 4.
2. Literature Review
This section focuses on how machine learning (ML) techniques are applied to predict travel insurance purchases. Various researchers have utilized different algorithms to analyze customer behavior and enhance prediction accuracy.
Rubi et al. [1] achieved an accuracy of 78% using travel insurance data with Random Forest and Decision Tree models. Similarly, Erdogan Koc [2] attained 81% accuracy by implementing the K-Nearest Neighbors (KNN) algorithm on insurance transaction data.
Dadang Amir Hamzah [3] focused on predicting travel insurance claims using Logistic Regression, which resulted in a 72% accuracy rate. In a Malaysia-based study, Shirelyzan Petrus et al. [4] analyzed travel insurance survey data and applied Multiple Regression Analysis to identify key purchase factors, achieving 73.25% accuracy.
Another study by Abdulrahman Jasim et al. [5] employed KNN to predict travel insurance purchases and achieved 78% accuracy, highlighting the method’s effectiveness. Lastly, Nazmus Sakib [6] used Gradient Boosting, which delivered the highest accuracy at 81.5%, demonstrating the strength of advanced ensemble models in improving prediction outcomes.

Table 1.
Literature Review Summary.
| Authors | Dataset | Classifier | Accuracy |
|---|---|---|---|
| [1] | Travel Insurance Prediction Data | Random Forest, Decision Tree | 78% |
| [2] | Insurance Transaction Data | K-Nearest Neighbors (KNN) | 81% |
| [3] | Travel Insurance Prediction Data | Logistic Regression | 72% |
| [4] | Malaysia Travel Insurance Survey Data | Multiple Regression Analysis | 73.25% |
| [5] | Travel Insurance Prediction Data | KNN | 78% |
| [6] | Travel Insurance Prediction Data | Gradient Boosting | 81.5% |
3. Methodology
In the methodology section, RapidMiner is used to train and test machine learning algorithms for predicting travel insurance. The methods applied include Naïve Bayes, KNN, Random Forest, and Decision Tree, all of which are highly effective for analyzing dataset performance and accuracy [9,10,11,12].
This process is not just about achieving high accuracy but also about thoroughly evaluating the model’s performance using various metrics [21]. The research is based on a relevant dataset, with calculations covering Classification Error, Precision, Recall, and F1 Score. To make things clearer, the formulas for calculating these parameters are also provided.
The Travel Insurance Prediction Dataset, sourced from Kaggle, offers valuable insights into customer behavior and the characteristics that influence travel insurance purchases. It encompasses a wide range of information related to customer demographics, travel habits, and health status all of which are key indicators in determining whether an individual is likely to buy travel insurance.
This is a multivariate dataset containing 918 records and 9 attributes, with a mix of numerical, categorical, and boolean data types. The primary objective is to predict whether a customer has purchased travel insurance, represented as a binary outcome: ‘yes’ (1) or ‘no’ (0). Table 2 shows dataset parameters.
4. Result
Many machine learning algorithms are now available and some have been used to predict travel insurance purchases. These classifiers follow a common framework in the Rapid Miner as illustrated in Figure 5. And Figure 6 shows the sample model in rapid miner.
To improve the model’s learning ability without overfitting, hyperparameter tuning has been applied to the dataset. Pruning was added with a reliance value of 0.1, along with a pre-pruning setting, including minimal gain (0.01), minimal leaf size (2), minimal split size (4), and pre-pruning alternatives(3). Additionally, the number of trees in the model was increased to 1000 to enhance accuracy. The results of these adjustments are shown in Figure 7.
Table 3.
Confusion Matrix (Random Forest).
| Predicted | Actual | No | Yes | Precision |
|---|---|---|---|---|
| No | 371 | 87 | 81.00% | |
| Yes | 12 | 126 | 91.30% | |
| recall | 96.87% | 59.15% |
Table 4.
Random Forest Performance.
| Parameters | Values |
|---|---|
| Accuracy | 83.39% |
| Classification Error | 16.61% |
| Precision | 91.30% |
| Recall | 59.15% |
| F1 Measure | 71.77% |
KNN predicts the outcome for an unknown sample by analyzing its K nearest neighbors in the training data that share similar characteristics. Table 5 shows the KNN classification results.
Table 5.
KNN Performance.
| Parameters | Values |
|---|---|
| Accuracy | 79.03% |
| Classification Error | 20.97% |
| Precision | 90.74% |
| Recall | 46.01% |
| F1 Measure | 61.01% |
Naïve Bayes is a classification algorithm that makes predictions based on probabilities from the given data and existing knowledge. However, one key limitation is that it assumes all the features are independent, which is not always true in real-life situations where different factors are connected.
Table 6.
Naïve Bayes Performance.
| Parameters | Values |
|---|---|
| Accuracy | 76.68% |
| Classification Error | 23.32% |
| Precision | 72.84% |
| Recall | 55.40% |
| F1 Measure | 63.02% |
In Decision Trees, the prediction starts from the root node and moves through different branches. This method is especially useful for multiclass datasets. At each step, the algorithm checks a data point against a specific rule and follows the corresponding path until it reaches the final prediction.
Table 7.
Decision Tree Performance.
| Parameters | Values |
|---|---|
| Accuracy | 82.38% |
| Classification Error | 17.62% |
| Precision | 87.50% |
| Recall | 59.15% |
| F1 Measure | 70.50% |
Bagging is a machine-learning technique that improves accuracy by combining predictions from multiple models. Each model makes its own prediction, and the final result is determined by averaging or voting. This method helps reduce error and prevents overfitting, making the model more reliable.
Table 8.
Bagging Performance.
| Parameters | Values |
|---|---|
| Accuracy | 82.55% |
| Classification Error | 17.45% |
| Precision | 87.59% |
| Recall | 59.62% |
| F1 Measure | 70.76% |
Final accuracy comparison table is shown in Table 9.
Table 9.
Accuracy Comparison Table.
| Algorithms | Accuracy |
|---|---|
| Naïve Bayes | 76.68% |
| KNN | 79.03% |
| Random Forest | 83.39% |
| Decision Tree | 82.38% |
| Bagging | 82.55% |
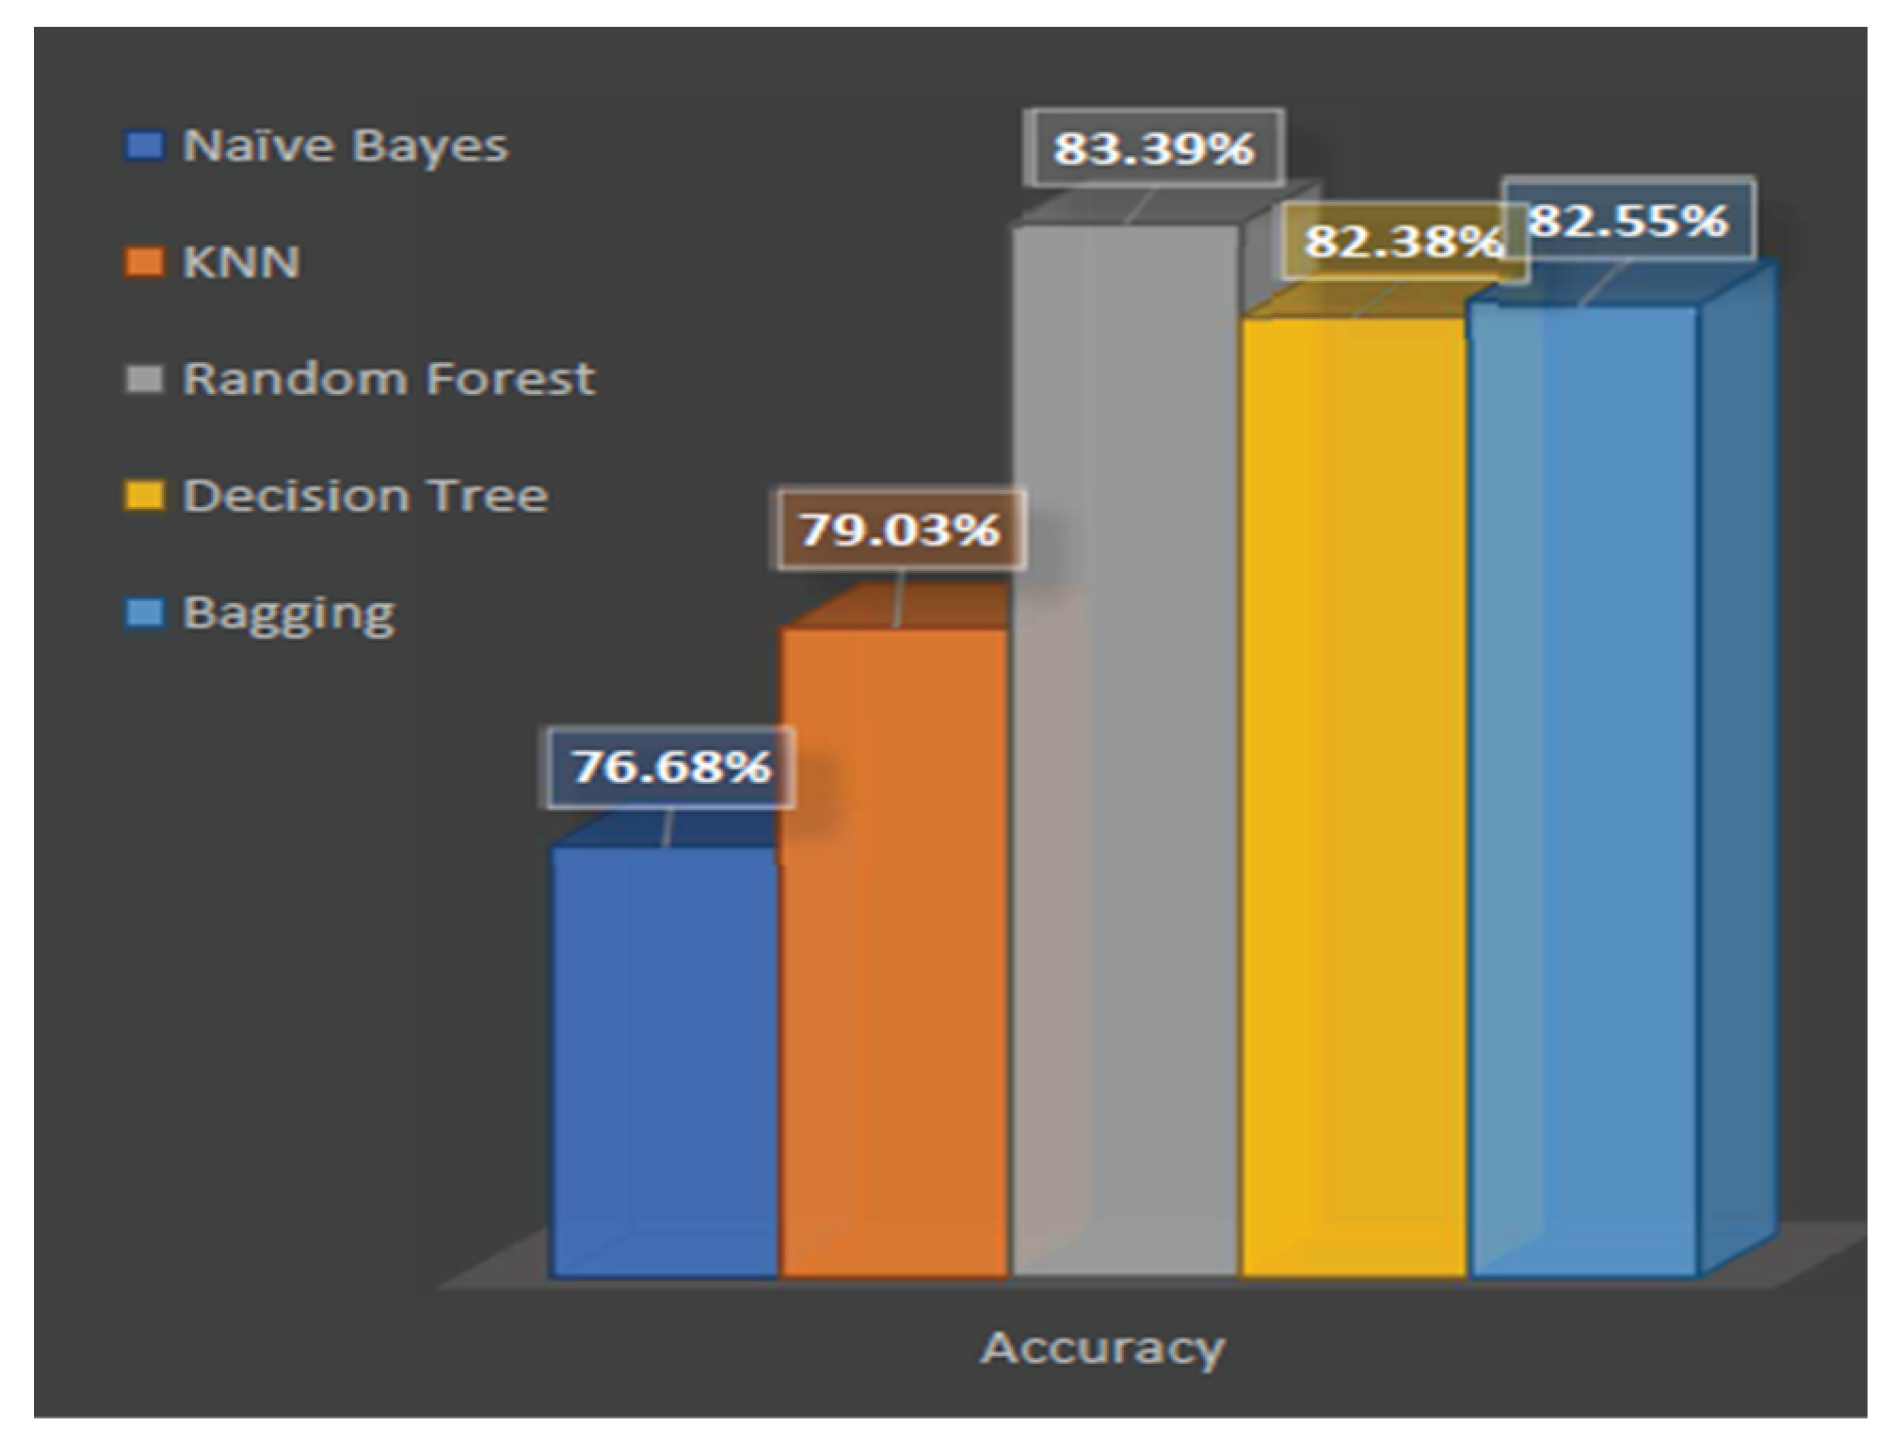
After performing all the calculations, it has been found that Random Forest, which has hyperparameter tuning, pruning, pre-pruning, and an increased number of trees, achieves the highest accuracy compared to all other classifiers. Table 10 shows benchmark comparison. Final accuracy comparison is shown in Figure 8.
Table 10.
Benchmark Comparison.
| Authors | Dataset | Classifier | Outcomes |
|---|---|---|---|
| [1] | Travel Insurance Prediction Data | Random Forest, Decision Tree | 78% |
| [2] | Insurance Transaction Data | KNN | 81% |
| [3] | Travel Insurance Prediction Data | Logistic Regression | 72% |
| [4] | Malaysia Travel Insurance Survey | Multiple Regression Analysis | 73.25% |
| [5] | Travel Insurance Prediction Data | KNN | 78% |
| Nazmus Sakib [6] | Travel Insurance Prediction Data | Gradient Boosting | 81.5% |
| Proposed Research | Travel Insurance Prediction Data | Random Forest | 83.39% |
Figure 8.
Parameter Tuning.
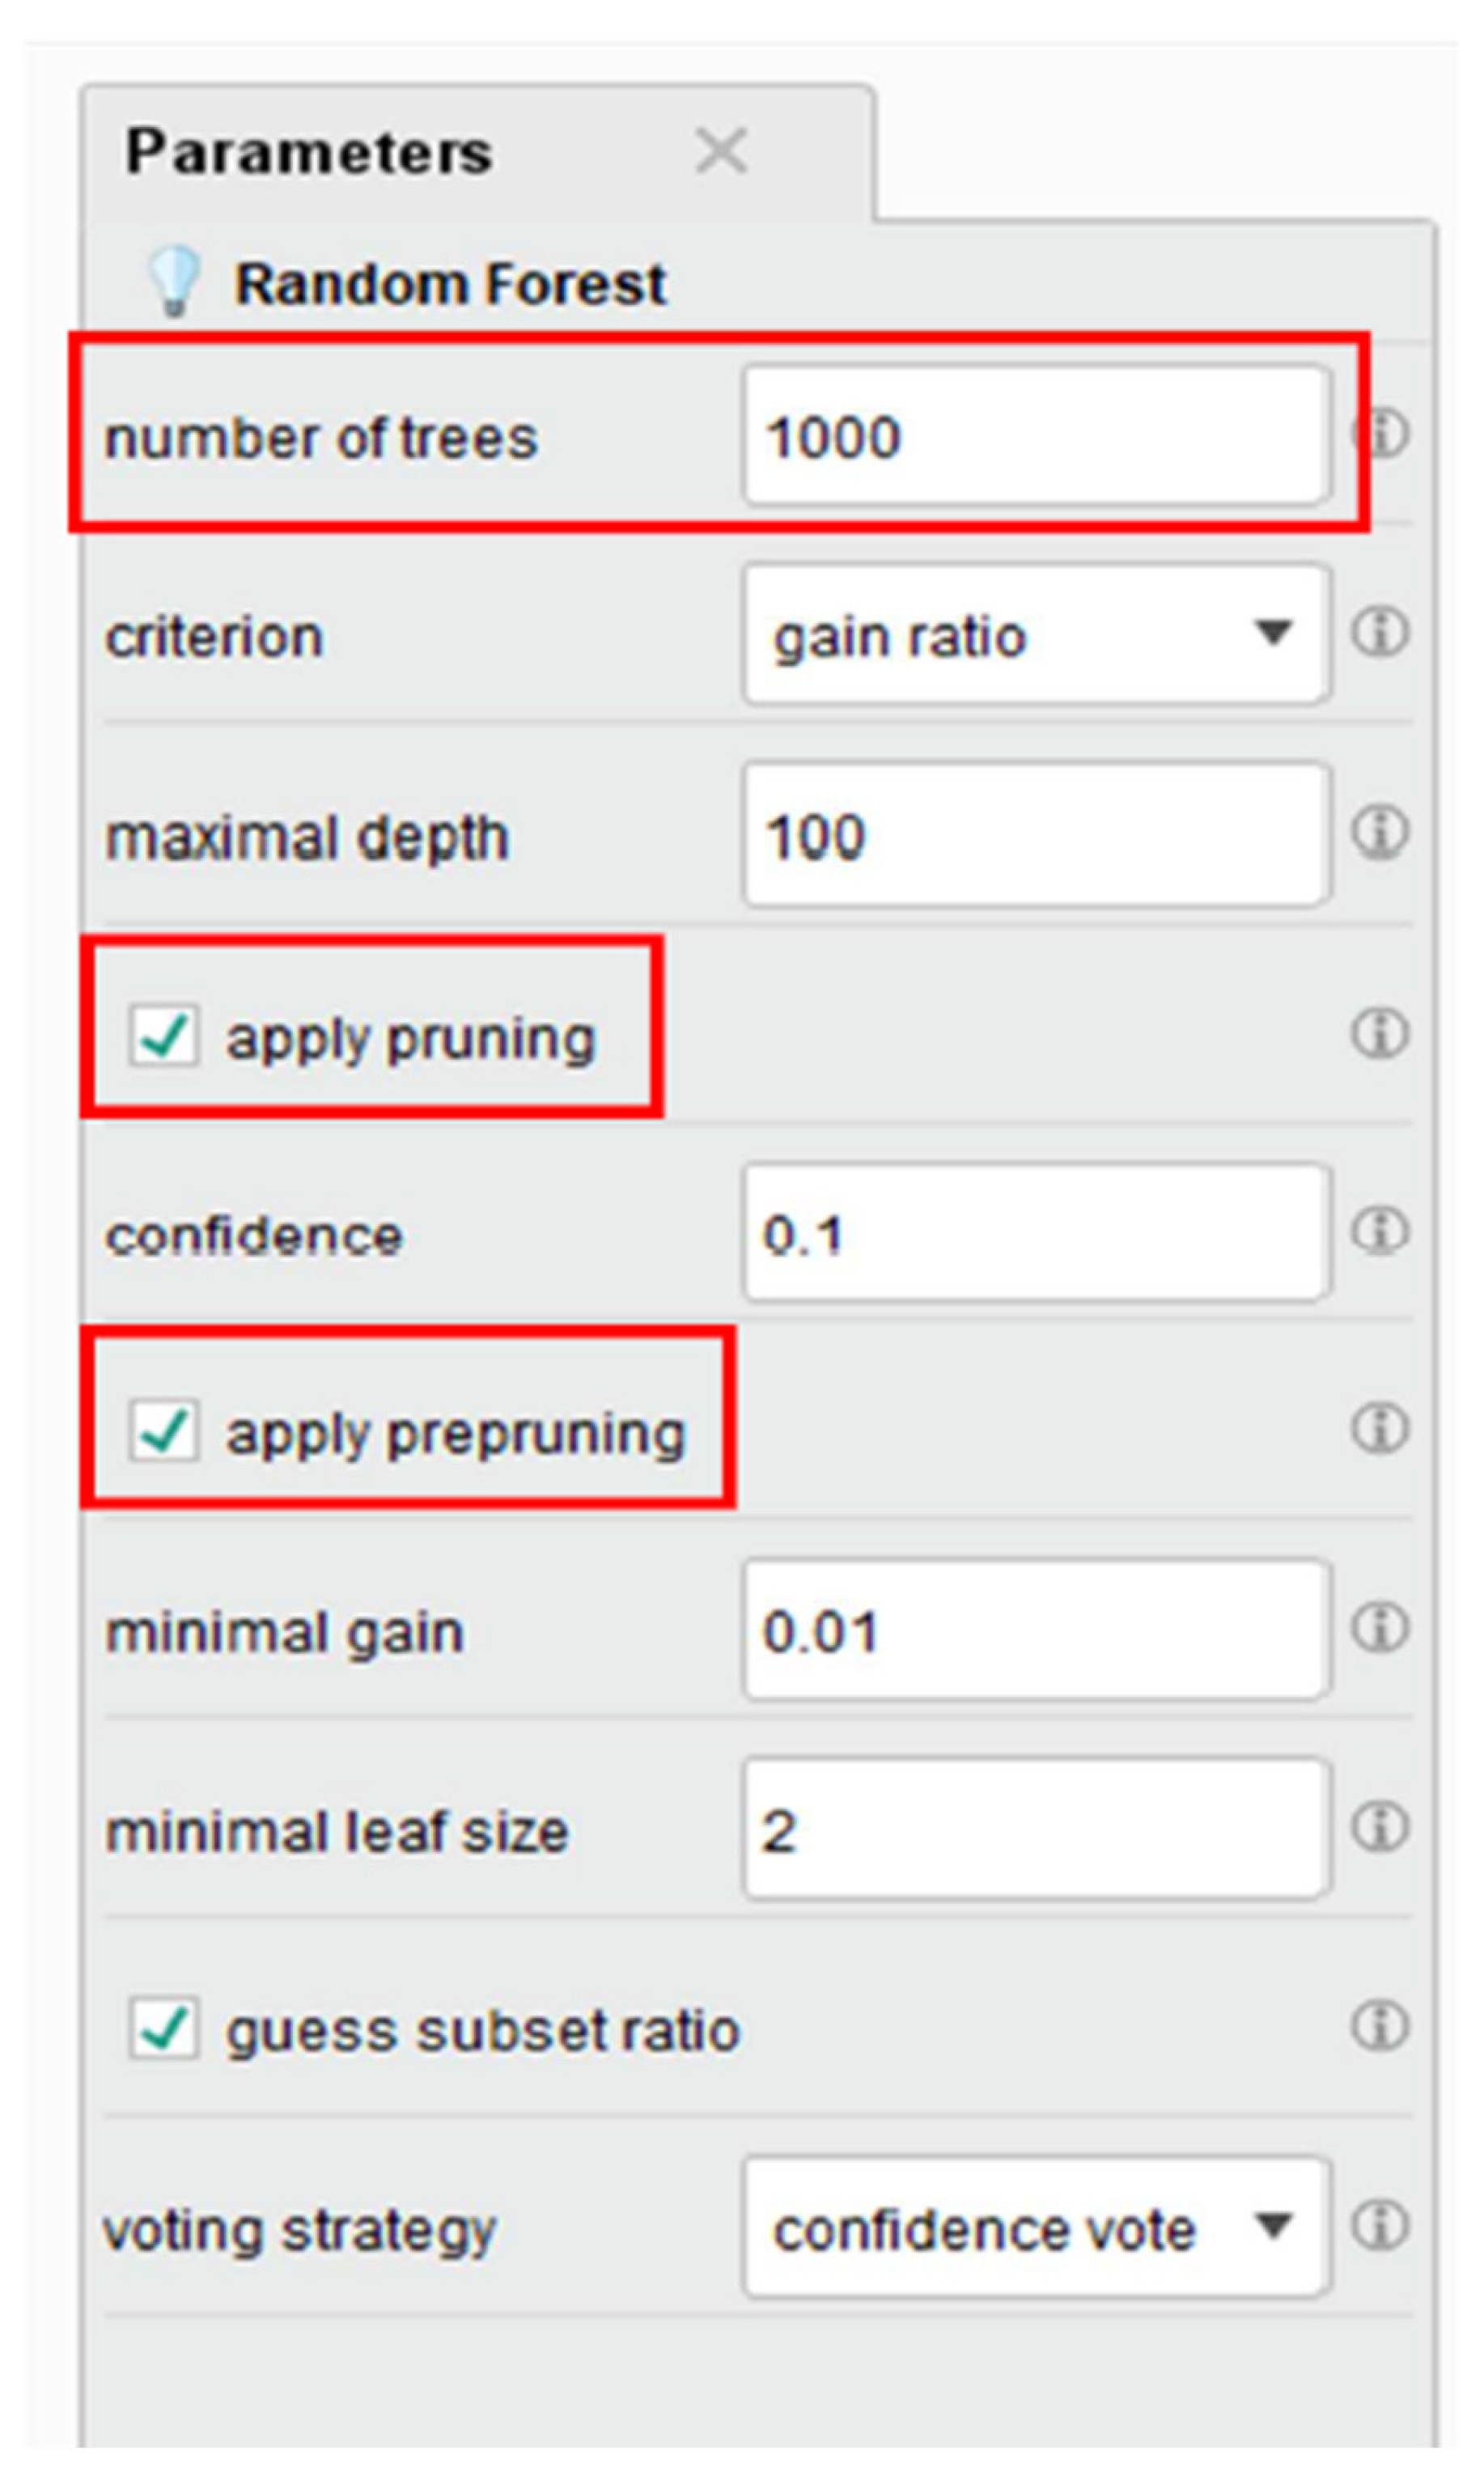
Figure 8.
Final Accuracy Comparison.
5. Conclusions
This research presents a machine learning-based approach to predict travel insurance purchases by analyzing customer demographics, travel behavior, and other related attributes. Multiple classification algorithms were applied, including Naïve Bayes, KNN, Decision Tree, Bagging, and Random Forest. Among these, the Random Forest algorithm delivered the highest performance, achieving an accuracy of 83.39%, along with superior precision and recall metrics. The model’s performance was further enhanced through hyperparameter tuning, pruning, and increasing the number of trees, making it the most reliable among all classifiers tested. Future research can be directed towards expanding the dataset with real-time and more diverse data sources and incorporating deep learning models
References
- M. A. Rubi, M. Hasan Imam Bijoy, S. Chowdhury, and M. K. Islam, “Machine Learning Prediction of Consumer Travel Insurance Purchase Behavior,” in 2022 13th International Conference on Computing Communication and Networking Technologies (ICCCNT), IEEE, 2022. [CrossRef]
- S. D. F. Lopes, A. Rial Boubeta, and J. Varela Mallou, “Post Hoc Tourist Segmentation with Conjoint and Cluster Analysis,” PASOS Revista de Turismo y Patrimonio Cultural, vol. 7, no. 3, pp. 491–501, 2009. [CrossRef]
- E. Koc, “The Role of Family Members in the Family Holiday Purchase Decision-Making Process,” International Journal of Hospitality and Tourism Administration, vol. 5, no. 2, pp. 85–102, Oct. 2004. [CrossRef]
- D. Genceli, G. Yüksek, and S. Uca, “Travel Insurance Behaviors of Digital Nomads,” Worldwide Hospitality and Tourism Themes, vol. 16, no. 3, pp. 365–374, Jun. 2024. [CrossRef]
- D. Amir Hamzah, “Predicting Travel Insurance Policy Claim Using Logistic Regression,” Applied Quantitative Analysis, vol. 1, no. 1, pp. 1–7, Sep. 2021. [CrossRef]
- S. Petrus, A. F. Yahya, and F. Yahya, “Domestic Travelers’ Perceptions and Intention to Purchase Travel Insurance,” MDPI Proceedings, Sep. 2022, p. 74. [CrossRef]
- J. Almansoori, H. S. Alghfeli, and H. Nobanee, “Travel Insurance Trends and Insights,” SSRN Electronic Journal, 2024. [CrossRef]
- N. Sakib, “Machine Learning-based Travel Time Prediction Models for Complex Traffic Conditions.” Available at: https://www.researchgate.net/publication/387270224.
- U. Rehman et al., “A Machine Learning-Based Framework for Accurate and Early Diagnosis of Liver Diseases: A Comprehensive Study on Feature Selection, Data Imbalance, and Algorithmic Performance,” International Journal of Intelligent Systems, vol. 2024, no. 1, Jan. 2024. [CrossRef]
- T. M. Ali et al., “A Sequential Machine Learning-cum-Attention Mechanism for Effective Segmentation of Brain Tumor,” Frontiers in Oncology, vol. 12, Jun. 2022. [CrossRef]
- Mir et al., “A Novel Approach for the Effective Prediction of Cardiovascular Disease Using Applied Artificial Intelligence Techniques,” ESC Heart Failure, Jul. 2024. [CrossRef]
- Muzafar, S., & Jhanjhi, N. Z. (2020). Success stories of ICT implementation in Saudi Arabia. In Employing Recent Technologies for Improved Digital Governance (pp. 151-163). IGI Global Scientific Publishing.
- Jabeen, T., Jabeen, I., Ashraf, H., Jhanjhi, N. Z., Yassine, A., & Hossain, M. S. (2023). An intelligent healthcare system using IoT in wireless sensor network. Sensors, 23(11), 5055.
- Shah, I. A., Jhanjhi, N. Z., & Laraib, A. (2023). Cybersecurity and blockchain usage in contemporary business. In Handbook of Research on Cybersecurity Issues and Challenges for Business and FinTech Applications (pp. 49-64). IGI Global.
- Hanif, M., Ashraf, H., Jalil, Z., Jhanjhi, N. Z., Humayun, M., Saeed, S., & Almuhaideb, A. M. (2022). AI-based wormhole attack detection techniques in wireless sensor networks. Electronics, 11(15), 2324.
- Shah, I. A., Jhanjhi, N. Z., Amsaad, F., & Razaque, A. (2022). The role of cutting-edge technologies in industry 4.0. In Cyber Security Applications for Industry 4.0 (pp. 97-109). Chapman and Hall/CRC.
- Humayun, M., Almufareh, M. F., & Jhanjhi, N. Z. (2022). Autonomous traffic system for emergency vehicles. Electronics, 11(4), 510.
- Muzammal, S. M., Murugesan, R. K., Jhanjhi, N. Z., & Jung, L. T. (2020, October). SMTrust: Proposing trust-based secure routing protocol for RPL attacks for IoT applications. In 2020 International Conference on Computational Intelligence (ICCI) (pp. 305-310). IEEE.
- Brohi, S. N., Jhanjhi, N. Z., Brohi, N. N., & Brohi, M. N. (2023). Key applications of state-of-the-art technologies to mitigate and eliminate COVID-19. Authorea Preprints.
- Khalil, M. I., Humayun, M., Jhanjhi, N. Z., Talib, M. N., & Tabbakh, T. A. (2021). Multi-class segmentation of organ at risk from abdominal ct images: A deep learning approach. In Intelligent Computing and Innovation on Data Science: Proceedings of ICTIDS 2021 (pp. 425-434). Singapore: Springer Nature Singapore.
- Humayun, M., Jhanjhi, N. Z., Niazi, M., Amsaad, F., & Masood, I. (2022). Securing drug distribution systems from tampering using blockchain. Electronics, 11(8), 1195.
Figure 1.
Top Benefits of Travel Insurance.
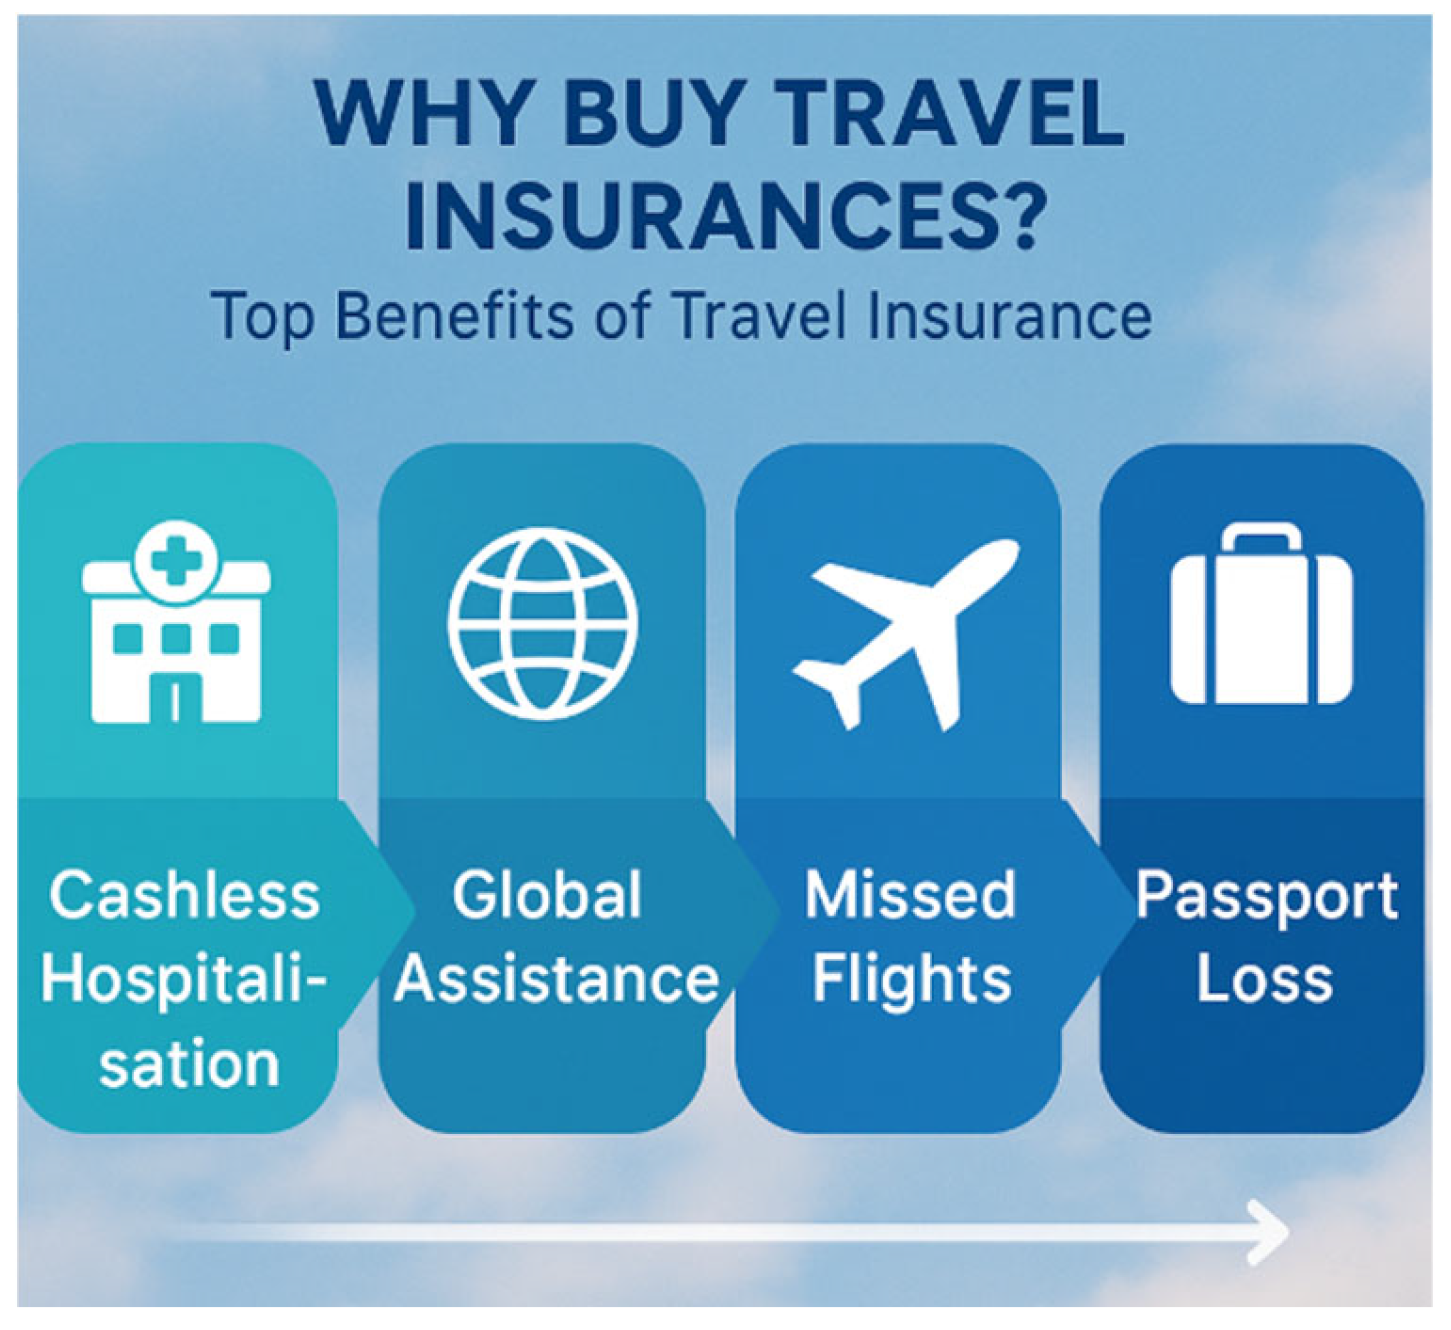
Figure 2.
Age Groups and Travel Insurance.
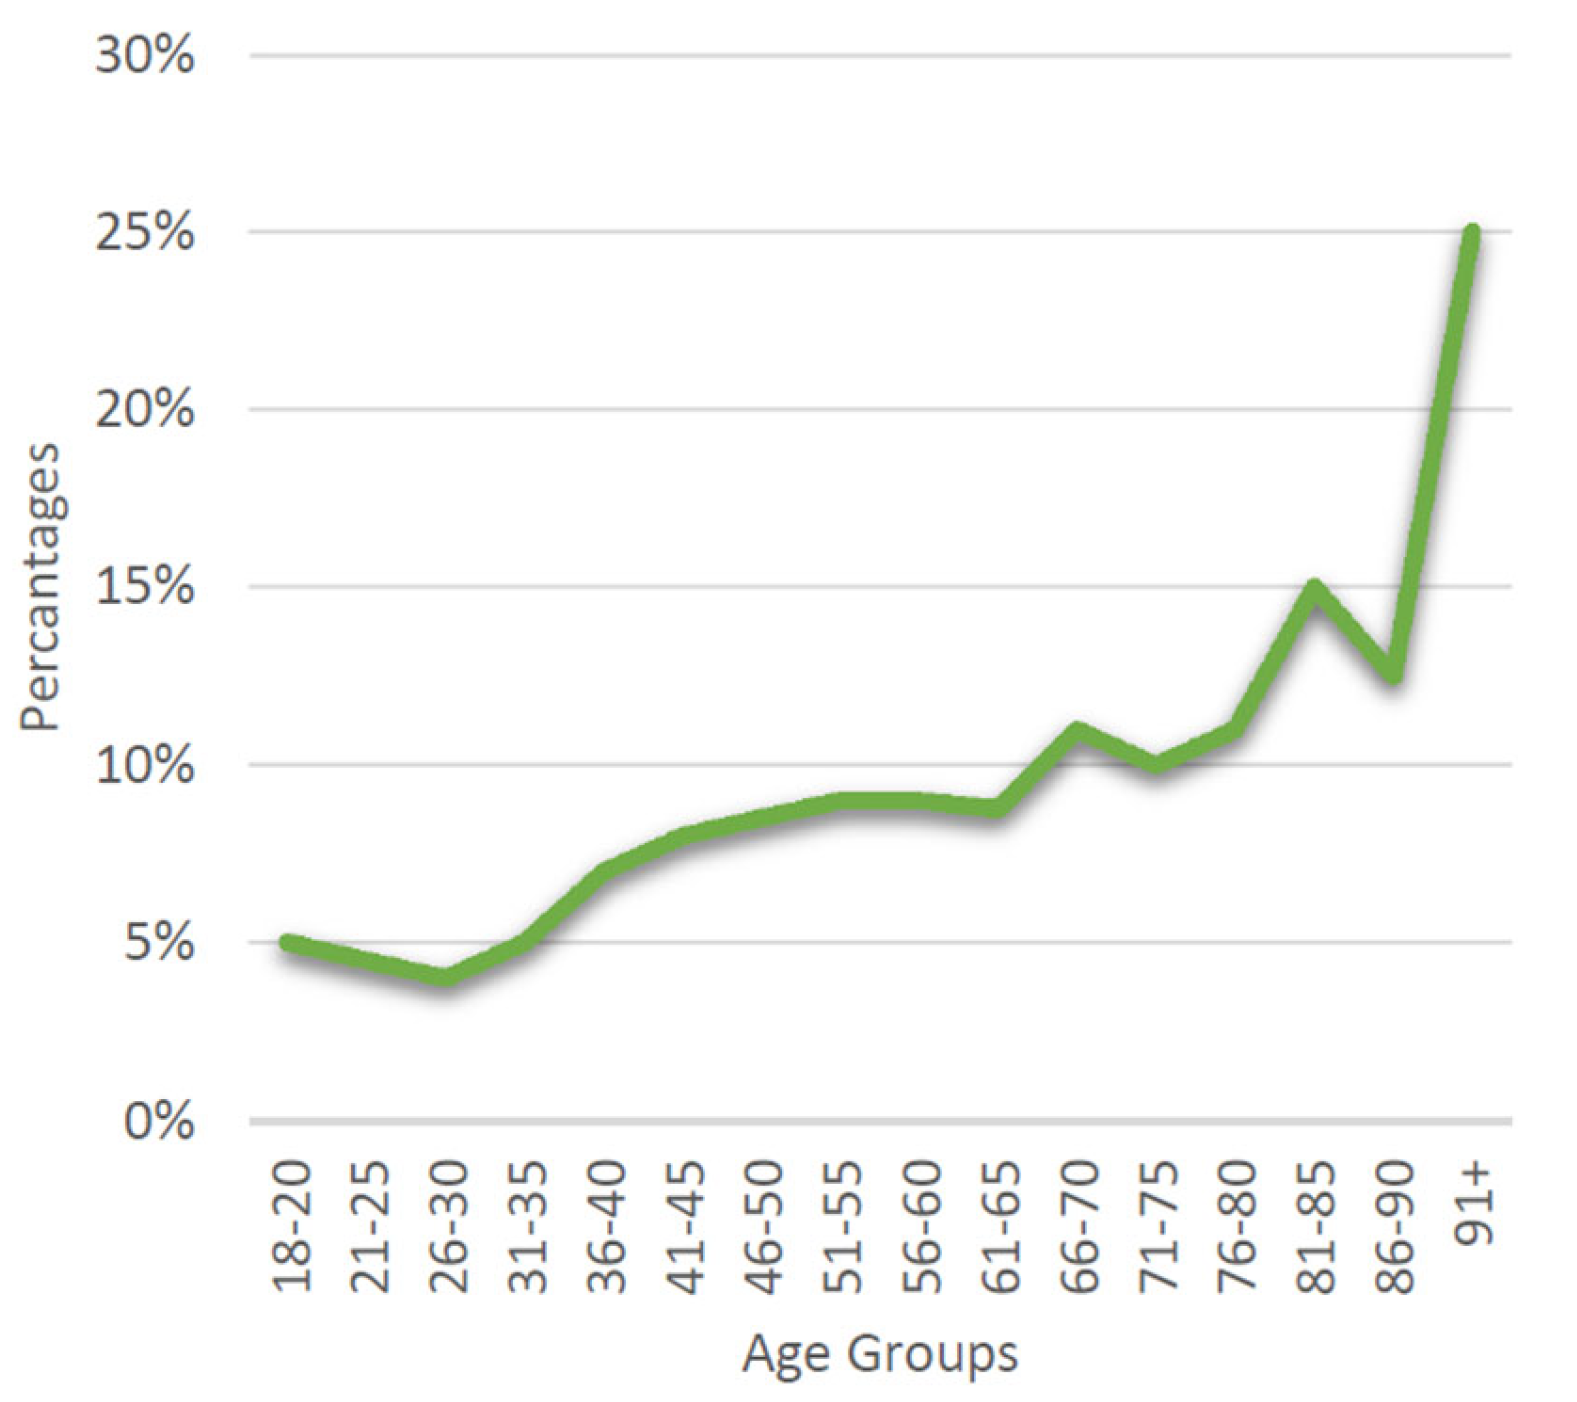
Figure 3.
Reasons Report of Travel Insurance.
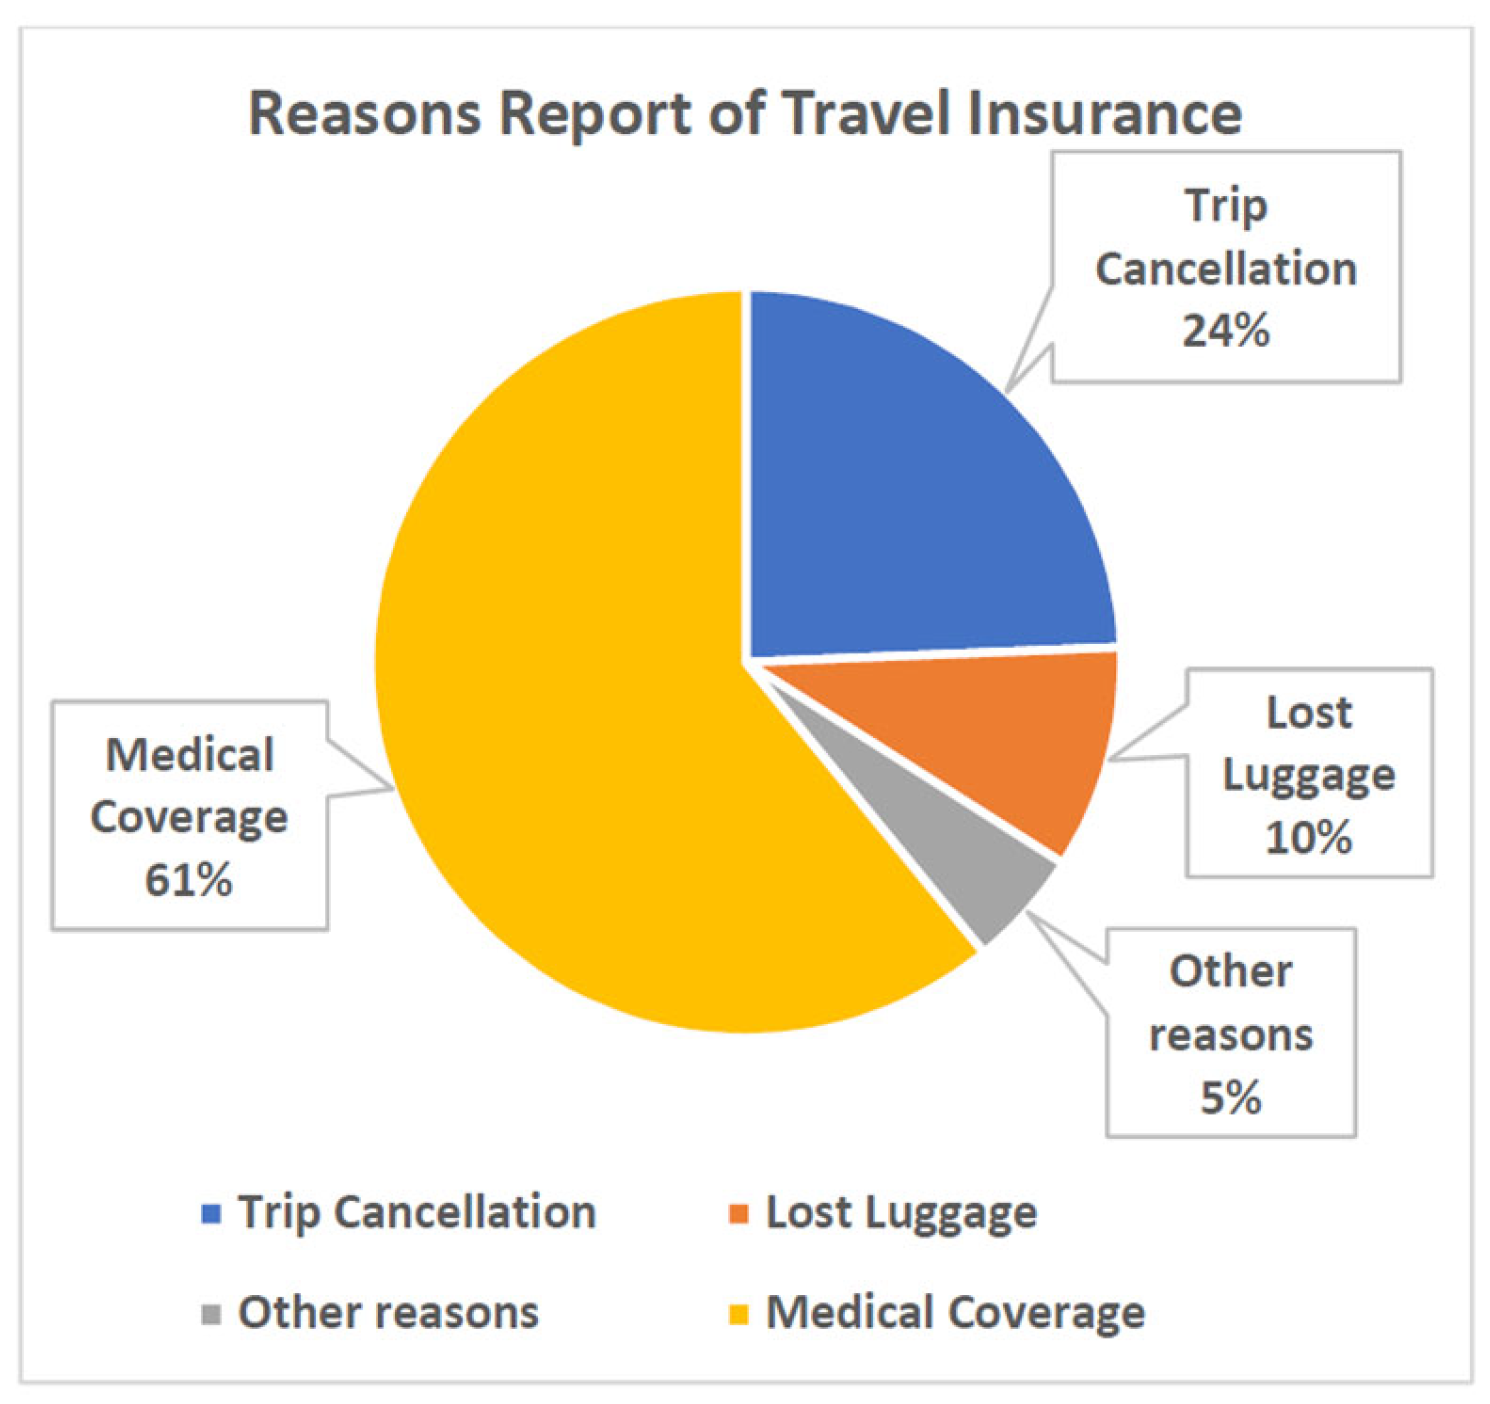
Figure 4.
Paper Flow Diagram.
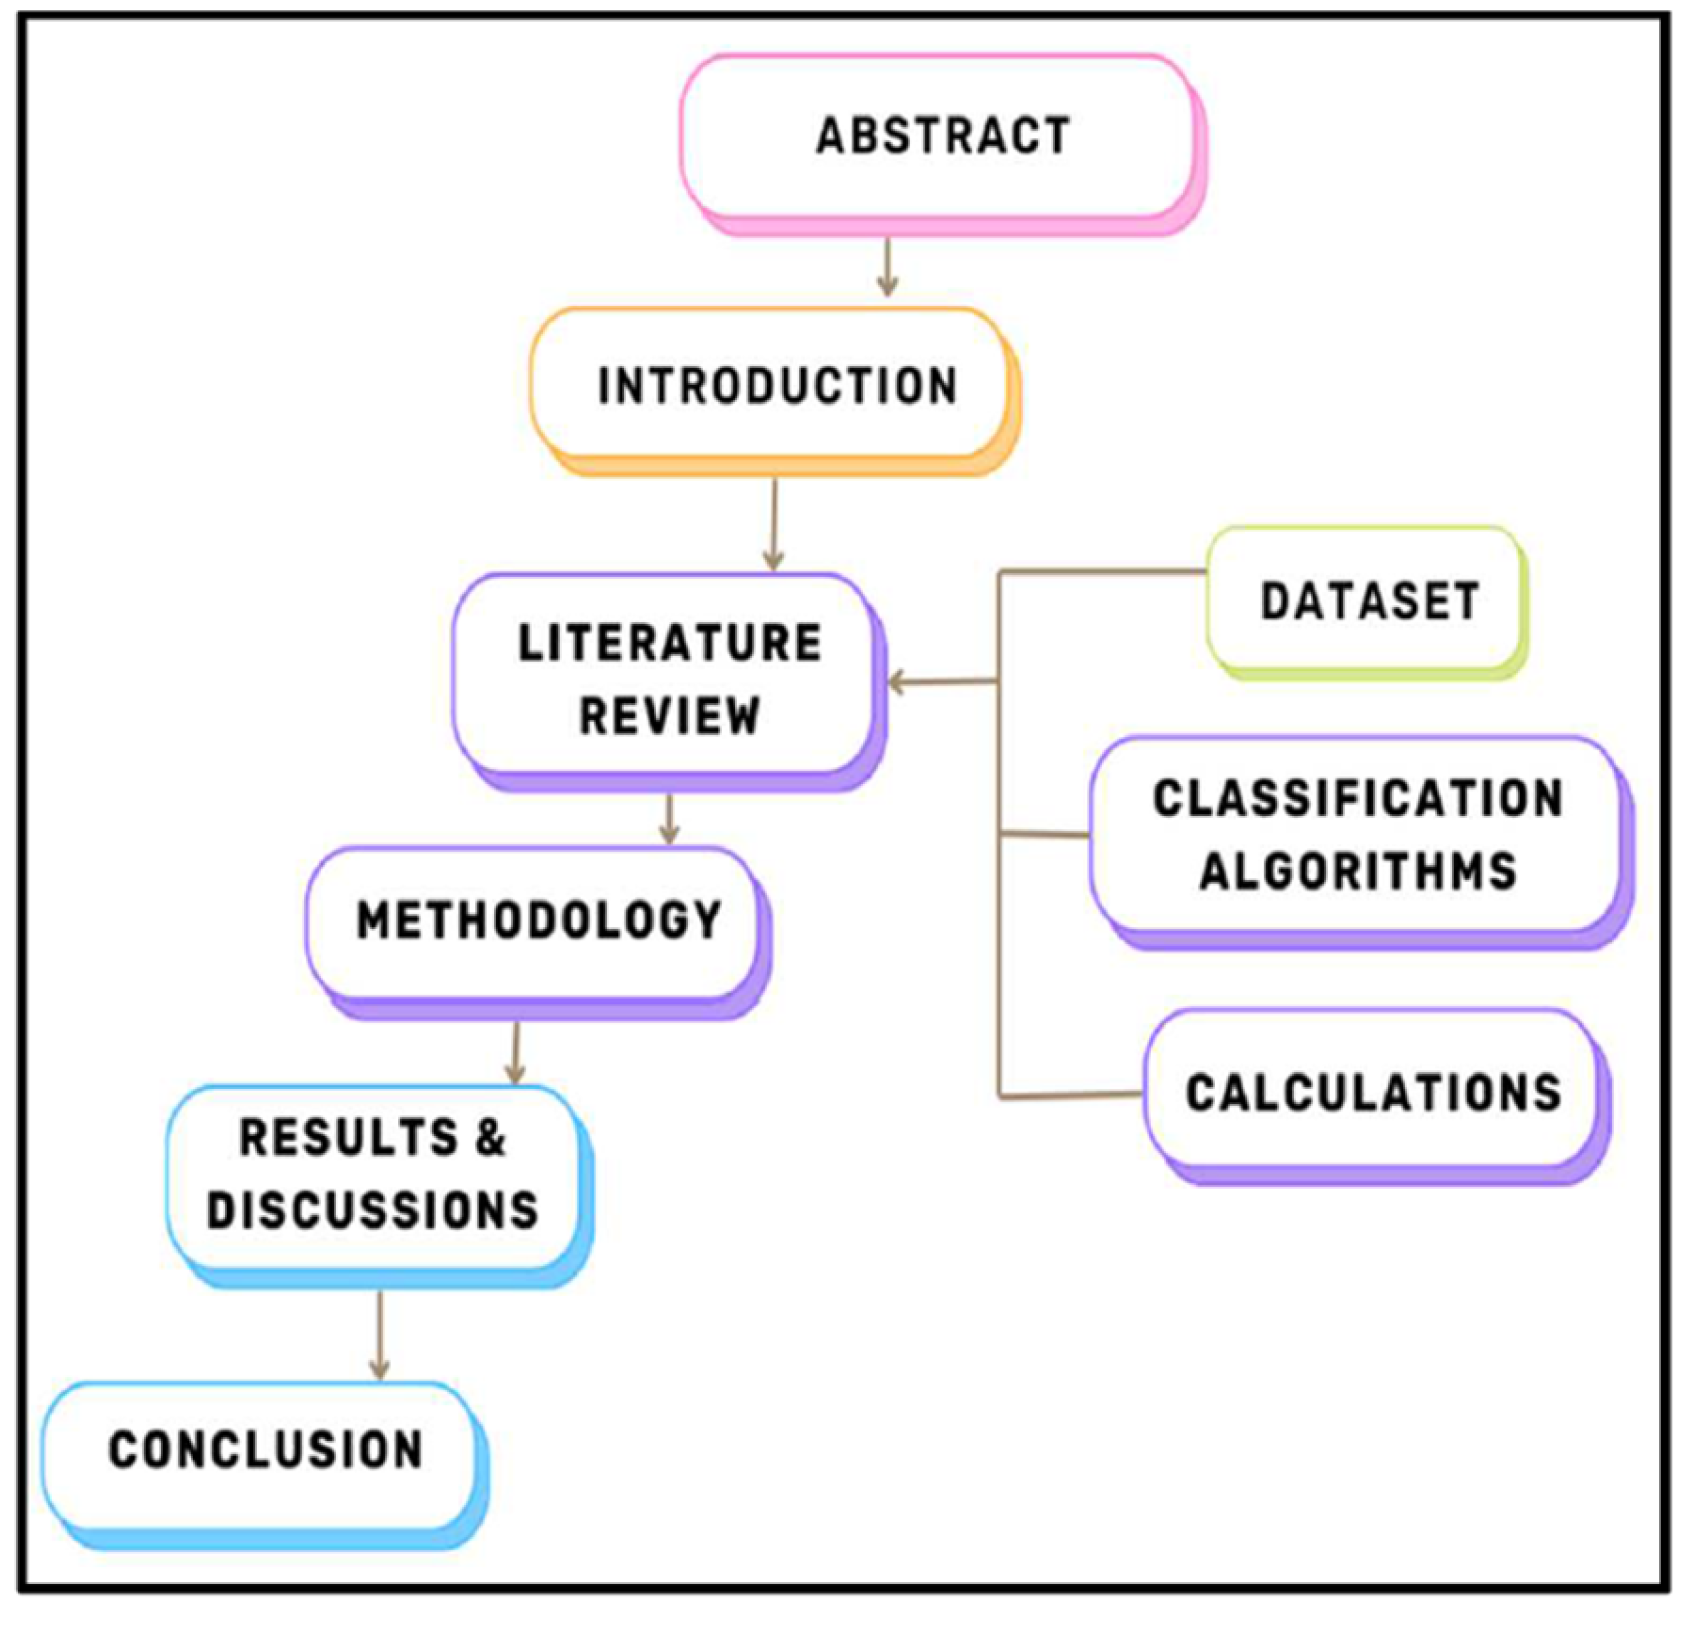
Figure 5.
Flowchart of Methodology.
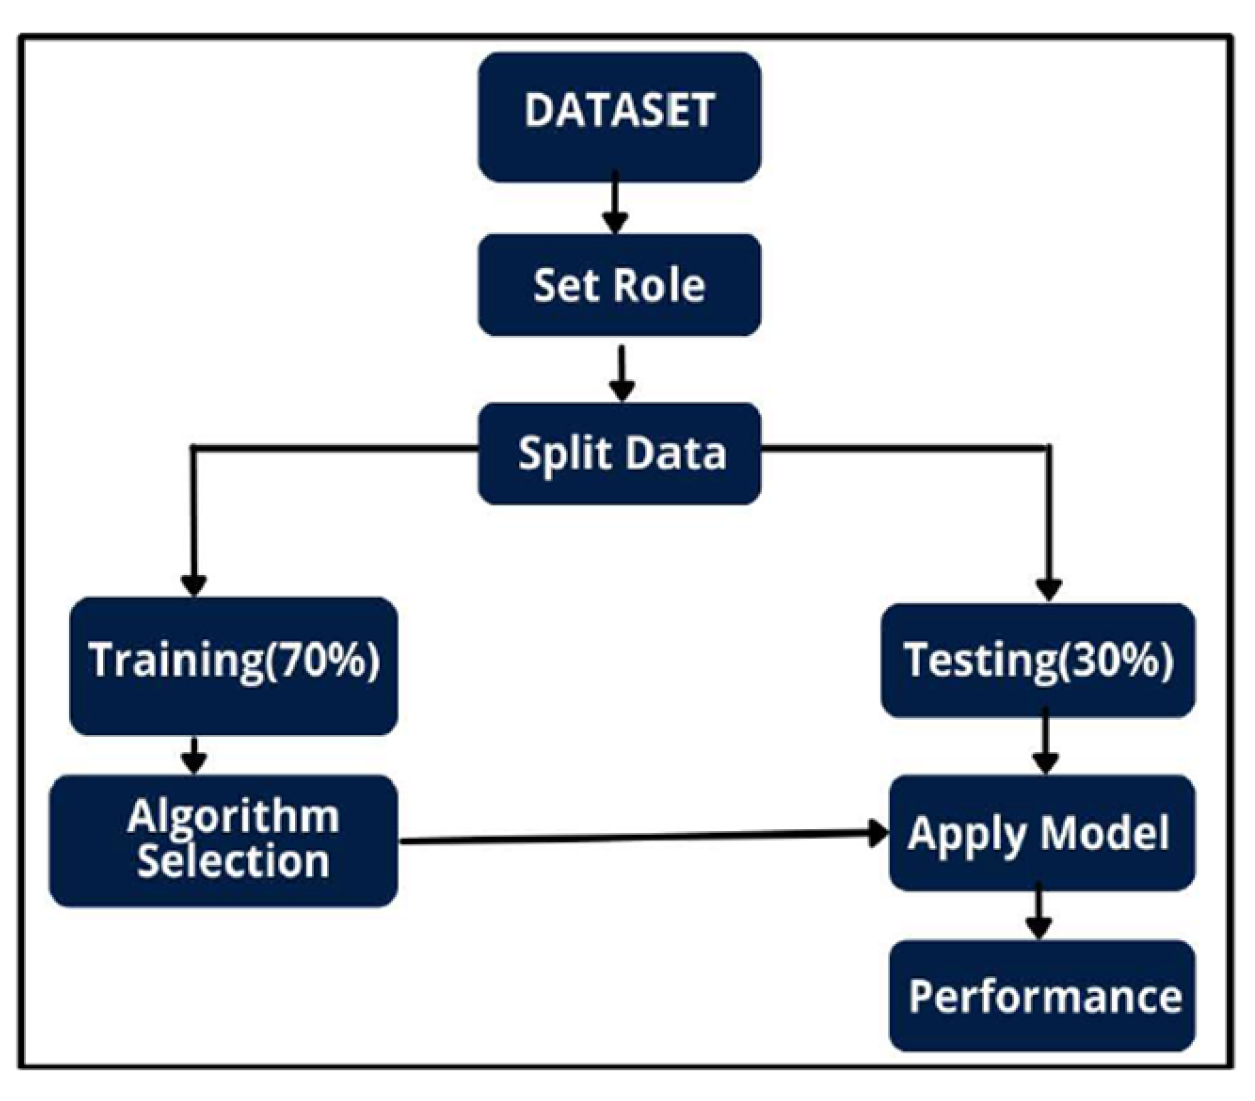
Figure 7.
Rapid Miner Model.
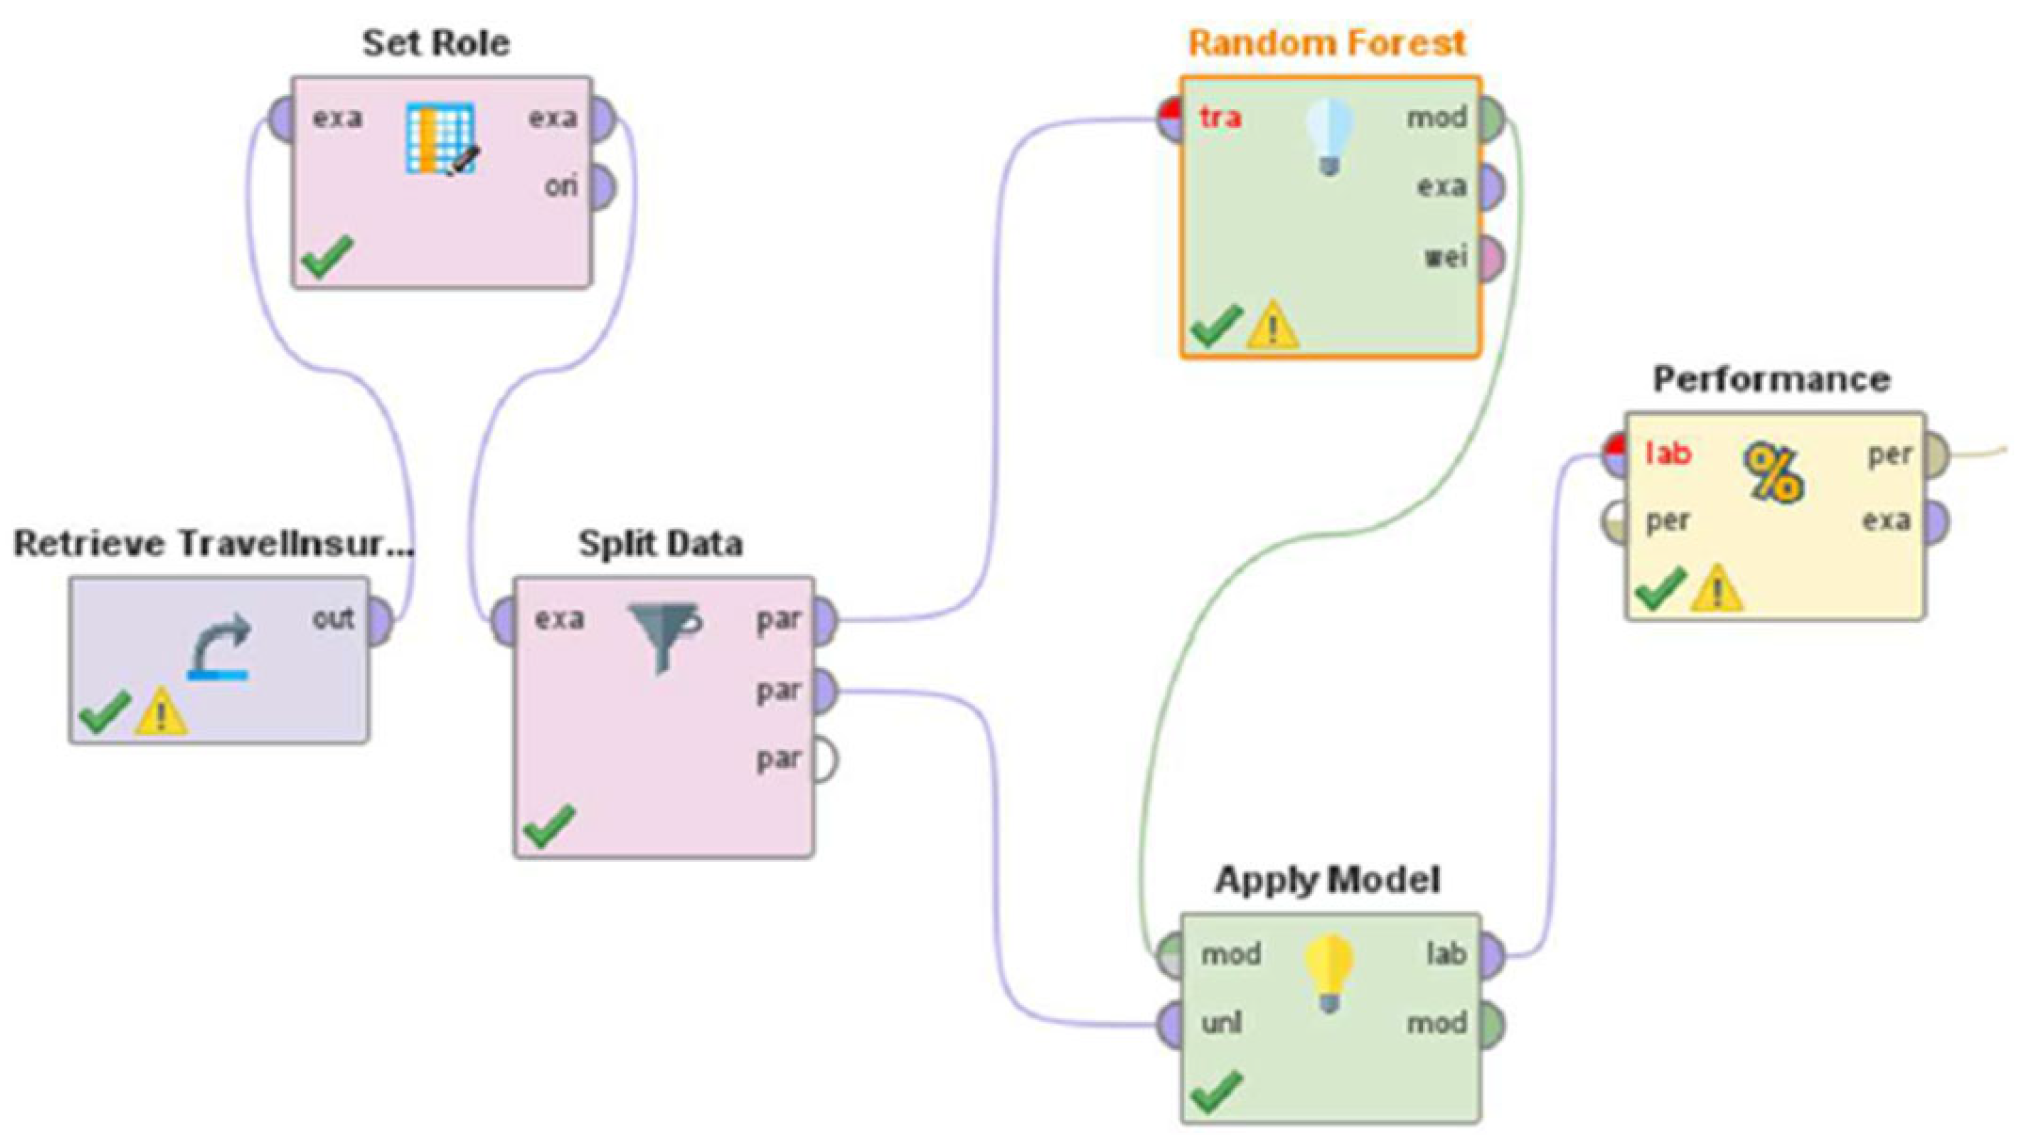
Table 2.
Attributes of the Dataset.
| Sr. No. | Attribute Name | Description | Data Type |
|---|---|---|---|
| 1 | Age | Customer's age | Integer |
| 2 | Employment Type | Type of employment | Categorical |
| 3 | GraduateOrNot | Whether the customer is a college graduate | Categorical |
| 4 | AnnualIncome | Annual income of the customer | Integer |
| 5 | FamilyMembers | Number of family members | Integer |
| 6 | ChronicDisease | Presence of a chronic disease | Categorical |
| 7 | FrequentFlyer | Whether the customer frequently flies | Categorical |
| 8 | EverTravelledAbroad | Whether the customer has traveled abroad | Boolean |
| 9 | TravelInsurance | Travel insurance purchase (1 = Yes, 0 = No) | Boolean |
Disclaimer/Publisher’s Note: The statements, opinions and data contained in all publications are solely those of the individual author(s) and contributor(s) and not of MDPI and/or the editor(s). MDPI and/or the editor(s) disclaim responsibility for any injury to people or property resulting from any ideas, methods, instructions or products referred to in the content. |
© 2025 by the authors. Licensee MDPI, Basel, Switzerland. This article is an open access article distributed under the terms and conditions of the Creative Commons Attribution (CC BY) license (https://creativecommons.org/licenses/by/4.0/).
Copyright: This open access article is published under a Creative Commons CC BY 4.0 license, which permit the free download, distribution, and reuse, provided that the author and preprint are cited in any reuse.


