
Submitted:
18 November 2025
Posted:
20 November 2025
You are already at the latest version
Abstract
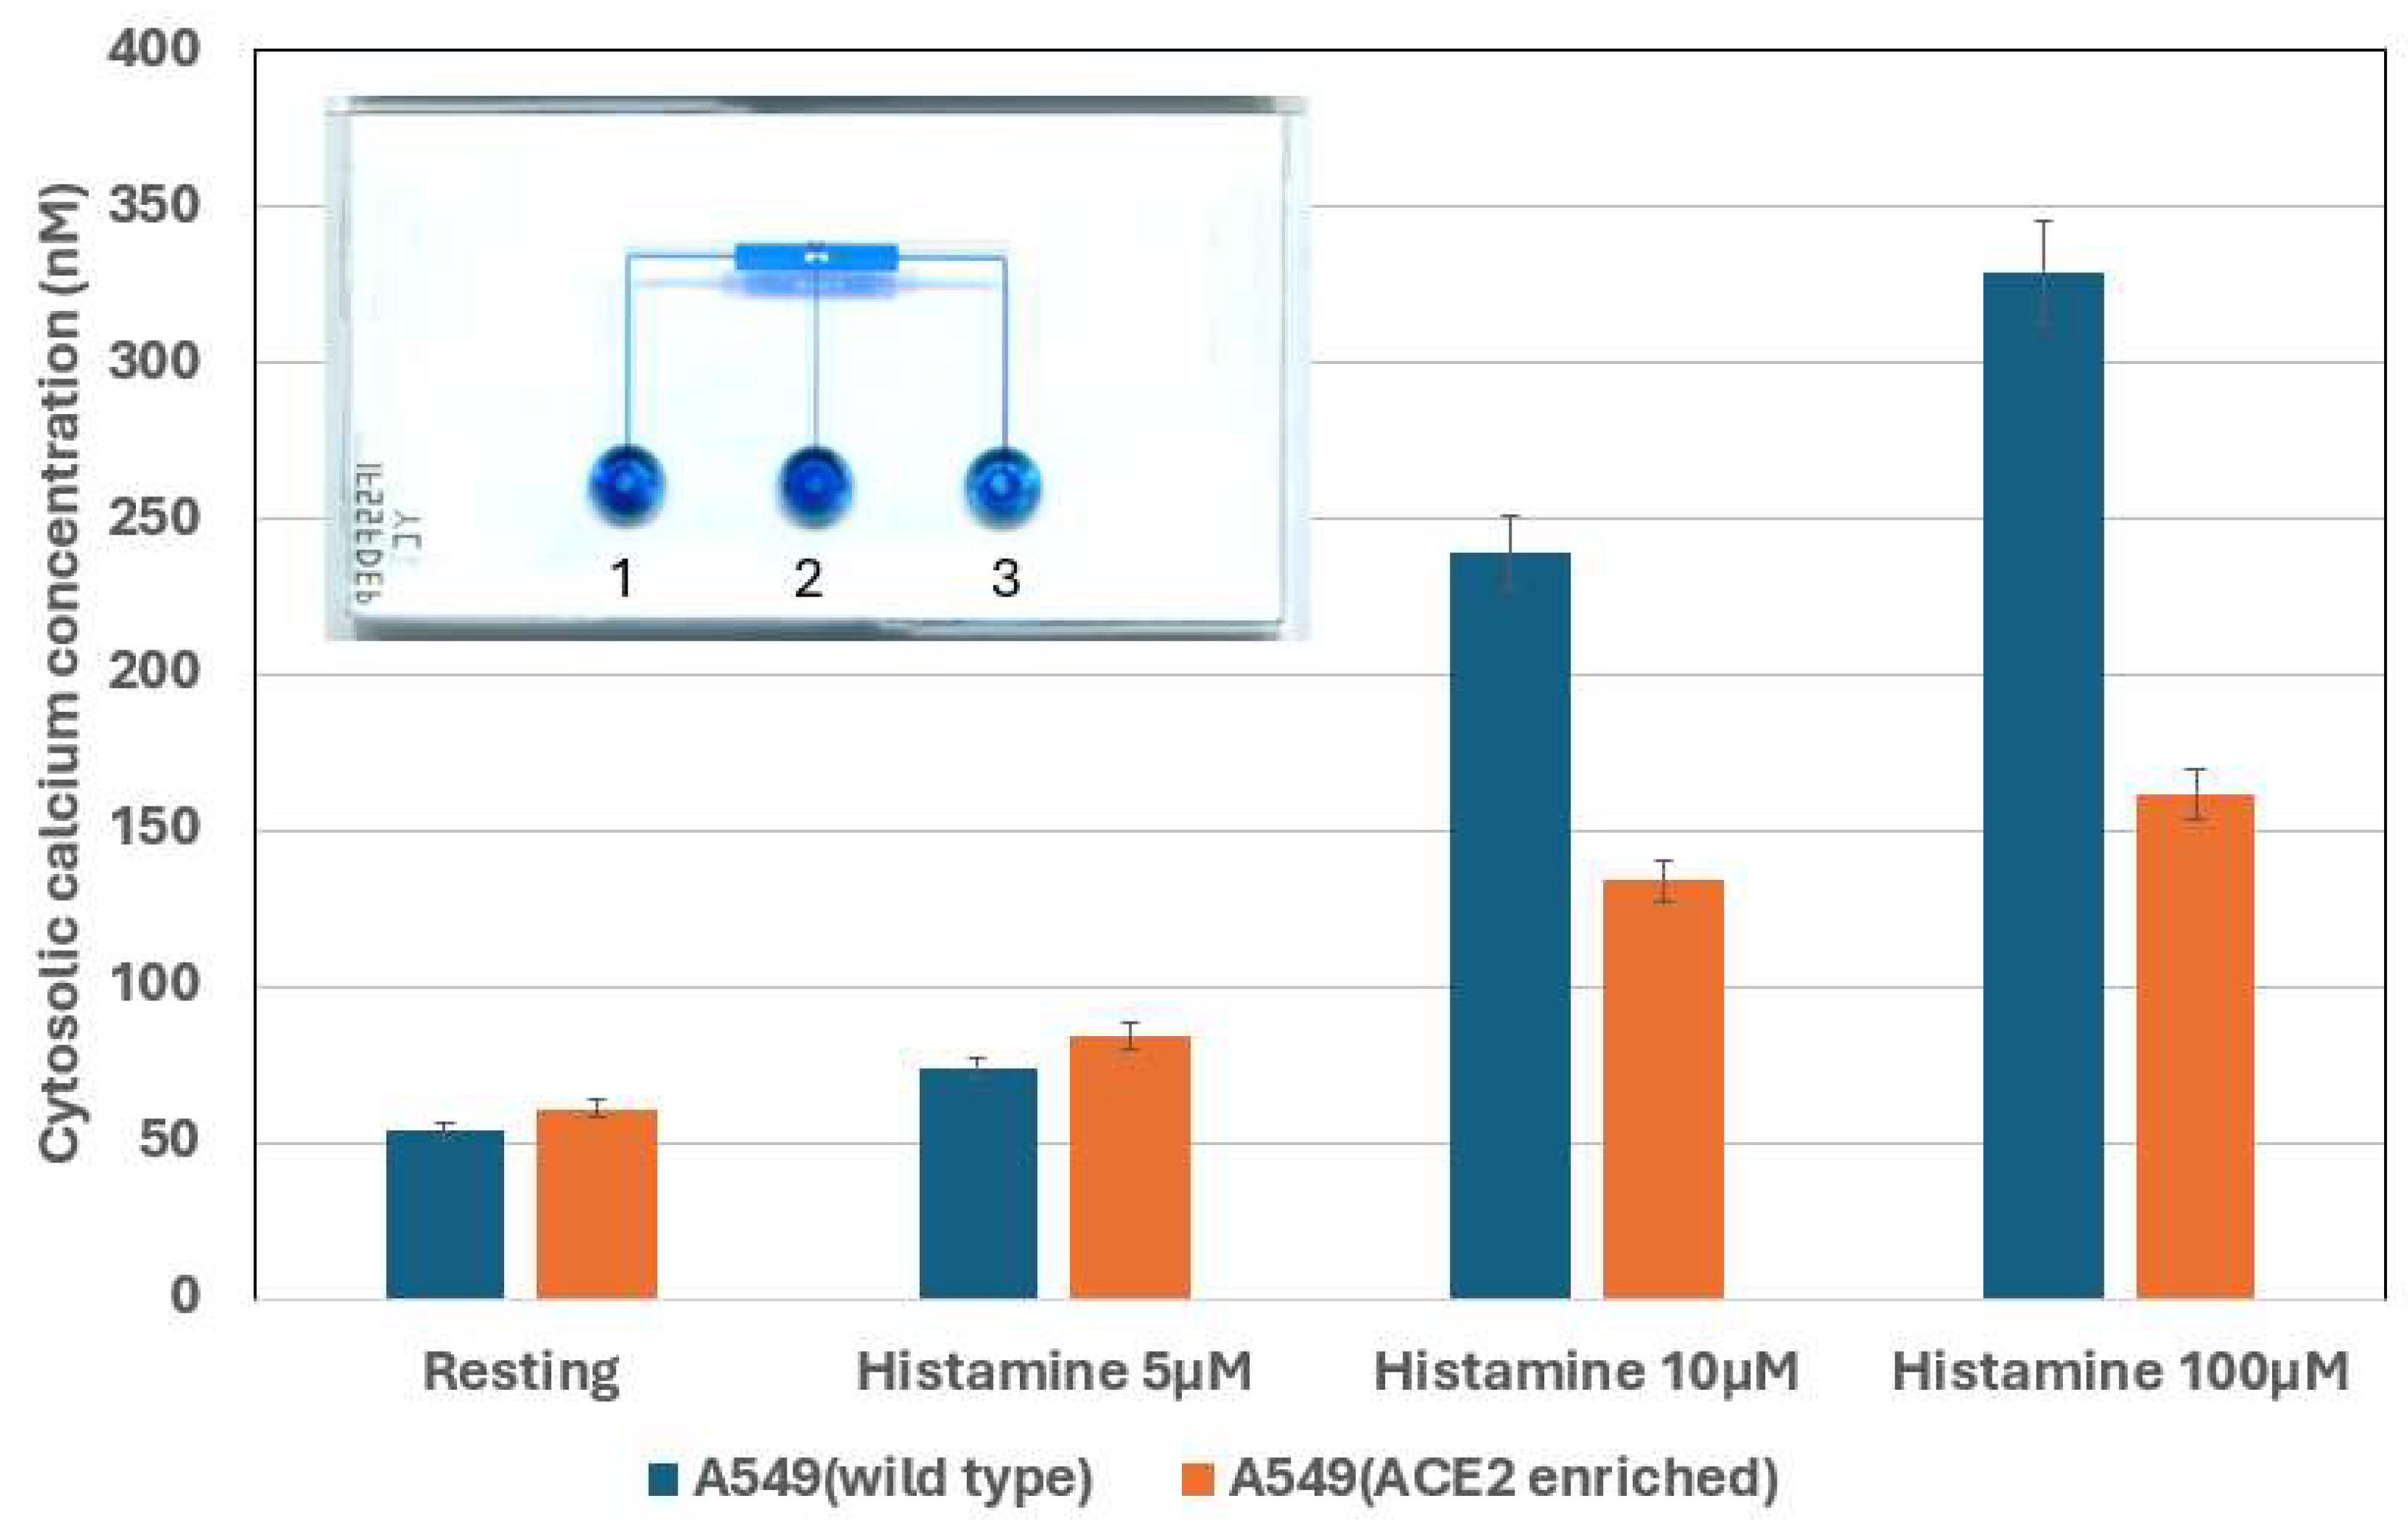
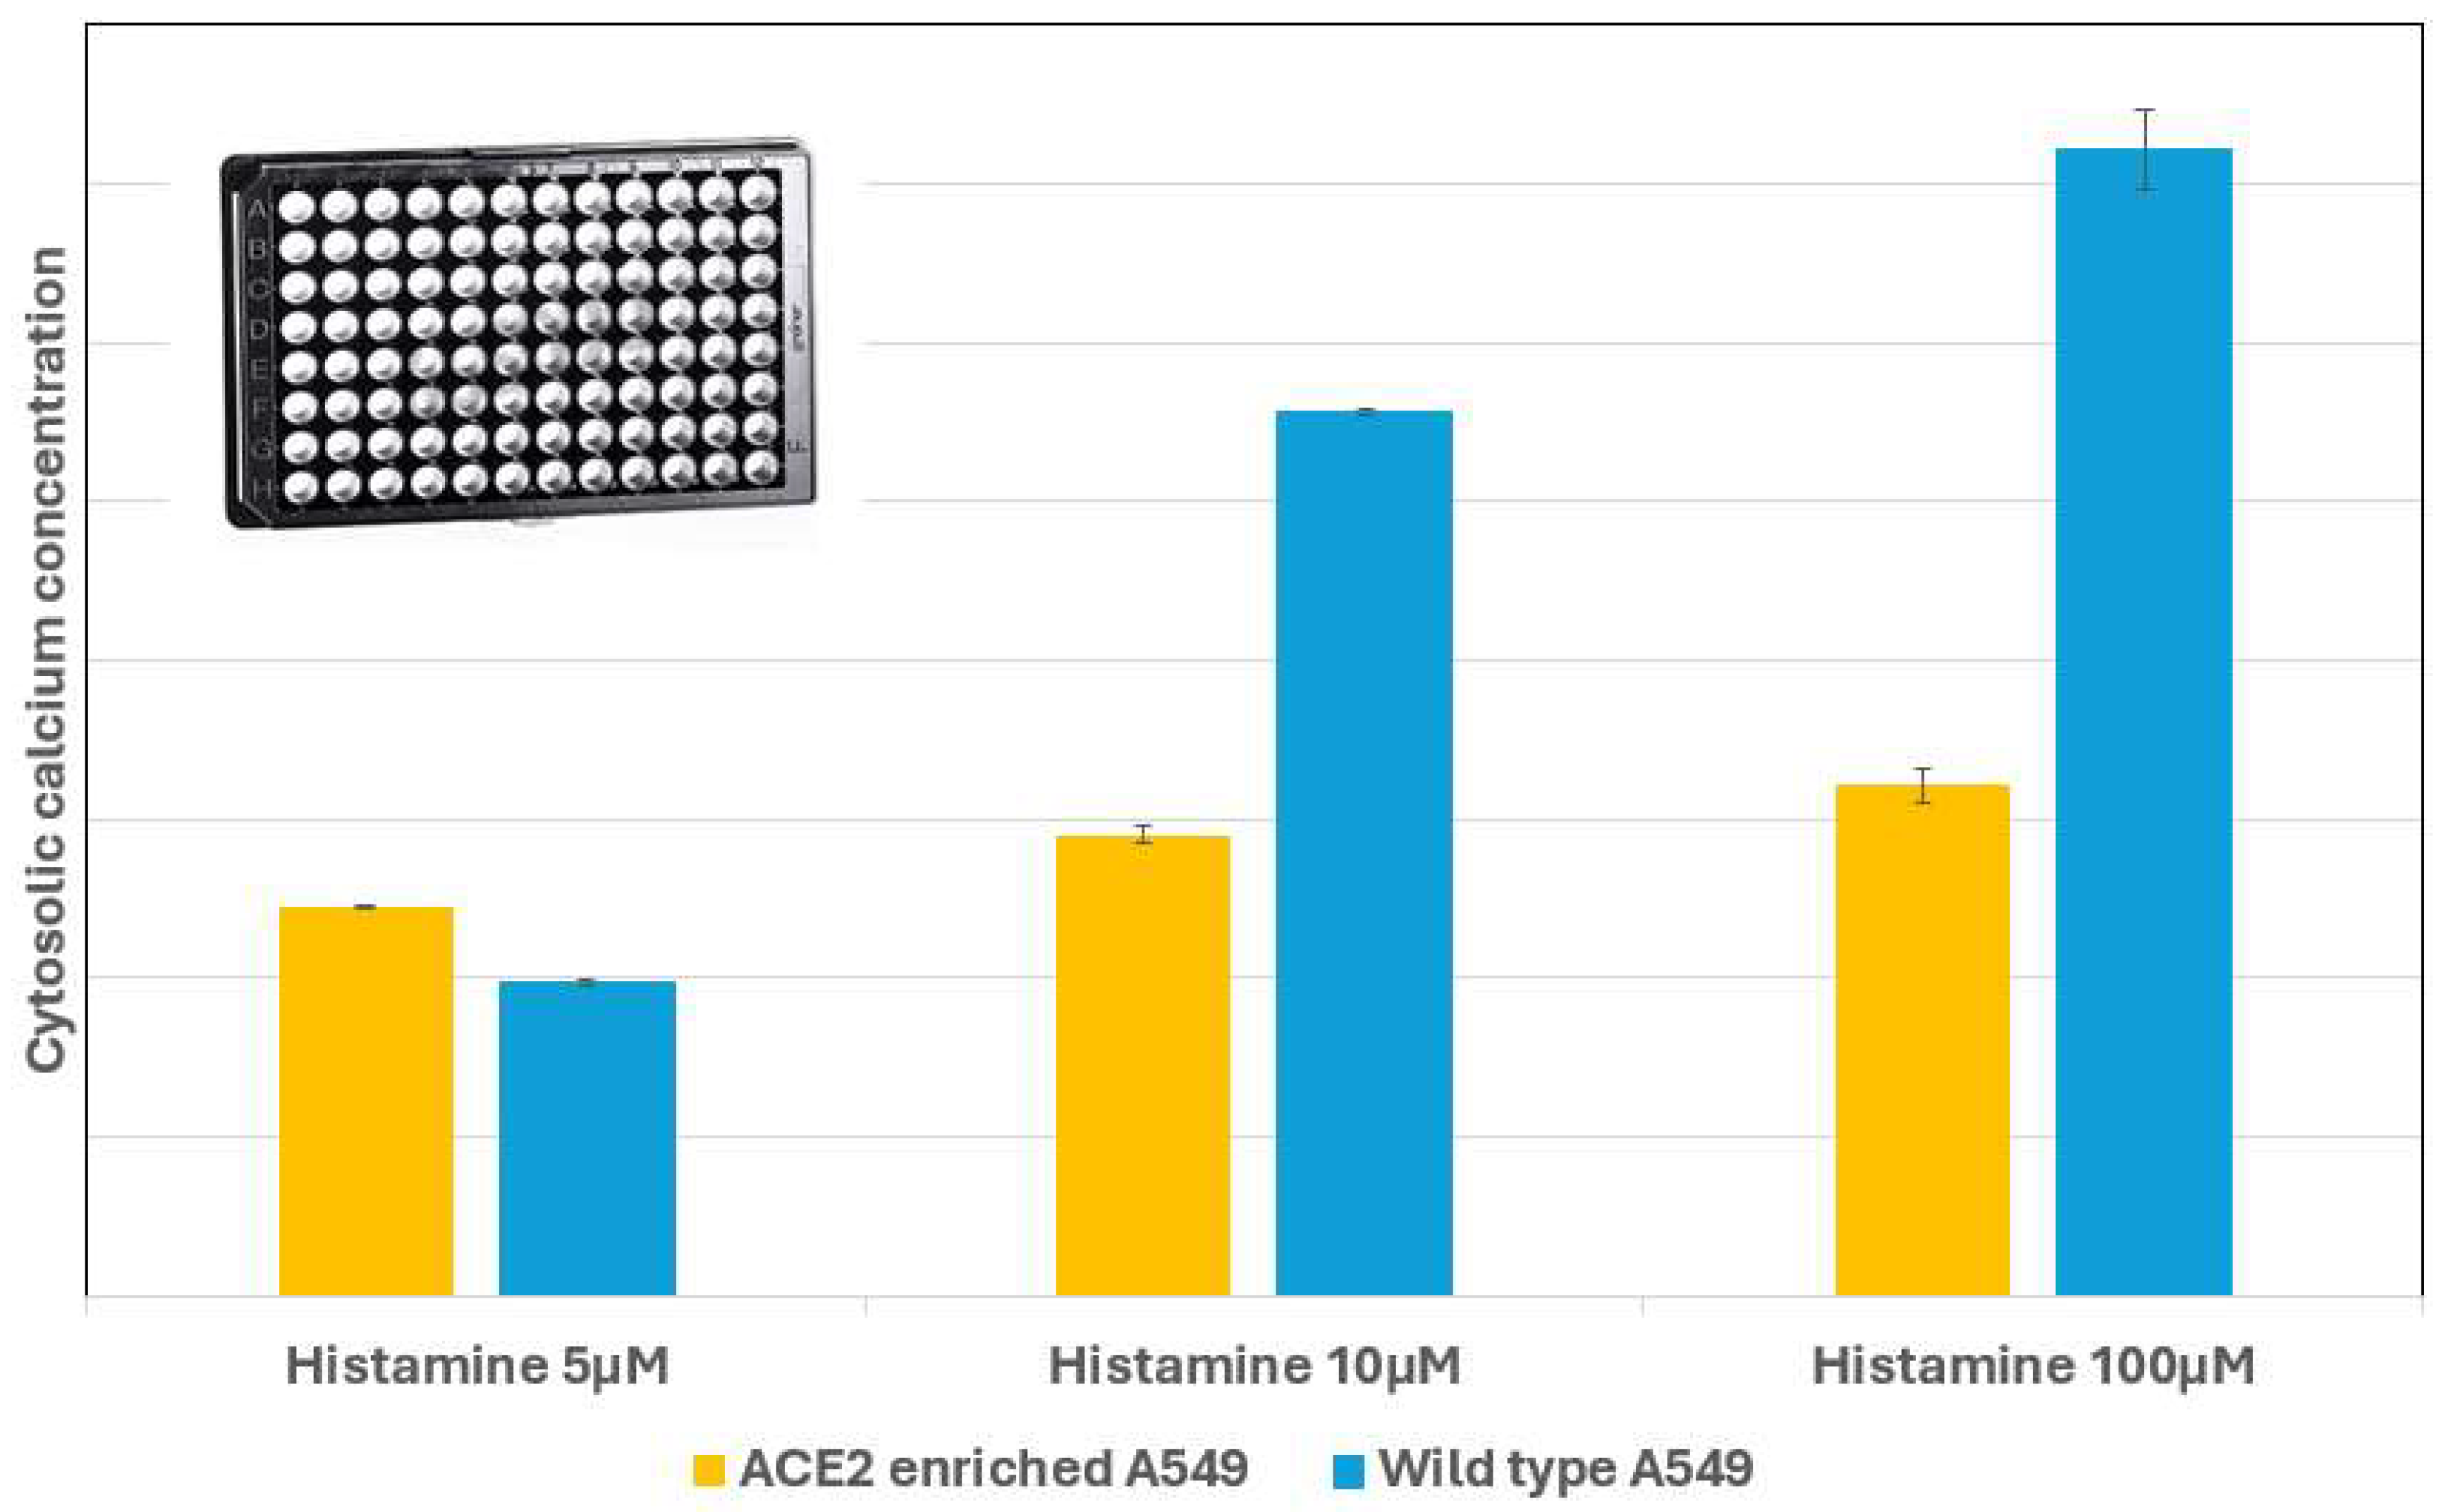
This study compares two methods for measuring cell changes: a microfluidic chip single-cell monitoring and a microplate bulk-cell measurement. As intracellular calcium ion concentration ([Ca2+]i) plays a critical role in various cellular functions and biochemical processes, measurements of [Ca2+]i may be used to compare the two methods. The microfluidic approach allows real-time monitoring of individual cells, utilizing the fluorescence emitted from calcium-Fluo 4 chelate, while the microplate method offers bulk analysis of approximately 10,000 cells per well in a 96-well microplate. We have demonstrated that the single-cell method provides insights into [Ca2+]i dynamics with low reagent consumption and rapid analysis, whereas the microplate method enables comprehensive bulk measurements when isolation of single cells is difficult. By integrating both techniques, we aim to complement measurements on both single-cell and population levels, especially when cell availability is an issue. For the cellular process, we specifically investigated the increase in [Ca2+]i following histamine receptor activation, in ACE2-enriched A549 and wild-type A549 cells. In our findings, both approaches yielded consistent calcium-signaling patterns, that wild-type A549 cells exhibited stronger histamine-induced calcium responses than ACE2-enriched cells, and that the two methods complement each other—single-cell assays providing temporal and low-reagent analysis, while bulk assays provide high-throughput, population-level averages.
Keywords:
1. Introduction
2. Materials and Methods
2.1. Reagents
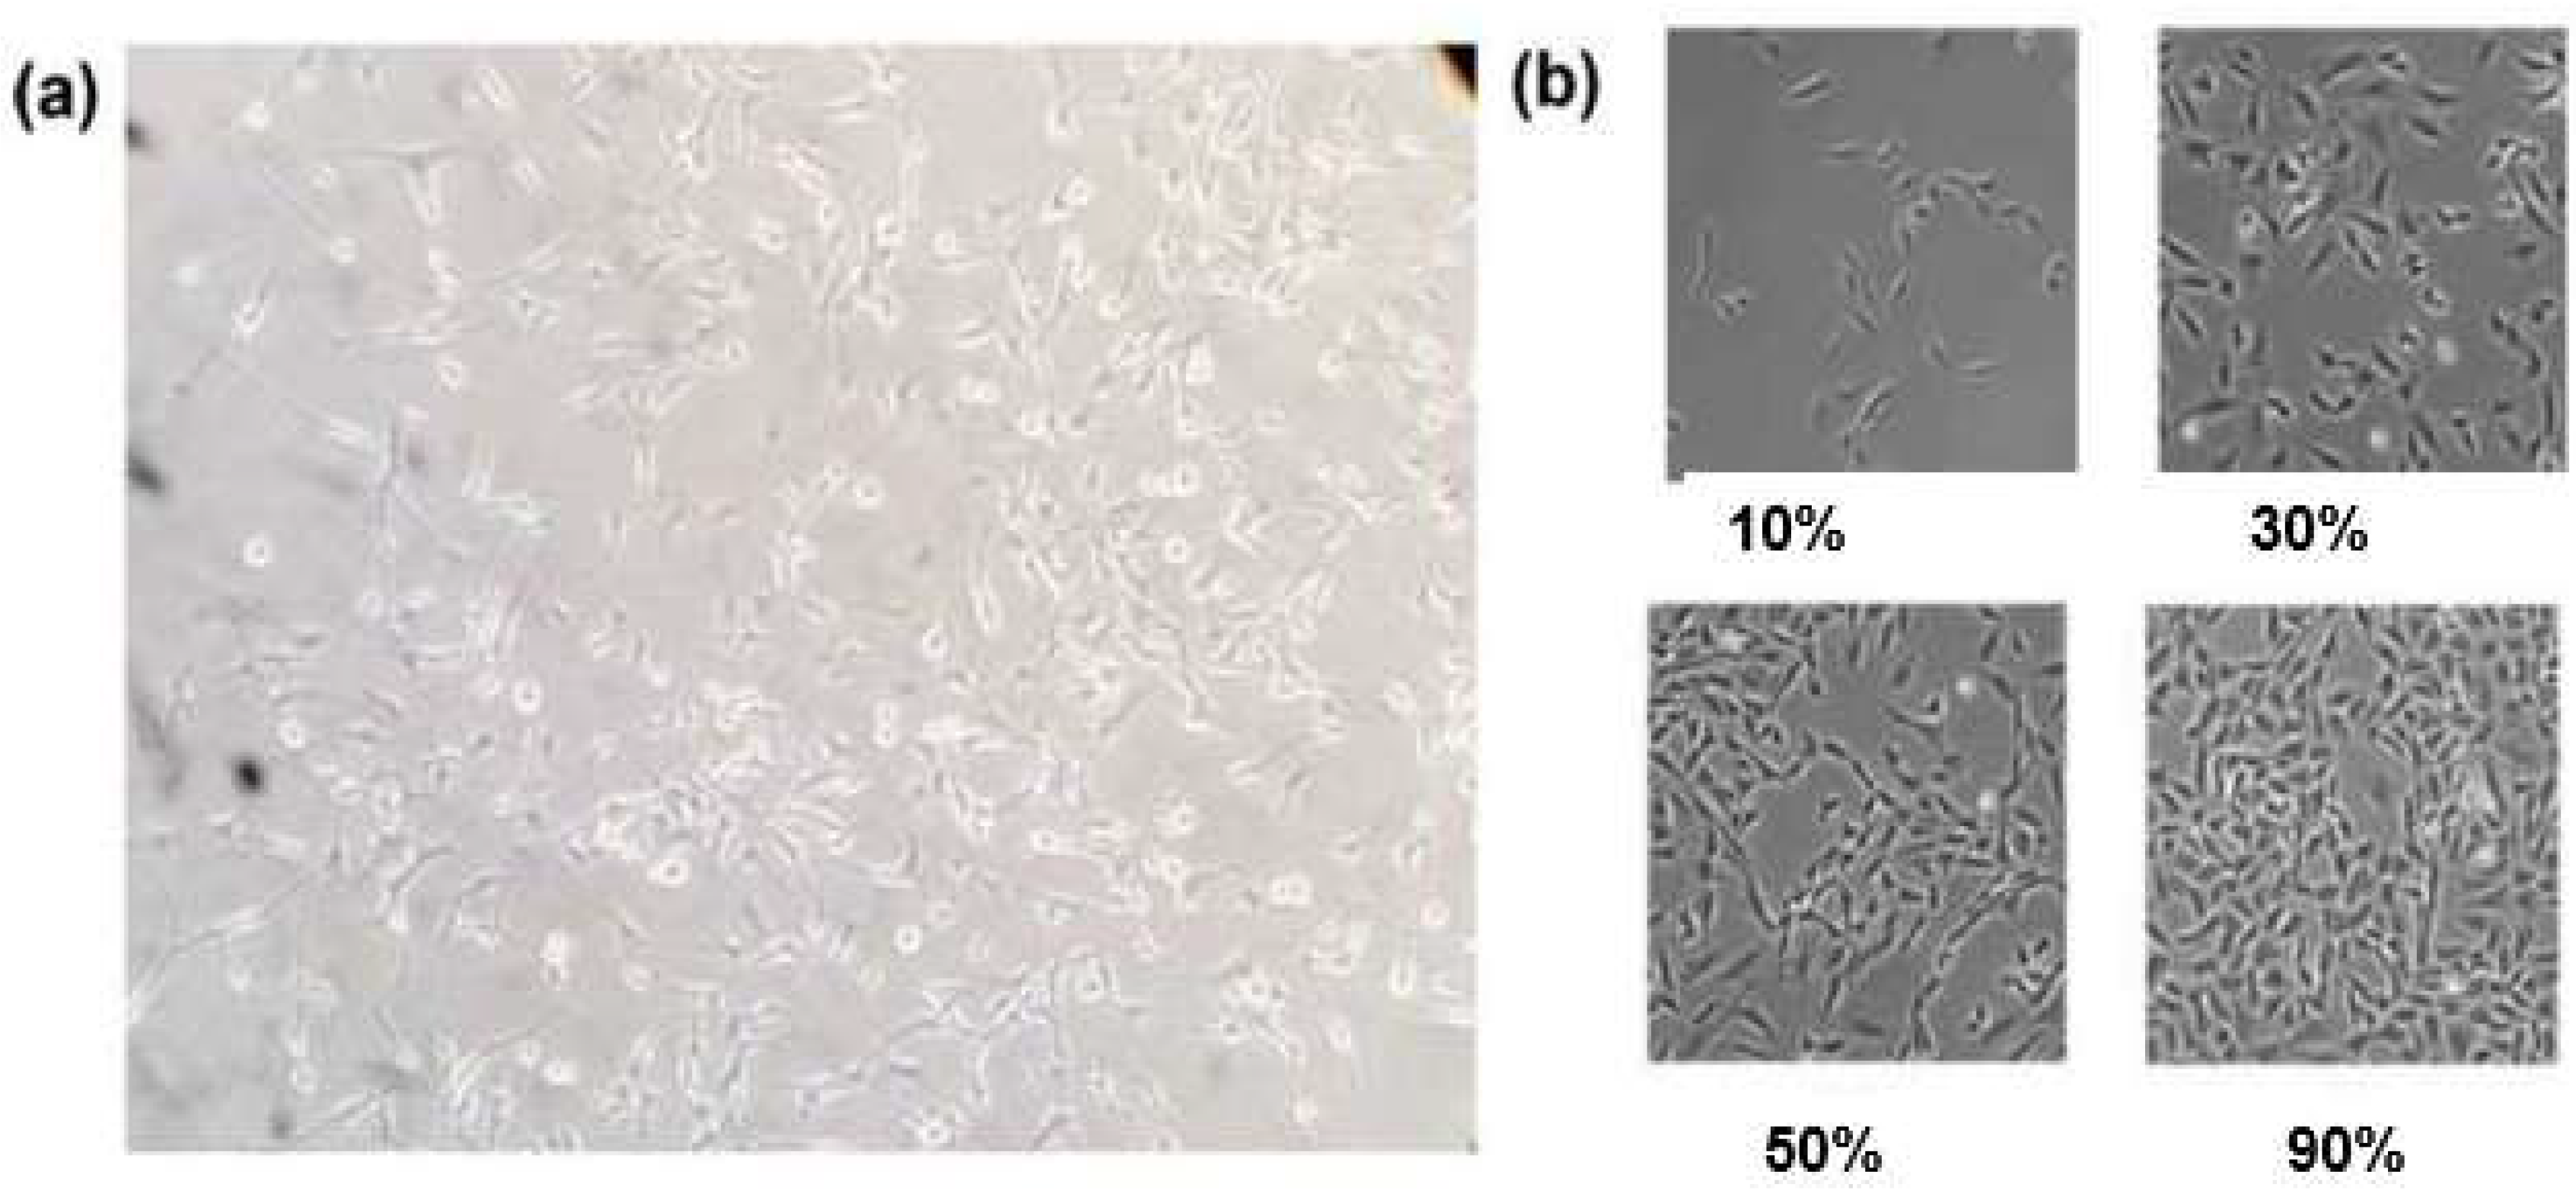
2.2. Cell Culture
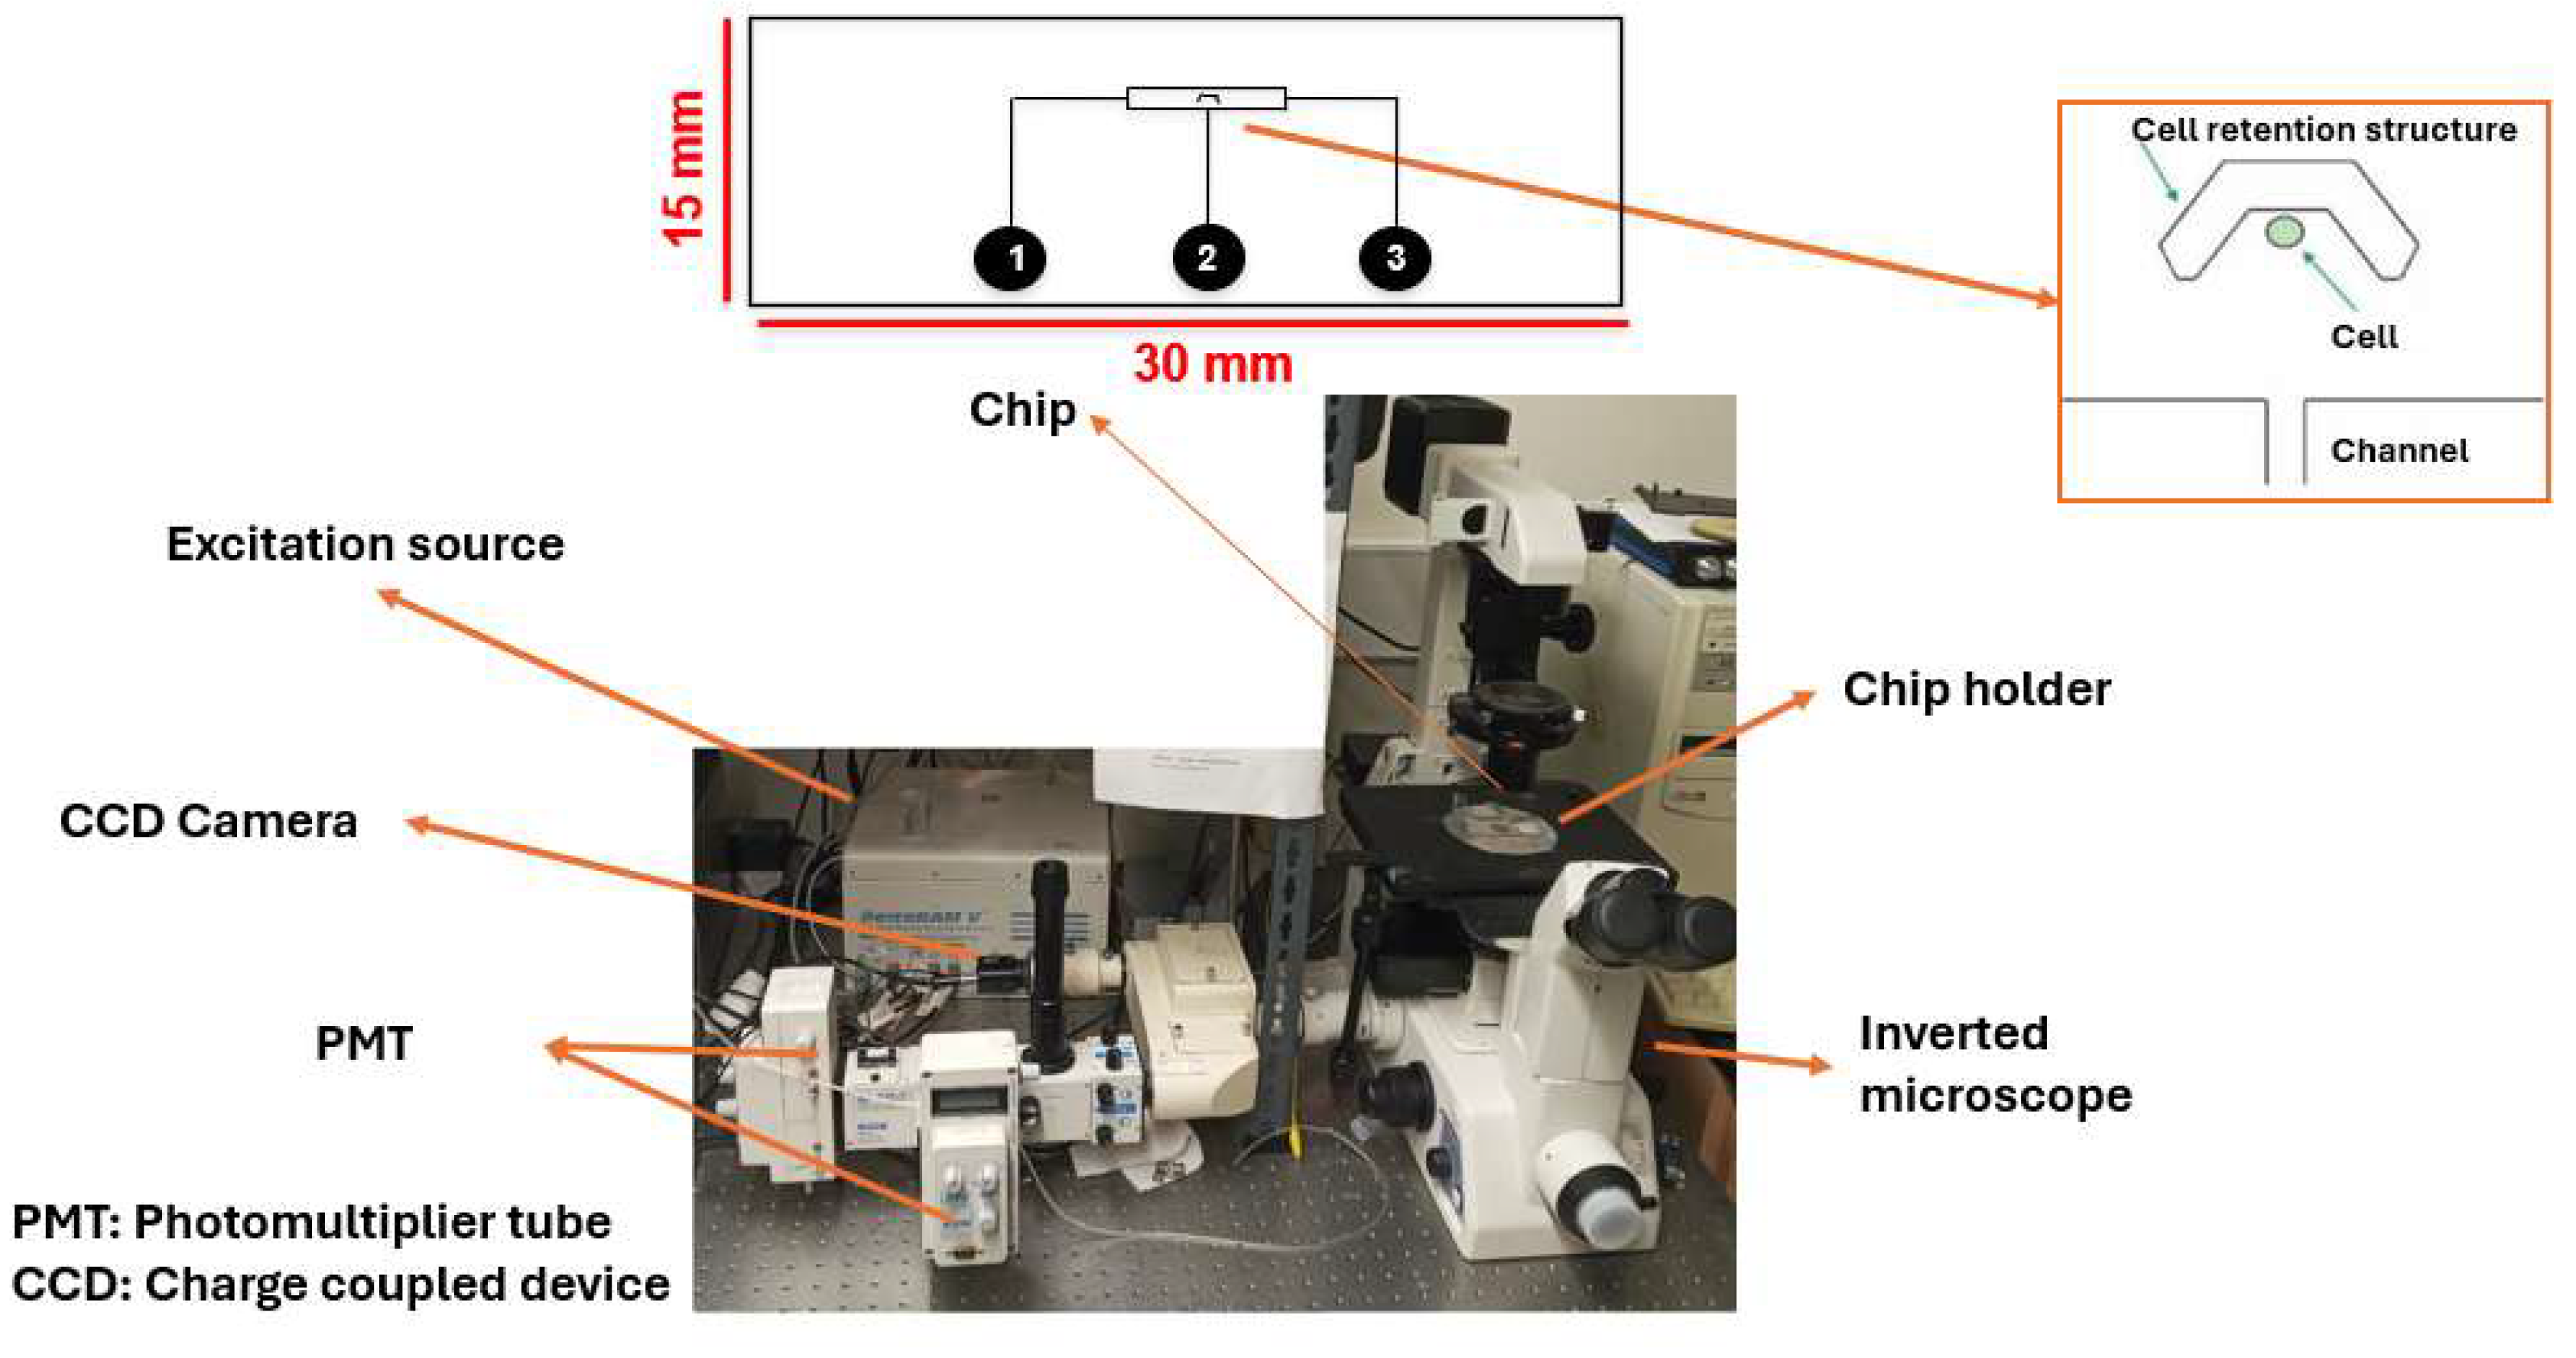
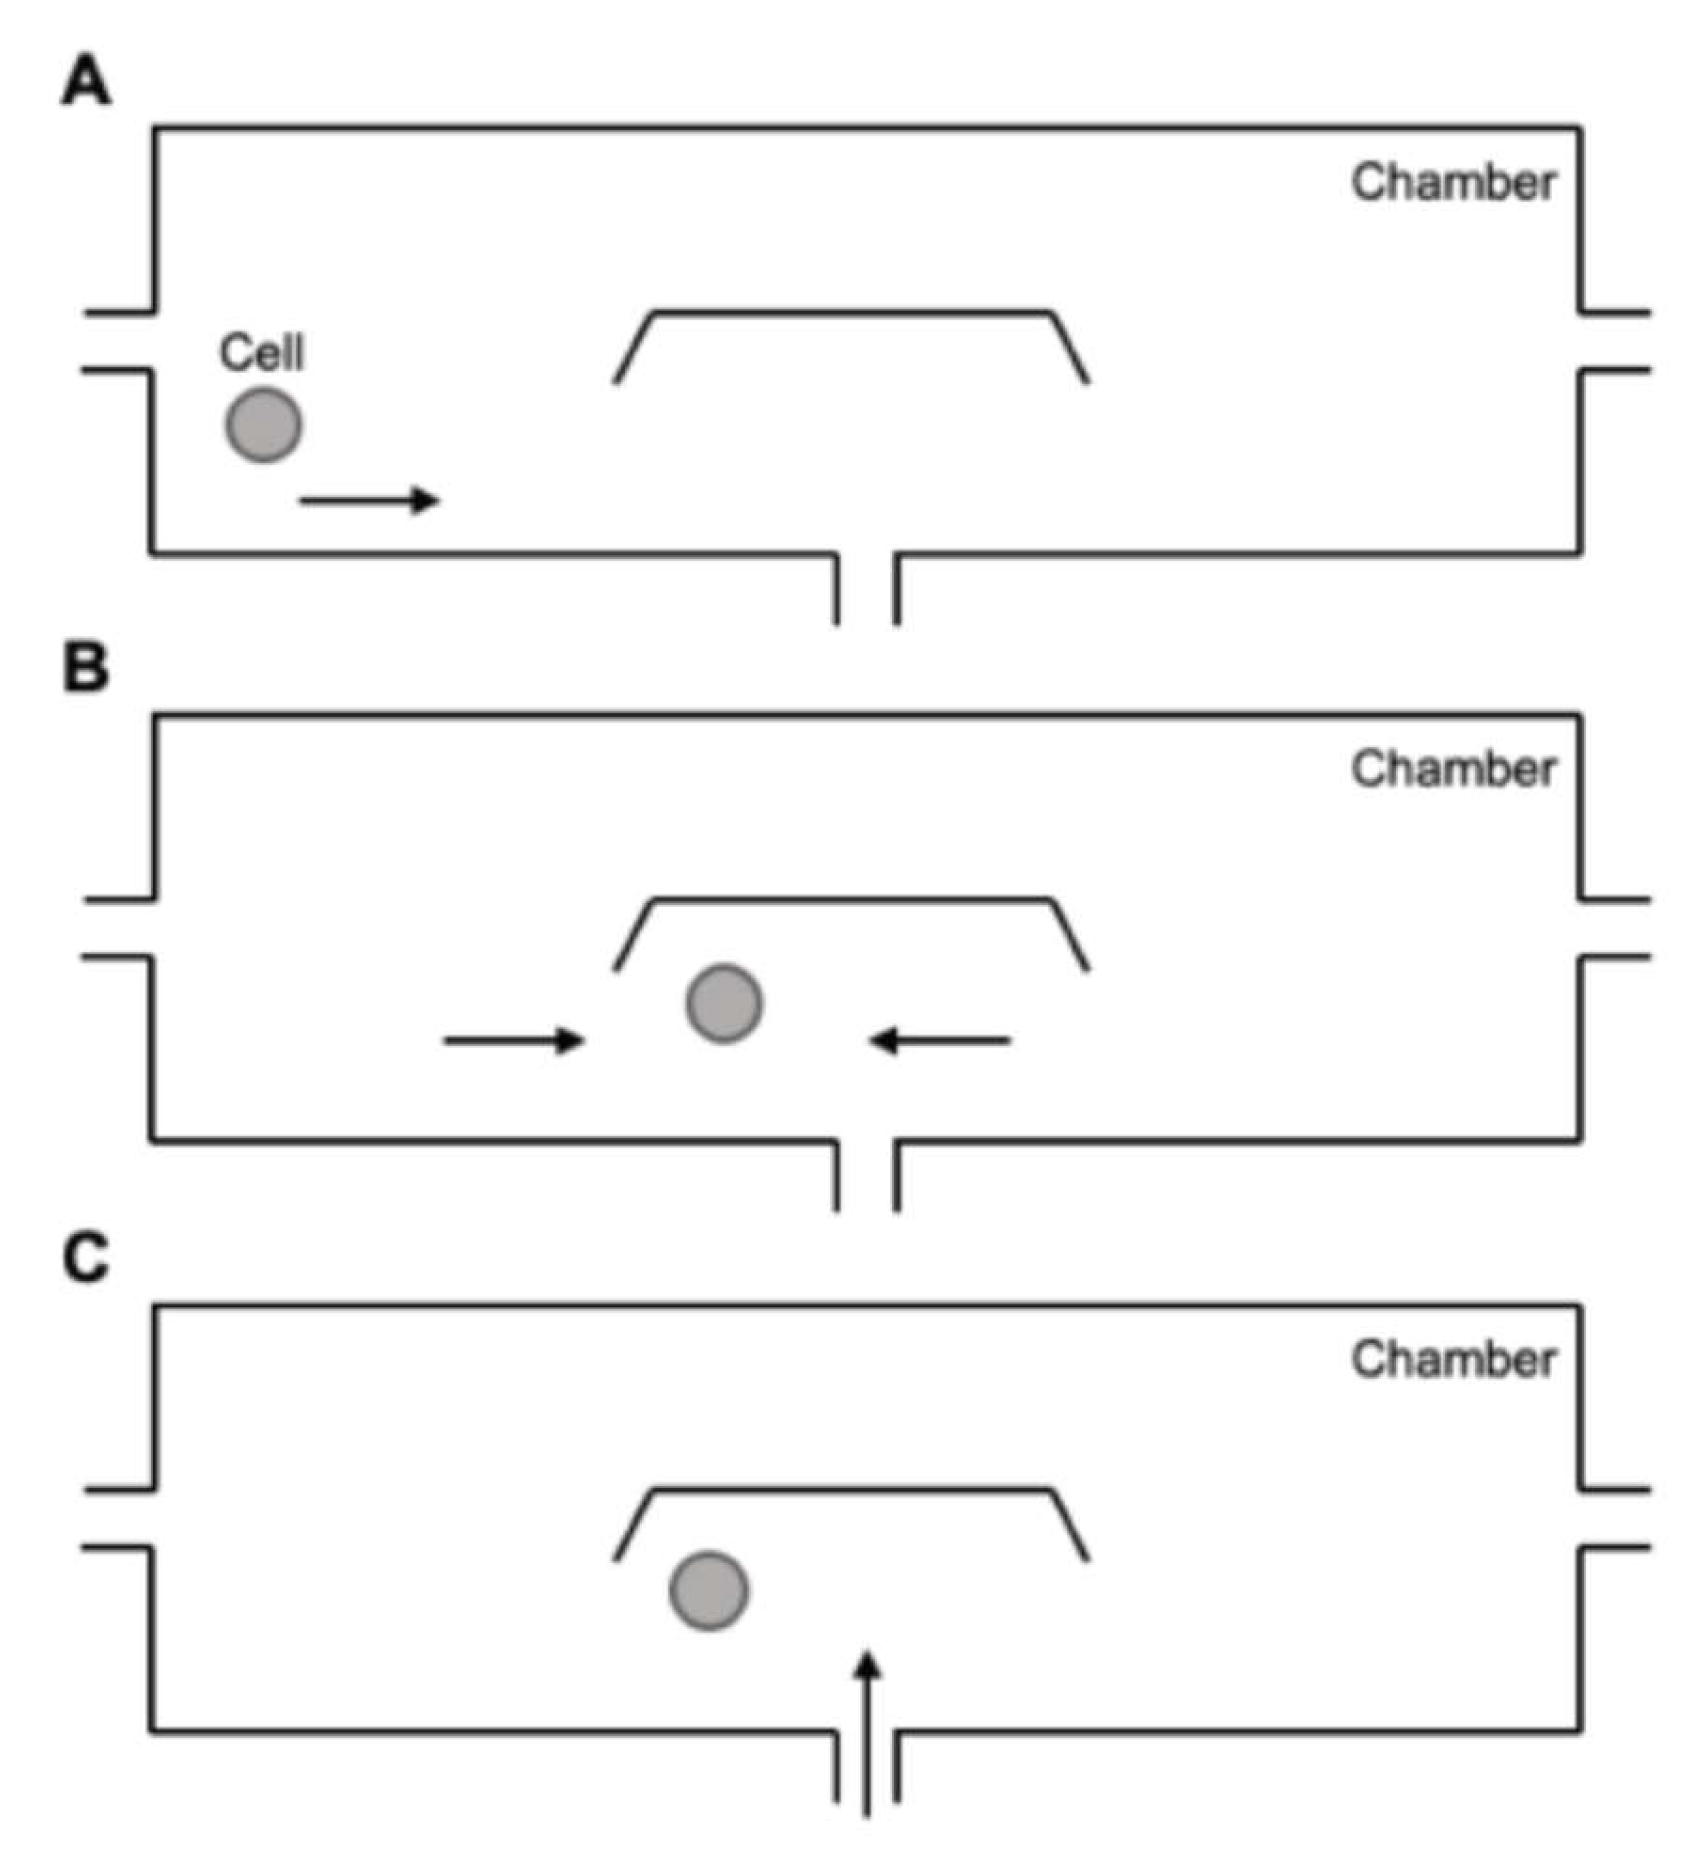
2.3. Single Cell Assay Using the Microfluidic Chip
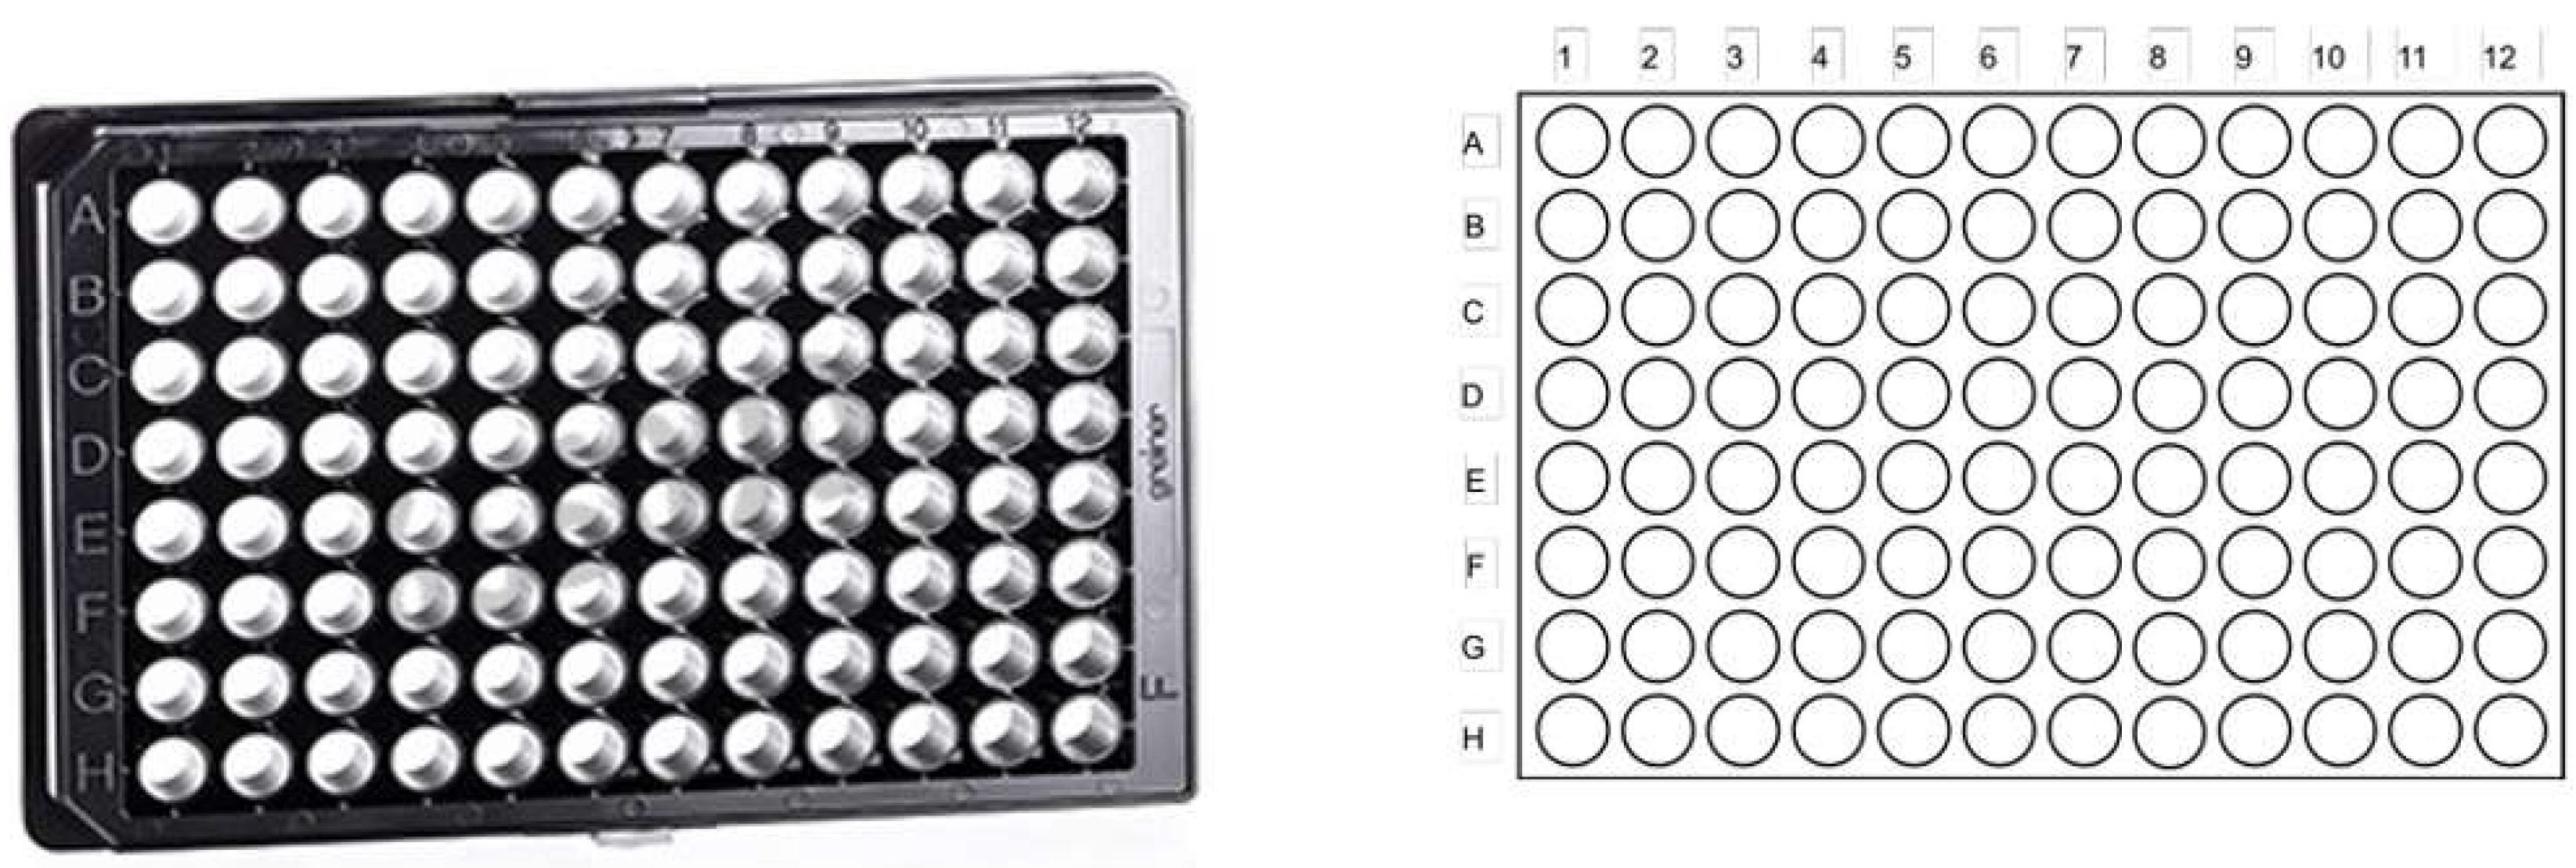
2.4. Bulk Cell Analysis Using the Microplate Reader
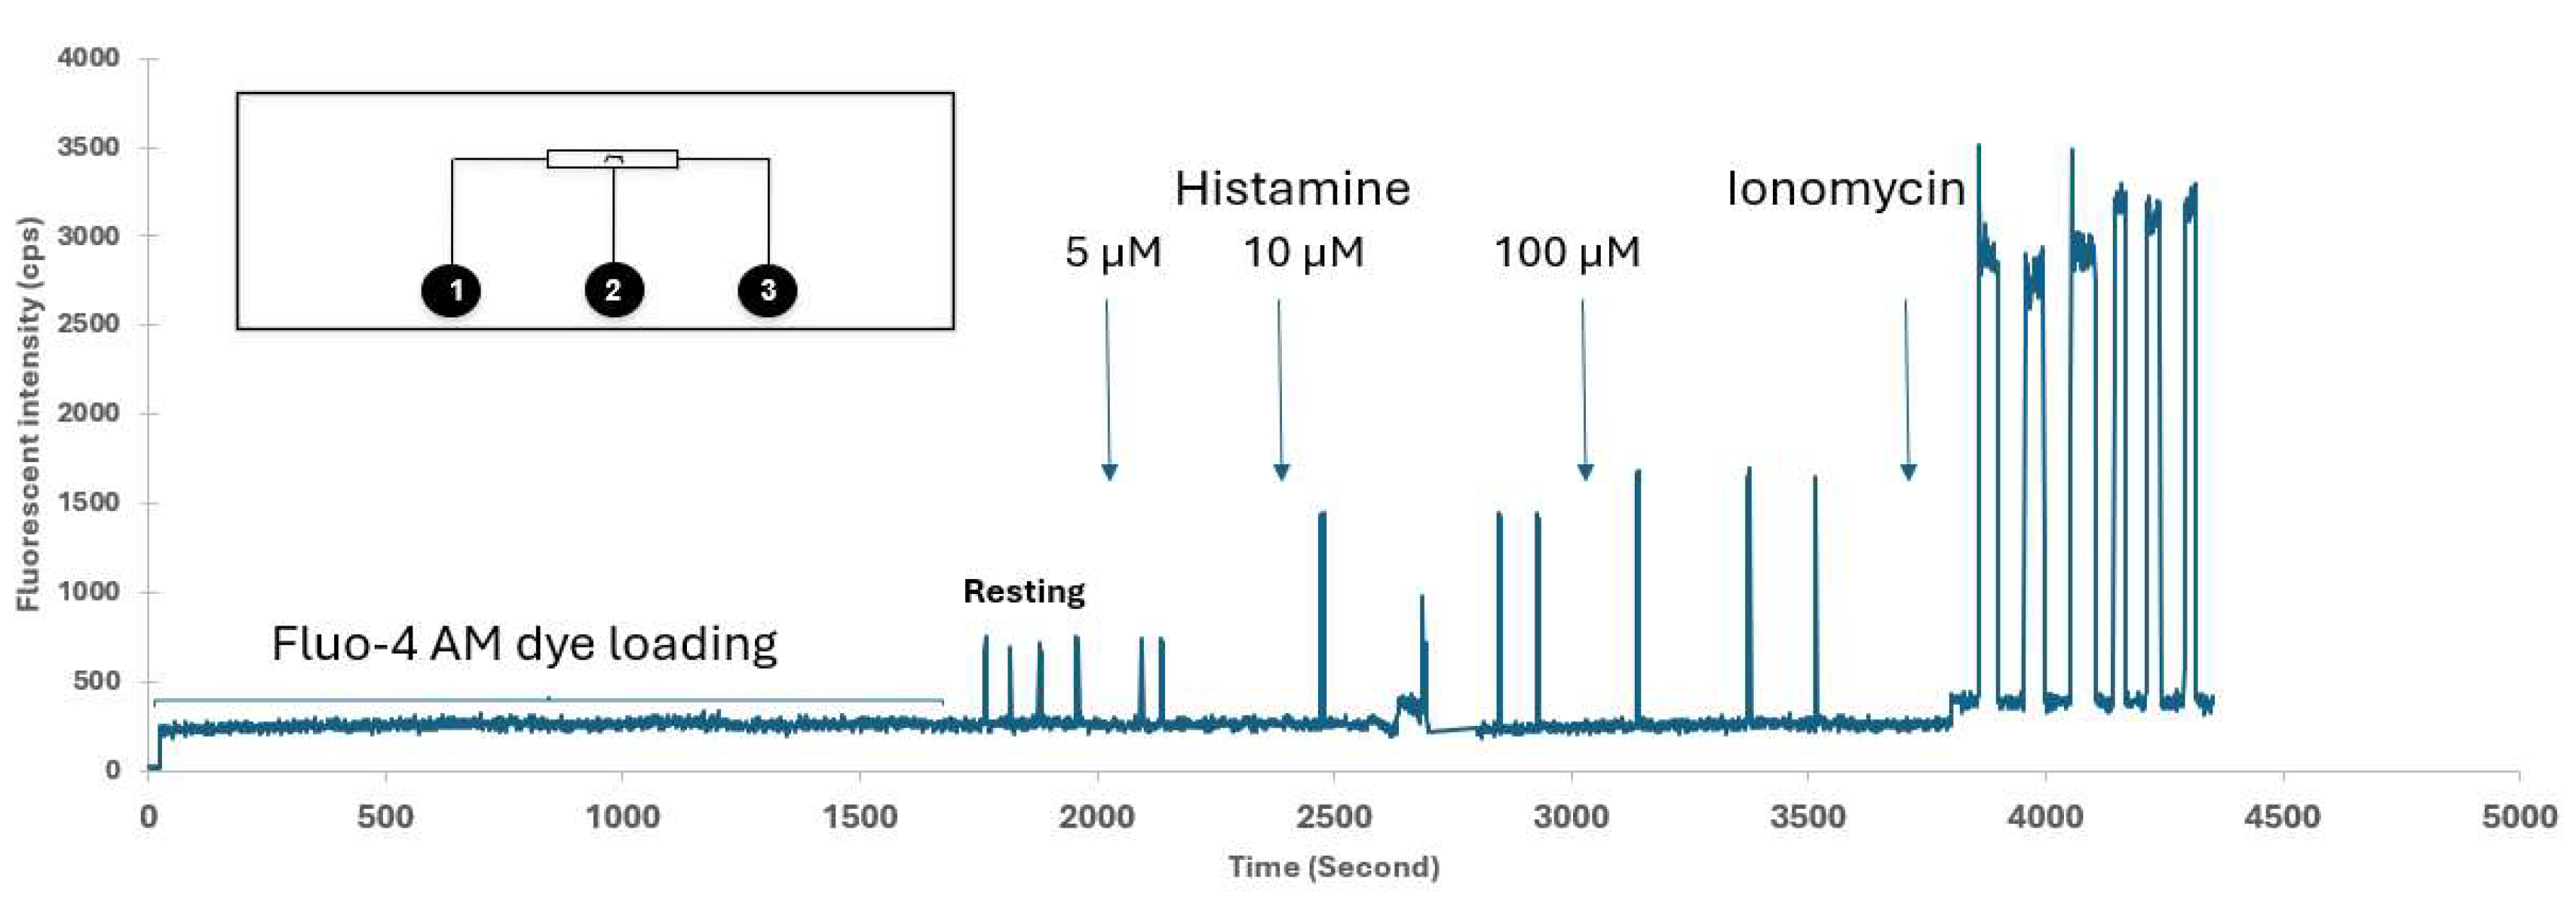
3. Results and Discussion
4. Conclusions
Acknowledgments
References
- J. Liao, D. Patel, Q. Zhao, R. Peng, H. Guo, Z. Diwu, A Novel Ca2+ Indicator for Long-term Tracking of Intracellular Calcium Flux, BioTechniques 70 (2021) 271-277. [CrossRef]
- J. P. Robinson, R. Ostafe, S. N. Iyengar, B. Rajwa, R. Fischer, Flow Cytometry: The Next Revolution, Cells 12 (2023) 1875. [CrossRef]
- K. Pang, S. Dong, Y. Zhu, X. Zhu, Q. Zhou, B. Gu, W. Jin, R. Zhang, Y. Fu, B. Yu, D. Sun, Z. Duanmu, X. Wei, Advanced flow cytometry for biomedical applications, J Biophotonics 16 (2023) e202300135. [CrossRef]
- C. Ulbricht, R. Leben, A. Rakhymzhan, F. Kirchhoff , L. Nitschke, H. Radbruch, R. A Niesner, A. E. Hauser, Intravital quantification reveals dynamic calcium concentration changes across B cell differentiation stages, eLife 10 (2021) e56020. [CrossRef]
- R. Wheeler, W. R. Throndset, R. J. Whelan, A. M. Leach, R.N. Zare, Y. H. Liao, K. Farrell, I. D. Manger, A. Daridon, Microfluidic device for single-cell analysis, Anal. Chem. 2003, 75, 14, 3581–3586. [CrossRef]
- Hamideh Sharifi Noghabi, Abdul Q. Ahmed, and Paul C. H. Li. Intracellular Calcium Increases due to Curcumin Measured using a Single-Cell Biochip. Anal. Lett.54 (2021) 2769-2776.
- P Chen, X Feng, D Chen, C Liu, W Du, BF Liu, Investigating intercellular calcium waves by microfluidic gated pinched-flow, Sens. Actuat. B 234 (2016) 583-592. [CrossRef]
- T Xu, W Yue, CW Li, X Yao, M Yang, Microfluidics study of intracellular calcium response to mechanical stimulation on single suspension cells, Lab Chip, 13 (2013) 1060-1069. [CrossRef]
- S Faley, K Seale, J Hughey, DK Schaffer, S. Van Compernolle, B. McKinney, F. Baudenbacher, D. Unutmaze, J. P. Wikswo, Microfluidic platform for real-time signaling analysis of multiple single T cells in parallel, Lab Chip, 8 (2008) 1700–1712. [CrossRef]
- XiuJun Li, Paul C.H. Li, Strategies for the real-time detection of calcium channel events of single cells: recent advances and new possibilities. Expert Review of Clinical Pharmacology, 3 (2010) 267-280.
- Takahashi, P. Camacho, J.D. Lechleiter, B. Herman, Measurement of Intracellular Calcium, Physiological Reviews. 79 (1999) 1089–1125. [CrossRef]
- A.S. Hauser, M.M. Attwood, M. Rask-Andersen, H.B. Schiöth, D.E. Gloriam, Trends in GPCR drug discovery: new agents, targets and indications, Nat Rev Drug Discov. 16 (2017) 829–842. [CrossRef]
- S. Martewicz , F. Michielin , E. Serena , A. Zambon , M. Mongillo , N. Elvassore, Reversible alteration of calcium dynamics in cardiomyocytes during acute hypoxia transient in a microfluidic platform, Integr. Biol. 4 (2012) 153–164. [CrossRef]
- X.J. Li, P.C.H. Li, Microfluidic selection and retention of a single cardiac myocyte, on-chip dye loading, cell contraction by chemical stimulation, and quantitative fluorescent analysis of intracellular calcium, Anal. Chem., 77 (2005) 4315-4322.
- S. Kou, L. Pan, D. van Noort, G Meng, X. Wu, H. Sun, J. Xu, I. Lee, A multishear microfluidic device for quantitative analysis of calcium dynamics in osteoblasts, Biochem. Biophy. Res. Comm. 408 (2011) 350-355. [CrossRef]
- Rahimi, H. Sharifi, P.C.H. Li, Cytosolic Calcium Measurement Utilizing a Single-Cell Biochip to Study the Effect of Curcumin and Resveratrol on a Single Glioma Cell, Methods Mol Biol. 2689 (2023) 13–25. [CrossRef]
- A Lopez-Canosa, S Perez-Amodio, E Engel, O. Castaño, Microfluidic 3D platform to evaluate endothelial progenitor cell recruitment by bioactive materials, Acta Biomaterialia, 151 (2022) 264-277. [CrossRef]
- C Huang, Q Ramadan, JB Wacker, HC Tekin, C Ruffert, G Vergeres, P Silacci, MAM Gijs, Microfluidic chip for monitoring Ca2+ transport through a confluent layer of intestinal cells, RSC Adv. 4(2014) 52887. [CrossRef]
- ZZ Chen, WM Yuan, C Xiang, DP Zeng, B Liu, K R Qin, A microfluidic device with spatiotemporal wall shear stress and ATP signals to investigate the intracellular calcium dynamics in vascular en-dothelial cells, Biomech Model Mechanobiol 18 (2019) 189–202. [CrossRef]
- A Jovic, SM Wade, RR Neubig, JJ Linderman, S Takayama, Microfluidic interrogation and mathematical modeling of multi-regime calcium signaling dynamics, Integr. Biol. 5 (2013) 932–939. [CrossRef]
- S Feng, Q Zhang, T Xie, Y Hou, JM Lin, In-situ monitoring calcium signaling through tumor microtubes for single cell-cell communication via an open microfluidic probe, Biosens. Bioe-lect. 206 (2022) 114137. [CrossRef]
- X Zhang, H Yin, JM Cooper, SJ Haswell, A microfluidic-based system for analysis of sin-gle cells based on Ca2+ flux, Electrophoresis, 27 (2006) 5093-5100. [CrossRef]
- K. Manohar, R.K. Gupta, P. Gupta, D. Saha, S. Gare, R. Sarkar, A. Misra, L. Giri, FDA approved L-type channel blocker Nifedipine reduces cell death in hypoxic A549 cells through modulation of mitochondrial calcium and superoxide generation, Free Radic Biol Med. 177 (2021) 189–200. [CrossRef]
- H.-J. Kim, P.C.W. Lee, J.H. Hong, Lamin-A/C Is Modulated by the Involvement of Hista-mine-Mediated Calcium/Calmodulin-Dependent Kinase II in Lung Cancer Cells, Int J Mol Sci. 23 (2022) 9075. [CrossRef]
- J. Paltauf-Doburzynska, M. Frieden, M. Spitaler, W.F. Graier, Histamine-induced Ca2+ oscilla-tions in a human endothelial cell line depend on transmembrane ion flux, ryanodine receptors and endoplasmic reticulum Ca2+-ATPase, J Physiol. 524 (2000) 701–713. [CrossRef]
- C.D. Zappia, G. Granja-Galeano, N. Fernández, C. Shayo, C. Davio, C.P. Fitzsimons, F. Monczor, Effects of histamine H1 receptor signaling on glucocorticoid receptor activity. Role of ca-nonical and non-canonical pathways, Sci Rep. 5 (2015) 17476. [CrossRef]
- W.-C. Huang, C.-Y. Chai, W.-C. Chen, M.-F. Hou, Y.-S. Wang, Y.-C. Chiu, S.-R. Lu, W.-C. Chang, S.-H.H. Juo, J.-Y. Wang, W.-C. Chang, Histamine regulates cyclooxygenase 2 gene activa-tion through Orai1-mediated NFκB activation in lung cancer cells, Cell Calcium. 50 (2011) 27–35. [CrossRef]
- C.P. Fitzsimons, F. Monczor, N. Fernández, C. Shayo, C. Davio, Mepyramine, a histamine H1 receptor inverse agonist, binds preferentially to a G protein-coupled form of the receptor and se-questers G protein, J Biol Chem. 279 (2004) 34431–34439. [CrossRef]
- X.J. Li, J. Huang, G.F. Tibbits, P.C.H. Li, Real-time monitoring of intracellular calcium dynamic mobilization of a single cardiomyocyte in a microfluidic chip pertaining to drug discovery, Electro-phoresis, 28 (2007) 4723-4733.
- S.T. Holgate, The epithelium takes centre stage in asthma and atopic dermatitis, Trends Immunol. 28 (2007) 248–251. [CrossRef]
- T. Liu, L. Zhang, D. Joo, S.-C. Sun, NF-κB signaling in inflammation, Signal Transduct Target Ther. 2 (2017) 17023-. [CrossRef]
- S. Smolinska, M. Jutel, R. Crameri, L. O’Mahony, Histamine and gut mucosal immune regulation, Allergy. 69 (2014) 273–281. [CrossRef]
- M. Jutel, K. Blaser, C.A. Akdis, Histamine in allergic inflammation and immune modulation, Int Arch Allergy Immunol. 137 (2005) 82–92. [CrossRef]
- M.M. Thakkar, Histamine in the regulation of wakefulness, Sleep Med Rev. 15 (2011) 65–74. [CrossRef]
- W.-K. Cai, J. Hu, T. Li, J.-R. Meng, X. Ma, S.-J. Yin, C.-H. Zhao, G.-H. He, G.-L. Xu, Activation of histamine H4 receptors decreases epithelial-to-mesenchymal transition progress by inhibiting transforming growth factor-β1 signalling pathway in non-small cell lung cancer, Eur J Cancer. 50 (2014) 1195–1206. [CrossRef]
- C.-W. Chang, K.M. Parsi, M. Somasundaran, E. Vanderleeden, P. Liu, J. Cruz, A. Cousineau, R.W. Finberg, E.A. Kurt-Jones, A Newly Engineered A549 Cell Line Expressing ACE2 and TMPRSS2 Is Highly Permissive to SARS-CoV-2, Including the Delta and Omicron Variants, Viruses. 14 (2022) 1369. [CrossRef]
- X. Li, X. Xue, P.C.H. Li, Real-time detection of the early event of cytotoxicity of herbal ingredients on single leukemia cells studied in a microfluidic biochip, Integr. Biol. 1 (2009) 90–98. [CrossRef]
- Gee, K. R., K. A. Brown, W. N. U. Chen, J. Bishop-Stewart, D. Gray, and I. Johnson. Chemical and physiological characterization of Fluo-4 Ca2+-indicator dyes. Cell Calcium. 27 (2000) 97–106. doi:10.1054/ceca.1999.0095.
- P.L. Nguyen, Pathophysiological Roles of Histamine Receptors in Cancer Progression: Implica-tions and Perspectives as Potential Molecular Targets, Biomolecules. 11 (2021) 1232. [CrossRef]
- Y. Jiang, H. Li, Y. Wang, T. Tian, Y. He, Y. Jin, C. Han, X. Jin, F. Zhang, E. Morii, ALDH enzyme activity is regulated by Nodal and histamine in the A549 cell line, Oncol Lett. 14 (2017) 6955–6961. [CrossRef]
- S. Hou, S.H. Heinemann, T. Hoshi, Modulation of BKCa channel gating by endogenous signaling molecules, Physiology (Bethesda). 24 (2009) 26–35. [CrossRef]
- E.E. Benarroch, Chapter 8 - Neurotransmitters, in: S.A. Waldman, A. Terzic (Eds.), Pharmacol-ogy and Therapeutics: principles to practice, W.B. Saunders, Philadelphia, 2009: pp. 91–113. [CrossRef]
- M.O. Lonchampt, P. Marche, C. Demerle, A. Girard, M. Cabanie, A. Esanu, P.E. Chabrier, P. Braquet, Histamine H1-receptors mediate phosphoinositide and calcium response in cultured smooth muscle cells-interaction with cicletanine (CIC), Agents and Actions. 24 (1988) 255–260. [CrossRef]
- Subedi, N., Van Eyndhoven, L.C., Hokke, A.M. et al. An automated real-time microfluidic platform to probe single NK cell heterogeneity and cytotoxicity on-chip. Sci Rep 11, 17084 (2021). [CrossRef]
- R. Dimatteo and D. Di Carlo, IL-2 secretion-based sorting of single T cells using high-throughput microfluidic on-cell cytokine capture. Lab Chip, 2022, 22, 1576 DOI: 10.1039/D1LC01098K.
- Sullivan, M.R., Ugolini, G.S., Sarkar, S. et al. Quantifying the efficacy of checkpoint inhibitors on CD8+ cytotoxic T cells for immunotherapeutic applications via single-cell interaction. Cell Death Dis 11, 979 (2020). [CrossRef]
- Fangteng Song, Chao Wang, Chunhua Wang, Jianbo Wang, Yu Wu, Yihe Wang, Hong Liu, Yu Zhang, Lin Han. Multi-Phenotypic Exosome Secretion Profiling Microfluidic Platform for Exploring Single-Cell Heterogeneity. Small Methods, 2022, 6 (9), 2200717. [CrossRef]
- S. Sarkar, N. Cohen, P. Sabhachandani and T. Konry. Phenotypic drug profiling in droplet microfluidics for better targeting of drug-resistant tumors. Lab Chip, 2015,15, 4441-445. [CrossRef]
- Sagar N. Agnihotri, Giovanni Stefano Ugolini, Matthew Ryan Sullivan, Yichao Yang, Augustin de Ganzo, Ji Won Lim, Tania Konry. Droplet Microfluidics for Functional Temporal Analysis and Cell Recovery on Demand using Microvalves: Application in Immunotherapies for Cancer Lab Chip, 2022,22, 3258-3267. [CrossRef]
- Langerman, J., Baghdasarian, S., Cheng, R.YH. et al. Linking single-cell transcriptomes with secretion using SEC-seq. Nat Protoc 20, 2034–2055 (2025). [CrossRef]
- N. Pacocha, M. Zapotoczna, K. Makuch, J. Bogusławski and P. Garstecki, You will know by its tail: a method for quantification of heterogeneity of bacterial populations using single-cell MIC pro-filing. Lab Chip, 2022, 22, 4317. [CrossRef]
- Giampaolo Pitruzzello, Christoph G. Baumann, Steven Johnson, Thomas F. Krauss. Single-Cell Motility Rapidly Quantifying Heteroresistance in Populations of Escherichia coli and Salmonella typhimurium. Small Science. 2022, 2(5), 2100123. [CrossRef]
- Sagar N. Agnihotri, Nikos Fatsis-Kavalopoulos, Jonas Windhager, Maria Tenje, Dan I. Andersson. Droplet microfluidics–based detection of rare antibiotic-resistant subpopulations in Escherichia coli from bloodstream infections. Sci. Adv. 11, eadv4558 (2025) https://www.science.org/doi/full/10.1126/sciadv.adv4558.
- 2025; 49, 54. Lukasz Kozubowski, Judith Berman, The impact of phenotypic heterogeneity on fungal patho-genicity and drug resistance, FEMS Microbiology Reviews, 2025, 49, fu-af001. [CrossRef]

| Cell number | Figure 6/7 | Reagent per conc. | Total cells | Total histamine | ionomycin | |
|---|---|---|---|---|---|---|
| Single-cell | 100 in 1 μL per chip |
3 chip expts for wt and 3 for ACE | 100 μM in 1 μL = 0.1 nmol | 100 x 3 for wt and 300 for ACE | 0.69 nmol | 0.06 nmol |
| Bulk-cell | 10,000 in 200 μL per well | 9 wells for wt (3 reagent conc,) and 9 wells for ACE | 1000 μM in 20 μL = 20 nmol | 9 x 10,000 for wt and 90,000 for ACE | 414 nmol | 36 nmol |
Disclaimer/Publisher’s Note: The statements, opinions and data contained in all publications are solely those of the individual author(s) and contributor(s) and not of MDPI and/or the editor(s). MDPI and/or the editor(s) disclaim responsibility for any injury to people or property resulting from any ideas, methods, instructions or products referred to in the content. |
© 2025 by the authors. Licensee MDPI, Basel, Switzerland. This article is an open access article distributed under the terms and conditions of the Creative Commons Attribution (CC BY) license (https://creativecommons.org/licenses/by/4.0/).


