
Submitted:
18 November 2025
Posted:
19 November 2025
You are already at the latest version
Abstract
Age-related macular degeneration (AMD) is a complex, multifactorial disease charac-terized by the degeneration of the retina. Blue-light damage (BLD) in BALB/c mouse has been currently used as a model of AMD. Nevertheless, the impact of blue light (BL) on RPE cell dysfunction and degeneration is not well documented. Here we report the effect of phenyl-N-tertbutylnitrone (PBN) on retinal function and structure in a model of BLD in BALB/c mice. We also describe the mechanisms involved in RPE cell degeneration and protection by PBN. One week after BL visual function was assessed by full-field scotopic and photopic electroretinogram in mice treated with PBN (50 mg/kg) or vehicle 30 min before BLD and 1h, 2.5h and 4h after. mRNA expression of RPE genes involved in in-flammation, oxidative stress, apoptosis and ferroptosis were measured by qRT-PCR. Our results demonstrate for the first time the protective effect of PBN in a mouse model of BLD. They show that BL induces oxidative stress and inflammation in the RPE of BALB/c mice and activates both apoptotic and ferroptotic pathways. Moreover, we demonstrate that PBN is able to counteract these intracellular pathways.
Keywords:
age-related macular degeneration (AMD)
; retinal pigment epithelium (RPE)
; alpha-phenyl-N-tertbutylnitrone (PBN)
; oxidative stress
; apoptosis
; ferroptosis
1. Introduction
Age-related macular degeneration (AMD) is a complex, multifactorial disease characterized by the degeneration of the retina. While the exact pathophysiology of AMD remains unclear, understanding the mechanisms behind this degeneration is essential for developing effective therapeutic interventions. Visible light is frequently considered a contributing factor to retinal degenerations, including AMD. Moreover, it can be leveraged in experimental settings to precisely control the onset, progression, and severity of retinal degeneration [1]. Light-damage (LD) rodent models, therefore, serve as a valuable and reliable approach to replicate key features of AMD [2].
The retina is one of the most oxygen-demanding tissues in the human body, which makes it particularly vulnerable to oxidative stress and overproduction of reactive oxygen species (ROS). To counterbalance the harmful effects of ROS, cells possess a complex antioxidant defense system which includes enzymes such as superoxide dismutase (Sod), catalase (Cat), heme oxygenase (Hmox), and glutathione peroxidase (Gpx). The expression of some of these antioxidant enzymes are largely regulated by the transcription factor (TF) Nuclear factor erythroid 2-related factor 2 (Nrf2) [3].
The retinal pigment epithelium (RPE), a single layer of cells located between the photoreceptor outer segments and the choroid, plays a vital role in maintaining retinal homeostasis. It performs several essential functions, including light absorption, maintenance of the outer blood-retinal barrier, phagocytosis of photoreceptor debris, and regulation of the visual cycle [4].
With aging and the accumulated effects of environmental stresses, the RPE can become dysfunctional and die [5]. Excessive white light exposure has been shown to induce oxidative stress, leading to critical retinal dysfunction, primarily causing the apoptosis of photoreceptor and RPE cells [6] mediated by Activating protein-1 (AP-1) a heterodimer transcription factor (TF) composed of two subunits: c-Fos and JunD/cJun [7,8]. This cellular degeneration plays a central role in AMD pathophysiology. More recently, blue-light (BL) exposure was shown to accelerate the production of ROS, lipid peroxidation, and cell apoptosis [9]. The deleterious effect of BL on the survival of retinal photoreceptors has been widely documented in vitro and in vivo models [10,11,12] and has been shown to increase caspase-3 (Casp3) expression in photoreceptor cells exposed [13]. Ferroptosis, a distinct form of regulated cell death, is primarily characterized by the accumulation of intracellular reactive oxygen species (ROS) and iron-dependent lipid peroxidation. This process is triggered by excessive iron accumulation, which catalyzes the formation of ROS through the Fenton reaction [14]. Recent studies have shown the critical role of ferroptosis in light-induced retinal degeneration, particularly in Sprague Dawley rats [15].
Alpha-phenyl-N-tertbutylnitrone (PBN) is a spin-trapping agent firstly used to capture trichloromethyl radical produced by an NADPH-dependent enzyme system present in liver microsomes. Novelli et al demonstrated a protective effect of PBN in cerebral ischemia in rat [16]. Later, it was demonstrated that PBN is also able to increase life span in the senescence-accelerated mouse [17] or to improve cognitive function in aging rats [18]. Neuroprotective effects were shown by other teams in several in vivo and in vitro models of degenerative diseases such as Huntington [19] or Alzheimer’s model [20].
Ranchon and al. were the first to demonstrate that systemic administration of PBN is able to protect photoreceptors from light-induced degeneration in a rat model of white light illumination [21]. Others studies confirmed the retinal protective effect of PBN in light-induced degeneration models in rats [22,23]. Mandal et al. have shown that PBN can inhibit RPE65, a critical enzyme in the visual cycle responsible for the regeneration of 11-cis-retinal. By modulating this key enzyme, PBN may slow down the visual cycle, potentially reducing the accumulation of toxic retinoid intermediates and alleviating metabolic stress on photoreceptors and RPE cells [22].
Here, PBN was administered by intraperitoneal injection in BALB/c mice, which were subsequently exposed to BL for 4 hours. Retinal function and tissue integrity were assessed using electroretinography (ERG) and histological analysis respectively. To elucidate the mechanisms induced by BL exposure in RPE cells and determine the effects of PBN, we analyzed the expression of genes involved in inflammation, oxidative stress, apoptosis, and ferroptosis using quantitative polymerase chain reaction (qPCR).
Our results allowed us to demonstrate for the first time the protective effect of PBN in a mouse model of BL-induced retinal damage (BLD). Moreover, we started to decipher the mechanisms activated by light exposure in RPE cells. Our results showed that BL exposure activates both apoptotic and ferroptotic pathways in RPE cells of BALB/c mice, and that PBN is able to counteract these intracellular pathways.
2. Materials and Methods
2.1. Ethical Statement
All animal procedures were performed according to the Council Directive 2010/63EU of the European Parliament and the Council of September 22, 2010, on the protection of animals used for scientific purposes, with the National Institutes of Health guidelines and with the ARVO Statement for the Use of Animals in Ophthalmic and Vision Research. They were approved by the French Minister of National Education, Superior Education and Research (APAFIS #27474 2020100110251857). All efforts were made to minimize suffering. Female BALB/c mice were provided by Envigo (Gannat, France). All animals were housed under 12-hour on/off cyclic normal lighting.
2.2. Reagents/Chemicals
PBN was from Santa Cruz Biotechnology (Dallas, TX, USA). All general chemicals, Hoechst 33342 and qPCR primers were from Sigma Aldrich (St. Louis, MO, USA). Primary antibody used for immunohistochemistry were listed in Table 1. Alexa Fluor® 488 conjugated secondary antibodies were from Thermo Fisher Scientific (Waltham, MA, USA).
2.3. Intraperitoneal Treatment and BLD
All animals were maintained in a 12-hour on/off light (≈ 10 lux) for two weeks before experimentation. Mice, dark-adapted for 24 h, were injected intraperitoneally with either PBN (50 mg/kg in H20 pH4), or an equivalent volume of vehicle (H20 pH4) 30 min prior to light damage and 1, 2.5 and 4 h after the beginning of the exposure. All manipulations with the animals were performed in dim red light. Pupils were dilated with 1 % atropine eye solution before illumination. A custom-made light-damage device equipped with fluorescent lamps (Phillips TL-D 36W/18 BLUE) with UV filter was used (Durand, St-Clair de la Tour, France). Light damage was induced at 4000 lux for 4 hours. Mice were placed individually in boxes covered with reflective foil and were free to move. Following exposure, animals were placed in the dark for 24 h and then were maintained under dim cyclic light up to 7 days.
To evaluate the effect of PBN on visual function, 4 groups of 8 BALB/c mice aged 7 weeks were used: injected with PBN (PBN) or vehicle (VEH), non-injected and illuminated (NI) and non-injected and non-illuminated (NINI).
For expression analysis, 3 groups of 4 mice were used: PBN, VEH, NINI. Mice were euthanized at the end of the illumination (T0), 24 h (T24h) or 7 days (T7d) before exposure. Four mice were used for each timepoint and group. Eyes were removed under dim red light and dissected to separate retina from RPE/choroid. Tissues were then frozen in liquid nitrogen and stored until extraction.
2.4. Full-Field Electroretinogram (ERG)
ERG recordings in mice were performed 7 days after BL as previously described [10]. Briefly, after overnight dark adaptation in mice, recording was done using Espion visual electrophysiology system (Diagnosys LLC, Lowell, MA, USA) that includes a ColorDome Ganzfeld. The ERG was recorded from both eyes of anaesthetized mice. Four responses to light stimulus at increasing intensities (0.1, 1, 10 and 30 cd.s.m-2) were averaged for scotopic response. After 5 min of light adaptation, the photopic response was recorded at the highest stimulus (average of 5 measurements at 30 cd.s.m-2).
2.5. Retinal Measurement and Photoreceptor Nuclear Counting
Following ERG measures, mice were euthanized and eyes were enucleated, dissected, and fixed as previously describe [10]. Cryosections (10 µm) were done using Superfrost® Plus slides (Thermo Fisher Scientific, Waltham, MA, USA) and stored at -20°C until analysis. Sections were stained with Hoechst 33342 to label nuclei and were scanned using a nanozoomer (NDP.scan v2.5.86, Hamamatsu, JP) with fluorescence imaging modules. Photoreceptor nuclei were quantified every 200µm from the optic nerve in superior and inferior retina along a vertical axis using the NDP.view 2 software v2.7.39 (Hamamatsu, JP). Retinal and inner retinal layer (INL) thickness were measured in the same benchmarks. Six eyes per group were quantified.
2.6. Immunohistochemistry
Retinal cryosections were permeabilized with 0.1% Triton X100 10 min at room temperature (RT) and saturated with 10% normal goat serum (NGS) or 3% bovine serum albumin (BSA) during 1 h at RT. Primary antibodies against (RPE65, Rho4D2, GNAT2, CalB, PKc α) were diluted in 2% NGS or 1% BSA and incubated overnight at 4°C and followed by Alexa Fluor® 488 conjugated secondary antibodies during 1 h at RT. Sections were stained with Hoechst 33342 to label nuclei and representative pictures were taken using CQ1, Confocal Quantitative Image Cytometer (Yokogawa, Tokyo, JP). Three eyes per group were immunolabelled.
2.7. Gene Expression Analysis
RPE was separated from choroid by mechanical disruption using pestle. Total RNA of mice RPE was extracted using Monarch Total RNA Miniprep (New England Biolabs, Ipswich, MA, USA) according to the manufacturer’s protocol. mRNA was reverse transcribed in cDNA using SuperScript III Reverse Transcriptase kit and Oligo DT primer (Thermo Fisher Scientific, Waltham, MA, USA). qPCR were performed on QuantStudio™ 6 Pro System using Power SYBR™ Green (Applied Biosystems, Foster City, CA, USA) as previously described [24]. Primers sequences used are listed in Table 2. The gene expressions were calculated relative to GAPDH using the ΔΔCt method. All experimental conditions were processed in triplicate and each experiment was done at least 3 times.
2.8. Statistical Analyses
For statistical analyses, One-way ANOVA followed by Dunnett’s multiple comparisons test was performed using GraphPad Prism 9.0.0 (GraphPad Software, San Diego, CA, USA). All values reported were means +/- SEM. A p-value < 0.05 was considered statistically significant.
3. Results
3.1. PBN Protects Photoreceptor and Inner Retinal Function Against BLD
In order to test whether PBN is able to preserve retinal function, mice were injected intraperitoneally with PBN or VEH and exposed to BL illumination. The effects of PBN on retinal cell activity were assessed by measuring ERG 7 days after light exposure (Scheme 1).
The scotopic A wave reflects the response of photoreceptors, with a rod-specific response when the flash intensity is below 10 cd.s/m2 and a mixed rod and cone response between 10 and 30 cd.s/m2. The scotopic B wave reflects the response of the inner retina. The photopic B wave amplitude represents cone photoreceptor function.
BL illumination induced drastic reduction of scotopic A and B wave of 77, 69, and 70% and 52, 62 and 57% respectively at 1, 10 and 30 cd.s/m2 in VEH control group compared to NINI (p<0.0001). No significant differences were found between VEH and NI groups. Mice injected with PBN showed a highly significant preservation of A wave of 93, 89 and 92% and B wave of 94, 92 and 100% at 1, 10 and 30 cd.s/m2 compared to VEH (p<0.0001) (Figure 1a,b). The photopic B wave amplitude decreased by 65 and 64% after illumination in NI and VEH groups respectively compared to NINI group (p<0.0001). Again, cone response was highly preserved in mice treated with PBN compared to VEH group (53%, p<0.01) (Figure 1c).
All together these results show that BALB/c mice exposed for 4 h to BL (4000 lux) display a highly-reduced electric response in both photoreceptors and inner retinal cells, and that systemic administration of PBN strongly preserves rod and cone function together with retinal activity.
3.2. PBN Protects Photoreceptors and Inner Retinal Cells After BL
To assess retinal damage at 7 days after BL, nuclei were labeled on retinal cryosections and representative pictures in the central retina were taken for each tested condition (Figure 2a). In NI and VEH-treated mice BL induced a severe retinal degeneration in the outer nuclear layer (ONL) with a destruction of most of the photoreceptor outer segments. The inner retinal layer (INL) was also impacted as a consequence of photoreceptor degeneration but at a lesser extent. In PBN-treated mice the whole retinal structure seemed to be preserved compared to the NINI mice.
To evaluate these effects, we measured retinal and INL thickness and quantified the number of photoreceptor nuclei. The whole retinal thickness was reduced by 28% and 35% in VEH and NI groups respectively compared to NINI group (p<0.001). In PBN-treated mice retinal thickness was preserved by 61% compared to VEH-treated mice (p<0.001) (Figure 2b,c). The INL thickness was reduced by 13% and 15% after BL in VEH and NI groups respectively compared to NINI group (p<0.01), and it was completely preserved in the PBN group (Figure 2d,e). Notably, the observed loss was localized specifically in the superior retina, spanning a region between 200 and 800 µm from the optic nerve. This specificity was already established, as retinal light damage in mice is a graded response, with the superior retina often exhibiting severe effects. [25].
A strong loss of 66% and 74% photoreceptors also occurred in VEH and NI groups respectively compared to NINI group (p<0.0001). In PBN group, the loss of photoreceptors was only 20% compared to VEH group, and it was not statistically significant compared to NINI group (Figure 2f, 2g).
These results corroborated the protective effect of PBN measured by ERG. Seven days after BL, retinas of mice treated with PBN were almost intact.
3.3. PBN Protects Photoreceptors and Inner Retinal Neurons
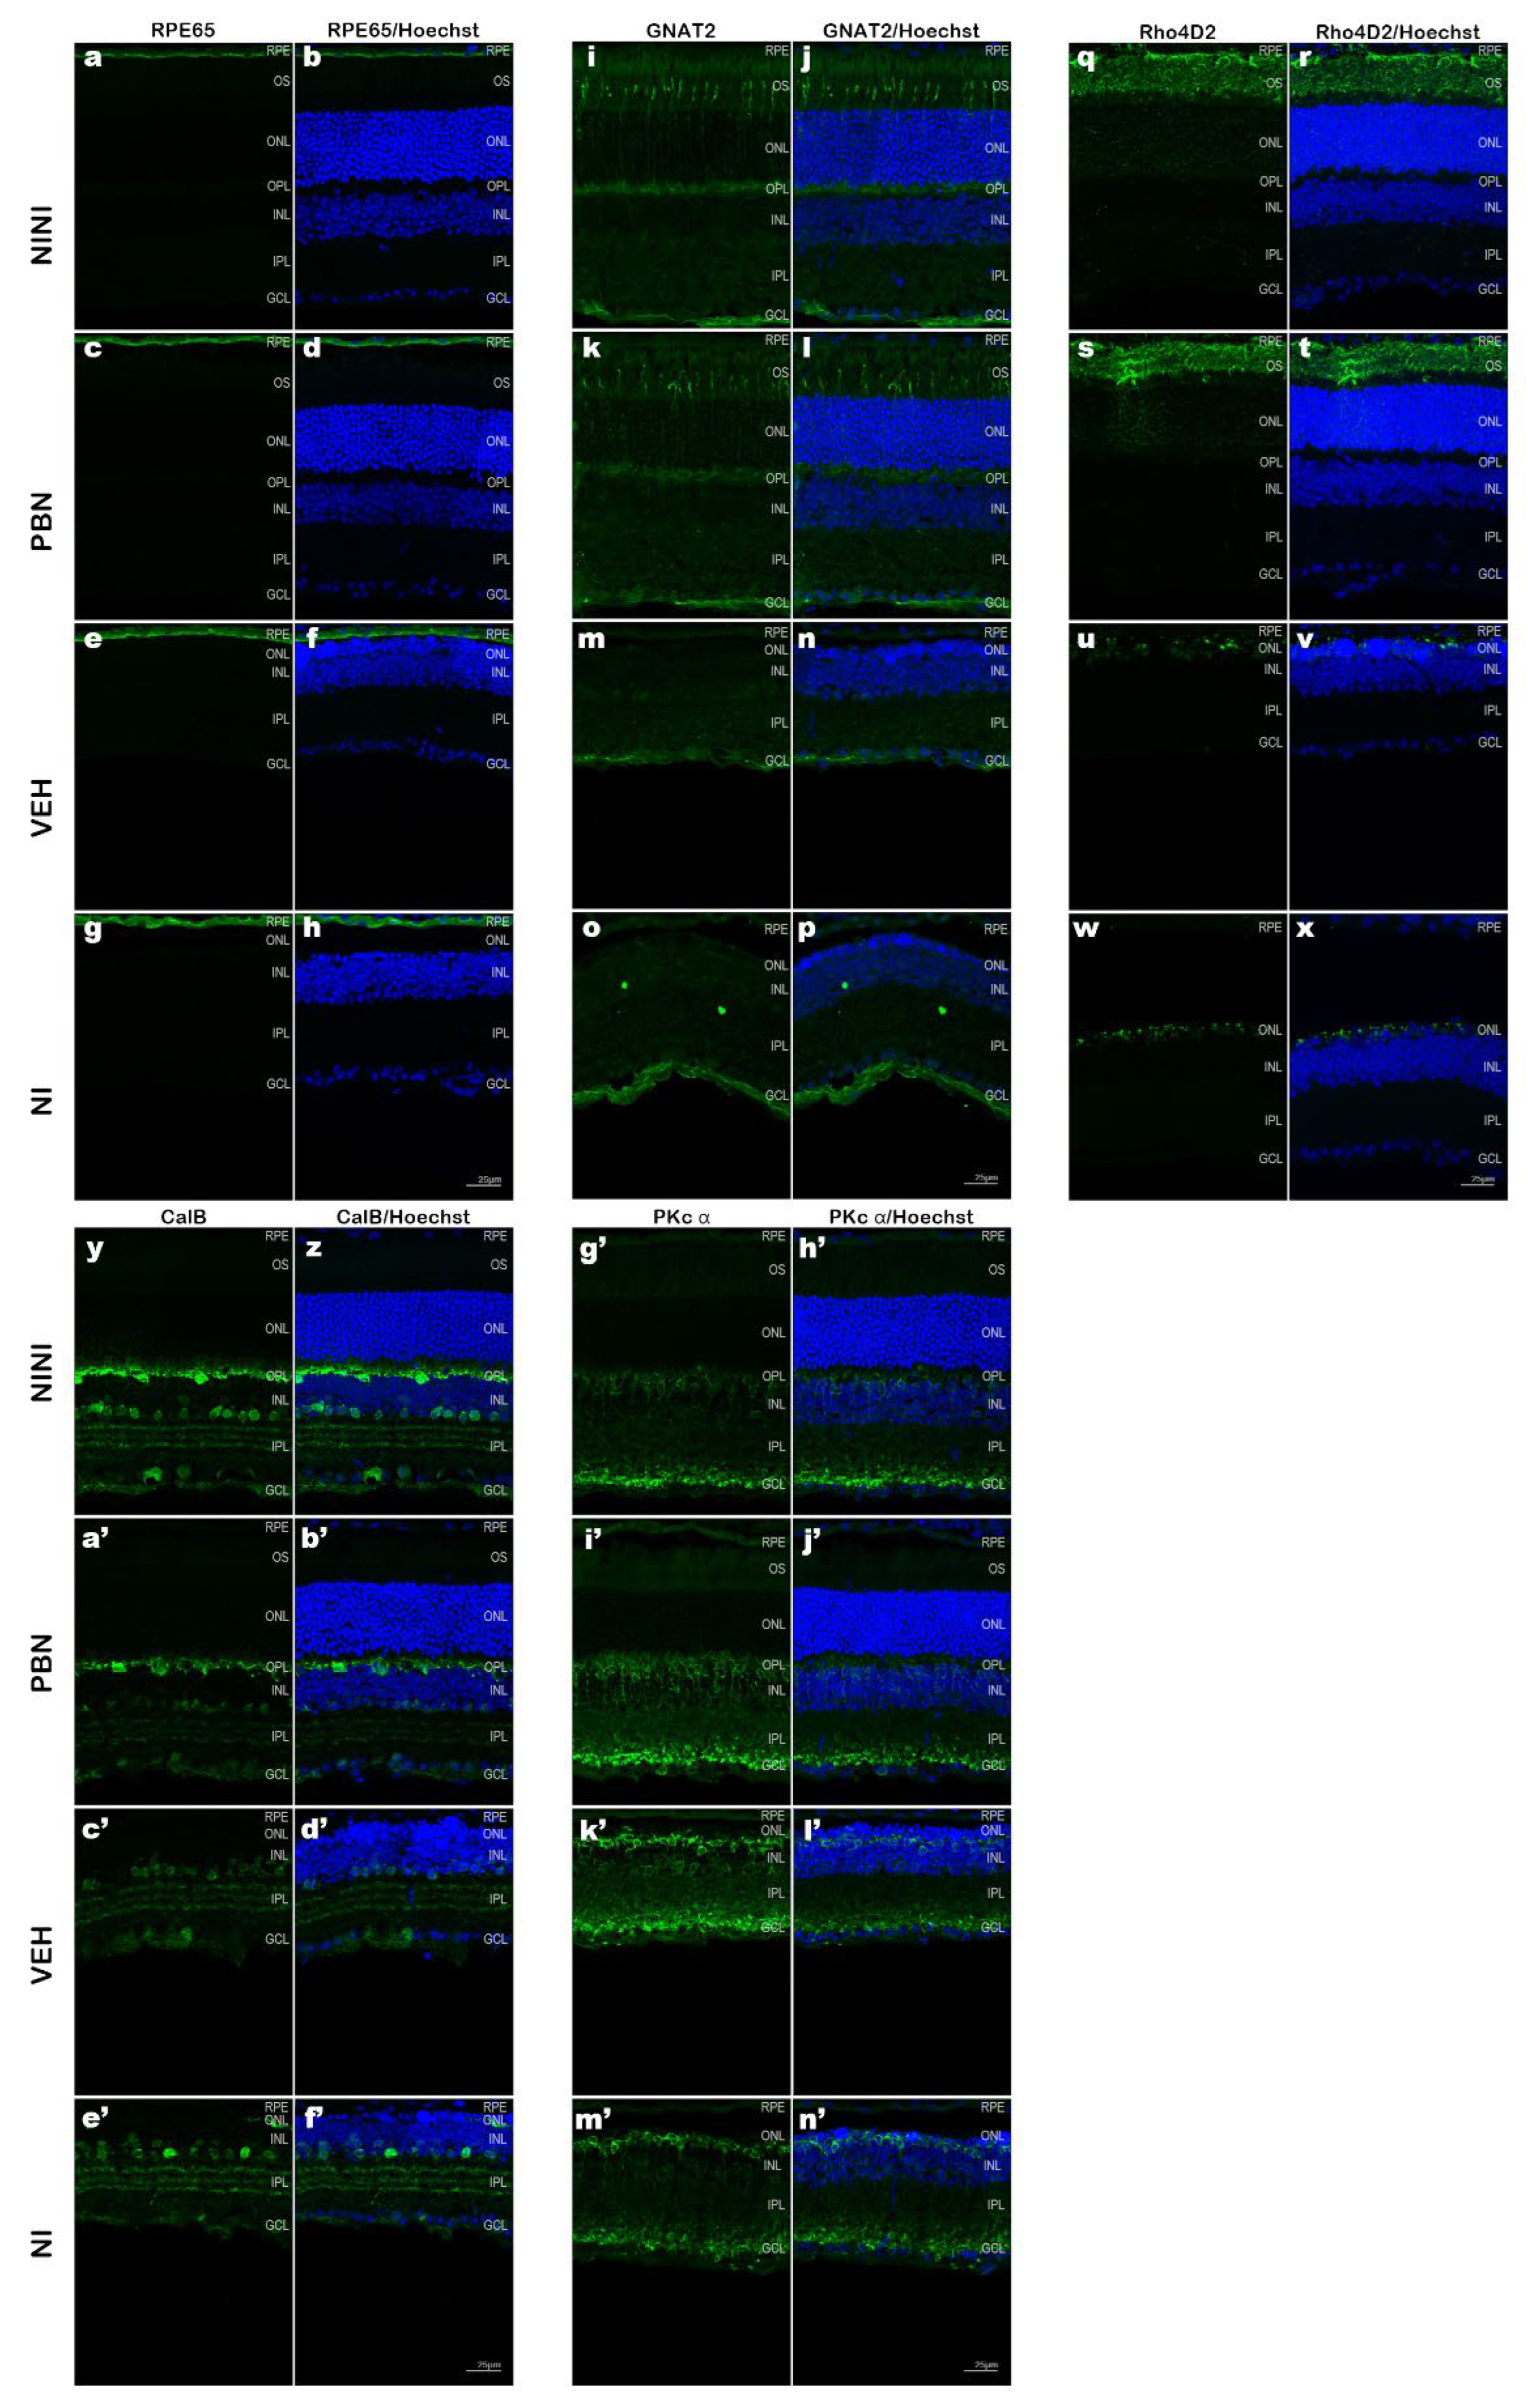
To further characterize the effect of BL illumination on retinal cells and determine which cell types were affected, we performed immunostaining on retinal cryosection 7 days after BL. The pictures in Figure 3 were taken in the superior retina between 400 to 600µm from the optic nerve where light effects were most pronounced.
RPE65 is a crucial enzyme in the visual cycle responsible for the trans-cis isomerization of retinol in the RPE. It has been found to be restricted to the RPE in many studies [26]. Rhodopsin is a light-sensitive G protein-coupled receptor found exclusively in rod photoreceptor cells [27]. GNAT2 is an isoform expressed specifically in cone photoreceptors [28]. CalB, a high-affinity calcium-binding protein of the EF-hand family, shows distinct expression patterns in the mouse retina. The horizontal cells show the highest level of calbindin immunoreactivity. Amacrine cells, displaced amacrine cells, and ganglion cells are also labeled [29]. Rod bipolar cells of all mammals are immunoreactive for PKc α a serine/threonine kinase [30].
Confocal microscopy images on mouse retinal cryosections showed that RPE65 immunostaining was preserved after BL in all groups but was more diffuse than in NINI mice indicating RPE suffering (Figure 3a-h). In the NI group RPE appeared more affected by BL than in VEH and PBN groups. Analysis of GNAT2 (Figure 3i-p) and Rho4D2 (Figure 3q-x) immunostainings demonstrated a strong loss in retinal photoreceptor outer segments after BL in VEH and NI groups. This reduction was strongly correlated with a loss of photoreceptor nuclei. In contrast, retinas from PBN-treated mice maintained Rho4D2 and GNAT2 expression. The intensity of outer segment labeling for GNAT2 appeared diminished compared to NINI group (Figure 3i-l) suggesting that the cones were affected by BL, which is consistent with our results of photopic ERGs showing a slight decrease in cone electrical activity. To identify BL-affected cells in the INL, we performed CalB immunostaining. Our results revealed a significant loss of horizontal cells in this retinal region in both VEH and NI groups. Horizontal cells were largely preserved in the retinas of PBN-treated mice (Figure 3y-f’). This preservation suggests a potential protective effect of PBN against BL-induced horizontal cell loss probably linked to the survival of photoreceptors. Rod bipolar cells immunolabelled with an anti-PKc α antibody were found at the outer margin of the INL. BL seemed to induce disorganization and retraction of the dendrite of these cells. In PBN-treated mice rod bipolar cells presented normal morphology (Figure 3g-n’).
3.4. PBN Inhibits RPE Apoptosis and Ferroptosis Pathways Induced by BL
In order to better understand the intracellular mechanisms activated in RPE cell by BL exposure and determine the effects of PBN, mRNA expression of several genes was measured by qPCR. Mice were illuminated and the RPE was removed from eyeballs at different times post illumination (Scheme 2).
AP-1, Nrf2 and Nfkb1 are TF involved in the regulation of oxidative stress and inflammation in many cell types including RPE cells [3,31,32]. We first evaluated the expression of these TF different times after BL in RPE of mice treated with PBN, VEH or NINI.
Four hours of BL (T0) induced a 3.3-fold increase in the expression of cJun, a subunit of AP-1 compared to NINI group (p<0.0001). After 24h (T24h) and 7 days (T7d) its expression remained 2.3-fold and 2.4-fold higher compared to the NINI group (p<0.01). At T0 PBN limited the increase of cJun expression of 43% compared to VEH (non-significant) and at T24h PBN strongly inhibited the overexpression of cJun by 77% compared to VEH (p<0.05) (Figure 4a), however, no significant effect was observed at 7d. At T0 the expression of Nrf2 mRNA was slightly increased (1.4-fold, (p=0.08)) in VEH treated-mice and no noticeable effect of PBN was shown for this FT. Likewise, no significant effect was shown at T24h and T7d for both VEH and PBN (Figure 4b,c).
It was previously demonstrated that AP-1 is involved in the white light-induced photoreceptor apoptosis in mice [33]. Our results thus suggest that apoptosis may also occur in RPE cells of mice exposed to BL. Here we demonstrate that PBN treatment inhibits BL-induced overexpression of AP-1 subunit cJun mRNA in RPE cells.
Bcl-2, Bax and Casp3 have been described to be implicated in cell survival and apoptosis [34]. We thus examined the mRNA expression of these apoptotic markers in RPE cells. As shown in Figure 5a,b, Bcl-2 and Bax mRNA expression were not significantly affected by 4h of BL (T0) in neither VEH-treated nor PBN-treated mice compared to NINI mice. Moreover, at T24h and T7d, no statistically significant change in expression was noticed in both groups, but a decrease in Bcl-2 expression could be observed. Unlike Bcl-2 and Bax, Casp3 mRNA expression was found to be slightly increased as soon as T0 in the VEH-treated mice compared to NINI mice and became significantly overexpressed by 2 at T7d (p<0.001) (Figure 5c). PBN significantly inhibited Casp3 mRNA overexpression at T0 and T24h (p<0.05). At T7d, this inhibition was lesser and not significant.
Altogether, these results demonstrate that BL-induced apoptosis of RPE cells begins between 24 hours and 7 days after the end of illumination, and occurs independently of Bcl-2 and Bax activation.
Light has been identified as a significant inducer of oxidative stress in the retina [35]. Therefore, we evaluated the impact of BL on the expression of RPE genes involved in oxidative stress regulation. Key antioxidant mechanisms include the conversion of superoxide anions to hydrogen peroxide by Sod and the breakdown of hydrogen peroxide by Cat [3]. Hmox1 plays a crucial role in reducing oxidative stress through the heme oxygenase reaction pathway, which degrades heme b while consuming molecular oxygen. This reaction produces three primary byproducts: carbon monoxide (CO), ferrous iron (Fe²⁺), and biliverdin [36]. Given that gene expression can be influenced by light exposure, we measured the mRNA levels of antioxidant-related proteins, including Hmox1, Cat, Sod1, and Sod2.
Figure 6a shows that mRNA expression of Hmox1 was increased by almost 3.1-fold at T0 in VEH-treated mice compared to NINI mice (p< 0.05). This increase was even greater 24 h after illumination reaching a value of 7 (p<0.0001). However, PBN was able to highly and significantly reduce this overexpression by 68% (p<0.001). At T0 and T7d no effect of PBN was noticed compared to the VEH.
Catalase mRNA expression was not modified at all time-points studied in the VEH-treated group but tended to slightly increase at T7d. Interestingly, PBN induced a more important increase (1.7-fold (p<0.05)) at T7d.
SOD1 and SOD2 mRNA expression did not show any significant modification following BL in neither the VEH nor the PBN group.
Our result reveals that exposure to BL induced a significant upregulation of the messenger of Hmox1 in RPE with a peak observed 24h post-exposure. Under these experimental conditions, the mRNA expression of the other enzymes remained unaltered. Remarkably, PBN effectively attenuated the light-induced hyperactivation of Hmox1 with no notable effect on other enzymes compared to VEH mice.
Recently, it has been shown that overexpression of Hmox1 has a deleterious effect on RPE by the induction of ferrous ions accumulation that leads to RPE death by ferroptosis [37]. In order to confirm whether BL induced ferroptosis in RPE cells we measured the expression of Tfrc and Gpx4 mRNA. Gpx4 is an intracellular antioxidant selenoprotein that can reduce lipid peroxidation within cell membranes [38]. Tfrc is a key iron transporter and can lead to iron overload and lipid peroxidation [39]. Figure 7a shows that BL did not induce Gpx4 mRNA overexpression in the RPE of VEH-treated mice whereas PBN treatment significantly increased it by 1.5-fold at T24h compared to NINI mice (p<0.05). At the same time Tfrc was significantly increased by 1.9-fold in RPE of VEH-treated mice and was completely inhibited in PBN-treated mice compared to NINI mice (p<0.05).
Here we demonstrate that at T24h, BL induced ferroptotic pathway in RPE cell of BALB/c mice. PBN was able to counteract this activation concomitantly with the activation of GPX4.
4. Discussion
In this study, we demonstrated for the first time by measuring ERG and immunohistochemistry observation that systemic administration of PBN in BALB/c mice protects the retina against 4h exposition of BL. This study complements the results obtained by other teams, such as Ranchon et al., who demonstrated a protective effect of PBN in the retinas of rats exposed to white light [21].
Very few publications have shown damage to the RPE in vivo after illumination. Cachafeiro et al. observed a rupture of the blood-retinal barrier [40]. Nakamura et al. showed disorganization of the RPE layer accompanied by cell enlargement [41]. Here, we observed by immunohistochemical staining with anti-RPE65 antibody that the RPE cells were still present 7d after mouse illumination regardless of the condition tested. To characterize the effects of BLD on RPE, we measured mRNA expression of genes directly involved in intracellular mechanisms. The induction of c-Jun and Nrf2 expression at the end of illumination shows that these transcription factors, known to be involved in oxidative stress and inflammation, are thus implicated in the intracellular response of the RPE to BL. AP-1, a heterodimer composed of c-Fos and cJun, is known to play a major role in photoreceptor death by apoptosis following light stress [7]. Here we show that cJun mRNA expression was strongly increased in the RPE after BL exposure in BALB/c mice. This increase in gene expression remained high for up to 7 days after BL, suggesting that apoptotic mechanisms were active in RPE cells. Illumination did not induce significant changes in Bcl-2 and Bax expression. However, we observed a fairly pronounced but non-significant decrease in Bcl-2 expression in the RPE of vehicle-treated mice. A complementary study to measure protein expression may help confirm these observations. Concomitantly, we observed an increase in caspase-3 expression. Its activation by BL was shown to be involved in photoreceptor cell death [13] in Sprague Dawley rats. These results show that apoptotic processes are activated in the RPE under BL stress.
The expression of Nrf2 was very weakly increased after BL illumination, while the expression of one of its effectors, Hmox1, was very strongly increased. These data suggest that our gene expression measurements may not be the most representative of its activation in the present model. Nrf2 is a TF which is, when activated, translocated into the nucleus to activate target genes, via the binding on antioxidant response element (ARE) [42]. Indeed, the timings used in our experiments were relatively far apart, which would explain this inconsistency.
Hmox1 plays a critical role across a wide spectrum of human diseases, including retinal disorders [43,44]. Moreover, recent research indicates that the level of Hmox1 activation is crucial in determining whether it exerts protective or deleterious effects [45]. C. Chen et al. also suggested that excessive Hmox1 expression leads to increased ferrous iron (Fe2+) production, which promotes ROS accumulation and initiates ferroptosis, a form of regulated cell death. Using zinc protoporphyrin IX (ZnPP), a selective inhibitor of Hmox1, they showed protective effects on photoreceptors and RPE cells in Abca4/Rdh8 knockout mice exposed to LED light [46]. In addition, our findings revealed a significant upregulation of Tfrc, a well-established ferroptosis marker [47] in the RPE as early as 24 hours post-BL exposure. Altogether these observations suggest that BL triggers not only pro-apoptotic but also pro-ferroptotic processes in RPE cells.
Our findings demonstrate that PBN effectively inhibits the BL-induced overexpression of the cJun subunit of AP-1, 24 h post illumination. This reduction correlates with the inhibition of caspase-3 upregulation from immediately after illumination until 24 hours post-LD. Suggesting that PBN can counteract apoptotic mechanisms induced by BL exposure. Similar effects were reported by Tomita et al. in Sprague-Dawley rats exposed to white light [48]. Furthermore, PBN strongly inhibits the overexpression of Hmox1 and Tfrc 24 hours after exposing BALB/c mice to BL, indicating its ability to suppress light-activated ferroptotic mechanisms. Additionally, we observed an increase in GPX4 expression, which was shown to play a crucial role in protecting retinal cells from oxidative stress and ferroptosis-induced damage [49].
5. Conclusions
These findings collectively suggest that PBN exhibits a dual protective effect against BL by inhibiting both apoptotic and ferroptotic pathways while enhancing antioxidant mechanisms in the RPE cells of BALB/c mice.
Author Contributions
Conceptualization, E.M. and V.F.; methodology, E.M. and V.F.; validation, E.M. and V.F.; investigation, E.M., V.F., L.L., C.F., T.B.; resources, E.M. and V.F.; data curation, E.M., V.F.; writing—original draft preparation, E.M., V.F.; writing—review and editing, E.M., T.B., V.F.; supervision, E.M., V.F.; project administration, V.F.; funding acquisition, J.S., V.F.. All authors have read and agreed to the published version of the manuscript
Funding
This work was supported by the Programme Investissements d’Avenir IHU FOReSIGHT (ANR-18-IAHU-01). This work was supported by the Région Ile-de-France.
Institutional Review Board Statement
The animal study protocol was approved by the French Minister of National Education, Superior Education and Research (APAFIS #27474 2020100110251857).
Data Availability Statement
The raw data supporting the conclusions of this article will be made available by the authors on request.
Acknowledgments
We thank the High Content Screening platform and the animal facility of the Institut de la Vision.
Conflicts of Interest
The authors declare no conflicts of interest.
Abbreviations
The following abbreviations are used in this manuscript:
| AMD | Age-related macular degeneration |
| BLD | Blue-light damage |
| BL | Blue light |
| PBN | Phenyl-N-tertbutylnitrone |
| ROS | Reactive oxygen species |
| Sod | Superoxide dismutase |
| Cat | Catalase |
| Hmox | Heme oxygenase |
| Gpx | Glutathione peroxidase |
| TF | Transcription factor |
| Nrf2 | Nuclear factor erythroid 2-related factor 2 |
| RPE | Retinal pigment epithelium |
| AP-1 | Activating protein-1 |
| Casp3 | Caspase-3 |
| ERG | Electroretinography |
| qPCR | Quantitative polymerase chain reaction |
| VEH | Vehicle |
| NI | Non-injected and illuminated |
| NINI | Non-injected and non-illuminated |
| INL | Inner retinal layer |
| RT | Room temperature |
| NGS | Normal goat serum |
| BSA | Bovine serum albumin |
References
- Grimm, C.; Reme, C.E. Light Damage Models of Retinal Degeneration. In Retinal Degeneration: Methods and Protocols; Weber, B.H.F., Langmann, T., Eds.; Methods in Molecular Biology; Springer New York: New York, NY, 2019; Vol. 1834, ISBN 978-1-4939-8668-2. [Google Scholar]
- Carozza, G.; Zerti, D.; Tisi, A.; Ciancaglini, M.; Maccarrone, M.; Maccarone, R. An Overview of Retinal Light Damage Models for Preclinical Studies on Age-Related Macular Degeneration: Identifying Molecular Hallmarks and Therapeutic Targets. Rev. Neurosci. 2024, 35, 303–330. [Google Scholar] [CrossRef]
- Böhm, E.W.; Buonfiglio, F.; Voigt, A.M.; Bachmann, P.; Safi, T.; Pfeiffer, N.; Gericke, A. Oxidative Stress in the Eye and Its Role in the Pathophysiology of Ocular Diseases. Redox Biol. 2023, 68, 102967. [Google Scholar] [CrossRef]
- Strauss, O. The Retinal Pigment Epithelium in Visual Function. Physiol. Rev. 2005, 85, 845–881. [Google Scholar] [CrossRef] [PubMed]
- Datta, S.; Cano, M.; Ebrahimi, K.; Wang, L.; Handa, J.T. The Impact of Oxidative Stress and Inflammation on RPE Degeneration in Non-Neovascular AMD. Prog. Retin. Eye Res. 2017, 60, 201–218. [Google Scholar] [CrossRef]
- Hafezi, F.; Marti, A.; Munz, K.; Remé, C.E. Light-Induced Apoptosis: Differential Timing in the Retina and Pigment Epithelium. Exp. Eye Res. 1997, 64, 963–970. [Google Scholar] [CrossRef]
- Grimm, C.; Wenzel, A.; Behrens, A.; Hafezi, F.; Wagner, E.F.; Remé, C.E. AP-1 Mediated Retinal Photoreceptor Apoptosis Is Independent of N-Terminal Phosphorylation of c-Jun. Cell Death Differ. 2001, 8, 859–867. [Google Scholar] [CrossRef]
- Wenzel, A.; Grimm, C.; Samardzija, M.; Remé, C.E. Molecular Mechanisms of Light-Induced Photoreceptor Apoptosis and Neuroprotection for Retinal Degeneration. Prog. Retin. Eye Res. 2005, 24, 275–306. [Google Scholar] [CrossRef]
- Cougnard-Gregoire, A.; Merle, B.M.J.; Aslam, T.; Seddon, J.M.; Aknin, I.; Klaver, C.C.W.; Garhöfer, G.; Layana, A.G.; Minnella, A.M.; Silva, R.; et al. Blue Light Exposure: Ocular Hazards and Prevention—A Narrative Review. Ophthalmol. Ther. 2023, 12, 755–788. [Google Scholar] [CrossRef] [PubMed]
- Fontaine, V.; Balducci, C.; Guibout, L.; Feraille, L.; Elena, P.; Sahel, J.-A.; Veillet, S.; Lafont, R. NORBIXIN PROTECTS RETINAL PIGMENTED EPITHELIUM AND PHOTORECEPTORS IN DIFFERENT MODELS OF DRY AGE-RELATED MACULAR DEGENERATION. 2016, 63.
- Fontaine, V.; Monteiro, E.; Fournié, M.; Brazhnikova, E.; Boumedine, T.; Vidal, C.; Balducci, C.; Guibout, L.; Latil, M.; Dilda, P.J.; et al. Systemic Administration of the Di-Apocarotenoid Norbixin (BIO201) Is Neuroprotective, Preserves Photoreceptor Function and Inhibits A2E and Lipofuscin Accumulation in Animal Models of Age-Related Macular Degeneration and Stargardt Disease 2020.
- Grimm, C.; Reme, C.E.; Rol, P.O.; Williams, T.P. Blue Light’s Effects on Rhodopsin: Photoreversal of Bleaching in Living Rat Eyes. 2000, 41, 7.
- Wu, J.; Gorman, A.; Zhou, X.; Sandra, C.; Chen, E. Involvement of Caspase-3 in Photoreceptor Cell Apoptosis Induced by In Vivo Blue Light Exposure. 2002, 43.
- Yang, Y.; Lin, Y.; Han, Z.; Wang, B.; Zheng, W.; Wei, L. Ferroptosis: A Novel Mechanism of Cell Death in Ophthalmic Conditions. Front. Immunol. 2024, 15, 1440309. [Google Scholar] [CrossRef] [PubMed]
- Tang, W.; Guo, J.; Liu, W.; Ma, J.; Xu, G. Ferrostatin-1 Attenuates Ferroptosis and Protects the Retina against Light-Induced Retinal Degeneration. Biochem. Biophys. Res. Commun. 2021, 548, 27–34. [Google Scholar] [CrossRef]
- Novelli, G.P.; Angiolini, P.; Tani, R.; Consales, G.; Bordi, L. Phenyl-T-Butyl-Nitrone Is Active against Traumatic Shock in Rats. Free Radic. Res. Commun. 1986, 1, 321–327. [Google Scholar] [CrossRef] [PubMed]
- SAITO, K.; YOSHIOKA, H.; CUTLER, R.G. A Spin Trap, N-Tert-Butyl-α-Phenylnitrone Extends the Life Span of Mice. Biosci. Biotechnol. Biochem. 1998, 62, 792–794. [Google Scholar] [CrossRef]
- Socci, D.J.; Crandall, B.M.; Arendash, G.W. Chronic Antioxidant Treatment Improves the Cognitive Performance of Aged Rats. Brain Res. 1995, 693, 88–94. [Google Scholar] [CrossRef] [PubMed]
- Nakao, N.; Brundin, P. EFFECTS OF -PHENYL-TERT-BUTYL NITRONE ON NEURONAL SURVIVAL AND MOTOR FUNCTION FOLLOWING INTRASTRIATAL INJECTIONS OF QUINOLINATE OR 3-NITROPROPIONIC ACID. Neuroscience 1997, 76, 749–761. [Google Scholar] [CrossRef]
- Garcia-Alloza, M.; Borrelli, L.A.; Hyman, B.T.; Bacskai, B.J. Antioxidants Have a Rapid and Long-Lasting Effect on Neuritic Abnormalities in APP:PS1 Mice. Neurobiol. Aging 2010, 31, 2058–2068. [Google Scholar] [CrossRef]
- Ranchon, I.; Chen, S.; Alvarez, K.; Anderson, R.E. Systemic Administration of Phenyl-N-Tert-Butylnitrone Protects the Retina from Light Damage. 2001, 42, 5.
- Mandal, M.N.A.; Moiseyev, G.P.; Elliott, M.H.; Kasus-Jacobi, A.; Li, X.; Chen, H.; Zheng, L.; Nikolaeva, O.; Floyd, R.A.; Ma, J.; et al. α-Phenyl- N-Tert -Butylnitrone (PBN) Prevents Light-Induced Degeneration of the Retina by Inhibiting RPE65 Protein Isomerohydrolase Activity. J. Biol. Chem. 2011, 286, 32491–32501. [Google Scholar] [CrossRef]
- Stiles, M.; Moiseyev, G.P.; Budda, M.L.; Linens, A.; Brush, R.S.; Qi, H.; White, G.L.; Wolf, R.F.; Ma, J.; Floyd, R.; et al. PBN (Phenyl-N-Tert-Butylnitrone)-Derivatives Are Effective in Slowing the Visual Cycle and Rhodopsin Regeneration and in Protecting the Retina from Light-Induced Damage. PLOS ONE 2015, 10, e0145305. [Google Scholar] [CrossRef]
- Fontaine, V.; Fournié, M.; Monteiro, E.; Boumedine, T.; Balducci, C.; Guibout, L.; Latil, M.; Sahel, J.-A.; Veillet, S.; Dilda, P.J.; et al. A2E-Induced Inflammation and Angiogenesis in RPE Cells in Vitro Are Modulated by PPAR-α, -β/δ, -γ, and RXR Antagonists and by Norbixin. Aging 2021, 13, 22040–22058. [Google Scholar] [CrossRef]
- Organisciak, D.T.; Vaughan, D.K. Retinal Light Damage: Mechanisms and Protection. Prog. Retin. Eye Res. 2010, 29, 113–134. [Google Scholar] [CrossRef]
- Kiser, P.D. Retinal Pigment Epithelium 65 kDa Protein (RPE65): An Update. Prog. Retin. Eye Res. 2022, 88, 101013. [Google Scholar] [CrossRef] [PubMed]
- Rhodopsin: Methods and Protocols; Jastrzebska, B., Ed.; Methods in Molecular Biology; Springer New York: New York, NY, 2015; Vol. 1271, ISBN 978-1-4939-2329-8. [Google Scholar]
- Kohl, S.; Baumann, B.; Rosenberg, T.; Kellner, U.; Lorenz, B.; Vadalà, M.; Jacobson, S.G.; Wissinger, B. Mutations in the Cone Photoreceptor G-Protein α-Subunit Gene GNAT2 in Patients with Achromatopsia. Am. J. Hum. Genet. 2002, 71, 422–425. [Google Scholar] [CrossRef] [PubMed]
- Wässle, H.; Peichl, L.; Airaksinen, M.S.; Meyer, M. Calcium-Binding Proteins in the Retina of a Calbindin-Null Mutant Mouse. Cell Tissue Res. 1998, 292, 211–218. [Google Scholar] [CrossRef]
- Haverkamp, S.; Wässle, H. Immunocytochemical Analysis of the Mouse Retina. J. Comp. Neurol. 2000, 424, 1–23. [Google Scholar] [CrossRef]
- Fontaine, V.; Balducci, C.; Dinan, L.; Monteiro, E.; Boumedine, T.; Fournié, M.; Nguyen, V.; Guibout, L.; Clatot, J.; Latil, M.; et al. Anti-Inflammatory Effects and Photo- and Neuro-Protective Properties of BIO203, a New Amide Conjugate of Norbixin, in Development for the Treatment of Age-Related Macular Degeneration (AMD). Int J Mol Sci 2023. [Google Scholar] [CrossRef]
- Tomita, H.; Tabata, K.; Takahashi, M.; Nishiyama, F.; Sugano, E. Light Induces Translocation of NF-κB P65 to the Mitochondria and Suppresses Expression of Cytochrome c Oxidase Subunit III (COX III) in the Rat Retina. Biochem. Biophys. Res. Commun. 2016, 473, 1013–1018. [Google Scholar] [CrossRef]
- Grimm, C.; Wenzel, A.; Hafezi, F.; Remè, C.E. Gene Expression in the Mouse Retina: The Effect of Damaging Light. Mol. Vis. 2000, 9. [Google Scholar]
- Donovan, M.; Cotter, T.G. Control of Mitochondrial Integrity by Bcl-2 Family Members and Caspase-Independent Cell Death.
- Ozawa, Y. Oxidative Stress in the Light-Exposed Retina and Its Implication in Age-Related Macular Degeneration. Redox Biol. 2020, 37, 101779. [Google Scholar] [CrossRef] [PubMed]
- Li, H.; Liu, B.; Lian, L.; Zhou, J.; Xiang, S.; Zhai, Y.; Chen, Y.; Ma, X.; Wu, W.; Hou, L. High Dose Expression of Heme Oxigenase-1 Induces Retinal Degeneration through ER Stress-Related DDIT3. Mol. Neurodegener. 2021, 16, 16. [Google Scholar] [CrossRef]
- Tang, Z.; Ju, Y.; Dai, X.; Ni, N.; Liu, Y.; Zhang, D.; Gao, H.; Sun, H.; Zhang, J.; Gu, P. HO-1-Mediated Ferroptosis as a Target for Protection against Retinal Pigment Epithelium Degeneration. Redox Biol. 2021, 43, 101971. [Google Scholar] [CrossRef]
- Conrad, M.; Pratt, D.A. The Chemical Basis of Ferroptosis. Nat. Chem. Biol. 2019, 15, 1137–1147. [Google Scholar] [CrossRef]
- Zhao, T.; Guo, X.; Sun, Y. Iron Accumulation and Lipid Peroxidation in the Aging Retina: Implication of Ferroptosis in Age-Related Macular Degeneration. Aging Dis. 2021, 12. [Google Scholar] [CrossRef]
- Cachafeiro, M.; Bemelmans, A.-P.; Samardzija, M.; Afanasieva, T.; Pournaras, J.-A.; Grimm, C.; Kostic, C.; Philippe, S.; Wenzel, A.; Arsenijevic, Y. Hyperactivation of Retina by Light in Mice Leads to Photoreceptor Cell Death Mediated by VEGF and Retinal Pigment Epithelium Permeability. Cell Death Dis. 2013, 4, e781–e781. [Google Scholar] [CrossRef]
- Nakamura, M.; Yako, T.; Kuse, Y.; Inoue, Y.; Nishinaka, A.; Nakamura, S.; Shimazawa, M.; Hara, H. Exposure to Excessive Blue LED Light Damages Retinal Pigment Epithelium and Photoreceptors of Pigmented Mice. Exp. Eye Res. 2018, 177, 1–11. [Google Scholar] [CrossRef]
- Itoh, K.; Wakabayashi, N.; Katoh, Y.; Ishii, T.; Igarashi, K.; Engel, J.D.; Yamamoto, M. Keap1 Represses Nuclear Activation of Antioxidant Responsive Elements by Nrf2 through Binding to the Amino-Terminal Neh2 Domain. Genes Dev. 1999, 13, 76–86. [Google Scholar] [CrossRef]
- Dunn, L.L.; Midwinter, R.G.; Ni, J.; Hamid, H.A.; Parish, C.R.; Stocker, R. New Insights into Intracellular Locations and Functions of Heme Oxygenase-1. Antioxid. Redox Signal. 2014, 20, 1723–1742. [Google Scholar] [CrossRef]
- Sun, M.-H.; Pang, J.-H.S.; Chen, S.-L.; Kuo, P.-C.; Chen, K.-J.; Kao, L.-Y.; Wu, J.-Y.; Lin, K.-K.; Tsao, Y.-P. Photoreceptor Protection against Light Damage by AAV-Mediated Overexpression of Heme Oxygenase-1. Investig. Opthalmology Vis. Sci. 2007, 48, 5699. [Google Scholar] [CrossRef] [PubMed]
- Li, H.; Liu, B.; Lian, L.; Zhou, J.; Xiang, S.; Zhai, Y.; Chen, Y.; Ma, X.; Wu, W.; Hou, L. High Dose Expression of Heme Oxigenase-1 Induces Retinal Degeneration through ER Stress-Related DDIT3. Mol. Neurodegener. 2021, 16, 16. [Google Scholar] [CrossRef] [PubMed]
- Chen, C. Induction of Ferroptosis by HO-1 Contributes to Retinal Degeneration in Mice with Defective Clearance of All- Trans -Retinal. Free Radic. Biol. Med. 2023. [Google Scholar] [CrossRef] [PubMed]
- Feng, H.; Schorpp, K.; Jin, J.; Yozwiak, C.E.; Hoffstrom, B.G.; Decker, A.M.; Rajbhandari, P.; Stokes, M.E.; Bender, H.G.; Csuka, J.M.; et al. Transferrin Receptor Is a Specific Ferroptosis Marker. Cell Rep. 2020, 30, 3411–3423.e7. [Google Scholar] [CrossRef]
- Tomita, H.; Kotake, Y.; Anderson, R.E. Mechanism of Protection from Light-Induced Retinal Degeneration by the Synthetic Antioxidant Phenyl- N-Tert -Butylnitrone. Investig. Opthalmology Vis. Sci. 2005, 46, 427. [Google Scholar] [CrossRef]
- Lu, L.; Oveson, B.C.; Jo, Y.; Lauer, T.W.; Usui, S.; Komeima, K.; Xie, B.; Campochiaro, P.A. Increased Expression of Glutathione Peroxidase 4 Strongly Protects Retina from Oxidative Damage. Antioxid. Redox Signal. 2009, 11, 715–724. [Google Scholar] [CrossRef] [PubMed]
Scheme 1.
Schematic representation of the protocol design. IP: intra-peritoneal; arrows indicate injection times.
Scheme 1.
Schematic representation of the protocol design. IP: intra-peritoneal; arrows indicate injection times.
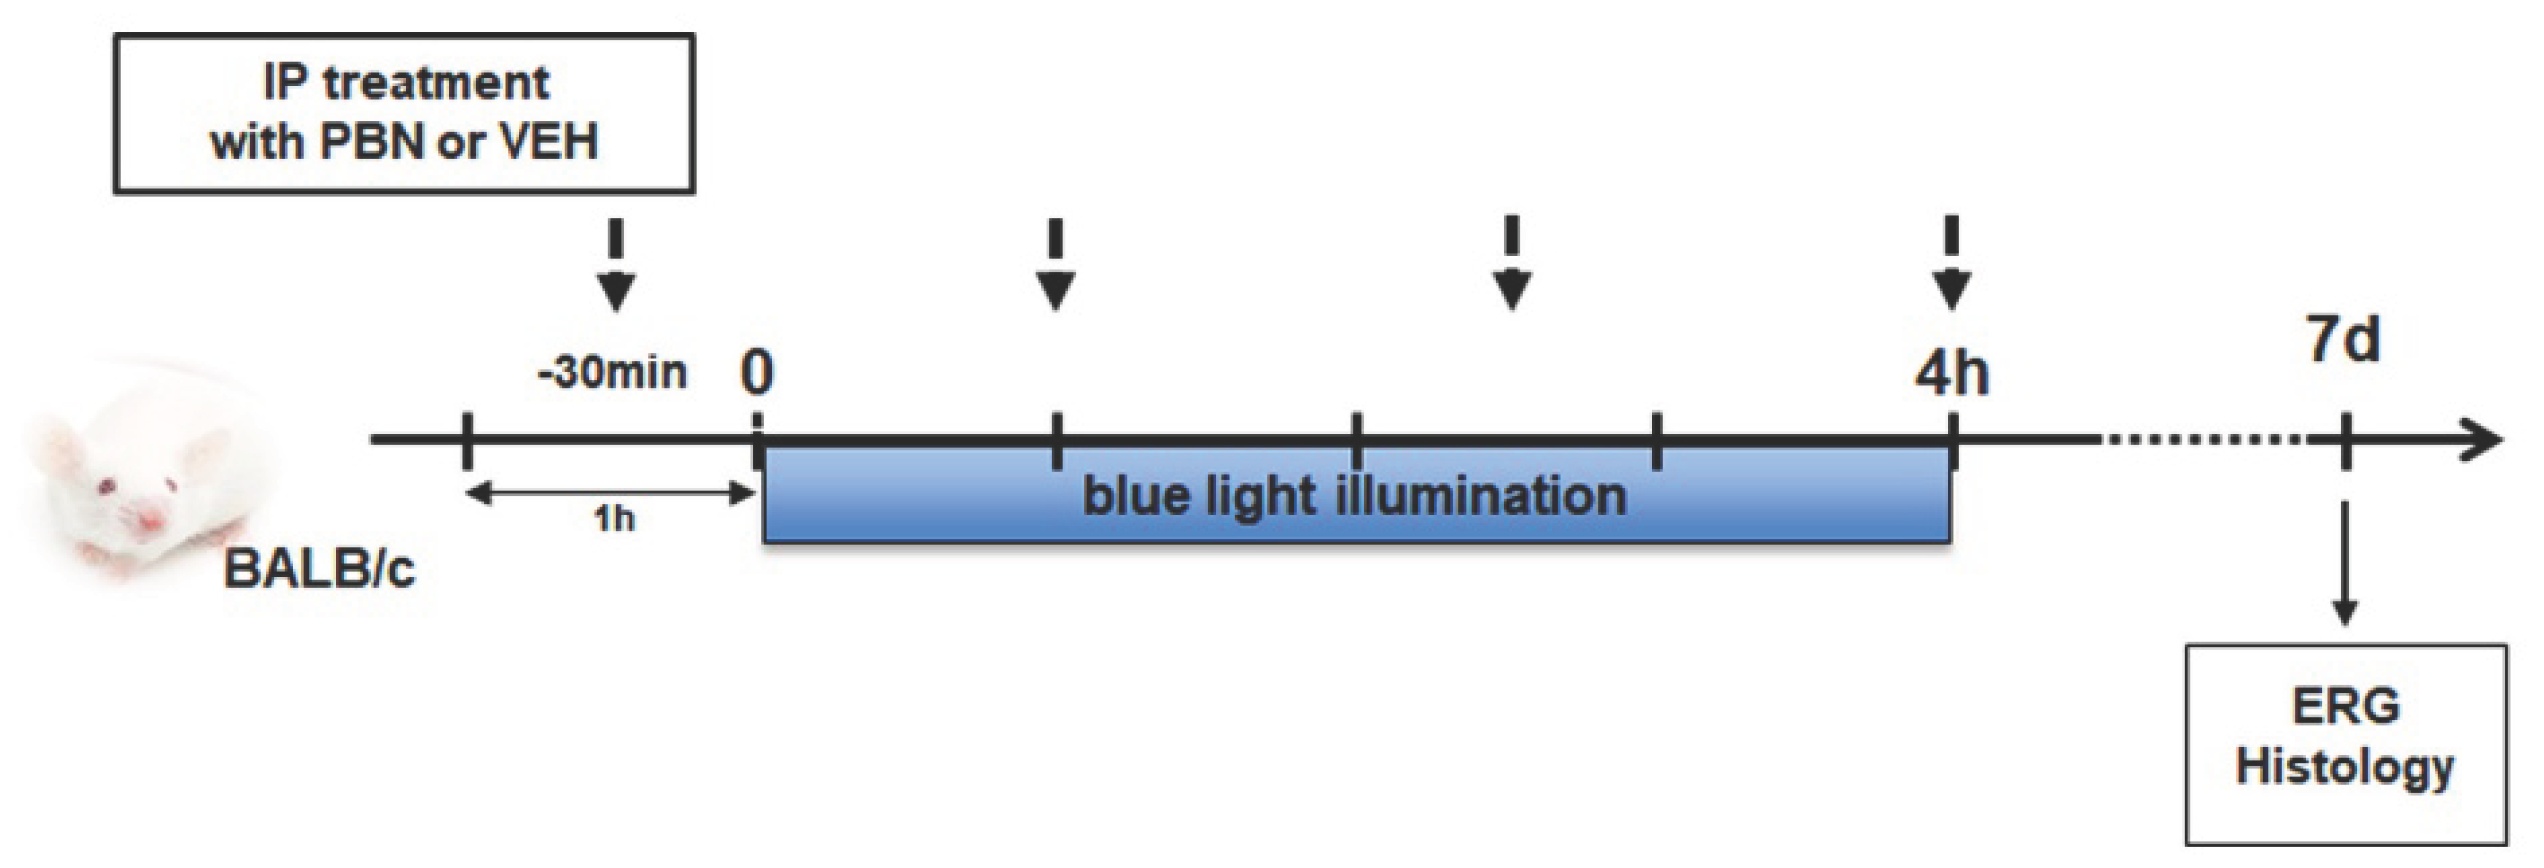
Figure 1.
Effect of PBN on retinal ERG 7 days after BL (a) scotopic A wave, (b) scotopic B wave, (c) photopic B wave. n = 8 mice per group. ## or **p<0.01, ### or ***p<0.001, #### or ****p<0.0001 compared to NINI or to VEH respectively (One-way ANOVA, Dunnett's post-test).
Figure 1.
Effect of PBN on retinal ERG 7 days after BL (a) scotopic A wave, (b) scotopic B wave, (c) photopic B wave. n = 8 mice per group. ## or **p<0.01, ### or ***p<0.001, #### or ****p<0.0001 compared to NINI or to VEH respectively (One-way ANOVA, Dunnett's post-test).
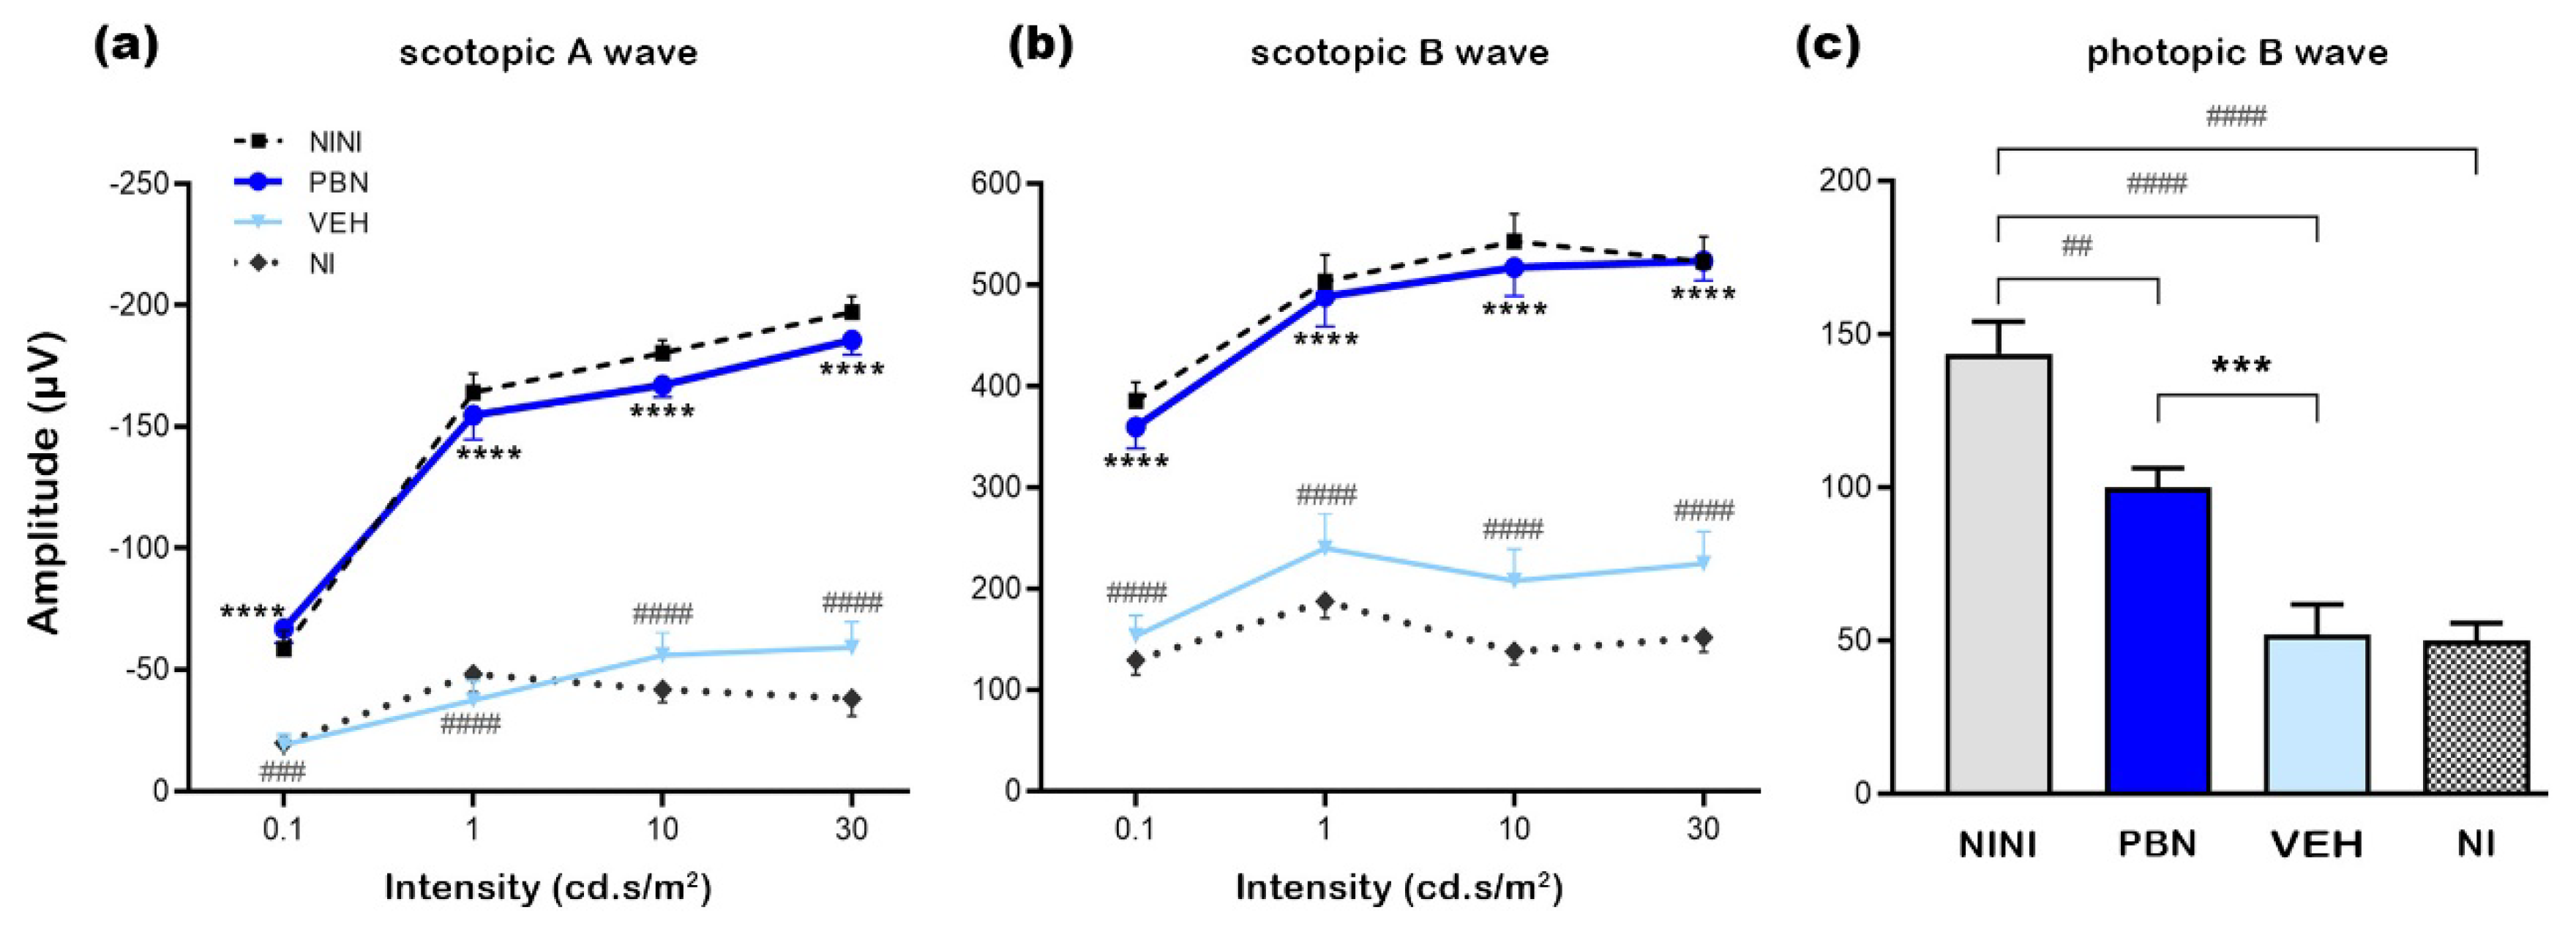
Figure 2.
(a) Representative cryosection pictures showing Hoechst 33342 staining of the retinal cell nuclei seven days after BL were taken 400µm from the optic nerve. (b) Graph showing the retinal thickness measured along the retina each 200μm from the optic nerve. (c) Histograms showing the area under the curve (AUC) calculated from the retinal thickness and used to perform statistical analyses. (d) Graph showing the INL layer thickness measured along the retina each 200μm from the optic nerve. (e) Histograms showing the area under the curve (AUC) calculated INL layer thickness quantification and used to perform statistical analyses. (f) Graph showing the number of nuclear photoreceptors counted along the retina each 200μm from the optic nerve. ON: optic nerve (g) Histograms showing the area under the curve (AUC) calculated from the photoreceptors nuclei quantification and used to perform statistical analyses. Bars represent mean ± s.e.m. with n = 5-6 per group. # or *p<0.05, ## or **p<0.01, ### or ***p<0.001, #### or ****p<0.0001 compared to NINI or to VEH respectively (One-way ANOVA, Dunnett's post-test).
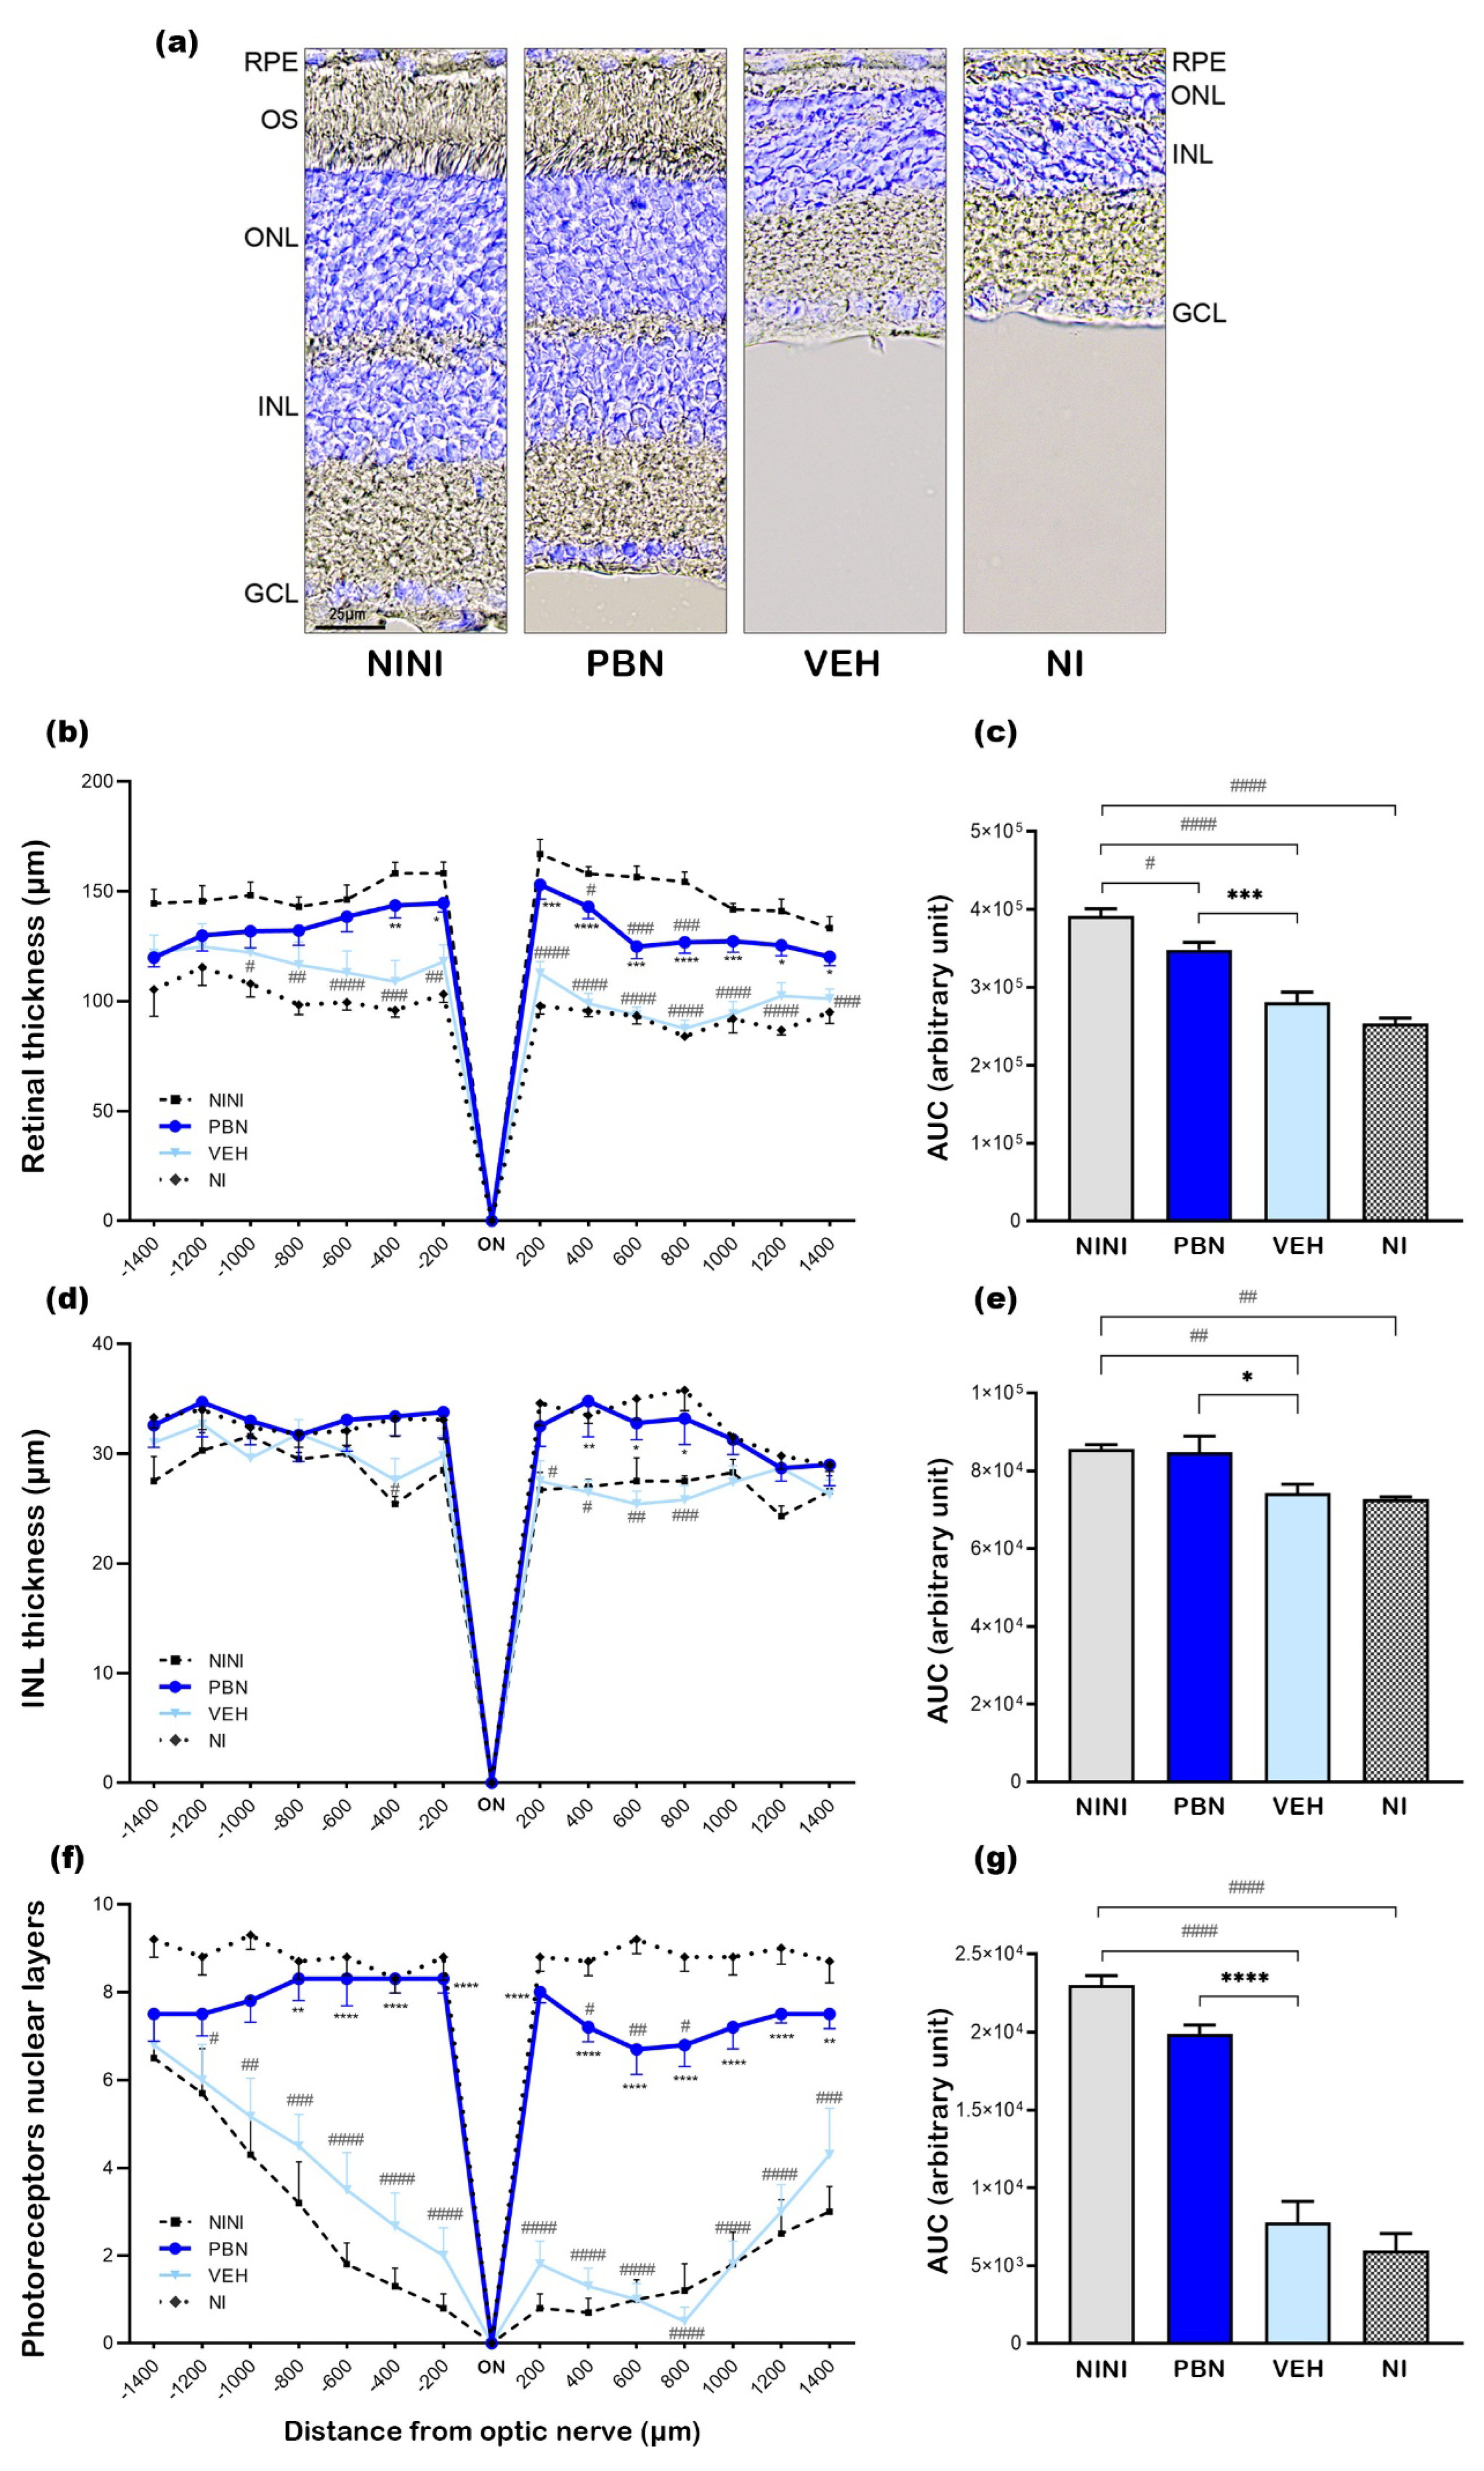
Figure 3.
Representative cryosection pictures showing retinal cell immunostaining and Hoechst nuclei labelling 7 days after BL. (a-h) RPE65 +/- Hoechst, (i-p) Rho4D2 +/- Hoechst, (p-x) GNAT2 +/- Hoechst, (y-f’) CalB +/- Hoechst, (g-n’) PKc α +/- Hoechst. Images were taken between 400 to 600µm from the optic nerve. Scale bar= 25µm. NINI: non-injected and non-illuminated mice. NI: non-injected and illuminated mice. VEH: vehicle. OS: outer segment; ONL: outer nuclear layer; OPL: outer plexiform layer; INL: inner nuclear layer; IPL: inner plexiform layer; GCL: ganglion cell layer.
Scheme 2.
Schematic representation of the protocol design. IP: intra-peritoneal, arrows indicate injection times.
Scheme 2.
Schematic representation of the protocol design. IP: intra-peritoneal, arrows indicate injection times.
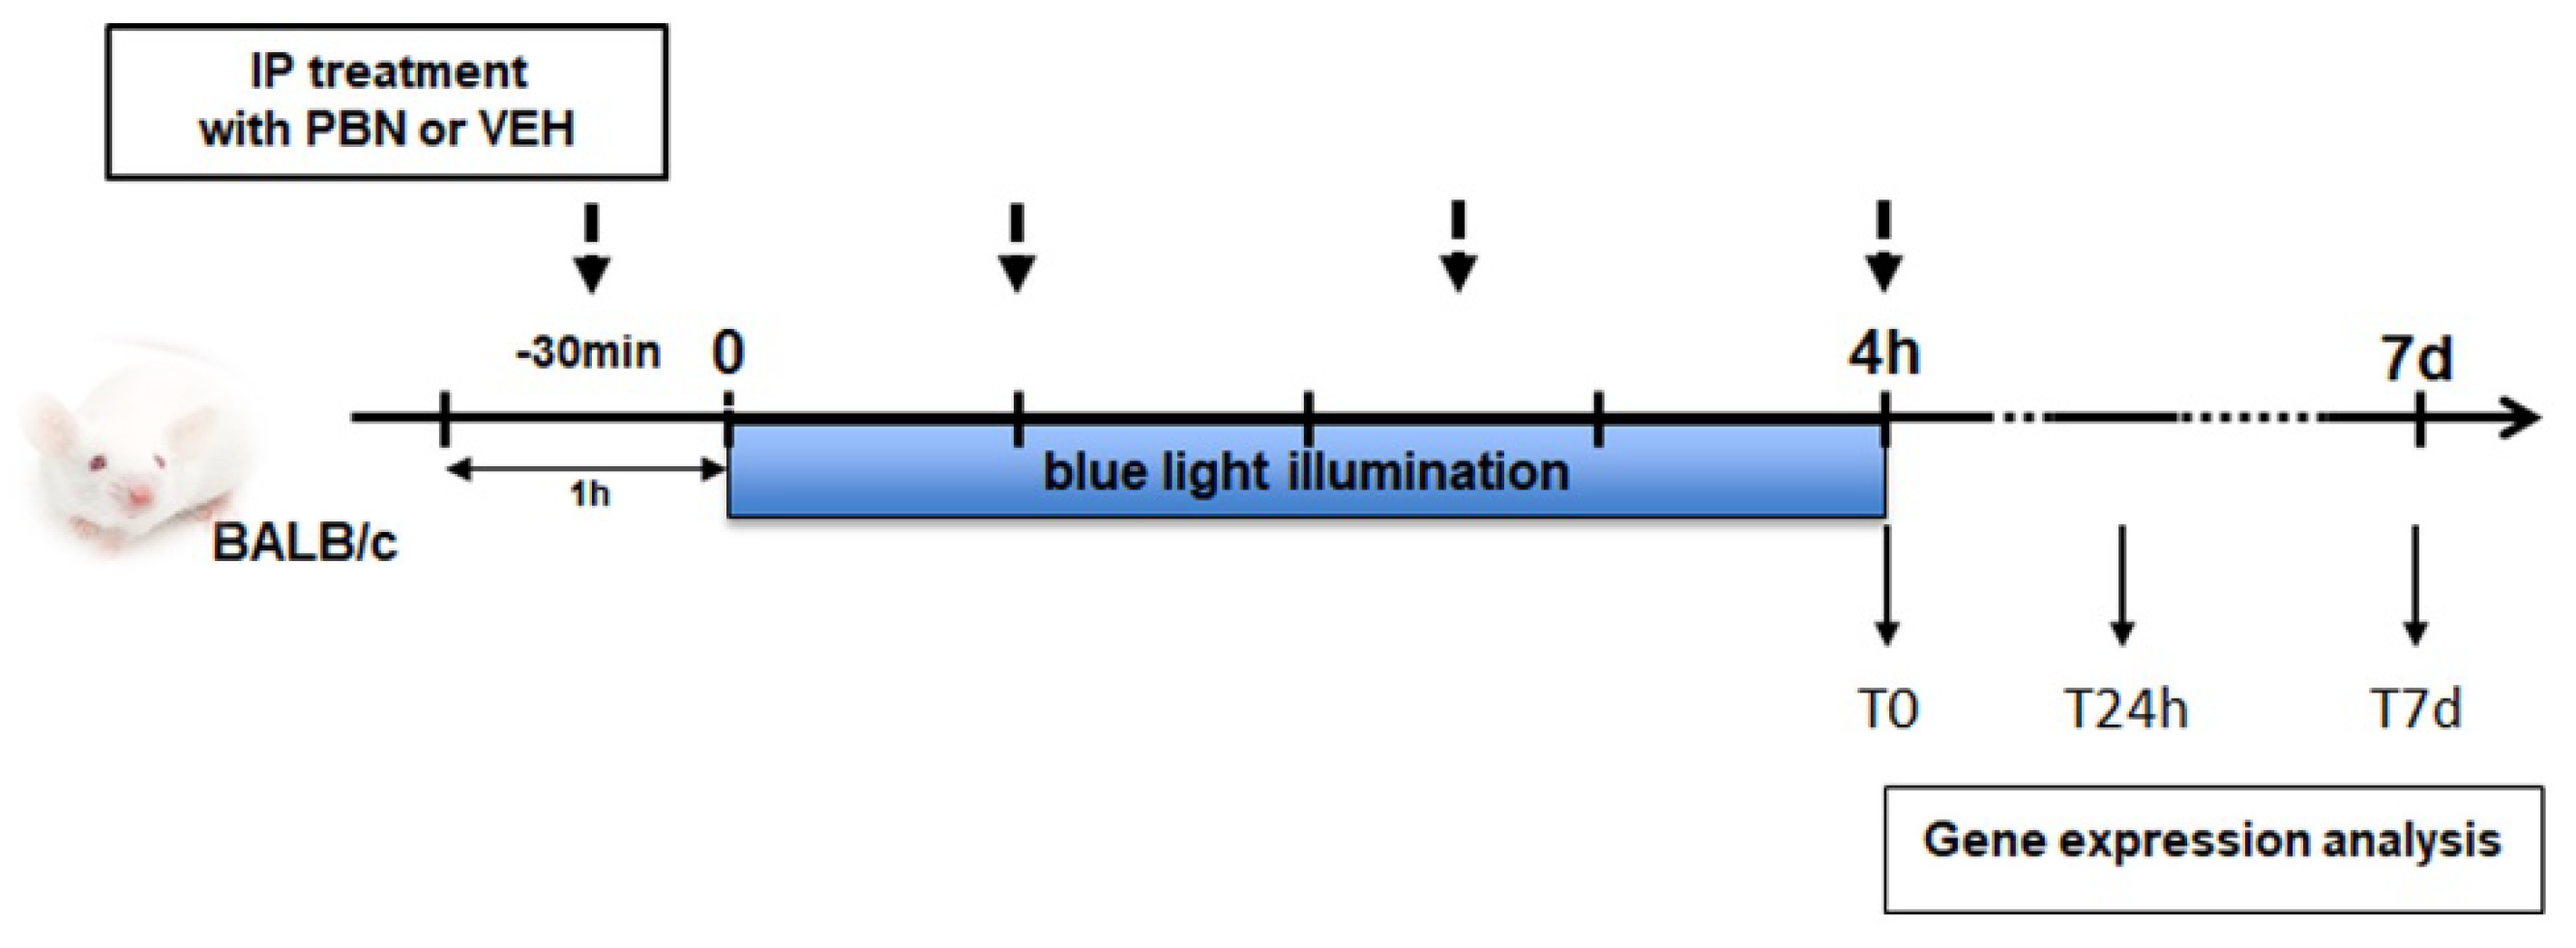
Figure 4.
mRNA relative expression levels compared to NINI (a) cJun, (b) Nrf2. NINI: non-injected and non-illuminated mice. VEH: vehicle. Bars represent mean ± s.e.m. with n = 3-4 per group. # or *p<0.05, ## or **p<0.01, #### or ****p<0.0001 compared to NINI or to VEH respectively (One-way ANOVA, Dunnett's post-test).
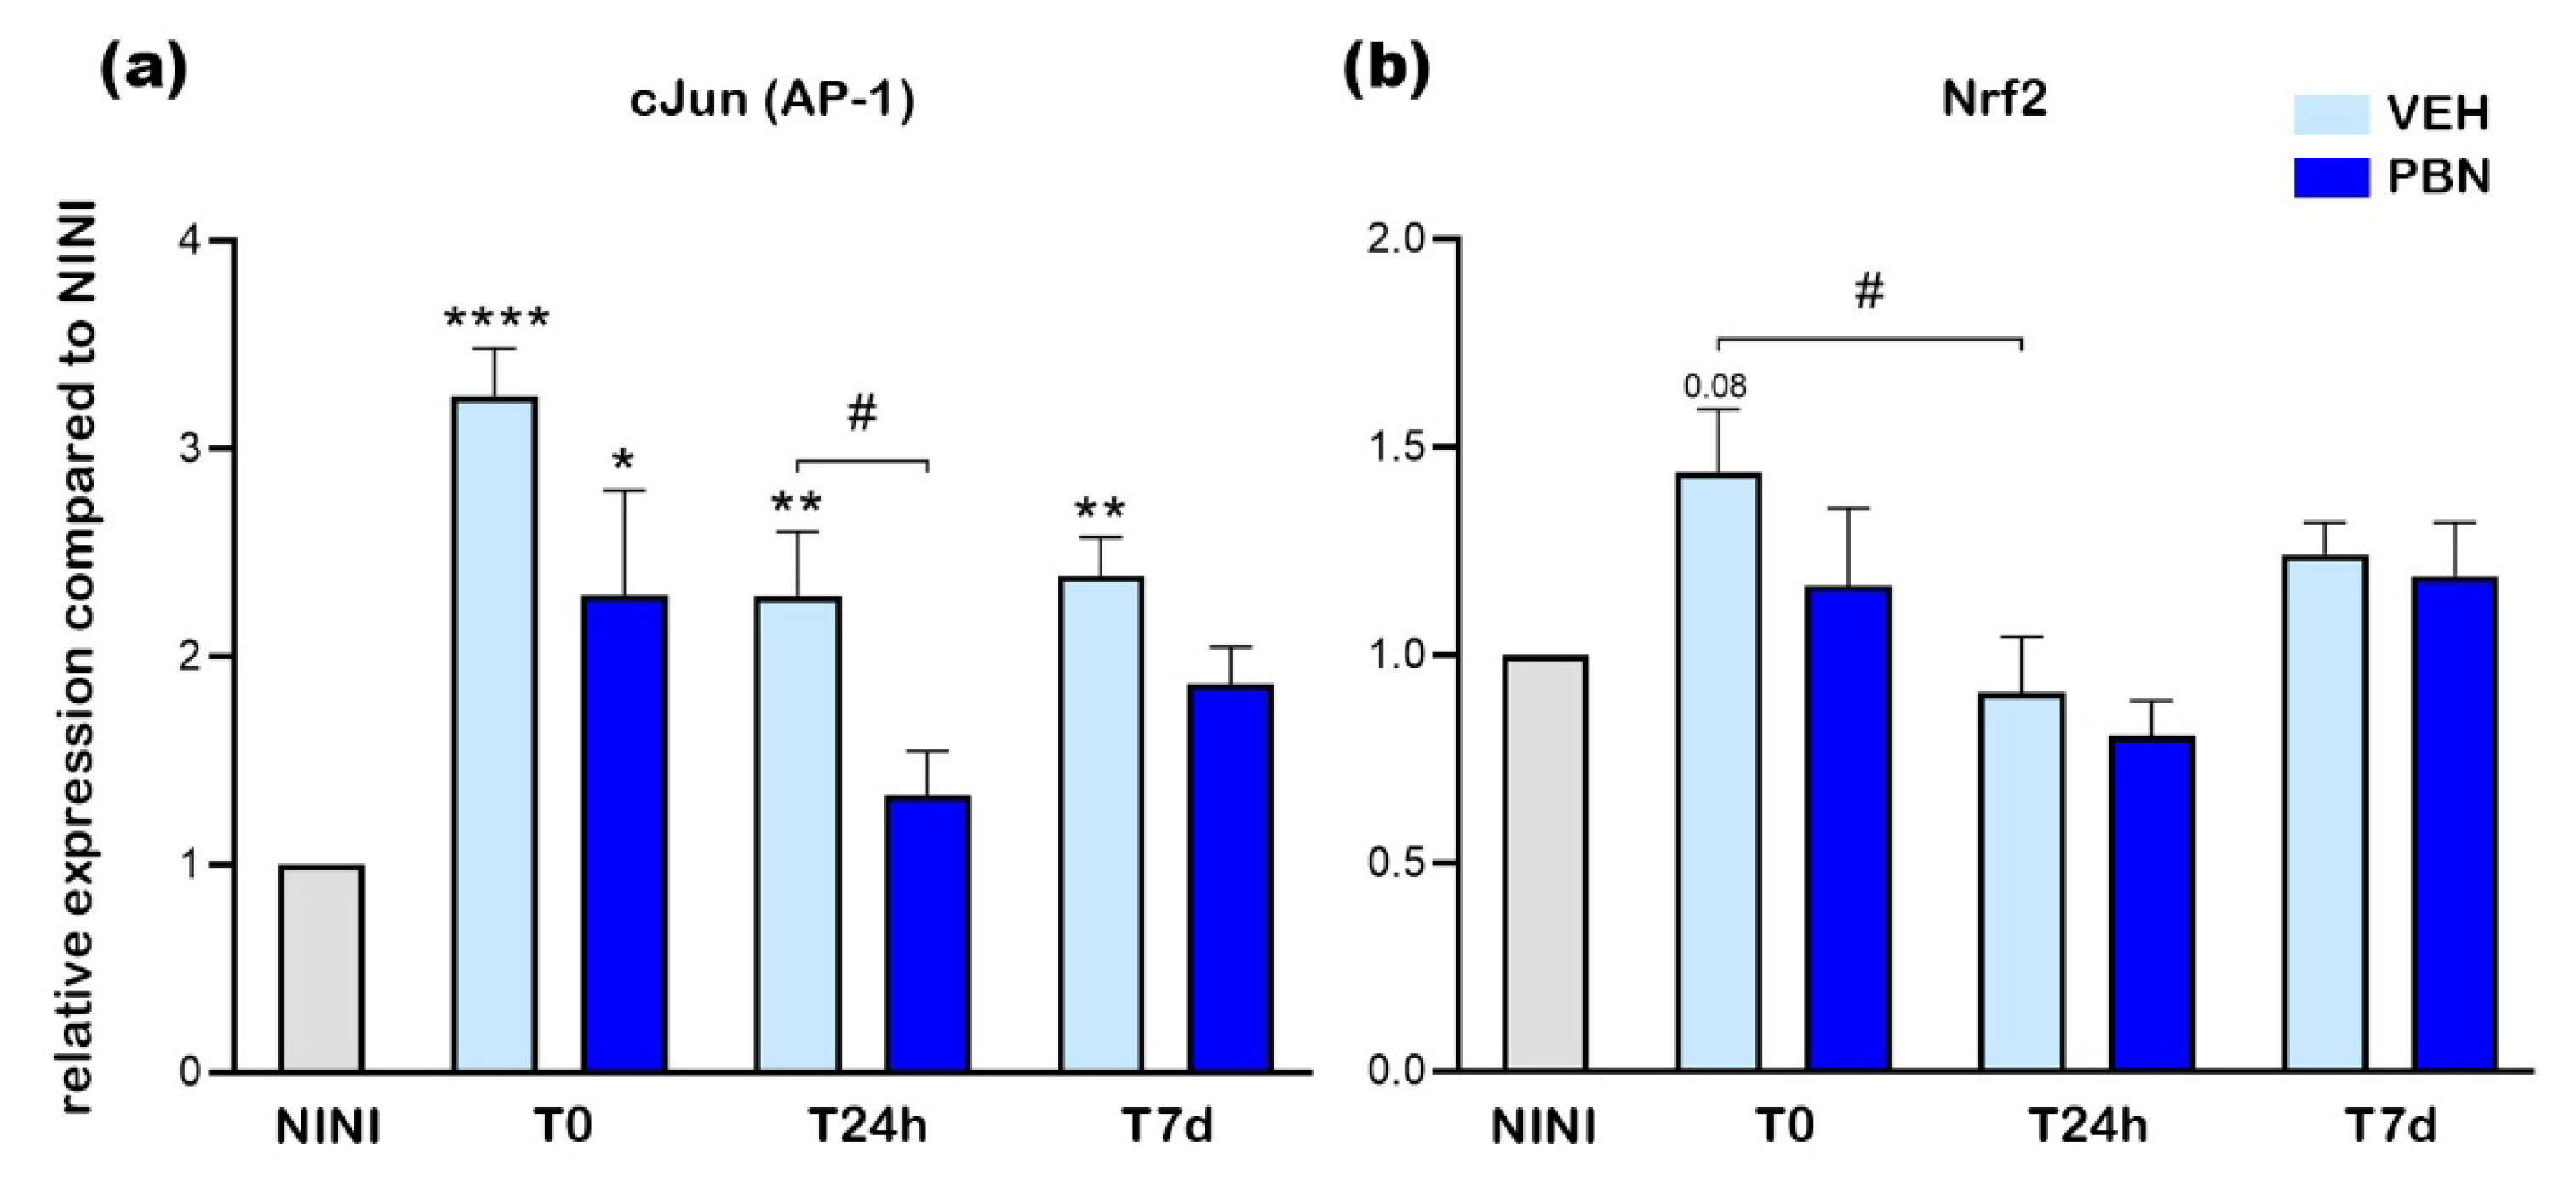
Figure 5.
mRNA relative expression levels compared to NINI (a) Bcl-2 (b) Bax (c) Casp3. NINI: non-injected and non-illuminated mice. VEH: vehicle. Bars represent mean ± s.e.m. with n = 3-4 per group. # or *p<0.05, ### or ***p<0.001, compared to VEH or NINI respectively (One-way ANOVA, Dunnett's post-test).
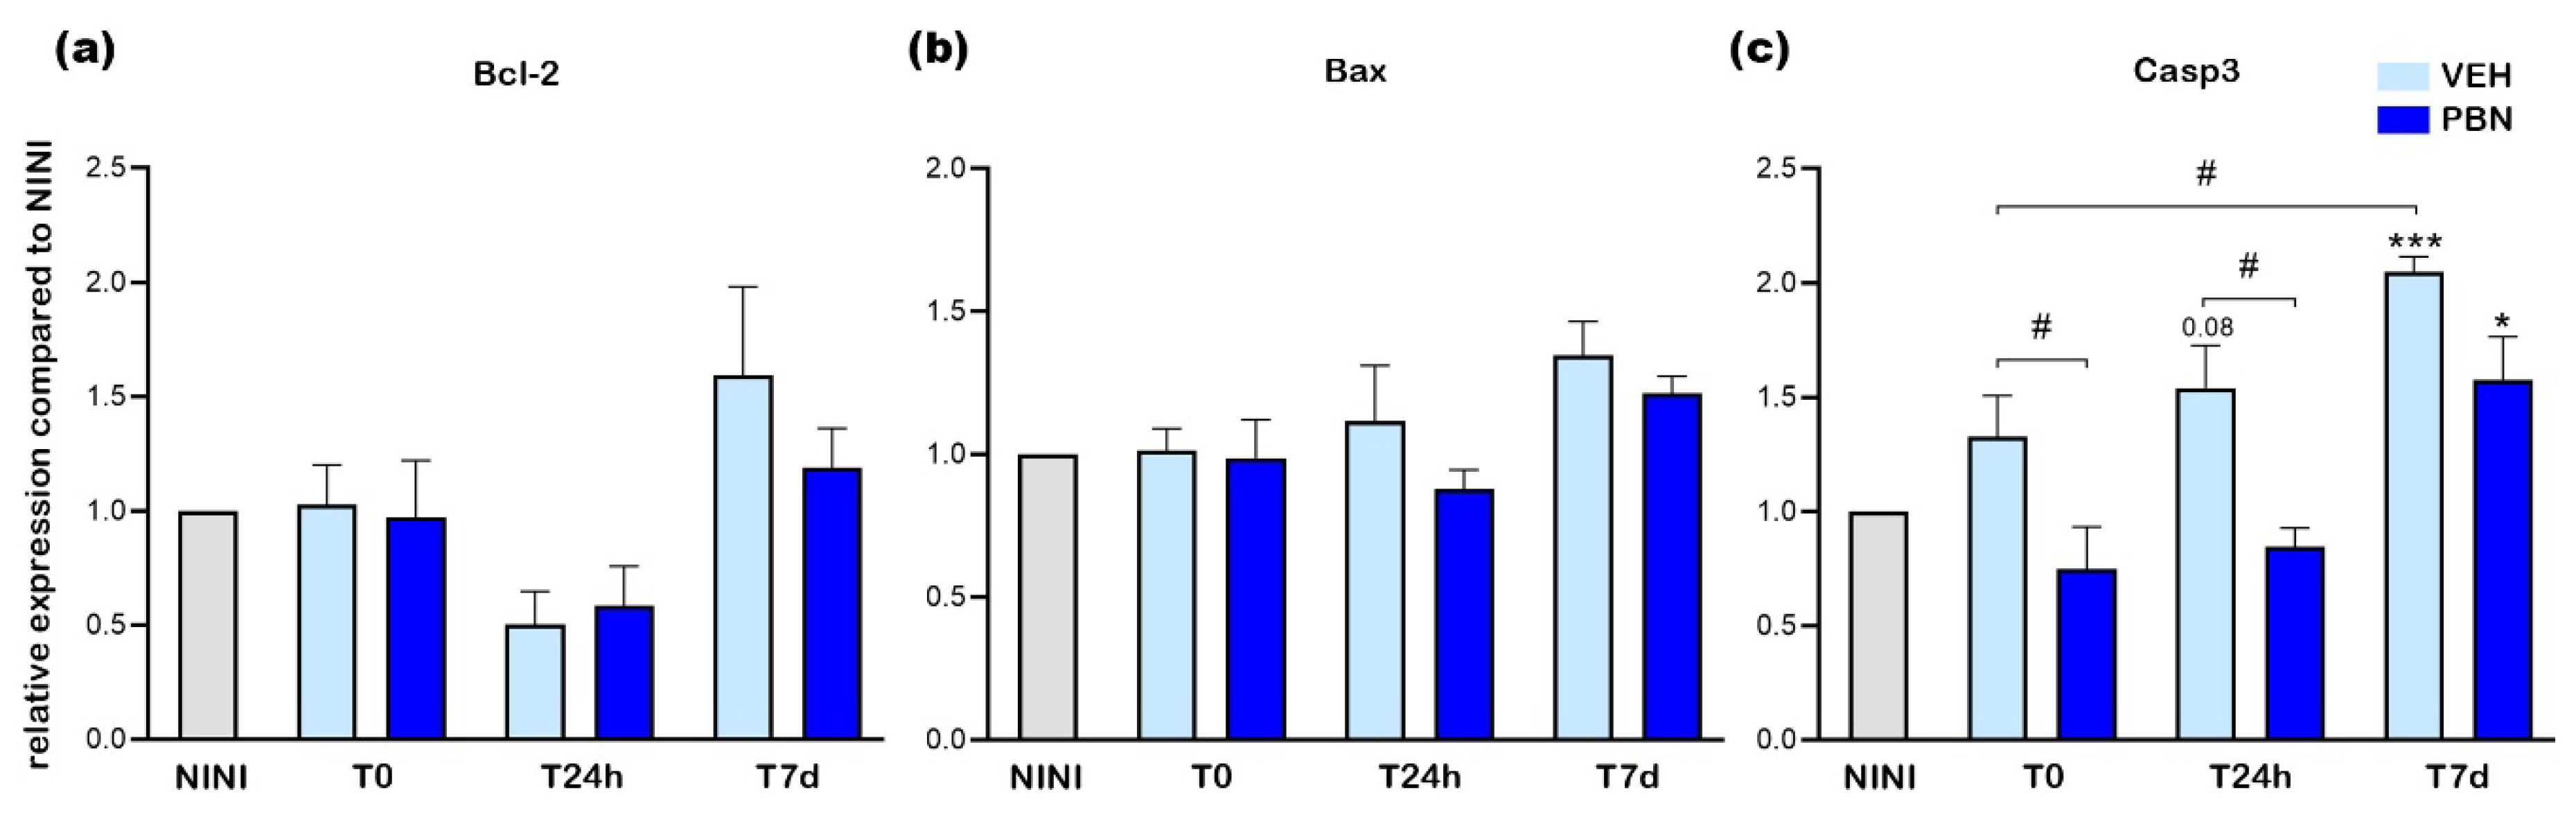
Figure 6.
mRNA relative expression levels compared to NINI (a) Hmox1 (b) Cat (c) Sod1 (d) Sod2. NINI: non-injected and non-illuminated mice. VEH: vehicle Bars represent mean ± s.e.m. with n = 3-4 per group. # or *p<0.05, ## or **p<0.01, ### or ***p<0.01, #### or ****p<0.0001 compared to VEH or NINI respectively (One-way ANOVA, Dunnett's post-test).
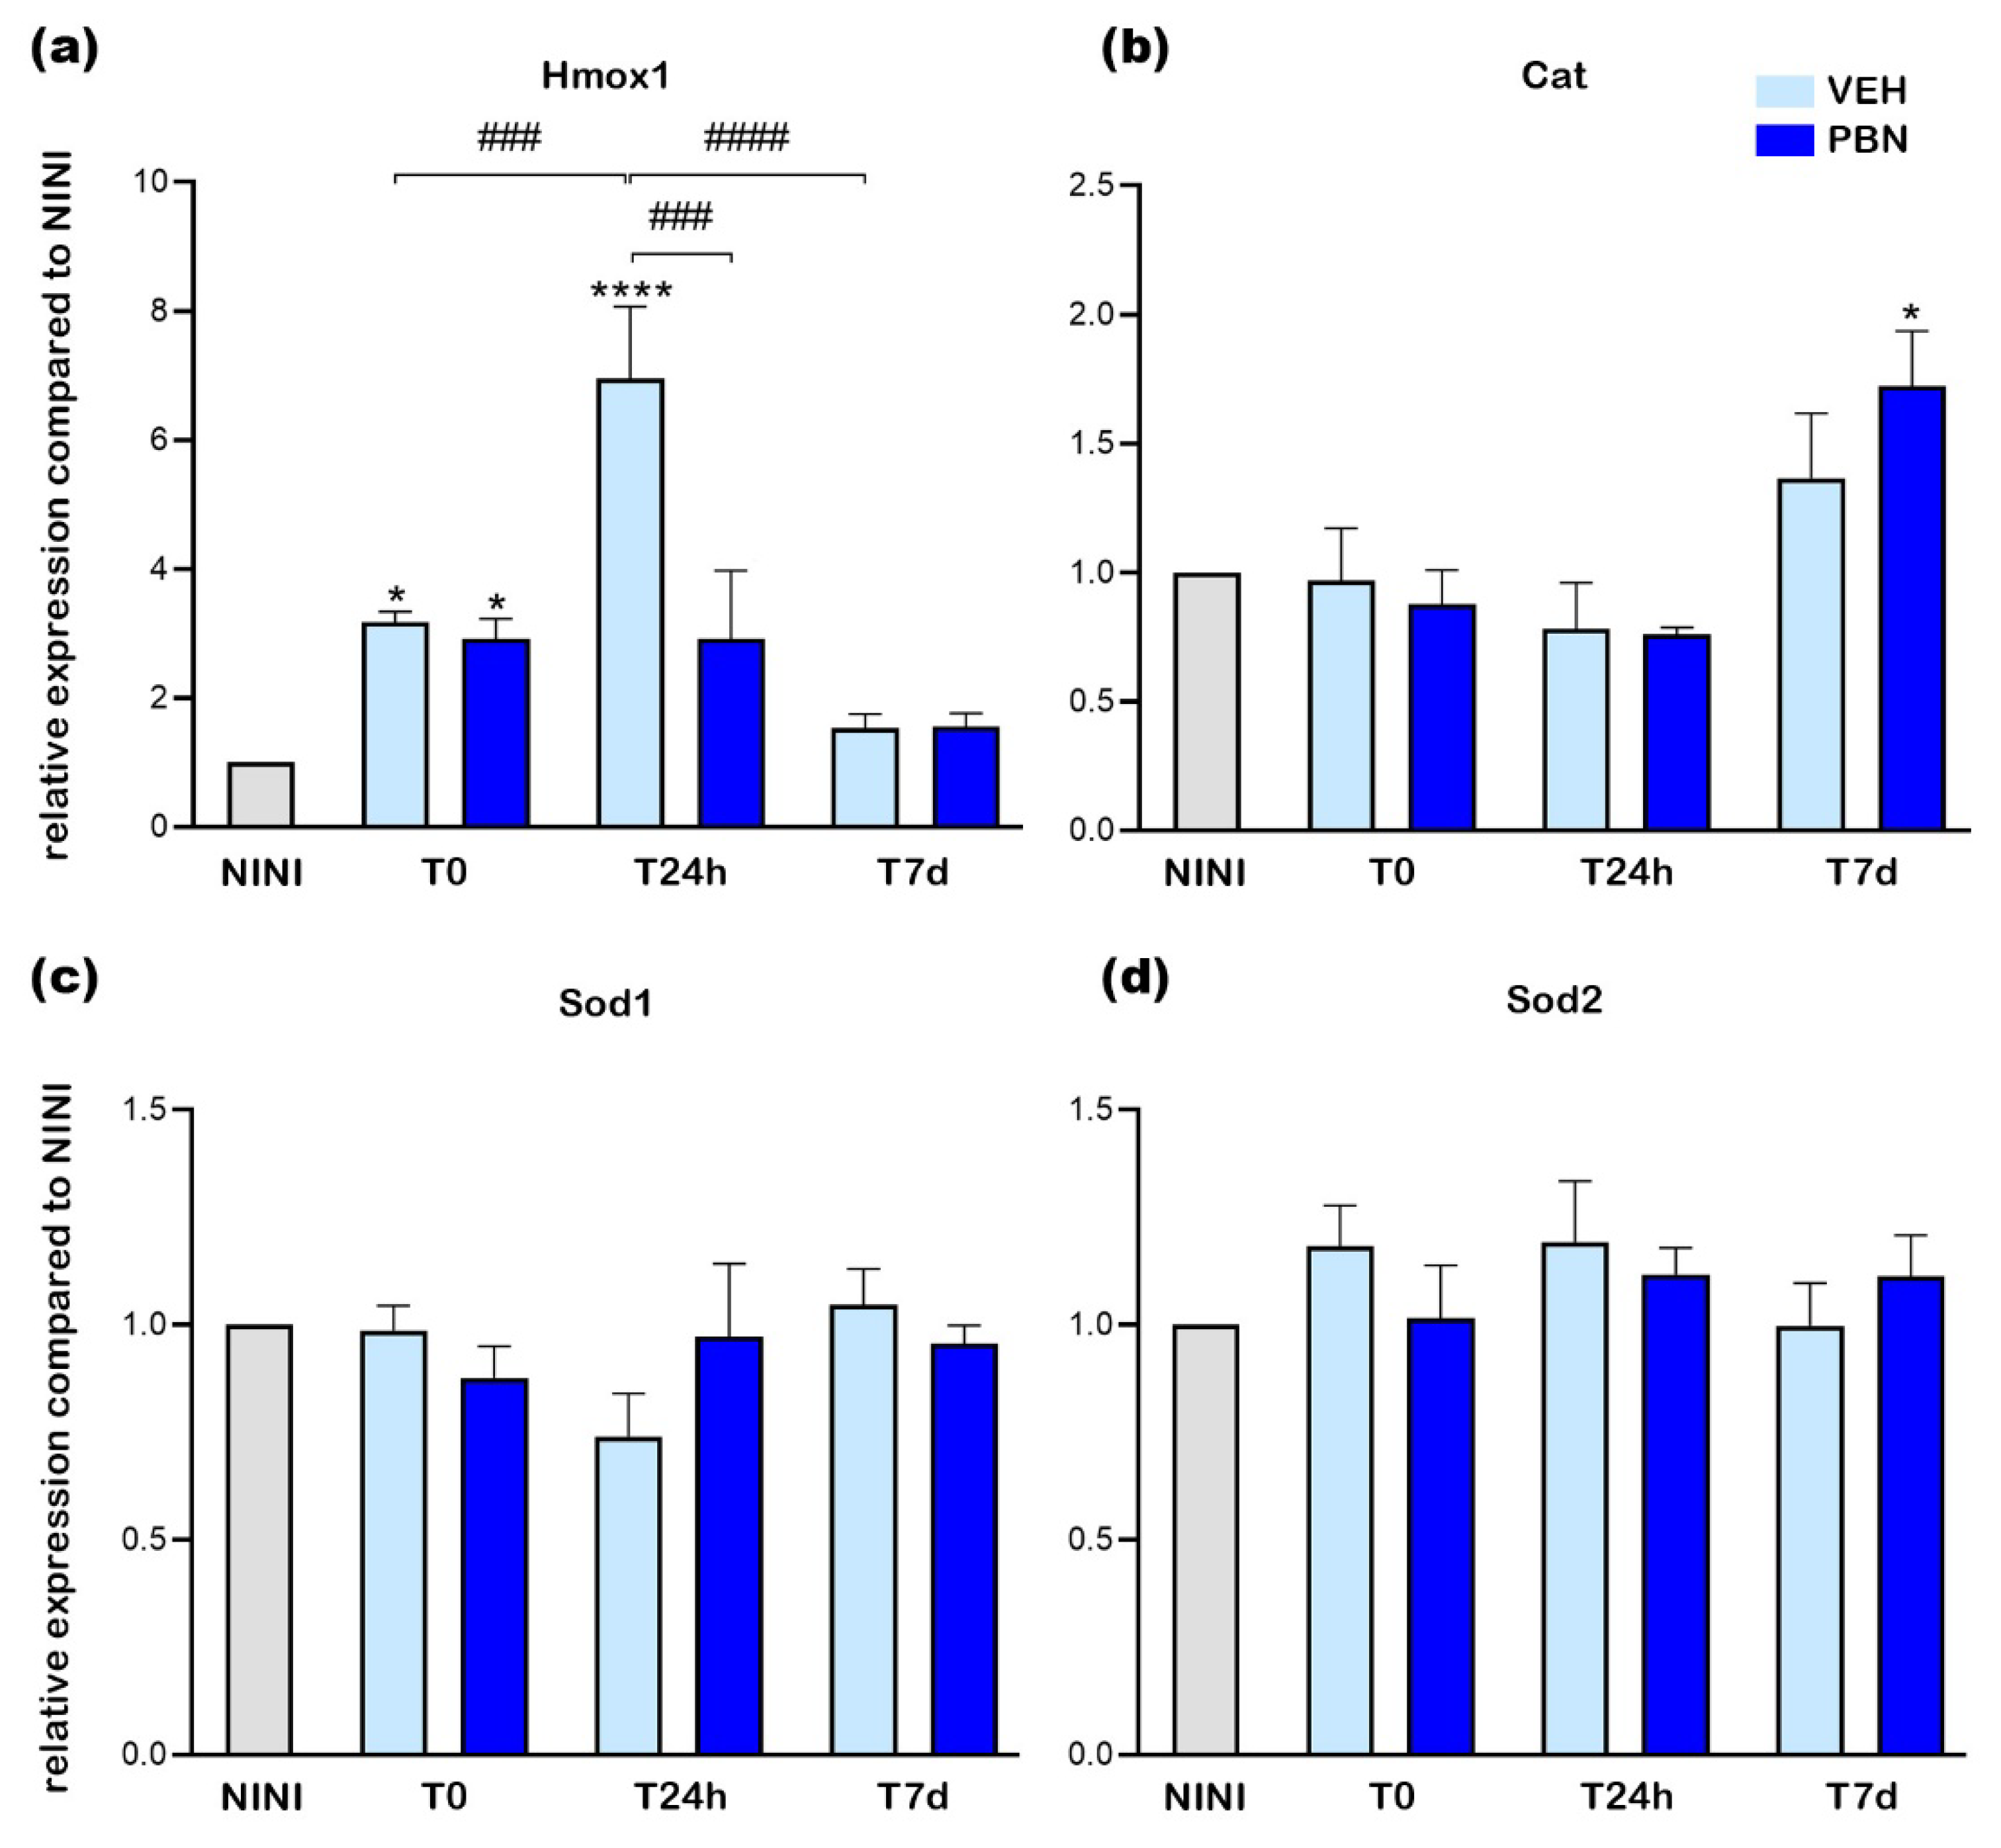
Figure 7.
mRNA relative expression levels compared to NINI (a) Gpx4 (b) Tfrc. NINI: non-injected and non-illuminated mice. VEH: vehicle. Bars represent mean ± s.e.m. with n = 3-4 per group. # or *p<0.05, ## or **p<0.01 compared to VEH or NINI respectively (One-way ANOVA, Dunnett's post-test).
Figure 7.
mRNA relative expression levels compared to NINI (a) Gpx4 (b) Tfrc. NINI: non-injected and non-illuminated mice. VEH: vehicle. Bars represent mean ± s.e.m. with n = 3-4 per group. # or *p<0.05, ## or **p<0.01 compared to VEH or NINI respectively (One-way ANOVA, Dunnett's post-test).
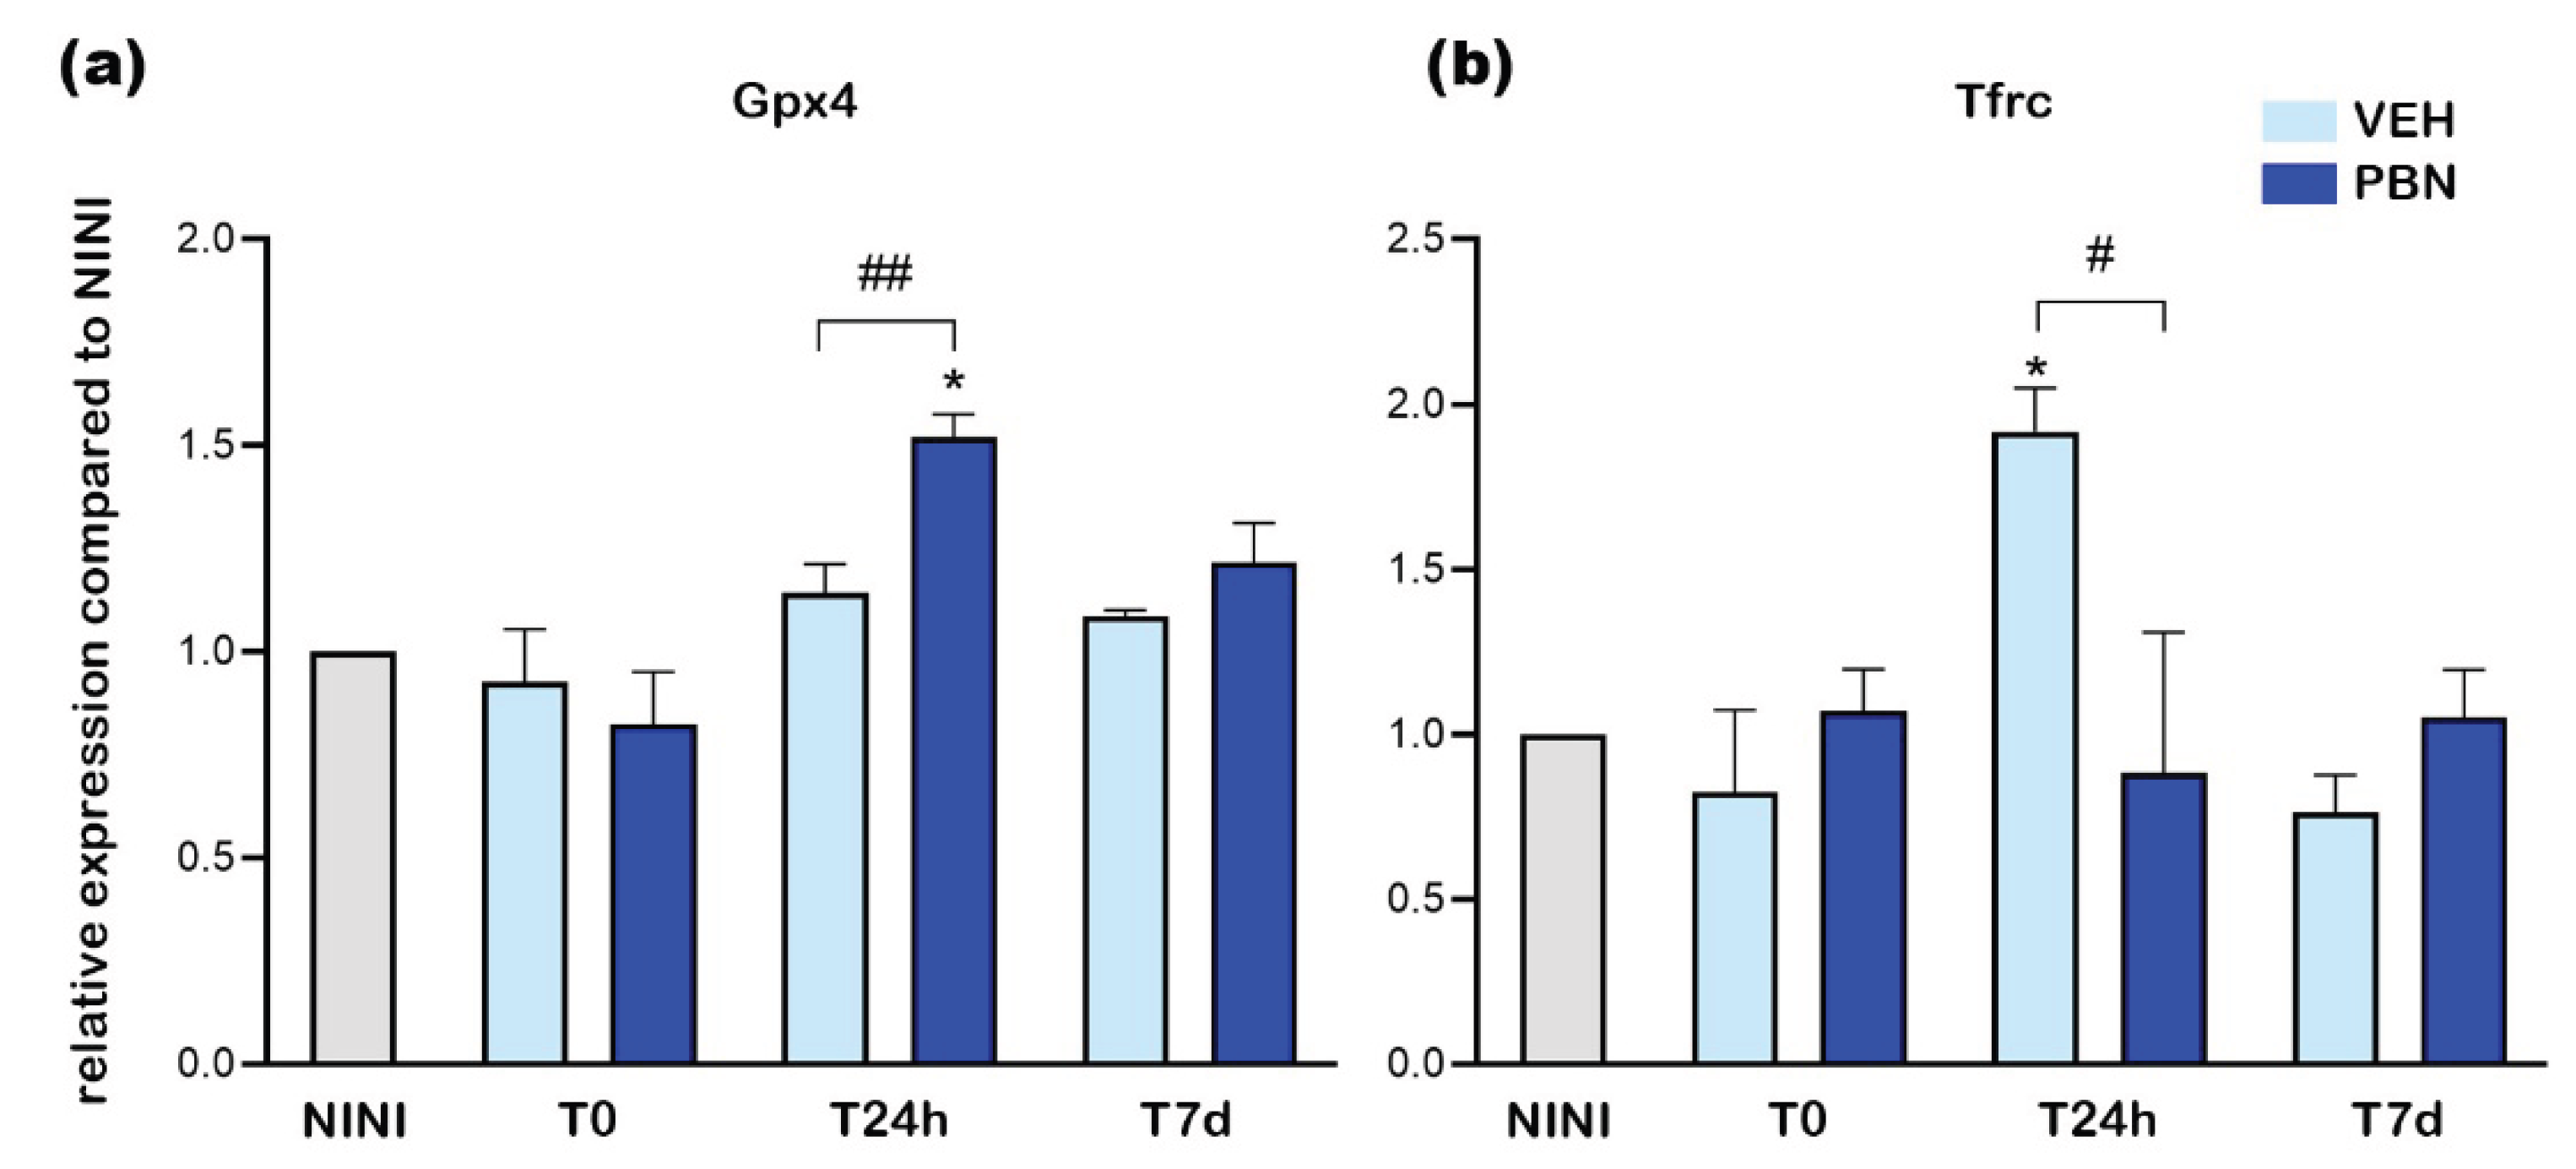

Table 1.
Primary antibodies used for immunohistochemistry.
| Antibody | Abbreviation | Reference | Species | Dilution |
|---|---|---|---|---|
| Retinal pigment epithelium-specific 65 kDa protein | RPE65 | ab231782 (abcam) | rabbit | 1/200 |
| Rhodopsin antibody clone 4D2 | Rho4D2 | MBN15 (Millipore) | mouse | 1/500 |
| Alpha transducing activity polypeptide 2 | GNAT2 | PA5-22340 (Invitrogen)) | rabbit | 1/100 |
| Protein kinase C alpha | PKc α | sc-208 (SantaCruz) | rabbit | 1/1000 |
| Calbindin D28K | CalB | VPA152 (ABcys) | rabbit | 1/1000 |
Table 2.
qPCR primer sequences list.
| Gene | Abbreviation | Forward 5’-3 | Reverse 5’-3’ | |
|---|---|---|---|---|
| cJun | cJun | CGGCTACAGTAACCCTAAGA | GATGTGCCCATTGCTGGACT | |
| Nuclear factor erythroid 2-related factor 2 | Nrf2 | CCGAGATATACGCAGGAGAG | CCGCCTTTTCAGTAGATGG | |
| B-cell lymphoma 2 | Bcl-2 | TCGCAGAGATGTCCAGTCAG | ACGCTCTCCACACACATGAC | |
| Bcl-2–associated X | Bax | GTCTTCTTCCGGGTGGCAG | GCCTTGAGCACCAGTTTGC | |
| Caspase-3 | Casp3 | CTGACTGGAAAGCCGAAACTC | CGACCCGTCCTTTGAAT | |
| Heme oxygenase 1 | Hmox1 | GTCAGGTGTCCAGAGAAGGC | AGGGAAGTAGAGTGGGGCAT | |
| Superoxide dismutase 1 | Sod1 | CGGCGGATGAAGAGAGG | CCACCTTTGCCCAAGTCATC | |
| Superoxide dismutase 2 | Sod2 | TGGTGGGGGACATATTAATCACA | AGTCACGCTTGATAGCCTCC | |
| Catalase | Cat | GTGCCCCCAACTATTACCC | TCTCACACAGGCGTTTCC | |
| Glutathione peroxidase 4 | Gpx4 | TCTGTGTAAATGGGGACGATG | CTCTATCACCTGGGGCTCCT | |
| Transferrin Receptor | Tfrc | GGCTGAAACGGAGGAGACA | CACGAGGAGTGTATGTATTCTGG | |
| Glyceraldehyde-3-phosphate dehydrogenase | GAPDH | TGTTCCTACCCCCAATGTGT | GGTCCTCAGTGTAGCCCAAG |
Disclaimer/Publisher’s Note: The statements, opinions and data contained in all publications are solely those of the individual author(s) and contributor(s) and not of MDPI and/or the editor(s). MDPI and/or the editor(s) disclaim responsibility for any injury to people or property resulting from any ideas, methods, instructions or products referred to in the content. |
© 2025 by the authors. Licensee MDPI, Basel, Switzerland. This article is an open access article distributed under the terms and conditions of the Creative Commons Attribution (CC BY) license (https://creativecommons.org/licenses/by/4.0/).
Copyright: This open access article is published under a Creative Commons CC BY 4.0 license, which permit the free download, distribution, and reuse, provided that the author and preprint are cited in any reuse.


