
Submitted:
18 November 2025
Posted:
19 November 2025
You are already at the latest version
Abstract
This study analyzes the operational efficiency of urban loading and unloading zones (LUZ) by applying queuing theory without waiting (Erlang B model) and incorporating weighted occupancy time as a fundamental metric. Six scenarios were evaluated in an urban block in Zaragoza, Spain: three using field data obtained through real-world observation and three simulated. The system's performance was compared under conditions of free access with a model that strictly enforces the municipal ordinance for Urban Goods Distribution, restricting access to authorized vehicles and maximum dwell times. The objective of this study is to demonstrate that zones that do not comply with the ordinance tend toward congestion, exhibiting high loss rates and prolonged occupancy, while applying access criteria frees up operational capacity and improves spatiotemporal productivity. The M/M/1/1 model in Kendall notation is suitable for representing this type of queuing-free urban environment, and weighted occupancy time proves to be a robust indicator for evaluating the performance of heterogeneous zones. The scenario assessment confirms that the sizing of these zones is correct if their proper use is guaranteed. The study concludes with recommendations and best practices for city governance in formulating urban policies aimed at more efficient and sustainable logistics to control land use in the LUZ.
Keywords:
loading and unloading zone
; illegal occupation
; exceeded time
; weighted occupation time
; municipal ordinance
; Urban Distribution of Goods
1. Introduction
Congestion in cities, resulting from the high volume of goods moving within them, has become particularly acute in recent years with the rise of e-commerce, Ma et al 2022[1]. This e-commerce brings products directly to our homes, replacing the traditional practice of consumers purchasing goods in stores or department stores. Loading and unloading areas are primarily located in designated zones during specific time slots, which are frequently saturated and only partially fulfill their purpose, unable to meet the full demand generated within their allotted time, Ezquerro et al. 2020[2].
The indiscriminate and uncontrolled use by unauthorized vehicles and the prolonged presence of authorized commercial vehicles generate operational collapses, externalities and an inefficient occupation of urban space, Alho et al 2014[3], since the unmet demand in one area seeks space in its adjacent areas and if it does not find it, it leads to an illegal occupation of public spaces, causing problems to the circulation of vehicles in the urban environment and annoyances to citizens, Alho et al 2017[4].
In defining illegal occupation, a distinction is made between occupation within the designated zone and occupation outside of it, Ghizzawi et al. 2024 [5]. LUZs have reserved operating hours, and within those hours, occupation is considered legal when it involves a commercial vehicle and the operation takes less than 30 minutes. If the LUZ is occupied by an unauthorized private vehicle or a commercial vehicle exceeding 30 minutes, it constitutes illegal occupation within the zone, Muriel et al 2022 [6]. If, due to the lack of space within the LUZ or by the carrier's intentional decision to park near the unloading point, the vehicle double-parks, blocks a garage door, crosswalks, traffic islands, or obstructs the sidewalk, then it constitutes illegal occupation outside the LUZ, causing negative externalities for other city users, Alho et al. 2022
For this article, direct observation fieldwork was conducted using real-world data on loading and unloading zone occupancy during May 2025 in five zones of the city of Zaragoza. May was chosen as a representative month, with full activity during the school year due to its impact on the city's mobility and the absence of holidays, and is therefore considered a time of coexistence between goods transporters and citizens under normal circumstances. A total of 1,582 unloadings of all types and with all types of vehicles were recorded in the five zones. Recording arrival and departure times, and therefore occupancy times, allows us to model, using queuing theory, the behavior of each zone and the zones as a whole, to measure their effectiveness and quantitatively simulate the observed situation compared to a scenario of strict compliance with the regulations defined by the municipal government., Alho et al 2018[7].
Attempting to reduce illegal occupation and consequently minimise these externalities is what motivates the authors to simulate dynamic scenarios that compare the actual situation observed with the illegal occupations observed in the data collection with the idealised situation of correct use of LUZ, Wilson et al. 2022[8].
Table 1 below shows the details of the illegal occupations observed during data collection.
This can be better observed in Figure 1, which shows the percentages in graphical form:
In general, analysis of vehicle occupancy distribution in different areas reveals that illegal occupancy is a significant concern in all loading and unloading areas analysed. Ezquerro et al 2020[2] already pointed out that in most areas, a considerable proportion of vehicles are parked illegally, either because they are unauthorised vehicles or because they exceed the permitted parking time. This indicates that loading and unloading areas are operating at or even above maximum capacity, leading to operational bottlenecks and inefficient use of urban space.
Excessive illegal parking time is another significant problem, as many vehicles remain parked for longer than the established 30 minutes, further aggravating congestion and reducing vehicle turnover. This behaviour highlights the need for stricter management of parking time, which could be optimised through technologies such as digital real-time entry and exit registration systems.
Gil Gallego et al (2025)[9] defined the OEE indicator as a measure of efficiency for an area or set of areas. This study reinforces the conclusions reached in that work, as it addresses the various factors that make up the OEE model to assess whether the measures proposed in the simulation using queueing theory improve logistics productivity.
Research on LUZs in urban environments highlights the use of queueing models, especially the Erlang B model, as a key tool for managing congestion. This model, which is used in loss systems where vehicles that cannot find space leave the area without waiting, has proven effective in representing congestion scenarios in LUZs. Comi et al 2017[10] highlight that, in this type of system, the model contemplates queues or waiting times, which leads to increased urban congestion, and that the insufficient number of delivery bays results in inefficient parking practices, such as the improper occupation of other public spaces, Comi et al 2022[11]. Similarly, Letnik et al 2020 [12] indicate that when a vehicle arrives and finds the area occupied, a queue is generated. If the estimated waiting time is too long, the vehicle chooses to leave the queue and look for another alternative, such as double parking or going to another available zone. Even Dalla Chiara et al. 2022 quantified the waiting time in a queue to perform the unloading operation in the city of Singapore at 5.7 minutes. However, the actual observation carried out in this study showed that almost all vehicles accessing the LUZ and finding it occupied sought an alternative location to carry out the operation, either another nearby area or an illegal occupation.
Therefore, although some studies insist that there is an explicit queue in LUZs, analysis of traffic flows and vehicle behaviour in real observation indicates that the system has a more complex dynamic, where vehicles recirculate. This behaviour highlights the need for more sophisticated models that integrate recirculation and other dynamic elements. In this regard, the present study has opted for the Erlang B model, as already indicated by Xiao et al. 2018 [14] which does not explicitly consider queues but, at the same time, recognises that vehicle flow patterns can be random and dynamic, justifying the inclusion of more complex models for future studies, Ochoa-Olan et al., 2021[15].
Municipal ordinances impose access restrictions exclusively on commercial vehicles carrying out loading and unloading tasks, as well as temporary restrictions during a specific limited time period, with a maximum stay of 30 minutes in general.
This study demonstrates that proper use, respecting the restrictions indicated in the municipal ordinance [16], is more relevant than the location of the LUZ itself. Therefore, the proposals for operational improvement are aimed at the management of the LUZ and not at its optimised location, as suggested by Les et al 2024[17], Sun et al 2023, [18], Jazemi et al 2023[19], Pinto et al 2019[20] or Jelen et al 2021 [21].
The article is organised as follows: Section 2 describes the six cases to be analyzed, as well as the selected areas, with their justified description. Section 3 analyses the results of applying the model in all its aspects and possibilities for analysis, and Section 4 interprets the results and makes recommendations for city governance. Finally, Section 5 presents the conclusions and possible future lines of research.
2. Materials and Methods
To carry out this study, six scenarios will be analysed: three under real conditions, as observed in the fieldwork, without restrictions, and three under a control model in which unauthorised private vehicles are not considered to occupy the LUZ and authorised commercial vehicles are considered to occupy the LUZ space for the actual time they have used it if it is less than 30 minutes, or a maximum of 30 minutes, which is the maximum authorised by the municipal government in Zaragoza [16], in cases where this is exceeded.
2.1. Queueing Theory Model with Weighted Occupancy Time
The M/M/1/1 (Erlang B) model with a single server and no waiting is used to model the system without a queue. This choice is based on the operational characteristics observed in a real environment. In the fieldwork, it was found that in no case did a vehicle wait for a space to unload. All of them sought an alternative solution if the chosen space was occupied. The loading and unloading areas do not support the formation of queues. When a vehicle arrives and the spaces are occupied, it does not wait, but is forced to leave the system and, either directly or after searching for an alternative area, double parks or illegally occupies public space, as reflected in the field study. This situation corresponds to a pure loss system, where rejected vehicles do not accumulate within the system but seek an alternative. The system assumes arrivals adjusted to Poisson distribution, exponential service times, a single server, and no possibility of waiting. This approach allows not only the probability of loss to be calculated, but also the potential productivity and efficiency of the system to be estimated under different usage and control scenarios..
The studies identified in the literature on queueing theory models use occupancy time and the number of loading and unloading bays within an area as service dispensers as variables. In line with the research outlined by Gil Gallego et al (2025)[9], this study will use weighted occupancy time with a single service point, as the variability in the sizes of delivery vehicles makes it impossible to unambiguously assign a specific number of exact spaces to a LUZ. The weighted occupancy time (tp) is the ratio of the length of the vehicle to the length of the area, multiplied by the effective time of use. Example: the same zone may be occupied by three delivery vans or by two 3.5-tonne or 7.5-tonne lorries. The use of weighted occupancy time as a temporal variable already takes into account the spatial occupancy within the zone, so we can consider it as a single service point for the application of the Erlag B model.
This is the feature that most distinguishes it from other studies of queue theories, as it considers a single queue attention point with the time indicator weighted to the length of time the vehicle occupies the area.
2.2. Characterisation of Selected LUZs
2.2.1. Study Area
The study was conducted in the city of Zaragoza (Spain), selected for its leadership in innovative mobility and sustainable logistics policies. The city is recognized for pioneering initiatives such as the implementation of an Urban Consolidation Centre (UCC)[22], the integration of personal mobility vehicles (PMVs)[23] for urban distribution, pilot projects with autonomous robots and buses[24], and its collaboration with the Spanish Directorate-General for Traffic (DGT)[25,26], which designated Zaragoza as a national test laboratory for intelligent mobility. Moreover, Zaragoza actively participates in national and European innovation projects such as URBANDUM [27]and DISCO, strengthening its position as a benchmark city for applied research on urban freight logistics efficiency.
According to the Sustainable Urban Mobility Plan (PMUS, 2018)[28], Zaragoza has 779 loading and unloading zones (LUZs)[29,30] with an average length of 19.4 m and an average reserved time of 7.7 h. The central district, characterized by an average length of 19.6 m and a daily operating window of 6.5 h, includes 108 LUZs, representing 13.86% of the city’s total, making it an appropriate and statistically representative environment for this study. The 2024 Urban Mobility Ordinance (Article 93) [31]limits the maximum time for loading and unloading operations to 30 minutes, establishing the regulatory context for the present analysis.
2.2.2. Zoning Description
The field study focused on five loading and unloading zones (LUZs) located in the central area, selected for their representativeness of different street configurations and operational contexts.
Zone 1 (Arzobispo Doménech Street):
One-way street with free parking, total width 9.2 m, and 5.3 m between parked vehicles, allowing for temporary double parking. Opposite the LUZ, there is a dark store serving PMV couriers (e.g., Glovo), which generates high delivery demand. The zone’s total operational length is 13 m, accommodating up to three vans or trucks, with authorized loading periods from 9:00–12:00 and 14:00–17:00 h.
Zones 3, 4, and 5 (Perpetuo Socorro Street):
One-way corridor with parking on both sides and no allowance for double parking, totaling 165 m of parking length. The three LUZs measure 18 m, 10 m, and 8 m, respectively, with time slots between 7:00 and 17:00 h. Field observations revealed frequent illegal stops in front of garage entrances, pedestrian crossings, and intersections, highlighting the competition between legal and illegal users.
Table 2 below shows the characteristics of the streets where the LUZs under study are located.
Zone 2 (wide avenue with six lanes and a cycle path) was excluded, as its location and user behavior did not interact with the circulation loop connecting the other zones.
The selected areas form a closed loop of interconnected streets, Arzobispo Doménech, Goya Avenue, Perpetuo Socorro, and Moncasi, allowing vehicles to circle the block in search of available space, which is essential for modeling reattempts and externalities due to unserved arrivals, as it can be seen in the Figure 2 where green lines correspond to the areas under study and the red line to the excluded area. Blue arrows indicate the direction of traffic flow.
2.2.3. Commercial Activity and Representativeness
Within this cluster, 43 commercial establishments were identified as receivers and/or senders of goods:
8 food retailers, 18 general merchandise stores, 1 supermarket, 10 horeca establishments, 2 pharmacies, 1 dark store, and 3 car repair shops. This business mix mirrors the urban commercial fabric and ensures that the demand patterns observed are representative of medium-density central districts in Spanish cities.
2.2.4. Data Collection
The study was carried out through direct observation over the entire month of May 2025, recording all entries and exits from the selected LUZs. This empirical approach complements numerical modeling, following the recommendation of Ochoa-Olan et al., who advocate for combining mathematical methods with observational evidence to obtain realistic assessments of logistics space utilization.
2.2.5. Experimental Scenarios
Six experimental configurations were analyzed:
Scenario 1: Z1 (Arzobispo Doménech Street), real data collected
Scenario 2: Z1 (Arzobispo Doménech St.), idealized use compliant with regulations
Scenario 3: Z3 + Z4 + Z5 (Perpetuo Socorro Street), real data collected
Scenario 4: Z3 + Z4 + Z5 (Perp. Socorro St.), idealized use compliant with regulations
Scenario 5: Z1 + Z3 + Z4 + Z5 (entire block), real data collected
Scenario 6: Z1 + Z3 + Z4 + Z5 (entire block), idealized use compliant with regulations
The daily operating time was set at 6 hours for zones Z1, Z4, and Z5, and 8 hours for Z3 due to its greater length (18 m, equivalent to the sum of Z4 and Z5). When the zones were aggregated, the equivalent available time was normalized to 6.7 hours/day, proportional to the total active length. This harmonization allows the estimation of arrival rates (λ), service rates (μ), and system utilization (ρ) in a comparable manner across all scenarios.
2.2.6. Analytical Framework
Each scenario was modeled as a queueing system using the M/M/1/1 model, where arrivals follow a Poisson distribution, service times are exponentially distributed, and the number of service channels is only one, for the reason explained above. The system assumes no waiting queue—vehicles unable to find space immediately must leave and reattempt later—making it suitable for evaluating urban loading bays with limited capacity.
Subsequently, the probability of loss (pB), system utilization (ρ), and number of vehicles effectively served were compared against empirical observations. This allowed quantifying the externality generated by unserved vehicles, which in subsequent sections was associated with additional fuel consumption and CO₂ emissions.
3. Results
This section will analyse and develop the models for the six scenarios and compare them with each other..
3.1. Scenario 1: Z1 All Vehicles According to Actual Observation
In this first analysis, all the steps will be detailed, but they will be omitted in the remaining five cases as they all use the same methodology.
Z1 is the only LUZ in the street in which it is located. The rate of vehicles arriving at the system attempting to unload in Z1 is 474 throughout the month, over the 21 days and 6 hours per day of reservation. A total of 273 vehicles were able to find a space in the zone, including private vehicles illegally occupying the zone. The weighted occupancy time of these 273 vehicles in Z1 was 20.94 minutes.
The effective arrival rate to the system is:
Each unloading operation lasts an average of 20.94 minutes, meaning that:
hours/vehicle
Therefore, the service rate in the area is:
Therefore, the intensity of traffic,
Since ρ>1, the system is saturated, it is not viable without a queue and therefore losses occur, resulting in double queues and illegal occupations. In the Erlang B model with c=1, i.e. a single server with the weighted time of occupation of the entire area as the time variable, this ρ, which is the traffic intensity, will be referred to as intensity in Erlangs.
Let us now consider the probability of loss or blockage in the area. The general formula for the Erlang B model is:
In our case, as there is only one service position, c=1, it is as follows:
The interpretation of this result is that 56.76% of vehicles arriving at the LUZ do so when it is already occupied and therefore cannot be served. This value is independent of the actual number of vehicles observed and is based solely on the balance between the arrival rate and the service rate. If we compare the number of vehicles not served in the actual observation (474-273=201), we see that this is a rate of 42.4% compared to the model's rate of 56.76% (0.5676 x 474=269 vehicles). The Erlang B model may overestimate the results as it is an idealised probabilistic model that assumes perfect randomness in arrivals and services (Poisson and exponential), when in reality vehicles arrive without a fixed pattern of arrival sequence. The model assumes that arrivals, according to the Poisson distribution, are constant, which is not the case, and that occupancy times follow an exponential distribution, in which, despite assuming randomness, the probability of a vehicle finishing unloading at a specific time t decreases exponentially as time increases, i.e., vehicles tend to be served faster on average, but the exact time for each vehicle to unload may vary, so this blocking probability for the Erlang B model does not provide us with reliable data, and we will now refer to the actual data collected in the field observation. Another reason why the blocking probability of this model loses validity is that using weighted occupancy time as a time variable leads the system to believe that, with only a single service point and a single occupancy, the system would be full, when there may be spaces available.
In terms of usage times for the area, compared to the total weighted available time of 7,560 minutes, the weighted usage time for the area was:
273 veh x 20,94 min/veh = 5.716,62 minutes, 75.62% time occupancy
The partial conclusions of this first case are that traffic intensity exceeds the system's capacity threshold (ρ>1), indicating that the system is at maximum capacity, generating high losses (42.4% in actual observation). The system is not viable without proper application of use, as disorderly use causes congestion, illegal occupation, and loss of logistical efficiency.
3.2. Scenario 2: Z1 Without Access to LUZ from Unauthorised Private Vehicles and Considering a Maximum Time of 30 Minutes per Authorised Vehicle Unloading. Idealized Use Compliant with Regulations
This simulated case presents an ideal situation in which both access control for authorised vehicles and the time of use of the area are guaranteed. The data characterising this scenario are as follows:
Vehicles entering the system (excluding private vehicles): 381 vehicles/month
Vehicles served applying restrictions in LUZ: 182 vehicles/month
Weighted occupancy time (maximum 30 minutes per unloading): 9.65 minutes
Weighted available time: 21 days, daily 6 hours, 13 minutes (Z1): 7,560 minutes
Weighted time occupied in LUZ: daily 6 hours, 13 minutes: 1,756.30 minutes
% of weighted time occupied: 23.23%
Weighted free time in the zone: 3,960.32 minutes
Using this data and following the same methodology as in the first case, the following results are obtained:
λ = 3.02 vehicles/hour
μ = 6.22 vehicles/hour
ρ = 0.49 Erlangs, Viable system as ρ<1. There is no risk of collapse or saturation, as the system capacity exceeds the vehicle arrival rate.
In this idealised case of no entry into the LUZ by unauthorised private vehicles and no excess time spent in the zone by commercial vehicles, a weighted amount of occupancy time is freed up, which could be offset by a greater number of authorised vehicle occupations.
The weighted occupancy time freed up is then calculated:
Tliberated = Tunrestricted occupation – Toccupied with constraints
In the comparative case of the Z1:
T liberated = (273 x 20,94= 5.716,62) – (182 x 9,65= 1.756,30) = 3.960,32
Next, the weighted occupancy time per vehicle is calculated to obtain a standard weighted time for what would be a generic vehicle.
where:
ti: time weighted by vehicle type
pi: percentage of that type out of the total number of authorised vehicles
In accordance with Table 3 below:
Therefore, the formula for new vehicles that could be serviced at LUZ would be:
NAdditional vehicles== 423,63 additional vehicles
In Z1, by correctly applying the rules of use, up to 423.63 additional vehicles could be served with the time freed up compared to those actually served in the saturation scenario. In other words, compared to the 381 authorised vehicles entering the system, under these control conditions, (273+423.63) 605.63 vehicles could be served, which means 332.62 more vehicles than the 273 that were served in the situation without correct use, a 121.84% increase.
The study is then redone with the new simulated data, in which the Erlang B model will provide us with the probability of blocking to validate whether all demand can be met.
Vehicles entering the system (excluding private vehicles): 381 vehicles/month
Vehicles served applying restrictions in LUZ: 606 vehicles/month
Excess vehicle availability in the area: 606-381=225 vehicles/month
Weighted occupancy time (maximum 30 minutes per unloading): 9.65 minutes
Weighted available time: 21 days, 6 hours, 13 minutes daily (Z1): 7,560 minutes
Weighted time occupied in LUZ: 6 hours, 13 minutes daily: 5,844.35 minutes
% of weighted time occupied: 77.31%
Using this data and following the same methodology as in the first case, the following results are obtained:
λ = 3.02 vehicles/hour
μ = 6.22 vehicles/hour
ρ = 0.49 Erlangs, Viable system as ρ<1. There is no risk of collapse or saturation, as the system capacity exceeds the vehicle arrival rate.
pB=0.3272
According to the probability suggested by the model, 124.66 vehicles, or 32.72% of those arriving, cannot be served, but this figure is lower than the 225 calculated as excess availability based on weighted time, so we can categorically state that by enforcing the established rules without exception, and without additional measures, all demand for commercial vehicles for loading and unloading in this area can be met.
3.3. Scenario 3: Z3+Z4+Z5 all Vehicles According to Actual Observation
Zones Z3, Z4, and Z5 are on the street parallel to the street where Z1 is located. To obtain the simulation comparison, we took the sum of the download data from the three zones and applied the methodology used in the previous cases.:
Vehicles entering the system (including private vehicles): 810 vehicles/month
Vehicles served applying restrictions in LUZ: 678 vehicles/month
Weighted occupancy time (maximum 30 minutes per unloading): 21.23 minutes
Weighted available time: 21 days, 7.14 hours daily (weighted by metres in the three zones), 36 m (Z3+Z4+Z5): 25,200 minutes
Weighted time occupied in LUZ: daily 7.14 hours, 36 m: 14,393.94 minutes
% of weighted time occupied: 57.12%
Using this data and following the same methodology as in the first case, the following results are obtained::
λ = 5.40 vehicles/hour
μ = 2.83 vehicles/hour
ρ = 1.91 Erlangs, saturated system, not viable without a queue, resulting in losses that translate into double parking and illegal occupation.
As for the probability of blocking, we chose the actual observed data (132 vehicles, 16.30%), disregarding the probability offered by the pB model, which predicted a loss of 66.10% for the reasons stated above.
As in case 3.1, the partial conclusions are that traffic intensity exceeds the system's capacity threshold (ρ>1). The system is not viable without restrictions, as disorderly use causes congestion, illegal occupation and loss of efficiency in goods unloading operations.
3.4. Scenario 4: Z3+Z4+Z5 Without Access to LUZ for Unauthorised Private Vehicles and Considering a Maximum Time of 30 Minutes per Authorised Vehicle Unloading. Idealized Use Compliant with Regulations
This simulated case presents an ideal situation in which both access control for authorised vehicles and the time of use of the area are guaranteed. The data characterising this scenario are as follows:
Vehicles entering the system (excluding private vehicles): 635 vehicles/month
Vehicles served applying restrictions in LUZ: 495 vehicles/month
Weighted occupancy time (maximum 30 minutes per unloading): 9.04 minutes
Weighted available time: 21 days, daily 7.14 hours, 36 minutes (Z3+Z4+Z5): 25,200 minutes
Weighted time occupied in LUZ: daily 7.14 hours, 36 minutes: 4,474.80 minutes
% of weighted time occupied: 17.76%
Using this data and following the same methodology as in the first case, the following results are obtained:
λ = 4.24 vehicles/hour
μ = 6.64 vehicles/hour
ρ = 0.64 Erlangs, Viable system as ρ<1. There is no risk of collapse or saturation, as the system capacity exceeds the vehicle arrival rate.
In this idealised case of no entry into the LUZ zone by unauthorised private vehicles and no excessive use of the zone by commercial vehicles, a weighted amount of occupancy time is freed up, which could be offset by a greater number of authorised vehicle occupations.
The weighted occupied time liberated is calculated:
Tliberated = Tunrestricted occupation – Toccupied with constraints
In the comparative case of Z3+Z4+Z5:
Tliberado = (678 x 21,23= 14.393,94) – (495 x 9,04= 4.474,80) = 9.919,14 minutes
Con un tiempo ponderado de ocupación por vehículo genérico calculado anteriormente de 9,35, se calcula el nuevo número de vehículos adicionales atendidos.
NAdditional vehicles== 1.061,04 additional vehicles
In the set of street areas, Z3+Z4+Z5, by applying restrictions, up to 1,061.04 additional vehicles could be served with the time freed up compared to those actually served in the saturation scenario. In other words, compared to the 635 authorised vehicles entering the system, under these control conditions, (495+1,061.04) 1,556.04 vehicles could be served, which means 878.04 more vehicles than the 678 served in the incorrect use situation, a 129.50% increase.
The study is then redone with the new simulated data, in which the Erlang B model will provide us with the probability of blocking to validate whether all demand can be met.
Vehicles entering the system (excluding private vehicles): 635 vehicles/month
Vehicles served applying restrictions in LUZ: 1,556 vehicles/month
Excess vehicle availability in the area: 1,556-635=921 vehicles/month
Weighted occupancy time (maximum 30 minutes per unloading): 9.04 minutes
Weighted available time: 21 days, daily 7.14 hours, 36 m (Z3+Z4+Z5): 25,200 minutes
Weighted time occupied in LUZ: daily 7 hours, 36 minutes: 14,066.62 minutes
% of weighted time occupied: 55.82%
Using this data and following the same methodology as in the first case, the following results are obtained:
λ = 4.24 vehicles/hour
μ = 6.64 vehicles/hour
ρ = 0.64 Erlangs, Viable system as ρ<1. There is no risk of collapse or saturation, as the system capacity exceeds the vehicle arrival rate.
pB=0.3895
According to the probability suggested by the model, 247.35 vehicles, or 38.95% of those arriving, will not be able to be served. but this figure is lower than the 921 calculated as excess availability based on weighted time, so we can categorically state that by enforcing the established rules without exception, and without additional measures, all commercial vehicle demand for loading and unloading in this area can be met.
3.5. Scenario 5: Z1+Z3+Z4+Z5 all Vehicles According to Actual Observation
Z1 is now added to zones Z3, Z4 and Z5 to obtain the total number of zones in the block under study. To obtain the simulation comparison, we take the sum of the download data from the four zones and apply the methodology used in the previous cases:
Vehicles entering the system (including private vehicles): 1,285 vehicles/month
Vehicles served applying restrictions in LUZ: 951 vehicles/month
Weighted occupancy time (maximum 30 minutes per unloading): 20.52 minutes
Weighted available time: 21 days, 6.87 hours per day (weighted by metres in the four zones), 49 m (Z1+Z3+Z4+Z5): 32,760 minutes
Weighted time occupied in LUZ: daily 6.87 hours, 49 m: 19,514.52 minutes
% of weighted time occupied: 59.57%
Using this data and following the same methodology as in the first case, the following results are obtained:
λ = 8.91 vehicles/hour
μ = 2.92 vehicles/hour
ρ = 3.05 Erlangs, saturated system, not viable without a queue, resulting in losses that translate into double parking and illegal occupation.
As for the probability of blocking, we chose the actual observed data (334 vehicles, 25.99% of those accessing), disregarding the probability offered by the pB model, which predicted a loss of 75.29%, for the reasons stated above.
As in case 3.1, the partial conclusions are that traffic intensity far exceeds the system's capacity threshold (ρ>1). The system is not viable without restrictions, as disorderly use causes congestion, illegal occupation and loss of efficiency in goods unloading operations.
3.6. Scenario 6: Z1+Z3+Z4+Z5 Without Access to LUZ for Unauthorised Private Vehicles and Considering a Maximum Time of 30 Minutes per Authorised Vehicle Unloading. Idealized Use Compliant with Regulations
This simulated case presents an ideal situation in which both access control for authorised vehicles and the time of use of the area are guaranteed. The data characterising this scenario are as follows:
Vehicles entering the system (excluding private vehicles): 1,016 vehicles/month
Vehicles served applying restrictions in LUZ: 677 vehicles/month
Weighted occupancy time (maximum 30 minutes per unloading): 8.94 minutes
Weighted available time: 21 days, daily 6.87 hours, 49 minutes (Z1+Z3+Z4+Z5): 32,760 minutes
Weighted time occupied in LUZ: daily 6.87 hours, 49 minutes: 6,052.38 minutes
% of weighted time occupied: 18.47%
Using this data and following the same methodology as in the first case, the following results are obtained:
λ = 7.04 vehicles/hour
μ = 6.71 vehicles/hour
ρ = 1.05 Erlangs, system slightly saturated as ρ>1, at the limit of viability without queueing.
In this idealised case of no entry into the LUZ zone by unauthorised private vehicles and no excessive use of the zone by commercial vehicles, a weighted amount of occupancy time is freed up, which could be offset by a greater number of authorised vehicle occupations.
The weighted occupied time liberated is calculated:
Tliberated = Tunrestricted occupation – Toccupied with constraints
In the comparative case of Z1+Z3+Z4+Z5:
Tliberated = (951 x 20,52=19.517,52) – (677 x 8,94= 6.052,38) = 13.462,14 minutes
Con un tiempo ponderado de ocupación por vehículo genérico calculado anteriormente de 9,35, se calcula el nuevo número de vehículos adicionales atendidos.
NAdditional vehicles== 1.440,03 additional vehicles
In the set of zones within the block, Z1+Z3+Z4+Z5, by applying restrictions, up to 1,440.03 additional vehicles could be served with the time freed up compared to those actually served in the saturation scenario. In other words, compared to the 1,016 authorised vehicles entering the system, under these control conditions, (677+1,440.03) 2,117.03 vehicles could be served, which means 1,166.03 more vehicles than the 951 served in the situation without restrictions, a 122.61% increase.
The study is then redone with the new simulated data, in which the Erlang B model will provide us with the probability of blocking to validate whether all demand can be met.
Vehicles entering the system (excluding private vehicles): 1,016 vehicles/month
Vehicles served applying restrictions in LUZ: 2,117 vehicles/month
Excess vehicle availability in the area: 2,117-1,016=1,101 vehicles/month
Weighted occupancy time (maximum 30 minutes per unloading): 8.94 minutes
Weighted available time: 21 days, daily 6.87 hours, 49 minutes (Z1+Z3+Z4+Z5): 32,760 minutes
Weighted time occupied in LUZ: daily 6.87 hours, 49 minutes: 18,926.28 minutes
% of weighted time occupied: 57.77%
Using this data and following the same methodology as in the first case, the following results are obtained:
λ = 7.04 vehicles/hour
μ = 6.71 vehicles/hour
ρ = 1.05 Erlangs, system slightly saturated as ρ>1, at the limit of viability without queue.
pB=0.5120
According to the probability suggested by the model, 520.22 vehicles, or 51.20% of those arriving, cannot be served, but this figure is lower than the 1,101 calculated as excess availability based on weighted time, so we can categorically state that by enforcing the established rules without exception, and without additional measures, all commercial vehicle demand for loading and unloading in this area can be met.
4. Discussion
Below are comparative tables between the different scenarios, as well as graphs that aid in better understanding and discussion.
Table 3 shows the results of various scenarios in different loading and unloading zones (Z1, Z3+Z4+Z5) with different levels of restrictions. The data includes the number of vehicles arriving at the system, vehicles served, vehicles not served (percentage of illegal occupancy) and weighted occupancy times, both with and without restrictions. Each scenario analyses how restrictions on private vehicles and time overruns affect the operational efficiency of the zones. The values in the table reflect comparisons between different combinations of zones and restrictions, showing how access conditions and the duration of time in loading and unloading zones influence the occupancy of available spaces. The percentages indicate the variability in performance for each scenario and how policy changes affect overall efficiency.

Table 3.
Arrival data, ratios, and weighted times.
| Set of zones | Vehicle Arrivals | Vehicles Serviced | Vehicles Lost | Actual Loss % | Arrival Rate | Weighted Time in LUZ | Service Rate | Load Factor |
| Sc 1: Z1 all | 474 | 273 | 201 | 42,41% | 3,76 | 20,94 | 2,87 | 1,31 |
| Sc 2 aux: Z1 with no part no exc | 381 | 182 | 199 | 52,23% | 3,02 | 9,65 | 6,22 | 0,49 |
| Sc 2: Z1 with no part no exc new | 381 | 605 | -225 | -58,96% | 3,02 | 9,65 | 6,22 | 0,49 |
| Sc 3: Z3+Z4+Z5 all | 810 | 678 | 132 | 16,30% | 5,40 | 21,23 | 2,83 | 1,91 |
| Sc 4 aux: Z3+Z4+Z5 with no part no exc | 635 | 495 | 140 | 22,05% | 4,24 | 9,04 | 6,64 | 0,64 |
| Sc 4: Z3+Z4+Z5 with no part no exc new | 635 | 1.556 | -921 | -145,05% | 4,24 | 9,04 | 6,64 | 0,64 |
| Sc 5: Z1+Z3+Z4+Z5 all | 1.285 | 951 | 334 | 25,99% | 8,91 | 20,52 | 2,92 | 3,05 |
| Sc 6 aux: Z1+Z3+Z4+Z5 with no part no exc | 1.016 | 677 | 339 | 33,37% | 7,04 | 8,94 | 6,71 | 1,05 |
| Sc 6: Z1+Z3+Z4+Z5 with no part no exc new | 1.016 | 2.117 | -1.101 | -108,37% | 7,04 | 8,94 | 6,71 | 1,05 |
Table 4 shows the results of the different scenarios related to the loading and unloading zones (LUZ) in Zaragoza. Each row shows the weighted total occupancy and usage times, as well as the percentage of effective occupancy and the estimated loss under the Erlang model, and the differences between theoretical and actual losses.
Table 5 presents the results of the different loading and unloading scenarios in the different scenarios, both with and without restrictions on private vehicles and time overruns. The results include total and weighted usage times, weighted usage percentage, and estimated loss based on the Erlang model, compared with the differences with the actual observed data.
Figure 3 shows that in scenarios involving incorrect use, more vehicles enter the system than can be handled, while in scenarios involving use in accordance with regulations, the capacity to handle commercial vehicles in the LUZ is sufficient and even oversized
Figure 4 shows the traffic intensity, that in scenarios involving incorrect use, more vehicles enter the system than can be handled, while in scenarios involving use in accordance with regulations, the capacity to handle commercial vehicles in the LUZ is sufficient and even oversized.
The traffic intensity measured in Erlangs shows that unrestricted systems are not viable as they have >1, while scenarios with restrictions applied are below 1, even in the case of the sum of all areas, which is just at the limit of viability. The contrast between scenarios demonstrates that management and restriction measures are more effective than physically expanding the available space. Controlled scenarios manage to maintain traffic intensity at stable levels (ρ < 1), which guarantees service continuity and reduces the likelihood of illegal parking or operational blockages.
These results suggest the need to implement intelligent access control and dwell time systems. This would allow ρ to be kept within sustainable limits and prevent structural saturation of the urban loading and unloading system.
Figure 5 shows the relationship between the arrival rate and the service rate. The scatter plot shows that the points below the red line (λ = μ) represent situations where demand exceeds capacity and therefore there is saturation. The points above the line indicate that the system has sufficient margin to operate without congestion. The combined scenario for the two areas is right on the limit. Overall, the graph shows that the systems studied do not collapse from a mathematical point of view, but operate in regimes of relative inefficiency, where the potential service capacity (μ) does not translate into an equivalent increase in the number of vehicles served. This reinforces the hypothesis that improvement does not only involve increasing the number of spaces or the time available, but also implementing digital control and time traceability mechanisms that optimise the use of existing infrastructure.
Figure 6 shows the capacity to serve services versus the arrival rate by scenario, almost balancing in the joint case. The application of restrictions (Yes scenarios) produces a significant reduction in the arrival rate (λ), as non-professional vehicles or those with irregular behaviour are eliminated. At the same time, the service rate (μ) tends to increase or stabilise, which shows an improvement in the overall efficiency of the system: with less interference and greater turnover, the areas can handle a similar flow of vehicles in less time. The graph shows that the physical expansion of the system does not guarantee improved performance if it is not accompanied by regulatory and technological measures. In fact, the controlled reduction of non-essential traffic, simulated by the restrictions, leads to greater functional efficiency (lower ρ) and lower blocking losses (pB).
Figure 7 shows the weighted occupancy times: total versus occupied and released, in each scenario. The released times are those that give rise to the simulation of commercial vehicles that could be served in each LUZ scenario according to the weighted occupancy times of the weighted generic average of occupancy times by vehicle type. A significant portion of the reserved time is not used for actual logistics operations. This reflects structural inefficiencies resulting from improper occupancy, downtime, and lack of controlled turnover.
When comparing the different groups of zones, it can be seen that increasing the operational area (from Z1 to Z3+Z4+Z5 and finally to the whole) increases the total available time, but not proportionally to the time of use. This finding confirms that marginal efficiency decreases as the system expands, suggesting that improvements should focus more on optimisation and control than on capacity expansion.
The graph shows that access restriction and control policies would significantly improve the system's temporal efficiency, reducing idle time and maximising the effective use of areas. From an urban management perspective, this reinforces the viability of implementing dynamic digital control tools capable of ensuring the rational use of LUZ and contributing to the sustainability of urban mobility.
4.1. Operational Interpretation
Detailed analysis of data collected in the field reveals that the main cause of congestion is not only the number of available spaces, but also inefficient occupancy due to illegal parking and exceeded parking times. In Z1, the existence of a dark store opposite the area increases the turnover of PMV delivery vehicles and supply vans, generating highly concentrated peaks in demand. In contrast, in Z3–Z5, the lack of parking alternatives and the linear configuration of the road network encourage prolonged occupancy, which reduces effective availability.
The comparative study between scenarios ‘Z1+Z3+Z4+Z5’ and ‘Z3+Z4+Z5’ showed a relative improvement in the use of total available time, as the number of active places increased and, with it, the capacity of the system. However, this improvement did not translate proportionally into a reduction in pB, suggesting that increasing the number of places does not guarantee greater efficiency without associated operational control.
4.2. Discussion of the Theoretical Model
The M/M/1/1 (Erlang B) model has proven adequate for estimating the average behaviour of the system when capacity is limited and there is no possibility of waiting. However, empirical results show that the actual distribution of arrivals does not strictly follow a Poisson distribution, but rather presents peaks and troughs associated with business hours and the concentration of deliveries in narrow time windows.
Therefore, the application of non-stationary or discrete event simulation models is proposed as a future line of research, which would allow the incorporation of actual hourly flow variability. However, the Erlang B model remains useful as a first-order reference for quantifying structural loss and establishing comparative scenarios between different zone configurations.
Overall, the results allow us to conclude that the current management of the LUZ selected for the study is functional but inefficient from an operational and environmental point of view, and that the application of some kind of usage control tool is a priority measure for improving sustainability and urban logistics competitiveness.
4.3. How to Comply with Municipal Regulations on Urban Goods Distribution
The simulation of scenarios is based on strict compliance with the rules for the use of LUZ in the city of Zaragoza. To achieve this compliance, the authors propose a tool for controlling loading and unloading spaces, mandatory for all professional drivers who wish to carry out unloading operations, which would allow manual registration using geolocation, without the need for physical sensors or cameras. The system would not allow private vehicles to enter and its use would be free of charge.
The system would allow control of the time spent in the zones, with a configurable limit (30 minutes by default), generating smart alerts to the driver when the end of the allowed time is approaching, to the police in case of exceeding it, and for the detection of repeat offences. The authorities would be able to view the vehicles present in each zone in real time, with access to a complete history of entries, exits, and violations. In addition, a heat map of occupancy would be available to facilitate further analysis and decision-making. The entire system would strictly comply with the GDPR, collecting only the data required by law, and would allow the zone to be catalogued according to the OEE metric resulting from its activity.
The implementation of this control system would increase commercial vehicle turnover, reduce double parking and illegal occupation, and facilitate data-based management by public officials.
The solution could also categorise loading and unloading areas based on a new OEE that could be defined automatically with the data generated, as well as categorising delivery drivers according to their punctuality, as already mentioned Gil Gallego et al [9] .
5. Conclusions
This study has made it possible to characterise the actual functioning of four loading and unloading zones (LUZ) in the central area of Zaragoza, combining direct empirical observation with theoretical modelling using M/M/1/1 (Erlang B) queues. The results show that, although the physical and temporal capacity of the zones is sufficient in nominal terms, operational efficiency is compromised by misuse, excessive time and lack of dynamic control, generating loss rates of over 30% during periods of peak demand.
The greatest bias in the study lies in the fact that it considers a single service point, since the weighted time of occupancy variable already takes into account the impact of vehicle length in the area. The probabilistic model for predicting loss or blockage indicates the moment when the area is occupied, regardless of whether or not there are spaces available in it. However, this limitation marks the most unfavourable point of occupancy, so in practice, the use of those metres not taken into account would always work in favour of the system's capacity and never against it.
This study makes three main contributions. The main conclusion is that it is not necessary to expand the spaces or reservation times in the LUZs studied to meet the entire demand for loading and unloading capacity. It is simply necessary to strictly enforce the relevant municipal ordinances, something that does not happen in practice.
The second contribution has been to demonstrate that the M/M/1/1 Erlang B model of queueing theory without queues, supported in this work by the weighted time variable, which eliminates unauthorised private vehicles and limits the stay in the LUZ of commercial vehicles loading or unloading to 30 actual minutes, is sufficient to meet demand by zone and for the LUZ as a whole. Areas with incorrect use tend to collapse and generate externalities. The comparison between the theoretical results and the observed data reveals significant deviations. This phenomenon demonstrates that the assumption of homogeneous Poisson-type arrivals does not accurately reflect the operational reality, where deliveries are grouped into short and uneven periods. Despite this, the Erlang B model remains valid as a first-rate analytical tool for estimating structural service loss and evaluating improvement scenarios, compared to other studies that do consider queues or waiting times.
The third contribution, in response to non-compliance with regulations, is the proposal to develop a tool for managing LUZ, based on geolocation, time recording and automatic alerts. This tool would allow drivers to record their entry and exit in real time, and would provide municipal agents with a control panel to monitor occupancy, excesses and repeat offences. This system, complemented by an adaptation period and without the need for sensors or cameras, would reduce service losses, improve turnover and decrease the environmental impact of unnecessary traffic.
The study concludes that the three restrictions, one on access and two others that are temporary, should ensure proper compliance with LUZ management. It also aims to provide the city's governance with an analysis methodology to improve LUZ management and therefore proposes, for future studies, incorporating a new indicator into the restrictions already established a new indicator to aid decision-making regarding the longitudinal impact of expanding or reducing LUZ and the associated environmental impact, thereby enabling the assessment of the impact that modifying them in terms of time windows or space dimensions would have on each area or group of areas, as well as the design approach of the control tool.
Author Contributions
Conceptualization, A.G. and M.P.L.; investigation, A.G. and M.P.L.; methodology, A.G. and M.P.L.; project administration, J.R. and J.C.S.; supervision, M.P.L., J.R. and P.M.; writing—original draft, A.G.; writing—review and editing, M.P.L. and P.M. All authors have read and agreed to the published version of the manuscript.
Funding
TECNALIA, Basque Research Technology Alliance (BRTA)
Institutional Review Board Statement
Not applicable.
Informed Consent Statement
Not applicable.
Data Availability Statement
The data presented in this study are available on request from the corresponding author.
Conflicts of Interest
Authors Paula Morella and Juan Carlos Sánchez were employed by the company TECNALIA. The other authors declare that the research was conducted in the absence of any commercial or financial relationship that could be interpreted as a potential conflict of interest.
Abbreviations
The following abbreviations are used in this manuscript:
| UDG | Urban Distribution of Goods |
| LUZ | Loading and Unloading Zones |
| OEE | Overall Equipment Effectiveness |
| PMV | Personal Mobility Vehicles |
References
- Ma, B.; Wong, Y.D.; Teo, C.C. Parcel Self-Collection for Urban Last-Mile Deliveries: A Review and Research Agenda with a Dual Operations-Consumer Perspective. Transp Res Interdiscip Perspect 2022, 16.
- Ezquerro, S.; Moura, J.L.; Alonso, B. Illegal Use of Loading Bays and Its Impact on the Use of Public Space. Sustainability (Switzerland) 2020, 12. [CrossRef]
- Alho, A.; Silva, J. de A. e; Sousa, J.P. de A State-of-the-Art Modeling Framework to Improve Congestion by Changing the Configuration/Enforcement of Urban Logistics Loading/Unloading Bays. Procedia Soc Behav Sci 2014, 111, 360–369. [CrossRef]
- Alho, A.R.; de Abreu e Silva, J. Modeling Retail Establishments’ Freight Trip Generation: A Comparison of Methodologies to Predict Total Weekly Deliveries. Transportation (Amst) 2017, 44, 1195–1212. [CrossRef]
- Ghizzawi, F.; Galal, A.; Roorda, M.J. Modelling Parking Behaviour of Commercial Vehicles: A Scoping Review. Transp Rev 2024, 44, 743–765. [CrossRef]
- Muriel, J.E.; Zhang, L.; Fransoo, J.C.; Perez-Franco, R. Assessing the Impacts of Last Mile Delivery Strategies on Delivery Vehicles and Traffic Network Performance. Transp Res Part C Emerg Technol 2022, 144. [CrossRef]
- Alho, A.R.; de Abreu e Silva, J.; de Sousa, J.P.; Blanco, E. Improving Mobility by Optimizing the Number, Location and Usage of Loading/Unloading Bays for Urban Freight Vehicles. Transp Res D Transp Environ 2018, 61, 3–18. [CrossRef]
- Wilson, M.; Janjevic, M.; Winkenbach, M. Modeling a Time-Differentiated Policy for Management of Loading Bays in Urban Areas. Research in Transportation Business and Management 2022, 45. [CrossRef]
- Gil Gallego, A.; Lambán, M.P.; Royo Sánchez, J.; Sánchez Catalán, J.C.; Morella Avinzano, P. Study and Characterization of New KPIs for Measuring Efficiency in Urban Loading and Unloading Zones Using the OEE (Overall Equipment Effectiveness) Model. Applied Sciences 2025, 15, 7652. [CrossRef]
- Comi, A.; Buttarazzi, B.; Schiraldi, M.M.; Innarella, R.; Varisco, M.; Rosati, L. DynaLOAD: A Simulation Framework for Planning, Managing and Controlling Urban Delivery Bays. In Proceedings of the Transportation Research Procedia; Elsevier B.V., 2017; Vol. 22, pp. 335–344.
- Comi, A.; Moura, J.L.; Ezquerro, S. A Methodology for Assessing the Urban Supply of On-Street Delivery Bays. Green Energy and Intelligent Transportation 2022, 1. [CrossRef]
- Letnik, T.; Mencinger, M.; Peruš, I. Flexible Assignment of Loading Bays for Efficient Vehicle Routing in Urban Last Mile Delivery. Sustainability (Switzerland) 2020, 12. [CrossRef]
- Dalla Chiara, G.; Krutein, K.F.; Ranjbari, A.; Goodchild, A. Providing Curb Availability Information to Delivery Drivers Reduces Cruising for Parking. Sci Rep 2022, 12. [CrossRef]
- Xiao, J.; Lou, Y.; Frisby, J. How Likely Am I to Find Parking? – A Practical Model-Based Framework for Predicting Parking Availability. Transportation Research Part B: Methodological 2018, 112, 19–39. [CrossRef]
- Ochoa-Olán, J. de J.; Betanzo-Quezada, E.; Romero-Navarrete, J.A. A Modeling and Micro-Simulation Approach to Estimate the Location, Number and Size of Loading/Unloading Bays: A Case Study in the City of Querétaro, Mexico. Transp Res Interdiscip Perspect 2021, 10. [CrossRef]
- Abierto, O. de T. y G. Ordenanza de Movilidad Urbana de Zaragoza. Normativa. Ayuntamiento de Zaragoza.
- Les, A.; Morella, P.; Lambán, M.P.; Royo, J.; Sánchez, J.C. A New Indicator for Measuring Efficiency in Urban Freight Transportation: Defining and Implementing the OEEM (Overall Equipment Effectiveness for Mobility). Applied Sciences (Switzerland) 2024, 14. [CrossRef]
- Sun, S.; Bi, R.; Wang, Z.; Ji, Y. Loading and Unloading Points Identification Based on Freight Trajectory Big Data and Clustering Method. Promet - Traffic&Transportation 2023, 35, 148–160. [CrossRef]
- Jazemi, R.; Alidadiani, E.; Ahn, K.; Jang, J. A Review of Literature on Vehicle Routing Problems of Last-Mile Delivery in Urban Areas. Applied Sciences (Switzerland) 2023, 13.
- Pinto, R.; Lagorio, A.; Golini, R. The Location and Sizing of Urban Freight Loading/Unloading Lay-by Areas. Int J Prod Res 2019, 57, 83–99. [CrossRef]
- Jelen, G.; Podobnik, V.; Babic, J. Contextual Prediction of Parking Spot Availability: A Step towards Sustainable Parking. J Clean Prod 2021, 312, 127684. [CrossRef]
- CITYlogin Inaugura En Zaragoza Un Microhub Para El Reparto Urbano Sostenible.
- BDM, R. Prueba Piloto de Los Primeros Robots Autónomos de Reparto En Zaragoza - Big Data Magazine.
- Caravia, S. Zaragoza, Epicentro de La Nueva Movilidad Con El Proyecto Digizity.
- DGT, M. interior VI Encuentro de Ciudades En Zaragoza, Ciudades 2030.
- DGT, M. interior Zaragoza Acoge La VI Edición Del Encuentro de Ciudades Organizado Por La Dirección General de Tráfico.
- Turrubia, M. UrbanDUM 4.0 Fase 2: Distribución Urbana, Inteligente y Sostenible de Mercancías | ALIA - Clúster Logístico Aragón.
- Abierto, O. de T. y G. Revisión Del Plan de Movilidad Urbana Sostenible de Zaragoza. Ayuntamiento de Zaragoza.
- Abierto, O. de T. y G. Datos Abiertos. Gobierno Abierto. Ayuntamiento de Zaragoza.
- Abierto, O. de T. y G. Reserva de Espacios Para Carga y Descarga. Datos Abiertos. Ayuntamiento de Zaragoza.
- ORDENANZA_MOVILIDAD_URBANA_def.
Figure 1.
Distribution of vehicle occupancy status by zone.
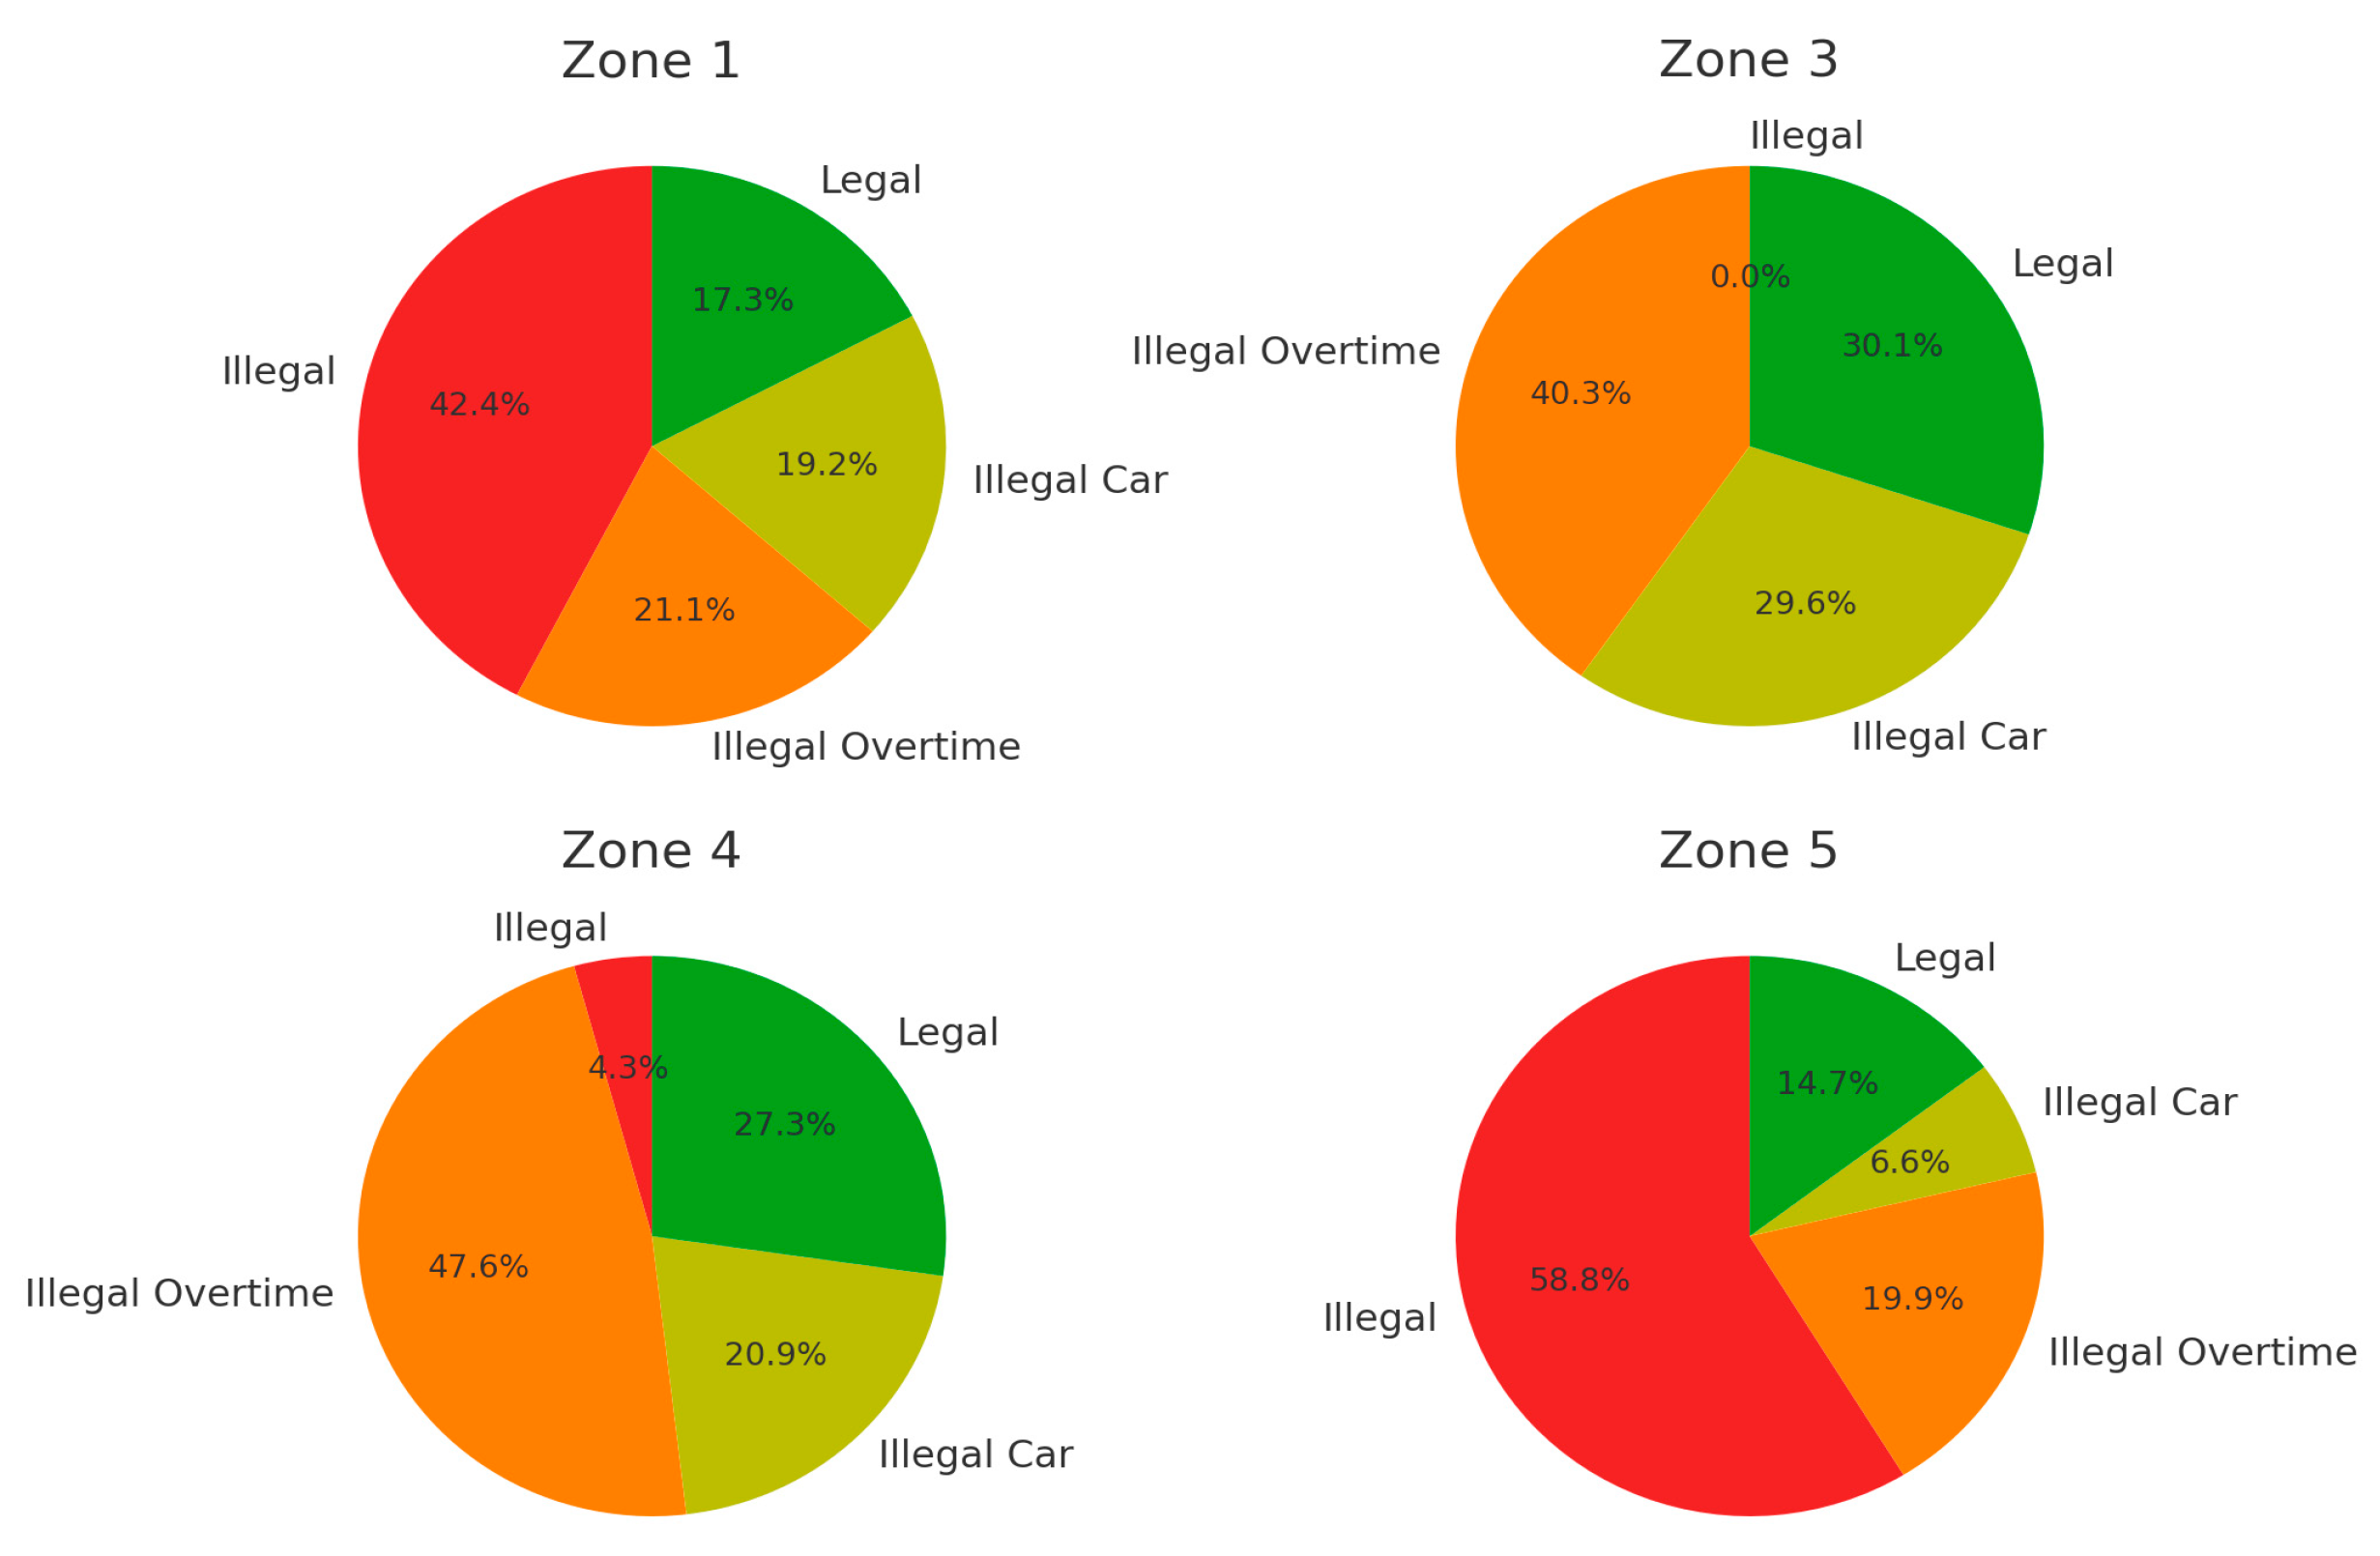
Figure 2.
Aerial view of the area where the five zones are located.
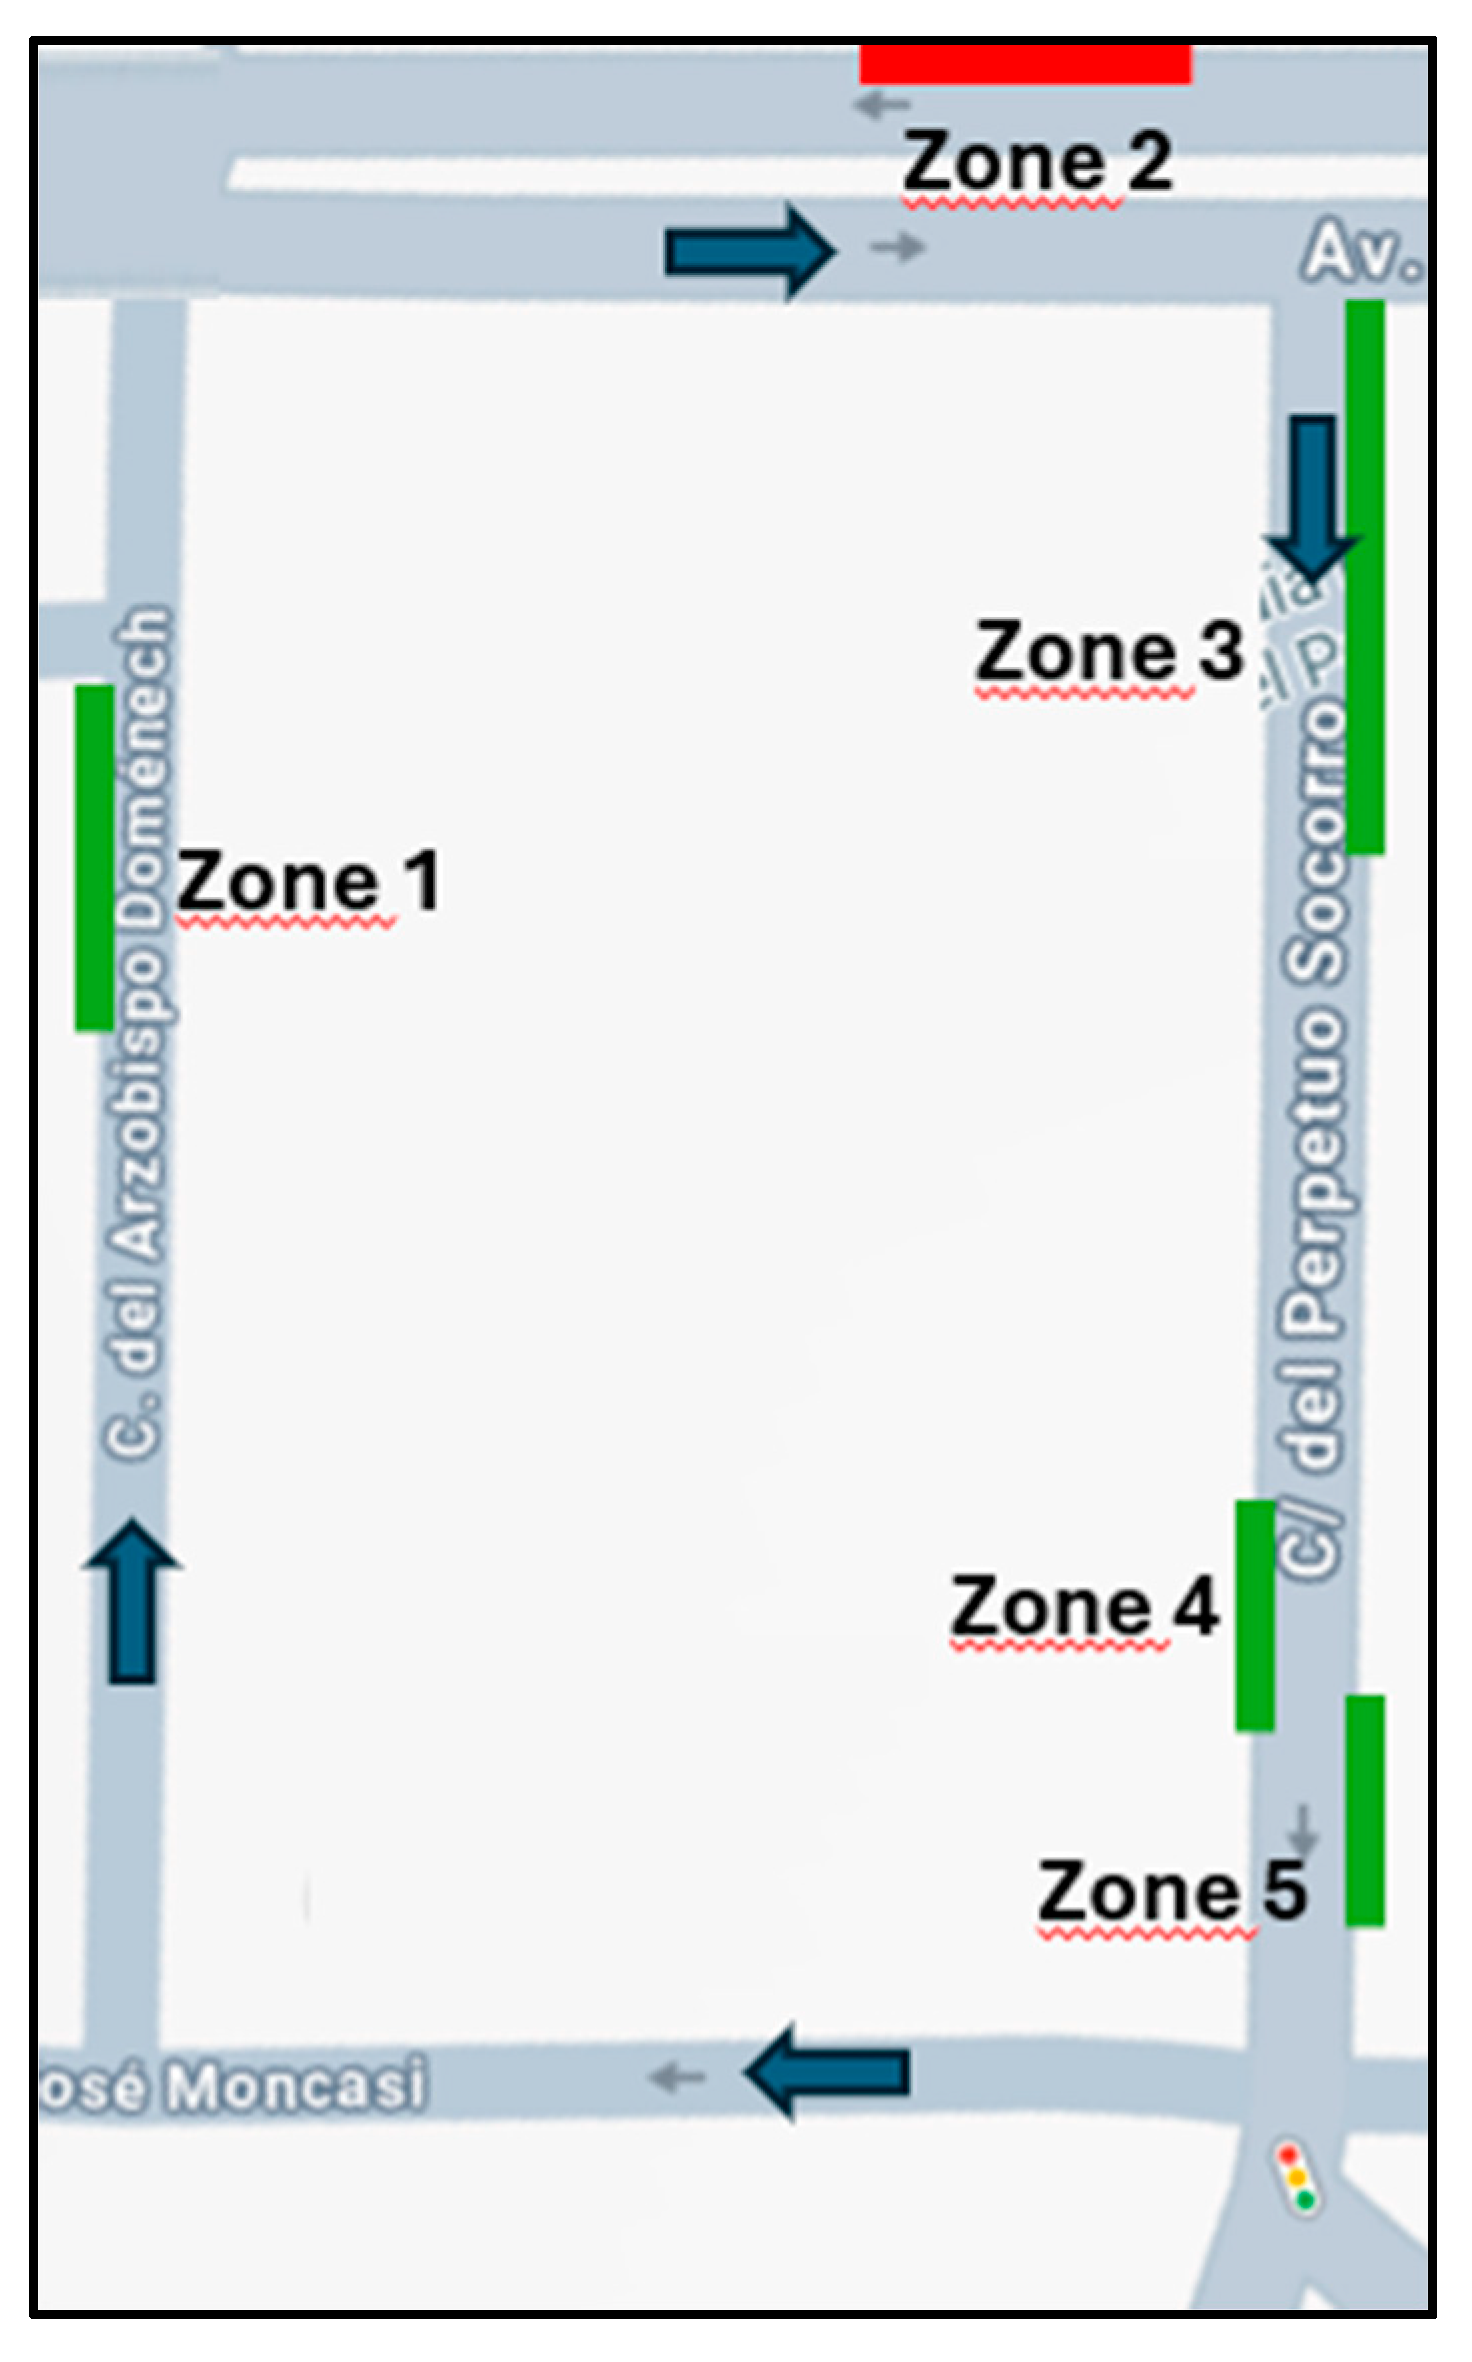
Figure 3.
Vehicles entering vs attended by scenario.
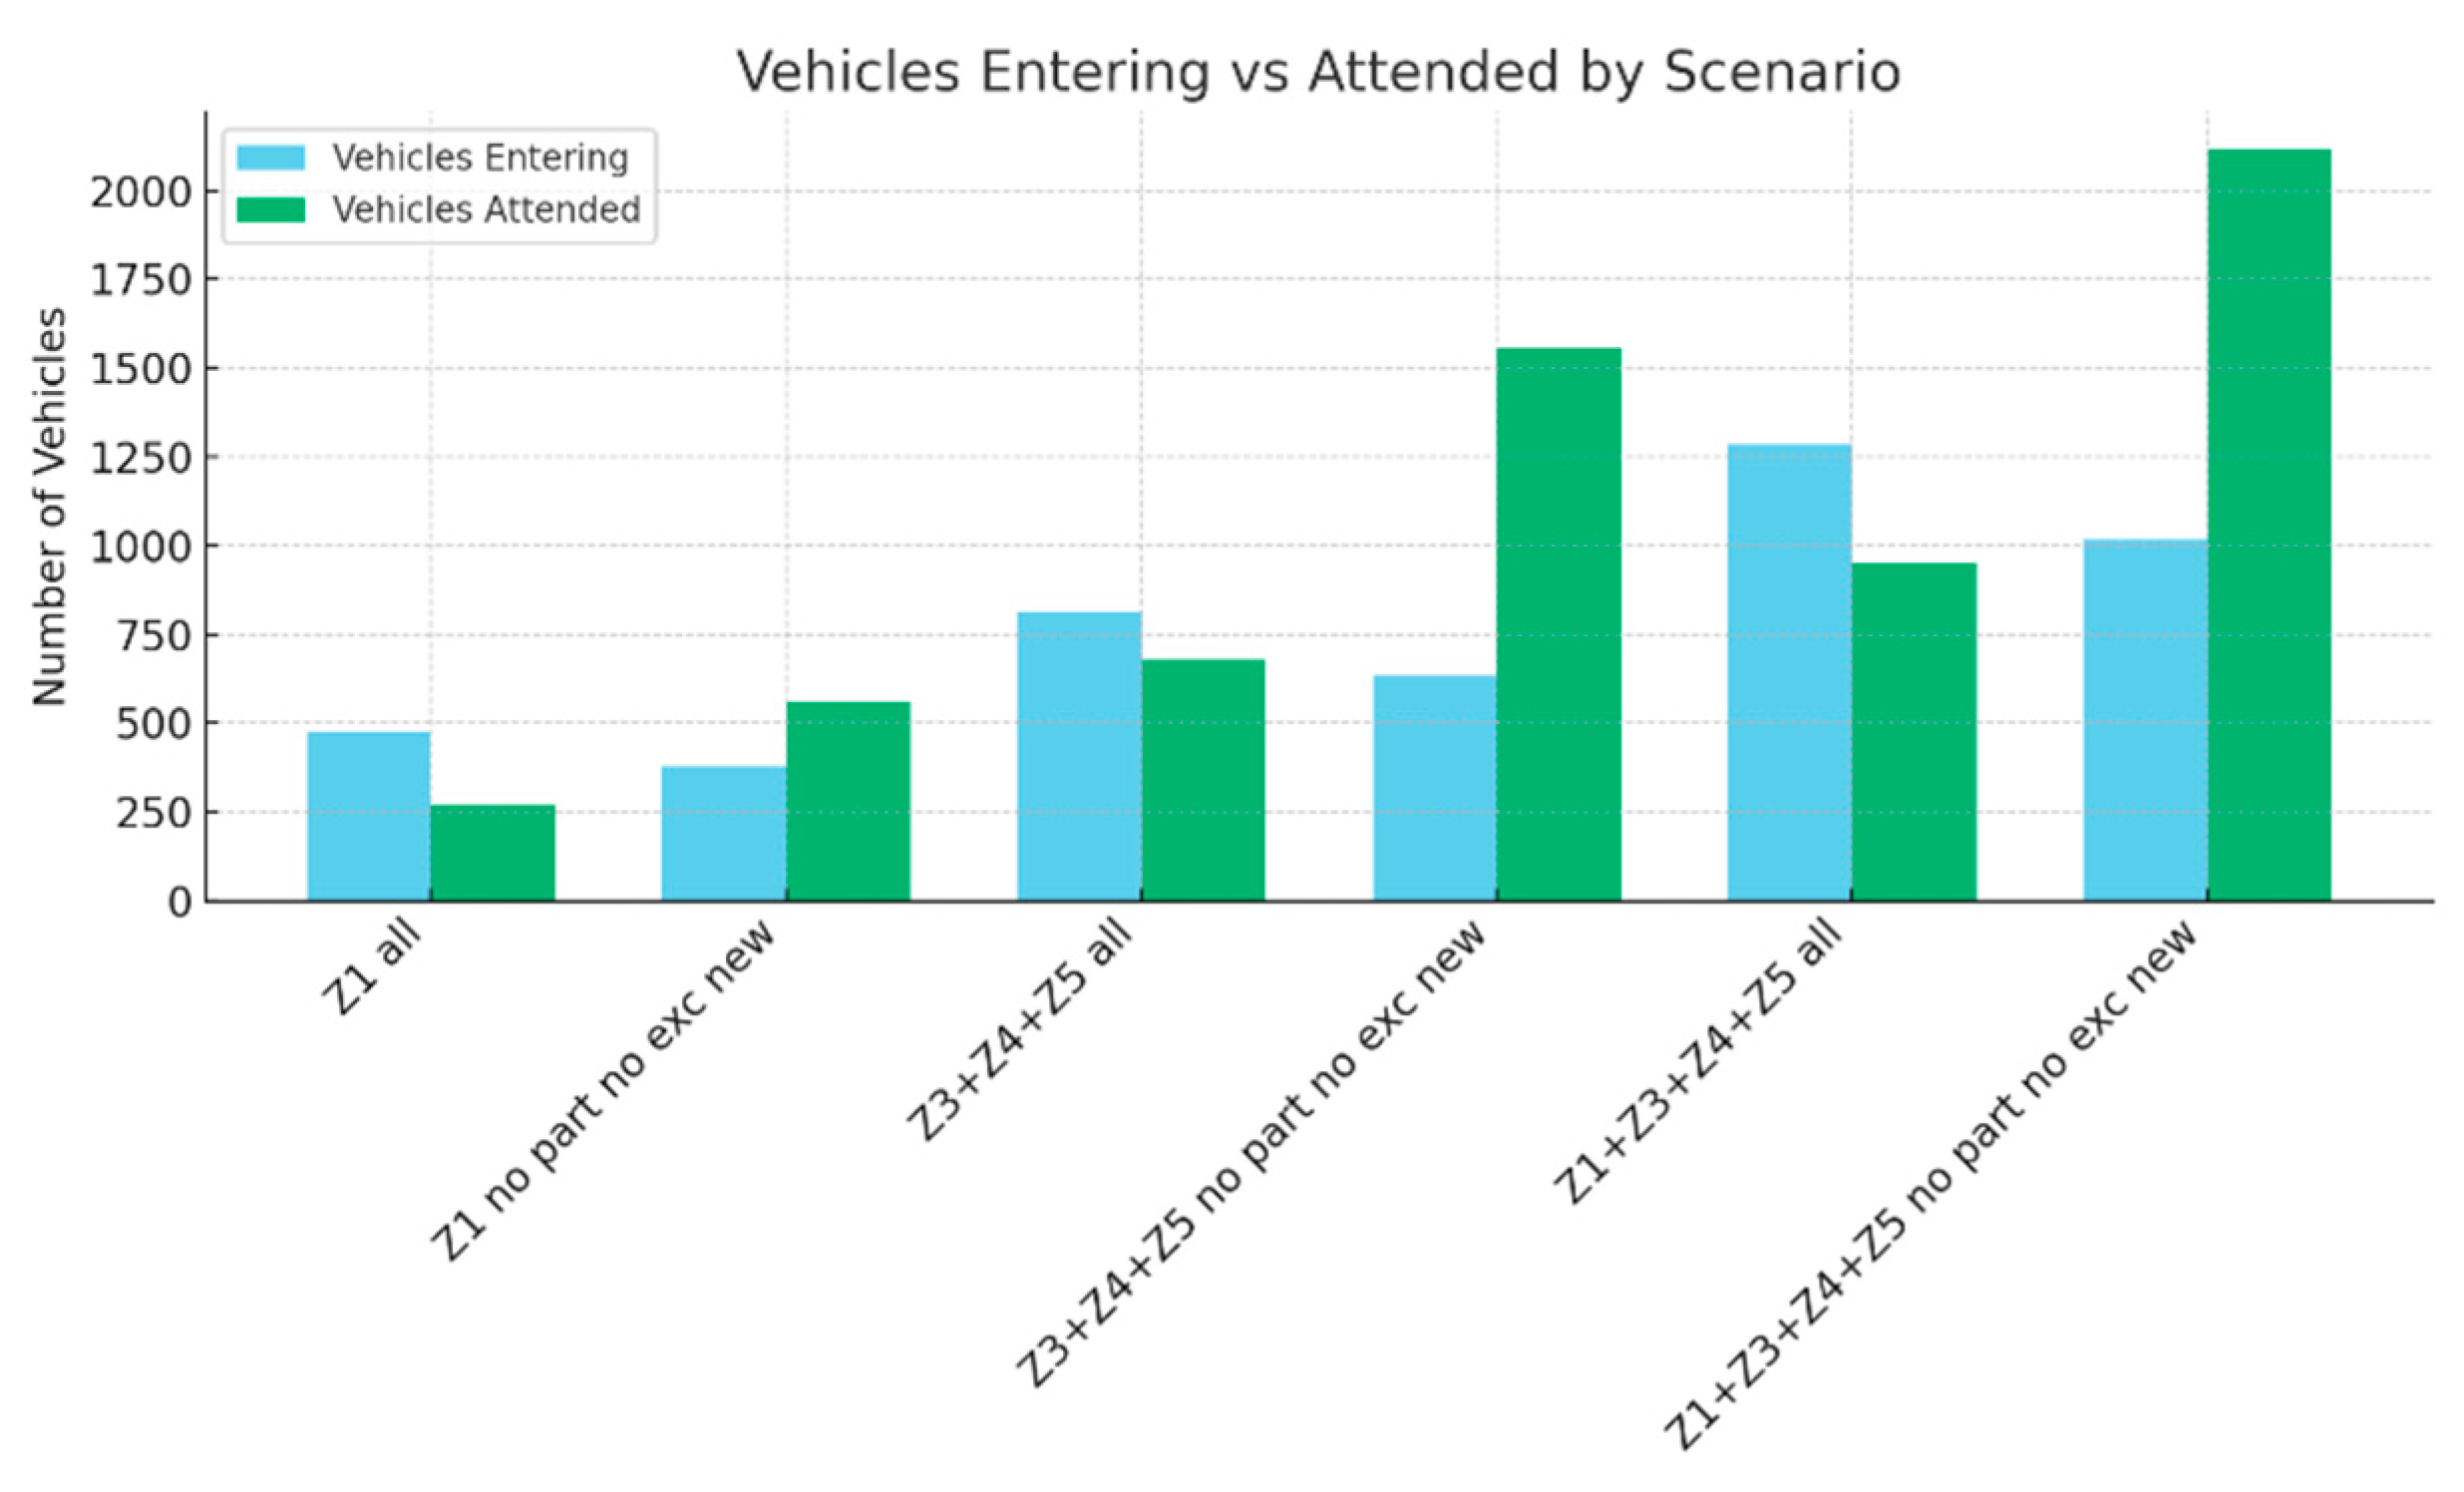
Figure 4.
Traffic intensity.
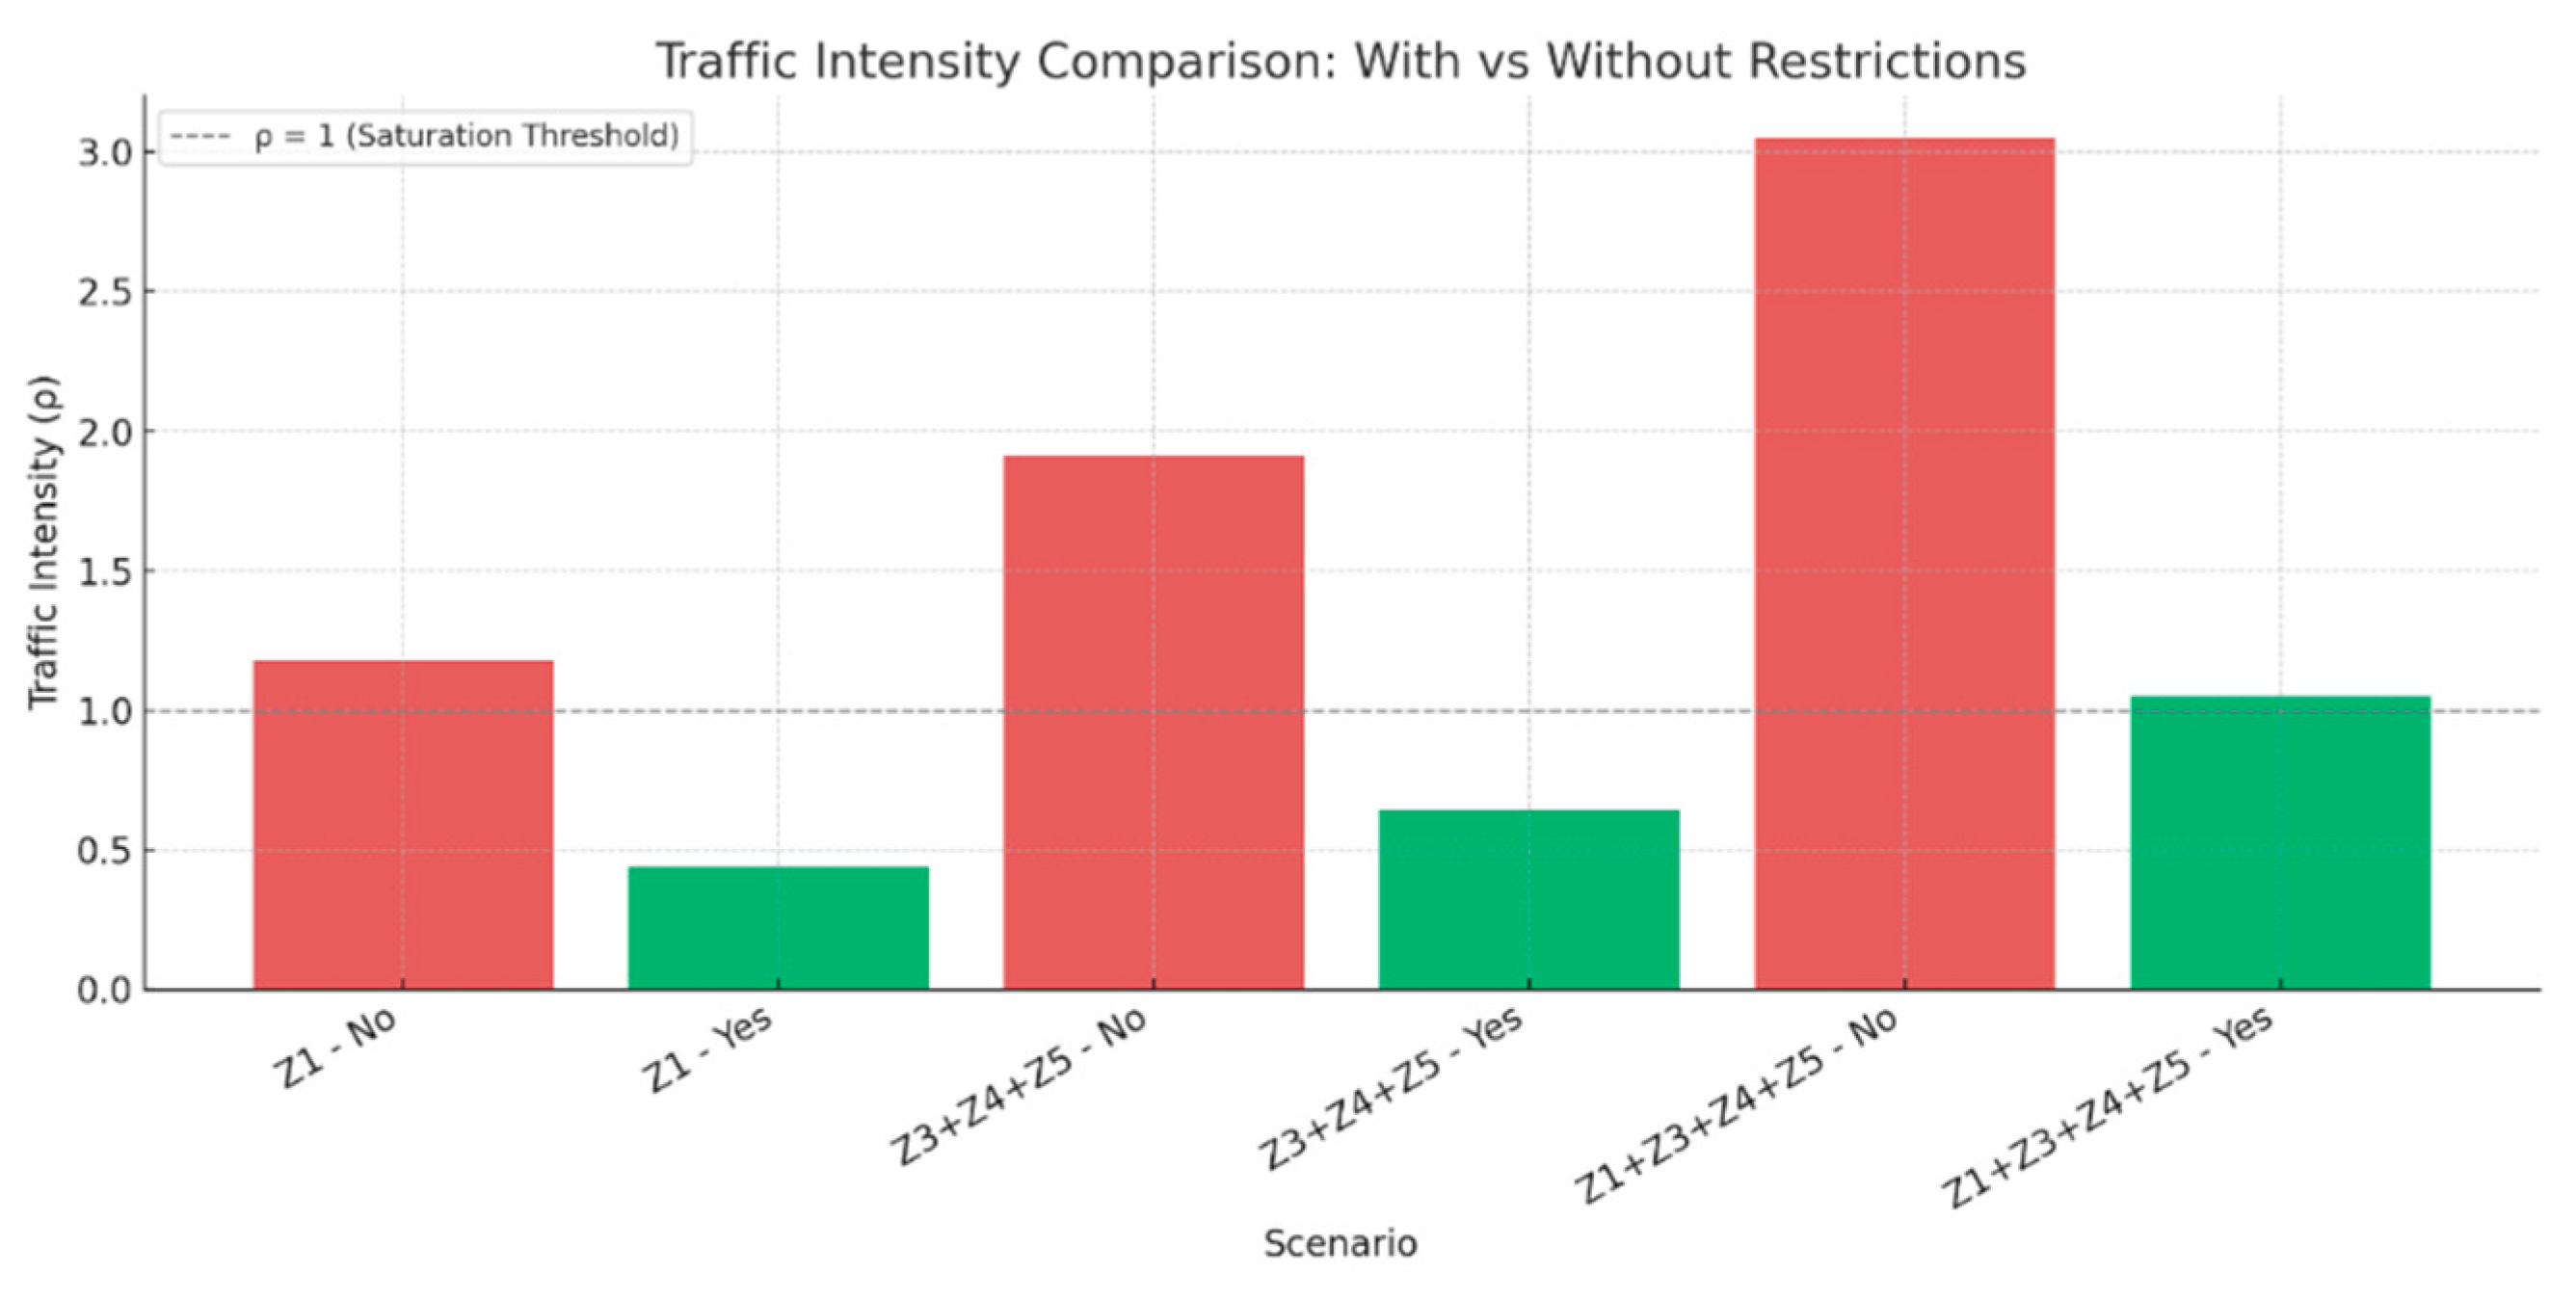
Figure 5.
Scatter Plot: Arrival Rate vs. Service Rate.

Figure 6.
Arrival vs Service Rate: With vs Without Restrictions.
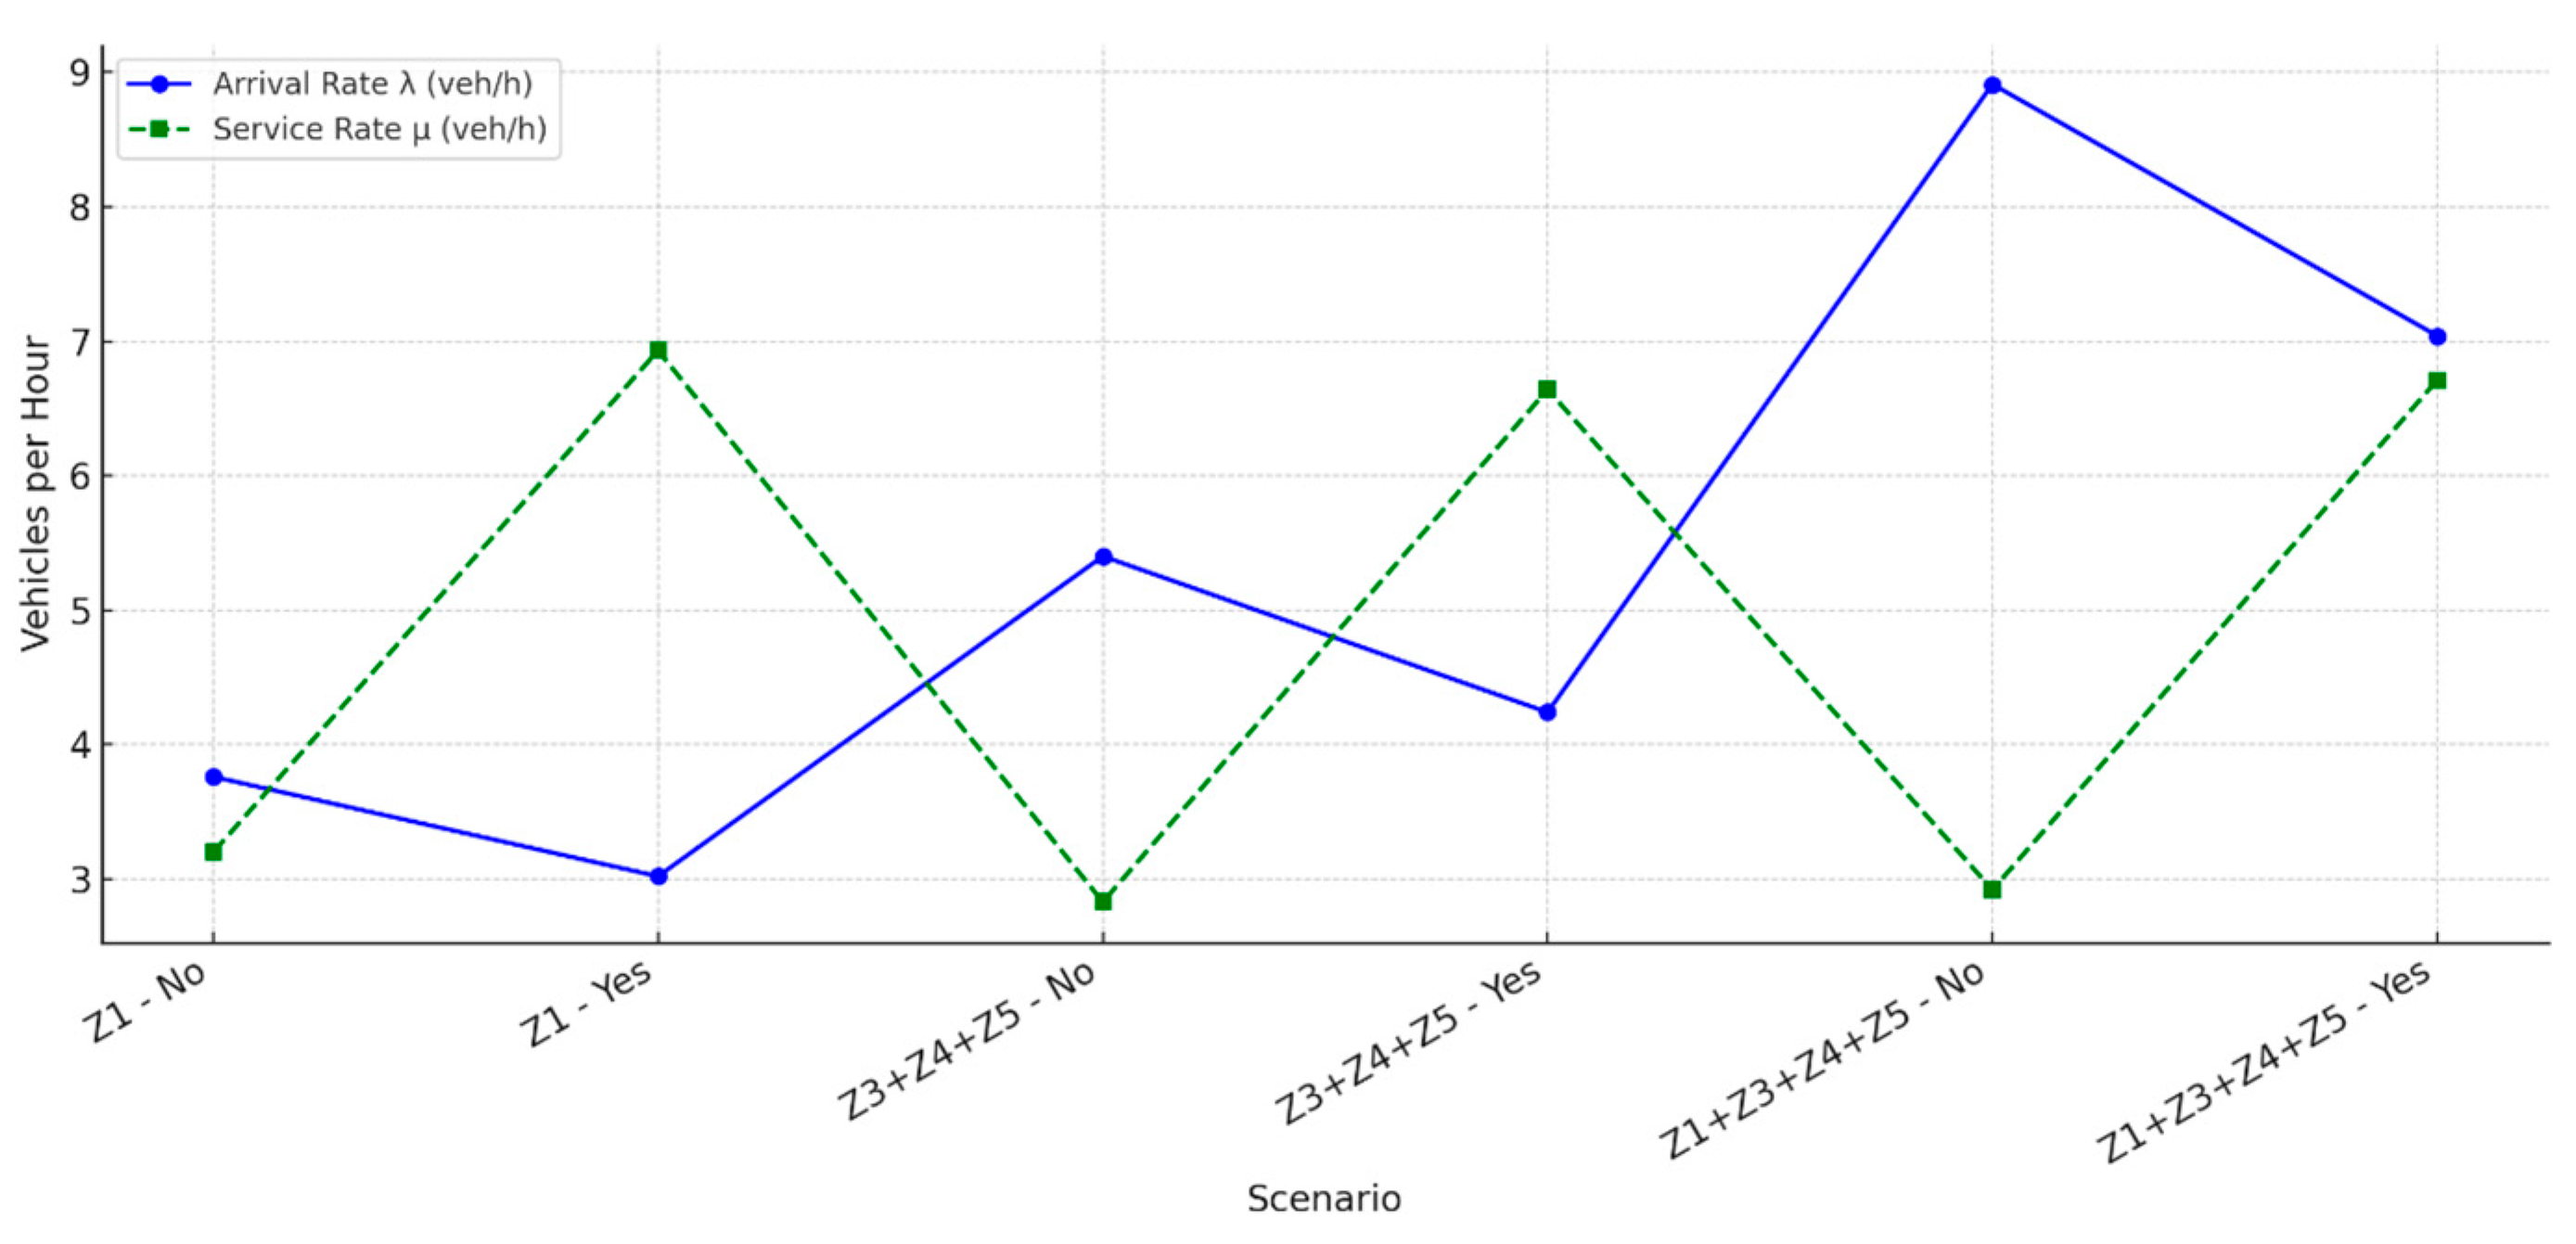
Figure 7.
Comparision of Total, Used and Saved Time per Scenario.
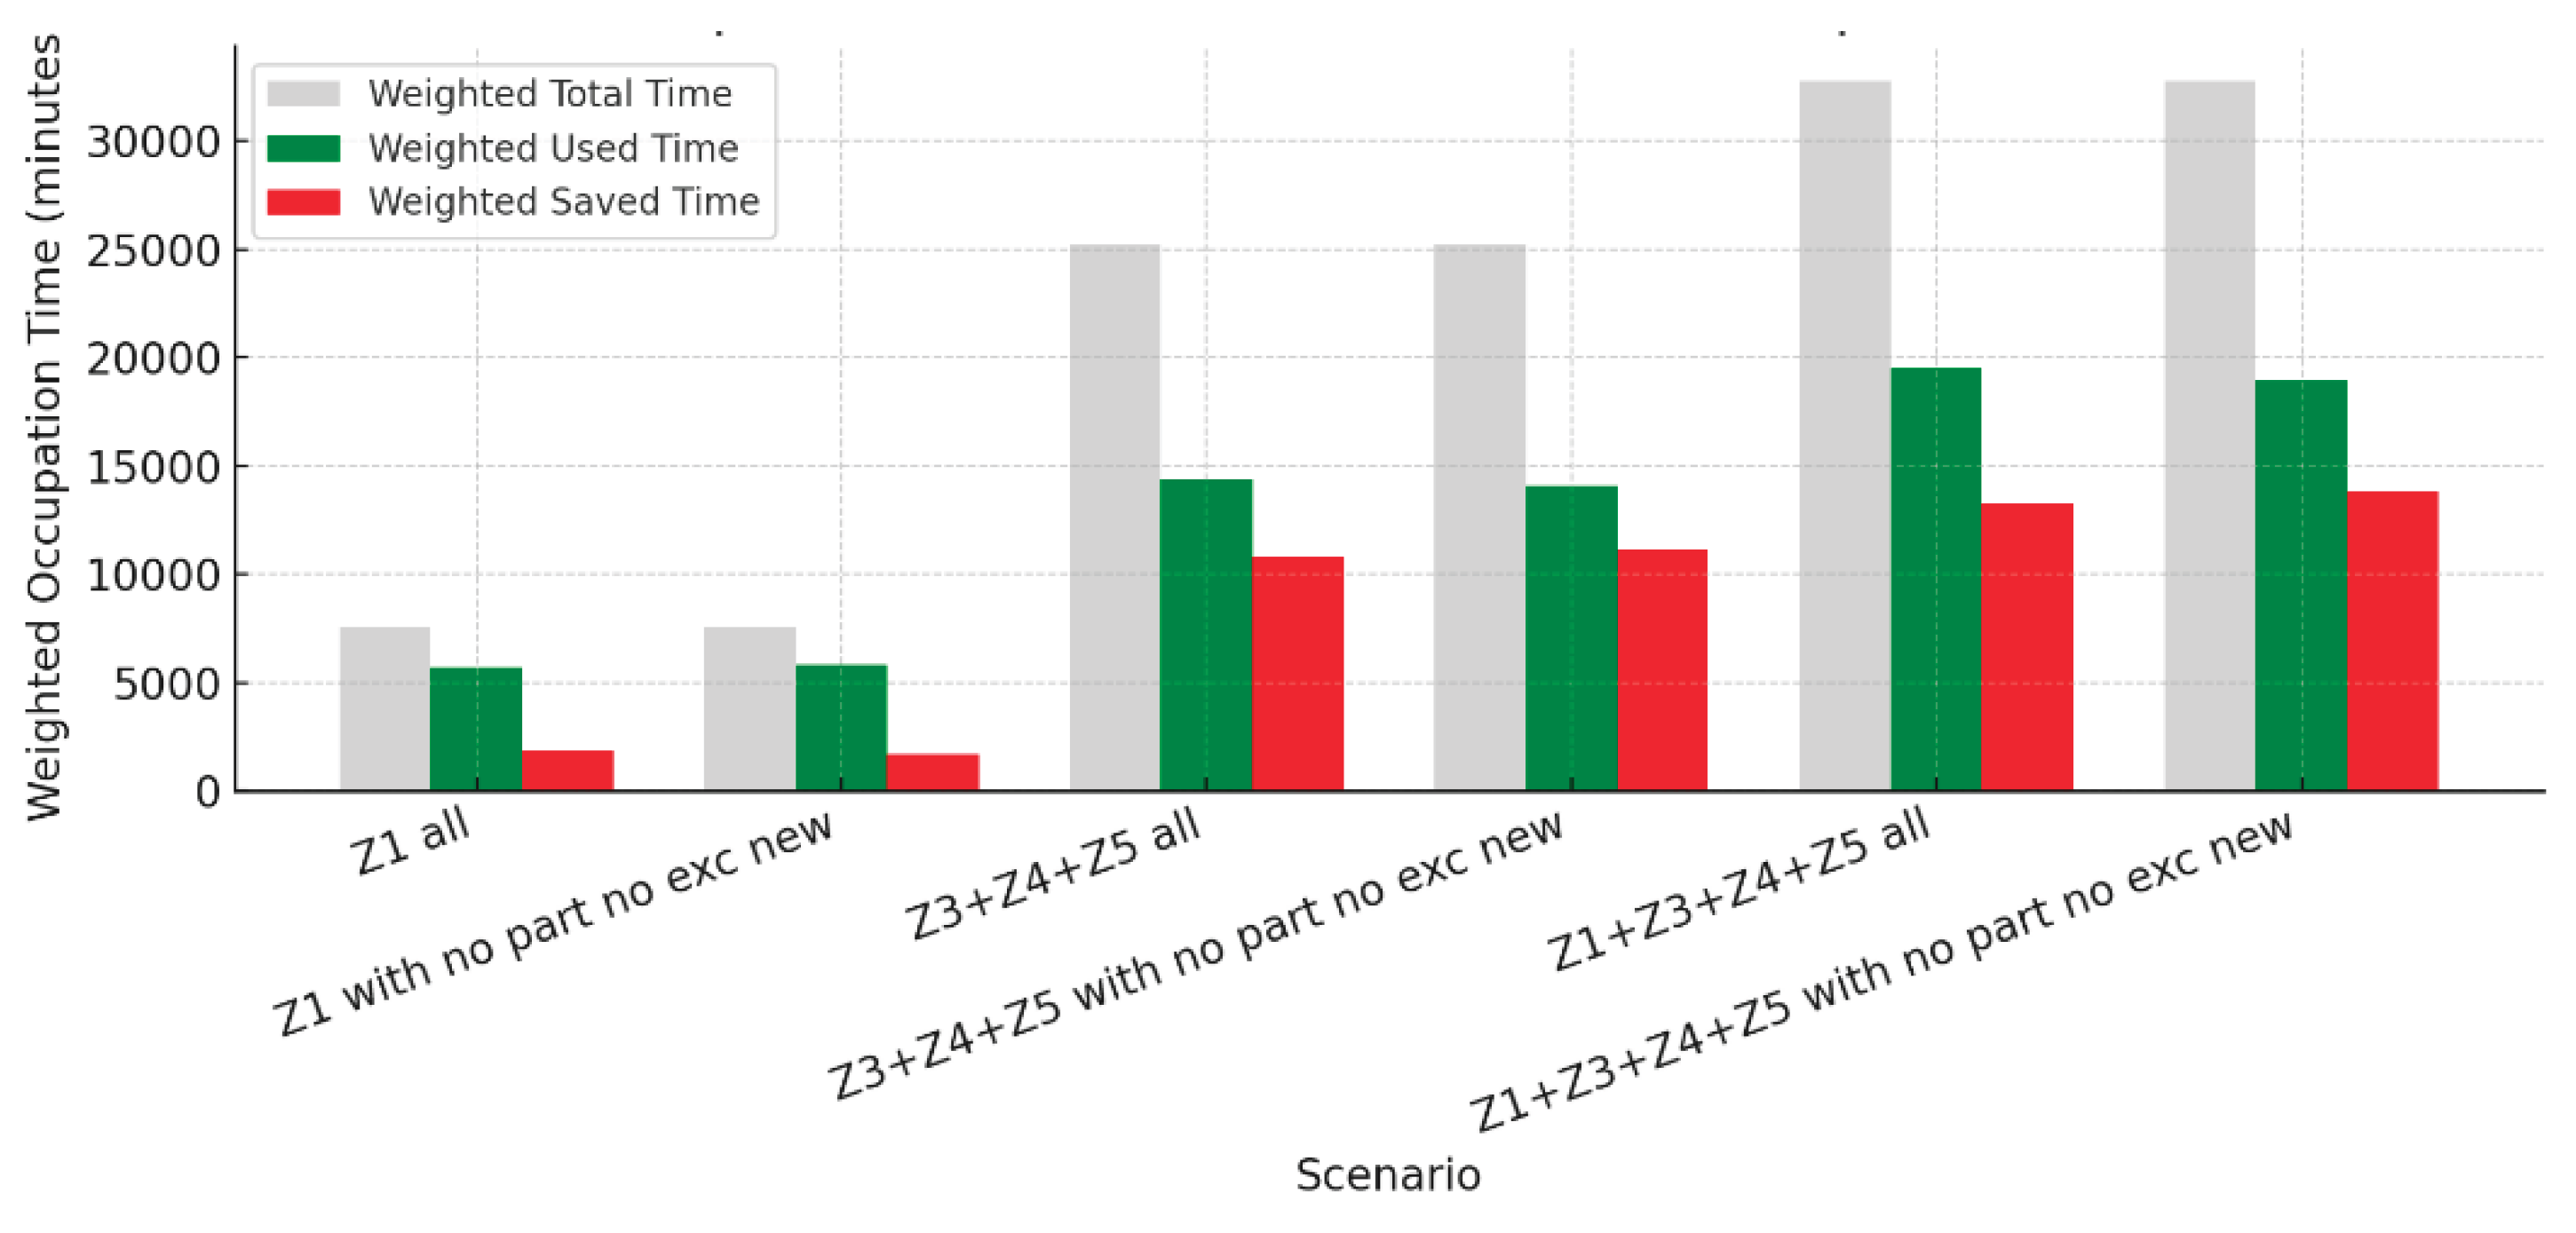
Table 1.
Detail of occupations by status during the period.
| Zone | Illegal exceeded | Illegal private vehicle | Legal LUZ | Total | |
| Zone 1 | 201 | 100 | 91 | 82 | 474 |
| Zone 3 | 166 | 122 | 124 | 412 | |
| Zone 4 | 8 | 89 | 39 | 51 | 187 |
| Zone 5 | 124 | 42 | 14 | 31 | 211 |
| Total | 482 | 436 | 310 | 354 | 1.582 |
Table 2.
Characteristics of each street and each zone.
| Zone | Lengh zone | Street width (lanes) | Parking Type | Reservation time | Reservation hours |
| Zone 1 | 13 | 1 with double width | Free | 9-12 / 14-17 | 6 |
| Zone 2 | 10 | 6 lanes | Regulated | 8-11 | 3 |
| Zone 3 | 18 | One line | Free | 7-12 / 14-17 | 8 |
| Zone 4 | 10 | One line | Free | 9-12 / 14-17 | 6 |
| Zone 5 | 8 | One line | Free | 9-12 / 14-17 | 6 |
Table 3.
Weighted occupancy time by vehicle type.
| Vehicle type | nº | % | Tp | Global |
| Light Truck 7.5 Tn | 21 | 1,66% | 13,80 | 0,23 |
| Chassis Cab 3.5 Tn | 148 | 11,70% | 11,23 | 1,31 |
| Large Volume Van | 94 | 7,43% | 10,83 | 0,80 |
| Small Van | 481 | 38,02% | 8,58 | 3,26 |
| Delivery Van | 521 | 41,19% | 9,08 | 3,74 |
|
Total |
1.265 |
9,35 |
Table 4.
Weighted times and estimated losses.
| Set of zones | Weighted T | Weighted T usage | % T usage | % Erlang loss | Estimated loss | Difference from actual |
| Sc 1: Z1 all | 7.560 | 5.717 | 75,62% | 56,76% | 269,06 | |
| Sc 2 aux: Z1 with no part no exc | 7.560 | 1.756 | 23,23% | 32,72% | 124,66 | |
| Sc 2: Z1 with no part no exc new | 7.560 | 5.844 | 77,31% | 32,72% | 124,66 | 99,97 |
| Sc 3: Z3+Z4+Z5 all | 25.200 | 14.394 | 57,12% | 65,65% | 531,79 | |
| Sc 4 aux: Z3+Z4+Z5 with no part no exc | 25.200 | 4.475 | 17,76% | 38,95% | 247,35 | |
| Sc 4: Z3+Z4+Z5 with no part no exc new | 25.200 | 14.067 | 55,82% | 38,95% | 247,35 | 673,69 |
| Sc 5: Z1+Z3+Z4+Z5 all | 32.760 | 19.515 | 59,57% | 75,29% | 967,42 | |
| Sc 6 aux: Z1+Z3+Z4+Z5 with no part no exc | 32.760 | 6.052 | 18,47% | 51,20% | 520,22 | |
| Sc 6: Z1+Z3+Z4+Z5 with no part no exc new | 32.760 | 18.926 | 57,77% | 51,20% | 520,22 | 580,81 |
Table 5.
Weighted time released and new capacity.
| Set of zones | Weighted time released | Additional vehicles | New capacity | Capacity increase | Increase in % |
| Sc 1: Z1 all | |||||
| Sc 2 aux: Z1 with no part no exc | 3.960 | 424 | 606 | 333 | 121,84% |
| Sc 2: Z1 with no part no exc new | |||||
| Sc 3: Z3+Z4+Z5 all | |||||
| Sc 4 aux: Z3+Z4+Z5 with no part no exc | 9.919 | 1.061 | 1.556 | 878 | 129,50% |
| Sc 4: Z3+Z4+Z5 with no part no exc new | |||||
| Sc 5: Z1+Z3+Z4+Z5 all | |||||
| Sc 6 aux: Z1+Z3+Z4+Z5 with no part no exc | 13.462 | 1.440 | 2.117 | 1.166 | 122,61% |
| Sc 6: Z1+Z3+Z4+Z5 with no part no exc new |
Disclaimer/Publisher’s Note: The statements, opinions and data contained in all publications are solely those of the individual author(s) and contributor(s) and not of MDPI and/or the editor(s). MDPI and/or the editor(s) disclaim responsibility for any injury to people or property resulting from any ideas, methods, instructions or products referred to in the content. |
© 2025 by the authors. Licensee MDPI, Basel, Switzerland. This article is an open access article distributed under the terms and conditions of the Creative Commons Attribution (CC BY) license (http://creativecommons.org/licenses/by/4.0/).
Copyright: This open access article is published under a Creative Commons CC BY 4.0 license, which permit the free download, distribution, and reuse, provided that the author and preprint are cited in any reuse.


