
Submitted:
18 November 2025
Posted:
20 November 2025
You are already at the latest version
Abstract
The universe is composed of many luminous planets distributed in the universe. The surface temperatures of these luminous planets are different, but they all radiate energy to the universe with radiation waves of different wavelengths. These radiation waves of different wavelengths will form a red shift when transmitted over long distances in the universe. These red-shifted radiation waves converge to any place in the universe. On a point object, the temperature of this point in the universe will be formed. This article assumes that the planets in the universe are evenly distributed, and uses data simulation methods to calculate the radiation amounts of different wavelengths of various planets in the universe that converge at the observation point. Then, the different types of radiation amounts are added according to different wavelengths to find the peak wavelength, which can be converted into the blackbody temperature at the observation point. It can be seen from the simulation calculations in this article that the temperature in the universe is mainly determined by B-type stars.
Keywords:
red shift law
; Stefan-Boltzmann law
; Planck black body radiation law
; Wien displacement law
1. Introduction
The universe is
composed of galaxies and space. Galaxies are dominated by stars. Different
stars emit light to different degrees and have different surface temperatures.
Generally, heat is transferred from high temperature to low temperature. There
are three basic ways of heat transfer: heat conduction, heat convection and
heat radiation. Thermal conduction is the process in which heat is transferred
from a high-temperature area to a low-temperature area through the collision of
microscopic particles within an object. It mainly occurs in solids. Thermal
convection is the process of transferring heat through the macroscopic motion
of a fluid (liquid or gas). Thermal radiation is the process by which objects
emit energy in the form of electromagnetic waves. All objects with a
temperature higher than absolute zero will produce thermal radiation. The
universe is almost a vacuum, so the heat of the planet can only spread in the
universe through thermal radiation. The density of particles in the universe is
extremely low and lacks material carriers, making it impossible to effectively
store heat. Therefore, the temperature of the universe is close to absolute
zero. On the other hand, heat is basically not lost during radiation
transmission. The essence of temperature is a reflection of the intensity of
thermal motion of molecules inside an object. The more intense the molecular
motion (the greater the average kinetic energy), the higher the temperature of
the object. In theory, when the thermal motion of molecules stops, the
temperature is the lowest temperature, absolute zero, 0K (-273.15°C).
There are more
stars in the universe than sand on the ground. In order to analyze the
performance of different stars, scientists classify stars into different types
such as O, B, A, F, G, K, M, etc. based on their luminescence. This article
assumes that different types of planets in the universe are evenly distributed,
calculates the radiation of different wavelengths from the planets in the
universe to the observation point, finds the peak wavelength of the radiation
wave at the observation point, and calculates the temperature of the object at
the observation point.
2. Hubble’s Law and Red Shift Law
The British
astronomer Huggins first measured the red shift of Sirius in 1868. In 1912, the
American astronomer Vesto Thriver observed the spectra of 41 galaxies and found
that the spectra of 36 of them were red shifted. From 1920 to 1929, Hubble used
the 2.5-meter telescope at Mount Wilson Observatory to obtain the spectra of 46
galaxies, of which only 24 had calculated distances. Based on the Doppler
effect [1], Hubble regarded this red shift as the result of the radial retrograde
motion of the galaxy. From this, Hubble concluded that the radial retrograde
velocity of the planet is roughly linearly proportional to the distance:
Among them, v
is the recession speed, d is the distance of the galaxy, and H0 is the Hubble
constant. This is the famous Hubble's law [2].
Since Hubble's
law was proposed, there has been controversy about the cause of red shift. We
eliminate the dispute and directly determine the relationship between red shift
and distance, forming the current red shift law [3]. Nowadays,
astronomy uses red shift to determine the distance of a planet using the red
shift law. According to Hubble's law and the definition of red shift, the red
shift z is:
The European
Space Agency announced on March 21, 2013 that the value of the Hubble constant [4] based on the
measurement results of the Planck satellite is 67.80±0.77 (km/s)/Mpc. When the
wavelength λ of the measurement end is determined, we can calculate the
wavelength formula of the far end λ0 as:
3. Average Mass, Size and Brightness of Planets in the Universe
The star with the most contact with people in the universe is the sun
[5]: the mass of the sun is 1.9891×10^30kg, the radius is 6.955×10^8m, and
the luminosity (LS) is about 3.827×10^26Js⁻¹. The core difference here between
luminosity (photometry) and total radiant power (radiography) is that
luminosity is a measure of visible light energy perceived by the human eye,
while total radiant power is an objective measure of electromagnetic radiation
energy, covering the entire electromagnetic spectrum.
Planets in the universe should generally be evenly distributed.
Table 1 is a statistical table of star types and performance
[6]. The first column in the table is the planet type.

Table 1.
Stellar type and performance statistics.
| Type | Temperature | Seen Color | Mass (M⊙) | Radius (R⊙) |
brightness (L⊙) |
Main sequence star proportion % |
Mass subtotal (M⊙) | Mass proportion | M%*L |
| O | 30,000-60,000K | blue | 64 | 16 | 1400000 | 0.00003 | 0.00192 | 3.31083E-05 | 46.352 |
| B | 10,000-30,000K | blue white | 18 | 7 | 20000 | 0.13 | 2.34 | 0.040350746 | 807.015 |
| A | 7,500-10,000K | White | 3.1 | 2.1 | 40 | 0.6 | 1.86 | 0.03207367 | 1.283 |
| F | 6000-7500K | White | 1.7 | 1.4 | 6 | 3 | 5.1 | 0.087943934 | 0.528 |
| G | 5000-6000K | Light yellowish white |
1.1 | 1.1 | 1.2 | 7.6 | 8.36 | 0.144159077 | 0.173 |
| K | 3500-5000K | yellow-orange | 0.8 | 0.9 | 0.4 | 12.1 | 9.68 | 0.166921036 | 0.067 |
| M | 2000-3500K | orange red | 0.4 | 0.5 | 0.04 | 76.45 | 30.58 | 0.527318728 | 0.021 |
| total | 99.88003 | 57.92192 | 0.9988003 |
The second column is the surface temperature of the planet, the third column is the color of the planet, the fourth column is the mass of the planet, the fifth column is the radius of the planet, the sixth column is the brightness of the planet, the seventh column is the proportion of planet types, the eighth column is the product of the mass and proportion of various planets, and the ninth column is the mass proportion of each type of planet, where 3.31083E-05 is the common expression of the data in the table, the same as 3.31083×10^(-05), the same below. The last column is the product of the planet's mass ratio and brightness. It can be seen that the value of B-type planets is much higher than that of other types of planets.
4. Stefan-Boltzmann Law
The Stefan-Boltzmann law [7] is a law in thermodynamics that describes the relationship between blackbody radiation power and temperature. It was proposed by Joseph Stefan and Ludwig Boltzmann. This law states that the power radiated per unit area of a black body surface is proportional to the fourth power of its thermodynamic temperature. The mathematical expression is:
The unit of radiance j* is J/(s·m^2), σ is the Stefan-Boltzmann constant with a value of 5.670373×10^-8W/(m²·K⁴), the unit of absolute temperature T is Kelvin, ε is the radiation coefficient, and the absolute blackbody value is 1.
The radiance in the Stefan-Boltzmann law specifically refers to the radiant power per unit area of the planet's surface. When we usually say that the brightness of a planet is several times that of the sun, it refers to the total radiation amount (i.e. luminosity), not the radiation amount per unit area of the surface. If we need to emphasize the radiation amount per unit area (such as surface temperature or brightness), we will clearly use terms such as "surface radiation power" or "effective temperature".
From the above analysis, it can be seen that the radiance corresponding to the average brightness of the stars in the universe is:
The equivalent planet surface temperature derived from the Stefan-Boltzmann law is:
5. Planck’s Black Body Radiation Law
Planck's formula [8] is a physical law proposed by German physicist Max Planck in 1900 to describe the energy distribution of blackbody radiation. This formula is based on the assumption of energy quantization, proposing that electromagnetic radiation energy is transferred in the form of discrete "energy quanta" (hν), and deriving a mathematical expression for the distribution of radiation field energy density with wavelength. As the wavelength approaches shortwave or longwave, this formula approximates Wien's formula and Rayleigh-Jeans formula respectively. Figure 1 is a typical Planck blackbody radiation diagram.
Planck’s blackbody radiation formula is as follows:
The meanings and units of each physical quantity in the formula are as shown in Table 2:
In order to calculate the radiation amount at the corresponding wavelength of the equivalent planet's radiation end (far end) from the wavelength given by the observation end, the redshift formula is brought into the Planck blackbody radiation formula:
From this, the radiation intensity when the distant planet emits this wavelength can be calculated from the wavelength set at the observation end.
6. Distribution and Temperature Calculation of Equivalent Planets in the Universe
The average density of ordinary matter in the universe [9] is approximately ρu=4.7×10^-28kg/m³. For different types of planets, their proportions of mass in the universe are different, so the material density of O-type planets in the universe is:
The other types of planets have similar material densities.
The universe is composed of many luminous planets and spaces. The ordinary matter in the universe is equivalent to the same planet with the same mass, size, and luminous brightness. The distribution of these planets in the universe is shown in Figure 2.
The center point in the figure is the observation point where we want to calculate the temperature. The maximum distance we calculate is dmax. We divide the distance evenly into n equal parts, and the distance of each equal part is Δd:
The radiation of each equivalent planet is calculated according to the Planck black body radiation formula to calculate the radiation of different wavelengths. The radiation in the universe attenuates according to the square of the distance. In this way, the radiation of the first layer of equivalent planets to the observation point is:
In the formula, 4πrue^2 is the surface area of the first layer of spheres, 4πrue^2/πrue^2 is the number of distributable planets in the first layer, uλ1 is the radiation intensity of the radiation wave with wavelength λ1, and uλ1/rue^2 is the radiation intensity converted to the observation point.
The angle of the planet behind the first layer of occlusion is:
In the formula, 4πrue^2 is the surface area of the first layer of spheres, 4πrue^2/πrue^2 is the number of distributable planets in the first layer, πrus^2 is the actual occupied area of a single planet, and 4πrue^2/πrue^2×4πrue^2/πrue^2 is the ratio of the actual occupied area of all planets to the total area of the current layer of spheres.
The radiance of all equivalent planets in the second layer to the observation point is:
In the formula, 4π-rus^2/rue^2 is the planet's distributable cone angle (viewing angle) after deducting the first layer of planet occlusion cone angle (viewing angle).
The angle of the second layer blocking the planet behind is:
The radiance of all equivalent planets in the nth layer radiating to the observation point is:
The angle of the planet behind the nth layer of occlusion is:
It can be seen that the cone angle (viewing angle) of the planet radiation behind each layer of occlusion is the same:
In actual simulation, the maximum simulated distance dmax is 1.880E+30m, and the total occupied viewing angle is:
Here, the occlusion viewing angle of each layer is <<4π. Even at the farthest distance, the total occlusion viewing angle is far less than 4π, so the viewing angle occlusion problem can be ignored in actual calculations.
In actual measurement, the universe is always divided into several equal parts outward from the measurement point, as shown in Figure 3. Here we do not consider the problem of planets spanning several viewing angles, because it can easily cause uneven temperatures in different directions. According to the mass of different types of typical planets and the distribution density of different types of materials, the size V of the space occupied by the equivalent planet can be calculated:
In order to facilitate the calculation within a square pyramid, we consider the equivalent planet as a cube, so that the side length lue of the cube is:
Suppose the viewing angle of the square cone is α, divide the square cone into n equal parts according to the distance, then the volume of the first layer is
In the formula, d1α is the length of the base of the square pyramid.
The number of planets in the first layer is:
The first layer can represent the place where the unified distance de1 of all planets is half the mass of all planets. In the case of uniform density, it can also be said to be half the volume:
Simplified to:
The volume of the second layer is:
The number of planets in the second layer is:
The second layer can represent a place where the unified distance de2 of all planets is half the mass. In the case of uniform density, it can also be said that in a place with half the volume, the unified distance de2 of all planets on the second layer is consistent with:
Simplified to:
The volume of the nth layer is:
The number of planets in the nth layer is:
The nth layer represents the unified distance den of all planets as:
For different wavelengths, and considering the representative distances of different layers within the square pyramid and the number of planets contained in each layer, the Planck formula for the total radiation amount of a single layer is:
In the formula, λj is the different wavelengths, di is the representative distance of different layers, and ni is the number of planets in each layer.
Table 3 is a cumulative calculation table of radiation amounts at different wavelengths at observation points in the universe.
The first column in the table is some constants, the second column is the actual distance, the unit is m, the third column is the representative distance that can represent all the planets in this layer, the fourth column is the number of planets in the current layer, the second row from the fifth column to the twelfth column is the wavelength, the unit is m, the second row and below are the radiation amounts of different wavelengths and different distances collected to the observation center, and their values are determined by equation (32). In the first column, ms is the mass of the sun, the value is 1.989E+30 (kg), rs is the radius of the sun, the value is 6.955E+08 (m), Ls is the brightness of the sun, the value is 3.827E+26 (J/ s), km is the ratio of the mass of this type of planet to the mass of the sun in the universe, kr is the ratio of the radius of this type of planet to the radius of the sun, kL is the ratio of the brightness of this type of planet to the brightness of the sun, mu is the mass of this type of planet, ru s is the radius of this type of planet, Lus is the brightness of this type of planet, j* is the radiance per unit area of the equivalent planet surface, σ is the Stefan-Boltzmann constant, the value is 5.67037E-08(W/m^2T^4 ), T is the surface temperature of this type of planet, ρu is the density of ordinary matter in the universe, the value is 4.7E-28 (kg/m^3), kρ is the mass ratio of this type of planet in the universe, ρui (kg/m^3) is the The material density of this type of planet in the universe, lue(m) is the side length of the equivalent space cube occupied by this type of planet, Δθ is the minimum resolvable viewing angle of the measuring square cone, the value here is 1°, the table has been converted into radians, dmax (m) is the maximum distance of the simulation, the value is uniformly 1.880E+30m, N is the number of layers separated by the maximum distance, here is divided into 10000 layers, the above table is just a partial screenshot, Δd is the distance of each layer, h is Planck's constant, the value is 6.626E-34 (J·s), c is the speed of light, the value is 2.998E+08 (m/s), H0 is the Hubble constant, take 67.8km/sMpc, here 1Mpc=3.086E+22 ( m), the actual data has been converted into meters, its value is 2.197E-18 (/s), e is a natural constant, its value is 2.718, k is Boltzmann's constant, its value is 1.381E-23 (J/K). The table data has 10,000 rows, and the last row is the accumulation of radiation at different wavelengths at the observation point, in unit (J/s).
7. Wien’s Displacement Law
In 1893, German physicist Wilhelm Wien proposed that the product of the temperature T of a black body and the peak wavelength λ corresponding to the maximum value of its radiation power is a constant. This is Wien's displacement law [10]. Its mathematical expression is
Among them, b=0.002897m·K is called Wien’s constant. Wien's displacement law states that when the temperature increases, the peak wavelength of radiation moves toward short wavelength. Conversely, the blackbody temperature can also be calculated based on the peak wavelength of the radiation:
In the above data simulation, data calculations were performed for different types of planets, and then accumulated according to different wavelengths. The results are as follows:
Table 4.
Radiation signal statistical table of different models.
| λ0(m) | 0.0006 | 0.0007 | 0.0008 | 0.0009 | 0.001 | 0.0011 | 0.0012 | 0.0013 | dmax |
| O | 2.065E-27 | 1.879E-27 | 1.639E-27 | 1.395E-27 | 1.172E-27 | 9.784E-28 | 8.155E-28 | 6.805E-28 | 1.880E+30 |
| B | 2.734E-25 | 3.105E-25 | 3.379E-25 | 3.539E-25 | 3.588E-25 | 3.541E-25 | 3.422E-25 | 3.252E-25 | b(mk) |
| A | 4.233E-27 | 4.939E-27 | 5.644E-27 | 6.350E-27 | 7.055E-27 | 7.759E-27 | 8.459E-27 | 9.151E-27 | 0.002897 |
| F | 4.150E-27 | 4.842E-27 | 5.534E-27 | 6.225E-27 | 6.917E-27 | 7.609E-27 | 8.300E-27 | 8.991E-27 | T(k) |
| G | 1.939E-27 | 2.262E-27 | 2.585E-27 | 2.908E-27 | 3.231E-27 | 3.554E-27 | 3.877E-27 | 4.200E-27 | 2.897 |
| K | 1.085E-27 | 1.265E-27 | 1.446E-27 | 1.627E-27 | 1.808E-27 | 1.988E-27 | 2.169E-27 | 2.350E-27 | |
| M | 1.264E-27 | 1.474E-27 | 1.685E-27 | 1.896E-27 | 2.106E-27 | 2.317E-27 | 2.527E-27 | 2.738E-27 | |
| total | 2.881E-25 | 3.272E-25 | 3.565E-25 | 3.743E-25 | 3.811E-25 | 3.783E-25 | 3.683E-25 | 3.533E-25 |
The first row in the table is the wavelength, the first row is the planet type, the last row is the total of the radiation amount of different types of planets at different wavelengths, the last row is several constants, dmax is the maximum distance of the simulation, b (mk) is the Wien constant, and T (k) is the blackbody temperature. It can be seen that the peak wavelength of the total radiation can be 1mm, and the corresponding blackbody temperature can be as low as 2.897k. From the perspective of planet type, the observed temperature of the universe is mainly determined by B-type planets. It is two orders of magnitude higher than the cumulative amplitude of other types of planets at the same wavelength. This corresponds to the ratio of the product of the mass proportion and brightness of B-type planets in the star type and performance statistics table.
8. Influencing Factors
8.1. Simulate Maximum Distance dmax
dmax is the maximum distance simulated. If the value of dmax is large, the maximum value of the cumulative wavelength amplitude (peak wavelength) of the observation point will move in the direction of longer wavelength. If the value of dmax is small, the maximum value of the cumulative wavelength amplitude of the observation point (peak wavelength) will move in the direction of shorter wavelength. The simulated maximum distance dmax actually represents the size of the universe centered on the observation point. The above value is 1.880E+30m, and 1 light year = 9.461E+15m. dmax is calculated in light years as 1.9871E+14 light years, which is 198.7105 billion light years. This value is normal in the static universe model.
In 1687, Isaac Newton proposed the law of universal gravitation in "Mathematical Principles of Natural Philosophy", proving that the earth and other planets revolve around the sun in elliptical orbits. Newton believed that the universe was static, infinitely large, uniform, and had infinite time. German philosopher Olbers proposed in 1823 that if the universe was infinite and stationary, then every ray of light would end at a star, making the night sky as bright as the sun. The traditional view is that Olbers' Paradox [11] proves that the age of the universe is finite and that the universe is not static. The article "A Naive Analysis of Olbers' Paradox" [12] believes that the real reason for the formation of Olbers' Paradox is that within the human eye's viewing angle, the sum of the visual brightness of an infinite number of planets at an infinite distance has an integral upper limit, and this upper limit is far lower than the lower limit of human eye viewing angle perception. Since light is a vector, the brightness at different resolution angles cannot be superimposed on each other to enhance each other. Only planets whose brightness at a single resolution angle exceeds the lower limit of human vision perception can be seen by us. This conclusion is consistent with people's intuitive experience of observing the dark night. This article believes that Olbers' paradox has nothing to do with whether the universe is finite, whether the universe is expanding, the red shift of galaxies, and the age of galaxies. It has little to do with the obstruction and absorption of light by cosmic dust and debris. Newton's static universe model holds that the universe is static, neither expanding nor contracting.
Universe models based on expansion include steady state, big bang and other universe models. The main basis for the expansion of the universe [13] are: a. Friedman’s FLRW metric and Friedman equation derived from the field equations of Einstein’s general relativity show that the universe is in an expanding state, b. Hubble’s law.
The article "Questions on the Expansion of the Universe Deduced from Einstein's Field Equations" [14] states that: From Newton's universal gravitation, it can be known that the gravitational force between two planets is inversely proportional to the square of the distance. When the distance is large, the gravitational force between the two planets will become very small. At this time, it can be considered that the two planets are no longer affected by each other's gravity. Einstein's general theory of relativity believes that a massive planet can bend the space-time around it, and the degree of curvature decreases with distance. When the distance is large, the degree of the planet's curvature of its space-time will also become very small, or even negligible. For a large galaxy or galaxy cluster, there are many planets in it. Their gravitational pull on the edge planets of the galaxy or galaxy cluster varies with the distance. For most planets, because the distance is quite far, it has no impact on the edge planets of the galaxy or galaxy cluster. It can also be said that most stars in the galaxy or galaxy cluster The ball has no impact on the space-time where its edge planets are located. Only a few planets that are closer to the edge planets of the galaxy or galaxy cluster will affect (drag) them. Therefore, we cannot equate the distribution of all the planets in the galaxy or galaxy cluster to the center of the galaxy or galaxy cluster to analyze its impact on the edge planets of the galaxy or galaxy cluster. For the entire universe, we are currently unable to determine whether its size is finite or infinite. Even if we regard it as a finite sphere, we cannot equate the planets in the entire universe to the center of the universe to analyze its impact on the edge planets (space-time) of the universe. Moreover, the edge planets of the universe move as a whole together with the equivalent planets in the center of the universe. Therefore, the results of the expansion of the universe cannot be derived from Einstein's field equations. We know that the field equations of Einstein's general theory of relativity evolved from the bending of space-time around massive stars. This article believes that the field equations of Einstein's general theory of relativity are only suitable for the calculation of the curvature of the surrounding space-time by specific stars. They are not applicable to the calculation of the impact of galaxies or galaxy clusters on the surrounding space-time, let alone the calculation of the evolution of the entire universe.
The main observational evidence of the expansion of the universe is the phenomenon of galaxy redshift: in 1929, Hubble discovered through observations that the spectra of almost all distant galaxies were shifted toward red light (i.e., redshift). The mainstream view is that this is because the galaxy is far away from the earth, causing the light waves to be elongated, which is consistent with the principle of the Doppler effect. The farther a galaxy is from the earth, the more obvious the red shift phenomenon is. The regression speed is linearly related to the distance, which directly proves that the universe is expanding. There is a very loose logical error in this reasoning: the retrogression of galaxies can produce red shifts, but red shifts are not necessarily caused by the retrogression of galaxies. Just like an apple orchard with A1, A2, A3, A4, A5, ..., A20 apple trees, each apple tree can produce apples, but we cannot say that these apples are all produced by a certain apple tree (such as A1). That is to say, there are many reasons in the universe that can produce red shifts. The retrogression of galaxies must produce red shifts, but conversely, red shifts are not necessarily caused by the retrogression of galaxies. Hubble's imprecision lies in the fact that he did not exclude other reasons and determined that the red shift of the galaxy spectrum is caused by the retrogression of the planet. Since the publication of Hubble's law, many scholars have proposed different red shift theories. In 1929, Fritz Zwicki used the loss of energy of photons when propagating through space to explain the observed red shift. Louis Mamet, an adjunct professor of physics and astronomy at York University in Toronto, Canada, published in January 2018: A review of 59 mechanisms of spectral red shift in astrophysics [15], which summarized various causes of Hubble red shift, of which Doppler red shift is only one. Therefore, we cannot conclude from Hubble redshift that galaxies are regressing and the universe is expanding.
The article "Hubble's Law, Universe Expansion Conflicts with Observational Results of Pulsar Time Stability" [16], calculated the pulsar time stability caused by Hubble's law. According to Hubble's law, the 10-year change value of the pulsar period should be 10^- On the order of 10, the actual observed value of pulsar time stability is on the order of 10^-15, which is more than 5 orders of magnitude smaller than the change in pulsar period inferred by Hubble's law, indicating that the galaxy is not regressing as Hubble inferred, and the universe is not expanding.
General relativity believes that the degree of curvature of space-time is mainly related to the mass and density of the central planet. The greater the mass, the more significant the curvature of space-time around it is. Although high-density celestial bodies (such as neutron stars) are small in size, their mass is concentrated in a smaller space, causing the surface gravitational acceleration to be much greater than that of lower-density celestial bodies (such as stars). Therefore, high-density celestial bodies have a more significant curvature of space and time around them, so it should be easier for larger galaxies to form around neutron stars. Actual observations show that no large galaxies centered on neutron stars have been found in the universe [17].
"280 million years after the birth of the universe, the Webb Telescope actually photographed galaxies that should not exist."[18] Since its launch at the end of 2021, the James Webb Space Telescope has penetrated the dust of the universe with its infrared eyes, pushing the limits of human observation to hundreds of millions of years after the Big Bang. In just a few years, it observed that mature galaxies that should have formed only after billions of years had quietly bloomed when the universe had just passed three percent of its lifetime.
According to the mainstream Λ-cold dark matter model, about 380,000 years after the Big Bang, neutral atoms began to gather, and the universe entered a long "dark age." Under the gravitational pull of dark matter, it took hundreds of millions of years for the gas to gradually collapse and give birth to the first generation of stars and galaxies. This theory is like the "standard answer" to the evolution of the universe and has been recognized by the academic community for decades. However, the data returned by the Webb Telescope shows that when the universe was only about 500 million years old, galaxies with a mass comparable to the Milky Way and complete structures had already appeared. They were quietly suspended in the early universe, as if silently questioning our inherent understanding of the evolution of the universe.
Since scientific observations began in 2022, the number of early galaxies discovered by the Webb Telescope far exceeds astronomers' expectations. It captures galaxies with redshift values exceeding 10, such as GN-z11, whose redshift value reaches 11.09, corresponding to the age of the universe is only about 400 million years; and the MoM-z14 galaxy, whose redshift value soars to 14.44, indicating its birth 280 million years after the Big Bang - at this point in time, the universe was still in its "infancy", and even the first generation of stars should have just begun to shine. However, this galaxy has already shown an astonishing brightness, suggesting that violent star formation activities are taking place within it.
Even more astonishing are the early galaxies with mature structures. When the universe was about 500 million years old, the mass of the ZF-UDS-7329 galaxy reached 10 billion times that of the sun, and star formation activity had basically stopped and entered a "quiet state." You must know that according to traditional theory, galaxies require at least billions of years of evolution from formation to cessation of stellar activity; there is also a giant galaxy chain known as the "cosmic vine", which connected 20 galaxies and spanned 13 million light-years when the universe was only 2 billion years old. Such a scale should have only appeared 5 billion years after the birth of the universe. At a redshift of 7.88, the Webb Telescope also confirmed a primordial galaxy cluster through spectral analysis, with seven galaxies crowded within a diameter of 60 kiloparsecs. The density is 20 times the average density of the universe, and the mass of its dark matter halo exceeds 40 billion times that of the sun. These data continue to impact the boundaries of existing theories.
In June 2025, Alicia Wang, a professor of astronomy at the California Institute of Technology, led a team to analyze data from the Webb Telescope and found that in the first billion years after the Big Bang, the formation rate and number of galaxies far exceeded the predictions of current mainstream models. Specifically, in the range of redshift 5 to 11, the number density of galaxies is about 10 times higher than predicted by the Λ-cold dark matter model - this means that a large number of galaxy cluster structures have been formed in the early universe, which directly conflicts with the hierarchical structure theory of "small galaxies gradually merge into large galaxies" in the standard model.
Not only were these early galaxies numerous in number, but their mass and evolutionary state were also "abnormal." The Webb-CEERS-93316 galaxy was formed about 600 million years after the Big Bang, but its mass reaches 50 billion times that of the sun, which is equivalent to the combined mass of 50 galaxies. Although the MoM-z14 galaxy is compact in size, it is extremely bright. Astronomers have used light to Spectral analysis found that its internal star formation efficiency is extremely high, converting almost all the surrounding gas and dust into stars. However, at such an early stage of the universe, these gases and dust, which are the "raw materials" for stars, should have been slowly gathering, and there was no time to form a star group of this size.
Even more complex is the chemical makeup of these galaxies. Spectroscopic analysis of galaxies shows that they contain a large amount of heavy elements such as carbon and oxygen, and these elements can only be formed through nuclear fusion inside stars, and are spread into interstellar space in the form of supernova explosions when stars die. This means that when the universe was only 280 million years old, it had already gone through the "birth-death" cycle of multiple generations of stars - the first generation of stars formed, glowed, exploded, and spread heavy elements; the second generation of stars formed based on heavy elements and then went through the same process... Such a cycle would take at least billions of years, but the early universe did not have such a long time window.
Some early galaxies also exhibit a disk-like structure and orderly rotation similar to the Milky Way, such as galaxies known as "cosmic vineyards." When the research team compared its observation data with the current most advanced cosmological simulations (SERRA, FIRE and TNG50), they found that the galaxies in the simulation could either only form a small number of clumps but maintain a rotating disk structure, or form a large number of clumps but fall into chaotic motion, and could never reproduce the observed characteristics of "rich clumps + orderly rotation" at the same time.
These findings put the mainstream Λ-cold dark matter model into trouble. This model believes that the universe is composed of about 5% ordinary matter, 27% dark matter and 68% dark energy, and the structure is formed in a hierarchical aggregation from small to large. However, the observations of the Webb Telescope have thrown up four unavoidable contradictions: In terms of time, early galaxies were formed much earlier than model expectations, and the universe had complex structures when it was only 280 million years old; in terms of mass, the mass of galaxies like MoM-z14 far exceeded model predictions, and it should not have been possible when the universe was 600 million years old. There are objects with a mass of 50 billion times that of the sun. Structurally, the disk-like structure and orderly rotation of early galaxies are completely inconsistent with the "loose small galaxies" predicted by the model. Quantitatively, the number of galaxies in the redshift range of 5 to 11 is ten times that predicted by the model. The "crowding" of the early universe is beyond imagination.
The theory of galaxy formation faces the same crisis. Traditional theories believe that the star formation efficiency of early galaxies is low because of the lack of heavy elements to help cool the gas. However, the star formation efficiency of the early galaxies observed by the Webb Telescope reached almost 100%. Theoretically, it takes a long time for the gas and dust in the early universe to accumulate, but these galaxies can gather enough "raw materials" in a short time. ; In terms of chemical evolution, the heavy element content in early galaxies shows that multi-generational stellar cycles have long been completed, which is seriously inconsistent with the time scale of the early universe; What is even more difficult is the problem of dark matter halo matching. The mass of the ZF-UDS-7329 galaxy even exceeds the mass of the dark matter halo in which it is located as estimated by the standard model, which completely goes against common sense.
Even the understanding of the reionization history of the universe has been rewritten by the Webb telescope. Traditional theory holds that reionization (the transition from a neutral state to an ionized state) of the universe mainly occurs near redshift 6 and is dominated by young, massive stars. However, observations from the Webb Telescope show that there is a large amount of star formation activity at redshifts above 10, and the reionization process may be much earlier than expected. The new study also found that faint galaxies are the main force in providing reionization photons, and the production efficiency of these photons is much higher than previous observations. Its efficiency is directly related to the history of star formation explosions in galaxies. This means that the "dark ages" of the universe may not be that dark, and the "first light" of stars shines earlier than we imagined.
The Webb Telescope discovered striking similarities between early quasars in the universe and recent quasars [19]. All of this shows that the distance and time are basically the same everywhere in the universe, and there is no expansion process in the universe.
8.2. Minimum Detection Range of Observation Points
For the same viewing angle, there are two situations. One is that only one radiation signal with a larger amplitude is received in the entire viewing angle, as shown in Figure 4. The other is to receive multiple radiation signals within one viewing angle, as shown in Figure 5. Although the total amount of radiation received at this time is the same as the first individual amount of radiation, the first case is easy to measure, while the second case is not easy to be detected by the detection equipment. Just like ordinary telescope observation can observe a relatively large number of planets, but the deep sky is dark when observed with the Hubble Telescope, there are actually many galaxies in the deep sky. The detection amplitude of a single radiation signal within a single viewing angle is therefore important and determines the sensitivity of the detector.
In fact, the minimum detection amplitude of different wavelengths is closely related to the maximum detection distance. If the minimum detection amplitude is small, the maximum detection distance is far. If the minimum detection amplitude is large, the maximum detection distance is short.
9. Conclusion
Different planets in the universe have different luminous brightness. According to Stefan-Boltzmann's law, it can be known that the surface temperature of the planet is also different. According to Planck's black body radiation law, it can be known that the amplitude of the electromagnetic waves radiated by the planets of various wavelengths is also different. The long-distance transmission of electromagnetic waves in the universe will cause a red shift. Calculate the time when the various electromagnetic waves emitted by different types of planets in the universe converge to the observation point after being reddened. Amplitude, and then add the radiation amplitudes of different types of electromagnetic waves according to different wavelengths, you can find the peak wavelength of the radiated electromagnetic wave. The peak wavelength simulated in this article can be around 1mm. According to Wien's displacement law, the temperature of the object at the monitoring point can be determined to be around 2.897k. Through data simulation, this article shows that 3k microwave background radiation can also be formed in the static universe.
References
- She Xuechang. Doppler effect and its applications [J]. Physics Teaching, 2004, (1): 45-45.
- Baidu Encyclopedia. Hubble's Law [EB/OL]. [2025-11-13], https://baike.baidu.com/item/%E5%93%88%E5%8B%83%E5%AE%9A%E5%BE%8B/2390703.
- Baidu Encyclopedia. Redshift Law [EB/OL]. [2025-11-13], https://baike.baidu.com/item/%E7%BA%A2%E7%A7%BB%E5%AE%9A%E5%BE%8B/2348273.
- Zou Zhenlong, Qin Bo. Measuring the Hubble constant [J]. Physics, 2013, 42(10)733-734.
- Baidu Encyclopedia. Sun [EB/OL]. [2025-11-13], https://baike.baidu.com/item/%E5%A4%AA%E9%98%B3/24010.
- Baidu Encyclopedia. Spectral Type. [EB/OL]. [2025-11-13], https://baike.baidu.com/item/%E5%85%89%E8%B0%B1%E5%9E%8B/6728499?fr=aladdin.
- Cao Dinghan. Stefan-Boltzmann radiation law and its application [J]. Infrared Technology, 1994, 16(3):3.DOI:CNKI:SUN:HWJS.0.1994-03-014.
- Wang Mingmei. Planck’s blackbody radiation formula and classical expressions [J]. Journal of Hefei Normal University, 2003, 21(006)17-18.DOI10.3969j.issn.1674-2273.2003.06.007.
- Albert Smith. If all the matter in the universe were evenly distributed, what would be the density of the universe? [EB/OL].[2025-11-13], https://baijiahao.baidu.com/s?id=1617920513954940178&wfr=spider&for=pc.
- Cao Dinghan. Wien's displacement law and its application [J]. Infrared Technology, 1994, 16(2):3.DOI:CNKI:SUN:HWJS.0.1994-02-016.
- PS Wesson, He Chang. Obers' Paradox in Astronomy [J]. World Science, 1992(8)4.DOICNKISUNSJKE.0.1992-08-005.
- Chen Junli. Naive analysis of Olbers' paradox [J]. Chinese Science and Technology Journal Database (Full-text version) Natural Science, 2022(4):5.
- Lu Gengyuan, Lu Haimin. Cosmic expansion model--Discussion on the universe model [J]. Science and Technology Outlook, 2016, 26(028)294-294.DOI10.3969j.issn.1672-8289.2016.28.260.
- Junli Chen.Doubts About the Expansion of the Universe Derived from Einstein's Field Equations. [CrossRef]
- Marmet L.On the Interpretation of Spectral Red-Shift in Astrophysics: A Survey of Red-Shift Mechanisms - II[J]. 2018. [CrossRef]
- Chen Junli, Kang Yaohui. Observational results of Hubble’s law, universe expansion and pulsar time stability are inconsistent [J]. Science and Life, Issue 30, October 2021. https://zhuanlan.zhihu.com/p/454024406.
- Junli Chen.Why Can’t Large Galaxies Centered on Neutron Stars be Observed? [CrossRef]
- The leisurely water-controlling Dayu. 280 million years after the birth of the universe, the Webb Telescope actually photographed galaxies that should not exist [EB/OL]. [2025-11-13], https://baijiahao.baidu.com/s?id=1845014193499369815&wfr=spider&for=pc.
- Zhao Xiaoran Fuel. The Webb Telescope discovered the surprising similarity between early quasars in the universe and recent quasars [EB/OL]. [2025-11-13], https://baijiahao.baidu.com/s?id=1834713834177657118&wfr=spider&for=pc.
Figure 1.
Typical Planck blackbody radiation diagram.
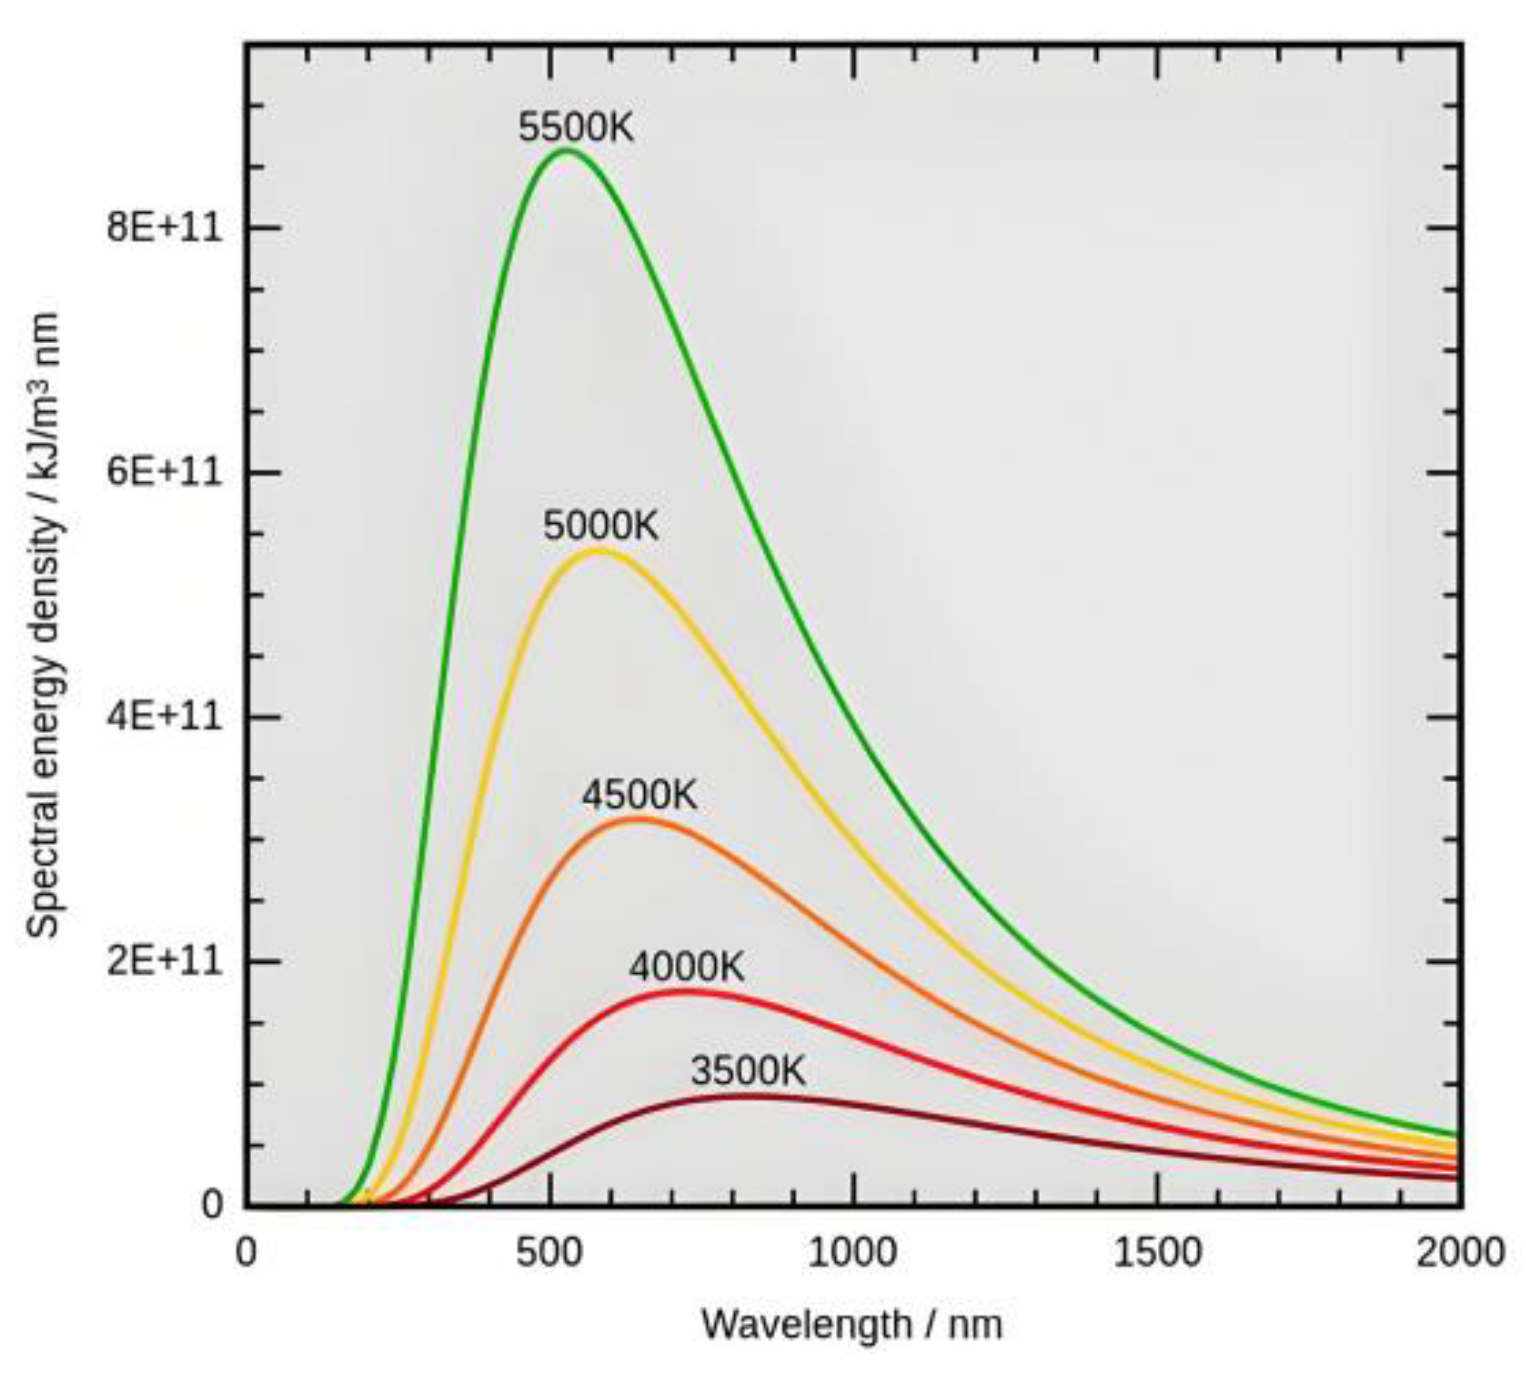
Figure 2.
Schematic diagram of simulated distribution of planets in the universe.
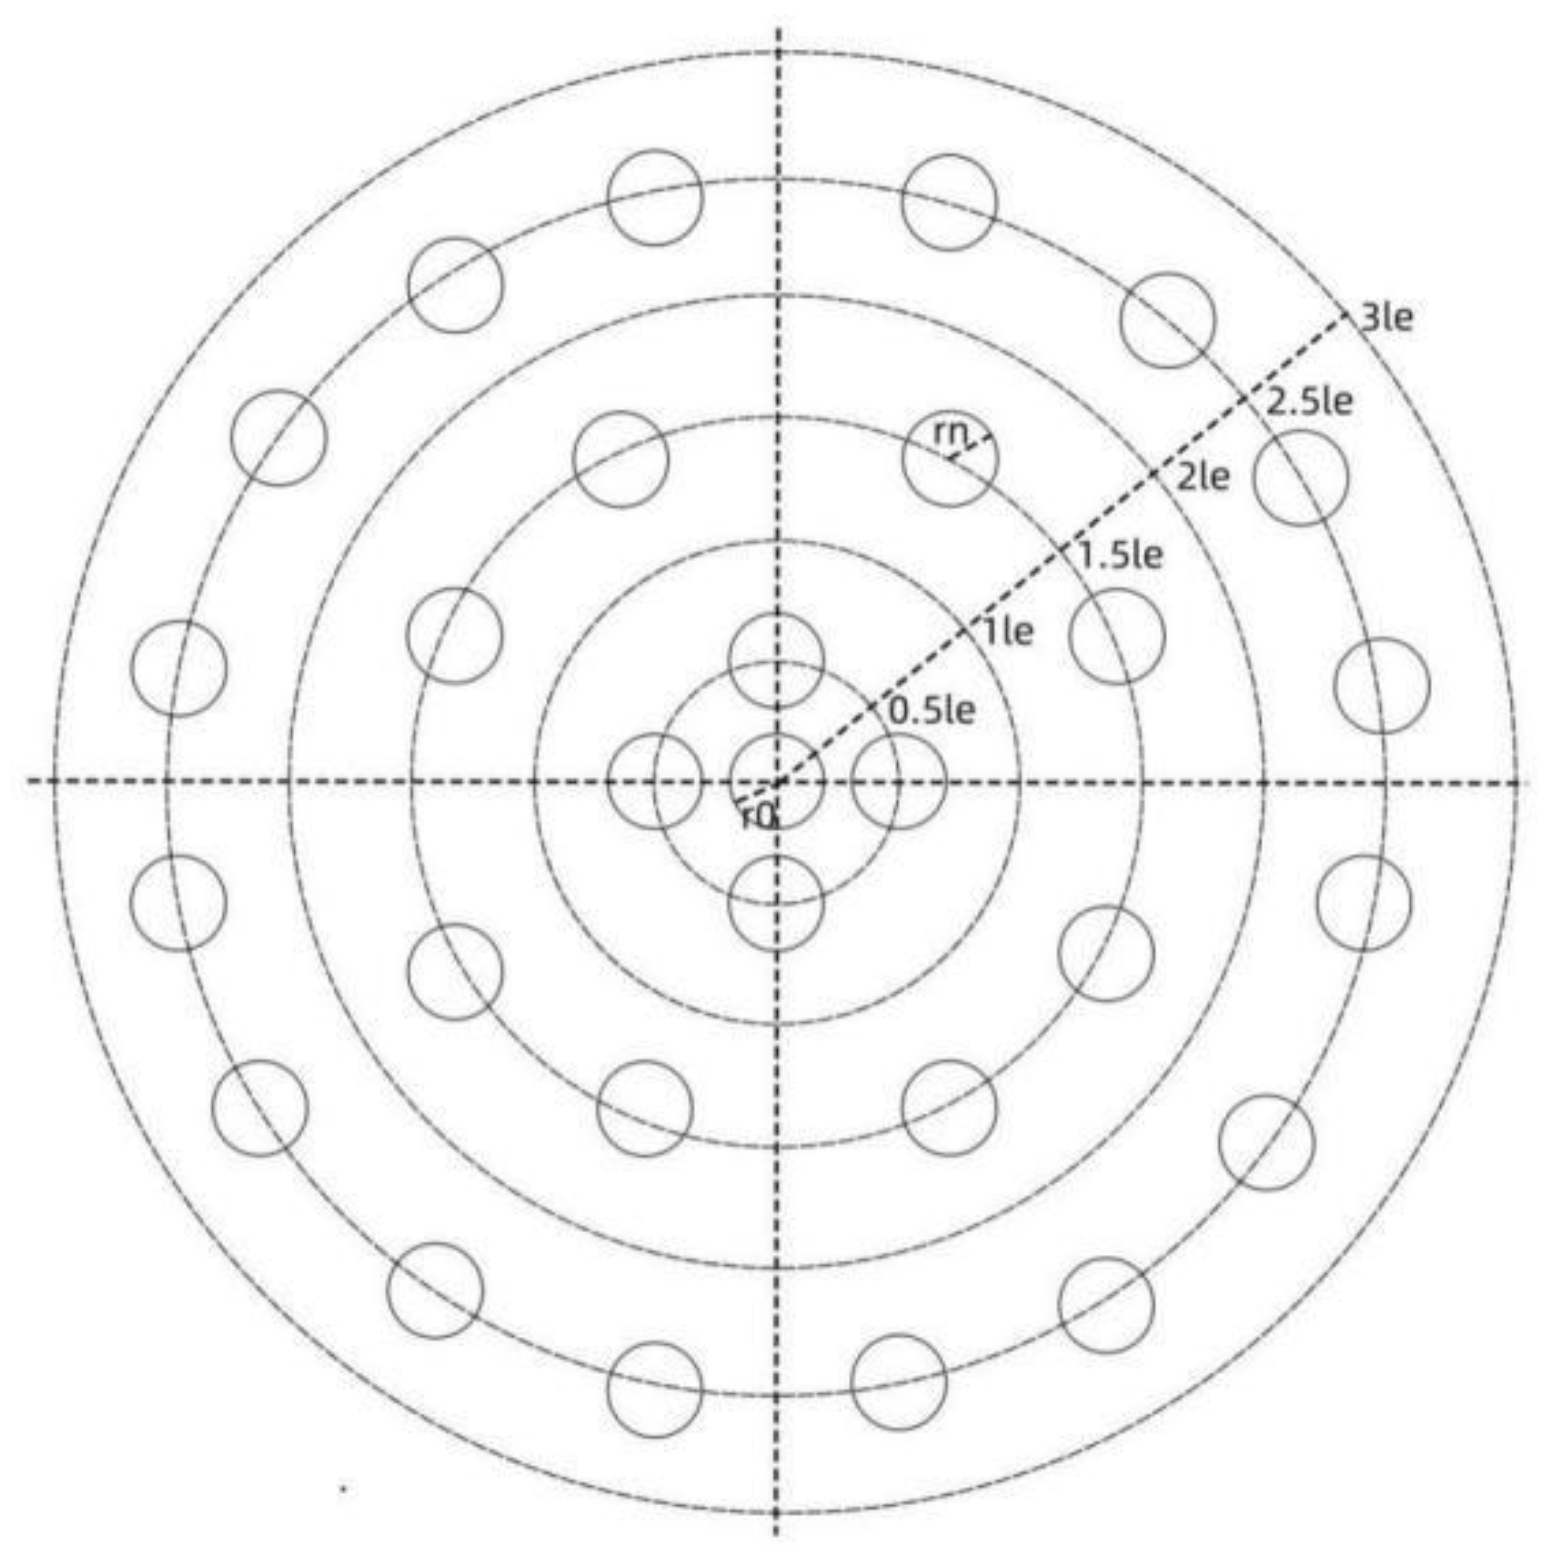
Figure 3.
Square pyramid in interstellar survey.

Figure 4.
Schematic diagram of only one radiation signal within the viewing angle.
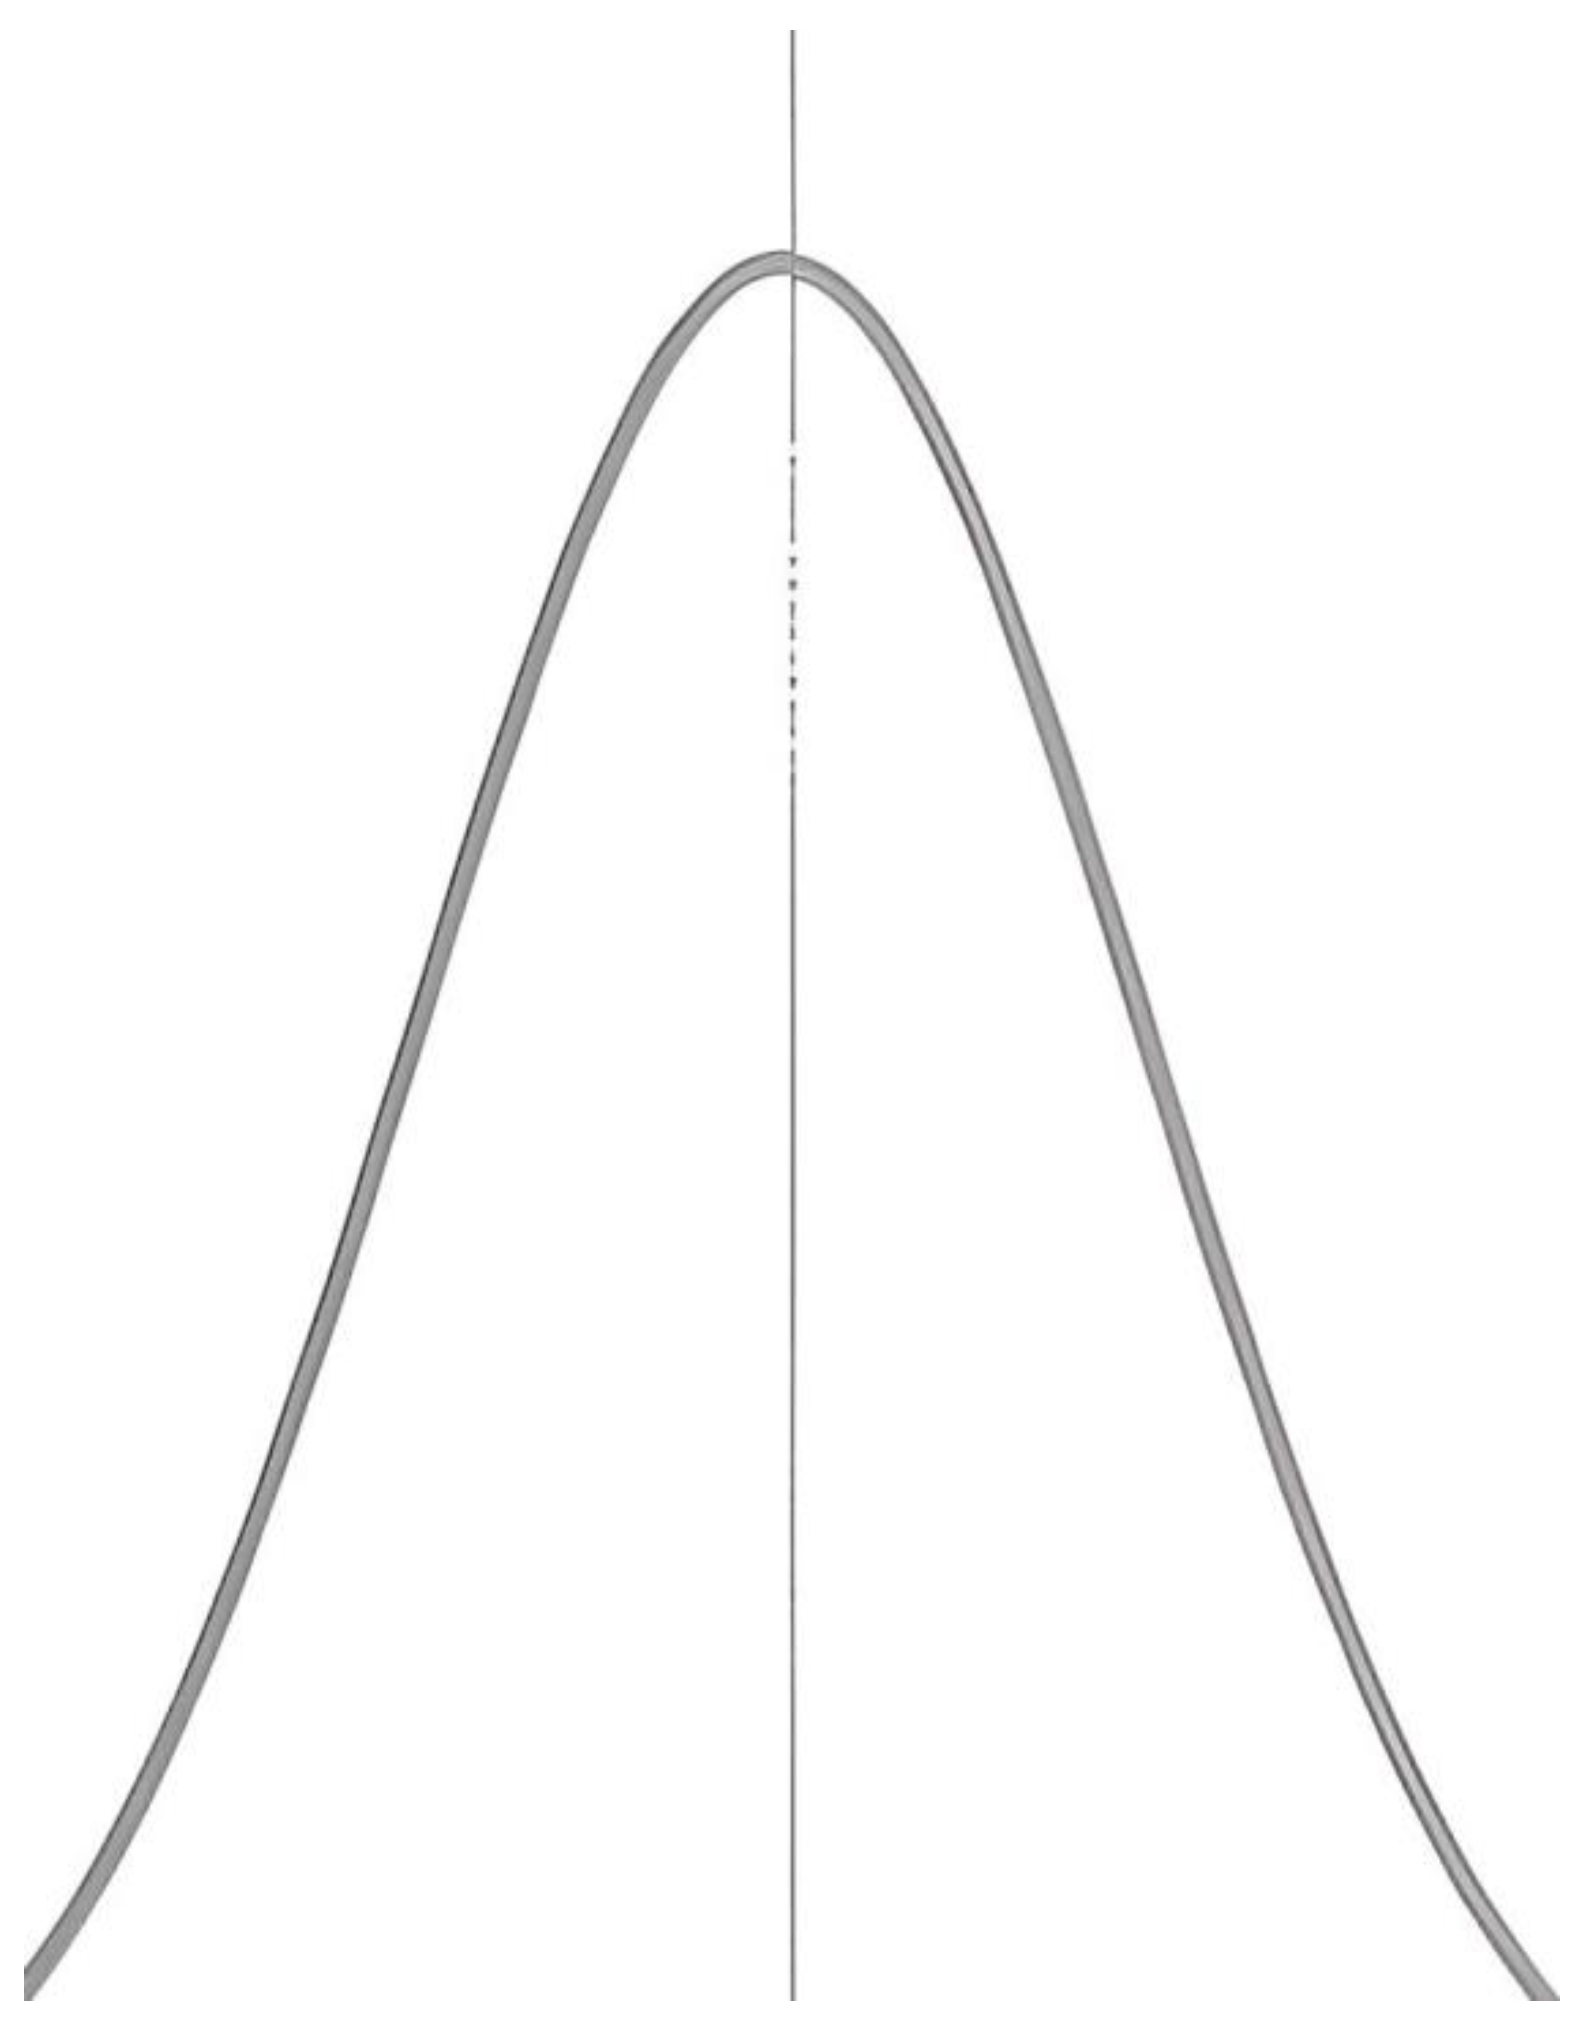
Figure 5.
Schematic diagram of multiple radiation signals within the viewing angle.
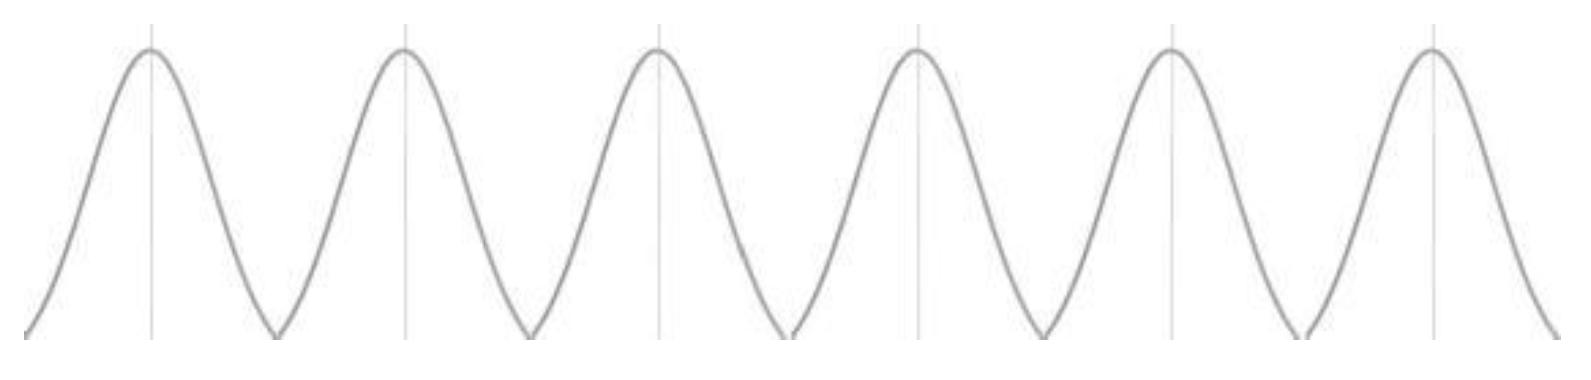
Table 2.
The meaning and units of physical quantities in Planck’s black body radiation formula.
| Physical Quantity | Meaning | SI Units |
| I | Radiation rate, from unit surface in unit time product and unit solid angle at unit frequency The energy radiated at intervals or unit wavelength intervals |
Joule · second · meter · steradian · Hertz,Or joules·second·meter· steradian·meter |
| frequency | Hz | |
| λ | wavelength | m |
| T | blackbody temperature | K |
| h | Planck's constant | J·s |
| c | speed of light | m/s |
| e | The base of natural logarithms | 1 |
| k | Boltzmann constant | J/K |
Table 3.
Cumulative calculation table of radiation amounts at different wavelengths at observation points in the universe.
Table 3.
Cumulative calculation table of radiation amounts at different wavelengths at observation points in the universe.
| Type B | λ(m) | ||||||||||
| ms(kg) | d(m) | de(m) | n | 0.0006 | 0.0007 | 0.0008 | 0.0009 | 0.001 | 0.0011 | 0.0012 | 0.0013 |
| 1.989E+30 | 1.880E+26 | 1.492E+26 | 3.574E+14 | 2.140E-41 | 1.155E-41 | 6.773E-42 | 4.229E-42 | 2.775E-42 | 1.895E-42 | 1.338E-42 | 9.717E-43 |
| rs(m) | 3.760E+26 | 3.104E+26 | 2.502E+15 | 2.072E-40 | 1.118E-40 | 6.557E-41 | 4.094E-41 | 2.687E-41 | 1.835E-41 | 1.296E-41 | 9.408E-42 |
| 6.955E+08 | 5.640E+26 | 4.881E+26 | 6.790E+15 | 8.673E-40 | 4.683E-40 | 2.746E-40 | 1.714E-40 | 1.125E-40 | 7.685E-41 | 5.427E-41 | 3.940E-41 |
| Ls(J/s) | 7.520E+26 | 6.712E+26 | 1.322E+16 | 2.496E-39 | 1.348E-39 | 7.904E-40 | 4.935E-40 | 3.239E-40 | 2.212E-40 | 1.562E-40 | 1.134E-40 |
| 3.827E+26 | 9.400E+26 | 8.563E+26 | 2.180E+16 | 5.769E-39 | 3.115E-39 | 1.827E-39 | 1.141E-39 | 7.487E-40 | 5.114E-40 | 3.612E-40 | 2.623E-40 |
| km | 1.128E+27 | 1.042E+27 | 3.252E+16 | 1.154E-38 | 6.233E-39 | 3.655E-39 | 2.283E-39 | 1.498E-39 | 1.023E-39 | 7.227E-40 | 5.248E-40 |
| 18 | 1.316E+27 | 1.229E+27 | 4.539E+16 | 2.085E-38 | 1.126E-38 | 6.603E-39 | 4.124E-39 | 2.707E-39 | 1.849E-39 | 1.306E-39 | 9.483E-40 |
| kr | 1.504E+27 | 1.416E+27 | 6.040E+16 | 3.490E-38 | 1.885E-38 | 1.106E-38 | 6.905E-39 | 4.532E-39 | 3.096E-39 | 2.187E-39 | 1.588E-39 |
| 7 | 1.692E+27 | 1.604E+27 | 7.755E+16 | 5.508E-38 | 2.976E-38 | 1.745E-38 | 1.090E-38 | 7.156E-39 | 4.889E-39 | 3.453E-39 | 2.508E-39 |
| kL | 1.880E+27 | 1.791E+27 | 9.685E+16 | 8.298E-38 | 4.483E-38 | 2.630E-38 | 1.643E-38 | 1.078E-38 | 7.367E-39 | 5.203E-39 | 3.779E-39 |
| 20000 | 2.068E+27 | 1.978E+27 | 1.183E+17 | 1.203E-37 | 6.501E-38 | 3.814E-38 | 2.382E-38 | 1.564E-38 | 1.069E-38 | 7.547E-39 | 5.481E-39 |
| mu(kg) | 2.256E+27 | 2.166E+27 | 1.419E+17 | 1.690E-37 | 9.135E-38 | 5.359E-38 | 3.348E-38 | 2.198E-38 | 1.502E-38 | 1.061E-38 | 7.703E-39 |
| 3.580E+31 | 2.444E+27 | 2.354E+27 | 1.676E+17 | 2.312E-37 | 1.250E-37 | 7.332E-38 | 4.580E-38 | 3.007E-38 | 2.055E-38 | 1.451E-38 | 1.054E-38 |
| rus(m) | 2.632E+27 | 2.541E+27 | 1.955E+17 | 3.092E-37 | 1.671E-37 | 9.804E-38 | 6.125E-38 | 4.021E-38 | 2.748E-38 | 1.941E-38 | 1.410E-38 |
| 4.869E+09 | 2.820E+27 | 2.729E+27 | 2.255E+17 | 4.053E-37 | 2.191E-37 | 1.285E-37 | 8.032E-38 | 5.273E-38 | 3.603E-38 | 2.545E-38 | 1.849E-38 |
| Lus(J/s) | 3.008E+27 | 2.917E+27 | 2.577E+17 | 5.222E-37 | 2.823E-37 | 1.657E-37 | 1.035E-37 | 6.796E-38 | 4.645E-38 | 3.281E-38 | 2.383E-38 |
| 7.654E+30 | 3.196E+27 | 3.105E+27 | 2.920E+17 | 6.628E-37 | 3.583E-37 | 2.103E-37 | 1.314E-37 | 8.627E-38 | 5.896E-38 | 4.165E-38 | 3.025E-38 |
| j*(J/s·m^2) | 3.384E+27 | 3.293E+27 | 3.284E+17 | 8.299E-37 | 4.487E-37 | 2.634E-37 | 1.646E-37 | 1.081E-37 | 7.385E-38 | 5.217E-38 | 3.789E-38 |
| 2.570E+10 | 3.572E+27 | 3.481E+27 | 3.670E+17 | 1.027E-36 | 5.552E-37 | 3.259E-37 | 2.036E-37 | 1.337E-37 | 9.139E-38 | 6.457E-38 | 4.690E-38 |
| σ(W/m^2 T^4) |
3.760E+27 | 3.668E+27 | 4.078E+17 | 1.257E-36 | 6.795E-37 | 3.989E-37 | 2.493E-37 | 1.637E-37 | 1.119E-37 | 7.905E-38 | 5.742E-38 |
| 5.670E-08 | 3.948E+27 | 3.856E+27 | 4.507E+17 | 1.523E-36 | 8.237E-37 | 4.835E-37 | 3.022E-37 | 1.985E-37 | 1.356E-37 | 9.584E-38 | 6.962E-38 |
| T(k) | 4.136E+27 | 4.044E+27 | 4.957E+17 | 1.830E-36 | 9.896E-37 | 5.809E-37 | 3.631E-37 | 2.385E-37 | 1.630E-37 | 1.152E-37 | 8.366E-38 |
| 25946 | 4.324E+27 | 4.232E+27 | 5.429E+17 | 2.180E-36 | 1.179E-36 | 6.924E-37 | 4.328E-37 | 2.842E-37 | 1.943E-37 | 1.373E-37 | 9.972E-38 |
| ρu(kg/m^3) | 4.512E+27 | 4.420E+27 | 5.922E+17 | 2.579E-36 | 1.395E-36 | 8.191E-37 | 5.120E-37 | 3.363E-37 | 2.299E-37 | 1.624E-37 | 1.180E-37 |
| 4.7E-28 | 4.700E+27 | 4.608E+27 | 6.436E+17 | 3.029E-36 | 1.639E-36 | 9.624E-37 | 6.016E-37 | 3.951E-37 | 2.701E-37 | 1.909E-37 | 1.387E-37 |
| kρ | 4.888E+27 | 4.796E+27 | 6.972E+17 | 3.537E-36 | 1.913E-36 | 1.124E-36 | 7.025E-37 | 4.614E-37 | 3.154E-37 | 2.229E-37 | 1.619E-37 |
| 0.04035 | 5.076E+27 | 4.984E+27 | 7.530E+17 | 4.105E-36 | 2.221E-36 | 1.304E-36 | 8.155E-37 | 5.357E-37 | 3.662E-37 | 2.588E-37 | 1.880E-37 |
| ρui (kg/m^3) | 5.264E+27 | 5.172E+27 | 8.109E+17 | 4.738E-36 | 2.564E-36 | 1.506E-36 | 9.416E-37 | 6.186E-37 | 4.229E-37 | 2.988E-37 | 2.171E-37 |
| 1.896E-29 | 5.452E+27 | 5.360E+27 | 8.709E+17 | 5.443E-36 | 2.946E-36 | 1.730E-36 | 1.082E-36 | 7.107E-37 | 4.859E-37 | 3.434E-37 | 2.495E-37 |
| lue(m) | 5.640E+27 | 5.548E+27 | 9.331E+17 | 6.223E-36 | 3.368E-36 | 1.978E-36 | 1.237E-36 | 8.127E-37 | 5.557E-37 | 3.927E-37 | 2.853E-37 |
| 1.236E+20 | 5.828E+27 | 5.736E+27 | 9.974E+17 | 7.083E-36 | 3.834E-36 | 2.252E-36 | 1.408E-36 | 9.253E-37 | 6.327E-37 | 4.471E-37 | 3.249E-37 |
| Δθ | 6.016E+27 | 5.923E+27 | 1.064E+18 | 8.029E-36 | 4.347E-36 | 2.554E-36 | 1.597E-36 | 1.049E-36 | 7.174E-37 | 5.070E-37 | 3.684E-37 |
| 0.01745 | 6.204E+27 | 6.111E+27 | 1.133E+18 | 9.067E-36 | 4.909E-36 | 2.884E-36 | 1.804E-36 | 1.185E-36 | 8.104E-37 | 5.728E-37 | 4.162E-37 |
| dmax(m) | 6.392E+27 | 6.299E+27 | 1.203E+18 | 1.020E-35 | 5.524E-36 | 3.246E-36 | 2.030E-36 | 1.334E-36 | 9.121E-37 | 6.447E-37 | 4.684E-37 |
| 1.880E+30 | 6.580E+27 | 6.487E+27 | 1.276E+18 | 1.144E-35 | 6.195E-36 | 3.640E-36 | 2.277E-36 | 1.496E-36 | 1.023E-36 | 7.231E-37 | 5.255E-37 |
| N | 6.768E+27 | 6.675E+27 | 1.351E+18 | 1.279E-35 | 6.925E-36 | 4.069E-36 | 2.545E-36 | 1.673E-36 | 1.144E-36 | 8.085E-37 | 5.875E-37 |
| 10000 | 6.956E+27 | 6.863E+27 | 1.428E+18 | 1.425E-35 | 7.718E-36 | 4.535E-36 | 2.837E-36 | 1.864E-36 | 1.275E-36 | 9.013E-37 | 6.549E-37 |
| Δd(m) | 7.144E+27 | 7.051E+27 | 1.508E+18 | 1.583E-35 | 8.576E-36 | 5.040E-36 | 3.153E-36 | 2.072E-36 | 1.417E-36 | 1.002E-36 | 7.280E-37 |
| 1.880E+26 | 7.332E+27 | 7.239E+27 | 1.589E+18 | 1.754E-35 | 9.504E-36 | 5.586E-36 | 3.495E-36 | 2.297E-36 | 1.571E-36 | 1.110E-36 | 8.069E-37 |
| h(J·s) | 7.520E+27 | 7.427E+27 | 1.673E+18 | 1.939E-35 | 1.050E-35 | 6.175E-36 | 3.863E-36 | 2.539E-36 | 1.737E-36 | 1.228E-36 | 8.921E-37 |
| 6.626E-34 | 7.708E+27 | 7.615E+27 | 1.759E+18 | 2.138E-35 | 1.158E-35 | 6.809E-36 | 4.260E-36 | 2.800E-36 | 1.915E-36 | 1.354E-36 | 9.839E-37 |
| c(m/s) | 7.896E+27 | 7.803E+27 | 1.847E+18 | 2.351E-35 | 1.274E-35 | 7.490E-36 | 4.686E-36 | 3.080E-36 | 2.107E-36 | 1.490E-36 | 1.083E-36 |
| 2.998E+08 | 8.084E+27 | 7.991E+27 | 1.937E+18 | 2.580E-35 | 1.398E-35 | 8.221E-36 | 5.144E-36 | 3.381E-36 | 2.313E-36 | 1.635E-36 | 1.188E-36 |
| H0(/s) | 8.272E+27 | 8.179E+27 | 2.029E+18 | 2.826E-35 | 1.531E-35 | 9.004E-36 | 5.634E-36 | 3.704E-36 | 2.534E-36 | 1.791E-36 | 1.302E-36 |
| 2.197E-18 | 8.460E+27 | 8.367E+27 | 2.123E+18 | 3.088E-35 | 1.674E-35 | 9.842E-36 | 6.159E-36 | 4.049E-36 | 2.770E-36 | 1.958E-36 | 1.423E-36 |
| e | 8.648E+27 | 8.555E+27 | 2.220E+18 | 3.368E-35 | 1.826E-35 | 1.074E-35 | 6.719E-36 | 4.417E-36 | 3.022E-36 | 2.136E-36 | 1.553E-36 |
| 2.718 | 8.836E+27 | 8.743E+27 | 2.318E+18 | 3.667E-35 | 1.988E-35 | 1.169E-35 | 7.316E-36 | 4.810E-36 | 3.291E-36 | 2.327E-36 | 1.691E-36 |
| k(J/K) | 9.024E+27 | 8.931E+27 | 2.419E+18 | 3.985E-35 | 2.160E-35 | 1.271E-35 | 7.953E-36 | 5.228E-36 | 3.577E-36 | 2.529E-36 | 1.838E-36 |
| 1.381E-23 | 9.212E+27 | 9.119E+27 | 2.522E+18 | 4.323E-35 | 2.344E-35 | 1.379E-35 | 8.629E-36 | 5.674E-36 | 3.882E-36 | 2.745E-36 | 1.995E-36 |
| total | 2.734E-25 | 3.105E-25 | 3.379E-25 | 3.539E-25 | 3.588E-25 | 3.541E-25 | 3.422E-25 | 3.252E-25 | |||
Disclaimer/Publisher’s Note: The statements, opinions and data contained in all publications are solely those of the individual author(s) and contributor(s) and not of MDPI and/or the editor(s). MDPI and/or the editor(s) disclaim responsibility for any injury to people or property resulting from any ideas, methods, instructions or products referred to in the content. |
© 2025 by the authors. Licensee MDPI, Basel, Switzerland. This article is an open access article distributed under the terms and conditions of the Creative Commons Attribution (CC BY) license (http://creativecommons.org/licenses/by/4.0/).
Copyright: This open access article is published under a Creative Commons CC BY 4.0 license, which permit the free download, distribution, and reuse, provided that the author and preprint are cited in any reuse.


