
Submitted:
18 November 2025
Posted:
19 November 2025
You are already at the latest version
Abstract
The increasing amount of recycled plastic waste and the extensive use of construction materials both contribute significantly to CO₂ emissions, a major global concern. This study investigates the use of recycled plastic waste (PW) as a partial replacement for nat-ural 10 mm coarse aggregates in concrete mix design, aiming to promote sustainable con-struction practices. Concrete mixes were prepared with varying levels of plastic replace-ment—0%, 15%, 30%, 45%, and 60% by volume—and evaluated for workability, compres-sive strength, tensile strength, water absorption, and microstructural properties. Results indicated that replacing aggregates with PW increased slump values, suggesting im-proved workability, particularly at 30–45% replacement. However, both compressive and tensile strengths exhibited a declining trend as the replacement level increased. The standard strength was maintained only at 15% replacement, achieving 35.3 MPa at 56 days compared to 37.3 MPa for the control mix. Durability tests showed reduced water absorption at low replacement levels but significant porosity and microcracking at higher percentages. Scanning Electron Microscopy (SEM) revealed weak interfacial transition zones (ITZs) between plastic waste and cement paste, with bonding weakening and mi-crovoids increasing as replacement levels rose. A simplified life cycle assessment (LCA) suggests that while CO₂ emissions remain largely unchanged due to cement dominance, incorporating recycled plastic waste provides sustainability benefits through resource conservation and waste diversion rather than direct carbon reduction. These findings highlight that limited aggregate replacement with plastic waste can be practical, cost-efficient, and environmentally advantageous. This research underscores the potential of recycled plastics in sustainable construction, contributing to waste management and reducing reliance on natural aggregates.
Keywords:
plastic waste
; Portland cement
; pulverised fuel ash
; ground granulated blast-furnace slag
; interfacial transition zone
; scanning electron microscopy
; polypropylene
; high-density polyethylene
; polyethylene terephthalate
; calcium-silicate-hydrate
1. Introduction
The rapid growth of urbanization has significantly affected the environment, increasing the demand for sustainable construction. It results in reliance on natural resources such as sand, gravel and cement. This growing dependency has led to resource depletion, solid waste accumulation and environmental degradation. Plastic waste generation has escalated to critical levels, with millions of non-biodegradable plastics accumulating annually in landfills and marine ecosystems. To minimize the environmental effects, researchers always try to find some alternatives by incorporating recycled materials in construction. Geopolymer concrete made with GGBS–PFA blends can strength to Portland cement concrete while significantly reducing carbon emissions and a sustainable alternative for the construction industry [1]. Implementing sustainable policies, adopting low-carbon materials and promoting innovative practices are essential to mitigate carbon impacts and move toward a greener construction industry. Construction activities consume 40% of global energy and contribute 36% of carbon emissions, making them a major driver of environmental degradation [1].
The use of environmentally friendly and low-cost products is increasing day by day, especially in the construction industry where sustainable alternatives to traditional materials are in high demand. Researchers are working on sustainable alternatives for constructions, recycled plastic waste is one of them. Plastics microfibers are used in pavement and linings with steel fibers [2]. A large amount of plastic waste has increased as a critical environmental issue. Apparently, 6300 metric tons of plastic waste were generated by 2015, with only 9% effectively recycled, while the remaining waste is either incinerated or accumulated in landfills and oceans [3]. Therefore, the recycled plastic waste has gathered some attention for use in construction. By replacing aggregates with plastic waste, reduce the reliance on natural resources and divert significant volumes of non-biodegradable waste from the environment [4].
The following plastics are frequently researched for use in concrete: polyethylene terephthalate (PET), polypropylene (PP), high-density polyethylene (HDPE) and polyvinyl chloride (PVC). Each of these plastics has unique characteristics that influence the behavior of concrete. The most abundant form of plastic is polyethylene terephthalate (PET) sourced from discarded beverage bottles. This study explores by using PET as a partial replacement for sand in concrete, the research aims to reduce solid waste management and resource conservation challenges. PET possesses favorable properties, including low density, high tensile strength, durability, and chemical attack resistance and corrosion, making it suitable for cement-based composites. Its incorporation not only works to reduce the requirement of natural aggregates but also has other beneficial opportunities, such as lowering concrete density, thermal performance, sustainability and reducing environmental pollution [5]. PP and HDPE are introduced as shredded aggregates, showing potential crack control and shrinkage reduction, for improving waste management while making concrete more economical. Their effects on workability, density, strength, durability, workability and resistance properties were examined to highlight the potential in sustainable construction [6]. For rigid pavement applications, some research has examined waste plastics such as PET, HDPE, LDPE, PVC, and PP in concrete as partial replacements for fine aggregates. It shows that higher replacement levels often reduce compressive strength, weaken bonding with cement and raise durability concerns, whereas further research is needed to optimize mix designs, enhance interfacial bonding and assess long-term durability under real-world conditions [7]. Plastics are inherently chemically inert and hydrophobic in nature. It has a strong influence on their interaction with cement paste. On one hand, these properties contribute to durability in aggressive environments, as plastics resist corrosion, chemical attack and moisture absorption, thereby enhancing the long-term stability of concrete in specific applications. The smooth surface texture and lack of chemical reactivity of plastic lead to weak interfacial bonding and decreased load transmission efficiency. As a result, it shows a decline in mechanical strength. This dual nature highlights both the potential benefits and limitations of incorporating plastic waste into concrete [8].
The main binder in concrete mix design is Portland cement. Portland cement clinker consists of four major phases: alite (C₃S) and belite (C₂S) for early and late strength, aluminate (C₃A) for rapid hydration and flash setting, and ferrite for clinker formation and hydration. Their hydration mostly yields C-S-H gel, the crucial binding phase. Admixtures have a strong influence on these reactions; triethanolamine (TEA) acts as an accelerator or retarder depending on the dosage, improving early but not long-term strength. Triisopropanolamine (TIPA) improves later-age strength and the newer THEED has similar effects to TIPA, improving strength in Portland cement and cement-slag blends while also boosting pozzolanic reactions [9]. Portland cement develops strength progressively, gaining most of its capacity within the first 7 days, after which the rate of strength growth becomes slow. Some paper investigates fluctuations in the compressive strength of Portland cement (PC) during a 28-day curing period using Fourier-transform infrared (FTIR) spectroscopy. The strength fluctuations correlated with the formation of ettringite, a sulfate phase, during cement hardening [10].
Mechanical properties of partially replaced compressive, tensile, and flexural strength are mostly influenced when the waste plastics are employed as a partial replacement for fine aggregates. Research indicates that compressive strength is typically decreased due to increased plastic content, with 10–25% reductions when plastics replace 20–30% of fine aggregates. This decrease is primarily a result of weak interfacial transition zones (ITZs) between hydrophobic plastic aggregates and cement paste, suppressing high bonding capacity and leading to void formation and microcracking. Additionally, lower densities and rigidities of plastics in comparison with natural aggregates reduce the overall density of the concrete matrix, further weakening its load-carrying capacity [11]. Incorporation of plastic waste into concrete has attracted attention as a strategy to enhance ductility, toughness and sustainability. High-density polyethylene (HDPE) and polypropylene (PP) can improve flexural strength and crack resistance by approximately 5–10% when used as partial replacements. Thereby enhancing the durability of concrete pavements and other load-bearing applications. On the other hand, low-density polyethylene (LDPE) and polyvinyl chloride (PVC) often show poor interfacial bonding with the cement paste, which results in reduced compressive and tensile strength, limiting their suitability for structural use [12]. Plastic is a lightweight substance which will help the concrete to be in less weight. Lightweight concrete that is made with plastics exhibits improved ductility and energy absorption which are beneficial for impact resistance and seismic applications [13]. In splitting tensile it shows some strength. Some studies show that first crack flexural strength at 0.3-1% PP/PET fiber volume which impacts the resistance, crack widths and spacing reduced. PP also shows a strong gain in residual flexural parameters and ductility [14].
Workability and Durability are the first tests to determine the strength of concrete, to see if concrete is usable for construction. Some recent research in 2020–2024 on the use of plastic waste as an aggregate in concrete, addressing both environmental and engineering perspectives. It examines the types of plastics used, their physical and mechanical properties, and effects on concrete performance. Findings show that incorporating PW improves workability, reduces density, compressive, flexural, and tensile strengths to acceptable ranges. It also benefits such as reduced raw material consumption, lower CO₂ emissions, improved durability at low replacement levels and decreased thermal conductivity. Economically, PW use lowers production costs and environmentally it helps to reduce plastic pollution. It mainly highlights the potential of plastic waste to enhance sustainability in construction when applied appropriately [15]. Workability is a critical property of fresh concrete, influencing ease of mixing, placing and compaction. Studies consistently show that plastic aggregates improve workability due to their smooth, hydrophobic surfaces and lower density [16].
Scanning Electron Microscopy (SEM) provides insights into the interaction between cement paste and plastic particles. SEM examinations revealed that plastic fibers such as PET developed scratches, bonding, and eventual rupturing in cement composites due to stronger frictional bonds. At the same time, PP fibers showed smoother surfaces and mainly pulled out of the geopolymer matrix without breaking, indicating weaker adhesion. HDPE fibers displayed no signs of chemical degradation; instead, surface damage was caused by friction during pull-out, as they did not fully bond with concrete. Recycled PET fibers also demonstrated high alkali resistance, with SEM confirming no dissolution in the concrete medium [17]. The images of SEM typically reveal the interfacial transition zone (ITZ), which plays a vital role in the overall performance of the composite concrete mix. In the case of untreated plastic, the ITZ often exhibits poor adhesion with the cement mix, resulting in the formation of micro-voids and weak bonding areas. These discontinuities act as stress concentration points under loading, which can reduce strength, increase the crack and negatively affect the durability of concrete [8]. Some research occurs with only PET waste, as it is mostly available. PET waste using hydrogen peroxide solution (H2O2) and calcium hypochlorite solution (Ca(ClO)2) by treating it before incorporating in concrete as coarse aggregate replacements. It shows that chemical treatment improved the bond between cement paste and plastic waste, also reduced the gap of ITZ [18].
Sustainable construction has developed as a key issue for addressing the built environment's environmental, social, and economic implications. The construction sector consumes almost 40% of global energy and emits approximately 36% of carbon dioxide, making it one of the major contributors to climate change. This has led to a growing emphasis on developing and implementing practices that minimize resource depletion, reduce waste, and promote circular economic principles. The researchers are developing strategies such as innovative production methods, waste recycling, carbon capture and storage (CCS), and low-carbon materials. All these findings are for better, sustainable construction [1]. Most studies agree that the incorporation of recycled plastic waste (PW) into concrete mix design improves workability but reduces mechanical strength, especially at higher replacement levels. However, limited amount of optimal replacement percentage can balance both structural performance and sustainability benefits of concrete. Reported results vary widely due to differences in plastic types, particle sizes, and processing methods [7]. Most of the existing experiment focuses on laboratory-scale, with limited exploration of practical applications. Research into large-scale implementation, cost–benefit analysis and life-cycle assessment (LCA) are also necessary to evaluate the economic and environmental feasibility of plastic waste concrete in real construction projects. But durability under UV, temperature change, load, chemical exposure needs to be proven. Without such studies, industry adoption may remain slow despite promising laboratory results [19].
2. Materials and Methods
The materials used in this experiment are Portland cement as primary binder, fine aggregate (sand), coarse aggregate, recycled plastic and water. The Portland cement and sand used in this experiment were obtained by a local supplier in the UK. The plastics were collected from nearby resources at the University of South Wales and shredded in the lab. Two types of limestones aggregates (10 mm and 20 mm) were used. In Table 1–3 it shows the physical and chemical properties of Portland cement, physical properties of sand, and physical properties of coarse aggregates. Figure 1 shows the particle size distribution of recycled plastics.

Table 1.
Chemical and Physical properties of Portland Cement [20].
Table 1.
Chemical and Physical properties of Portland Cement [20].
| Chemical Composition | % Mass |
|---|---|
| Fe2O3 | 3.2 |
| SiO2 | 23.5 |
| MgO | 2.6 |
| Al2O3 | 3.5 |
| CaO | 63.5 |
| Alkalis | 0.54 |
| LOI | 0.82 |
| Others | 2.34 |
| Physical Properties | |
| Initial/final setting (min) | 140/480 |
| Specific gravity | 3.11 |
| Normal consistency (%) | 30 |
| Compressive strength, 28days (MPa) | 30.5 |
| Specific surface, Blaine (m2/kg) | 3.11 |
Table 2.
Physical properties of Sand [21].
Table 2.
Physical properties of Sand [21].
| Physical Properties | |
|---|---|
| Specific gravity | 2.60 |
| Bulk density | 1000 kg/m3 |
Table 3.
Physical properties of aggregates [22].
Table 3.
Physical properties of aggregates [22].
| Property | 10 mm Coarse Aggregate | 20 mm Coarse Aggregate |
|---|---|---|
| Water absorption (%) | 1.5 | 12.8 |
| Dry density (Mg/m3) | 2.57 | 1.42 |
| Shape index (%) | 12 | 32 |
| Fakiness index (%) | 23 | 37 |
| Impact value (%) | 18 | 12 |
3. Methodology
3.1. Mix Design
The control mix for the research work was prepared in a 1:2:3 ratio with a water–cement (w/c) ratio of 0.55. A total of five mix designs were prepared for the experiment: one control mix, and four mixes in which plastic aggregates replaced 10 mm coarse aggregates by volume at replacement levels of 0%, 15%, 30%, 45%, and 60%. Total 60 samples were made in this experiment. After the calculations, each proportion weight for cement is 6.0 kg, fine aggregate (sand) is 12 kg, 20mm aggregate is 10kg and water is 3.3 kg. Some calculations were carried out to convert the weight of plastic waste into its equivalent volume. Table 4 shows the mix design of this research work. To investigate the first mix is the control one where there is no mix with the plastics. The intention for the control one is to see how the concrete mix acts with no mix with the plastics. For the second mix it was replaced by 15% of PW. In third mix it was replaced by more plastic waste with 30%. For the fourth mix the coarse aggregate in the control concrete mix replaced by 45%, according to control mix. Lastly, it was replaced by 60% plastic waste, which is the highest percentage of replacement for this study. All these mixes are carried out by volume, to replace plastic with coarse aggregate in terms of volume, the corresponding weight needs to be determined. For this some correction factors had been taken into consideration for calculation. That’s how the accurate corresponding weight of plastic waste determines to be used in form of coarse aggregate. The compressive strength was determined at curing ages of 7, 28, and 56 days. The detailed mixed design proportions are presented below.
3.2. Sample Preparation
The preparation of the concrete samples carried out according to the designed mix codes, and laboratory safety rules were followed throughout process. A controlled mix, four additional mixes containing different percentages of plastic waste. The plastics were first collected and shredded into suitable sizes. The materials were weighed; they were placed on a digital weight scale and dust extractor was placed above the bucket to extract dust. After proportioning the materials, the dry constituents were thoroughly mixed until a uniform blend was obtained. Water was then added gradually and mixing continued to achieve a homogeneous and workable concrete mix. The total mixing time occurs 2-3 minutes, then fresh concrete immediately placed into pre-lubricated moulds. For each batch, ten cube specimens of size 100 mm × 100 mm × 100 mm and two cylindrical specimens of size 100 mm × 200 mm were cast. The molding sample in cubes and cylinders were kept for the study. To avoid voids and ensure proper consolidation, compaction was done using tamping rod and vibration of the surface by three layers. Once casting was done, the surface was smoothened and kept them in normal room temperature for moulding. The initial setting period is 24 hours. After 24 hours, the specimens were labelled properly and demoulded without damaging the edges or surfaces of the samples. It maintained the standard in accordance with BS EN 12390-2:2019 [23]. The specimens were taken into the curing water tank filled with clean water with maintained constant temperature 20˚С ± 2˚С as per standards. Curing process was carried out until the testing days of 7, 28 and 56. Proper curing was carried out to maintain continuous hydration, which is important to gain strength and durability of the concrete. The compressive and splitting tensile strength test conducted in accordance with BS EN 12390-3:2019 [24] and BS EN 12390-6 [25]. The workability of fresh concrete, durability and sieve analysis test were carried out in accordance with BS EN 12350-2-2019 [26], BS EN 1097-6:2022 [27] and BS EN 933-1:2012 [28]. Scanning Electron Microscopy (SEM) was followed the standard in accordance with BS 1881-211:2016 [29].
4. Results
4.1. Workability Test
The workability of concrete increased with higher proportion of plastic waste replacements in concrete mix shows in Figure 2. The controlled mix showed a slump of 80 mm, which lies within the normal slump range (75–100 mm) typically associated with concrete of medium workability, suitable for reinforced concrete construction. The partial replacement of 15% and 30% showed increase slump value with 90mm which represents an improved workability while still falling within the normal range. With 45% replacement, the slump value increased 100mm and for 60% replacement it went 120mm, exceeding the normal range and indicating high workability. In figure it shows, expected slump value of 90mm, which is acceptable for reinforced concrete structures. While higher slump values may facilitate easier placement and compaction. Overall, it indicates that the inclusion of plastic waste enhances flowability due to its smooth surface texture and lower density, with optimal results observed up to 30–45% plastic waste, whereas higher dosages may compromise mix stability.
4.2. Sieve Analysis Test
The particle size distribution test was conducted on shredded plastic material. The initial dry mass sample recorded 200.4 g and total mass retained after sieving was 199.7 g which shows that negligible material loss occurred during the test procedure. This ensures that the results obtained are reliable and representative of the actual particle size composition of the material.
The results of the sieve analysis are presented in Table 5 and show that most of the particles were retained from 3.35 mm and 2 mm sieves, which account almost for 21% and 48% of the total mass respectively. Together, these two fractions make up almost 69% of the entire sample. A further 20.23% was retained on the 1.18 mm sieve, while smaller percentages were retained at finer sieve sizes, such as 600 µm by 7.06% and less amount of percentage retained at 425 µm and 300 µm. No measurable quantities were retained on the 212 µm, 150 µm, and 63 µm sieves, confirming the virtual absence of fines in the sample. The curve remains flat across the fine end of the scale 63 µm – 425 µm, with less than 1% passing, reflecting the absence of fines. A sharp rise begins at 600 µm by 0.35% passing. The most significant increases occur at 2 mm and 3.35 by 27.64% and 75.41% passing, before leveling off at 5 mm 96.59% passing.
4.3. Compressive Strength Test
The compressive strength and density of the concrete mixes were determined at curing ages of 7 days, 28 days and 56 days. Then the average of the results is presented in Figure 3, which shows the variation in performance with different percentages of plastic waste (PW) as a partial replacement. The results show a progressive reduction in compressive strength with increasing percentages of plastic waste. The controlled mix recorded the highest compressive strength across all curing ages, with values of 30.3 MPa at 7 days, 35.1 MPa at 28 days and 37.3 MPa at 56 days. In comparison, mixes containing plastic waste showed consistently lower strengths, with the reduction becoming more significant as the replacement percentage increased.
In Figure 3, 15% of PW replacement showed the compressive strength of 27.7 MPa at 7 days, 32.8 MPa at 28 days and 35.3 MPa at 56 days. It was lower than the control, the reduction was relatively moderate. However, at higher replacement levels, the reduction in compressive strength was substantial. For example, the 30% PW mix reached only 26.9 MPa at 56 days, compared with 37.3 MPa for the control, representing a reduction of nearly 28%. The 45% and 60% PW mixes exhibited even lower strengths, with the 60% PW mix achieving just 17.7 MPa at 56 days, less than half the strength of the control. The expected minimum compressive strength is 30 MPa, for controlled and 15% of plastic waste exceeds the minimum strength value at 28 and 56 days. But increased value of plastic waste showed less compressive strength all over the testing period.
In Figure 4, it shows the statistical model of every mix design. For controlled mix design, the trend shows as y = 3.5x + 27.233 (where y is the compressive strength in water, x is the curing age) and R2 = 0.956. For 15% plastic waste replacement it shows y = 3.8x + 24.333 and R2 = 0.9625. For 30%, it shows y = 0.75x + 25.833 and R2 = 0.1181. For 45%, y = -0.05x + 23.467 and R2 = 0.0008 which shows a linear regression model. For 60%, it shows y = 0.05x + 18.667 and R2 = 0.0007.
Overall, the results indicate that the incorporation of plastic waste reduces strength, with the effect becoming pronounced at replacement levels above 15%. At lower replacement levels, however, the strength reduction remains within an acceptable range.
4.4. Splitting Tensile Strength Test
The result shows the tensile strength after 28 days of curing in Figure 5. The control mix recorded the highest tensile strength of 3.3 MPa which exceeds the expected minimum strength of 3.0 MPa. The partial replacement of plastic waste shows a progressive reduction in tensile strength was observed. At 15% PW, the strength slightly decreased to 3.1 MPa, followed by 2.8 MPa at 30% PW. Beyond this level of replacement, the tensile strength dropped more sharply, reaching 2.2 MPa at 45% PW and 1.9 MPa at 60% PW. These results indicate that the incorporation of plastic waste beyond 30% replacement leads to strengths below the minimum requirement, compromising performance.
The compressive strength trend across different mix codes is shown in Figure 6. The statistical model shows correlation between plastic waste content and strength values. A linear regression model was fitted to the data in Figure 6, with a negative slope of –0.37x and a high coefficient of determination (R² = 0.9696), indicating a strong correlation between increasing PW content and decreasing compressive strength.
4.5. Durability: Water Absorption Test
In Figure 7, it presents the wet weight, dry weight and water absorption percentage for the control mix and the mixes incorporating different proportions of plastic waste. After curing for 28 days the cubes weighed and then kept in drying for 24 hours to weight the dry value of cubes. The controlled mix code shows lower weight than 15% PW for both dry and wet weight. A general decreasing trend in wet and dry weight was observed beyond 15% PW, indicating that higher PW content reduces the overall mass of the specimens.
Water absorption values showed greater variation across the mixes. The control mix exhibited 4.83%, while the lowest absorption was observed in the 15% PW mix (4.73%), indicating improved resistance to water uptake at this replacement level. However, beyond 15% PW, water absorption increased progressively: 5.33% (30% PW), 5.44% (45% PW), and reaching a maximum of 6.17% (60% PW). This indicates that higher plastic waste content may increase porosity or reduce compaction, thereby allowing more water ingress.
4.6. Microstructural Analysis (SEM)
4.6.1. Controlled Mix Design SEM Test
The Scanning Electron Microscopy (SEM) analysis of the concrete sample revealed distinct elemental variations across the examined regions. The presence of calcium silicate hydrate (C–S–H) phases plays a pivotal role, as they serve as the primary binding component responsible for strength and durability in cementitious materials. The variation in elemental distribution across the selected regions highlights the heterogeneous microstructure of the concrete, reflecting the coexistence of hydration products, unreacted silicate phases and potential minor impurities. In Figure 8, the pictures show the controlled mix design SEM where the sample seems to be made up mainly of oxides and silicates and shows a strong bond. For selected area 1 revealed that highest oxygen, calcium and silicon levels, which means C-S-H gel is present higher amount with strong bond in this sample.
4.6.2. SEM Results with Mix of Recycled Plastic Waste
The SEM for the modified concrete sample 15% replacement revealed clear differences in elemental composition across the analyzed regions. In Selected Area 1, oxygen (53.34 wt%) and calcium (32.19 wt%) were the dominant elements, accompanied by smaller amounts of silicon (3.74 wt%) and trace magnesium. In Figure 9, the 15% replacement mix showed a shift toward higher silicon and aluminum contents, consistent with the formation of additional C–S–H and alumino-silicate phases.
In the study, it was shown that the increase the value of the PW, it decease the bond shows in Figure 10. However, SEM test of 60% of plastic waste repacement shows most of the plastic and has more cracks and less bond with the cementitoius material.
4.7. Life Cycle Assessment (Numerical Results)
A simplified cradle-to-gate life cycle assessment (LCA) was performed for the five concrete mixes (0%, 15%, 30%, 45%, and 60% PW) using standard emission factors for cement, aggregates, and recycled plastic. The assessment focused on CO₂ emissions and embodied energy for each mix. The results are presented in Table 6. The highest carbon and Energy were obtained from the mix where 60% of the coarse aggregate was replaced with plastic waste. The reason the CO₂ emissions and embodied energy slightly increase for mixes with plastic waste instead of decreasing is due to the assumptions used in the simplified LCA:
-
Cement Dominates Emissions
- Cement has a very high emission factor (≈0.95 kg CO₂/kg and 4.6 MJ/kg).
- In all mixes, the cement content remains constant (6 kg), so majority of the emissions and energy come from cement, not aggregates or plastic.
-
Plastic Processing Adds Energy
- Recycled plastic requires shredding, cleaning, and sometimes chemical treatment, which adds embodied energy (≈0.5 MJ/kg) and a small CO₂ footprint (≈0.02 kg CO₂/kg).
- Natural aggregates have very low energy and CO₂ factors (≈0.1 MJ/kg and 0.005 kg CO₂/kg).
- So, when you replace aggregates with plastic, you swap low-impact material for one with slightly higher energy and emissions.
-
Net Effect
- The increase is small because the quantities of aggregates and plastic are much smaller compared to cement.
- For example, going from 0% PW to 60% PW only changes total CO₂ from 5.75 kg to 5.84 kg (≈1.6% increase) and energy from 28.6 MJ to 31 MJ (≈8% increase).
5. Discussion
5.1. Durability: Water Absorption Test
The results in Figure 2 show that the control mix exhibited a slump value of 80 mm, which lies within the low to medium slump range of 50-90 mm. This range is typically associated with concrete of medium workability, suitable for reinforced concrete construction. The slump test value is different by 40% which means replaced by volume, the mix contains more plastic particles with smooth, hydrophobic surfaces and more voids between them. This tends to reduce internal friction, making the mix much more fluid. Other studies also show that when replacement of plastic waste increases the slump value also increases [22]. Partial replacement with 15% and 30% plastic waste resulted in an increase in slump to 90 mm, reflecting improved workability while remaining within the acceptable range. With increasing of 45% and 60% the slump value increases to 100mm to 120mm. It shows as the PW increases, cohesion of the matrix got weak.
The results indicate that more plastic waste enhances the flowability of the mix and less plastic makes it stiff. Optimal workability was observed at 30–45% replacement levels of PW where the slump remained within the acceptable range for reinforced concrete. Beyond this level, particularly at 60% replacement, the mix became overly workable, which could lead to segregation or reduced stability during placement.
5.2. Compressive Strength
Compressive strength shows a clear trend, increasing plastic waste decreases the strength value. After analyzing Figure 3, control mix achieved 37.3 MPa at 56 days, the 15% PW mix retained a respectable 35.3 MPa, which still met the structural threshold of 30 MPa. Beyond this, strengths dropped sharply with the 60% PW mix achieving only 17.7 MPa. These outcomes are consistent with earlier studies, which showed strength loss to the hydrophobic nature and poor bonding capacity of plastic surfaces. Similar situation observed that compressive strength decreases as plastic aggregate content increases and small content substitutions gave acceptable strength, but larger substitutions (20-30% and more) saw big drops [22].
In Figure 4, the trendline shows that for 30%, 45% and 60% the value of compressive strength in 56 days went downward, it can happen because of weak bonding of Interfacial Transition Zone (ITZ). Low stiffness of plastic can react differently, unlike natural aggregates, plastics are flexible and deformable, reducing their ability to resist load transfer under compression. Research shows that replacing coarse aggregate with PW in small amounts like 2.5% gives minimal strength losses, but as the amount increases and especially when fine particles aren’t used to fill voids, compressive strength falls significantly [16].
Therefore, from a sustainability perspective, it suggests that PW can replace part of natural aggregates while keeping compressive strength within acceptable limits, reducing the environmental burden of aggregate extraction and plastic disposal.
5.3. Splitting Tensile Strength
In Figure 5, Splitting tensile strength results followed a similar pattern to compressive strength, with values decreasing as PW replacement increased. The control mix recorded 3.3 MPa, while 15% PW remained 3.1 MPa, both above the expected minimum of 3.0 MPa. However, for 30% replacement the value dropped below threshold, with 60% replacement producing only 1.9 MPa strength. Recycled plastic reduces splitting tensile strength by amounts often greater than compressive strength reductions, because tensile behavior is more sensitive to crack initiation and bonding issues. In their work, compressive strength reduced by up to ~31%, tensile strength by ~22%, flexural by ~60% [30]. In Figure 6, the regression model R² = 0.97 confirms the strong negative correlation between PW content and tensile strength. This shows more PW reduces also the tensile strength which like compressive strength.
5.4. Durability of Concrete: Water Absorption
Water absorption results showed a different trend in Figure 7. At 15% PW replacement, absorption decreased slightly to 4.73% compared to the control was 4.83%, suggesting improved resistance to water ingress. This could be due to the impermeable nature of PW, which blocks continuous pore networks within the matrix. However, at higher replacements, absorption increased significantly, reaching 6.17% at 60% PW. This reflects increased porosity and reduced compaction caused by the poor packing of coarse PW particles. Higher absorption is detrimental, as it accelerates deterioration processes such as freeze–thaw damage and chloride ingress.
Research also shows absorption and porosity increase as plastic content increases. For low replacement like 5%, absorption losses are small but worsen at larger substitution percentages [31]. The dual nature of this finding highlights that PW content must have small dosages which enhance durability, but excessive amounts compromise it. High absorption usually means more interconnected voids and capillaries which allow water and dissolved salts to penetrate more easily. So, durability is an important point which shows if PW appears beneficial only at ≤15% replacement levels.
5.5. Microstructural Analysis
For the controlled mix in Figure 8, the SEM analysis provided valuable insight into the observed mechanical trends. It showed dense hydration products, primarily C–S–H, distributed throughout the cement matrix. The present of C-S-H gel is the highest which shows good bond. The ITZ between natural aggregates and cement paste appeared relatively well-bonded, with only minor microcracks. This dense microstructure explains the high compressive and tensile strength recorded in the control mix, as well as the relatively low water absorption. Similar microstructural patterns have been reported in conventional Portland cement concretes, where strong ITZs provide effective load transfer and resistance to crack propagation [30].
In Figure 9, the SEM images indicated the presence of weak bonding areas around the PW particles due to their hydrophobic surfaces. The C-S-H gel was seen also less than the control mix value. However, C–S–H gel was still observed bridging between the plastic and cementitious matrix, and alumino-silicate phases were also detected which may have contributed to maintaining acceptable strength. Water absorption was also reduced at this level, which could be explained by PW particles obstructing continuous pore channels [32].
From the last two experiment results, it was evident that if the replacement increases the bonding gets weaker. So, for the last three replacement samples in Figure 10 shown the cementitious and plastic waste bond. Micro voids and cracks formed around PW particles while the cement paste often showed signs of shrinkage away from plastic surfaces. These weak ITZs correlate directly with the significant loss of compressive and tensile strength observed in the mechanical tests. Comparable SEM studies demonstrated that increased PW content introduces porosity and weak interfaces, reducing the matrix’s load transfer efficiency [16]. At 60 % replacement, it shows weak bond with cement, large voids and interfacial cracks with minimal C–S–H formation on the plastic surfaces. These features explain the substantial drop in compressive strength and the sharp rise in water absorption. The strength reduction corresponds to weak ITZ’s and increased porosity and durability declines at higher PW contents due to microcracks and voids.
5.6. Life Cycle Perspective
The LCA results indicate that cement production dominates CO₂ emissions, overshadowing the effect of aggregate or plastic substitution. While incorporating recycled plastic waste (PW) does not significantly reduce embodied carbon, it provides sustainability benefits by diverting plastic waste from landfills and reducing natural aggregate extraction. Embodied energy shows a slight increase with higher PW content due to processing requirements. Therefore, PW concrete’s environmental advantage lies in resource conservation and waste management rather than direct carbon reduction. Comprehensive LCA covering service life and end-of-life stages is recommended for future studies
6. Conclusions and Recommendations
This research contributes to the growing knowledge on sustainable construction materials by demonstrating both the promise and the challenges of incorporating plastic waste into concrete. While the findings confirm that only limited replacement levels are viable for structural applications, they also highlight the potential of PW as part of broader strategies for circular economy and sustainable construction.
6.1. Conclusion
- The results of the slump test demonstrated that replacing coarse aggregates with plastic waste on volume basis increased the workability of fresh concrete. High slump means lots of water in the admixture, it can cause segregation, poor durability and voids. Improved workability shows because of the smooth texture and low density of plastic waste. The standard slump value shows in the replacement level of ≤15% PW that offers environmental benefits while maintaining structural integrity.
- Sieve analysis revealed that most PW particles in the range of 2 mm to 3.35 mm, within the range of Coarse Sand and Fine aggregate range. But mostly it is suitable for fine aggregate particles. Rather than throwing the plastic into dump, it is environmentally friendly to use it in the construction materials. Sieve analysis helps to find which replacement can be beneficial for the construction either with fine aggregate or coarse aggregate. In this study, it replaced with the coarse aggregate and the result shows less than 15% replacement can be usable for the concrete mix design.
- The focus of this study is on compressive strength analysis. The results show that compressive strength decreases with the increase of plastic waste content. At 15% replacement, the compressive strength was 35.3 MPa at 56 days which crossed the minimum strength range of our study. For the higher replacement, it shows that compressive strength decreases in 56 days compared to 28 days. It is because of the weak bonding in interfacial transition zone (ITZ). Plastic waste (PW) has a smooth, hydrophobic surface that does not chemically bond with cement paste. Over the time microcracks in this weak ITZ can propagate which reduce the load-carrying capacity instead of improving it.
- The splitting tensile strength also shows similar trends as the compressive strength test. The test occurred after 28 days of curing; 15% replacement only achieved the minimum strength with control mix. Higher PW showed decrease in strength. This indicates that a balance can be achieved between sustainability by using recycled materials and achieving the performance of design standards.
- Water absorption shows how much water can take in through its pores. Here, in this study, water absorption was slightly reduced at 15% PW by 4.73%, suggesting enhanced impermeability due to the non-porous nature of plastic. Increasing of the PW also increases the value of water absorption percentage which means high porosity, more interconnected voids and less resistance ingress.
- SEM analysis revealed that at low replacement of plastic waste, C-S-H gel was present and limited bonding showed between plastic particles and cement. But at higher PW replacement, ITZ showed weak bond, microcracks, voids become more prominent which explains why the compressive and tensile strength observed low strength.
- The LCA confirms that cement drives most environmental impacts, limiting direct carbon savings from PW substitution. However, PW integration supports circular economy principles by reducing landfill disposal and aggregate extraction. Combining mechanical performance data with full life cycle assessment is essential to ensure genuine sustainability gains across the concrete life span.
- All these findings proved that limited range of replacement of plastic waste in mix design can be usable for construction. Plastic waste is diverted from landfills, marine ecosystem, which reduces reliance on natural aggregate extraction. Reintegrating non-biodegradable waste into the construction cycle as a material. It will be cost efficient and environmentally sustainable.
6.2. Recommendations for Future Work
- Investigate the particle size and see which type of aggregate replacement will be beneficial for the mix design. Also, it needs to do chemical or mechanical modifications of PW to enhance adhesion with cement paste.
- Combining PW with supplementary cementitious materials such as fly ash, silica fume which may counterbalance strength loss while lowering CO₂ emissions from cement.
- Analyze overall environmental impact of using PW in concrete mix, considering embodied carbon, cost, energy savings and life cycle analysis.
- PW concrete should be prioritized for paving blocks, lightweight panels and non-load-bearing walls, where sustainability benefits outweigh strength demands.
- The durability and workability under the UV ray, temperature changes and chemical exposure also need to be proven. The costs of the whole collection of plastic and make usable for construction also need to be taken into consideration.
- Recent projects should be developed to assess real-world applicability, addressing practical concerns such as handling, scalability and economic feasibility, which will show the performance of partial replacement of plastic waste in concrete.
Author Contributions
Conceptualization (JO, IJR. BA), methodology (JO, IJR. BA), resources (JO, IJR. BA), data curation (JO, IJR. BA), writing (JO, IJR. BA), visualization (JO, IJR. BA), supervision (JO, IJR. BA), project administration (JO, IJR. BA). All authors have read and agreed to the published version of the manuscript
Funding
Not applicable.
Institutional Review Board Statement
Not applicable.
Informed Consent Statement
Not applicable.
Data Availability Statement
Data contained within the research.
Acknowledgments
The authors would like to acknowledge the support of lab technicians of Civil Engineer Department.
Conflicts of Interest
The authors declare no conflicts of interest.
Abbreviations
The following abbreviations are used in this manuscript:
| PW | Plastic Waste |
| PC | Portland Cement |
| PFA | Pulverised Fuel Ash |
| GGBS | Ground Granulated Blast-furnace Slag |
| ITZ | Interfacial Transition Zone |
| SEM | Scanning Electron Microscopy |
| C-S-H | Calcium-Silicate-Hydrate |
| PP | Polypropylene |
| HDPE | High-Density Polyethylene |
| PET | Polyethylene Terephthalate |
References
- Yu, Z.; Nurdiawati, A.; Kanwal, Q.; Al-Humaiqani, M.M.; Al-Ghamdi, S.G. Assessing and mitigating environmental impacts of construction materials: Insights from environmental product declarations. J. Build. Eng. 2024, 98. [Google Scholar] [CrossRef]
- Chaurasiya, C. and Dayashankar, V.A., "Recycled Plastic in Concrete: A Comprehensive Review," nternational Research Journal of Modernization in Engineering Technology and Science, vol. 6, p. 11, 2024.
- Geyer, R.; Jambeck, J.R.; Law, K.L. Production, use, and fate of all plastics ever made. Sci. Adv. 2017, 3, e1700782. [Google Scholar] [CrossRef] [PubMed]
- Gu, L.; Ozbakkaloglu, T. Use of recycled plastics in concrete: A critical review. Waste Manag. 2016, 51, 19–42. [Google Scholar] [CrossRef] [PubMed]
- Almeshal, I.; Tayeh, B.A.; Alyousef, R.; Alabduljabbar, H.; Mohamed, A.M. Eco-friendly concrete containing recycled plastic as partial replacement for sand. J. Mater. Res. Technol. 2020, 9, 4631–4643. [Google Scholar] [CrossRef]
- Siddique, R.; Khatib, J.; Kaur, I. Use of recycled plastic in concrete: A review. Waste Manag. 2008, 28, 1835–1852. [Google Scholar] [CrossRef] [PubMed]
- Mashaan, N.S. Waste Plastic In Concrete: Review And State Of The Art. Nanotechnology Perceptions 2024, 20, 594–614. [Google Scholar] [CrossRef]
- Saikia, N. and De Brito, J., ". Mechanical properties and abrasion behaviour of concrete containing shredded PET bottle waste as a partial substitution of natural aggregate," Construction and Building Materials, vol. 52, p. 236-244, 2014.
- Ma, S.; Li, W.; Shen, X. Study on the physical and chemical properties of Portland cement with THEED. Constr. Build. Mater. 2019, 213, 617–626. [Google Scholar] [CrossRef]
- Tararushkin, E.V., Shchelokova, T.N. and Kudryavtseva, V.D., "A study of strength fluctuations of Portland cement by FTIR," OP Conference Series Materials Science and Engineering, vol. 919, no. 2, p. 022017, 2020.
- Ismail, Z.Z.; Al-Hashmi, E.A. Use of waste plastic in concrete mixture as aggregate replacement. Waste Manag. 2008, 28, 2041–2047. [Google Scholar] [CrossRef] [PubMed]
- Mashaan, N.S.; Ouano, C.A.E. An Investigation of the Mechanical Properties of Concrete with Different Types of Waste Plastics for Rigid Pavements. Appl. Mech. 2025, 6, 9. [Google Scholar] [CrossRef]
- Al-Manaseer, A.A. and Dalal, B.J., "Concrete Containing Plastic Aggregate," Concrete International, vol. 19, p. 47-52, 1997.
- Chen, Z., Wang, X., Jiang, K., Zhao, X., Liu, X and Wu, Z. 2024. The splitting tensile strength and impact resistance of concrete reinforced with hybrid BFRP minibars and micro fibers. Journal of Building Engineering, Volume 88, p. 109188., "The splitting tensile strength and impact resistance of concrete reinforced with hybrid BFRP minibars and micro fibers," Journal of Building Engineering, vol. 88, p. 109188, 2024. [CrossRef]
- Hamada, H.M.; Al-Attar, A.; Abed, F.; Beddu, S.; Humada, A.M.; Majdi, A.; Yousif, S.T.; Thomas, B.S. Enhancing sustainability in concrete construction: A comprehensive review of plastic waste as an aggregate material. Sustain. Mater. Technol. 2024, 40. [Google Scholar] [CrossRef]
- Mohamedsalih, M.A.; Radwan, A.E.; Alyami, S.H.; El Aal, A.K.A. The Use of Plastic Waste as Replacement of Coarse Aggregate in Concrete Industry. Sustainability 2024, 16, 10522. [Google Scholar] [CrossRef]
- Magbool, H.M. Sustainability of utilizing recycled plastic fiber in green concrete: A systematic review. Case Stud. Constr. Mater. 2025, 22. [Google Scholar] [CrossRef]
- Lee, Z.H.; Paul, S.C.; Kong, S.Y.; Susilawati, S.; Yang, X. Modification of Waste Aggregate PET for Improving the Concrete Properties. Adv. Civ. Eng. 2019, 2019. [Google Scholar] [CrossRef]
- Zuo, J.; Zhao, Z.-Y. Green building research–current status and future agenda: A review. Renew. Sustain. Energy Rev. 2014, 30, 271–281. [Google Scholar] [CrossRef]
- Asrat, F.S.; Ghebrab, T.T. Effect of Mill-Rejected Granular Cement Grains on Healing Concrete Cracks. Materials 2020, 13, 840. [Google Scholar] [CrossRef] [PubMed]
- Neville, A.M., Properties of Concrete, 5th ed., Pearson Education Limited, 2011.
- Oti, J.; Adeleke, B.O.; Rathnayake, M.; Kinuthia, J.M.; Ekwulo, E. Strength and Durability Characterization of Structural Concrete Made of Recycled Plastic. Materials 2024, 17, 1841. [Google Scholar] [CrossRef] [PubMed]
- BS EN 12390-2:2019, "Testing hardened concrete, Part 2: Making and curing specimens for strength tests," 31 July 2019. [Online].
- BS EN 12390-3:2019, "Testing hardened concrete, Part 4: Compressive strength of test specimens," 31 July 2019. [Online].
- BS EN 12390-6:2023, "Testing hardened concrete, Part 6: Tensile splitting strength of test specimens," 30 November 2023. [Online].
- BS EN 12350-2:2019, "Testing fresh concrete, Part 2: Slump test," 31 July 2019. [Online].
- BS EN 1097-6:2022, "Tests for mechanical and physical properties of aggregates - Determination of particle density and water absorption," 31 March 2022. [Online].
- BS EN 933-1:2012, "Tests for geometrical properties of aggregates, Part 1: Determination of particle size distribution. Sieving method," 29 February 2012. [Online].
- BS 1881-211:2016, "Testing concrete - Procedure and terminology for the petrographic examination of hardened concrete," 30 November 2016. [Online].
- Shukur, M.H.; Ibrahim, K.A.; Al-Darzi, S.Y.; Salih, O.A. Mechanical properties of concrete using different types of recycled plastic as an aggregate replacement. Cogent Eng. 2023, 10. [Google Scholar] [CrossRef]
- Gámez-García, D.C.; Vargas-Leal, A.J.; Serrania-Guerra, D.A.; González-Borrego, J.G.; Saldaña-Márquez, H. Sustainable Concrete with Recycled Aggregate from Plastic Waste: Physical–Mechanical Behavior. Appl. Sci. 2025, 15, 3468. [Google Scholar] [CrossRef]
- Savoikar, P.P., Orr, J.J. and Borkar, S.P., "Advanced tests for durability studies of concrete with plastic waste," 2015.
Figure 1.
Recycled plastics particle size distribution.
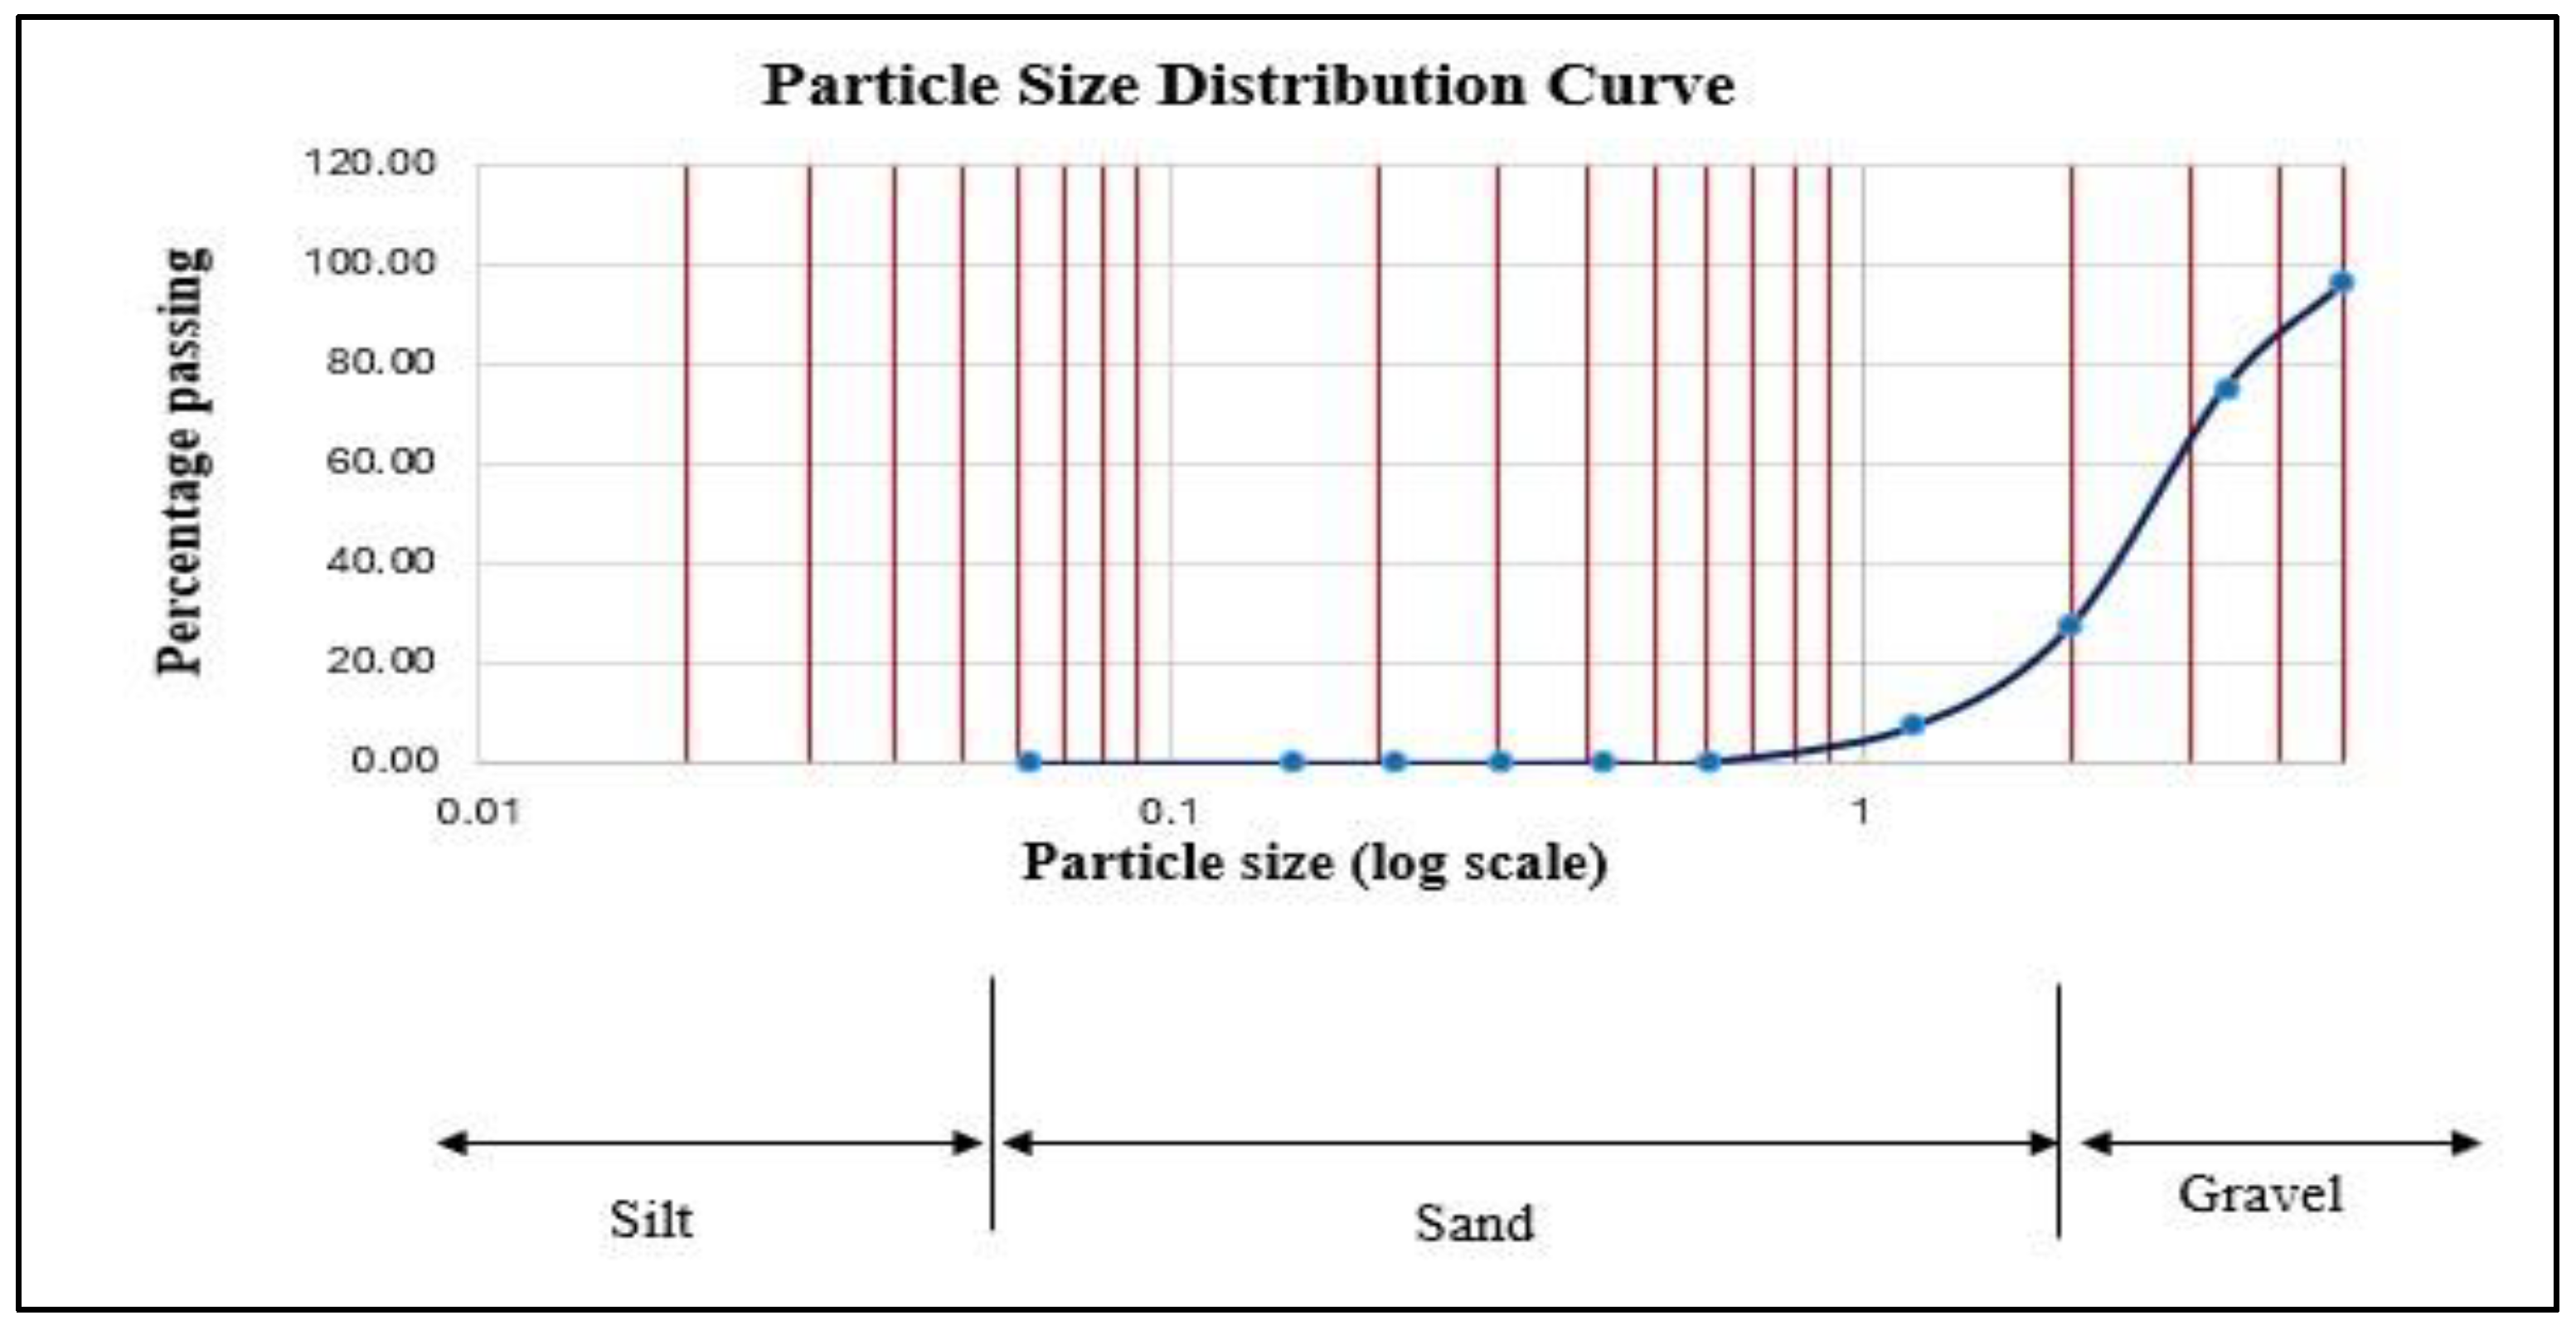
Figure 2.
Slump Test Result.
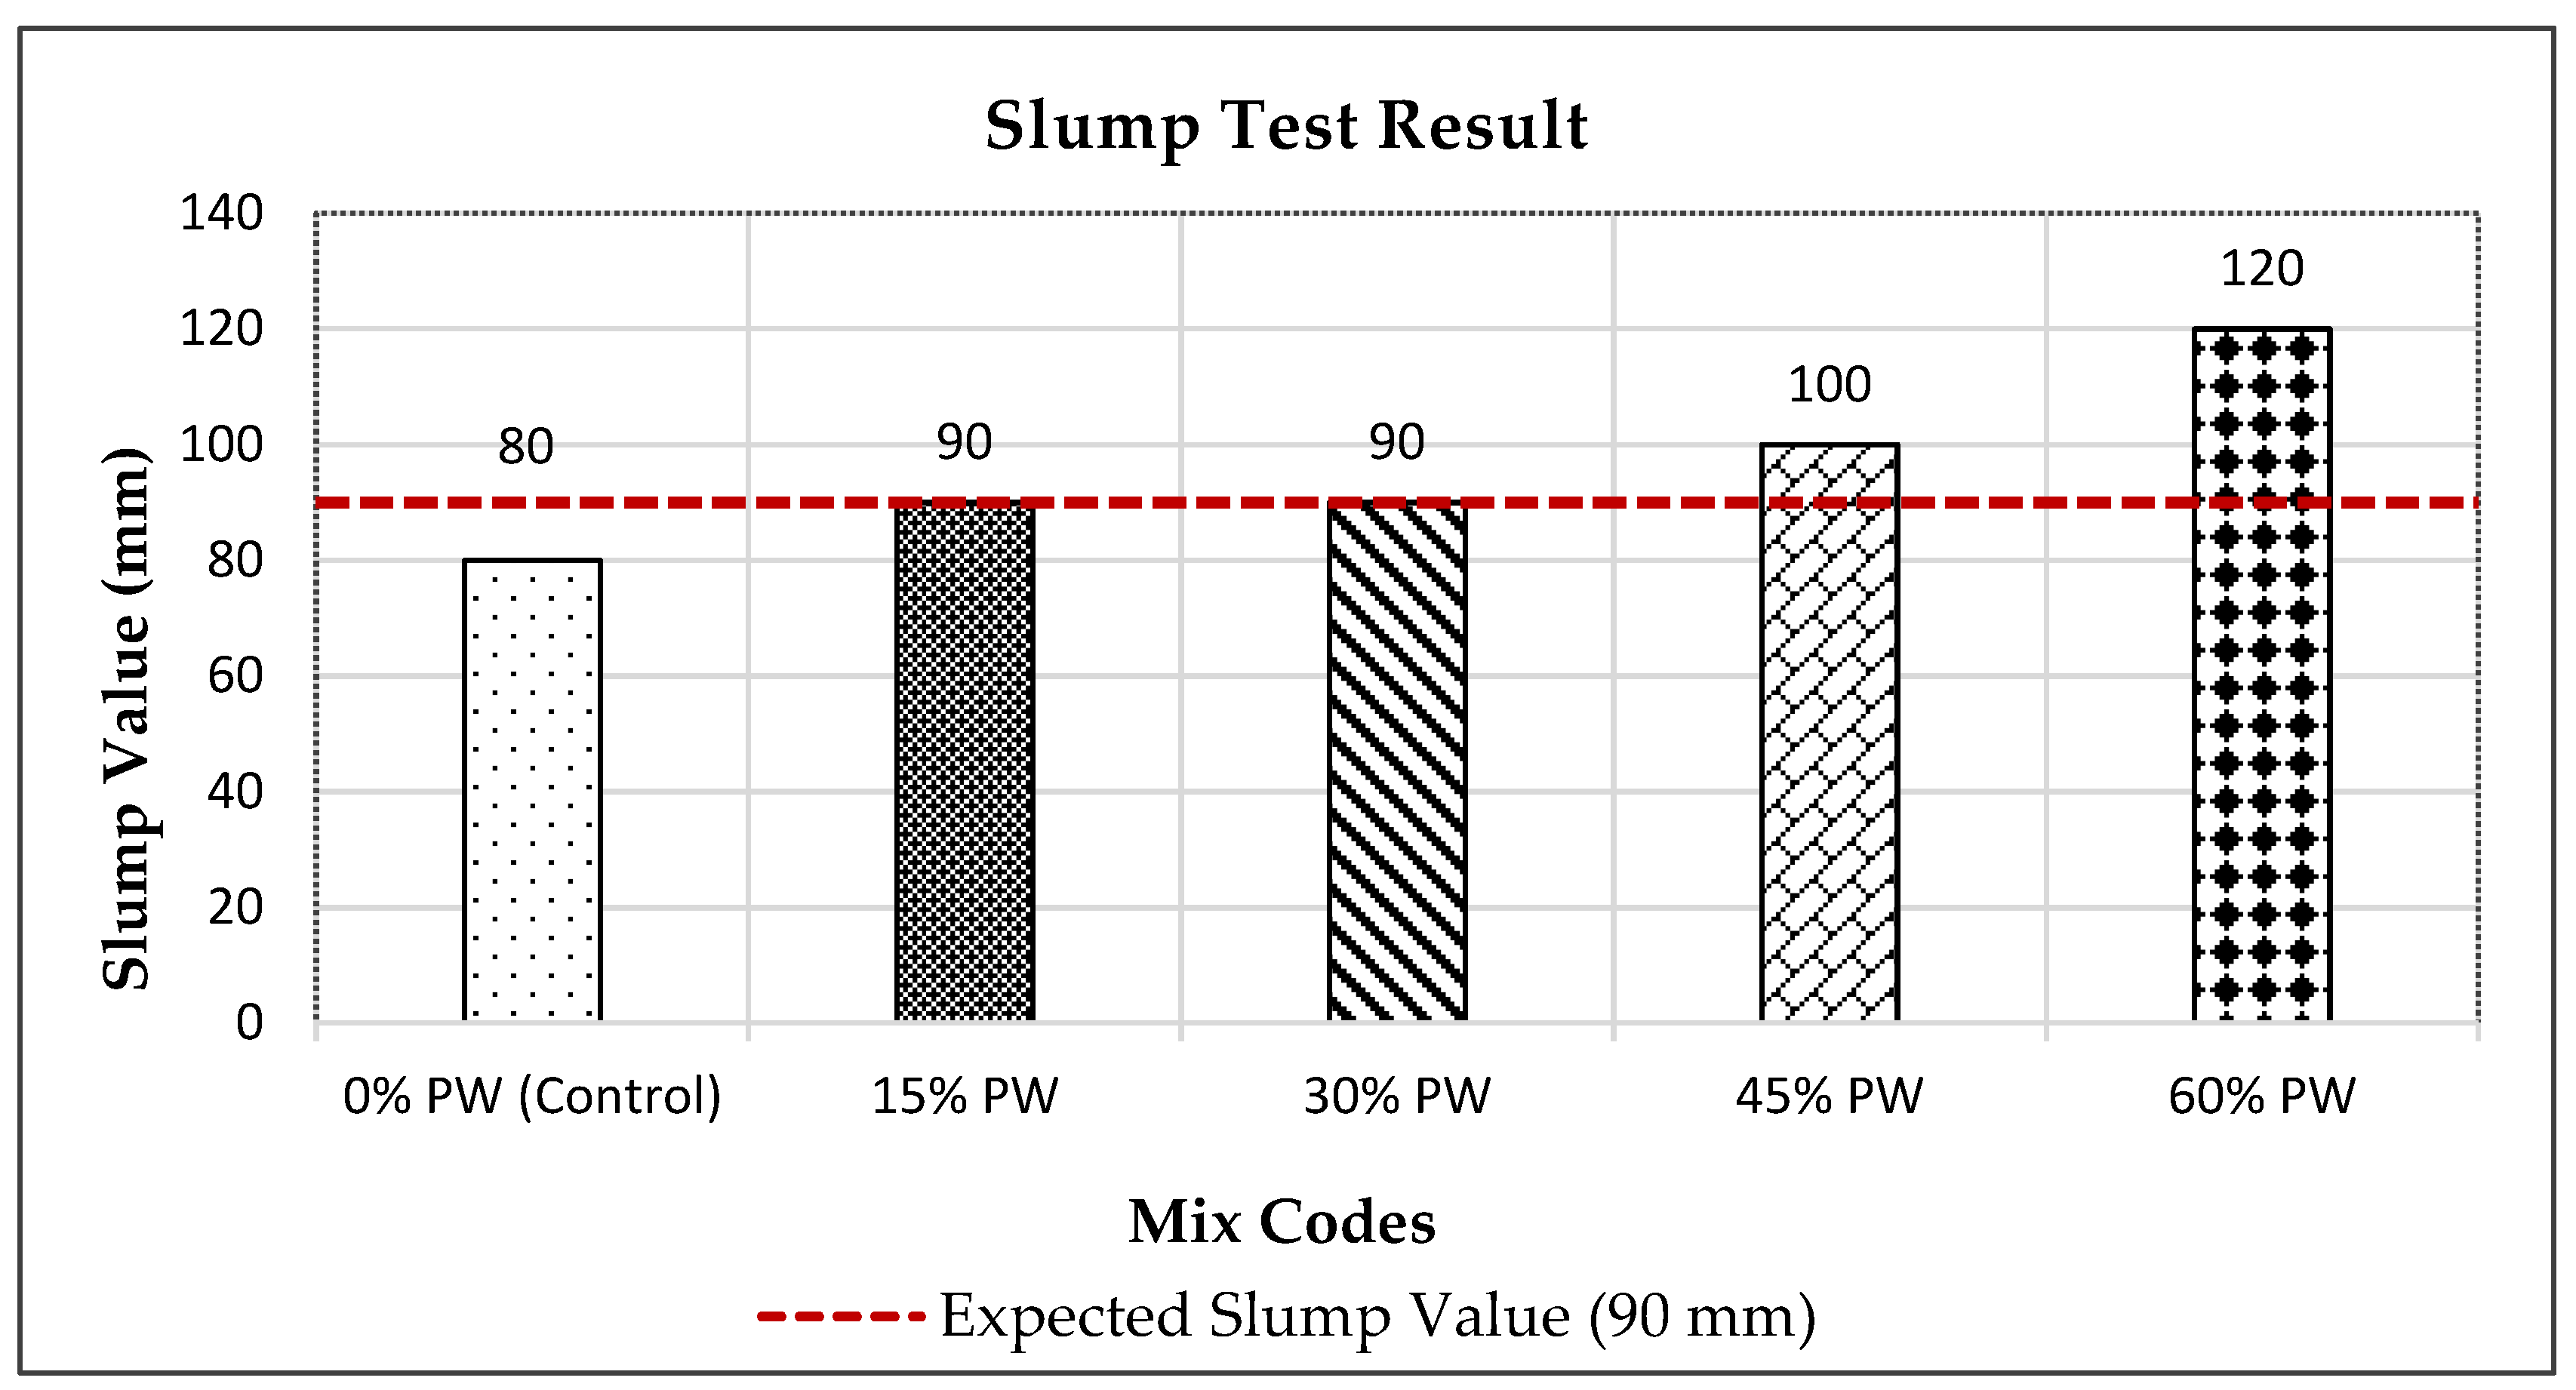
Figure 3.
Compressive Strength Difference During Times.
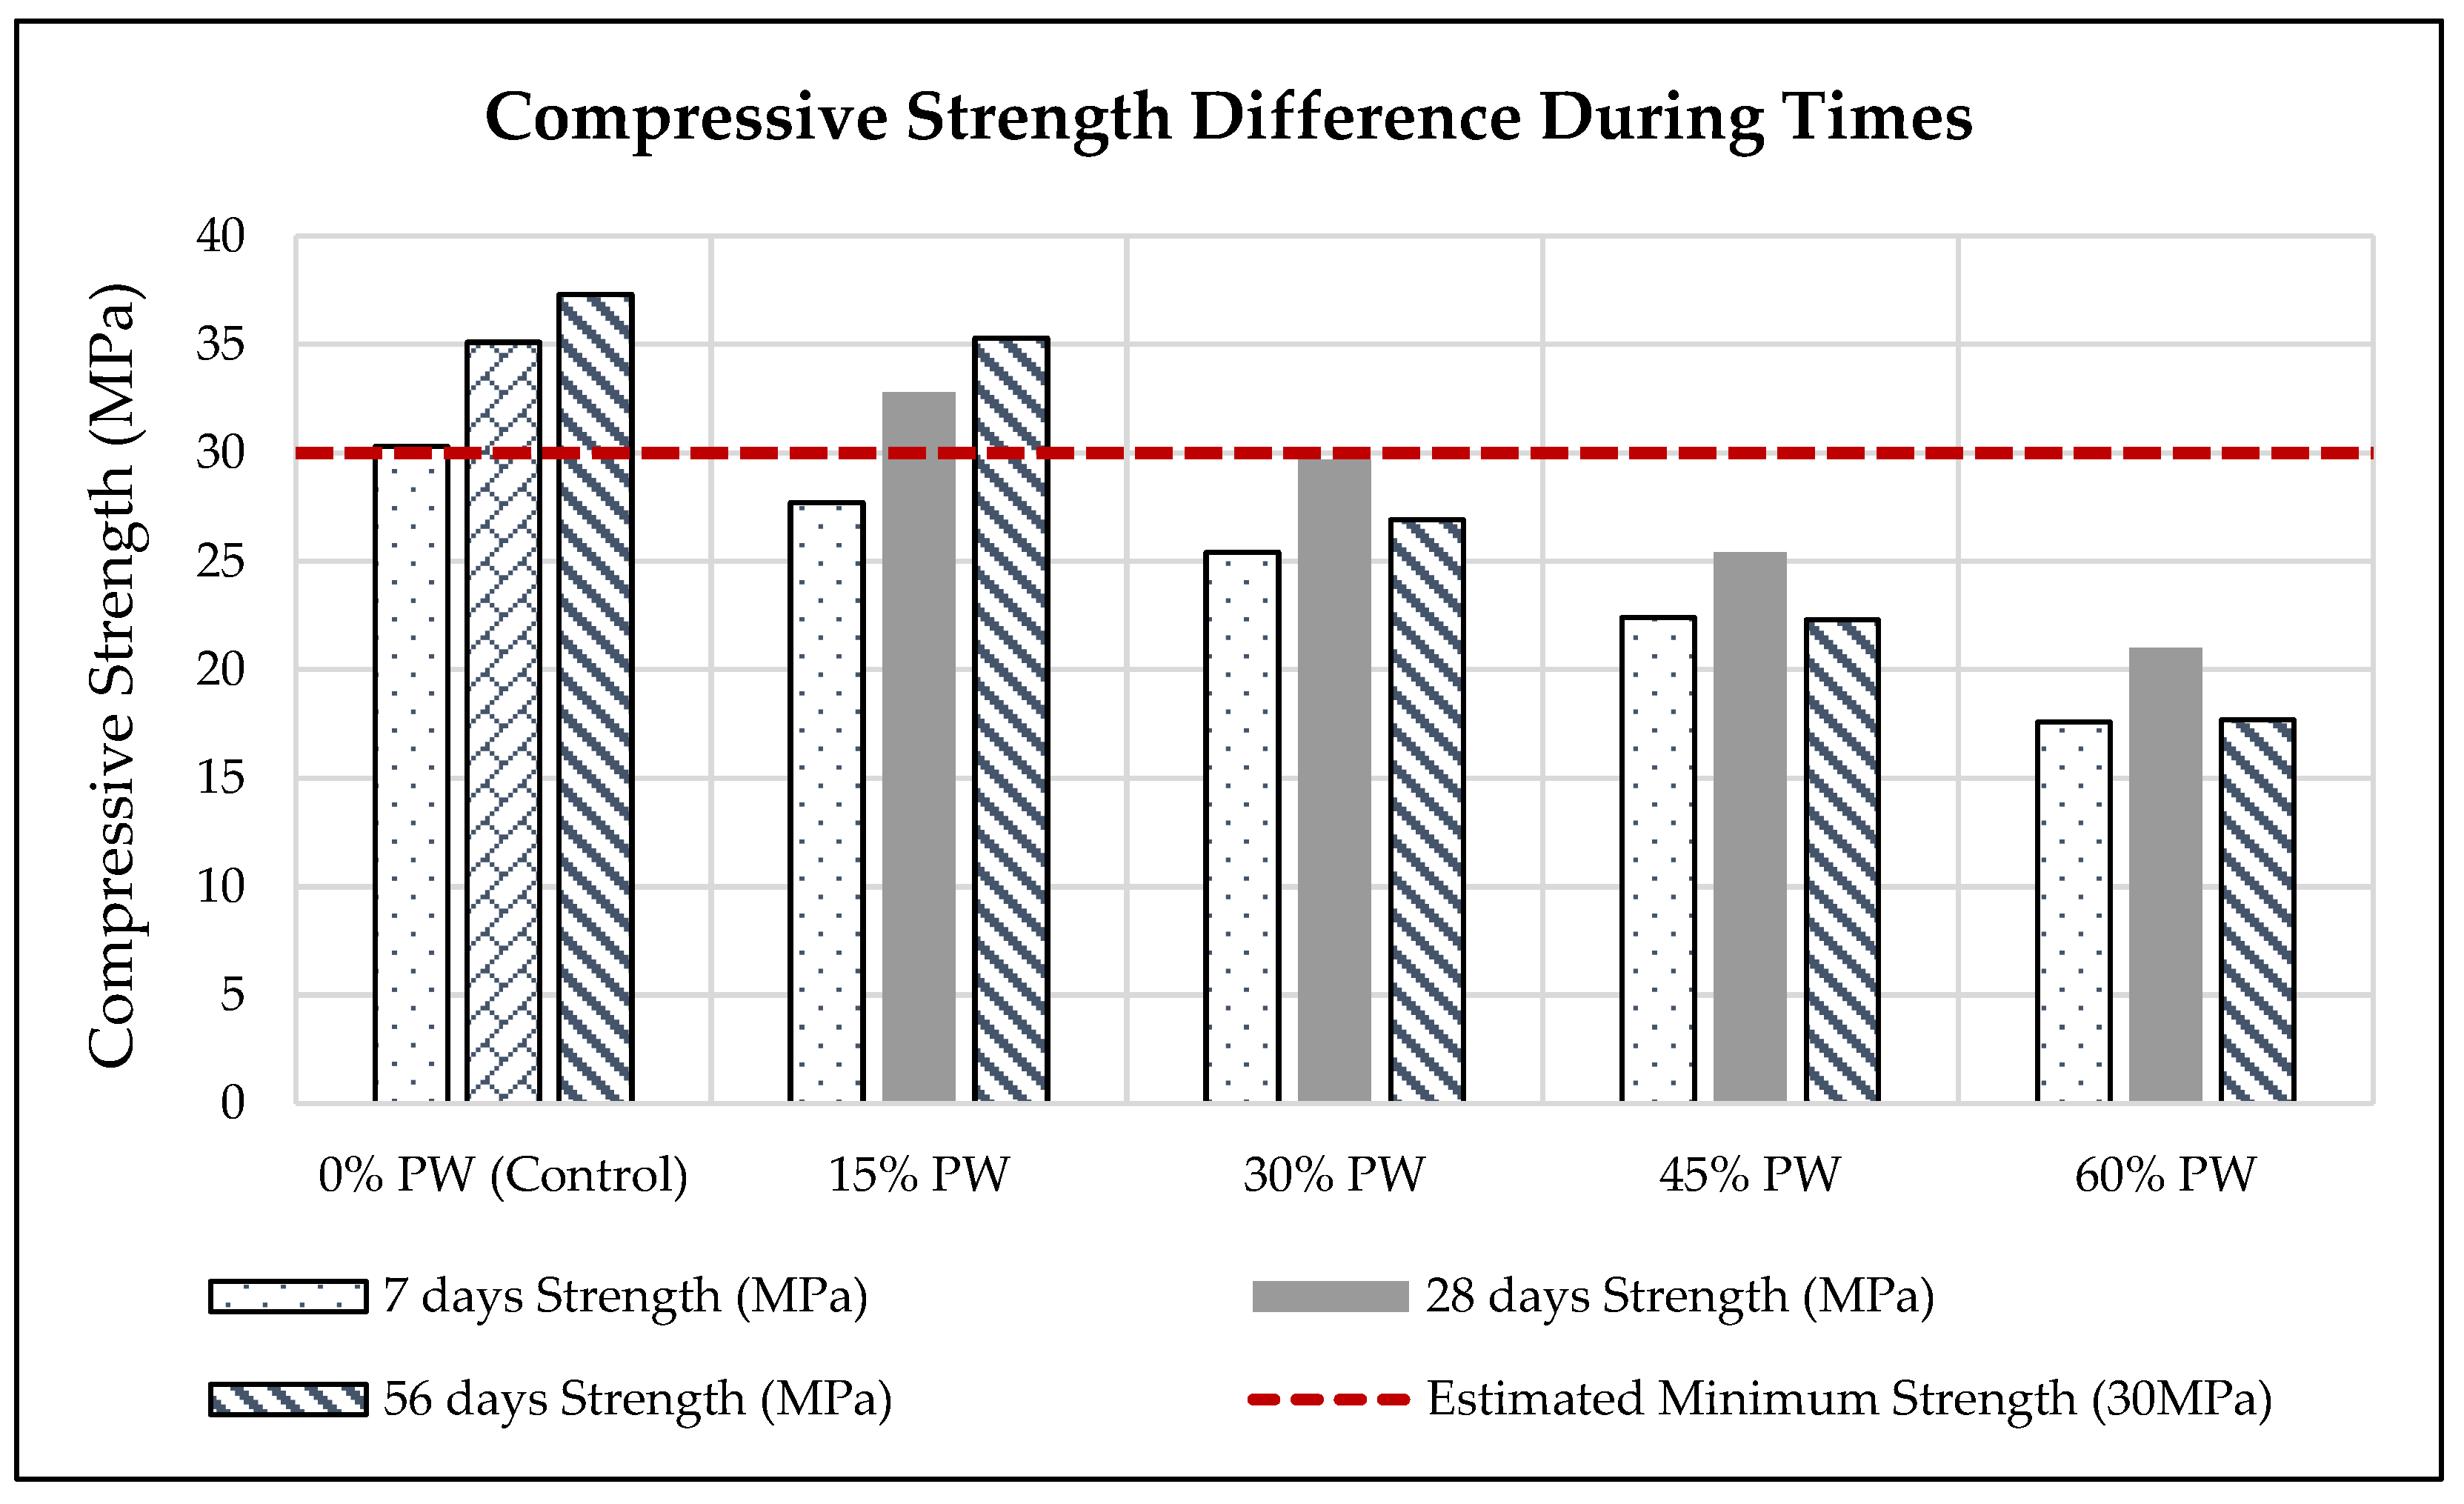
Figure 4.
Compressive Strength Statistical Model.
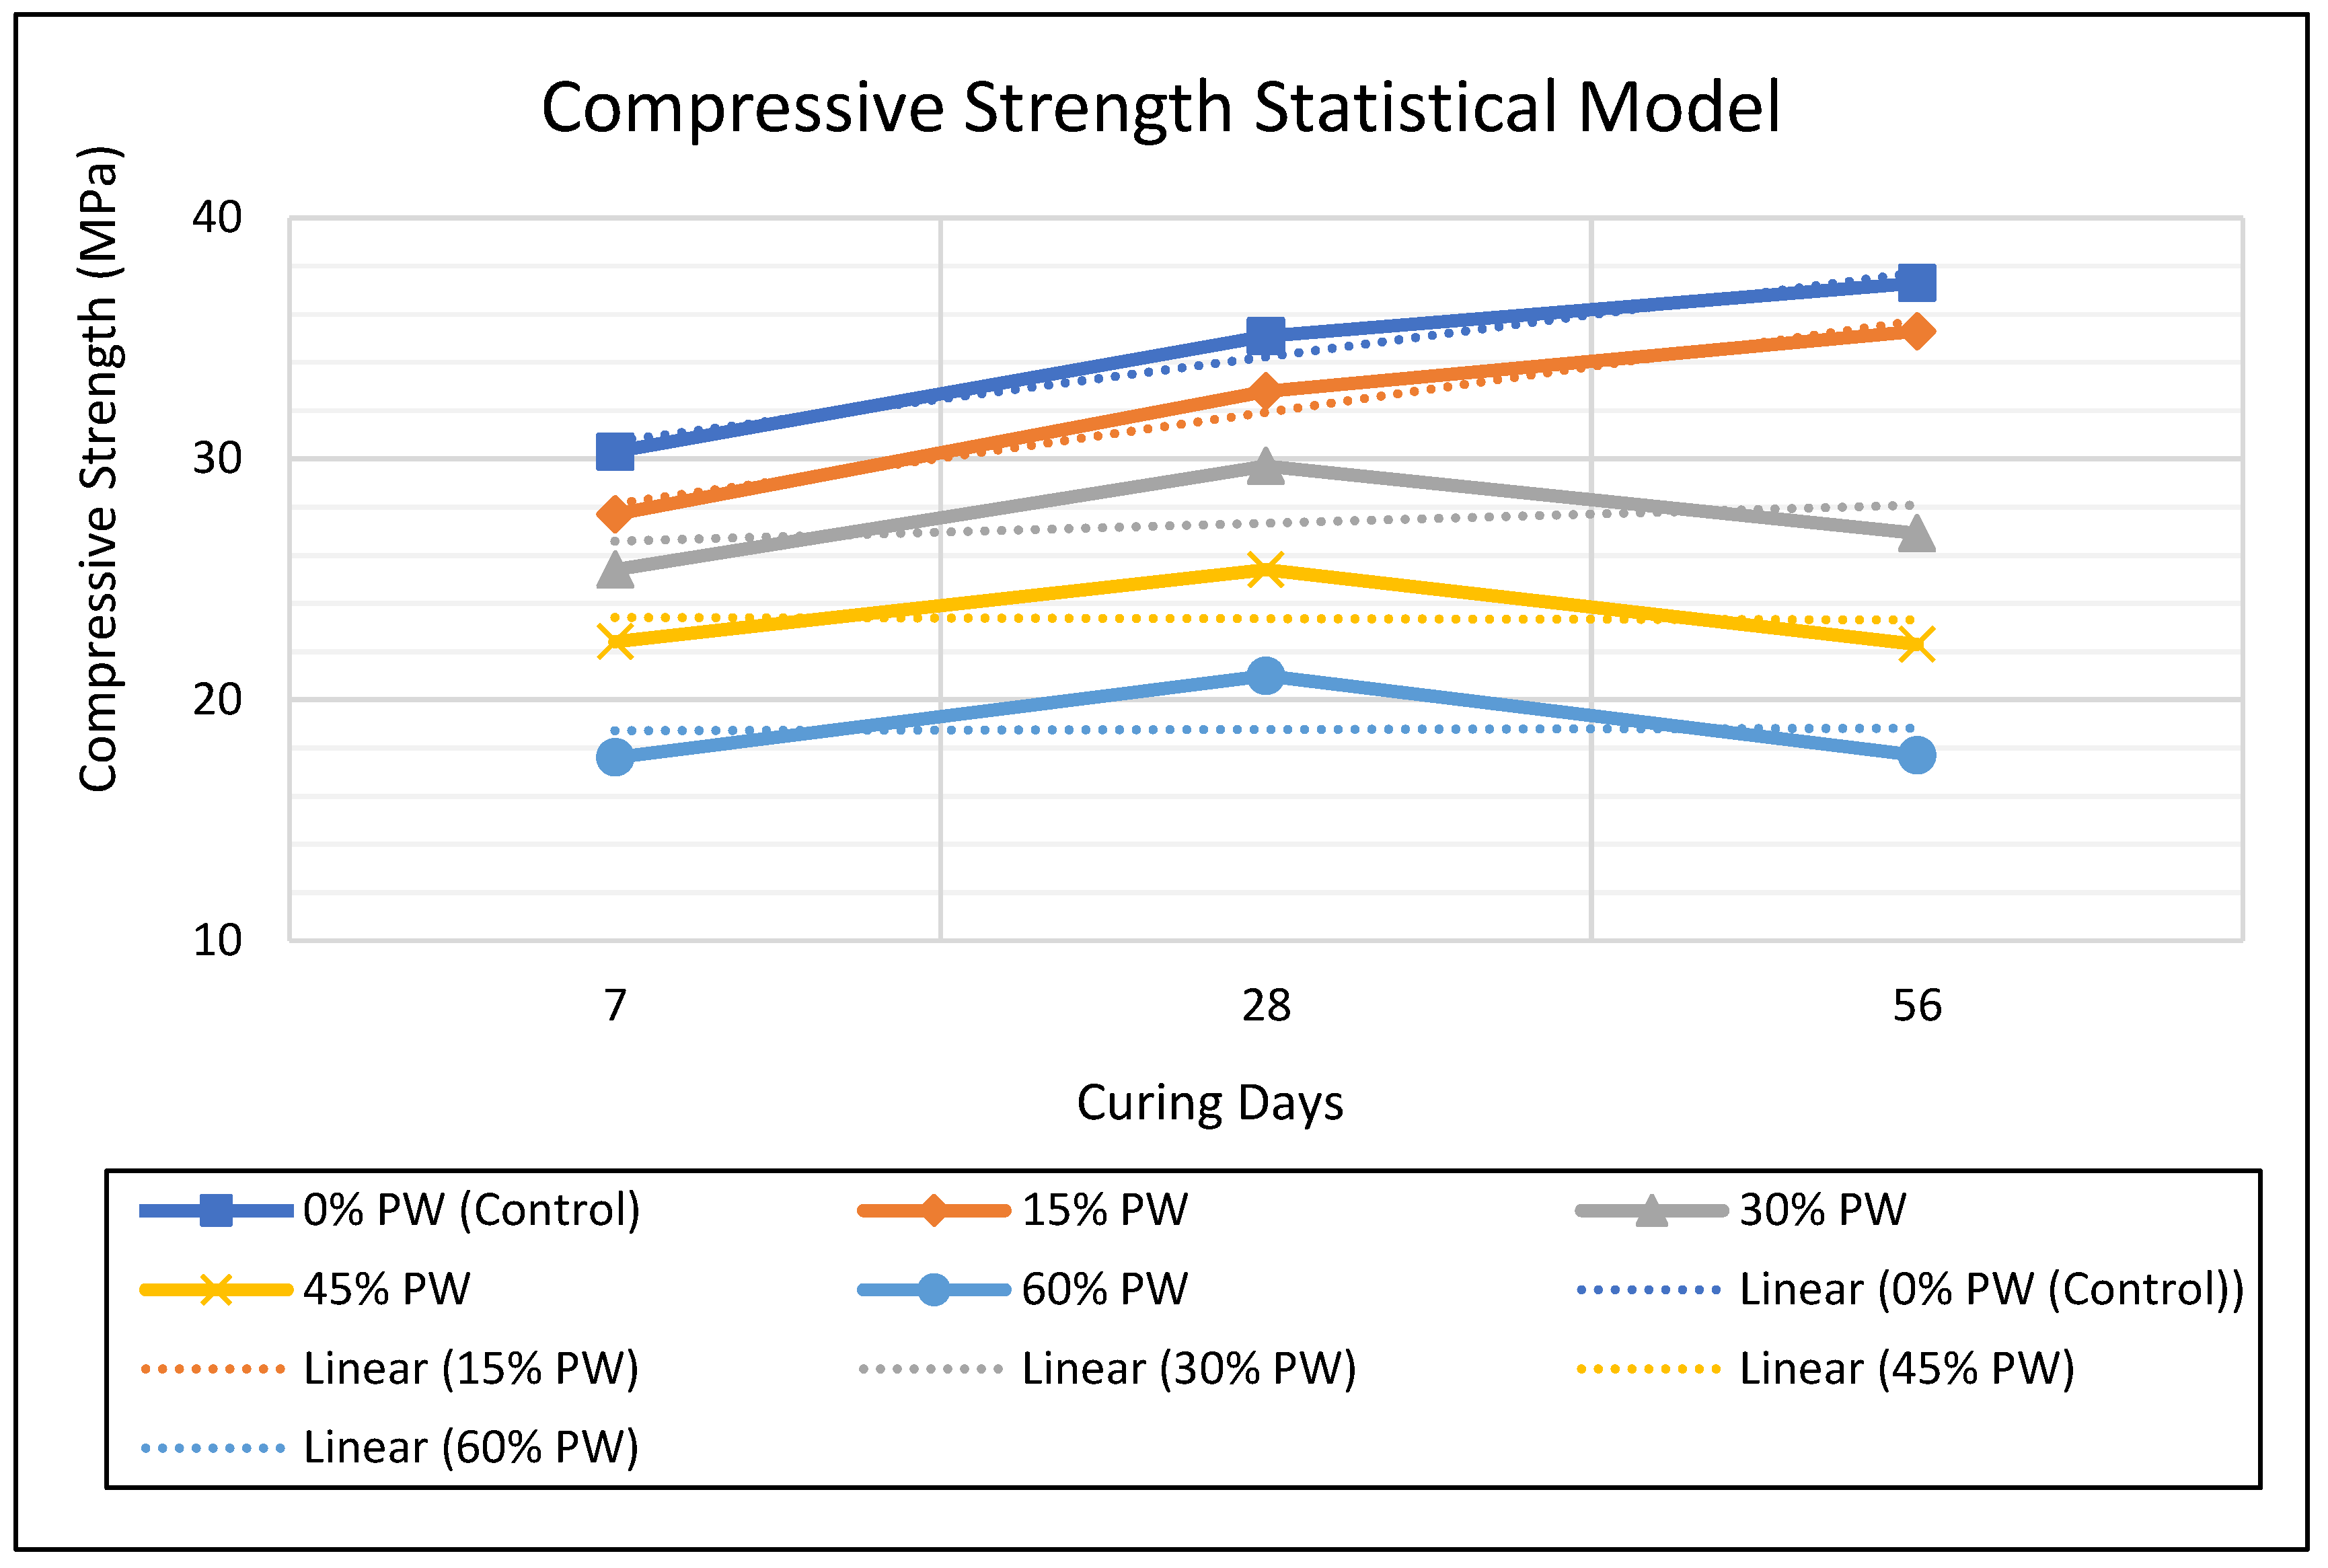
Figure 5.
Splitting Tensile Strength after 28 Days.
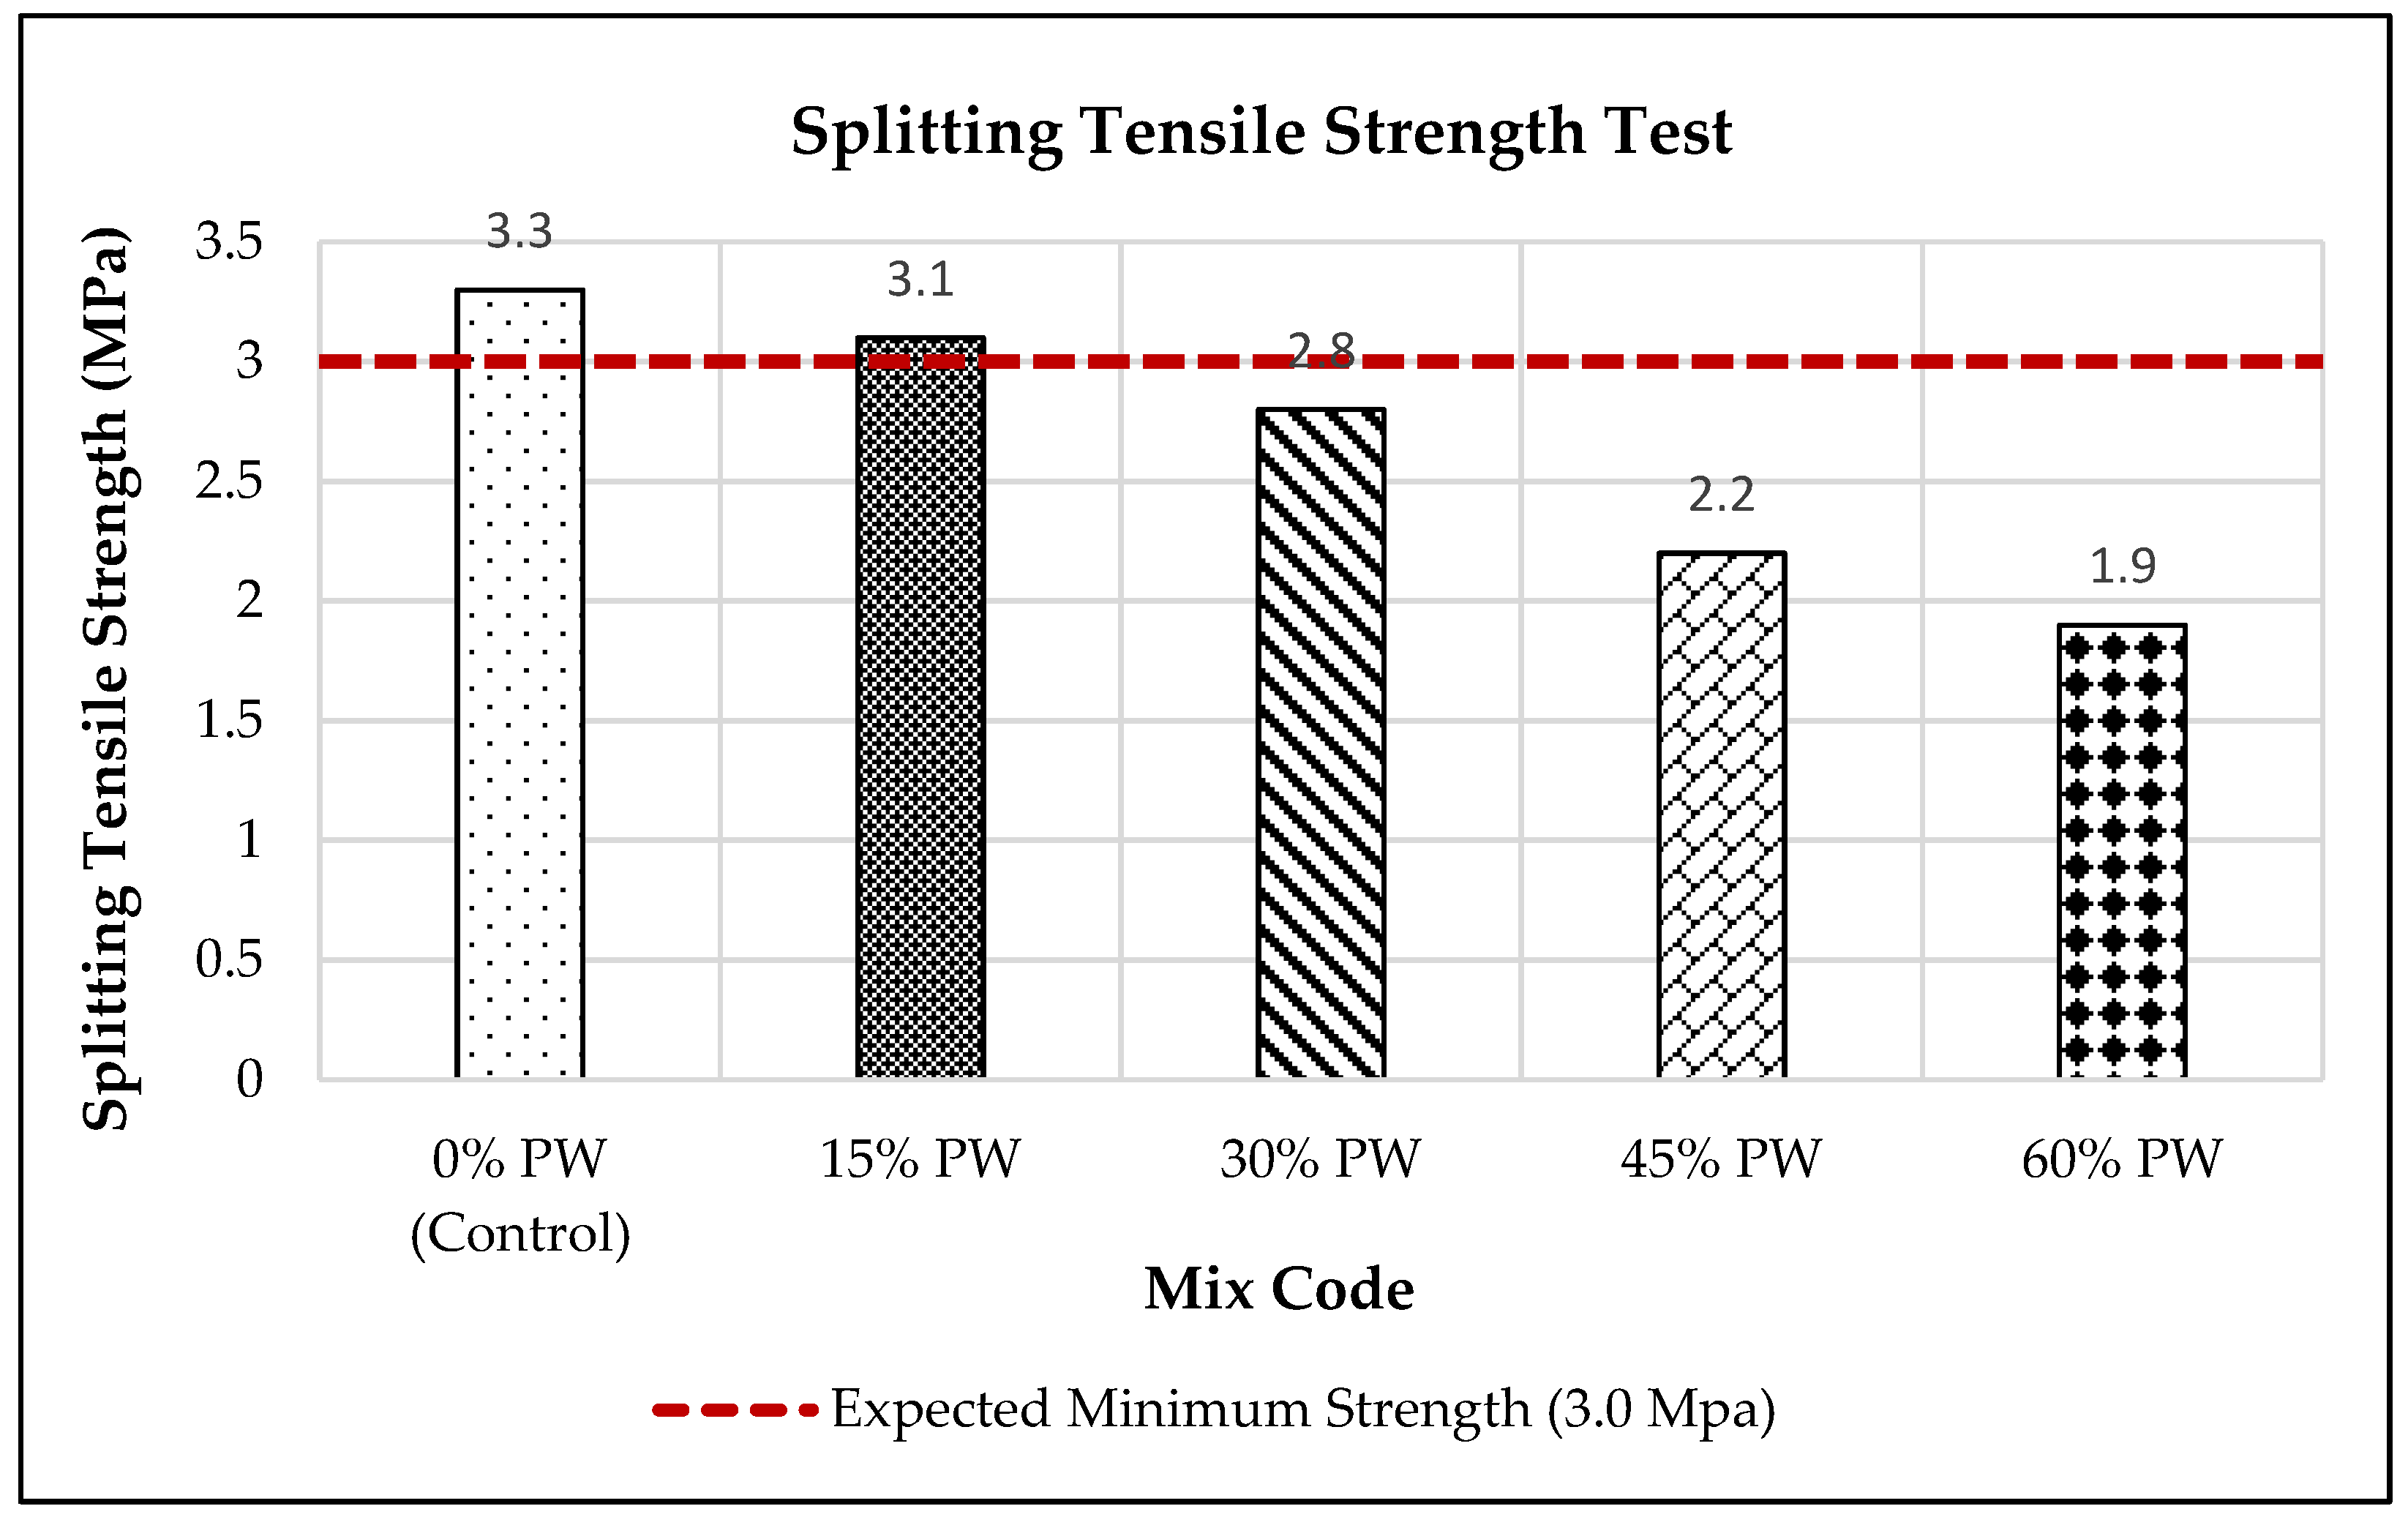
Figure 6.
Splitting Tensile Strength Statistical Model.
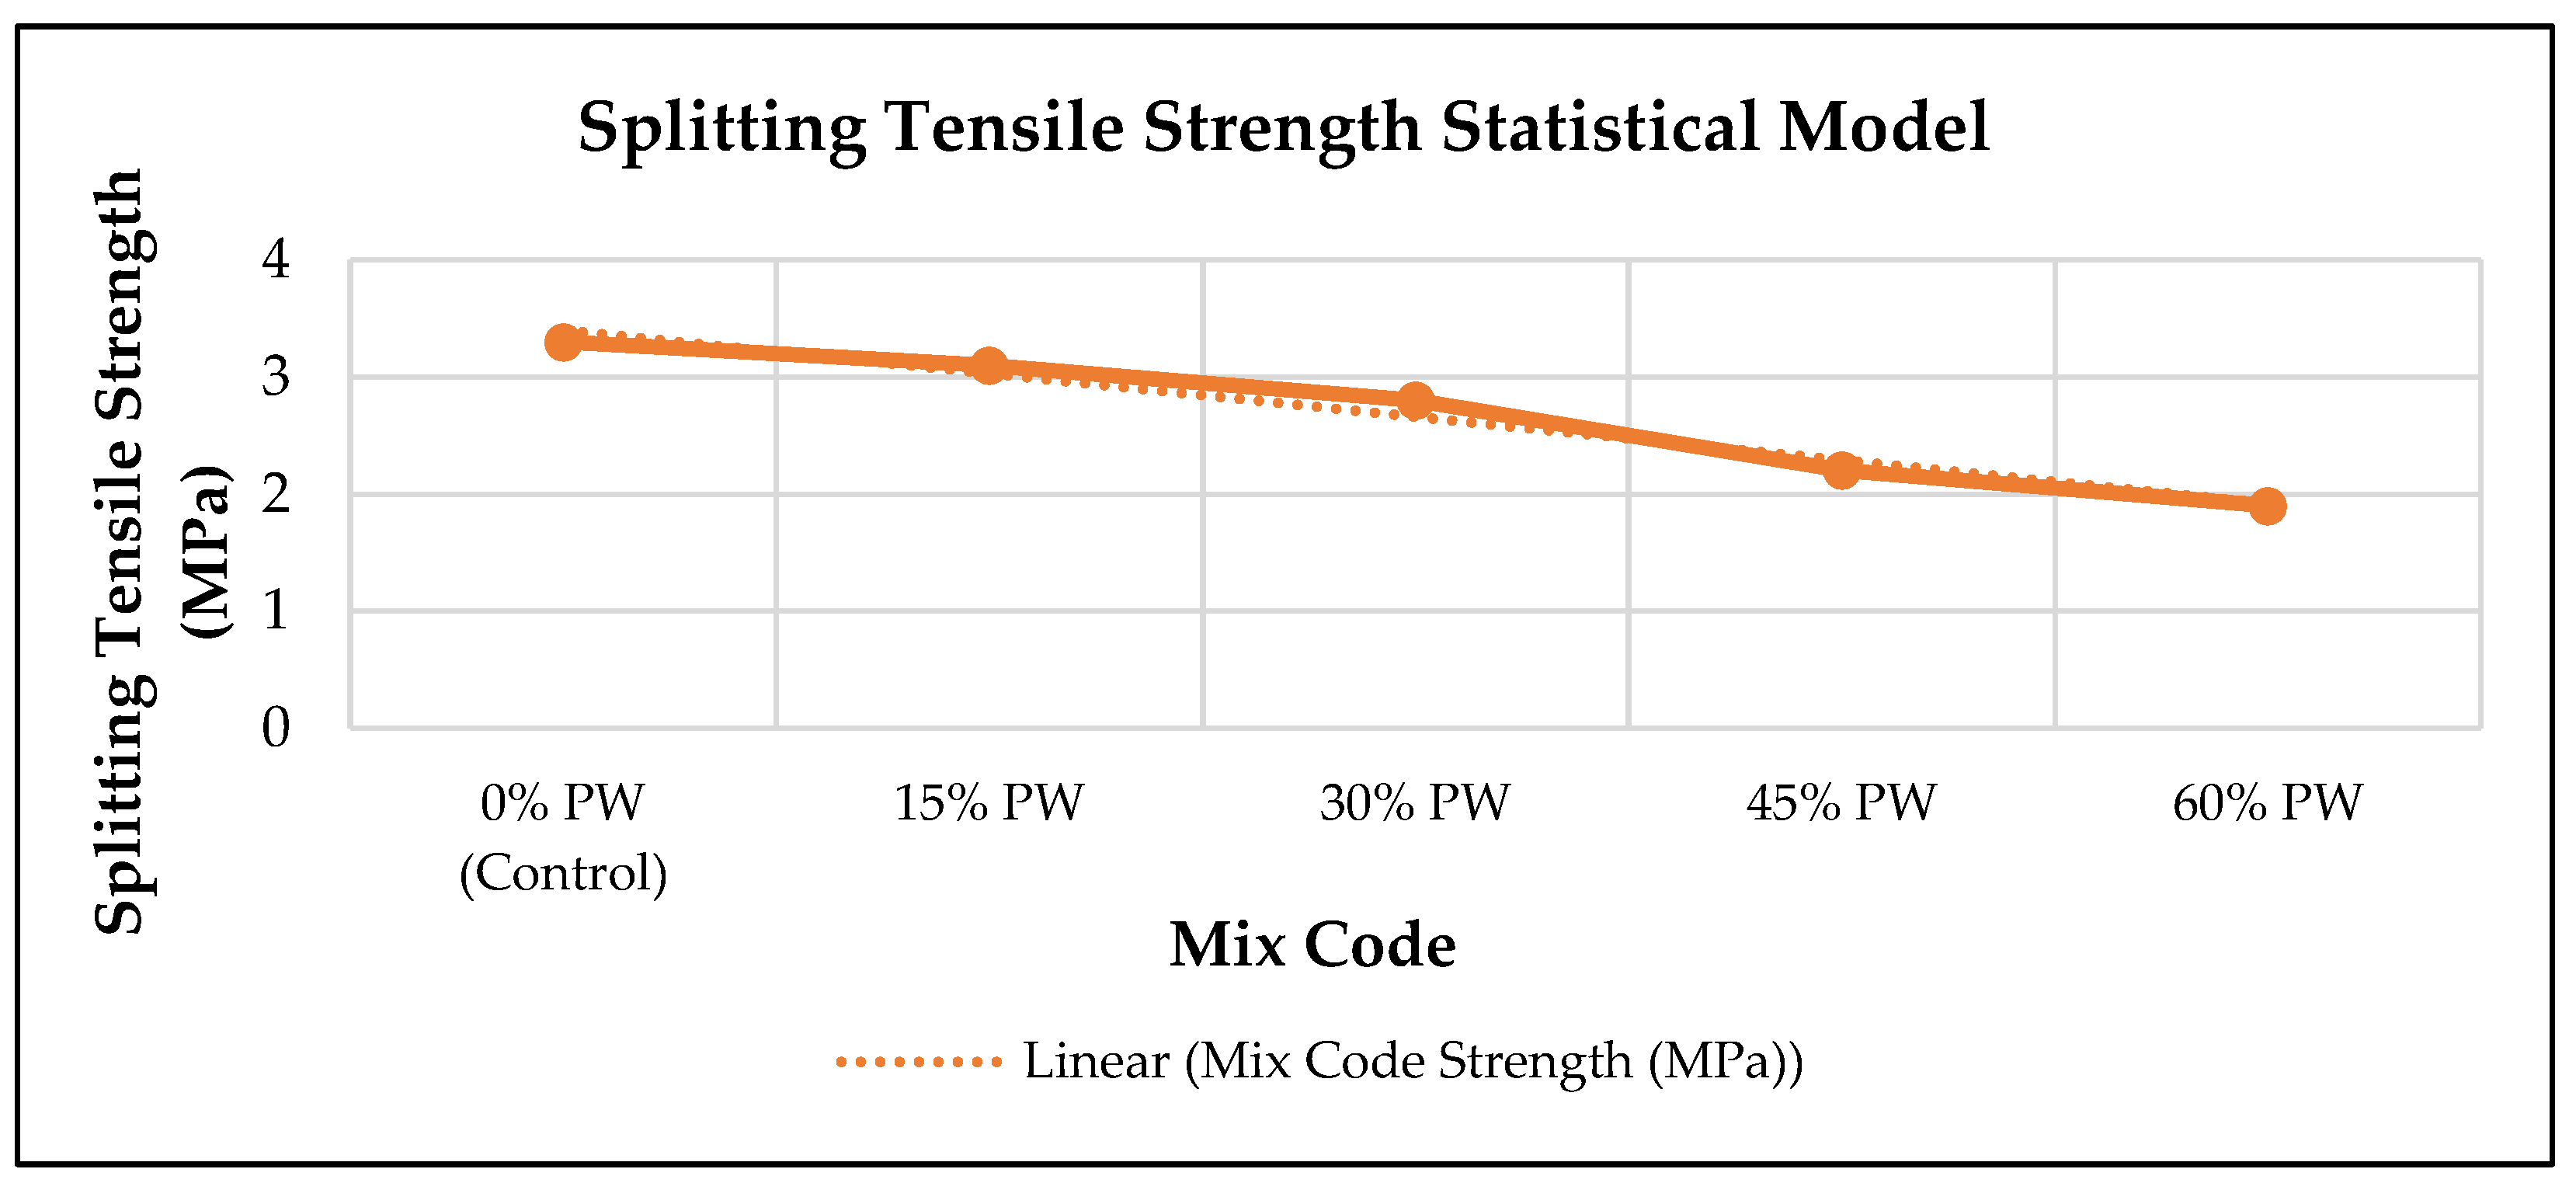
Figure 7.
Water Absorption Percentage.
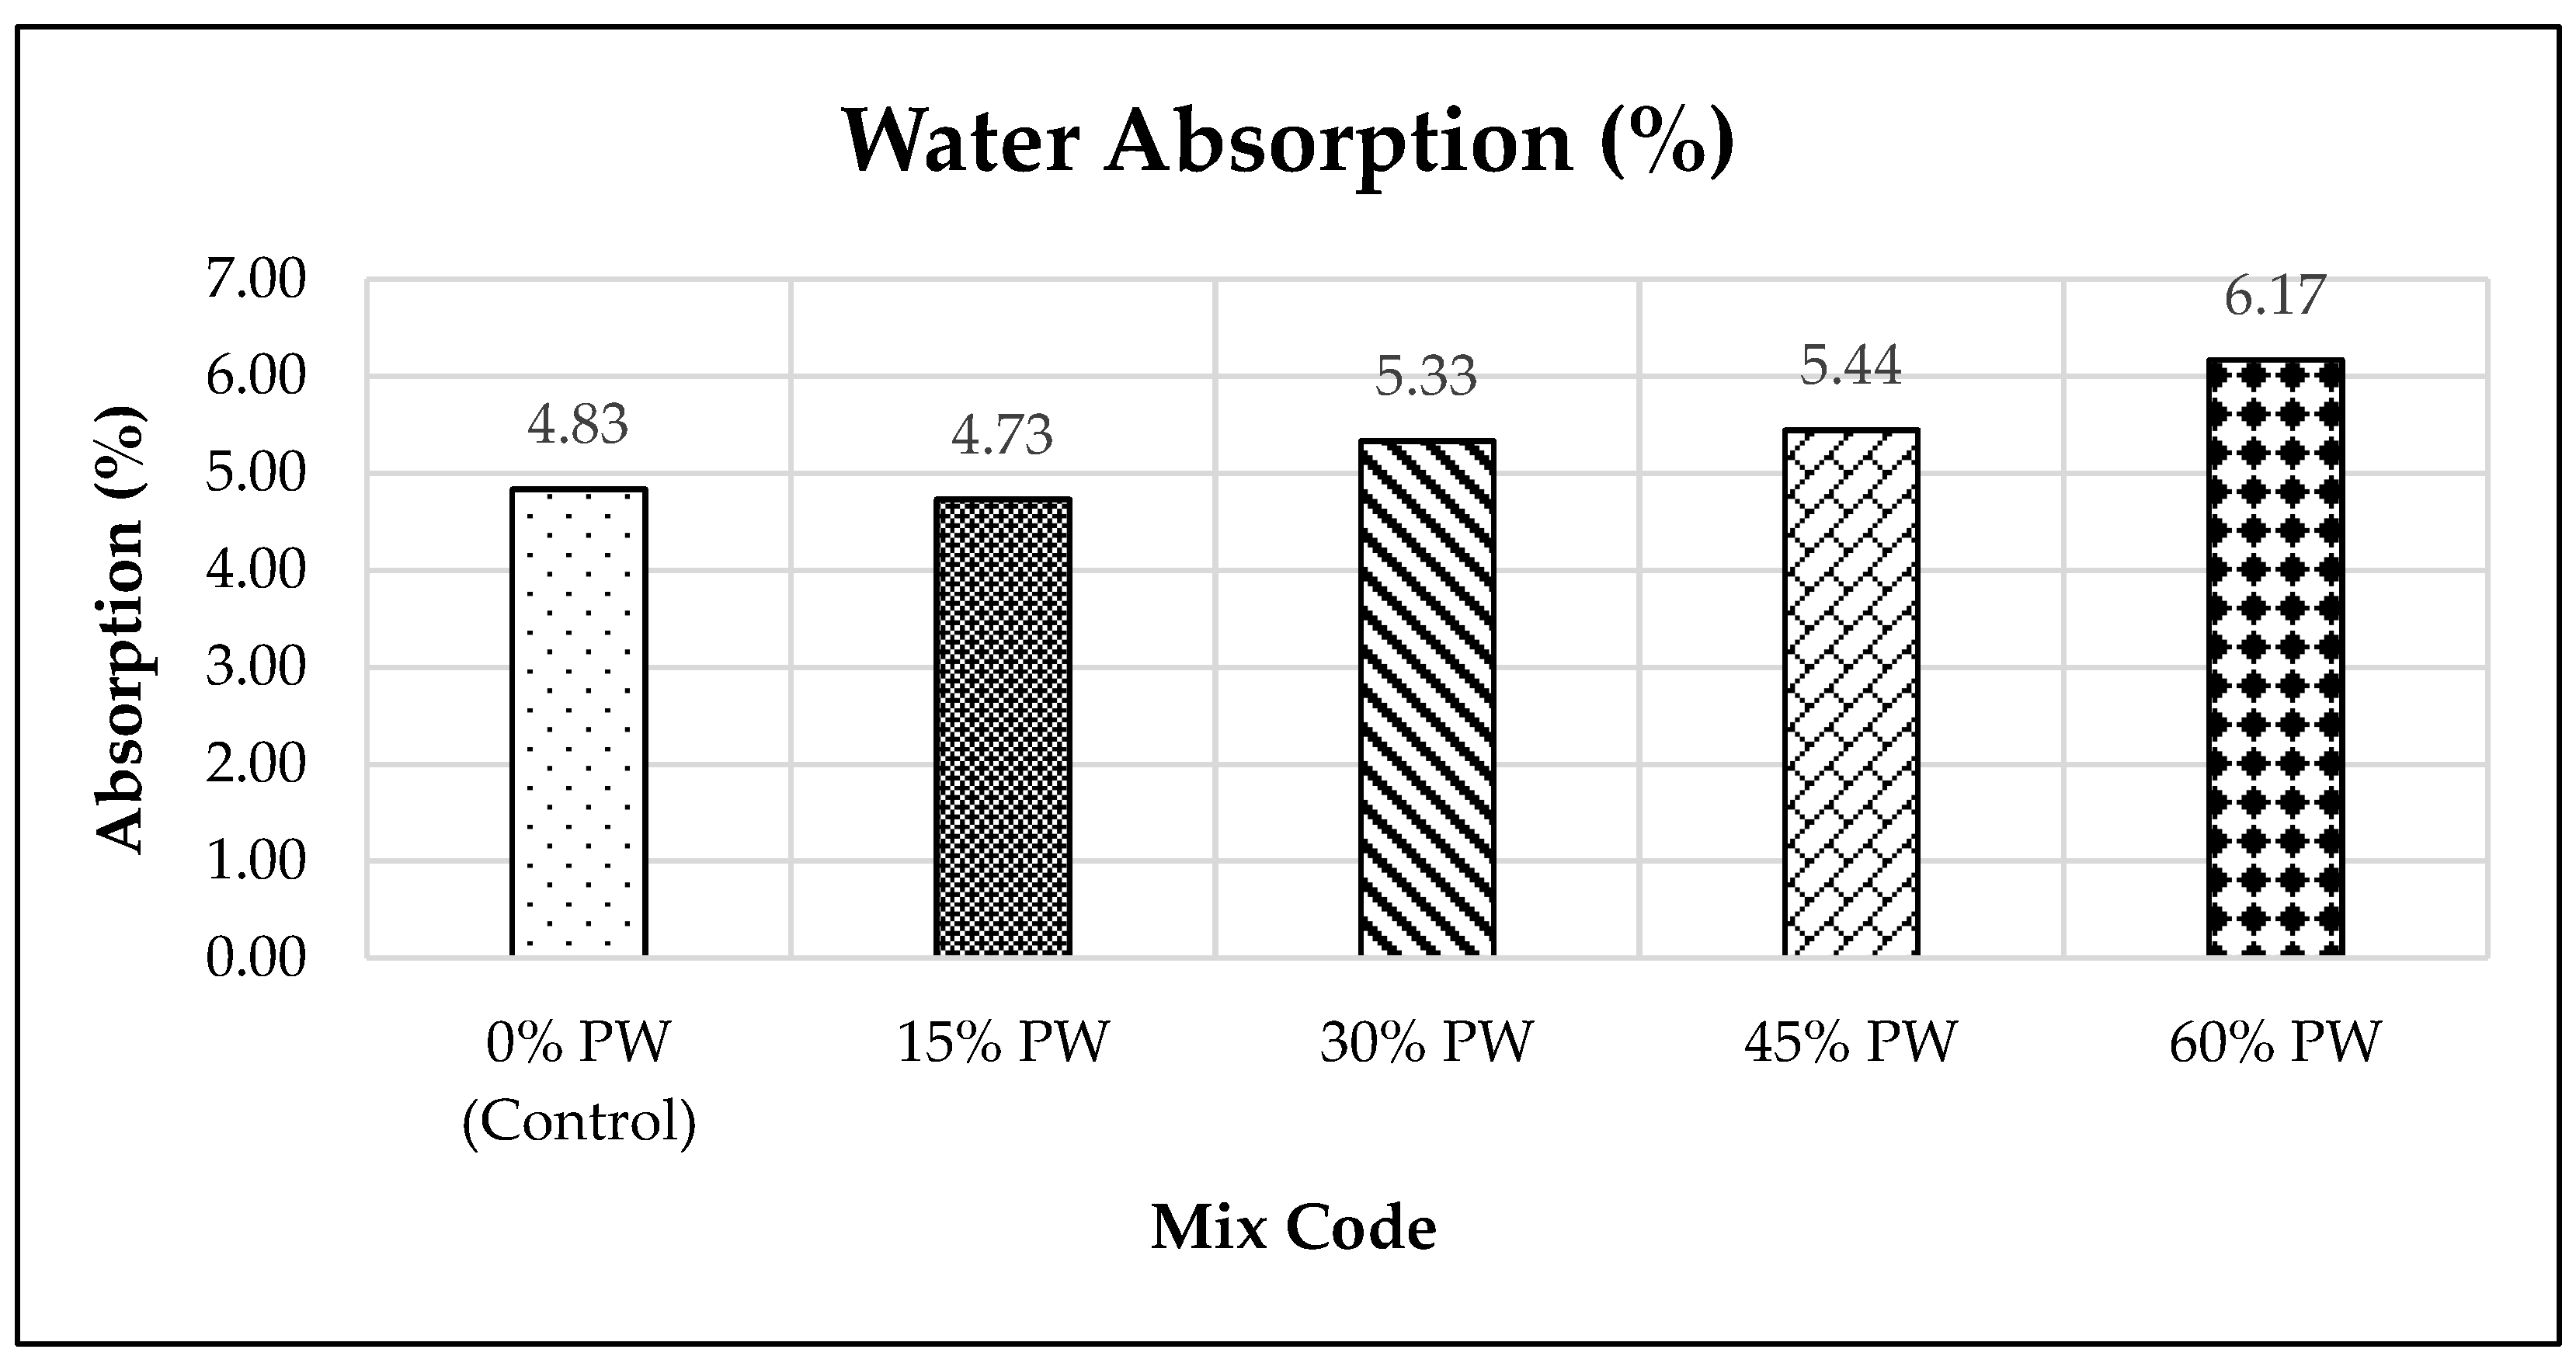
Figure 8.
SEM Pictures Showing Cementitious Material Controlled Mix.

Figure 9.
SEM Pictures Showing the Relation between PW and Cementitious Material in 15% of PW.
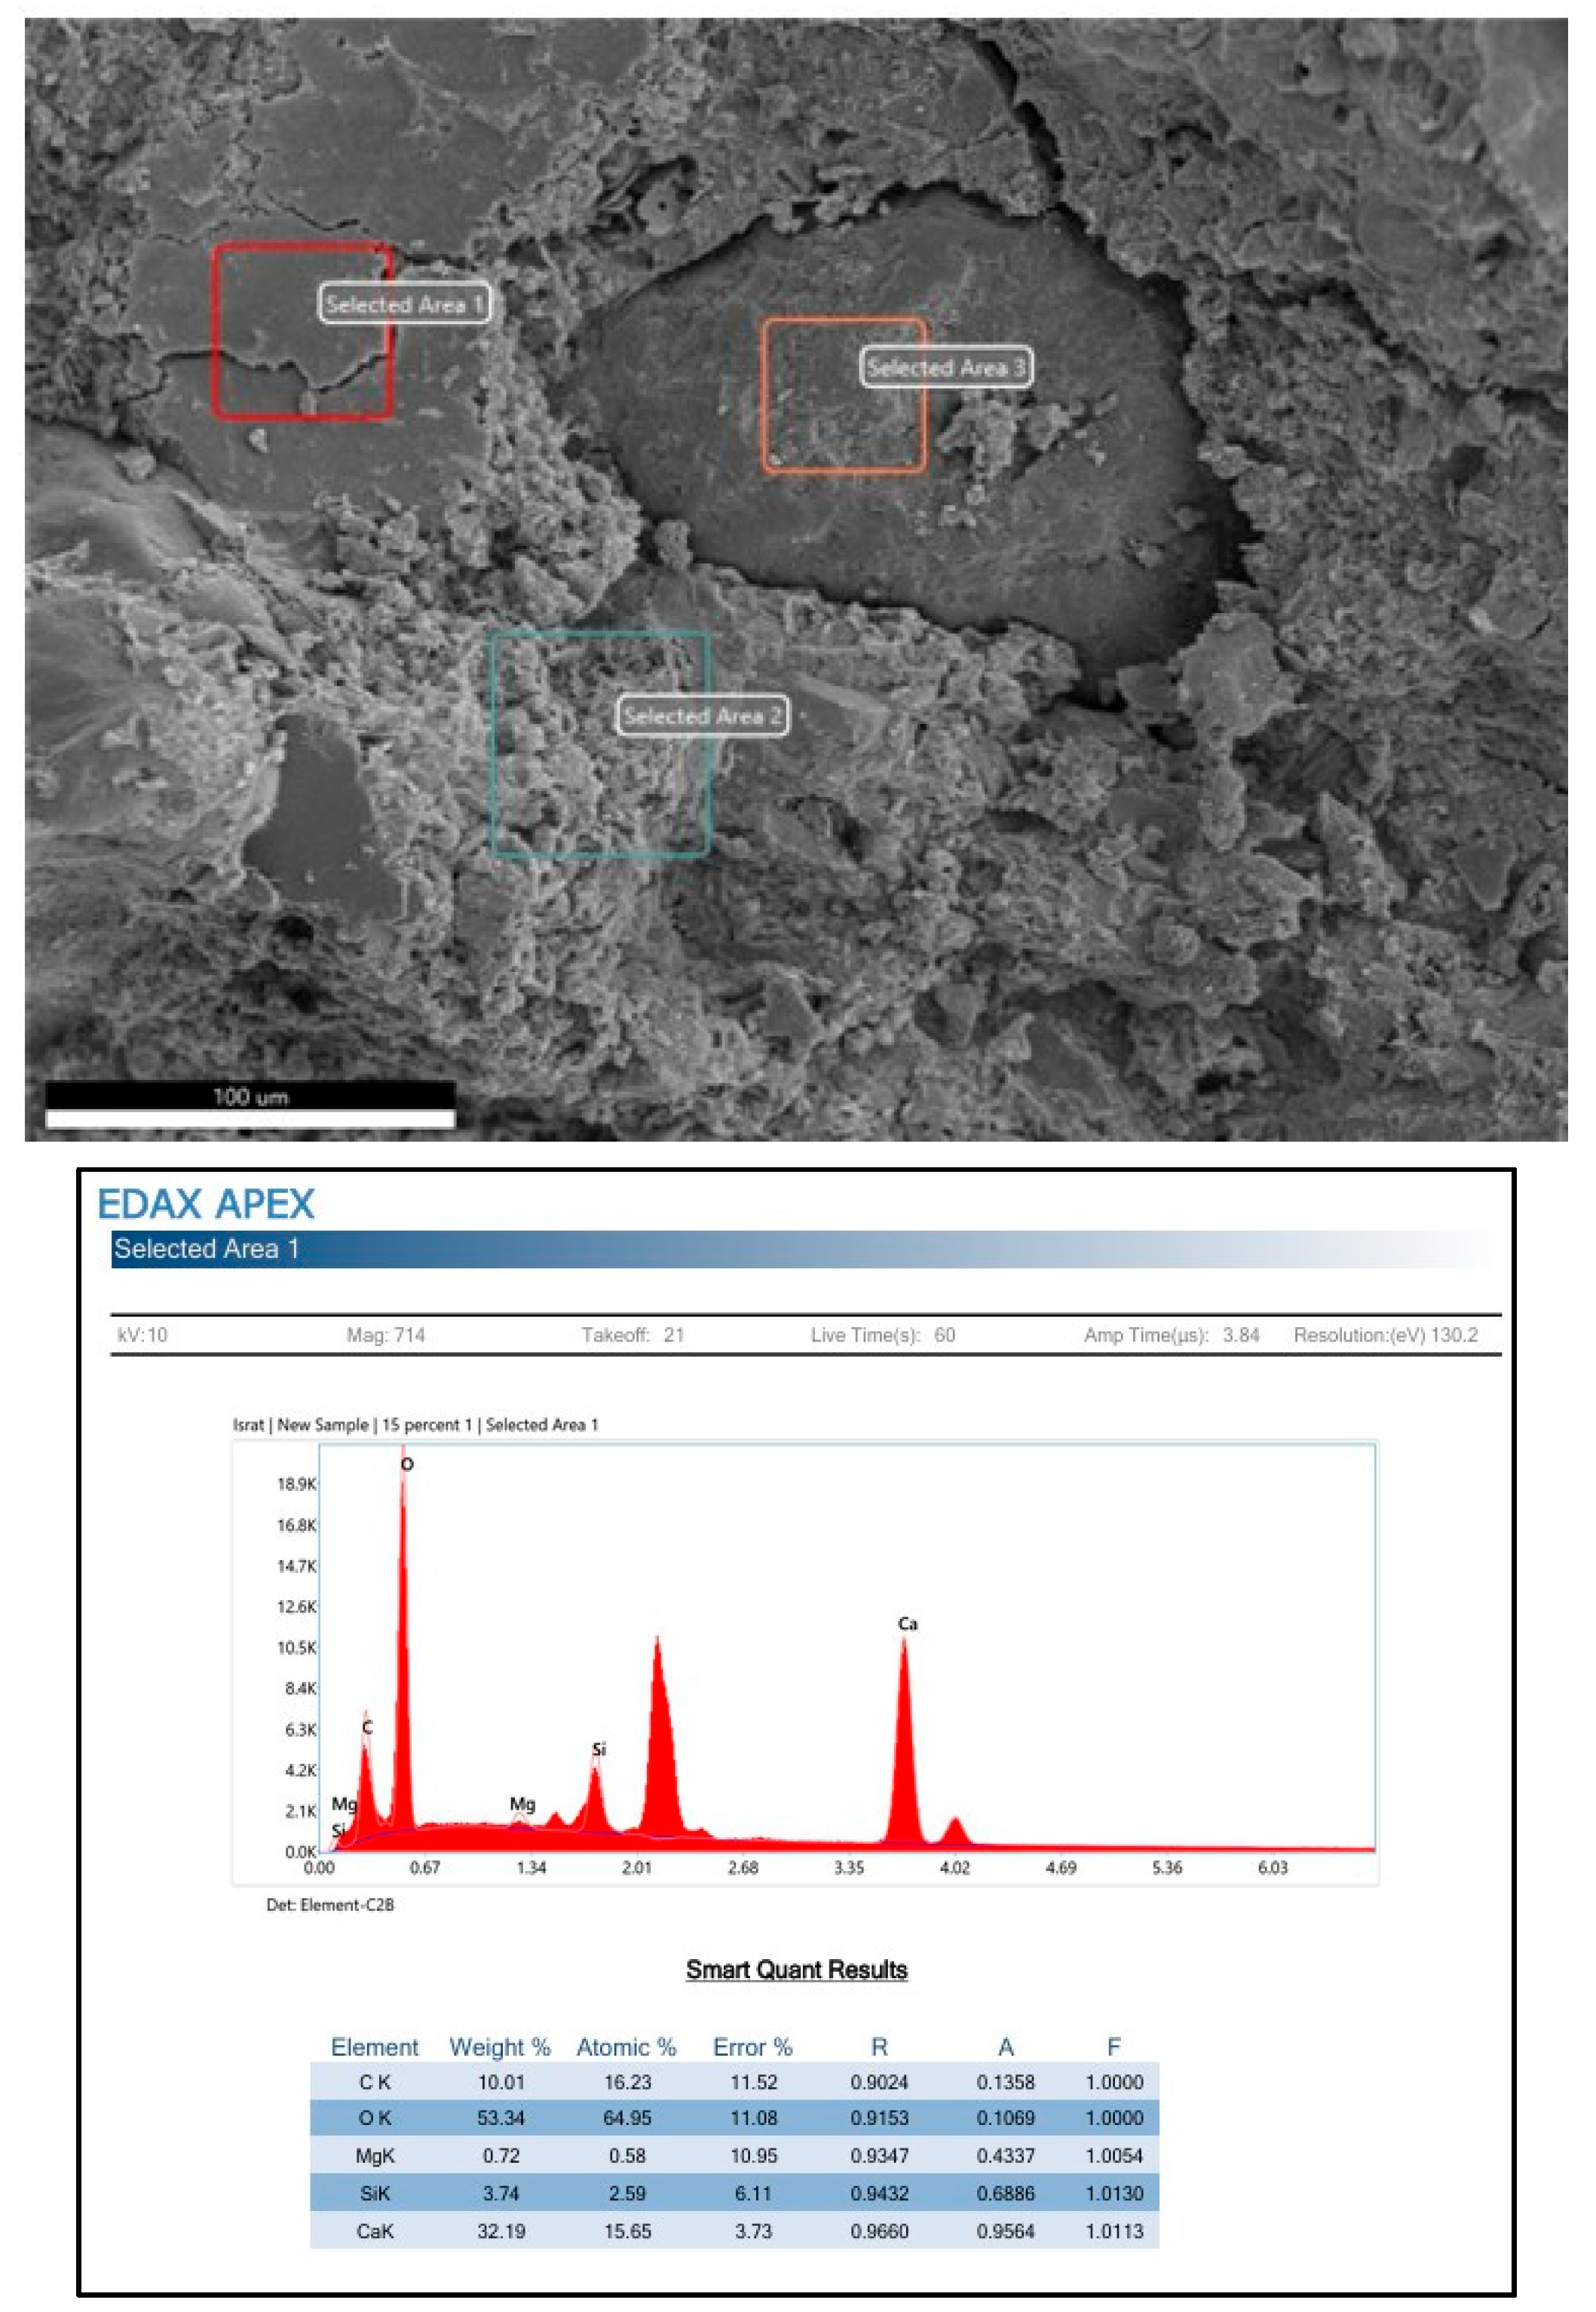
Figure 10.
SEM Pictures Showing the Relation between PW and Cementitious Material in 60% of PW.
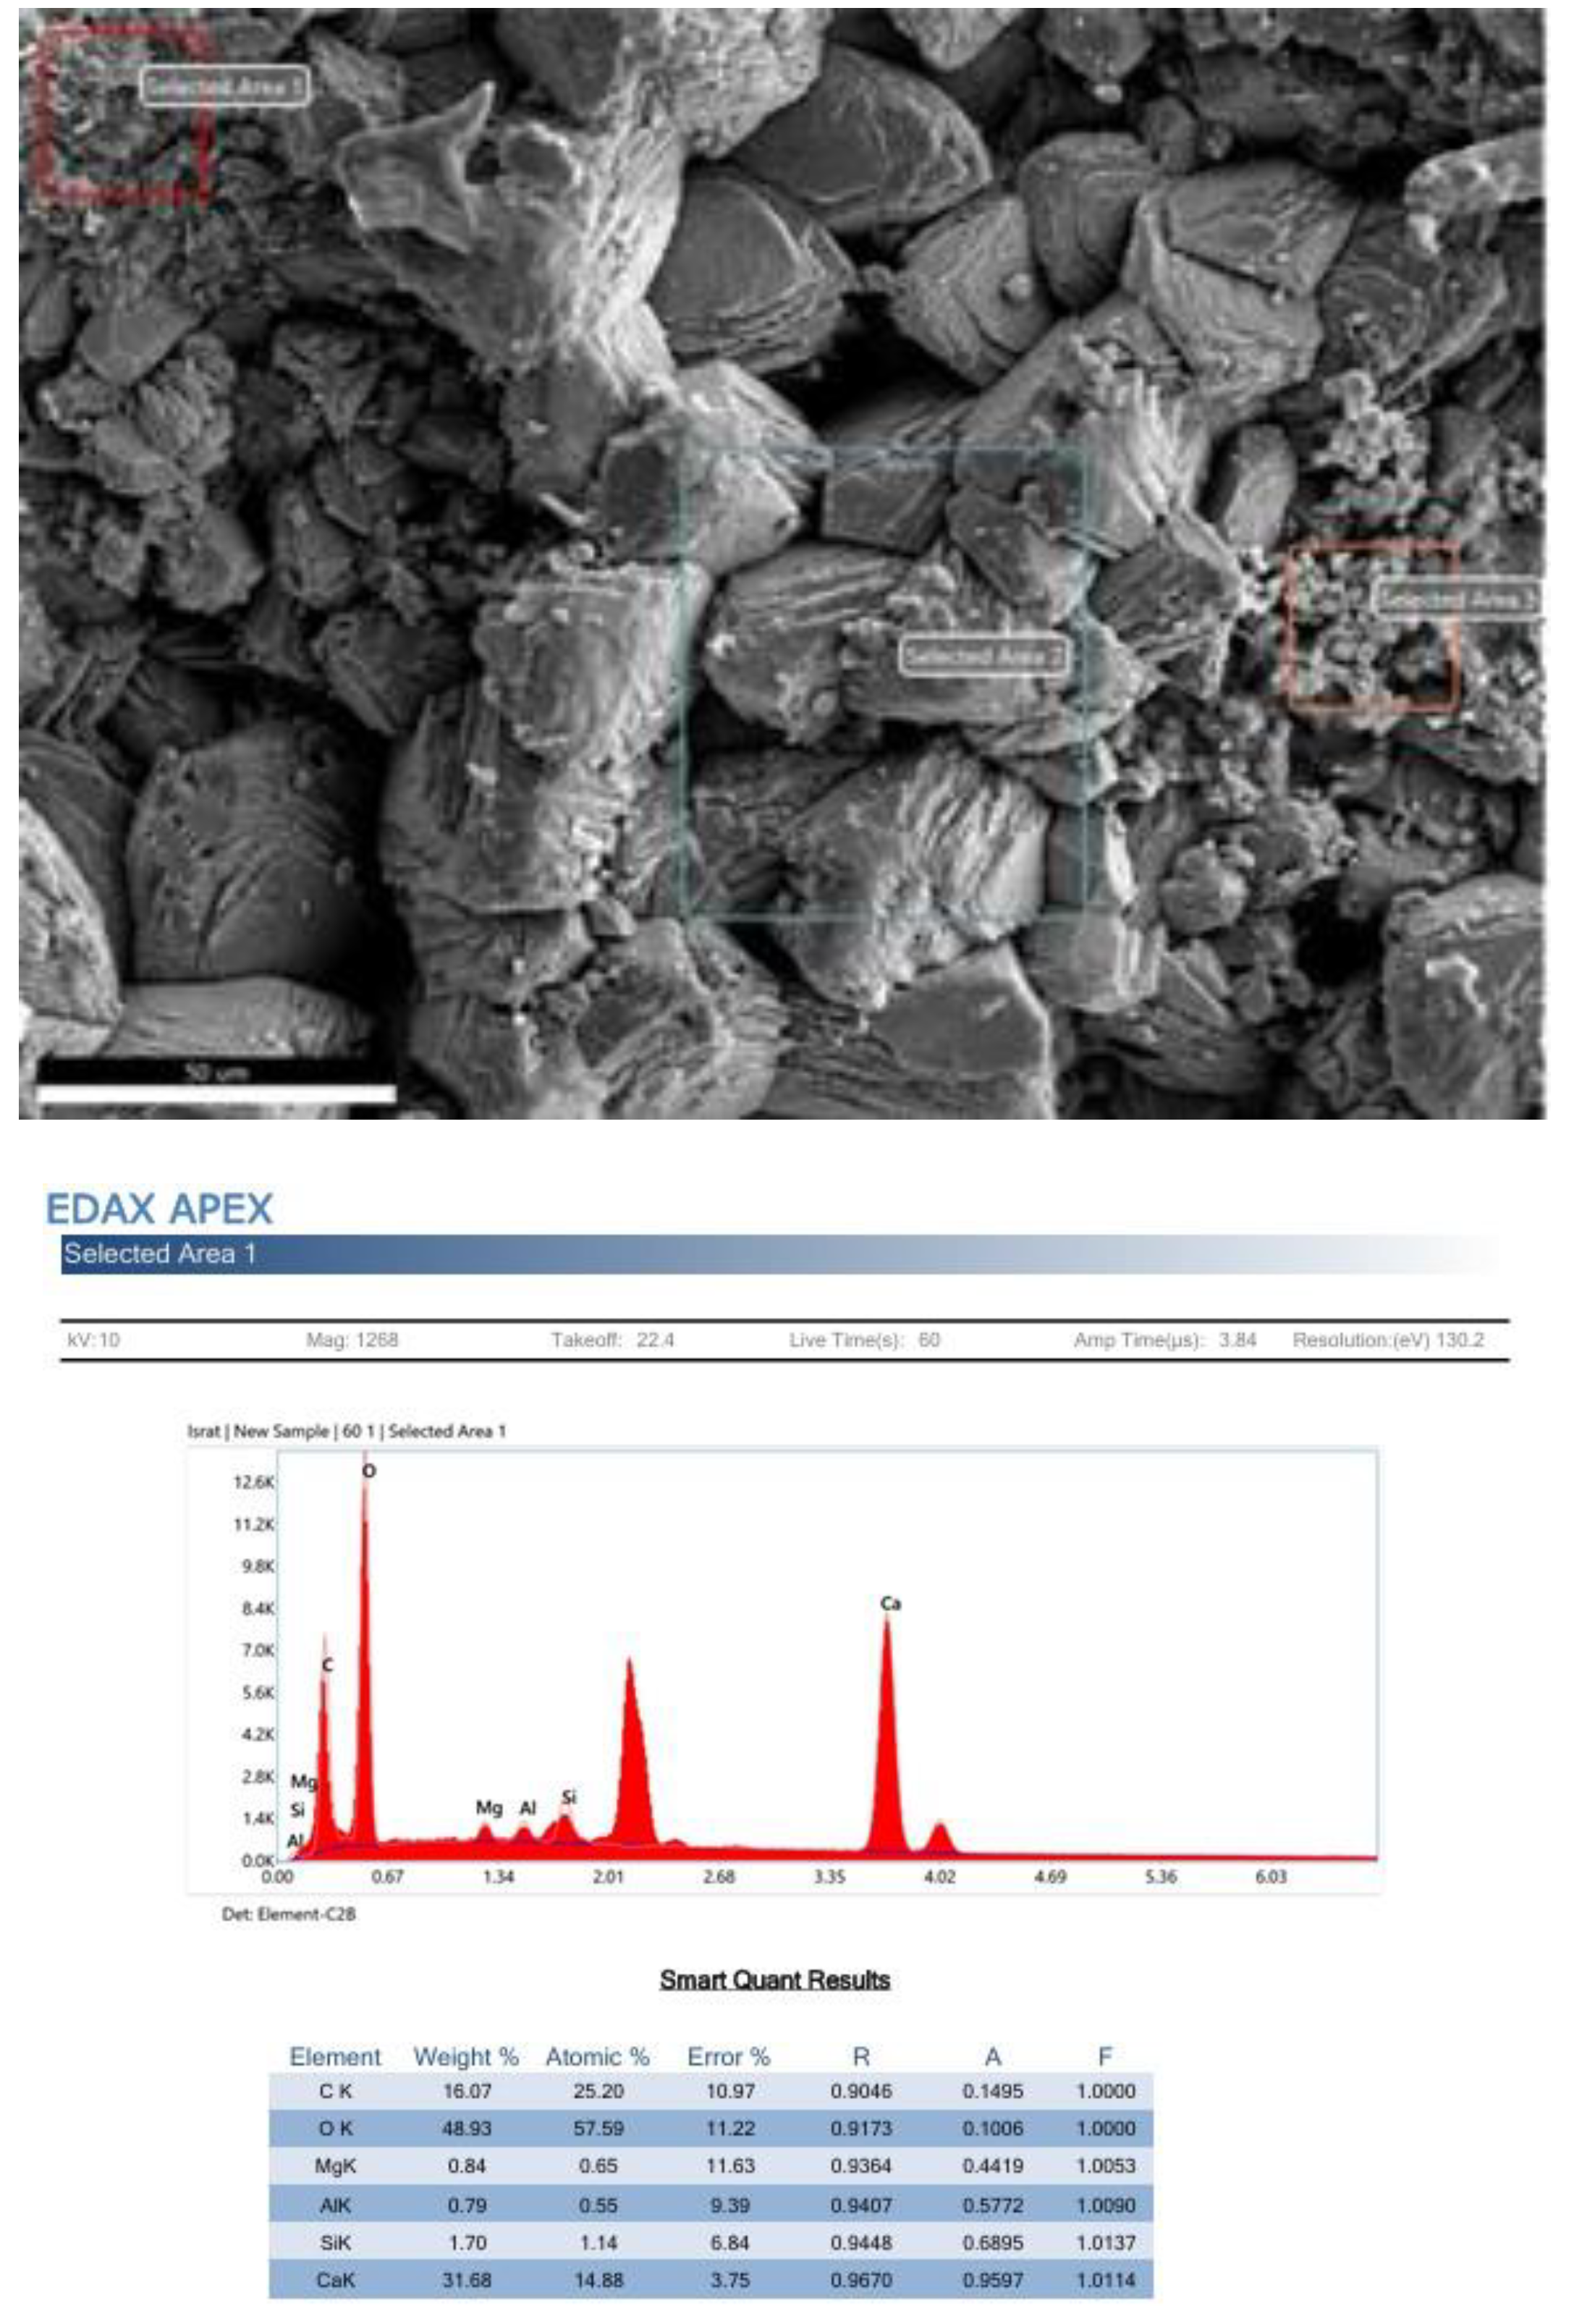
Table 4.
Mix design for this research.
| Sl. No. | Mix Codes | Cement (kg) | Fine Aggregate (kg) |
Recycled Plastic Waste (kg equivalent by volume) |
Coarse Aggregate 10mm (kg) | Coarse Aggregate 20mm (kg) | Water (kg) |
|---|---|---|---|---|---|---|---|
| 1 | 0% PW (Control) | 6 | 12 | 0 | 8 | 10 | 3.3 |
| 2 | 15% PW | 6 | 12 | 0.4 | 6.8 | 10 | 3.3 |
| 3 | 30% PW | 6 | 12 | 0.8 | 5.6 | 10 | 3.3 |
| 4 | 45% PW | 6 | 12 | 1.2 | 4.4 | 10 | 3.3 |
| 5 | 60% PW | 6 | 12 | 1.6 | 3.2 | 10 | 3.3 |
Table 5.
Sieve Analysis of Recycled Plastic Waste.
| BS Test Sieve Size | Mass Retained (g) |
% Retained | Cumulative % Retained | % Passing |
|---|---|---|---|---|
| 5 mm | 6.8 | 3.41 | 3.41 | 96.59 |
| 3.35 mm | 42.3 | 21.18 | 24.59 | 75.41 |
| 2 mm | 95.4 | 47.77 | 72.36 | 27.64 |
| 1.18 mm | 40.4 | 20.23 | 92.59 | 7.41 |
| 600 µm | 14.1 | 7.06 | 99.65 | 0.35 |
| 425 µm | 0.5 | 0.25 | 99.90 | 0.10 |
| 300 µm | 0.2 | 0.10 | 100.00 | 0.00 |
| 212 µm | — | — | — | — |
| 150 µm | — | — | — | — |
| 63 µm | — | — | — | — |
| Total = 199.7 | 100.00 |
Table 6.
Sieve Analysis of Recycled Plastic Waste.
| Mix | CO₂ Emissions (kg) |
Embodied Energy (MJ) |
|---|---|---|
| Control (0%) | 5.75 | 28.6 |
| 15% PW | 5.77 | 29.2 |
| 30% PW | 5.79 | 29.8 |
| 45% PW | 5.82 | 30.4 |
| 60% PW | 5.84 | 31.0 |
Disclaimer/Publisher’s Note: The statements, opinions and data contained in all publications are solely those of the individual author(s) and contributor(s) and not of MDPI and/or the editor(s). MDPI and/or the editor(s) disclaim responsibility for any injury to people or property resulting from any ideas, methods, instructions or products referred to in the content. |
© 2025 by the authors. Licensee MDPI, Basel, Switzerland. This article is an open access article distributed under the terms and conditions of the Creative Commons Attribution (CC BY) license (http://creativecommons.org/licenses/by/4.0/).
Copyright: This open access article is published under a Creative Commons CC BY 4.0 license, which permit the free download, distribution, and reuse, provided that the author and preprint are cited in any reuse.


