Submitted:
17 November 2025
Posted:
19 November 2025
You are already at the latest version
Abstract
This paper investigates the adsorption performance of green mesoporous silica (GMS-24h) and its amine-functionalized derivative (GMS-24h–NH2) for Cr(III) removal from aqueous systems. Adsorption isotherms were evaluated using the Langmuir and Freundlich models. GMS-24h achieved a maximum capacity of 303 mg·g⁻¹ at pH 3, while GMS-24h– NH2 showed a maximum capacity of 370 mg·g⁻¹ at pH 5. When compared to other silica-based materials, such as SRH and SRH–Triamine, the GMS materials demonstrated up to 44% higher adsorption capacity. Kinetic studies indicated that the pseudo-second-order (PSO) model provided the most accurate description of the adsorption process, as evidenced by high correlation coefficients (R2 > 0.99) and low deviation values (Δq < 20%). The equilibrium factor Rw showed rapid system stabilization. Intraparticle and external diffusion models demonstrated that both mechanisms contribute to the overall process, with external diffusion dominating at low Cr(III) concentrations and intraparticle diffusion at higher levels. The number of diffusion steps remained constant across a range of pH values, indicating a pH-independent mechanism. However, an additional chelation step (N→Cr) was observed in GMS-24h–NH2. These findings underscore the promise of GMS-based materials as effective adsorbents for the remediation of heavy metals in water treatment applications.
Keywords:
heavy metal removal
; water treatment
; chromium adsorption
; adsorption kinetics
; amine-functionalized silica
; surface functionalization
1. Introduction
Environmental remediation is one of the greatest challenges facing humanity today. Water pollution from heavy metals continues to be a priority issue, as these elements, being non-biodegradable, accumulate in the food chain and cause various complications in living beings. Heavy metals are highly toxic and carcinogenic pollutants; among the most common are lead, arsenic, cadmium, thallium, chromium, and mercury [1,2,3,4].
Chromium is one of the twenty most abundant elements in the Earth’s crust. However, it is highly toxic to plants, animals, microorganisms, and humans due to its carcinogenic and mutagenic properties. Its primary industrial applications include leather tanning, steel manufacturing, auto parts, dyes, electroplating, paper production, mining, and the cement industry, among others [1,2,3,4,5,6,7,8,9]. The most common valences of chromium are Cr3+ and Cr6+; the latter is the most harmful due to its high oxidizing power.
In humans, exposure to chromium has been associated with a variety of health concerns, including lung cancer, eczema-like allergies, perforation of the nasal septum, asthma, respiratory diseases, ulcers in the nasal layers, and growth and reproduction disorders. In the case of plants, the effects include defects in roots, stems, and leaves; slowed germination; reduced photosynthesis; nutritional and oxidative imbalances; mutagenesis; and limits to growth [1,2].
In this regard, the harmful effects that chromium can cause in both water and soil are significant. The US Environmental Protection Agency (USEPA) has established a maximum permissible concentration of chromium in drinking water at 0.05 milligrams per liter (mg/L). Thus, the removal of this contaminant from wastewater is a constant challenge in environmental remediation processes due to its toxicity. A variety of methodologies have been proposed for this purpose, including ion exchange, photocatalysis, chemical reduction, electrokinetic remediation, precipitation, bioremediation, and adsorption processes, among others [1,2].
The use of adsorbent materials as a promising solution for the effective removal of chromium from aqueous systems has been proposed. The bioadsorbents employed include grapefruit peel [10], chitosan [11,12,13,14,15], mesoporous silica [16,17,18,19,20], biosilica obtained from rice husks [21,22,23,24,25], and activated carbon, among others [26,27,28,29,30,31,32].
The main drawback to its industrial implementation is the cost of the adsorbent. To identify cost-effective silica production methods, the synthesis of silica from sodium silicate has been investigated as a potential alternative. The process entails the acidification of the silicate, a process which results in the precipitation of amorphous silica [34,35,36].
Under acidic conditions, sodium silicate forms silicic acid (Si(OH)4), which then polymerizes to form silica. The polymerization of Si(OH)4 occurs in three stages: The process begins with the formation of the monomer, which then undergoes polymerization into particles. Next, the particles undergo growth. Finally, the particles bond to form chains or networks that create a gel-like structure. Stages 2 and 3 are contingent on the pH of the medium: an acidic pH promotes gelation, while an alkaline pH promotes particle aggregation [33,36,37].
The present study proposes the utilization of mesoporous silicas, obtained through cost-effective processes, employing industrial-grade sodium silicate as a precursor for the formation of silicic acid. The investigation focuses on the effect of the aging time of Si(OH)4 on the textural properties of the silica obtained, with a comparison to the properties observed in silica synthesized by simple acidification and silica obtained from tetraethyl orthosilicate (TEOS).
Consequently, the adsorption capacity of the silicas against Cr(III) is evaluated, and the maximum adsorption capacity is determined by adjusting the data to the theoretical models of Freundlich and Langmuir. The effect of pH and Cr(III) concentration on the adsorption process is also analyzed. Thus, the final aim of this study is to examine the impact of surface modification with amino groups on Cr(III) adsorption efficiency.
2. Materials and Methods
2.1. Experimental Procedure
2.1.1. Green Mesoporous Silica (GMS) Synthesis Starting Sodium Silicate
100 ml of an industrial-grade sodium silicate solution at 25%V was prepared and passed through Dowex 50WX8 ion exchange resin to yield silicic acid (Si(OH)4). The acid was eluted in 100 ml of deionized water, and fractions with an approximate pH of 3 were collected. Subsequently, these fractions were then exposed to an aging process for various intervals: 0, 6, and 24 hours.
The concentration of Si(OH)4 was determined by yellow silicon-molybdenum complexes, using UV-visible spectrophotometry with an SQ-2800 UNICO spectrophotometer. The measurements were conducted at a wavelength of 400 nm (λ=400nm), employing the Deutsche-Einheitsverfahren method [37].
Green mesoporous silica (GMS) was synthesized via a hydrothermal process, in which silicic acid was mixed with a solution of the triblock copolymer P–123 (HO(CH2CH2O)20(CH2CH(CH3)O)70(CH2CH2O)20H, 98%, Sigma-Aldrich). The P–123 solution was prepared by dissolving 66 g of the copolymer in 500 mL of H2O. Si(OH)4 was added at a volume ratio of 1:2, and the mixture was subsequently heated at 60 °C for a span of 24 hours. The resulting solid was recovered by means of filtration. Subsequently, P–123 was removed via solid–liquid extraction using acidic ethanol under reflux for 24 h. Then, the material was calcined at 600 °C for 2 h.
On the other hand, mesoporous silica obtained by acidification (MS-HCl) was synthesized by adding 10 mL of concentrated hydrochloric acid (37% w; Karal) to 200 mL of a 12.5% sodium silicate solution under magnetic stirring. The pH was maintained within the range of 1 to 3 until the onset of gelation was observed. Afterward, the resulting gel was washed with deionized water until reaching a neutral pH (approximately 7) and then dried at 40 °C for 24 h.
2.2. Functionalization of GMS with Amine Groups
The functionalization of silica was carried out using a post-synthesis method. The GMS-24h material was used for this purpose due to the monodisperse pore distribution and enhanced textural properties.
A mixture containing 83 mmol of GMS-24h and 0.166 mmol of the alkylalkoxysilane modifier 3-aminopropyl(triethoxy)silane (APTES; 99%, Sigma-Aldrich) was prepared in 75 mL of ethanol, using NH4OH as a condensation catalyst. The reaction was conducted under reflux for a span of 24 h. The resulting solid was then recovered by filtration, washed with ethanol, and dried at 90 °C for 12 h.
2.3. Characterization Studies
The characterization of GMS and GMS–NH2 was performed by Fourier-transform infrared (FTIR) spectroscopy, using an ATR-FTIR Nicolet iS10 (Thermo Scientific), with measurements recorded in the range of 600–4 000 cm–1. The average number of scans collected was 32, with a resolution of 4 cm–1. The FTIR analysis confirmed the effective surface modification of the silica. Furthermore, chemical characterization was performed using CP–MAS 13C and 29Si NMR spectroscopy, using an AR–Premium COMPACT 600 MHz Varian. Talc was used as reference material, with a spinning rate of 6 kHz, a delay time (D1) of 4 s, a contact time of 3 ms, and a total of 120 scans.
The textural properties of the samples were evaluated by N2 adsorption–desorption isotherms at 77 K using a Micromeritics ASAP 2010 instrument. Prior to measurement, the samples were degassed overnight at 180 °C under a vacuum of 71 mmHg. The specific surface area was calculated using the BET method, while the mean pore diameter was determined by applying the BJH method to the desorption branch of the isotherm.
The zeta potential (ζ-potential) and isoelectric point were determined for samples dispersed in 1 mM KCl using a Zetasizer Nano ZS instrument (Malvern Co. Ltd., UK) equipped with a He–Ne laser. The variation in surface charge detected for MS and MS-modified samples may be associated with adsorption mechanisms and the specific interactions between the silica surface and the chromium.
On the other hand, thermogravimetric analysis (TGA/DTA) was performed using a PerkinElmer SII-Diamond Thermogravimetric/Differential Analyzer under an oxidizing atmosphere, within a temperature range of 25–1000 °C and a heating rate of 120 °C min–1. Finally, Transmission electron microscopy (TEM) micrographs were obtained by suspending the silica samples on gold grids and imaging them with a FEI Talos F200X G2 TEM microscope.
2.4. Cr(III) Adsorption Studies
The Cr3+ adsorption study was conducted using stock solutions ranging from 247 to 1636 mg–L–1, prepared by dissolving Cr2(SO4)3 powder (Karal; 99%) in deionized water. The adsorption experiments were performed using a batch method at room temperature (25 °C) under constant stirring at 24 rpm. 0.2 g of GMS or GMS-NH2 was added to 10 mL of aqueous Cr3+ solution at varying concentrations. The residual chromium present in the solution was analyzed using a UV–visible spectrometer (UNICO SQ-2800), with measurements acquired at 10-minute intervals over a 60-minute period.
The amount of Cr3+ adsorbed at time t (qₜ) was calculated using Equation (1), where C0 and Ct represent the initial and time-dependent concentrations of Cr3+ in solution (mg–L–1), m is the mass of the adsorbent used (g), and V is the volume of the solution (L). Furthermore, the removal efficiency was calculated using Equation (2).
3. Results
3.1. Effect of Aging on Textural Properties of GMS
Figure 1a shows the behavior of the surface area as a function of silicic acid concentration in aged solutions. It was observed that as the ageing time increased, the concentrations of silicic acid remaining in solution decreased. This phenomenon is due attributable to the agglomeration of particles during the gel formation process, which is in accordance with the silica precipitation mechanisms from silicates [37].
The aging time showed an increase in the surface area up to 24 h, at which point an increase of approximately 12% in SBET was recorded (SBET = 496.5 m2/g). However, after 48 h, the SBET decreased to 466 m2/g. Similar trends were observed for pore volume (see Figure 1b). The initial volume of 0.34 cm3/g was measured without aging, and it increased to 0.55 cm3/g after 24 h of aging. Then, it decreased to 0.49 cm3/g in 48 h.
According to the IUPAC classification of adsorption isotherms [38], the silicic acid sample without aging shows a mixed isotherm profile (Figure 1c), indicating the presence of two types of pores. Up to a relative pressure of 0.7, a type IV isotherm is observed, which is characteristic of mesoporous materials.
After 24 and 48 h of aging, the samples display typical type IV isotherms, with capillary condensation occurring at a relative pressure of 0.7 for the 24-h aged sample. At 48 h, a similar isotherm profile is observed; however, a shift in the hysteresis loop is noted, and capillary condensation occurs at a slightly higher relative pressure of 0.8.
The modal pore distributions observed vary depending on the ageing time (see Figure 2). The silicic acid sample without aging showed a bimodal pore distribution, with a dominant peak at 3.9 nm (corresponding to the mesoporous fraction) and a broader secondary distribution ranging from 5 to 20 nm.
After 24 h of aging, the pore structure shifted to a unimodal distribution centered at 3.9 nm. In contrast, the sample aged 48 h showed a bimodal distribution again, with peaks at 3.9 nm and 7.8 nm.
Table 1 presents a comparative analysis of the textural properties of GMS samples with varying aging times, silica obtained from sodium silicate precipitated under acidic conditions (SiO2–HCl), and mesoporous silica (MS) synthesized from TEOS using Pluronic as a pore-directing agent.
Acidification of sodium silicate results in the formation of non-porous materials due to the agglomeration of silica particles into gel-like structures. In contrast, the aging of silicic acid has been shown to enhance porosity, yielding materials with textural properties comparable to mesoporous silica synthesized from TEOS, which typically exhibits ABET values between 543 and 908 m2/g [39].
Figure 3 shows TEM micrographs of GMS samples that were aged for 0 and 24 h. The sample without aging (Figure 3a) shows thin, poorly ordered silica layers. In contrast, the sample aged for 24 h (Figure 3b) shows a more ordered stacking of mesoporous silica layers and pore sizes of approximately 4 nm, which closely matches the average diameter determined by BJH analysis (3.9 nm).
These results suggest that aging Si(OH)4 promotes structural ordering in the mesoporous silica framework. This may be due to the increased size of the oligomers present in the aged stock solution. This could improve the organization of molecules during the formation of the molecular sieve.
3.2. GMS Modification with Amine Groups
The GMS-24h sample showed a monodisperse pore distribution with enhanced textural properties. Thereafter, the functionalization process involved the addition of amine groups, as shown in Figure 4a.
Figure 4b shows the FTIR characterization of GMS. The spectrum confirms the presence of an inorganic silica matrix (SiO2), with characteristic vibrational bands at 1072.8 cm–1 (ν Si–O), 946.9 cm–1 (δ Si–O), and 783.6 cm–1 (δ Si–OH), corresponding to the SiO2 lattice. Additionally, adsorbed water is identified by bands at 3483 cm–1 (ν O–H) and 1674 cm–1 (δ O–H).
As shown in Figure 4c, the presence of amine groups in GMS–NH2 is confirmed by bands at 1556 cm–1 (δ N–H) and 3440 cm–1 (ν N–H). The presence of signals at 1200 cm–1 (Si–C) and 2936–2856 cm–1 (ν C–H) suggests alkyl chain incorporation. The silica network is also evident, with bands at 1075.4 cm–1 (ν Si–O–Si), 796 cm–1 (δ Si–O), 945 cm–1 (δ Si–OH), and 698 cm–1 (Si–(CH2)n). Adsorbed water is once again observed at 3361 cm–1 (O–H) and 1637 cm–1 (δ O–H).
Figure 5 shows the 13C CP–MAS NMR spectra of the GMS-24h samples that were functionalized with either amine or thiol groups. The spectra confirm the successful crosslinking of the silica surface with the organic modifiers. Three characteristic signals corresponding to methylene groups (–CH2–) were identified for the GMS-24h–NH2 sample.
Figure 6 shows the nitrogen adsorption isotherms and pore size distributions of GMS-24h samples that were modified with functional groups. A decrease in the volume of adsorbed N2 was observed, particularly in the sample modified with thiol groups. Changes in pore distribution were also identified; the original pore size of 3.9 nm shifted to 3.2 nm in the sample modified with amino groups. This shift may be attributed to the functional groups acting as an overlay on the pore walls.
Table 2 summarizes the textural properties of these silica materials. A reduction in BET surface area and pore volume was observed because of surface modification. However, chromium adsorption may be enhanced due to chemical interactions between metal ions and functional groups, as well as pH effects. These effects are discussed in [22].
Figure 7 shows the thermogravimetric analysis (TGA) of mesoporous silica (GMS) and the modified silica samples. This analysis reveals weight loss as a function of increasing temperature. Between 100–200 °C, loss of adsorbed solvents from the solid surface is observed (peak 1), and between 300–600 °C, the decomposition of organic matter occurs (peaks 2 and 3).
On the other hand, ceramic yield, defined as the percentage of SiO2 retained in the solid matrix, was 90% for GMS. In contrast, all amine-modified silica samples exhibited a lower ceramic yield of approximately 75%. This reduction is attributed to the presence of organic functional groups grafted onto the silica surface. The degree of surface modification was calculated using Equation (3), resulting in a value of 26 wt%.
Figure 8 shows the measurements of the ζ-potential for GMS-24h and its amine-modified counterpart (GMS-24h–NH2). The GMS-24h sample showed a large negative surface potential throughout a wide pH range, with an isoelectric point (IEP) around pH 2.0. This behavior is attributed to the presence of deprotonated silanol groups on the silica surface.
In contrast, the GMS-24h–NH2 sample showed a positive surface charge as a function of pH, with an IEP near pH 9.5. The effect of this surface charge shift on adsorption capacity was further evaluated
3.3. Cr(3+) Removal Using GMS-24h and GMS-24h-NH2
Cr3+ removal studies were conducted using concentrations ranging from 200 to 1600 ppm, which are representative of those found in tannery effluents at various stages of processing [6,9,10,22].
As shown in Figure 9, the pH level had a significant impact on chromium adsorption, with the highest removal rates observed at a pH of 5 for both silica materials. For GMS-24h, removal efficiencies ranged from 38–79% at a pH of 1, 46–78% at a pH of 3, and 43–71% at a pH of 5. In contrast, the amine-modified silica (GMS-24h–NH2) showed a removal efficiencies of 42–55% at a pH of 1, 33–55% at a pH of 3, and 79–94% at a pH of 5, indicating near-quantitative removal.
These results suggest that electrostatic attraction between the material surface and Cr3+ is not the main adsorption mechanism. Instead, coordination between the amine group (–NH2) and Cr3+ appears to play a key role, particularly at pH5 where the surface charge is less positive, enabling cation approach and interaction.
pH is a key variable that enhances the adsorption capacity of silica materials. This effect can be attributed to the interactions between chromium species in solution and the surface characteristics of GMS-24h and GMS-24h–NH2.
Cr(OH)3 precipitation occurs at a pH of 6.0. At lower values, the dominant chromium species at the studied pH levels are Cr3+ and hydroxy complexes, such as [CrOH]2+, [Cr3(OH)4]5+, and [Cr2(OH)2]4+, as shown in the Cr(III) speciation diagram obtained using SHC (Figure 10a).
Furthermore, according to the measurements of the ζ-potential (see Figure 8), GMS-24h shows a negative surface charge above pH 2, while GMS-24h–NH2 maintains a positive surface charge across all pH values that were evaluated. The corresponding structural representations for GMS-24h are shown in Figure 10b.
According to the measurements of the ζ-potential for GMS-24h at pH1, the silica surface shows a slight positive charge. Therefore, electrostatic repulsion between Cr3+ ions and protonated silanol groups (–OH2+) on the silica surface limits the material’s adsorption capacity.
Furthermore, at higher pH values of 3 and 5, the surface charge becomes increasingly negative (as indicated by a decrease in the ζ-potential from –18 mV to –30 mV). Under these conditions, electrostatic attraction between the negatively charged surface and Cr3+ ions, as well as chromium hydroxy complexes, enhances adsorption. This effect becomes more evident as the negative surface charge increases (Figure 10c).
In contrast, GMS-24h–NH2 exhibits a positive surface charge at pH values of 1, 3, and 5, with a ζ-potential of approximately +40 mV. In these conditions, electrostatic repulsion between the positively charged surface and Cr3+ ions would, in theory, hinder adsorption.
However, the material demonstrates moderate chromium removal (≈50%) at pH levels 1 and 3, and near-quantitative removal at pH 5. These results indicate that adsorption in GMS–24h–NH2 is governed primarily by coordination interactions between Cr3+ ions and amino groups on the surface, rather than by electrostatic attraction.
This stands in contrast to GMS-24h, where adsorption is predominantly driven by electrostatic interactions (ion exchange) between the negatively charged surface and chromium species (Figure 10d).
Adsorption data were evaluated using the Langmuir and Freundlich isotherm models, which are commonly employed to describe adsorption processes [40,41,42,43]. The adsorption change, expressed as the normalized standard deviation (Δq), was calculated according to Equation (4). This parameter quantitatively compares the pertinence of each isotherm model for describing the silica adsorption system. Where N represents the number of data points, while qexp and qcal, in mg·g–1, denote the experimental and model-predicted amounts of Cr3+ adsorbed at equilibrium, respectively.
Figure 11 shows the experimental data fitted to adsorption models as a function of pH. A better fit was observed for both silica materials at pH 1 and 3 using the Freundlich model, while an excellent fit was obtained for all adsorption models at pH 5.
Table 3 summarizes the adsorption parameters derived from each model. The Gibbs free energy of the adsorption process was calculated using Equation (5), where is the equilibrium constant determined as bQmax according to the Langmuir parameters [37,43]. The resulting negative Gibbs free energy values indicate that the adsorption process is spontaneous in all cases.
Additionally, the separation factor (RL) was used to assess whether the adsorption process is favorable or unfavorable. RL is calculated using Equation (6), where C0 is the initial concentration (mg–L–1) and KL is the Langmuir constant. An RL value between 0 and 1 indicates favorable adsorption, while an RL value greater than 1 suggests unfavorable adsorption. An RL value of 1 corresponds to linear adsorption, and an RL value of 0 indicates irreversible adsorption [43].
Figure 12 shows the RL coefficients for chromium adsorption on silica materials. Favorable adsorption was observed for both GMS-24h and GMS-24h–NH2, with RL values less than 1 in all cases.
RL values for GMS-24h ranged from 0.49 to 0.13 at pH 1 and from 0.62 to 0.20 at pH 5. As the concentration of Cr3+ increased, the RL values approached zero, indicating a tendency toward irreversible adsorption. However, this behavior was not observed at pH 3, where RL values ranged from 0.91 to 0.60.
The presence of amine groups on the silica surface modified the RL values, maintaining favorable adsorption while shifting away from irreversibility. For GMS-24h–NH2, the RL values ranged from 0.922 to 0.12; the lowest value (0.12) was observed at pH 5.
According to the Freundlich coefficient 1/n, GMS-24h shown values below 1, indicating favorable adsorption. In contrast, GMS-24h–NH2 showed 1/n > 1 at pH 1 and 3, suggesting heterogeneous and unfavorable adsorption under those conditions. At pH 5, however, 1/n < 1, indicating favorable adsorption.
These findings confirm that the maximum adsorption capacity for both silica materials occurs at pH 5, while moderate adsorption (approximately 55%) is observed at pH 1 and 3.
Figure 13 compares the Qmax values obtained from the Langmuir model for GMS-24h and GMS-24h–NH2 with those of other silica-based materials reported in the literature. Fe3O4@nSiO2@mSiO2/EDTA, silica modified with magnetite and the complexing agent EDTA [44], shown a Qmax of 30.59 mg·g−1 at pH 3—significantly lower than the values reported in this study for GMS-24h (303.03 mg·g−1) and GMS-24h–NH2 (48.31 mg·g−1) at the same pH.
Biogenic silica (SRH) has been proposed as a low-cost alternative [22]. However, the Qmax values obtained for GMS-24h (synthesized from sodium silicate) demonstrate superior adsorption capacity. At pH 5, GMS-24h showed a Qmax approximately six and sixteen times higher than SRH.
The textural properties of biogenic silica can vary depending on the environmental conditions under which it is obtained, resulting in materials with either high or low porosity [36]. In contrast, the GMS synthesis method yields consistent textural properties, contributing to its reliable adsorption performance.
According to the results obtained, the presence of amine groups on the surface of GMS-24h significantly improved chromium adsorption. The maximum adsorption capacity (Qmax) increased by a factor of 3.6 at pH 1 and 3.88 at pH 5 compared to the unmodified material.
Surface modification SRH with one amine group (SRH–NH2) and three amine groups (SRH–Triamine) enhanced Cr3+ adsorption, reaching 45.45 mg–g–1 and 204.08 mg–g–1 at pH 4, respectively. In comparison, GMS-24h–NH2 demonstrated an adsorption capacity of 48.31 mg–g–1 at pH 3 and 370 mg–g–1 at pH 5, showing superior adsorption performance [22].
Kinetic studies of Cr3+ adsorption in stock solutions
The adsorption rate was analyzed using semi-empirical kinetic models: pseudo-first-order (PFO), pseudo-second-order (PSO), intra-particle diffusion (PID), and extra-particle diffusion (ED). The quality of fit for each model was evaluated using the normalized deviation parameter, Δq (%), as outlined in [45,46,47].
As shown in Table 4, the experimental data fits with the PFO kinetic model. The analysis revealed that the PFO model does not adequately describe the adsorption behavior of both GMS-24h and GMS-24h–NH2, with Δq values around 50%. This shows that the PFO model does not provide reliable predictions of the experimental data.
In contrast, the adsorption rate described by the PSO model demonstrated strong alignment with the experimental data, as illustrated in Table 5. The correlation coefficients (R2) ranged from 0.9945 to 0.9999, and the low Δq values ranged from 0.30% to 20%.
The equilibrium factor Rw was used to explain the kinetic curve behavior under the PSO model and was calculated using Equation (6).
As shown in Equation (6), tref represents a long time in the adsorption process, K2 is the kinetic rate constant of the pseudo-second-order (PSO) model, and qe is the amount of Cr3+ adsorbed at equilibrium, calculated using the PSO model.
The equilibrium factor Rw is used to interpret the kinetic behavior of the system. If 1 > R_w > 0.1, the system gradually approaches equilibrium. If 0.1 > R_w > 0.01, the system approaches equilibrium smoothly. If R_w < 0.01, the system reaches equilibrium abruptly. Finally, if R_w = 1, the system does not approach equilibrium. These classifications are summarized in Table 6 [37,46].
Table 6 shows the kinetic parameters that were fitted to the experimental data using the PSO model. The equilibrium factor, Rw, which is evaluated at various initial Cr(III) concentrations across all studied systems, indicates that the adsorption process smoothly approaches equilibrium. This behavior corresponds to zones I and II in Table 6, suggesting that the systems show favorable adsorption kinetics and well-defined equilibrium profiles (Figure 14).
Figure 15 shows the chromium adsorption process analyzed using the IPD model. The presence of multiple slopes in the kinetic curves indicates that intraparticle and external diffusion, as well as the coordination of Cr(III) ions with functional groups on the silica surface, contribute to the overall adsorption mechanism. Weber’s diffusion model was compared across different pH values at an initial Cr(III) concentration of 1636 mg–L–1, revealing a similar number of slopes for each material studied. This suggests that the Cr(III) adsorption mechanism on silica is independent of pH.
On the other hand, four distinct slopes were observed for GMS-24h and five for the amine-functionalized material (GMS-24h–NH2), indicating an additional chelation step between the Cr(III) ions and amine groups on the surface (Figure 16).
4. Conclusions
The GMS-24h material exhibited a high chromium removal capacity at pH 3, with a maximum adsorption of 303 mg·g−1. In contrast, the amine-functionalized GMS-24h–NH2 showed its highest adsorption capacity at pH 5, reaching 370 mg·g−1.
Compared to other green mesoporous silica materials, such as SRH and SRH-Triamine, the two GMS modifications demonstrated an approximately 44% increase in adsorption capacity.
Adsorption kinetics evaluated using the pseudo-second-order (PSO) model showed excellent agreement with the experimental data, with the systems tending rapidly toward equilibrium.
The Weber diffusion model revealed four kinetic slopes for GMS-24h and five for GMS-24h–NH2, suggesting a similar adsorption mechanism for both materials. The additional slope observed in GMS-24h–NH2 is attributed to the chemical coordination step between Cr(III) and surface amine groups (N→Cr).
No significant changes in the adsorption mechanism were observed with respect to pH. For GMS-24h, the highest adsorption at pH 3 is associated with ion exchange or electrostatic interaction as the dominant step. At pH 1 and 5, analyte diffusion toward the surface was the predominant mechanism.
For GMS-24h–NH2, diffusion of Cr(III) to the surface was identified as the dominant step across all studied pH conditions.
Author Contributions
All authors contributed to the development and revision of the manuscript. CSH and MSH were responsible for conceptualization, data interpretation and analysis, writing, and financial support. EER contributed to data interpretation, analysis, and methodology. JMMM participated in writing, data interpretation and acquisition. MJPA contributed to methodology, data acquisition, and technical support. RMA and CRR supported data acquisition, methodology, and technical assistance. All authors read and approved the final version of the manuscript.
Funding
This work was supported by Instituto Politécnico Nacional, through the Secretaría de Investigación y Posgrado (SIP) for the financial support under the grant number SIP-20227036.
Acknowledgments
The authors are grateful for the financial support of the Universidad de Guanajuato through the DAIP-CIIC and the Instituto Politécnico Nacional through the Secretaría de Investigación y Posgrado (SIP) for the financial support under the grant number SIP-20227036 and the LICAMM for characterization support.
Conflicts of Interest
The authors declare no conflicts of interest.
References
- Shruthi, S.; Hemavathy, R.V. Myco-remediation of chromium heavy metal from industrial wastewater: A review. Toxicol. Rep. 2024, 13, 101740. [Google Scholar] [CrossRef]
- Kumari, A.; Kamaraj, N.; Selvaraj, R.; Nanoth, R. Emerging trends and future outlook on chromium removal in the lab, pilot scale, and industrial wastewater system: An updated review exploring 10 years of research. Environ. Monit. Assess. 2025, 197, 1–46. [Google Scholar] [CrossRef]
- Xiao, Y.; Huang, J.; Xu, Q.; Liu, R.; Yang, F.; Xie, H. Synergistic oxygen vacancies and surface hydroxyl groups in NFM@γ-Al2O3 for enhanced catalytic ozonation of refractory organics and phosphorus in swine wastewater. Sep. Purif. Technol. 2025, 378. [Google Scholar] [CrossRef]
- Liu, T.; Yin, M.; Du, W.; Zhang, S.; Wen, Z.; Yu, L.; Sun, J.; Zhang, Q.; Sun, M.; Wang, X.; et al. Metal ion-induced structural reconstruction in a porphyrin MOF for ultrasensitive detection of Cr3+ and Al3+. Spectrochim. Acta Part A: Mol. Biomol. Spectrosc. 2025, 344, 126624. [Google Scholar] [CrossRef]
- Niu, K.; Zhang, X.; Zhu, P.; Liu, J.; Liu, H.; Wang, L.; Wang, J.; Zhang, J.; Liu, Q.; Ma, S.; et al. Facile synthesis of polyethyleneimine-reinforced PHTA resin for efficient Cr(VI) removal. Sep. Purif. Technol. 2025, 377. [Google Scholar] [CrossRef]
- Hosen, S.; Sahen, S.; Ahmed, H.; Reza, S.; Bhowmik, P.; Mim, F.; Islam, B.; Naim, A.H.K.; Rahman, M.M.; Rahman, M. Tannery shaving dust-based charcoal blended adsorbent for efficient heavy metal remediation: An experimental and machine learning approach. Case Stud. Chem. Environ. Eng. 2025, 12. [Google Scholar] [CrossRef]
- Quiroz, C.E.A.; Ruiz, Y.G.; Rios, J.F.U.; Escobar, E.G.L.; Rodrigues, M.A.S. Electrochemical separation of chromium/collagen from wet blue in a single step: Recycling of tannery waste to promote a circular economy. Results Eng. 2025, 26. [Google Scholar] [CrossRef]
- Santis, A.; Arbeláez, O.; Mendivelso, K.; Riaño, M.; Prieto, V.; Velásquez, P. Sustainable innovation: Removal of chromium (VI) from wastewater from plastic chromium plating industries using rice husk as photocatalyst. Results Eng. 2025, 26. [Google Scholar] [CrossRef]
- Kandasamy, S.; Meenachi, S.; Ohm Prakash, K.; Kr, S.K.; Thamaraikannan, V. Removal of chromium from tannery wastewater by rice husk ash nanosilica. Appl. Res. 2023, 2. [Google Scholar] [CrossRef]
- Rabago-Velasquez, Z.; Patiño-Saldivar, L.; A, A.N.A.; Talavera-Lopez, A.; Salazar-Hernández, M.; Hernández-Soto, R.; Hernández, J.A. Removal of Cr(III) from tannery wastewater using Citrus aurantium (grapefruit peel) as biosorbent. Desalination Water Treat. 2023, 283, 36–49. [Google Scholar] [CrossRef]
- Munagapati, V.S.; Wen, H.-Y.; Gutha, Y.; Wen, J.-C.; Venkateswarlu, S.; Yarramuthi, V.; Gollakota, A.R.; Shu, C.-M.; Lohith, E.; Jyothi, N. Advances in biocompatible chitosan composites for chromium, arsenic, and radionuclide remediation: Experimental and computational insights. Co-ord. Chem. Rev. 2025, 547. [Google Scholar] [CrossRef]
- Ahmed, M.A.; Mohamed, A.A. The use of chitosan-based composites for environmental remediation: A review. Int. J. Biol. Macromol. 2023, 242, 124787. [Google Scholar] [CrossRef] [PubMed]
- Zhou, Y.; Zhang, Y.; Nie, Y.; Sun, D.; Wu, D.; Ban, L.; Zhang, H.; Yang, S.; Chen, J.; Du, H.; et al. Recent advances and perspectives in functional chitosan-based composites for environmental remediation, energy, and biomedical applications. Prog. Mater. Sci. 2025, 152. [Google Scholar] [CrossRef]
- Zhang, X.; Wu, S.; Liu, R.; Jiang, H.; Jing, S.; Zhuang, H. Smart-responsive chitosan-based materials for precise degradation control and environmental remediation: A review. Int. J. Biol. Macromol. 2025, 319, 144982. [Google Scholar] [CrossRef] [PubMed]
- Rathore, B.S.; Perumal, P.; Singh, G.P.; Rathore, R.; Rawal, M.K.; Jadoun, S.; Chauhan, N.P.S. Polyaniline, Chitosan and Metal Oxide based Nanocomposites: Synthesis, Characterization, and Their Water Remediation Applications. J. Mol. Struct. 2025, 1337. [Google Scholar] [CrossRef]
- Purrostam, S.; Rahimi-Ahar, Z.; Babapoor, A.; Nematollahzadeh, A.; Salahshoori, I.; Seyfaee, A. Melamine functionalized mesoporous silica SBA-15 for separation of chromium (VI) from wastewater. Mater. Chem. Phys. 2023, 307. [Google Scholar] [CrossRef]
- Sun, X.D.; Feng, D.; Xu, J.; Gao, X.; Yan, K.; Tian, Z. Mesoporous silica modified zwitterionic poly(ionic liquids) with enhanced absorption for Cr3+ and dye as a tanning agent. Microporous Mesoporous Mater. 2025, 396. [Google Scholar] [CrossRef]
- Zhang, S.; Xu, X.; Yue, Q.; Wang, W.; Gao, B. Improving the removal of chromium by polymer epichlorohydrin- dimethylamine functionalized mesoporous silica. Desalination Water Treat. 2019, 169, 294–304. [Google Scholar] [CrossRef]
- Kobylinska, N. Single-stage separation and quantitation of anionic and cationic forms of transition metals from environmental water using organo-functionalized ordered mesoporous silica. Chem. Eng. J. Adv. 2025, 22. [Google Scholar] [CrossRef]
- Zhu, H.; Ding, K.; You, Y.; Sheng, G.; Dong, H.; Liu, H. In-situ fabrication of exceptionally efficient traps namely nanoscale zero valent iron wrapped on mesoporous silica microspheres with different size in effectively purifying and scavenging Re(VII) and Cr(VI) from water matrices. J. Environ. Chem. Eng. 2025, 13. [Google Scholar] [CrossRef]
- Priya, A.; Yogeshwaran, V.; Rajendran, S.; Hoang, T.K.; Soto-Moscoso, M.; Ghfar, A.A.; Bathula, C. Investigation of mechanism of heavy metals (Cr6+, Pb2+& Zn2+) adsorption from aqueous medium using rice husk ash: Kinetic and thermodynamic approach. Chemosphere 2022, 286, 131796. [Google Scholar] [CrossRef]
- Gutiérrez-Valtierra, M.; Salazar-Hernández, C.; Mendoza-Miranda, J.M.; Elorza-Rodríguez, E.; Puy-Alquiza, M.J.; Caudillo-González, M.; Salazar-Hernández, M.M. Cr(III) removal from tannery effluents using silica obtained from rice husk and modified silica. Desalination Water Treat. 2019, 158, 152–163. [Google Scholar] [CrossRef]
- Ijaz, S.; Kausar, A.; Iqbal, M.; El Messaoudi, N.; Miyah, Y.; Knani, S.; Graba, B. Advances in extraction of silica from rice husk and its modification for friendly environmental wastewater treatment via adsorption technology. J. Water Process. Eng. 2025, 71. [Google Scholar] [CrossRef]
- Ben Khemis, I.; Aouaini, F.; Knani, S.; Al-Mugren, K.S.; Ben Lamine, A. Microscopic and macroscopic analysis of hexavalent chromium adsorption on polypyrrole-polyaniline@rice husk ash adsorbent using statistical physics modeling. Heliyon 2024, 10, e37061. [Google Scholar] [CrossRef]
- Amirhandeh, S.Z.H.; Salem, A.; Salem, S. Sono-chemical extraction of silica from rice husk for uptake of chromium species from tannery wastewater: Effect of aging time on porous structure. Mater. Lett. 2022, 327. [Google Scholar] [CrossRef]
- Khan, M.; Din, I.; Aziz, F.; Qureshi, I.U.; Zahid, M.; Mustafa, G.; Sher, A.; Hakim, S. Chromium adsorption from water using mesoporous magnetic iron oxide-aluminum silicate adsorbent: An investigation of adsorption isotherms and kinetics. Curr. Res. Green Sustain. Chem. 2023, 7. [Google Scholar] [CrossRef]
- Tsegaye, G.; Kiflie, Z.; Mekonnen, T.H.; Jida, M. Amine-functionalized magnetic bio-nanocomposite for fluoride and chromium removal in water. Results Chem. 2025, 18. [Google Scholar] [CrossRef]
- Wei, Y.; He, L.; Luo, Z.; Zhou, X.; Zhang, Z.; Luo, Y.; Liu, Q. Removal of hexavalent chromium from aqueous solution using low-cost magnetic microspheres derived from alkali-activated iron-rich copper slag. J. Environ. Chem. Eng. 2023, 11. [Google Scholar] [CrossRef]
- Zhang, X.; Liang, P.; Pan, Y.; Wang, G. Fabrication of hydrophilic defective MOF-801 thin-film nanocomposite membranes via interfacial polymerization for efficient chromium removal from water. J. Environ. Manag. 2025, 384, 125561. [Google Scholar] [CrossRef]
- Mubarak, A.S.; Salih, S.S.; Kadhom, M.; Ghosh, T.K. Removal of heavy metals from contaminated water using Metal-Organic Frameworks (MOFs): A review on techniques and applications. Mater. Sci. Eng. B 2025, 315. [Google Scholar] [CrossRef]
- Khosroshahi, N.; Bakhtian, M.; Safarifard, V. Mechanochemical synthesis of ferrite/MOF nanocomposite: Efficient photocatalyst for the removal of meropenem and hexavalent chromium from water. J. Photochem. Photobiol. A: Chem. 2022, 431. [Google Scholar] [CrossRef]
- Tokalıoğlu, Ş.; Moghaddam, S.T.H.; Demir, S. A zirconium metal–organic framework functionalized with a S/N containing carboxylic acid (MOF-808(Zr)-Tz) as an efficient sorbent for the ultrafast and selective dispersive solid phase micro extraction of chromium, silver, and rhodium in water samples. Talanta 2024, 274, 126094. [Google Scholar] [CrossRef]
- Watanabe, Y.; Amitani, N.; Yokoyama, T.; Ueda, A.; Kusakabe, M.; Unami, S.; Odashima, Y. Synthesis of mesoporous silica from geothermal water. Sci. Rep. 2021, 11, 1–9. [Google Scholar] [CrossRef]
- Hwang, J.; Lee, J.H.; Chun, J. Facile approach for the synthesis of spherical mesoporous silica nanoparticles from sodium silicate. Mater. Lett. 2021, 283. [Google Scholar] [CrossRef]
- Hossain, K.-Z.; Sayari, A. Synthesis of onion-like mesoporous silica from sodium silicate in the presence of α,ω-diamine surfactant. Microporous Mesoporous Mater. 2008, 114, 387–394. [Google Scholar] [CrossRef]
- Ewlad-Ahmed, A.M.; Morris, M.; Holmes, J.; Belton, D.J.; Patwardhan, S.V.; Gibson, L.T. Green Nanosilicas for Monoaromatic Hydrocarbons Removal from Air. Silicon 2021, 14, 1447–1454. [Google Scholar] [CrossRef]
- Salazar-Hernández, M.; Salazar-Hernández, C.; Rodríguez, E.E.; Mendoza-Miranda, J.M.; Puy-Alquiza, M.d.J.; Miranda-Aviles, R.; Rodríguez, C.R. Using of Green Silica Amine-Fe3O4 Modified from Rrecovery Ag(I) on Aqueous System. Silicon 2023, 16, 1509–1524. [Google Scholar] [CrossRef]
- Barton, T.J.; Bull, L.M.; Klemperer, W.G.; Loy, D.A.; McEnaney, B.; Misono, M.; Monson, P.A.; Pez, G.; Scherer, G.W.; Vartuli, J.C.; et al. Tailored Porous Materials. Chem. Mater. 1999, 11, 2633–2656. [Google Scholar] [CrossRef]
- Tella, J.O.; Ajanaku, K.O.; Adekoya, J.A.; Banerjee, R.; Patra, C.R.; Pavuluri, S.; Sreedhar, B. Physicochemical and textural properties of amino-functionalised mesoporous silica nanomaterials from different silica sources. Results Chem. 2024, 7. [Google Scholar] [CrossRef]
- Hu, Q.; Lan, R.; He, L.; Liu, H.; Pei, X. A critical review of adsorption isotherm models for aqueous contaminants: Curve characteristics, site energy distribution and common controversies. J. Environ. Manag. 2023, 329, 117104. [Google Scholar] [CrossRef]
- Al-Ghouti, M.A.; Da'ana, D.A. Guidelines for the use and interpretation of adsorption isotherm models: A review. J. Hazard. Mater. 2020, 393, 122383. [Google Scholar] [CrossRef]
- Alafnan, S.; Awotunde, A.; Glatz, G.; Adjei, S.; Alrumaih, I.; Gowida, A. Langmuir adsorption isotherm in unconventional resources: Applicability and limitations. J. Pet. Sci. Eng. 2021, 207. [Google Scholar] [CrossRef]
- Foo, K.; Hameed, B. Insights into the modeling of adsorption isotherm systems. Chem. Eng. J. 2010, 156, 2–10. [Google Scholar] [CrossRef]
- Wang, J.; Chen, Y.; Sun, T.; Saleem, A.; Wang, C. Enhanced removal of Cr(III)-EDTA chelates from high-salinity water by ternary complex formation on DETA functionalized magnetic carbon-based adsorbents. Ecotoxicol. Environ. Saf. 2021, 209, 111858. [Google Scholar] [CrossRef] [PubMed]
- Simonin, J.P. On the comparison of pseudo-first order and pseudo-second order rate laws in the modeling of adsorption kinetics. Chem. Eng. J. 2016, 300, 254–263. [Google Scholar] [CrossRef]
- Wu, F.-C.; Tseng, R.-L.; Huang, S.-C.; Juang, R.-S. Characteristics of pseudo-second-order kinetic model for liquid-phase adsorption: A mini-review. Chem. Eng. J. 2009, 151, 1–9. [Google Scholar] [CrossRef]
- Largitte, L.; Pasquier, R. A review of the kinetics adsorption models and their application to the adsorption of lead by an activated carbon. Chem. Eng. Res. Des. 2016, 109, 495–504. [Google Scholar] [CrossRef]
Figure 1.
(a) Effect of aging time on surface area of the GMS (b) Effect of aging time on volume pore of the GMS (c) N2 isotherms adsorption-desorption for GMS.
Figure 1.
(a) Effect of aging time on surface area of the GMS (b) Effect of aging time on volume pore of the GMS (c) N2 isotherms adsorption-desorption for GMS.
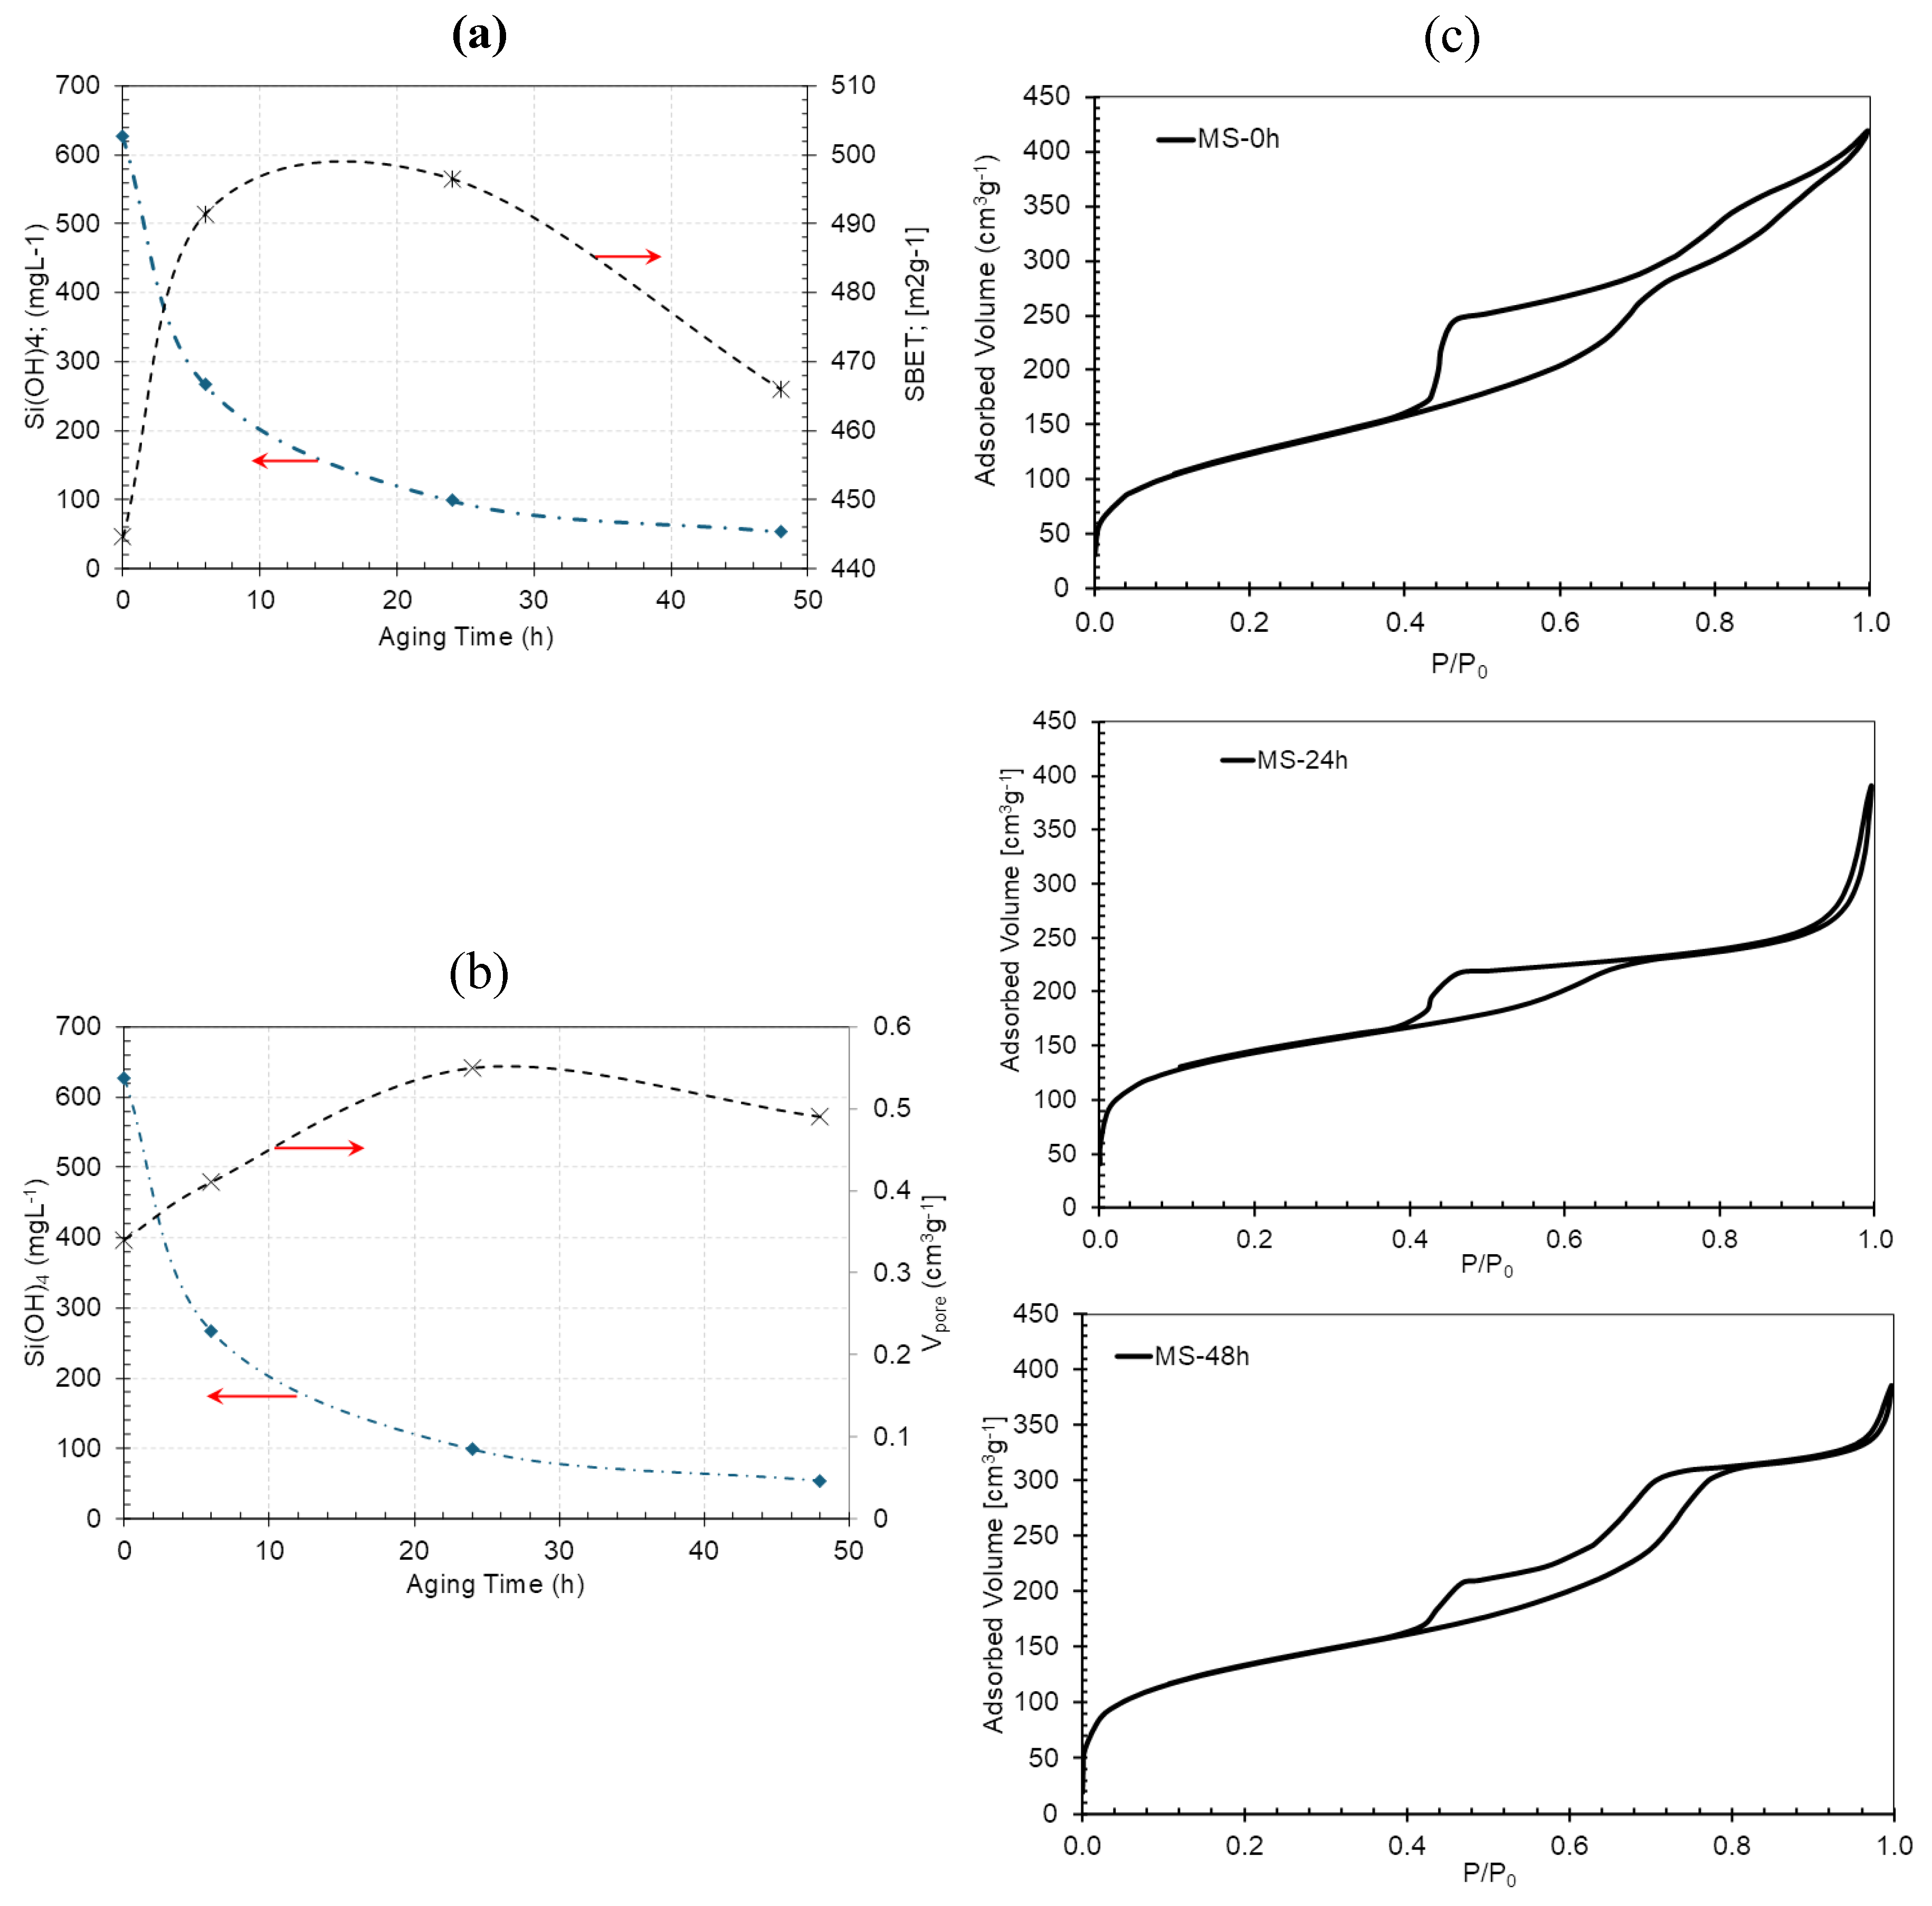
Figure 2.
BJH pore distribution of GMS with different aging time.
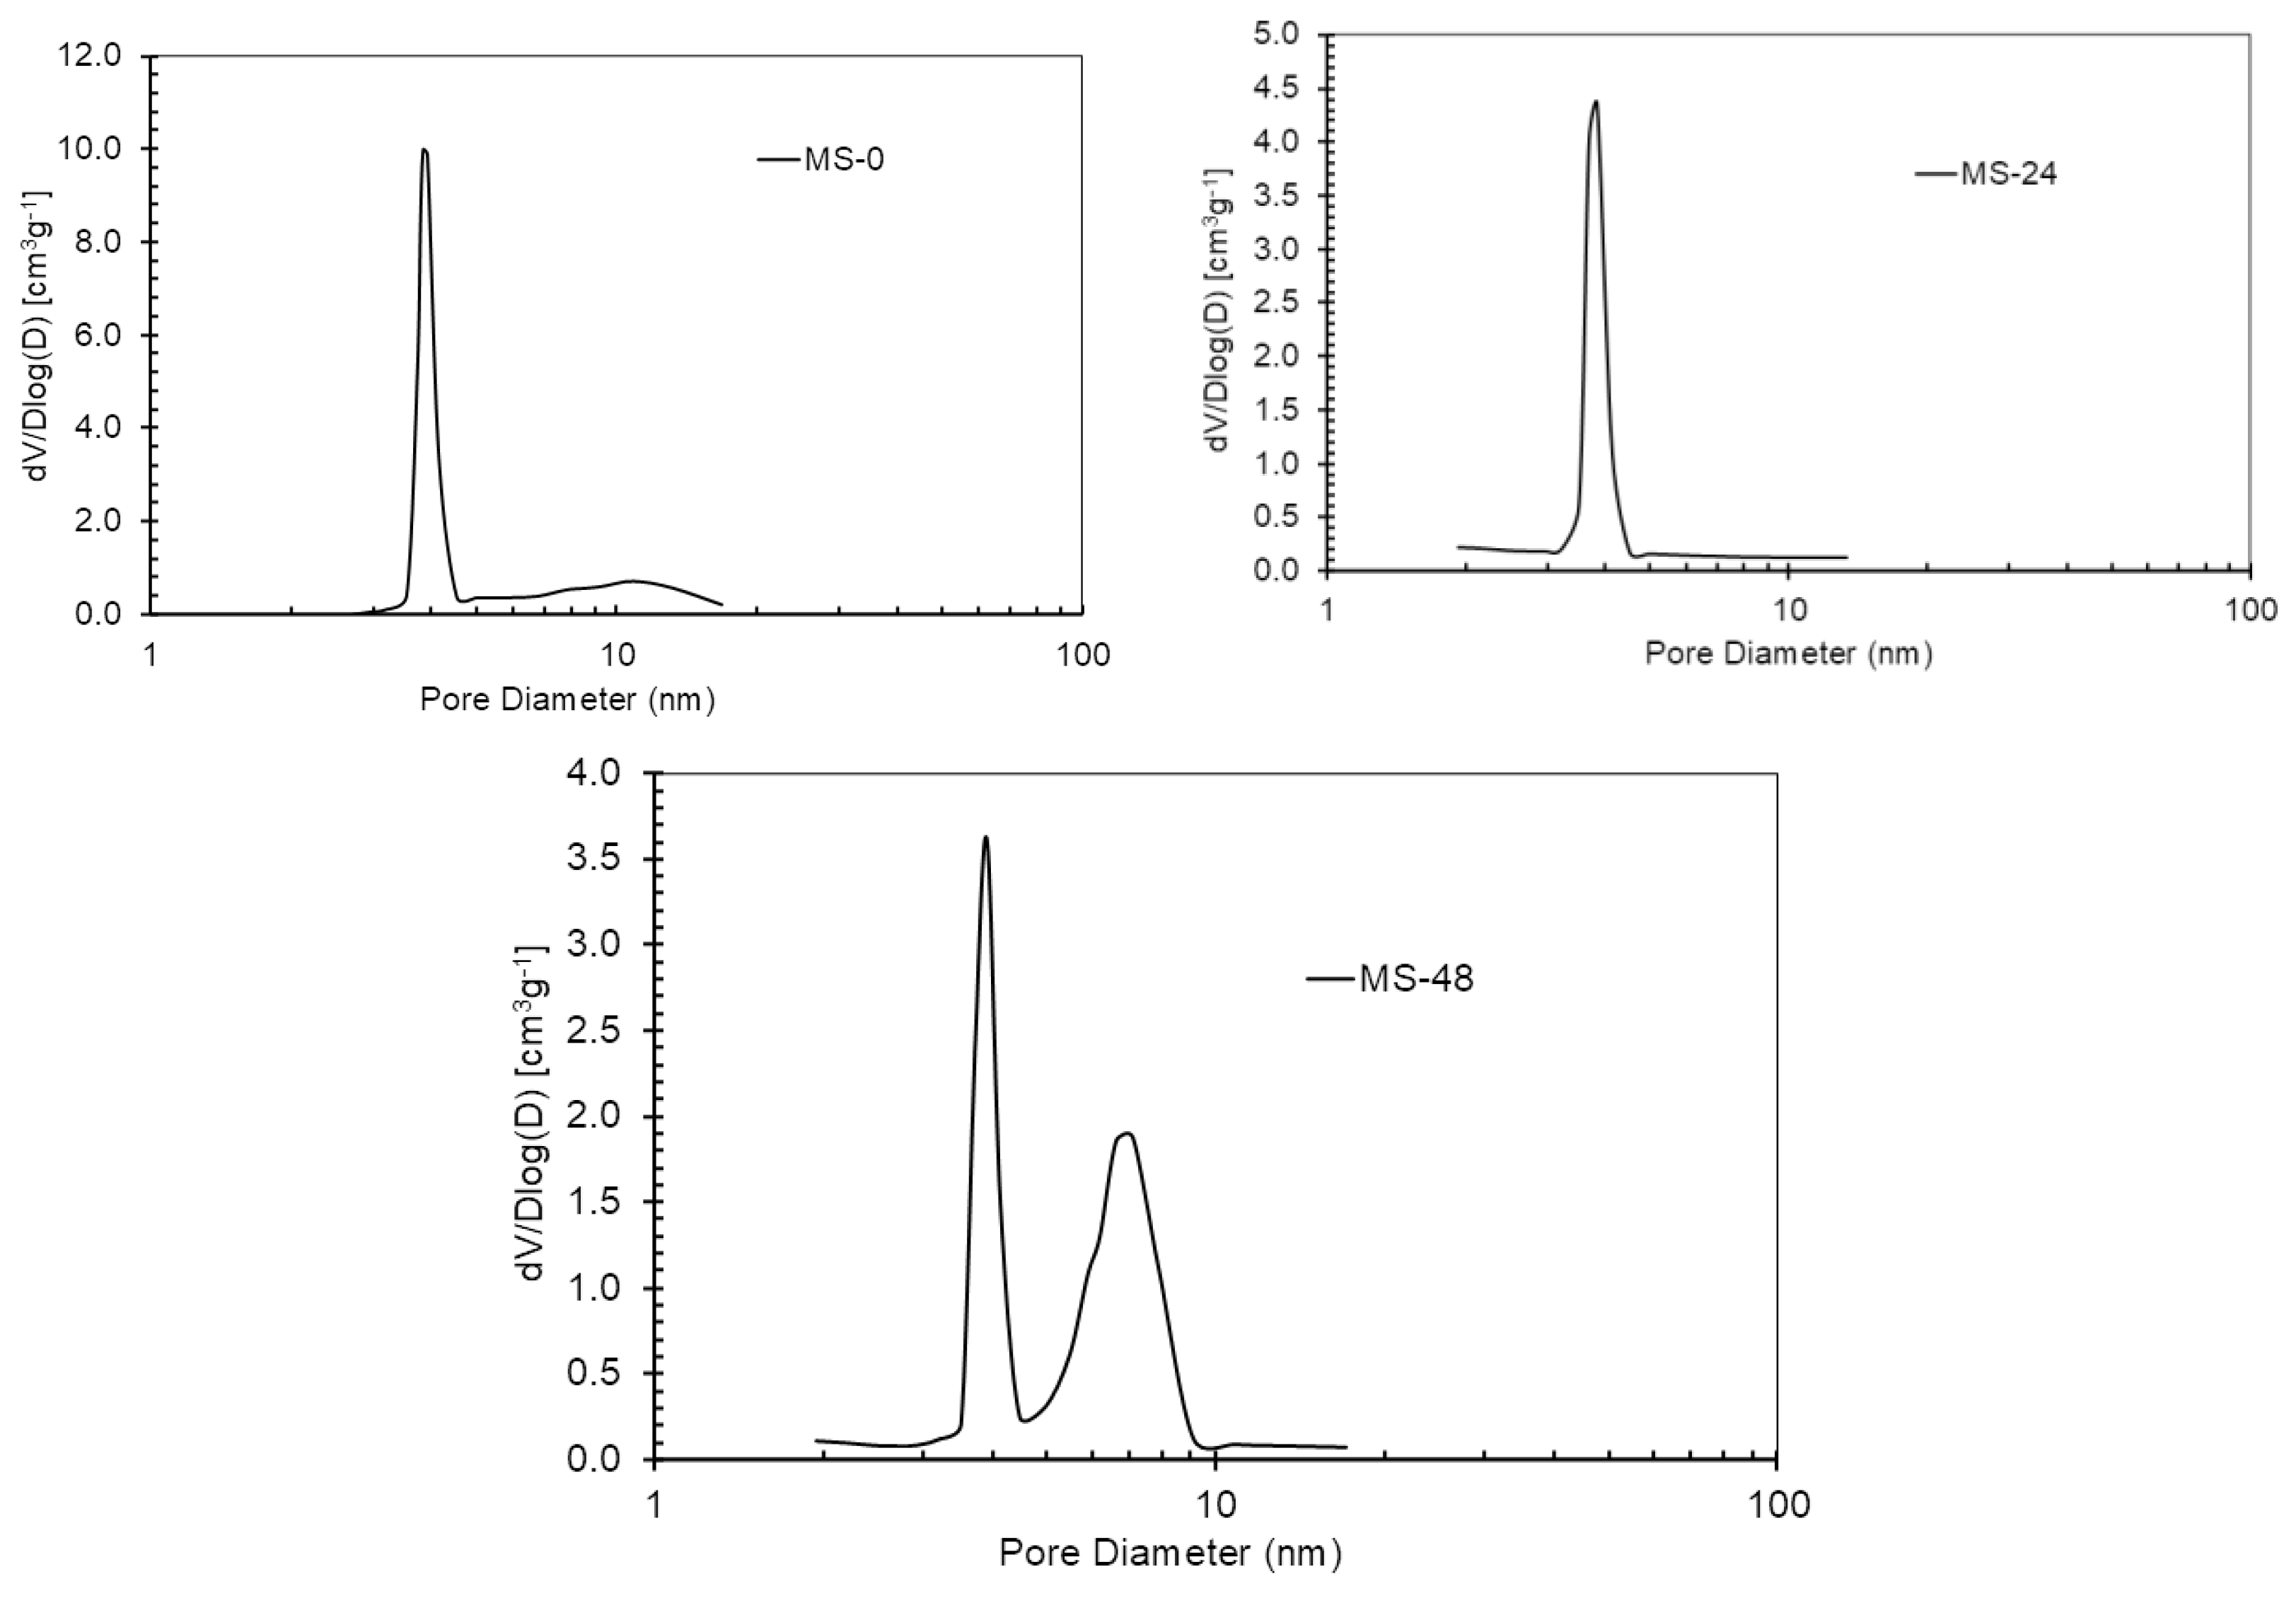
Figure 3.
TEM of mesoporous silica (MS) (a) 0 h of aging, (b) 24 h of aging.
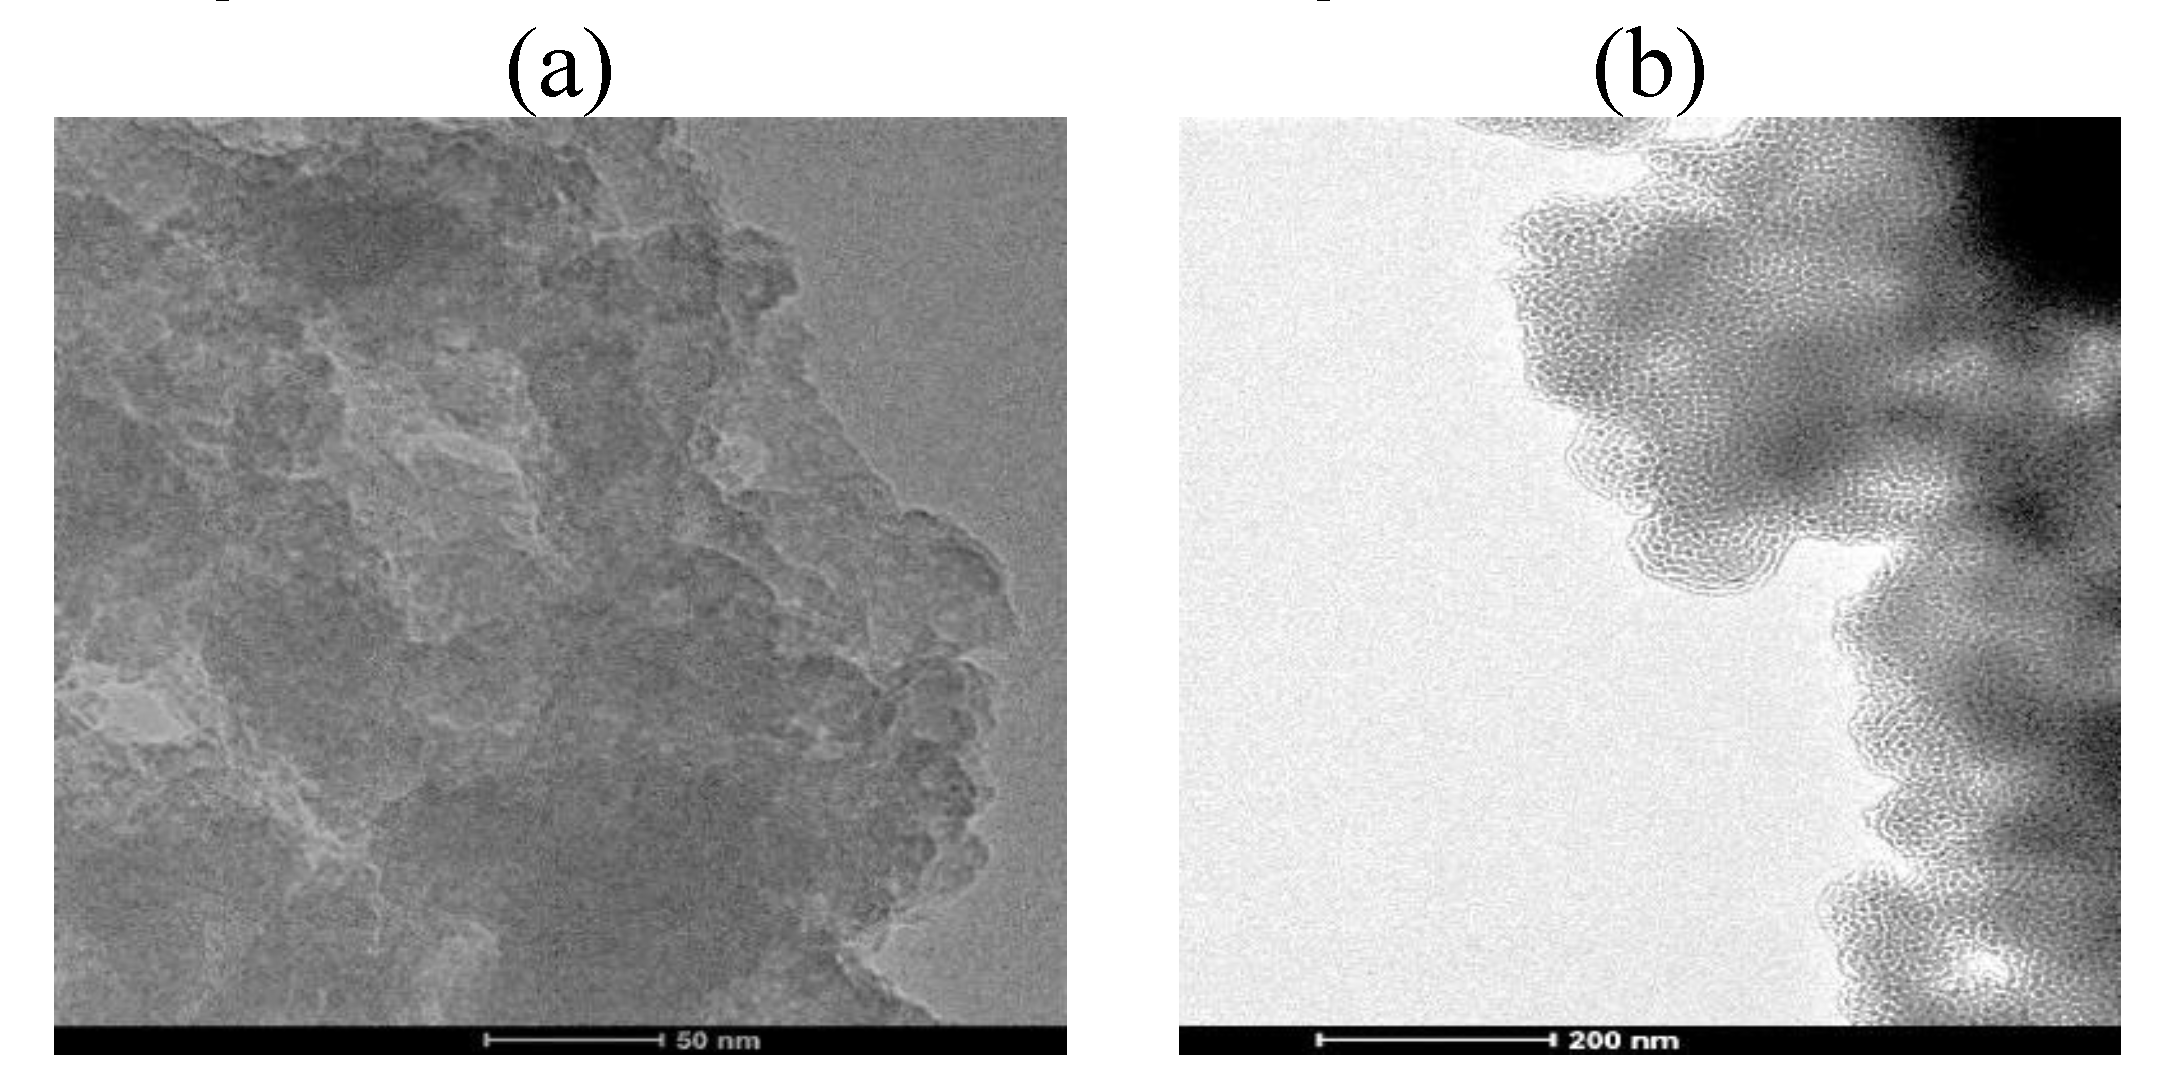
Figure 4.
GMS surface modification (a) pathway modification (b) ATR-FTIR GMS-24h (c) ATR-FTIR GMS-24h-NH2.
Figure 4.
GMS surface modification (a) pathway modification (b) ATR-FTIR GMS-24h (c) ATR-FTIR GMS-24h-NH2.
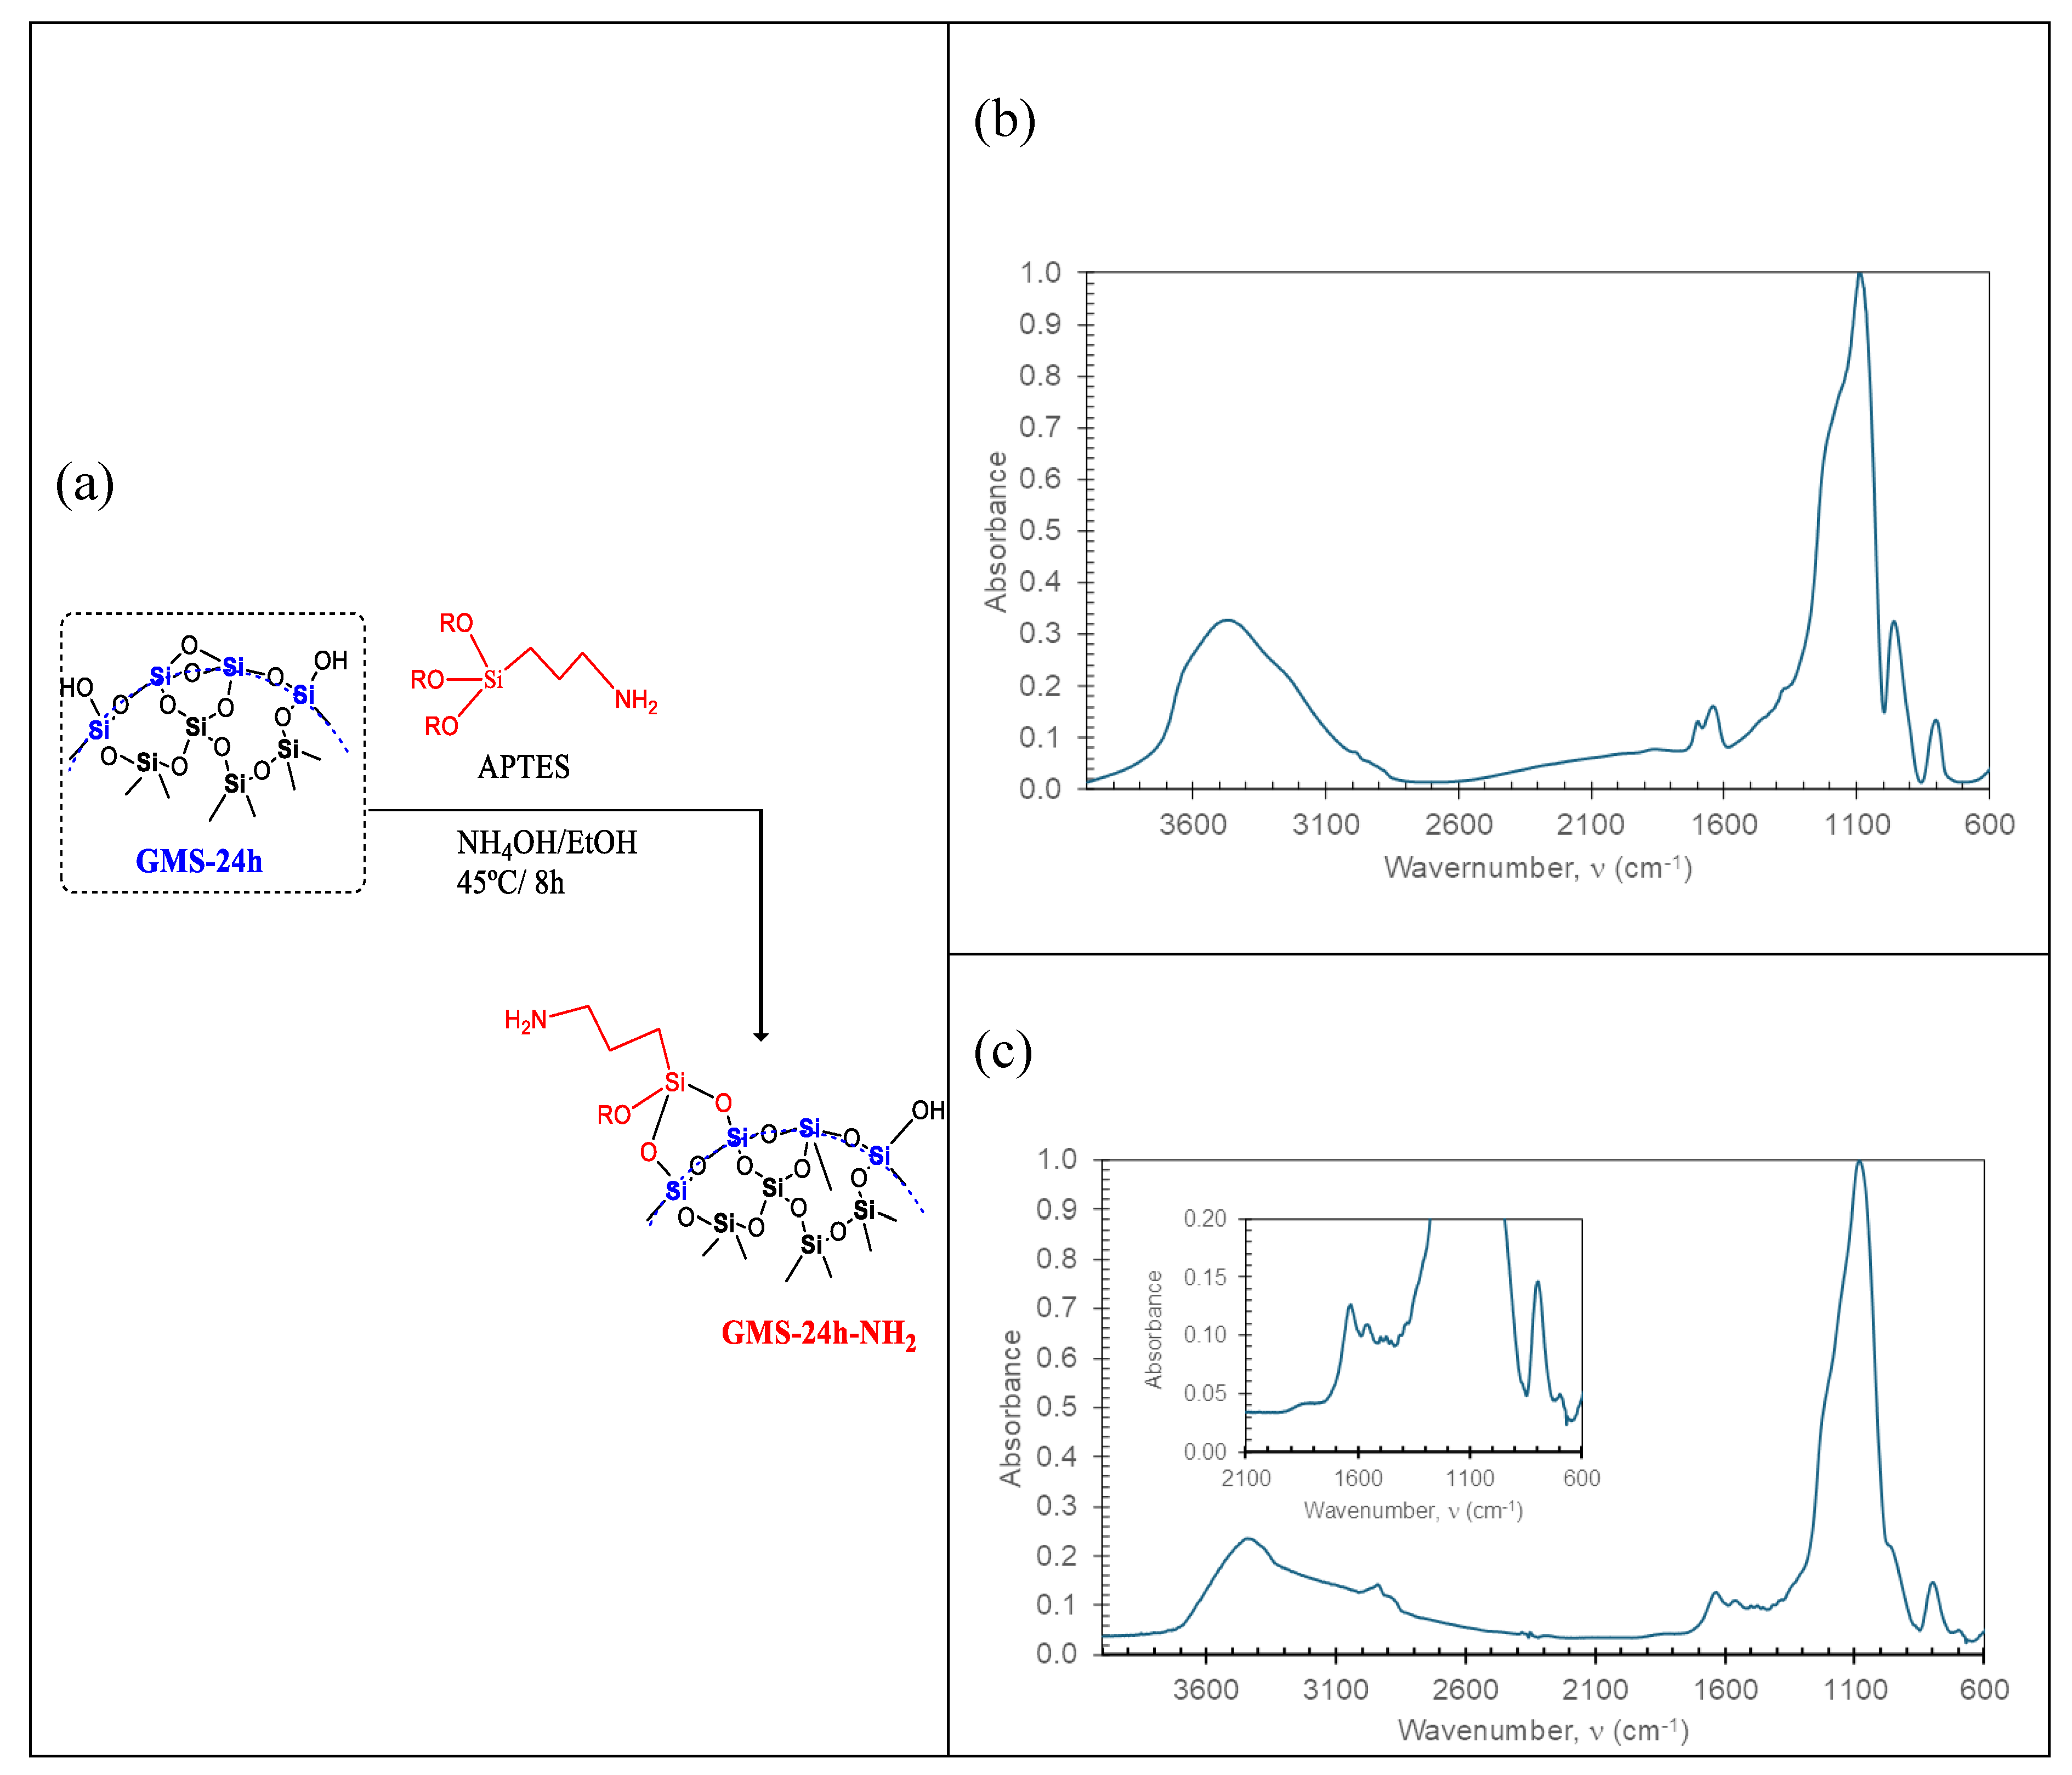
Figure 5.
13C spectra for GMS-24h-NH2.
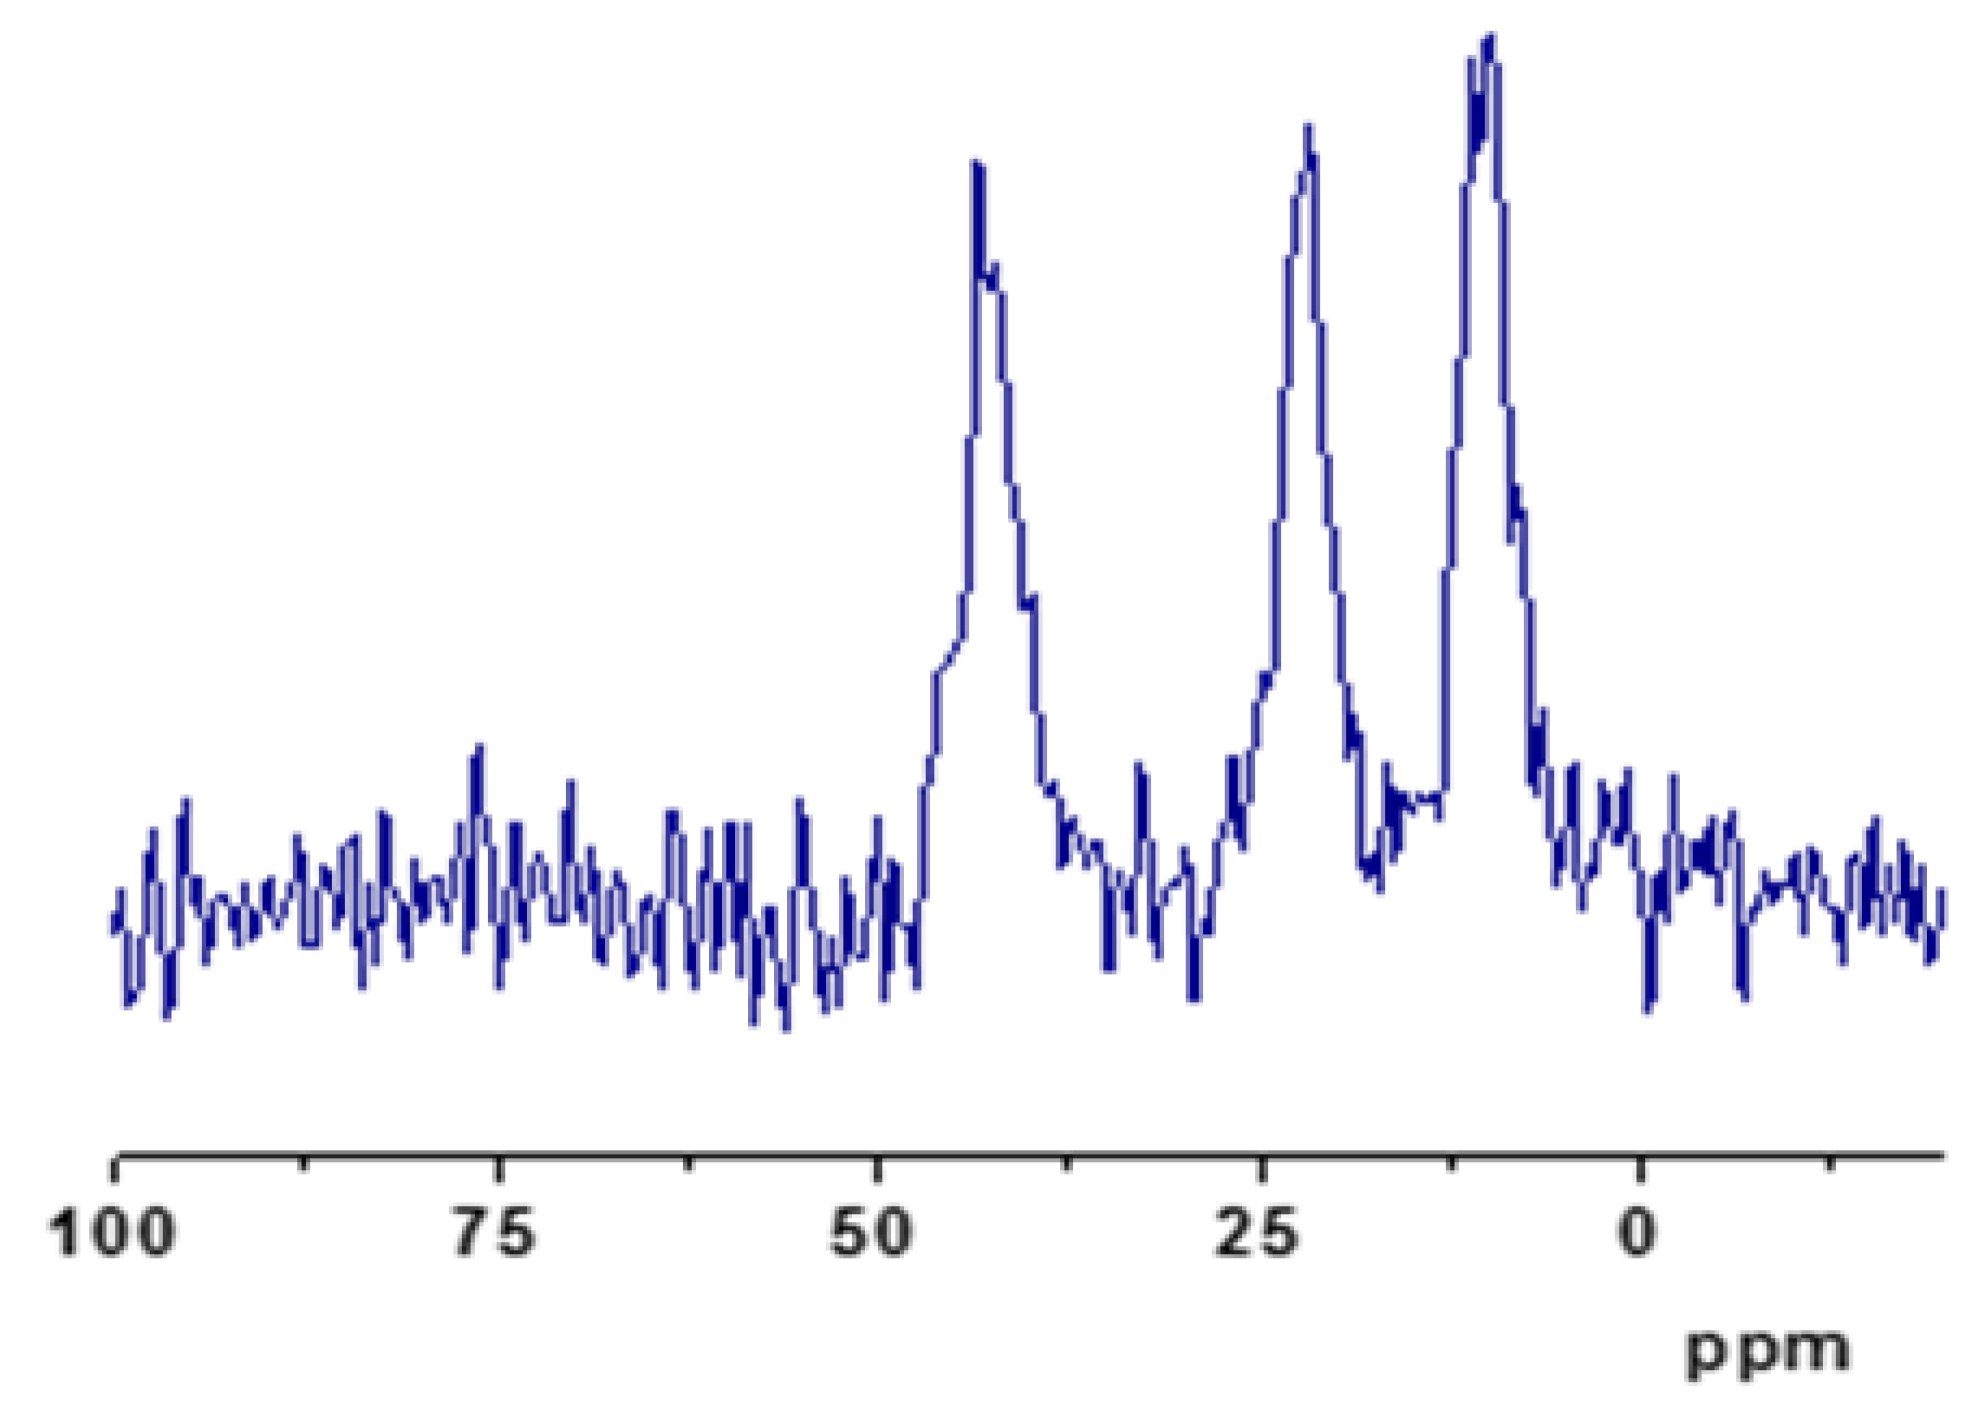
Figure 6.
(a) N2 adsorption-desorption isotherms for GMS-modified (b) pore distribution for GMS-modified.
Figure 6.
(a) N2 adsorption-desorption isotherms for GMS-modified (b) pore distribution for GMS-modified.
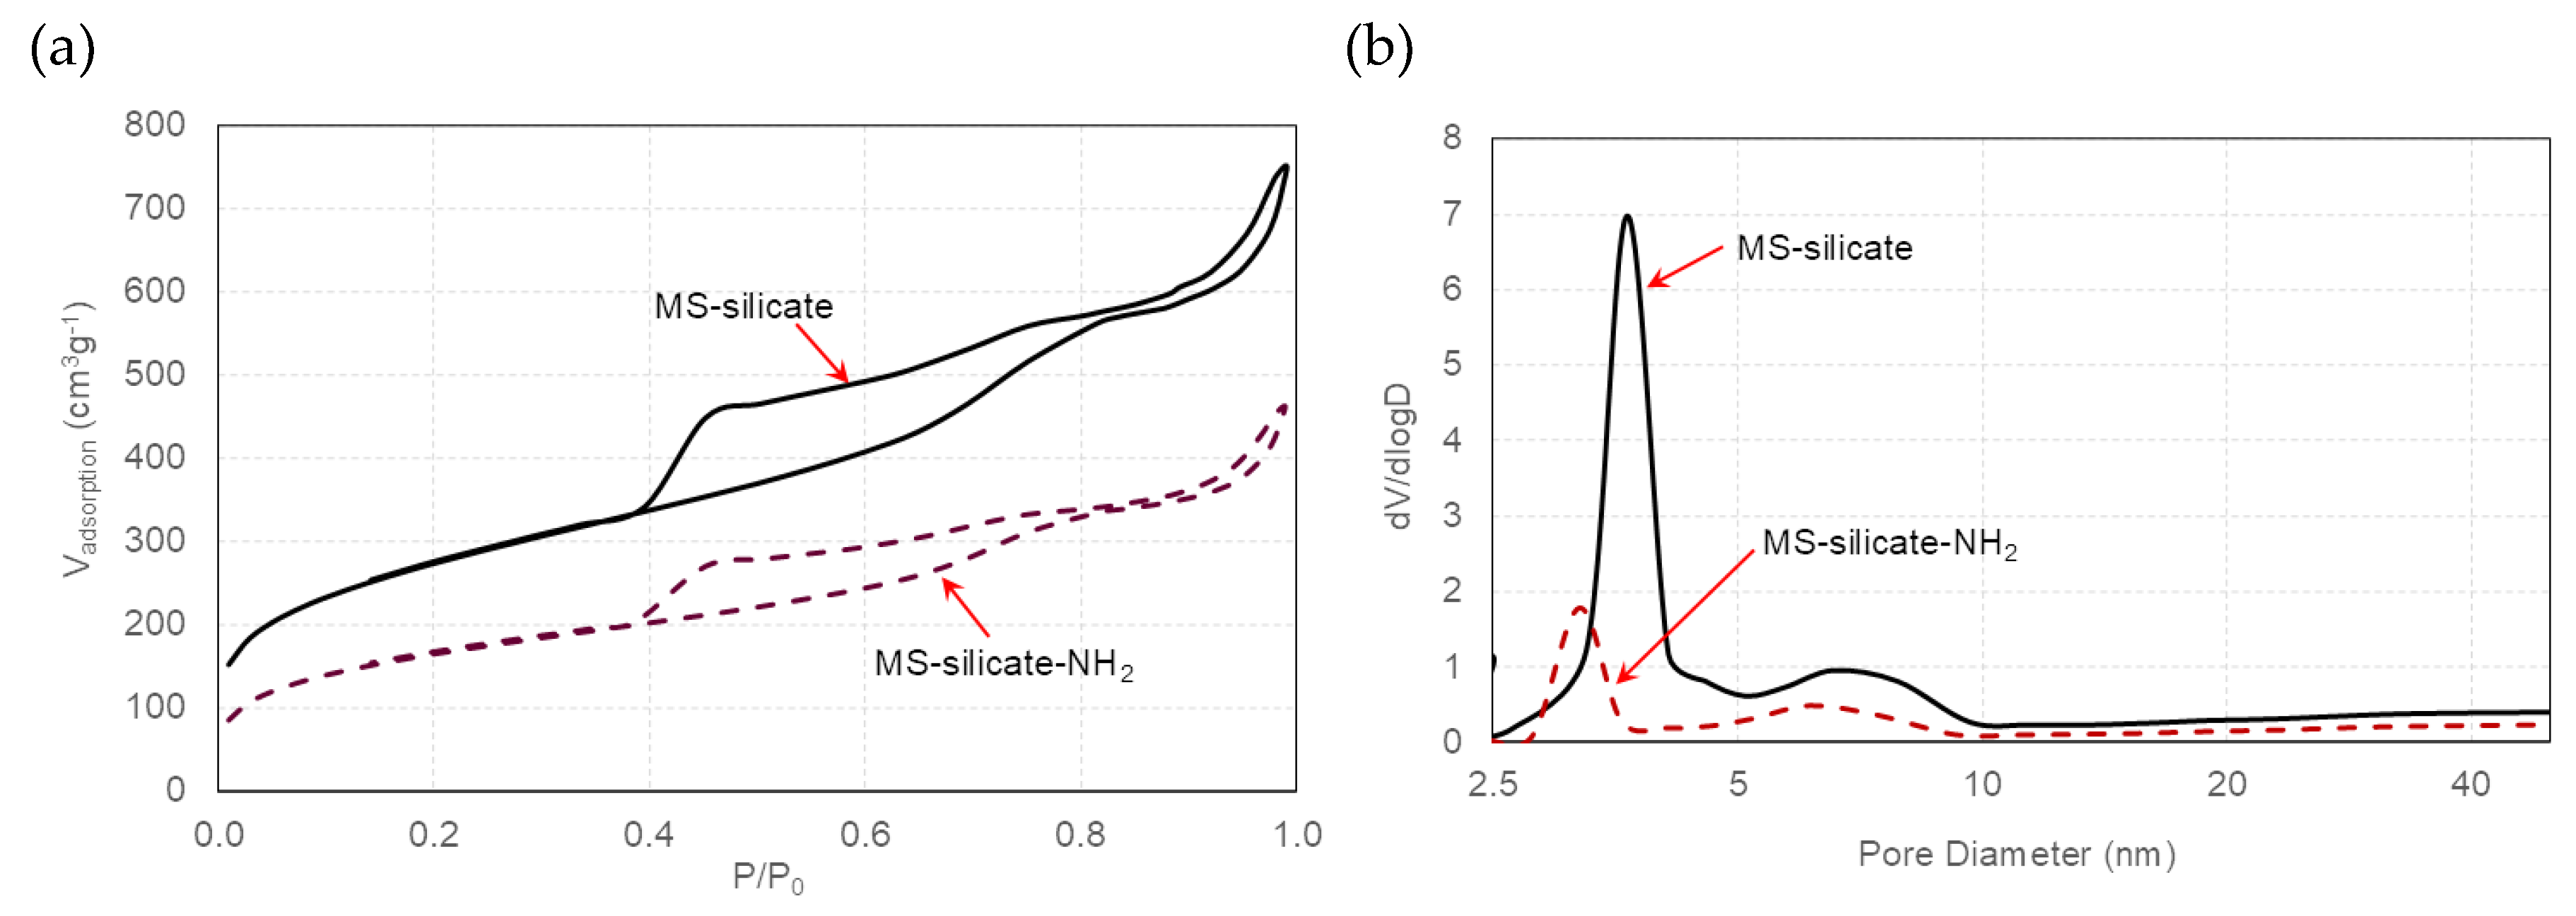
Figure 7.
Thermal analysis for GMS-24h and GMS-24h-NH2.
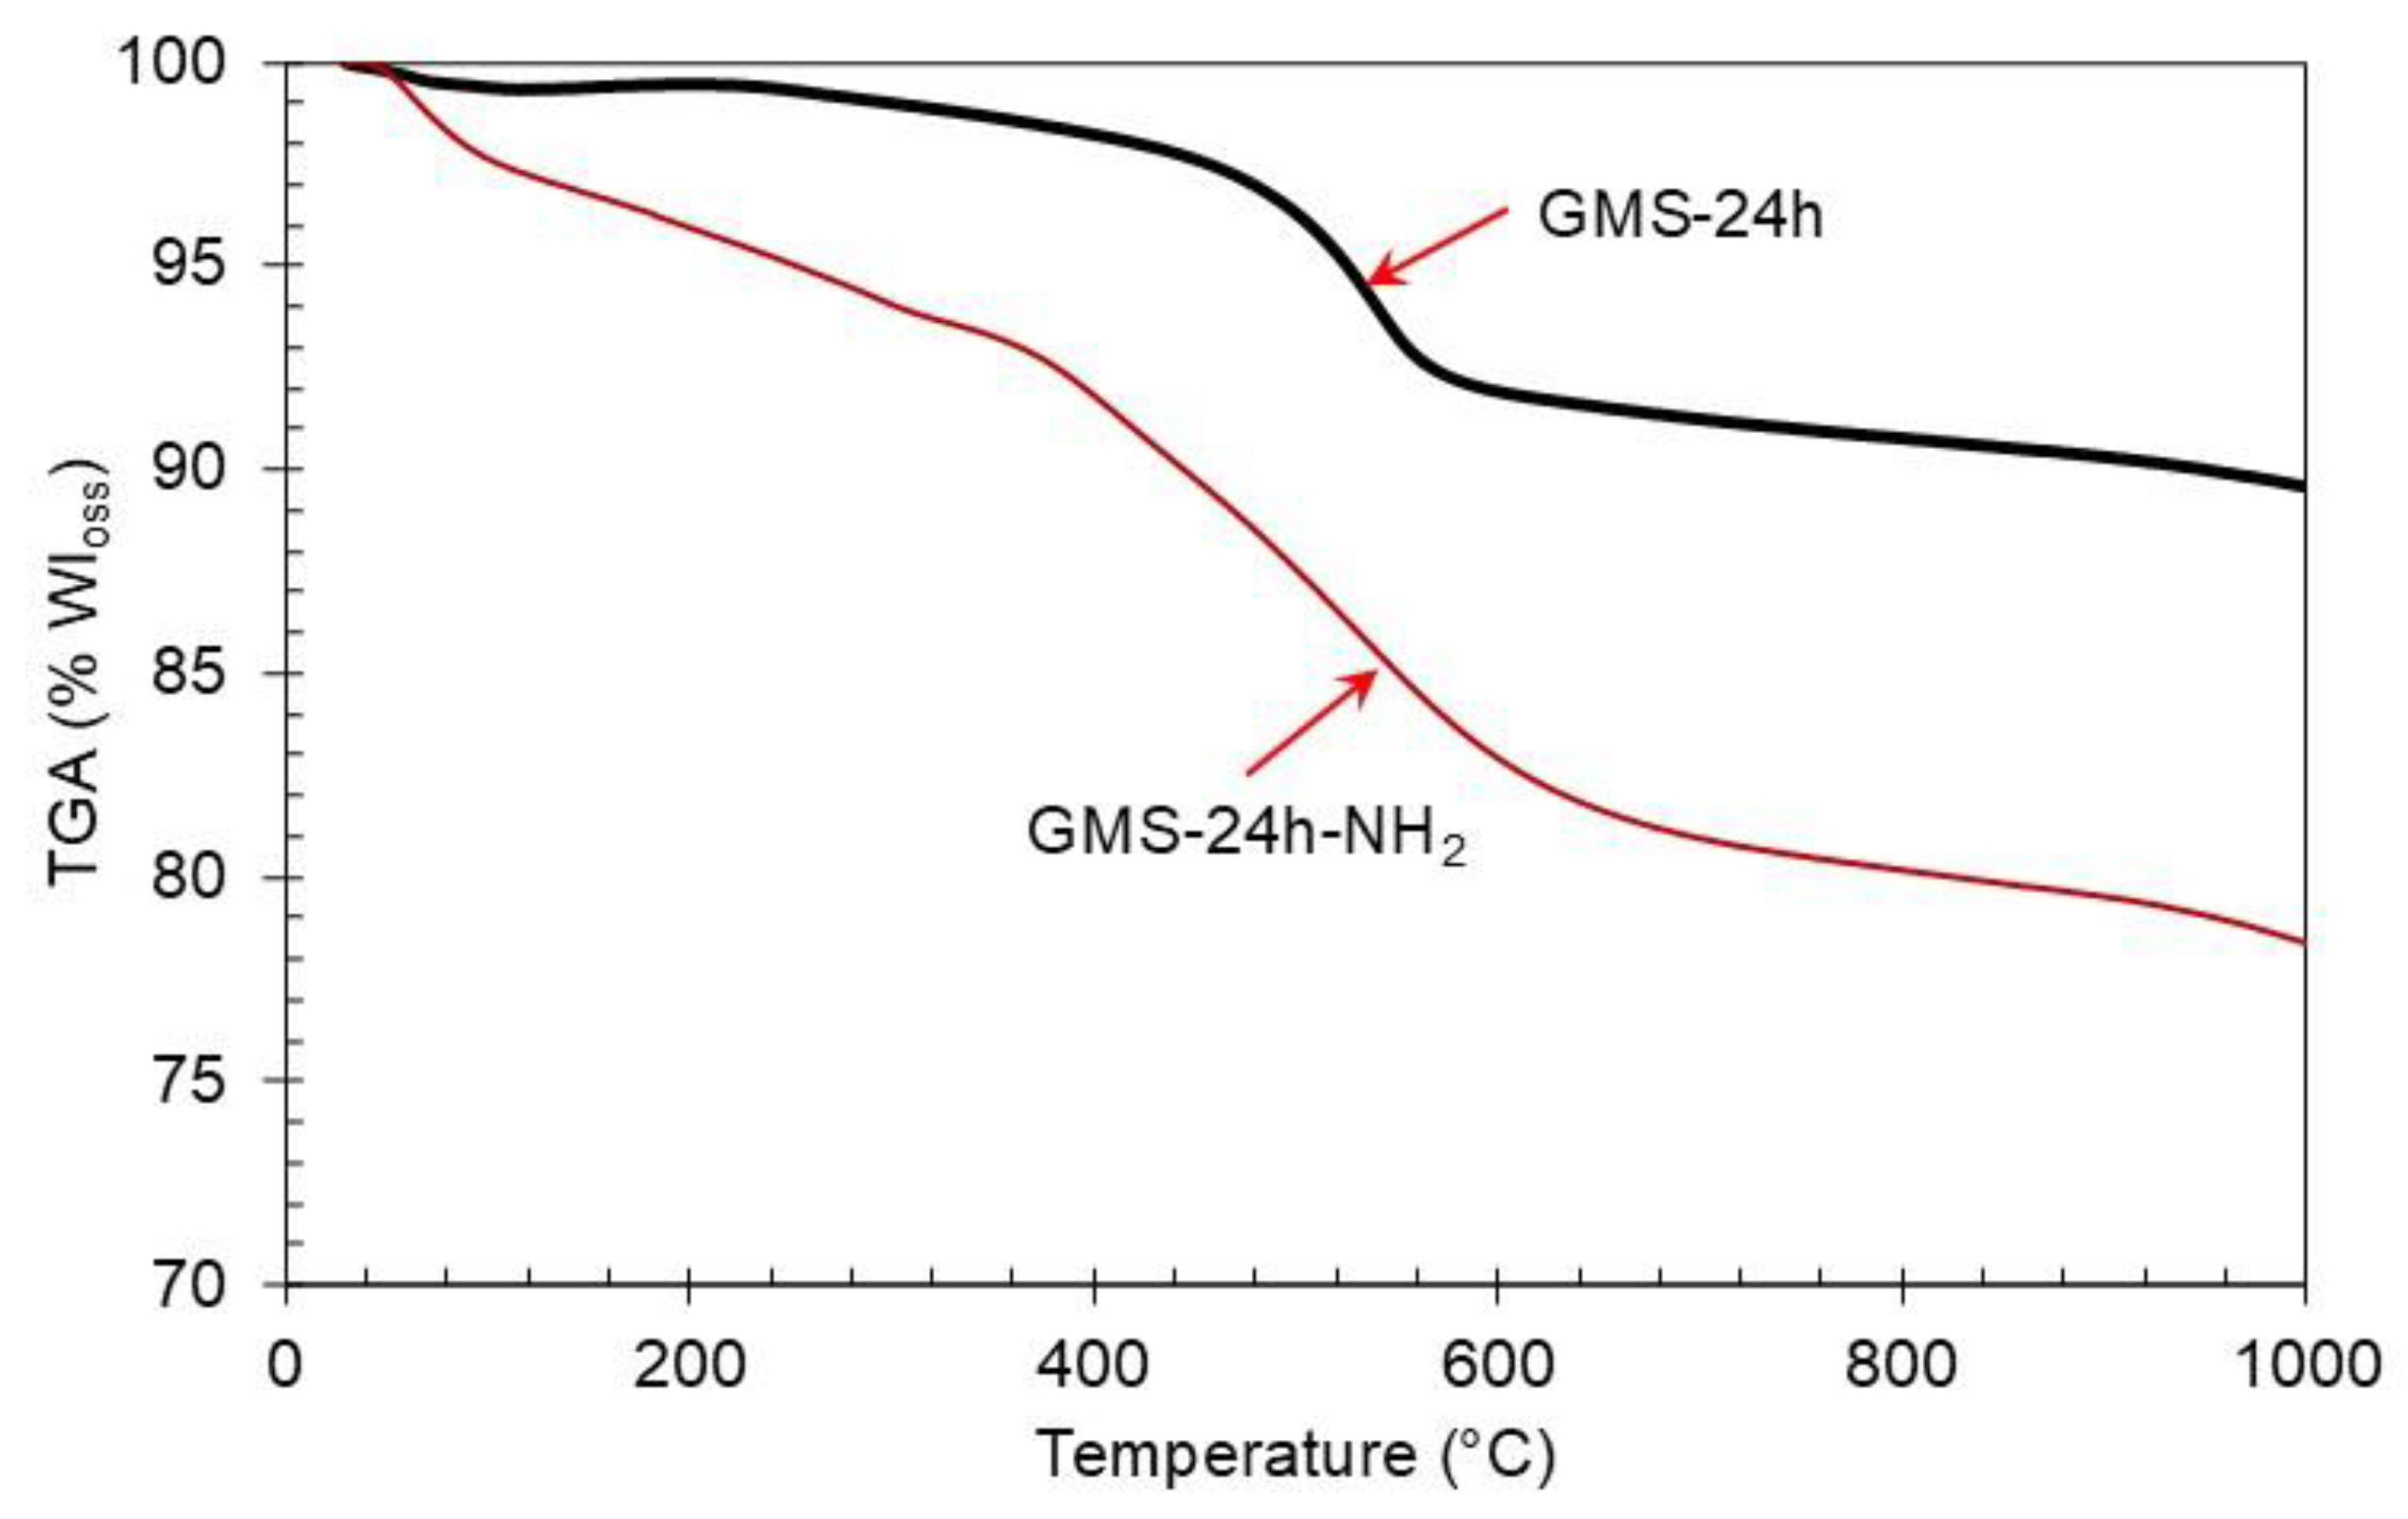
Figure 8.
Zeta potential for MS and MS-modified.
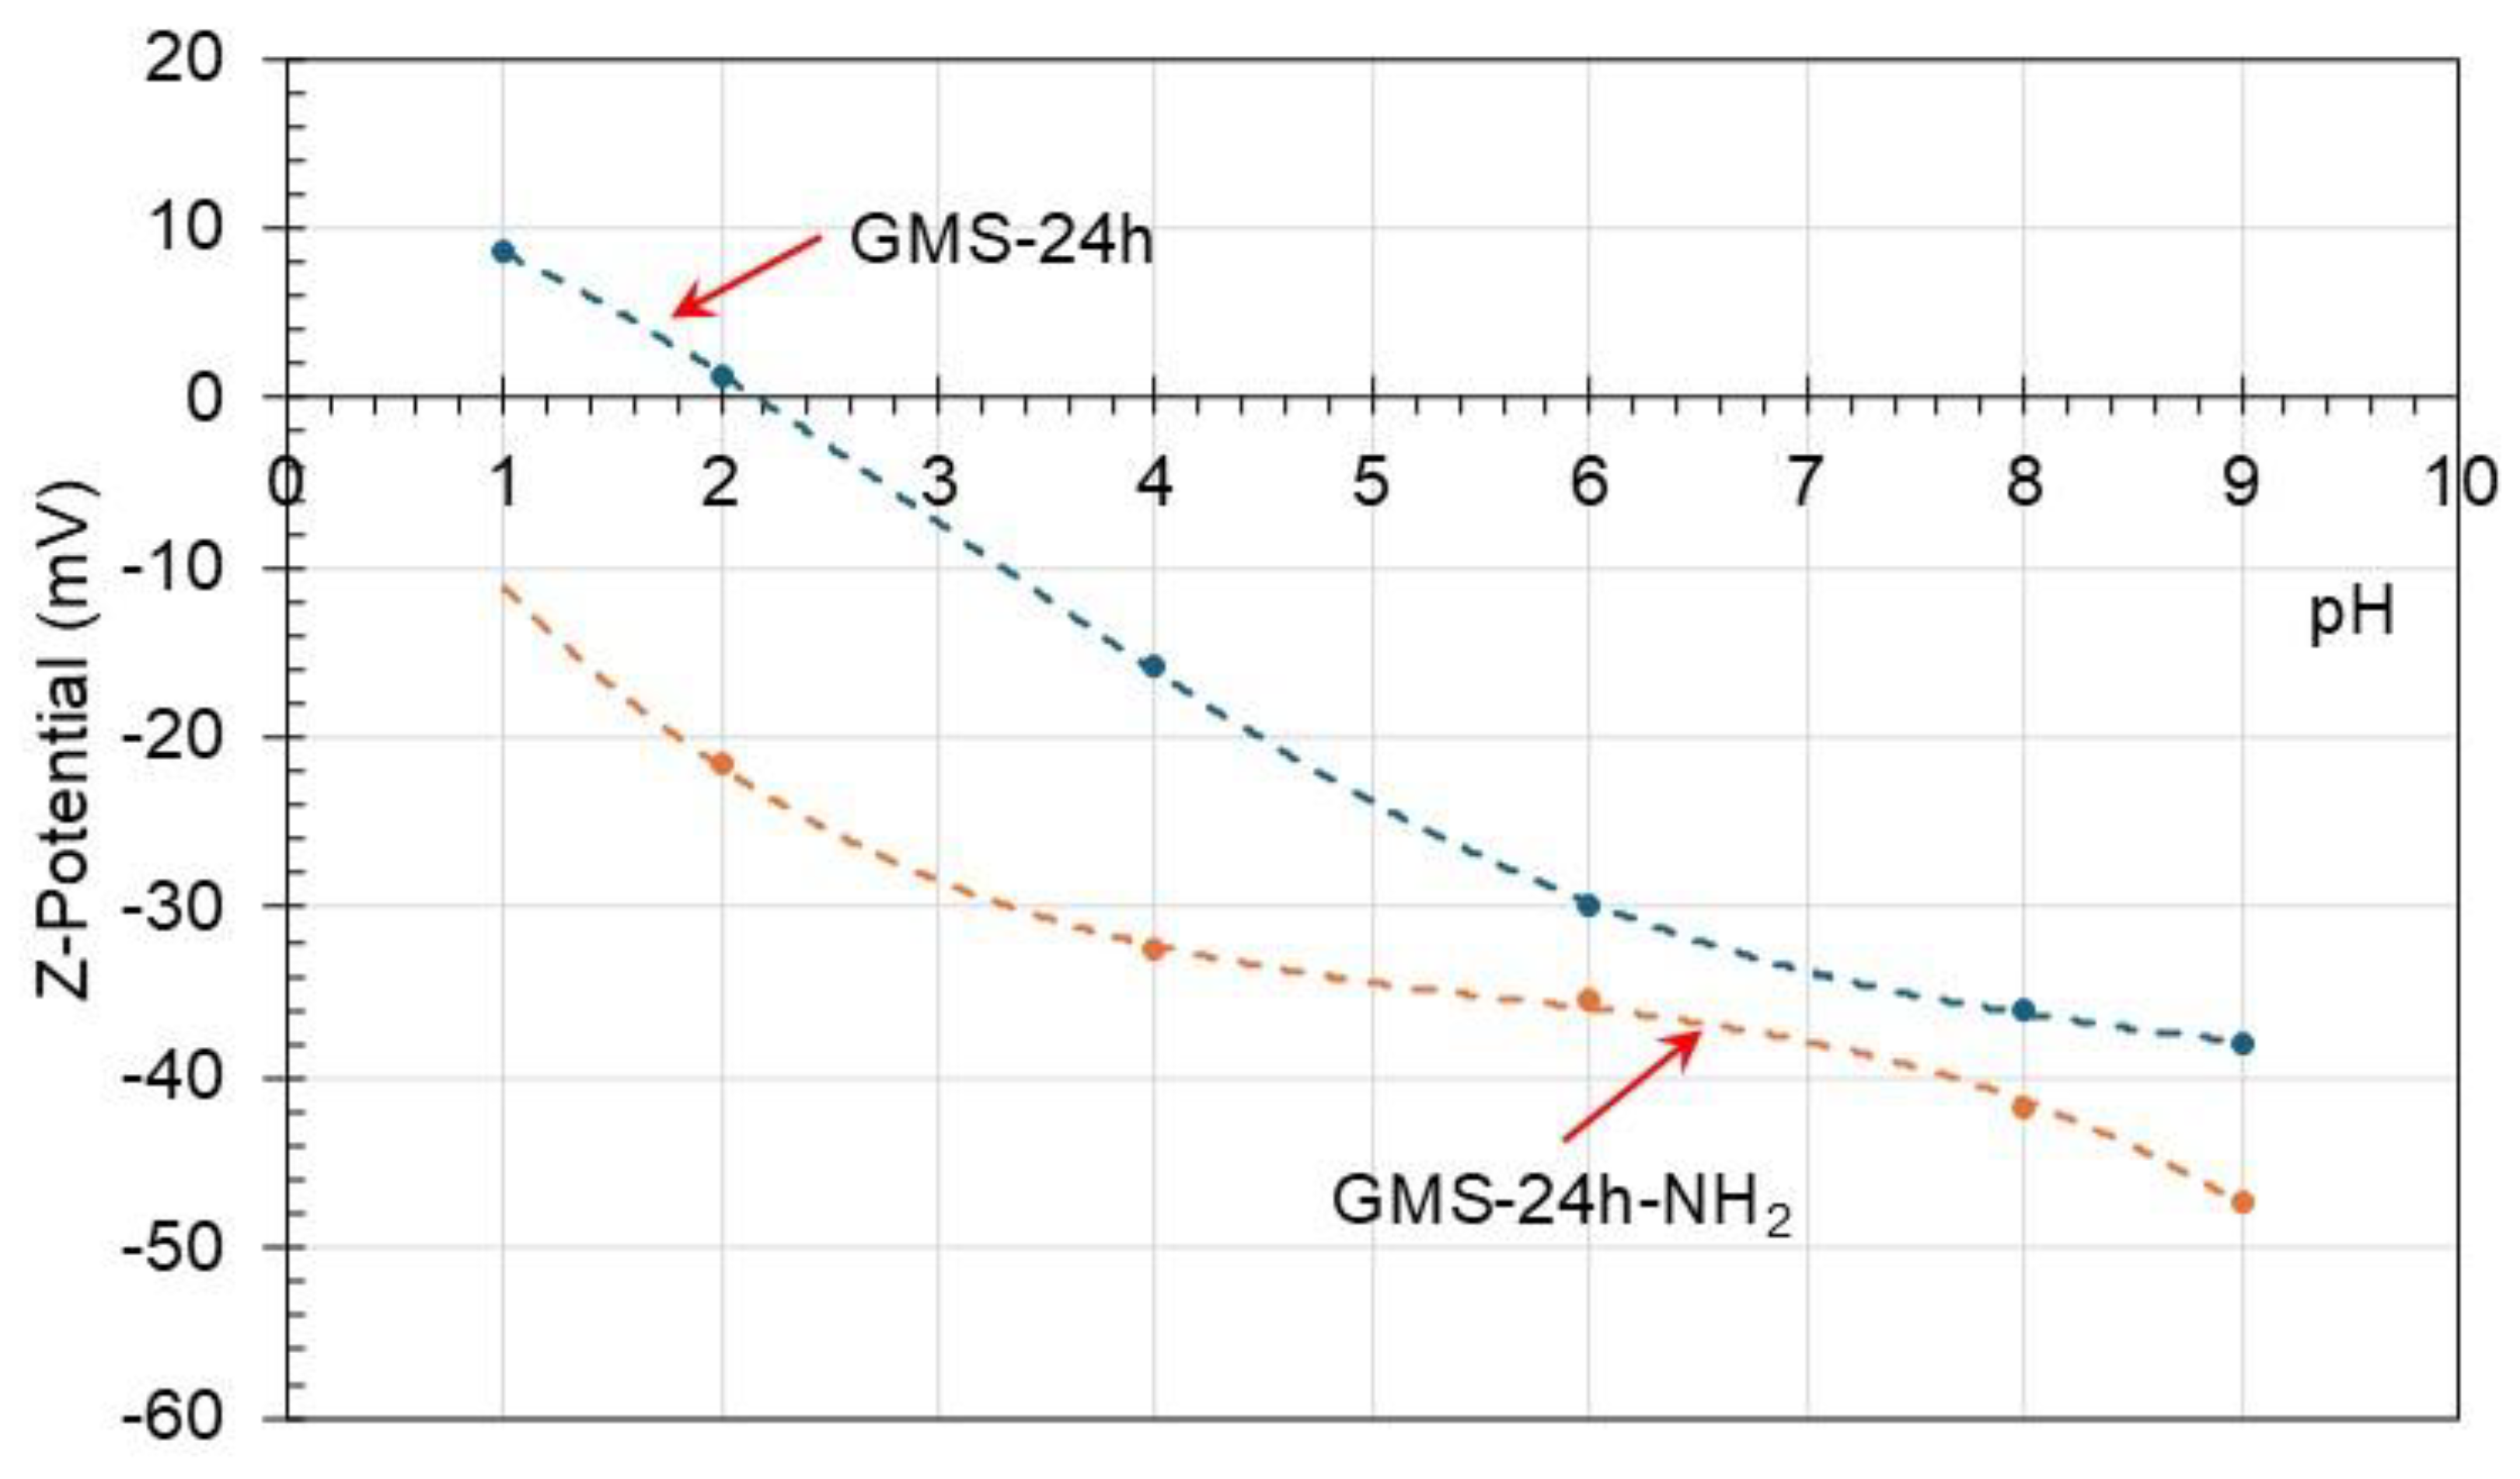
Figure 9.
Effect of the pH on chromium removal capacity (a) GMS-24h (b) GMS-24h-NH2.
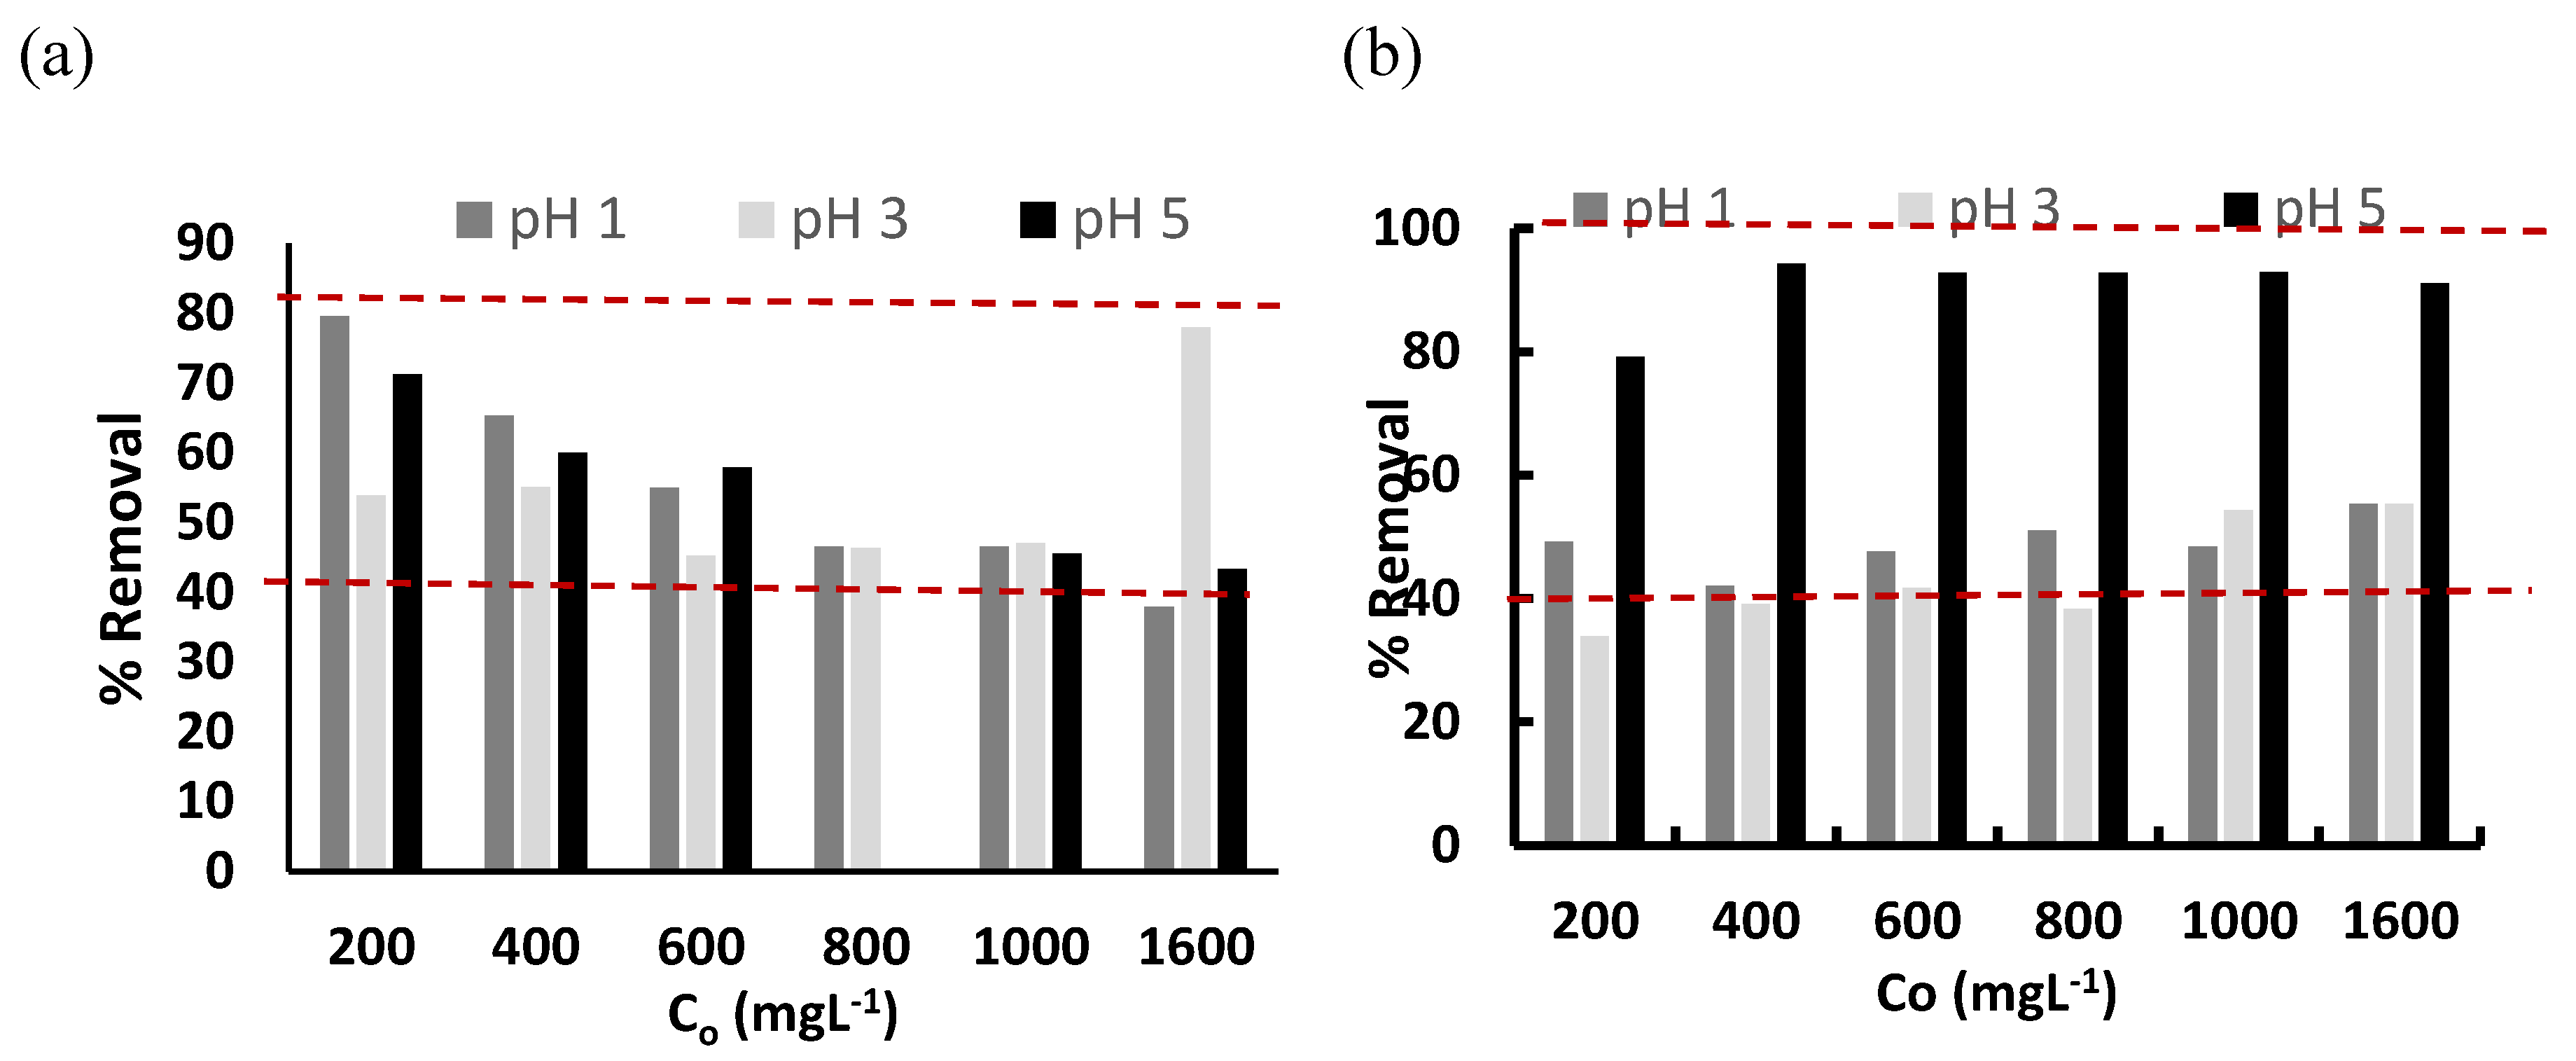
Figure 10.
Interaction between Cr3+ and Silica Surface (GMS-24h, GMS-24h-NH2) during Adsorption Process (a) Chromium Species Distribution (b) Silica Structure According to pH (c) Chromium-GMS-24h Interaction (d) Chromium/GMS-24h-NH2 Interactions.
Figure 10.
Interaction between Cr3+ and Silica Surface (GMS-24h, GMS-24h-NH2) during Adsorption Process (a) Chromium Species Distribution (b) Silica Structure According to pH (c) Chromium-GMS-24h Interaction (d) Chromium/GMS-24h-NH2 Interactions.

Figure 11.
Adsorption isotherm model fitting for GMS and GMS-NH2 samples at different pH values.
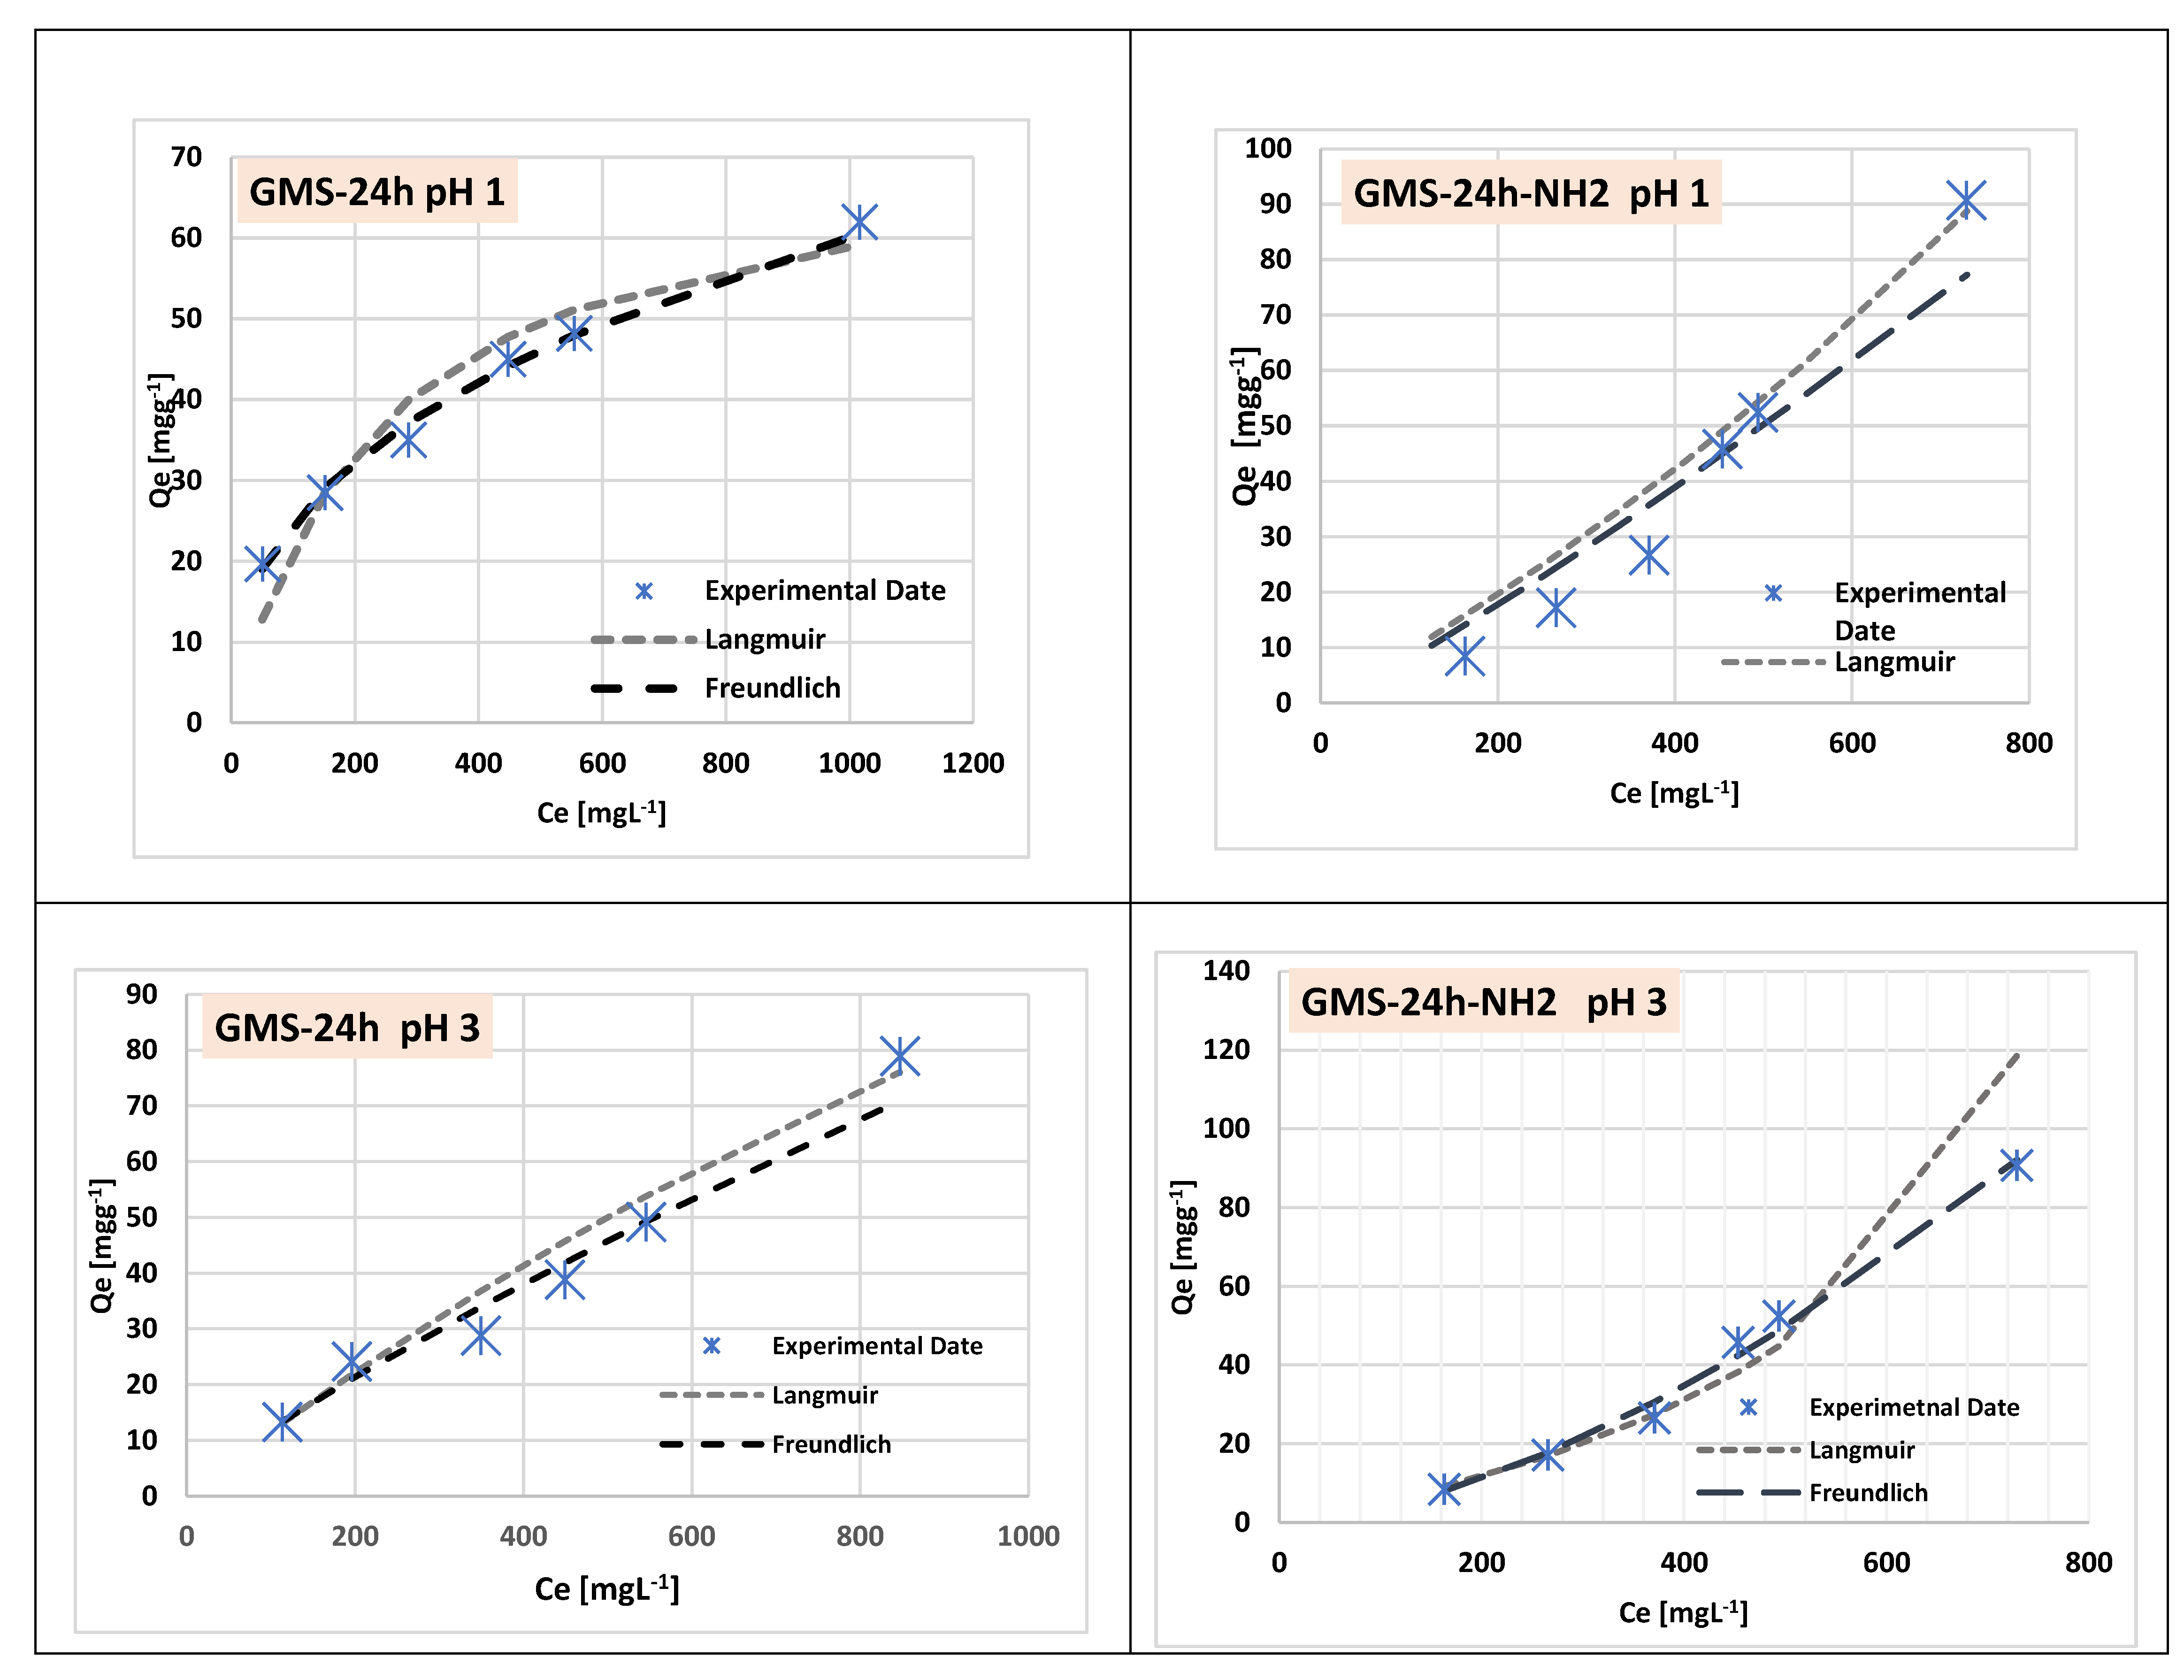
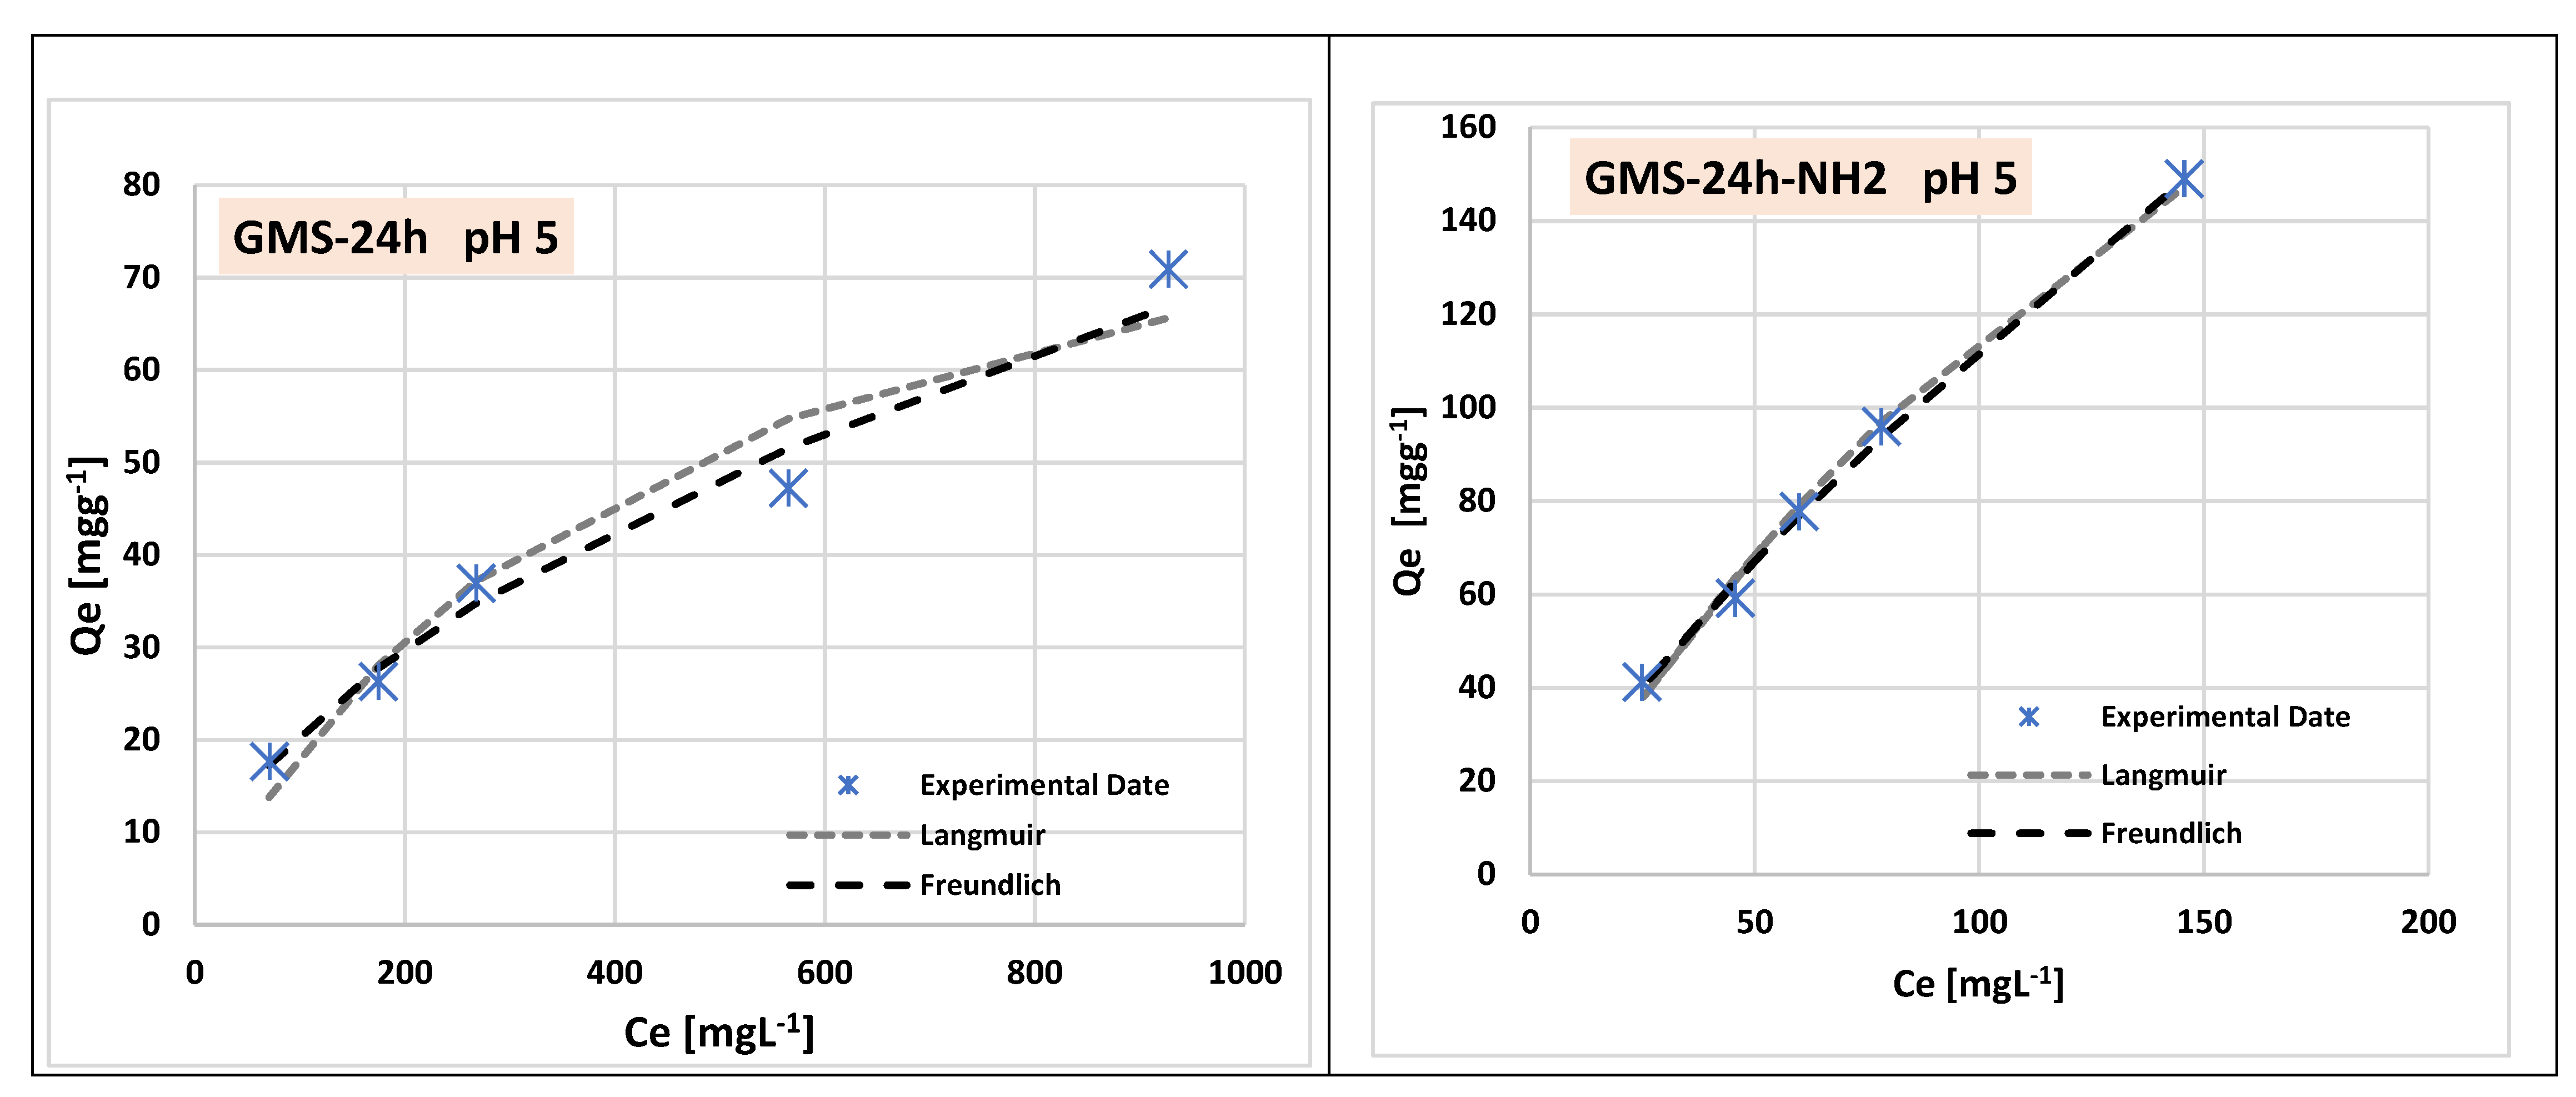
Figure 12.
Separation Factors (RL) for Cr3+ adsorption on GMS-24h and GMS-24h–NH2.
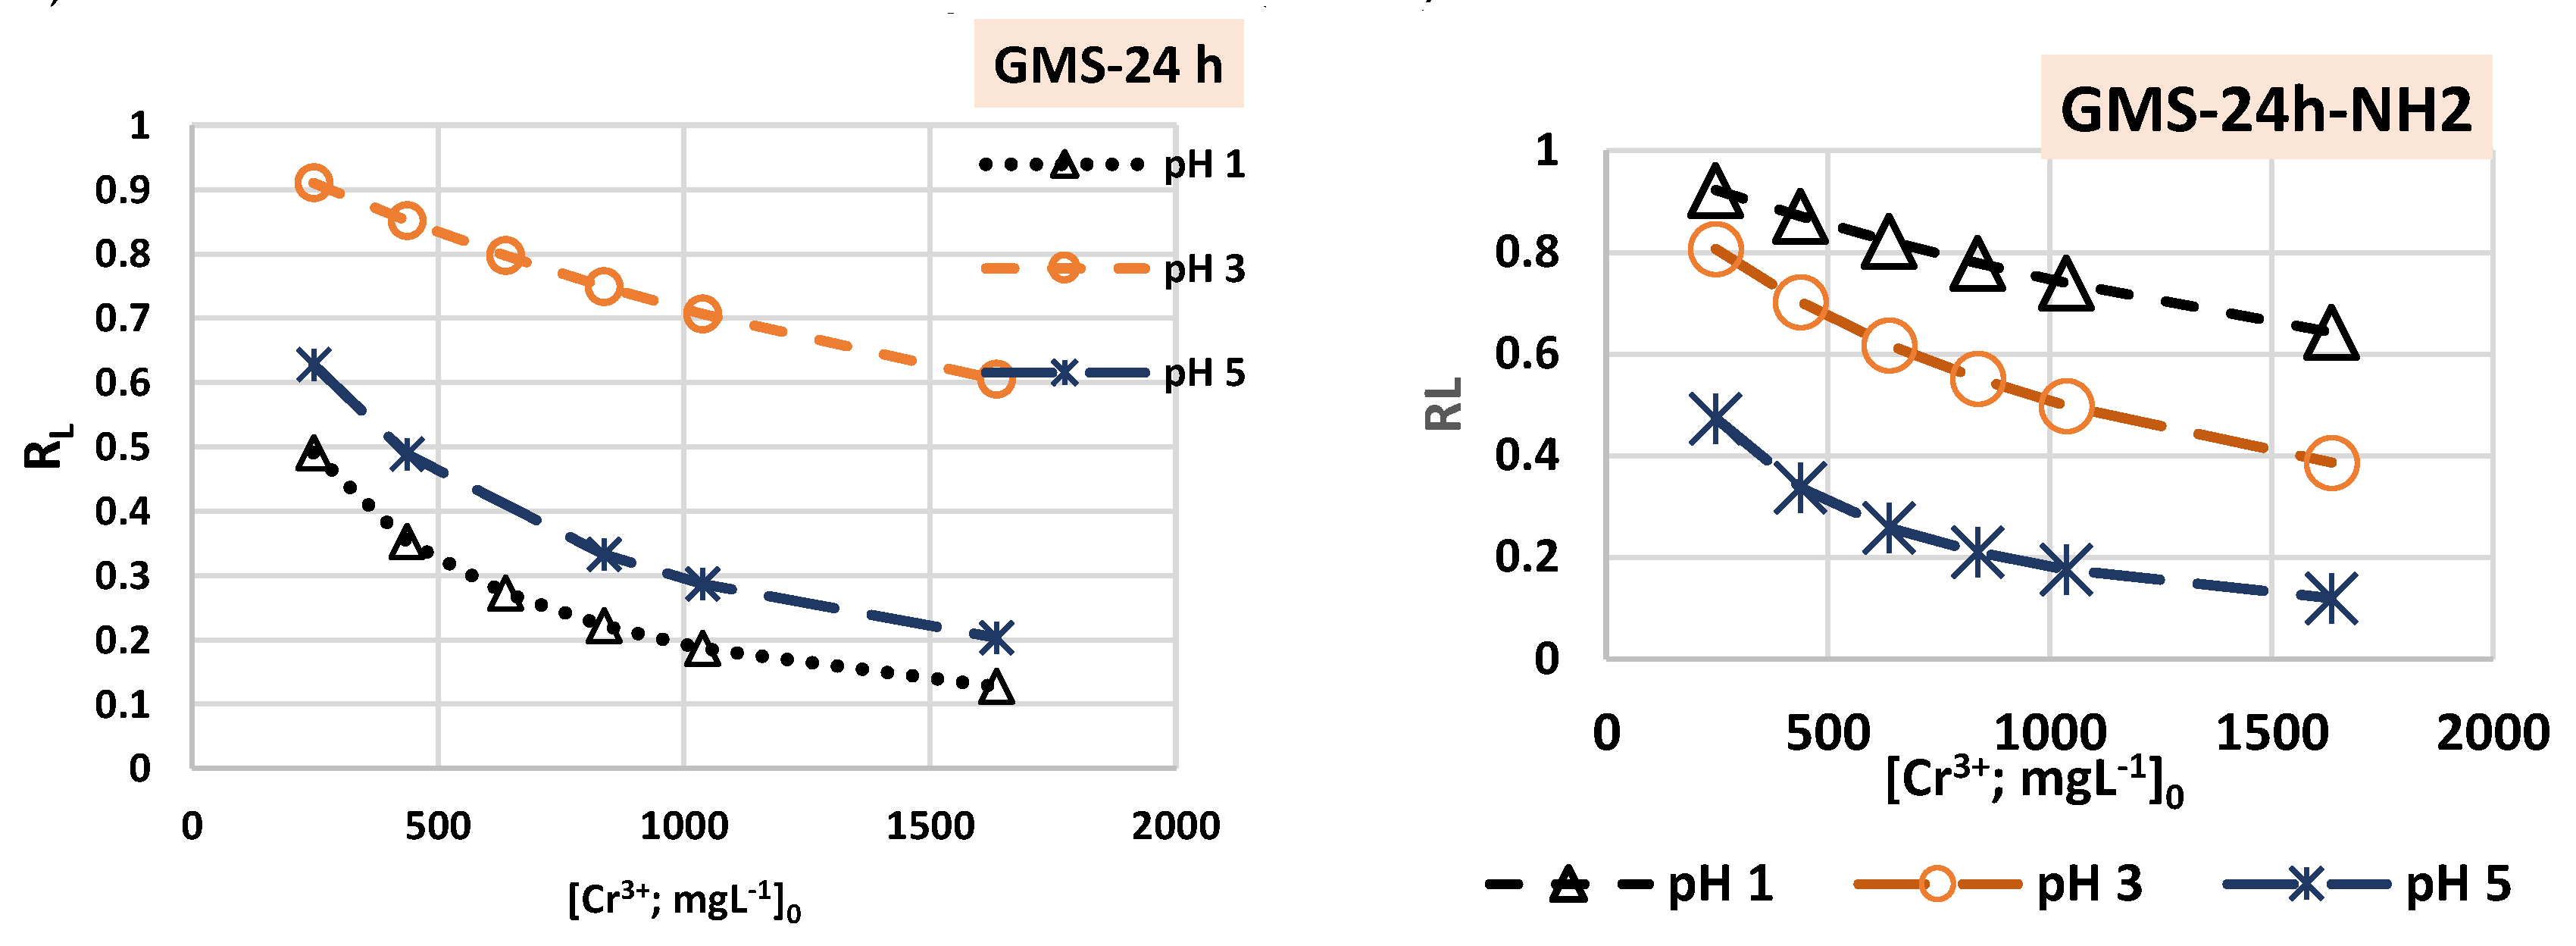
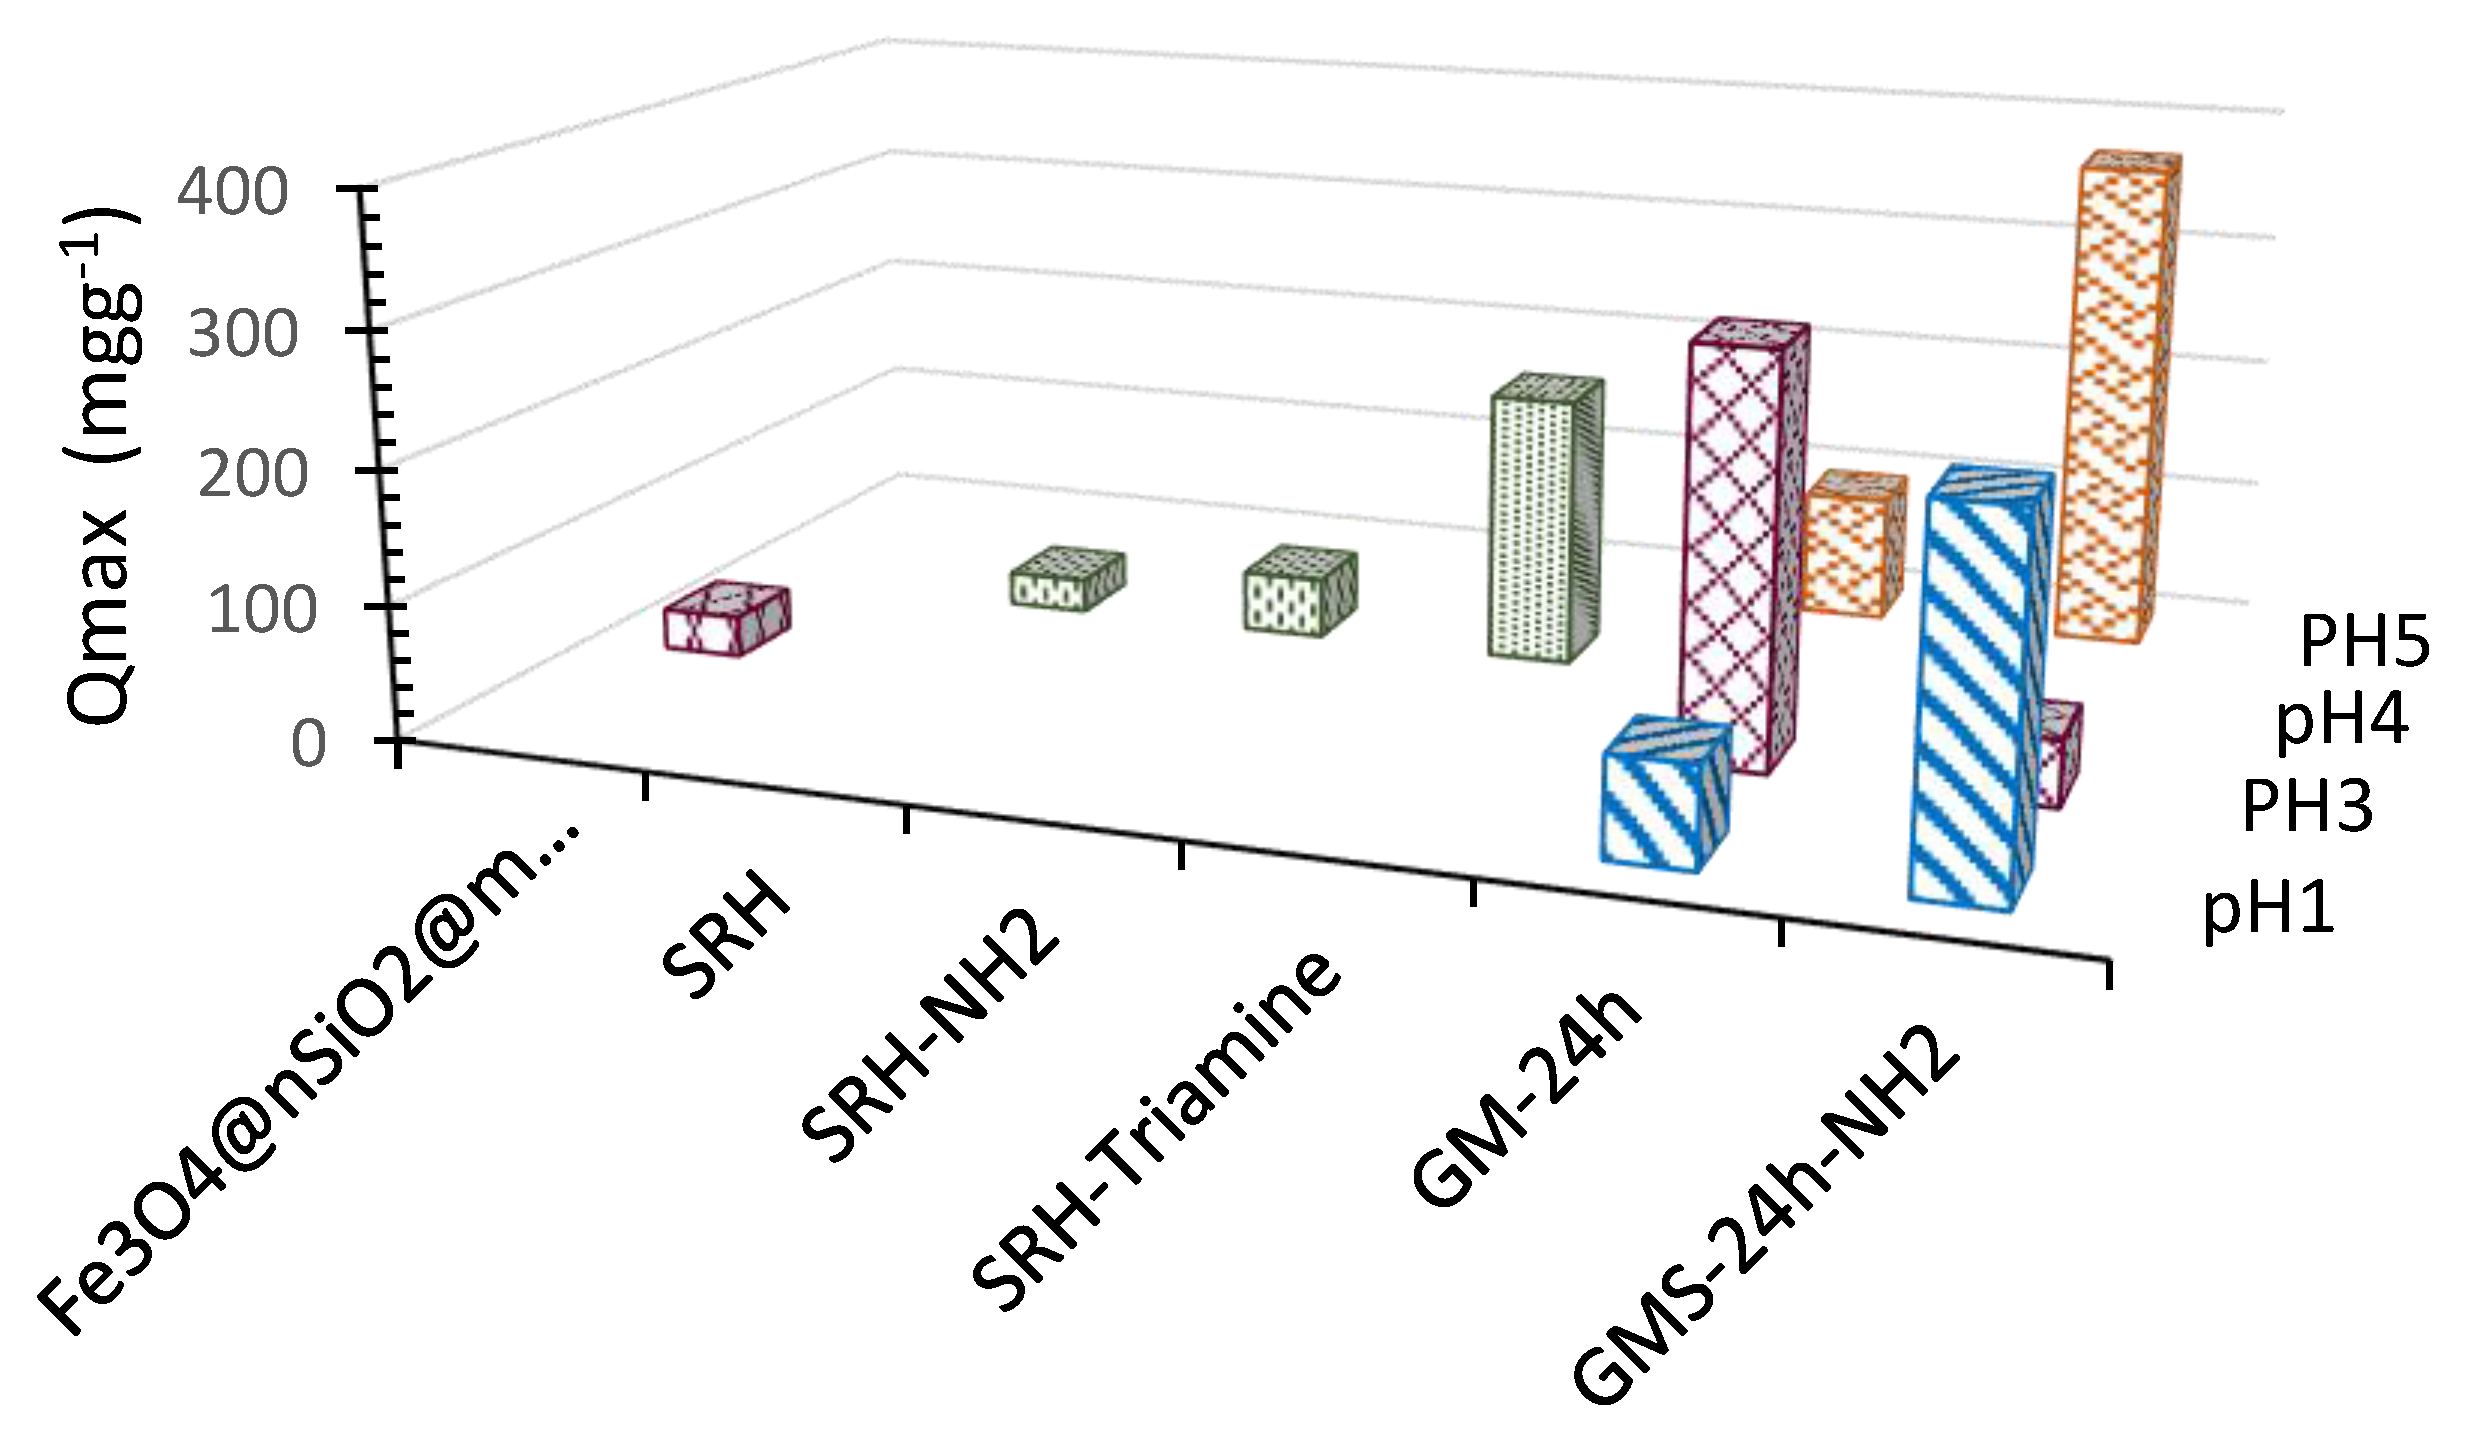
Figure 14.
Equilibrium study according to PSO from GMS-24h and GMS-24h-NH2.
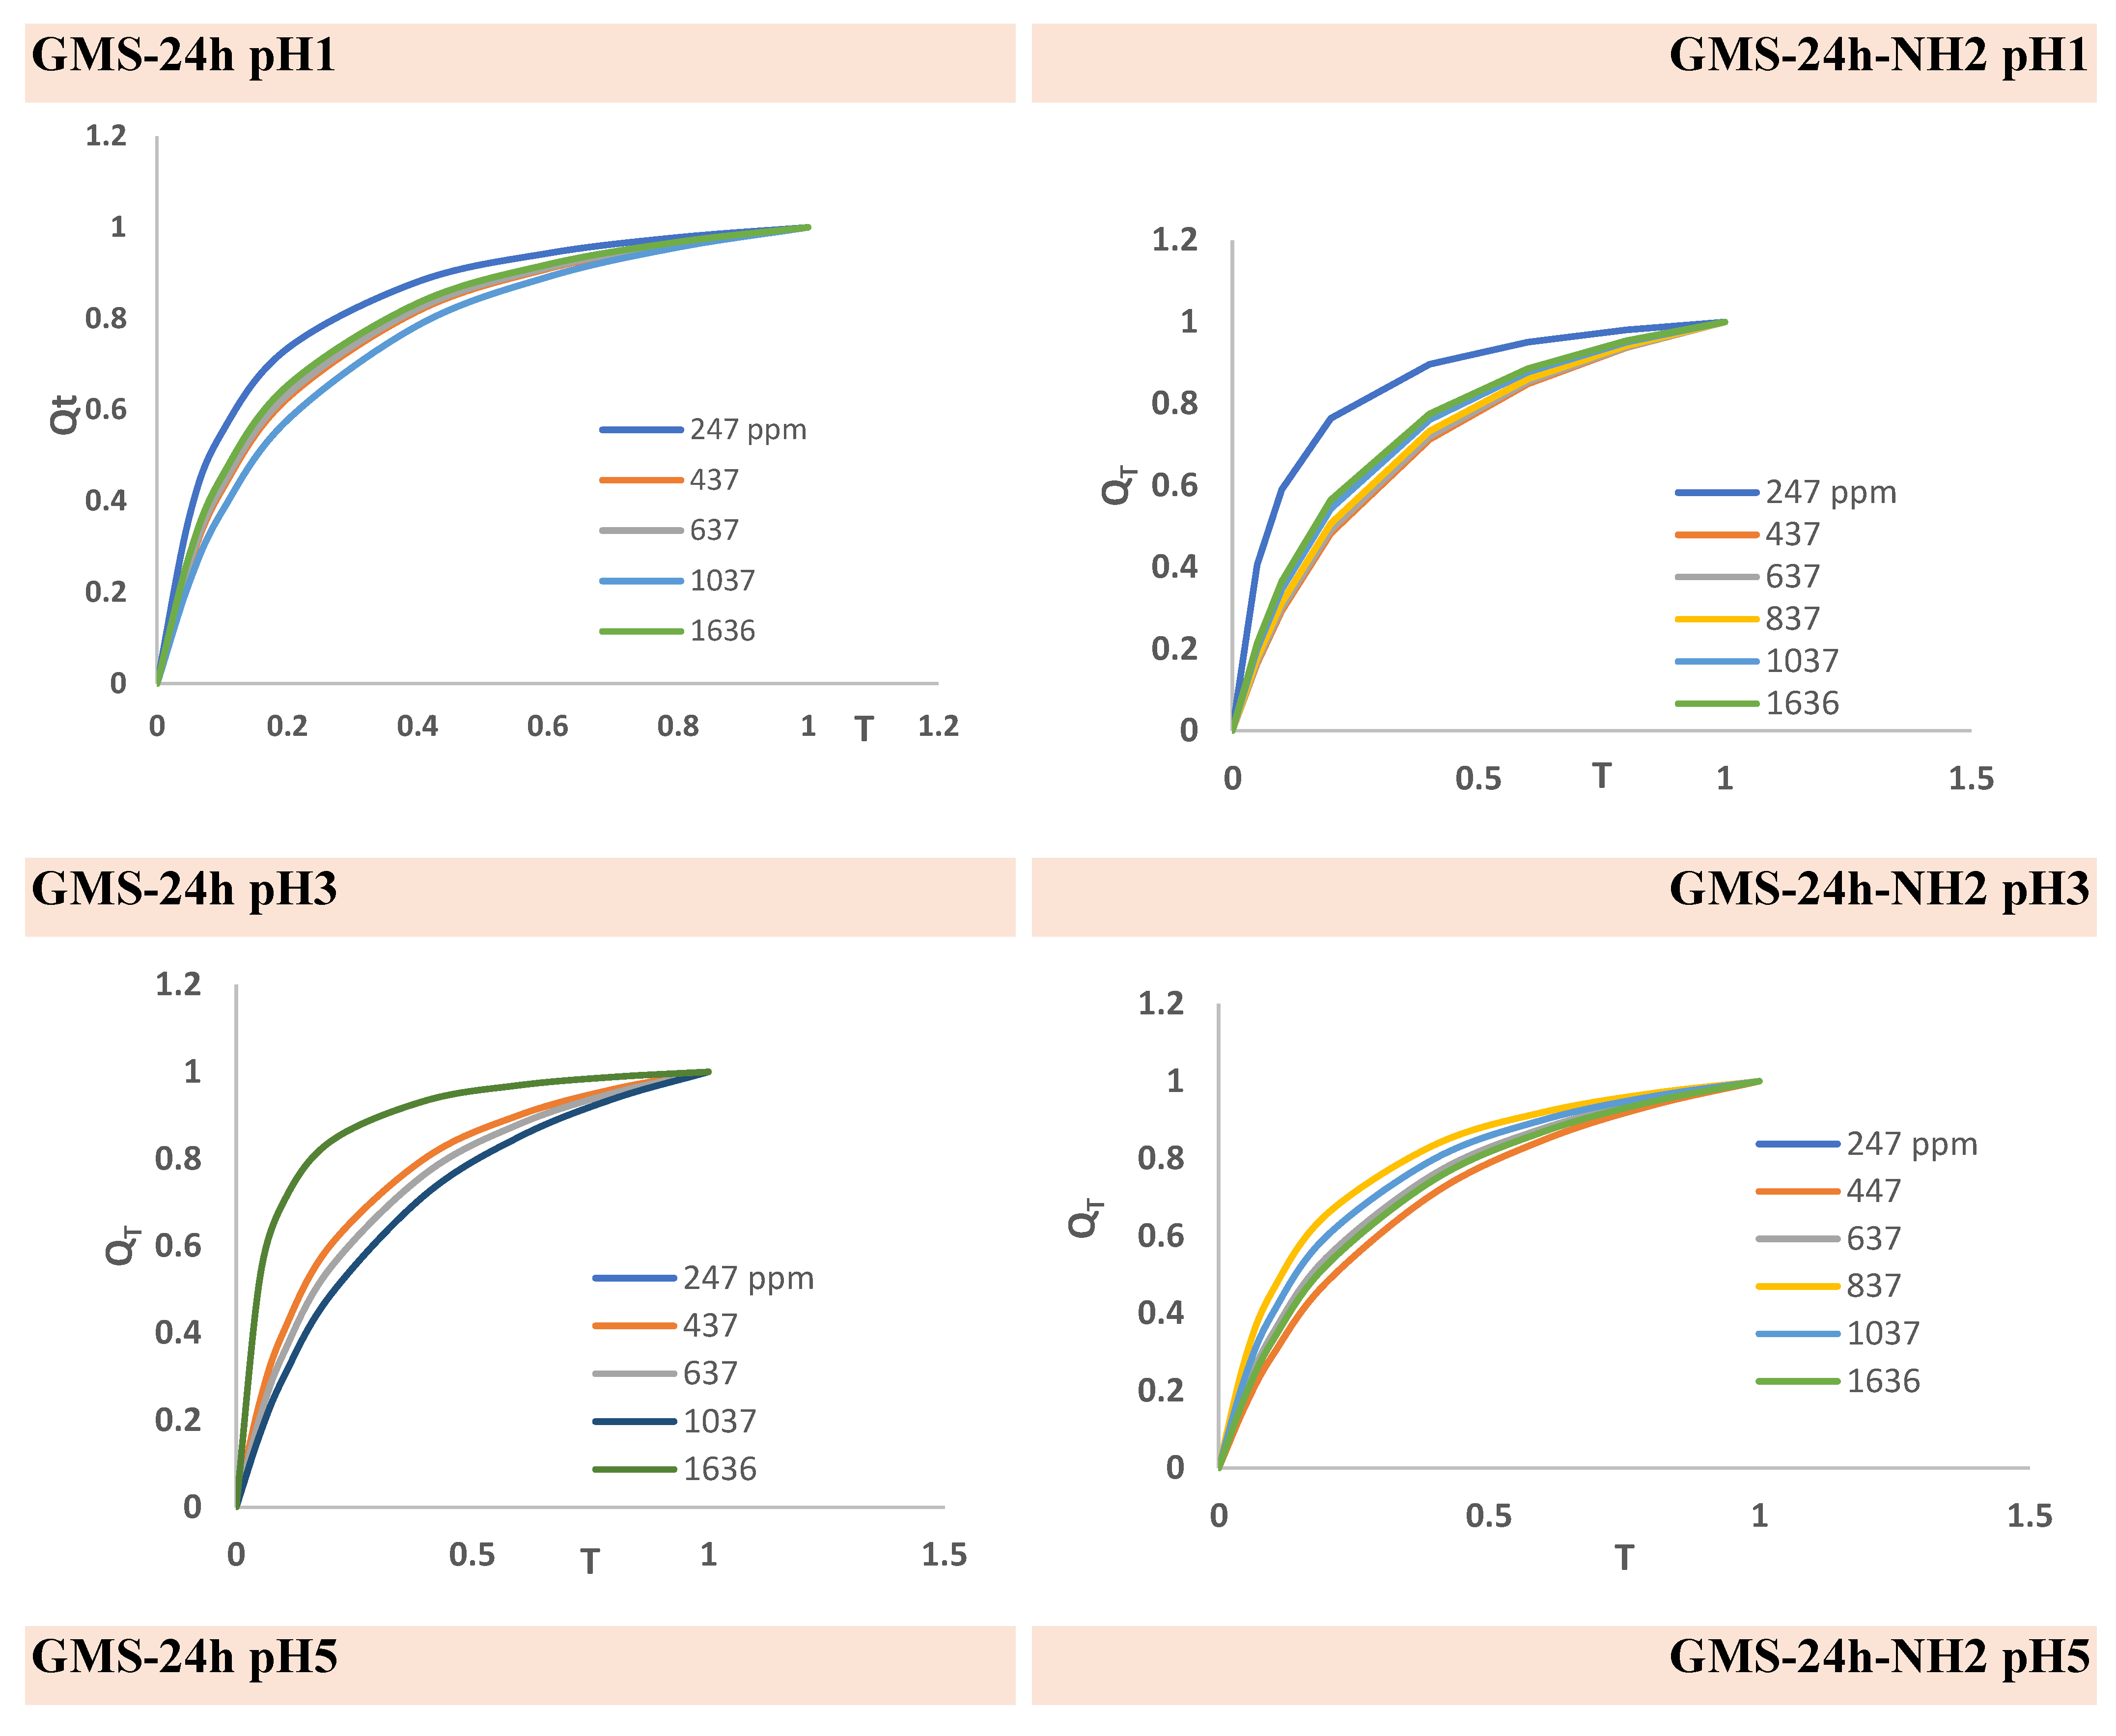
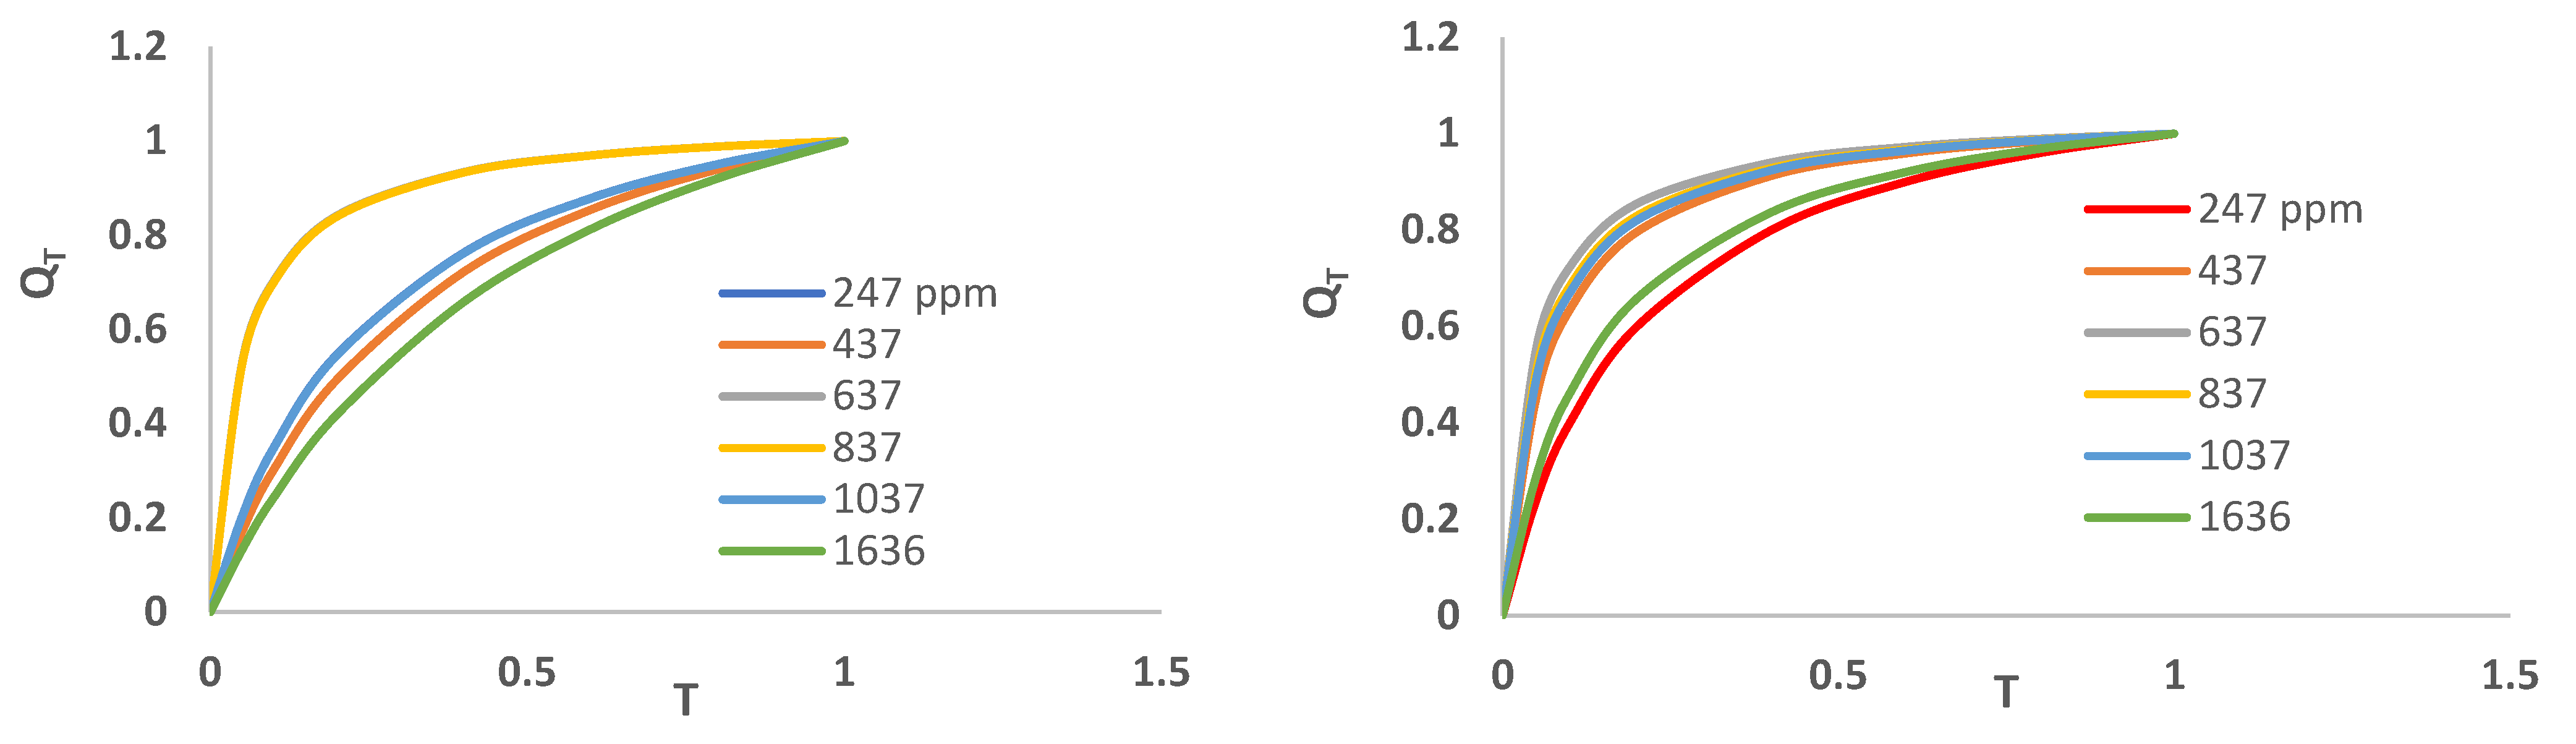
Figure 15.
Intraparticle Diffusion model.
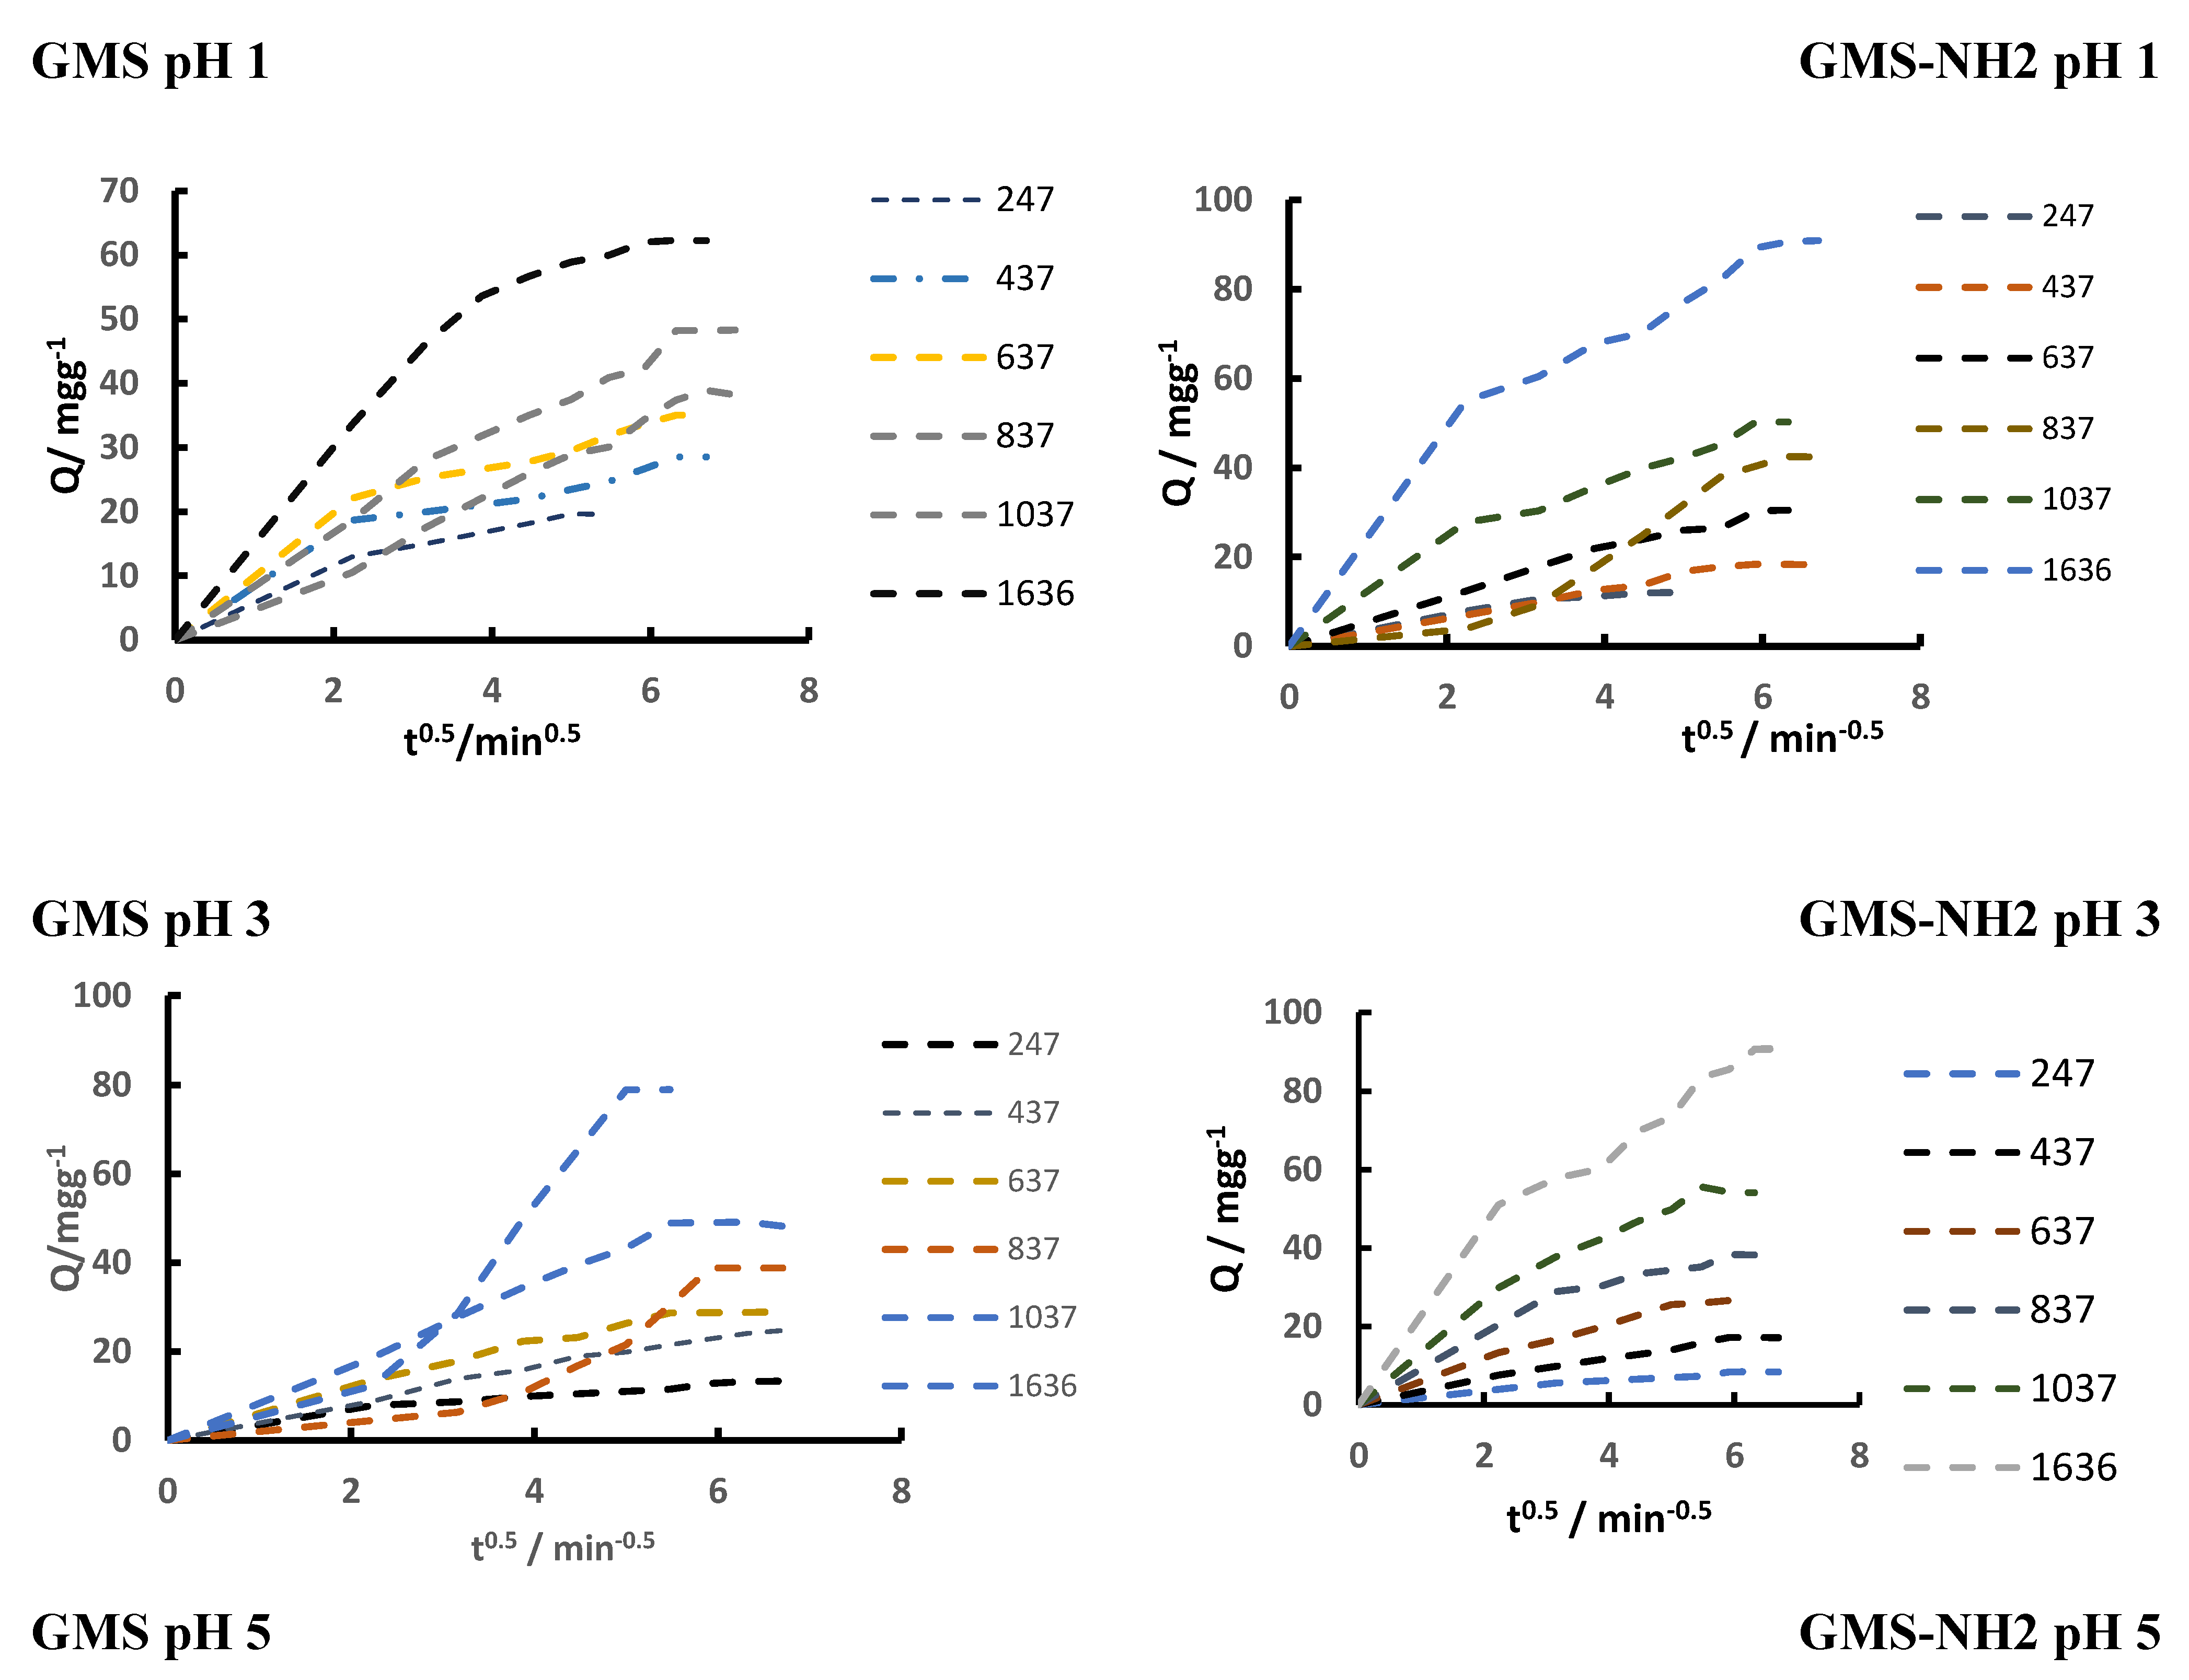
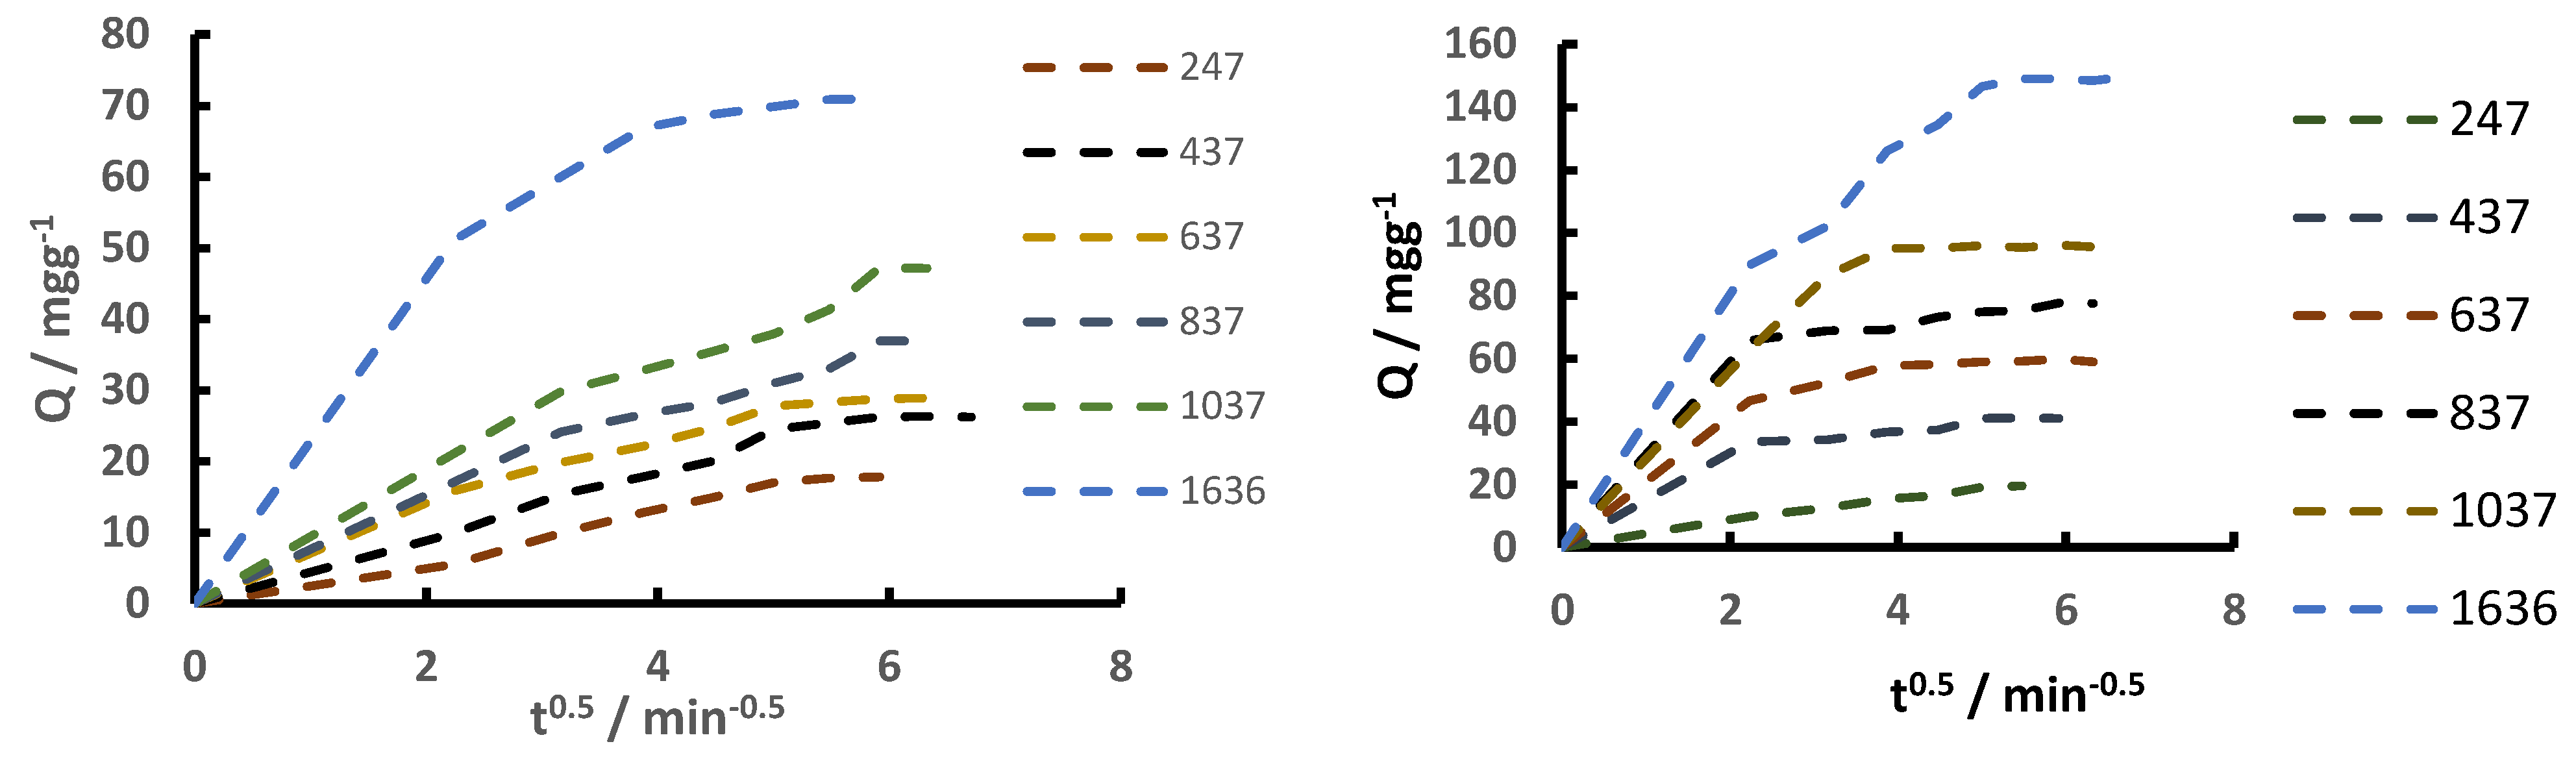
Figure 16.
Mechanism of adsorption according to IDP model.
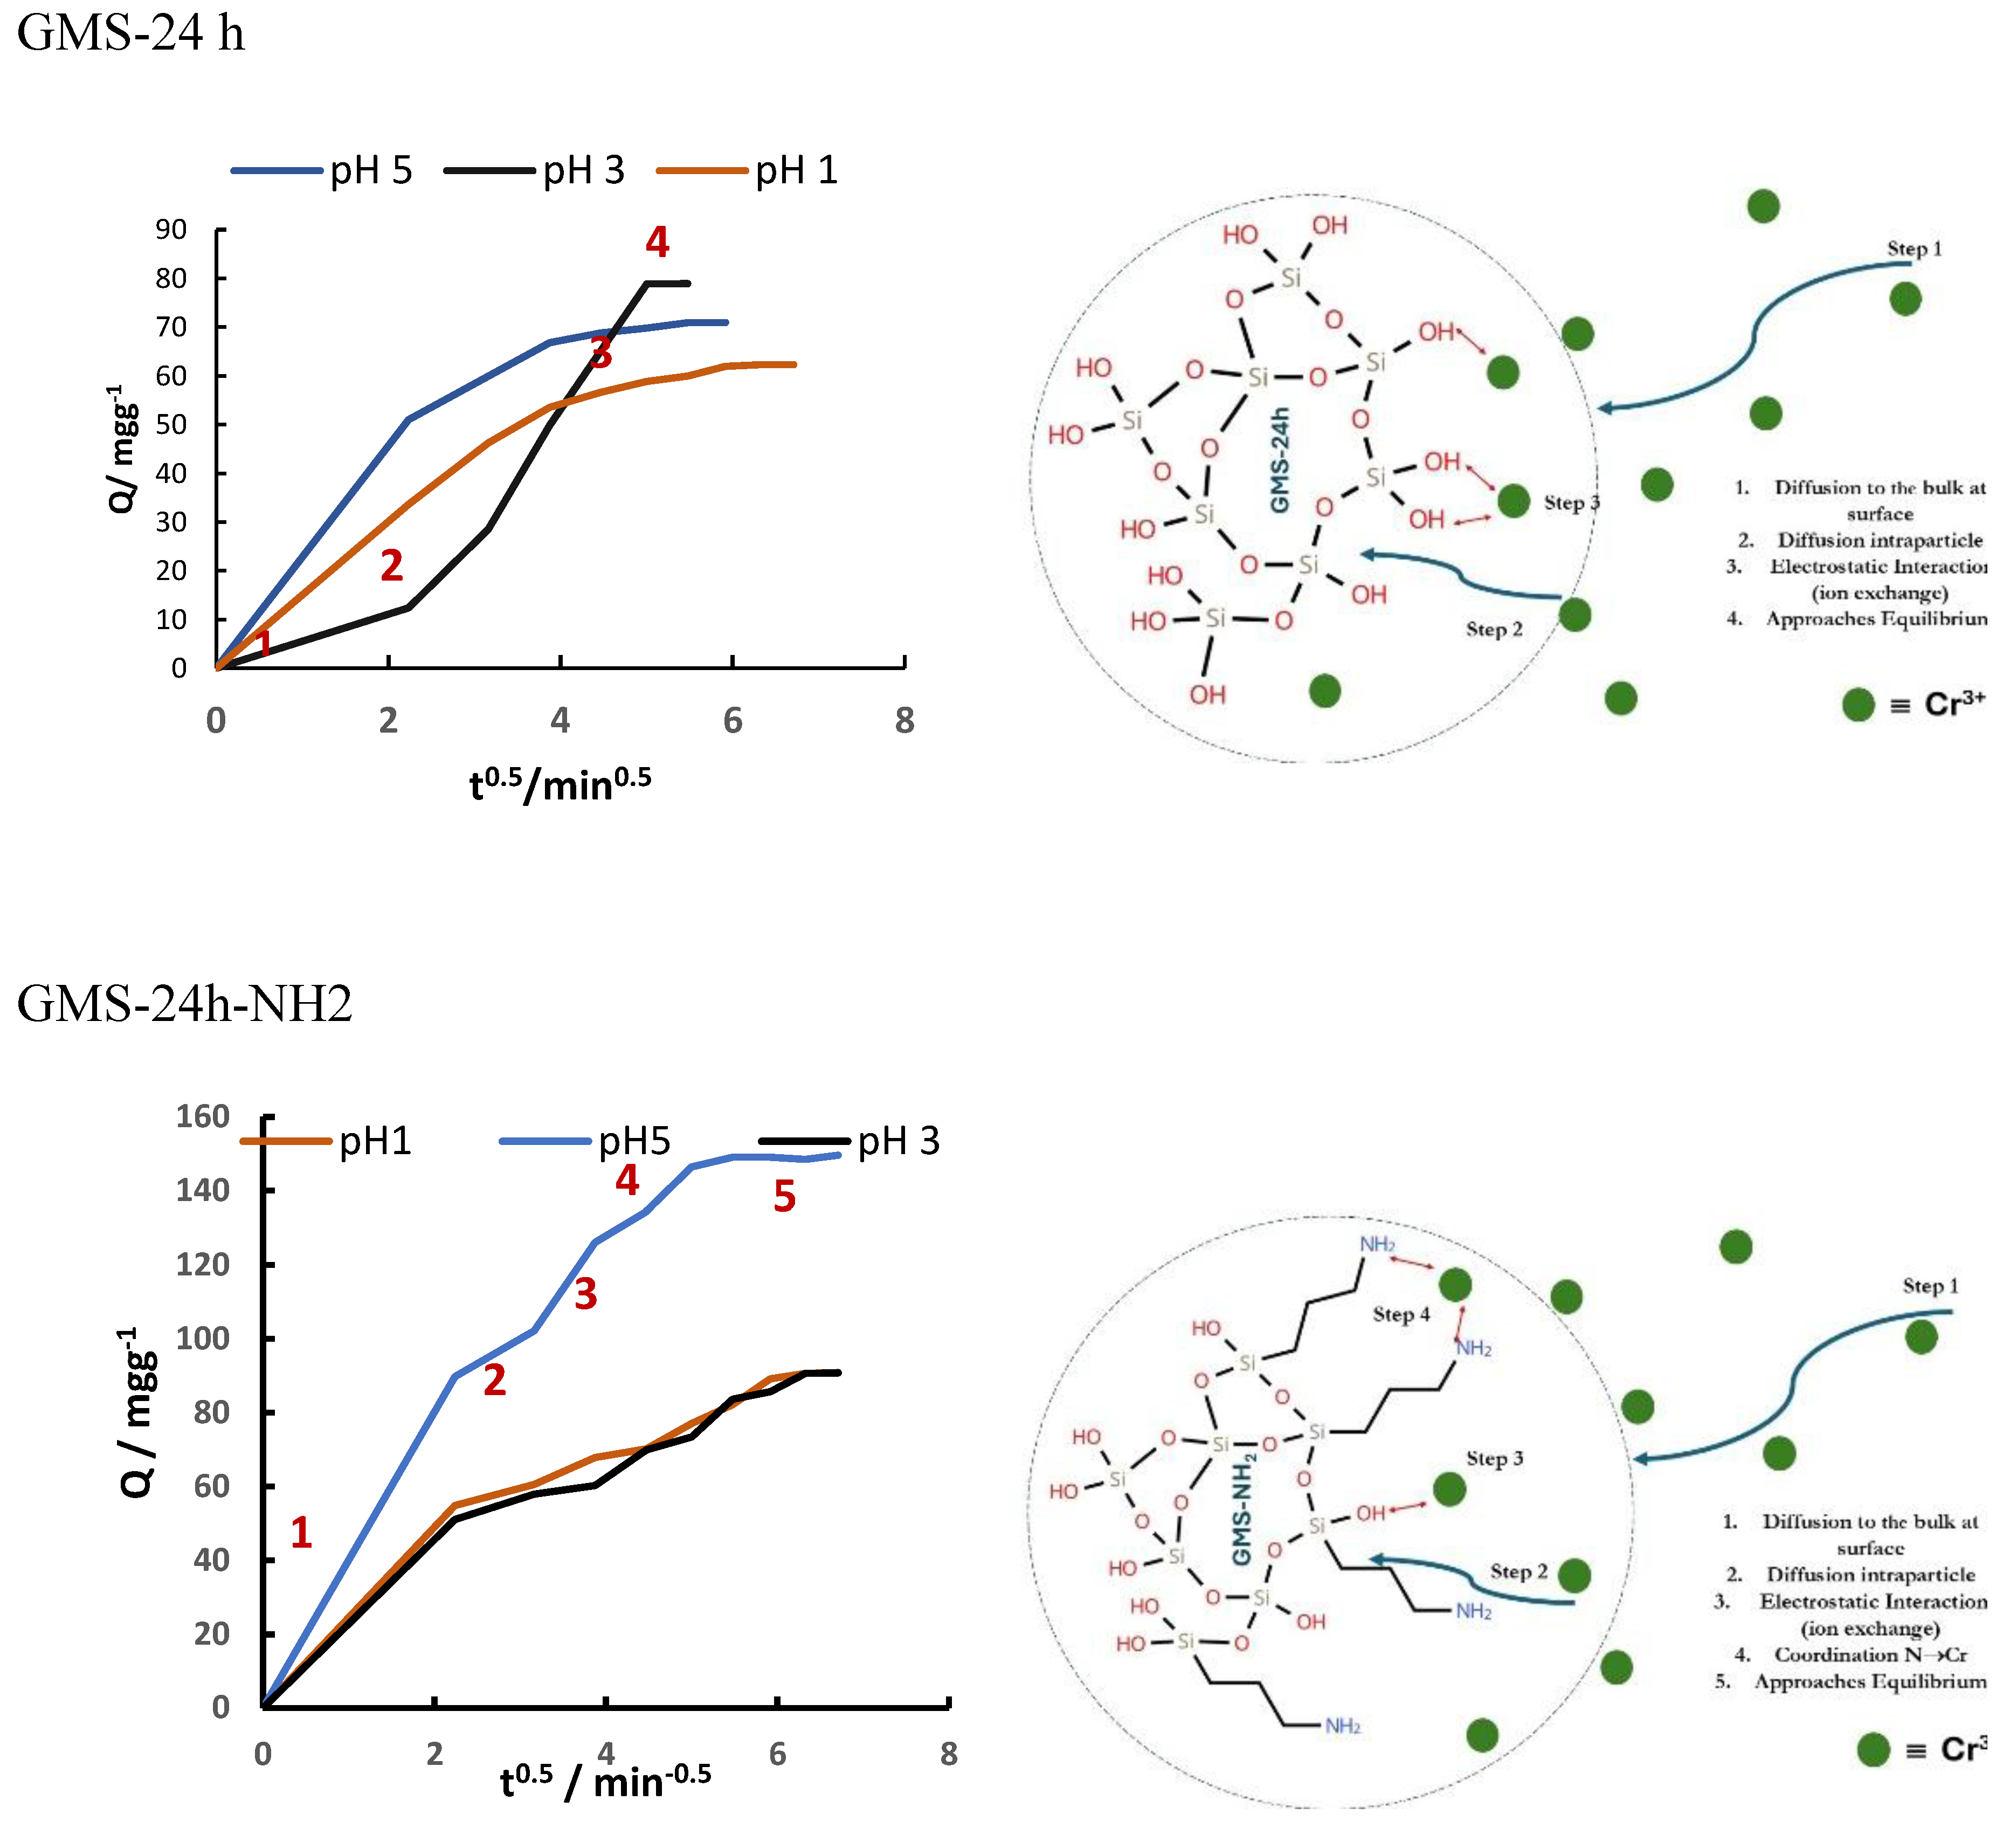

Table 1.
Comparison textural properties for GMS with other mesoporous silicas.
| [Si(OH)4]; (mgL–1) | ABET [m2g–1] | Average Pore Volume [cm3g–1] | Pore Diameter (BJH) [nm] | |
|---|---|---|---|---|
| GMS-0h | 626.1 | 444.5 | 0.341 | 3.9; broad between 5-20 |
| GMS-6h | 265.9 | 491.4 | 0.416 | 3.9 |
| GMS-24h | 97.7 | 496.5 | 0.552 | 3.9 |
| GMS-48 h | 52.9 | 466 | 0.497 | 3.9 and 7.8 |
| SiO2-HCl* | – | 13.27 | 0.052 | – |
| MS-TEOS [39] | – | 543-908 | 0.63-0.67 | 6-7 |
*non-porous structure.
Table 2.
Textural properties for GMS-modified*.
| ABET [m2g–1] | Average Pore Volume [cm3g–1] | Pore Diameter (BJH) [nm] | |
|---|---|---|---|
| GMS-24 h | 496.5 | 0.552 | 3.9 |
| GMS-24h-NH2 | 171.1(-65.5%) | 0.368 (-33.3%) | 3.2 (-17.9%) |
*In parenthesis percentage o modification; (-) reduction (+) increased.
Table 3.
Cr3+ Adsorption Parameters for GMS-24h and Amine-Modified GMS-24h–NH2.
| Parameters | pH 1 | pH 3 | pH 5 | ||||
|---|---|---|---|---|---|---|---|
| GMS-24h | GMS-24h-NH2 | GMS-24h | GMS-24h-NH2 | GMS-24h | GMS-24h-NH2 | ||
| Langmuir | Q0 [mgg–1] | 72.99 | 263.16 | 303.03 | 48.31 | 95.24 | 370.37 |
| KL [L mg–1] | 0.0042 | 0.00034 | 0.00039 | 0.00097 | 0.0024 | 0.0045 | |
| R2 | 0.9632 | 0.9568 | 0.8783 | 0.8675 | 0.9099 | 0.9052 | |
| Δq(%) | 0.1389 | 0.1832 | 0.313 | 0.1967 | 0.00012 | 0.09134 | |
| G [KJmol–1] | 3.59 | 9.79 | 9.46 | 7.23 | 5.04 | 3.42 | |
| Freundlich | KF [(mg/g)/(mg/L)]1/n | 4.21 | 0.042 | 3.843 | 0.00197 | 1.823 | 3.653 |
| 1/n | 0.385 | 1.14 | 0.832 | 1.63 | 0.527 | 0.744 | |
| R2 | 0.9929 | 0.956 | 0.9666 | 0.9907 | 0.9842 | 0.9945 | |
| Δq(%) | 0.0718 | 0.3552 | 0.2199 | 0.1068 | 0.1269 | 0.0561 | |
Table 4.
Data fits for the PFO kinetic model form GMS-24h and GMS-24h-NH2.
| GMS-24h | GMS-24hNH2 | ||||||||||||
|---|---|---|---|---|---|---|---|---|---|---|---|---|---|
| pH | [Ag(I)]0 mgL-1 |
247 | 437 | 637 | 837 | 1037 | 1636 | 247 | 437 | 637 | 837 | 1037 | 1636 |
| 1 | Qeexp [mgg-1] |
19.66 | 28.5 | 35 | 38.9 | 48.2 | 62 | 12.1 | 28.5 | 30.3 | 42.5 | 50.2 | 90.61 |
| Qecal [mgg-1] |
19.62 | 21.18 | 37.6 | 50.36 | 41.54 | 52.47 | 14.6 | 21.18 | 30.65 | 55.61 | 40.67 | 96.64 | |
| K1 [min-1] |
0.148 | 0.068 | 0.0792 | 0.0817 | 0.0568 | 0.0242 | 0.044 | 0.1124 | 0.0845 | 0.0741 | 0.0691 | 0.1022 | |
| R2 | 0.9128 | 0.9355 | 0.9411 | 0.9599 | 0.9838 | 0.9922 | 0.9575 | 0.9035 | 0.9574 | 0.9057 | 0.9662 | 0.9181 | |
| Δq(%) |
9.5 | 37.98 | 31.81 | 49.87 | 26.78 | 21.29 | 21.66 | 50.38 | 6.4 | 27.07 | 31.27 | 15.35 | |
| 3 | Qeexp [mgg-1] |
13.3 | 24.1 | 28.8 | - | 49 | 78.9 | 8.4 | 17.12 | 26.6 | 38.34 | 54.3 | 90.68 |
| Qecal [mgg-1] |
9.17 | 23.82 | 60.98 | - | 49 | 155.63 | 10.52 | 16.27 | 18.78 | 49.27 | 46.27 | 78.72 | |
| K1 [min-1] |
0.0649 | 0.0762 | 0.1789 | - | 0.0831 | 0.1697 | 0.1273 | 0.0776 | 0.1291 | 0.1276 | 0.09372 | 0.0739 | |
| R2 | 0.9054 | 0.9913 | 0.8781 | - | 0.997 | 0.8984 | 0.8601 | 0.9564 | 0.9734 | 0.8884 | 0.9819 | 0.9422 | |
| Δq(%) |
41.35 | 0.3186 | 26.44 | - | 4.47 | 263.93 | 24.20 | 14.92 | 20.28 | 29.62 | 23.26 | 25.13 | |
| 5 | Qeexp [mgg-1] |
17.6 | 26.3 | 28.7 | 36.2 | 47.2 | 70.89 | 19.56 | 41.2 | 59.12 | 77.7 | 95.87 | 149.03 |
| Qecal [mgg-1] |
22.87 | 28.56 | 24.38 | 35.93 | 40.63 | 56.76 | 16.87 | 38.01 | 30.70 | 35.94 | 60.67 | 184.84 | |
| K1 [min-1] |
0.1236 | 0.095 | 0.0907 | 0.0025 | 0.0637 | 0.1686 | 0.0654 | 0.1768 | 0.1596 | 0.1002 | 0.135 | 0.1607 | |
| R2 | 0.9245 | 0.9155 | 0.9649 | 0.818 | 0.9641 | 0.9898 | 0.9905 | 0.7857 | 0.9513 | 0.8532 | 0.945 | 0.9471 | |
| Δq(%) | 49.085 | 49.06 | 190 | 92.12 | 6.47 | 3.21 | 5.35 | 13.24 | 11.44 | 14.4 | 18.91 | 29.85 | |
Table 5.
Data fits the PSO kinetic model form GMS-24h and GMS-24h-NH2.
| GMS-24h | GMS-24hNH2 | ||||||||||||
|---|---|---|---|---|---|---|---|---|---|---|---|---|---|
| pH | [Ag(I)]0 mgL-1 |
247 | 437 | 637 | 837 | 1037 | 1636 | 247 | 437 | 637 | 837 | 1037 | 1636 |
| 1 | Qeexp [mgg-1] |
19.66 | 28.5 | 35 | 38.9 | 48.2 | 62 | 12.1 | 18.4 | 30.3 | 42.5 | 50.2 | 90.61 |
| Qecal [mgg-1] |
20.57 | 29.3 | 36.5 | 46.29 | 45.66 | 66.22 | 12.73 | 20.7 | 33.67 | 27.32 | 53.7 | 97 | |
| K2 [gmg-1min-1] |
0.024 | 0.0096 | 0.008 | 0.0018 | 0.0048 | 0.0049 | 0.049 | 0.0074 | 0.0047 | 0.0036 | 0.0037 | 0.0023 | |
| K2qe [min-1] | 0.494 | 0.281 | 0.292 | 0.0833 | 0.219 | 0.324 | 0.624 | 0.153 | 0.158 | 0.098 | 0.198 | 0.223 | |
| R2 | 0.9872 | 0.9773 | 0.9834 | 0.9135 | 0.9646 | 0.9926 | 0.9949 | 0.9375 | 0.9537 | 0.735 | 0.9631 | 0.977 | |
| Δq(%) | 8.9 | 7.7 | 6.4 | 13.7 | 14.3 | 8.7 | 8.1 | 12.5 | 10.2 | 54 | 9.1 | 8.1 | |
| Rw | 0.09 | 0.15 | 0.145 | 0.377 | 0.182 | 0.133 | 0.077 | 0.268 | 0.256 | 0.243 | 0.21 | 0.193 | |
| Zone | II | I | I | I | I | I | II | I | I | I | I | I | |
| 3 | Qeexp [mgg-1] |
13.3 | 24.1 | 28.8 | - | 49 | 78.9 | 8.4 | 17.12 | 26.6 | 38.3 | 54.3 | 90.7 |
| Qecal [mgg-1] |
14.1 | 27.7 | 31.9 | - | 55.9 | 78.7 | 8.8 | 19.3 | 29.6 | 40.1 | 59.2 | 98.0 | |
| K2 [gmg-1min-1] |
0.0179 | 0.0045 | 0.0061 | - | 0.0026 | 0.0127 | 0.0396 | 0.0079 | 0.0071 | 0.0086 | 0.0046 | 0.0019 | |
| K2qe [min-1] | 0.252 | 0.125 | 0.194 | 0.145 | 0.999 | 0.348 | 0.152 | 0.210 | 0.345 | 0.272 | 0.186 | ||
| R2 | 0.9814 | 0.9481 | 0.9755 | - | 0.9576 | 1 | 0.982 | 0.962 | 0.9796 | 0.9889 | 0.9801 | 0.9663 | |
| Δq(%) | 0.384 | 10.66 | 9.52 | - | 8.5 | 0.51 | 8.75 | 10.28 | 10.39 | 5.64 | 9.97 | 9.86 | |
| Rw | 0.165 | 0.165 | 0.204 | - | 0.262 | 0.0475 | 0.131 | 0.269 | 0.209 | 0.131 | 0.1667 | 0.226 | |
| Zone | I | I | I | - | I | I | I | I | I | I | I | I | |
| 5 | Qeexp [mgg-1] |
17.6 | 26.3 | 28.7 | 36.2 | 47.2 | 70.89 | 19.56 | 41.2 | 59.12 | 77.7 | 95.87 | 149.03 |
| Qecal [mgg-1] |
19.76 | 30.3 | 31.15 | 39.06 | 50 | 72.88 | 21.01 | 42.19 | 60.6 | 78.74 | 99 | 158.7 | |
| K2 [gmg-1min-1] |
0.0097 | 0.0047 | 0.0321 | 0.0256 | 0.0038 | 0.0012 | 0.0118 | 0.0173 | 0.0186 | 0.0117 | 0.0087 | 0.0021 | |
| K2qe [min-1] | 0.192 | 0.142 | 0.999 | 0.999 | 0.19 | 0.087 | 0.248 | 0.729 | 1.127 | 0.921 | 0.861 | 0.333 | |
| R2 | 0.9292 | 0.9595 | 0.9797 | 0.9574 | 0.9451 | 0.9975 | 0.9722 | 0.9943 | 0.9987 | 0.9978 | 0.9966 | 0.9904 | |
| Δq(%) | 12.7 | 28.5 | 7.7 | 7.9 | 8.6 | 29.7 | 10.2 | 4.2 | 4.3 | 2.7 | 10.2 | 8.0 | |
| Rw | 0.2068 | 0.2558 | 0.0514 | 0.047 | 0.208 | 0.345 | 0.168 | 0.064 | 0.042 | 0.0515 | 0.0548 | 0.1304 | |
| Zone | I | I | II | II | I | I | I | II | II | II | II | I | |
Table 6.
PSO Kinetic Study criteria for approaching equilibrium (Rw).
| Rw | Zone | Observation |
|---|---|---|
| Rw=1 | 0 | Type of Kinetic curve: line. System not approaching equilibrium |
| 1>Rw>0.1 | I | Type of Kinetic curve: slightly curved. System approaching equilibrium |
| 0.1>Rw>0.01 | II | Type of Kinetic curve: largely curved System well approaching equilibrium |
| Rw<0.01 | III | Type of Kinetic curve: Pseudo-rectangular curved System drastically approaching equilibrium |
Disclaimer/Publisher’s Note: The statements, opinions and data contained in all publications are solely those of the individual author(s) and contributor(s) and not of MDPI and/or the editor(s). MDPI and/or the editor(s) disclaim responsibility for any injury to people or property resulting from any ideas, methods, instructions or products referred to in the content. |
© 2025 by the authors. Licensee MDPI, Basel, Switzerland. This article is an open access article distributed under the terms and conditions of the Creative Commons Attribution (CC BY) license (https://creativecommons.org/licenses/by/4.0/).
Copyright: This open access article is published under a Creative Commons CC BY 4.0 license, which permit the free download, distribution, and reuse, provided that the author and preprint are cited in any reuse.


