1. Introduction
Takotsubo syndrome (TTS), also known as stress-induced cardiomyopathy, is an acute, transient disorder of left ventricular (LV) function characterized by regional wall motion abnormalities extending beyond a single coronary artery territory, in the absence of obstructive coronary artery disease [
1]. It has been increasingly recognized over the past three decades as a distinct clinical entity predominantly affecting postmenopausal women and typically triggered by emotional or physical stress [
2].
Large contemporary registries have confirmed that TTS accounts for a non-negligible proportion of patients initially presenting with suspected acute coronary syndrome, with a marked female predominance and a wide spectrum of clinical triggers and outcomes [
3,
4]. Comprehensive expert panel reviews have summarized the evolving concepts in epidemiology, diagnostic criteria, and management, highlighting TTS as a heterogeneous syndrome rather than a single disease entity [
5].
Clinically, TTS often mimics an acute anterior ST-elevation myocardial infarction (STEMI), presenting with chest pain, ST-segment elevation, and elevation of cardiac biomarkers. This resemblance makes the differential diagnosis between TTS and true anterior STEMI particularly challenging in the acute phase [
2,
6]. Despite similar initial presentations, the underlying pathophysiology differs substantially. TTS is thought to represent a form of myocardial stunning related to catecholamine excess and stress-related neurohumoral activation, whereas anterior STEMI is caused by prolonged ischemia due to an occlusive thrombus in the left anterior descending (LAD) artery [
7,
8].
Several mechanistic studies and reviews have proposed that TTS involves complex interactions between catecholamine toxicity, microvascular dysfunction, and myocardial energy metabolism, leading to transient but sometimes extensive LV dysfunction [
9,
10]. In contrast, LAD-related anterior STEMI results in irreversible necrosis within a more clearly demarcated perfusion territory, followed by scar formation and chronic remodeling.
Advances in echocardiographic imaging, particularly two-dimensional (2D) speckle-tracking strain analysis, have enabled a more detailed assessment of LV systolic mechanics beyond conventional left ventricular ejection fraction (LVEF). Global longitudinal strain (GLS) has emerged as a sensitive marker of systolic function across a range of cardiac conditions, including acute coronary syndromes and chronic ischemic heart disease [
11,
12].
In the context of STEMI, speckle-tracking–derived longitudinal strain has been shown to predict infarct size, microvascular obstruction and subsequent LV remodeling, particularly in first anterior infarctions [
13,
14].
In TTS, strain imaging offers unique insights into the pattern and extent of myocardial dysfunction. Recent literature and expert reviews describe a characteristic apical-to-basal gradient of longitudinal deformation, with severely impaired apical strain and relatively preserved or even hypercontractile basal segments, as well as potential differences in recovery patterns compared with ischemic injury [
15,
16,
17].
Nevertheless, individual studies comparing LV mechanics between TTS and anterior STEMI are limited by relatively small sample sizes, single-center designs and methodological heterogeneity in echocardiographic acquisition and strain analysis. The true magnitude and regional distribution of LV mechanical impairment in TTS relative to LAD-related anterior STEMI therefore remain uncertain.
The aim of the present study was to perform a systematic review and meta-analysis of comparative studies evaluating LV mechanics—particularly GLS, regional longitudinal strain (apical, mid, basal), and LVEF—in patients with TTS versus those with anterior STEMI due to LAD occlusion.
2. Materials and Methods
This systematic review and meta-analysis followed the Preferred Reporting Items for Systematic Reviews and Meta-Analyses (PRISMA) recommendations [
18] (
Supplementary Material 1). The study protocol was registered in advance with the INPLASY database (ID: INPLASY2025110021) on 9 November 2025 (
Supplementary Material 2).
2.1. Search Strategy
Two independent reviewers (A.S. and M.B.) systematically searched PubMed, Embase, and Scopus through October 2025 for all comparative studies evaluating LV function and mechanics by two-dimensional speckle-tracking echocardiography (2D-STE) in patients with TTS and anterior STEMI due to LAD occlusion. The following keywords and Boolean operators were used: “Takotsubo cardiomyopathy” OR “stress cardiomyopathy” OR “broken heart syndrome” OR “Takotsubo syndrome” AND “ST-elevation myocardial infarction” OR “anterior STEMI” OR “LAD occlusion” AND “echocardiography” OR “speckle tracking echocardiography” OR “strain imaging” OR “left ventricular strain” OR “global longitudinal strain” OR “LV mechanics.” No language or temporal restrictions were applied. Reference lists of included papers and relevant reviews were manually searched to identify additional eligible studies. Disagreements between reviewers were resolved by discussion or, when necessary, by consulting a third investigator.
2.2. Eligibility Criteria
Studies were included if they met the following criteria: (1) case-control design directly comparing patients with TTS and anterior STEMI due to LAD occlusion; (2) quantitative assessment of LV function using 2D-STE; and (3) available data for at least one of the following parameters in both groups: GLS, regional longitudinal strain (apical, mid-ventricular, or basal), or LVEF. Exclusion criteria were: (1) studies including mixed cardiomyopathies or other causes of transient LV dysfunction (e.g., myocarditis or sepsis-induced cardiomyopathy); (2) absence of a comparison group with angiographically confirmed LAD occlusion; (3) lack of quantitative LV strain measurements; (4) imaging methods other than echocardiography (e.g., cardiac magnetic resonance imaging strain only); and (5) conference abstracts, editorials, case reports, or narrative reviews without original data.
2.3. Study Selection and Data Extraction
Two reviewers (A.S. and M.B.) independently screened all titles and abstracts, followed by a full-text assessment of potentially eligible studies. Data were extracted from each study using a standardized collection form that included the following: (1) study characteristics (first author, year of publication, country, and study design); (2) population details (sample size, mean age, and proportion of female participants); (3) imaging protocol (vendor and software used for STE analysis, and timing of echocardiographic assessment—acute phase, recovery, or both); (4) conventional transthoracic echocardiography parameters (chamber dimensions and indices of LV systolic and diastolic function); (5) STE-derived LV functional parameters [GLS, apical longitudinal strain (ALS), mid-ventricular longitudinal strain (MLS), and basal longitudinal strain (BLS), and global radial strain (GRS) when available]; and (6) summary statistics (mean ± SD or median and interquartile range, together with reported p-values or confidence intervals). When results were available only in graphical form, numerical data were extracted using digital measurement software. Any discrepancies between reviewers were resolved through discussion and consensus.
2.4. Risk of Bias Assessment
The methodological quality and risk of bias were independently evaluated by two reviewers (A.S. and G.L.N.) using the National Institutes of Health (NIH) Quality Assessment Tool for Case-Control Studies [
19]. Each study was classified as “good,” “fair,” or “poor” according to the NIH scoring criteria. Inter-rater reliability was assessed using Cohen’s kappa coefficient (κ), and any discrepancies were resolved through discussion and consensus.
2.5. Statistical Analysis
The distribution of all continuous variables was assessed using the Shapiro–Wilk test, which demonstrated non-normal distribution for all parameters across the included studies. Accordingly, continuous variables were uniformly reported as median with ìinterquartile range (IQR). For studies that originally provided continuous data in median (IQR) form, no transformation to means or standard deviations was performed. Given the non-normal distribution of the data, between-group comparisons of continuous variables (TTS vs. anterior STEMI) were carried out using the Mann–Whitney U test. Categorical variables were compared using Fisher’s exact test or chi-square test as appropriate, based on expected cell counts.
For meta-analytic pooling of echocardiographic parameters—including GLS, ALS, MLS, BLS, GRS, and LVEF—standardized mean differences (SMDs) were computed using established methods for converting medians and IQRs into approximate means and SDs under non-normal distributional assumptions (Luo et al. [
20], Wan et al. [
21]). These converted values were used exclusively for meta-analytic synthesis, not for descriptive reporting in the manuscript text or tables.
According to standard speckle-tracking echocardiography conventions, more negative GLS values indicate greater myocardial deformation (i.e., better systolic function), whereas less negative values correspond to reduced deformation. For the purpose of graphical comparison in the forest plot, GLS magnitudes were converted to positive values so that lower values represent worse deformation. Global radial strain, in contrast, is inherently expressed as a positive value.
A random-effects model (DerSimonian–Lairdmethod) was selected a priori to account for anticipated inter-study heterogeneity. Between-study heterogeneity was quantified with the I² statistic, with thresholds of 25%, 50%, and 75% denoting low, moderate, and high heterogeneity, respectively.
Publication bias was assessed visually using Begg’s funnel plots and statistically using Egger’s regression test.
Meta-regression models examined whether cardiovascular risk factors such as hypertension, diabetes, or age contributed to variability in LVEF effect sizes. Additionally, meta-regression analyses were performed to evaluate whether demographic or methodological factors—including age, sex distribution, and STE software vendor—modulated GLS outcomes.
Sensitivity analyses were conducted by sequentially excluding individual studies (leave-one-out approach) to test the robustness of pooled estimates.
All analyses were performed using Comprehensive Meta-Analysis software (version 3.0, Biostat, Englewood, NJ, USA) and IBM SPSS Statistics version 29.0 (Armonk, NY, USA). A two-tailed p-value < 0.05 was considered statistically significant.
3. Results
3.1. Study Selection
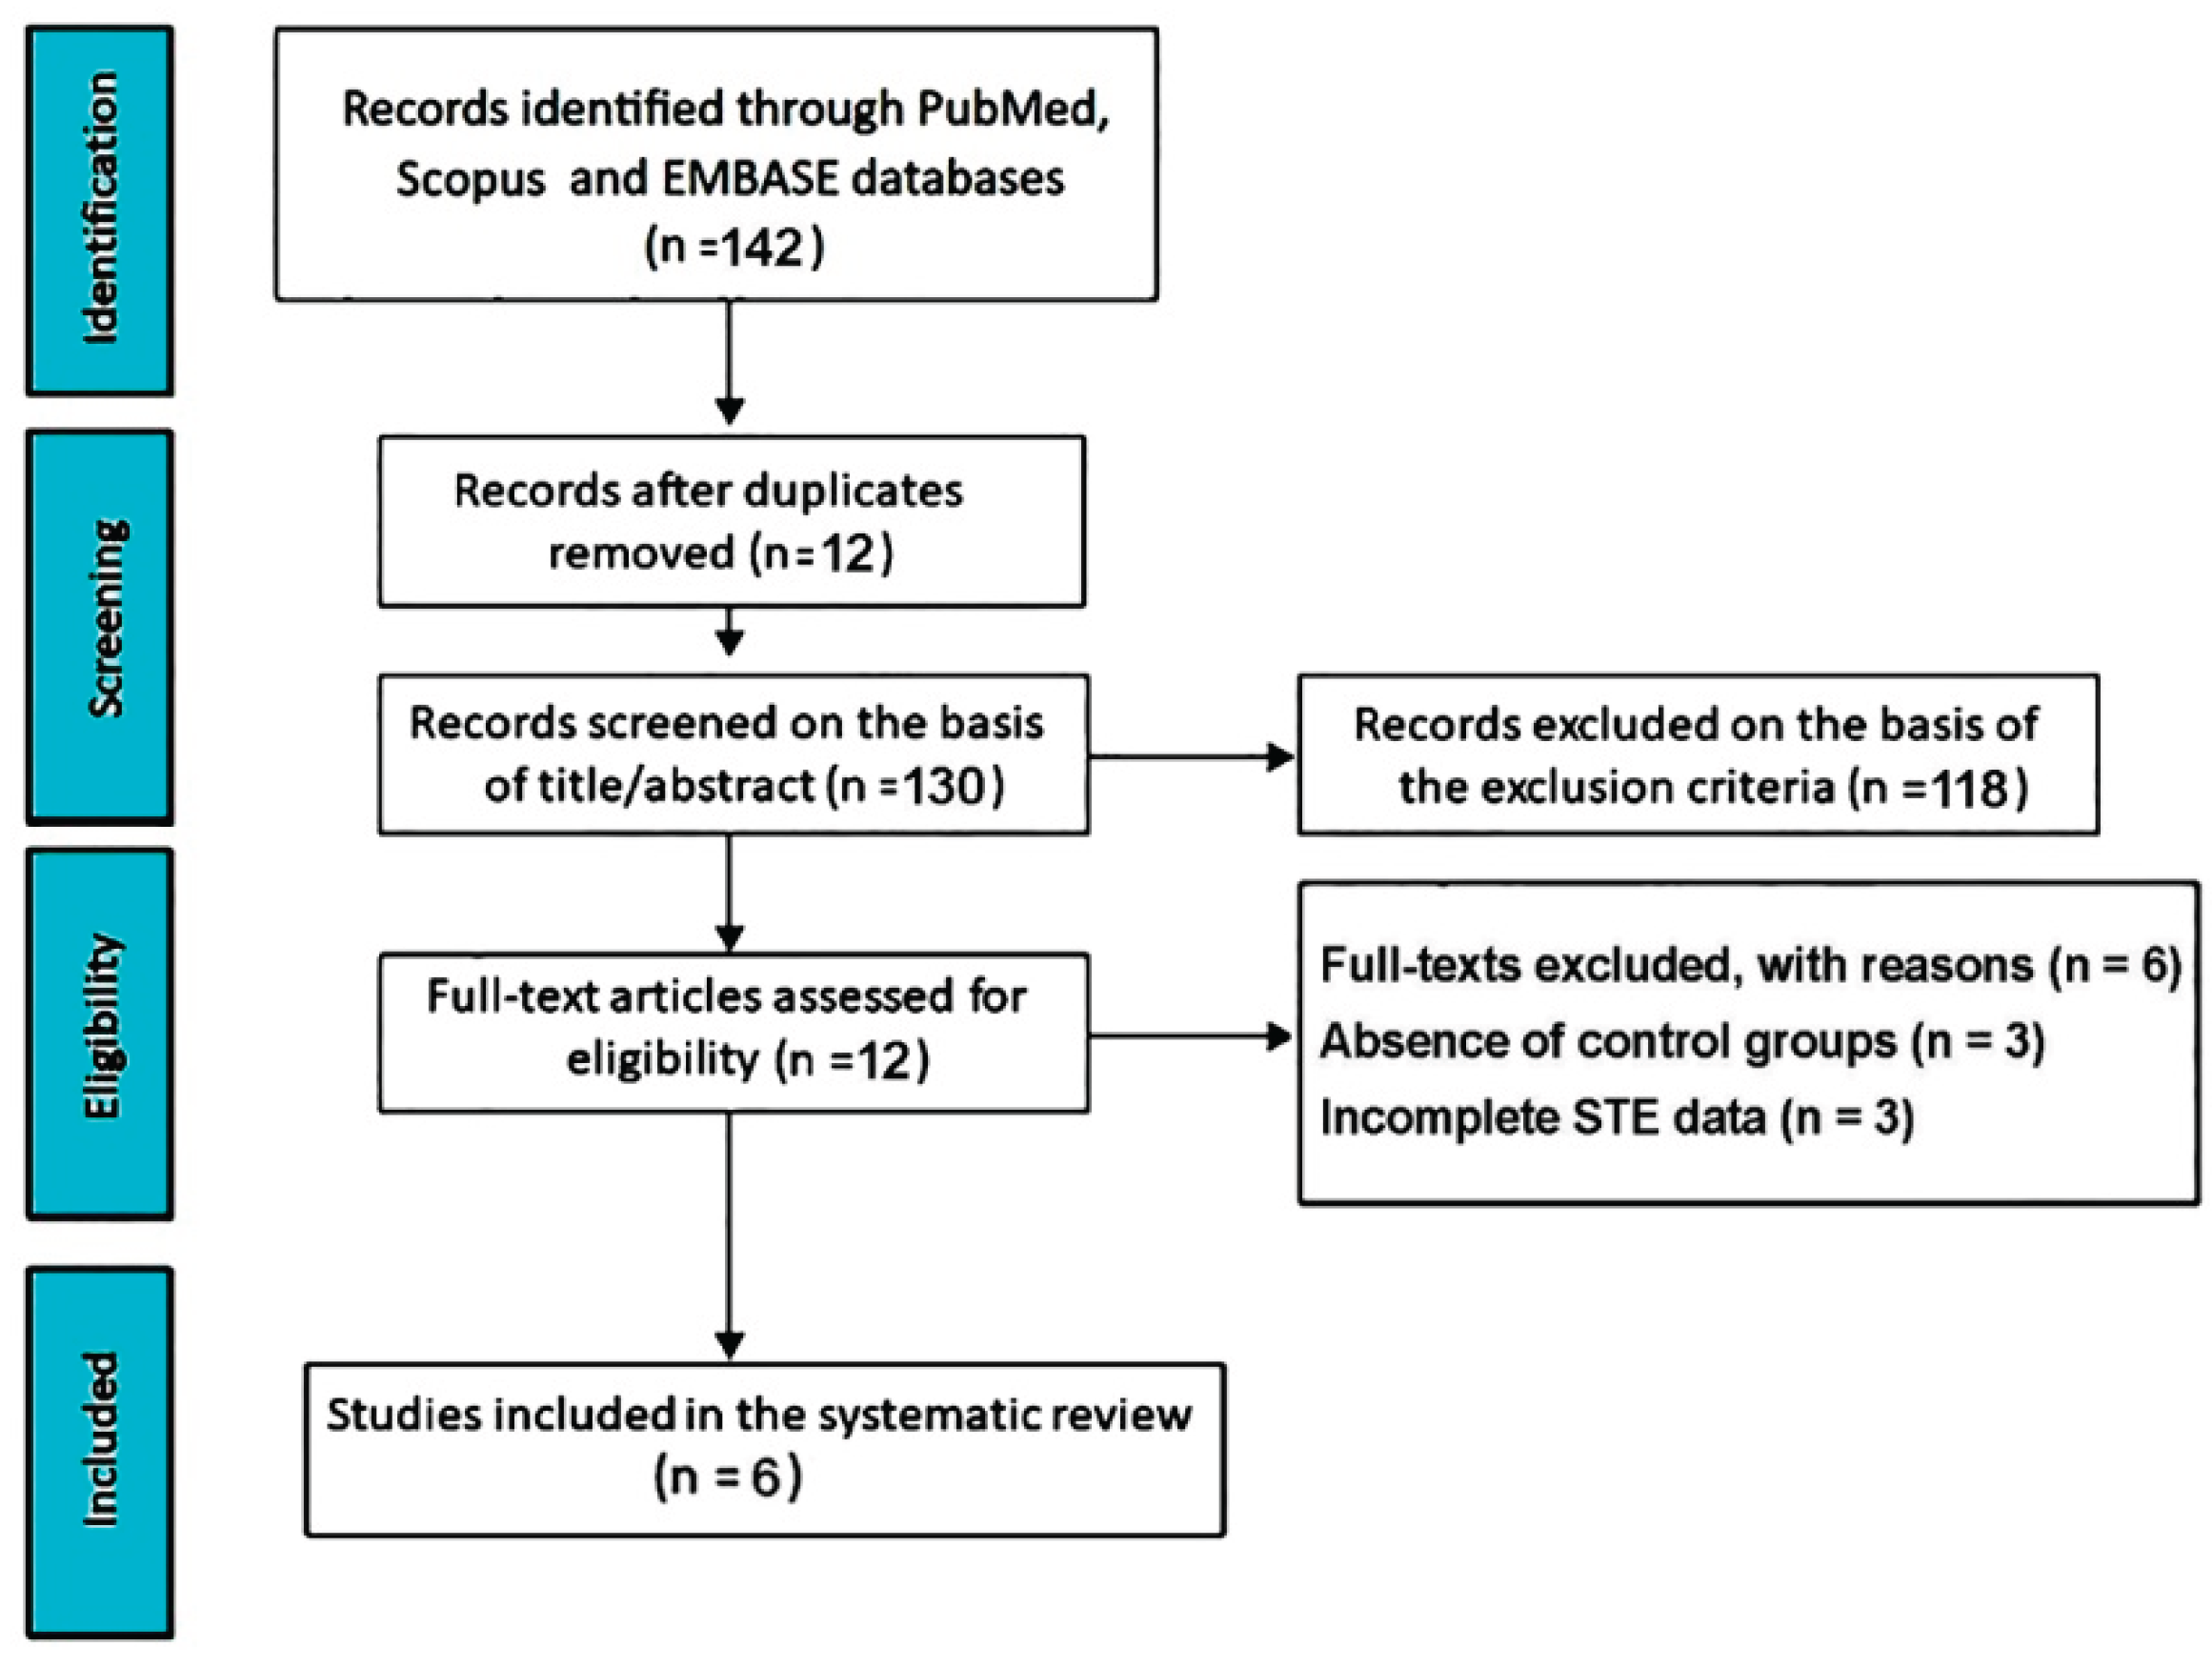
The initial search yielded 142 records. Twelve studies (8.5%) were removed as duplicates. A further 118 studies (83.1%) were excluded based on the predefined exclusion criteria. The remaining 12 studies (8.5%) were assessed for eligibility. Of these, 3 studies (2.1%) were excluded due to the absence of control groups, and 3 (2.1%) due to incomplete STE data. Ultimately, 6 studies (4.2%) [
22,
23,
24,
25,
26,
27] were included in this systematic review and meta-analysis (
Figure 1).
3.2. Clinical Findings
The included studies were published between 2009 and 2025. They were conducted in South Korea, Germany, the United States, and Sweden, and enrolled a total of 221 patients with TTS and 290 patients with anterior STEMI due to LAD occlusion. All studies assessed LV function using 2D-STE during the acute phase. Diagnostic criteria for TTS were consistent with the Mayo Clinic or European Society of Cardiology (ESC) definitions, while anterior STEMI was confirmed by angiographically proven LAD occlusion treated with percutaneous coronary intervention (PCI). All included studies evaluated only apical variants of TTS; no mid-ventricular, basal, or focal variants were enrolled. Therefore, strain findings reported across the selected literature strictly refer to classical apical ballooning presentations. The timing of echocardiographic assessment varied between studies, ranging from within 24 hours to 7 days after symptom onset. Different software packages—GE EchoPAC, TomTec, and Philips QLAB—were used for strain analysis contributing to methodological heterogeneity across studies (
Table 1).
The clinical characteristics of TTS and anterior STEMI groups assessed by the included studies are summarized in
Table 2.
Across studies, TTS patients were significantly older than those with anterior STEMI (median 68.8 [62.9–73] vs. 63.1 [58–66.9] years, p < 0.001) and were predominantly female (91.4% vs. 49.2%, p < 0.001). Cardiovascular risk factors were less prevalent in the TTS cohort, including diabetes mellitus (10.9% vs. 20.8%, p = 0.004) and hypercholesterolemia (21.8% vs. 41.4%, p < 0.001), while hypertension was more frequent in TTS (52.8% vs. 43.3%, p = 0.04). The prevalence of active smoking was significantly lower among TTS patients (18.0% vs. 29.9%, p = 0.003).
From a hemodynamic perspective, TTS patients exhibited slightly higher heart rates (87.8 [82–94.3] vs. 83.1 [79.9–89.6] bpm, p = 0.002) and lower systolic blood pressure (120.4 [98–132.3] vs. 129.1 [119–136.1] mmHg, p = 0.003) on admission. ST-segment elevation was observed in approximately half of TTS patients (48%) compared with almost all STEMI cases (98%, p < 0.001). Consistent with their distinct pathophysiology, peak troponin I levels were dramatically lower in TTS than in STEMI (2.9 [2.3–3.3] vs. 62.2 [29–93.7] µg/L, p < 0.001).
In the TTS population, a physical stressor (41.4%) or an emotional stressor (36.8%) was identified as the most frequent precipitating factor, whereas ischemic chest pain remained the predominant presentation among STEMI patients.
Only two studies reported longitudinal imaging data. Park et al. [
22] performed a single follow-up echocardiogram at a mean of 6.7 weeks after the acute event (range 4–16 weeks), documenting near-complete recovery of systolic function in TTS. In contrast, Poller et al. [
27] conducted serial strain assessments at days 0, 1, 2, 3, 7, 14, and 30, showing progressive improvement in both groups but more heterogeneous and incomplete recovery among anterior STEMI patients, who frequently exhibited persistent regional wall-motion abnormalities at 30 days.
3.3. Conventional Echocardiographic Findings
Across the six studies, conventional transthoracic echocardiography performed during the acute phase revealed consistent differences in LV systolic and diastolic function between patients with TTS and those with anterior STEMI due to LAD occlusion (
Table 3).
In line with the pooled results, LVEF was significantly lower in TTS (median 34.2% [25.4–39.7]) compared with anterior STEMI (41.6% [33.1–48.7]; p = 0.03), reflecting a more severe, though transient, global systolic dysfunction in the absence of permanent coronary obstruction.
LV structural dimensions were comparable between the two groups. LV end-diastolic diameter (LV-EDD) and end-systolic diameter (LV-ESD) did not differ significantly (46.8 [45–49.1] vs. 47.1 [45–50.7] mm, p = 0.44; and 33.3 [29–35.6] vs. 34.2 [32–36.3] mm, p = 0.29, respectively), nor did LV end-diastolic and end-systolic volume indices (LV-EDVi 62.5 [49.5–80] vs. 62.7 [45.2–90] mL/m², p = 0.96; LV-ESVi 36.9 [29.6–43] vs. 35.2 [26.2–51] mL/m², p = 0.61). These findings indicate that the reduction in LVEF in TTS is not primarily driven by increased chamber size, but rather by diffuse and reversible myocardial stunning.
Conversely, the interventricular septal (IVS) thickness was slightly lower in TTS (9.4 [8.9–10.2] vs. 10.0 [9.5–10.3] mm; p = 0.03), consistent with a lower myocardial mass and the typically non-hypertrophic LV phenotype observed in stress cardiomyopathy.
Indices of diastolic function demonstrated similar filling pressures between the groups. The E/e′ ratio was nearly identical (12.2 [11.4–13.0] vs. 12.3 [10.3–16.3]; p = 0.88), whereas the E/A ratio tended to be higher in TTS (1.00 [0.7–1.3] vs. 1.15 [1.0–1.3]; p = 0.07), suggesting a pattern of mild delayed relaxation rather than restrictive filling. The left atrial volume index (LAVi) was comparable or slightly lower in TTS (30.8 [30.7–30.9] vs. 31.4 [31.2–31.7] mL/m²; p = 0.05), further supporting less chronic diastolic load.
Right ventricular parameters showed distinct differences. Tricuspid annular plane systolic excursion (TAPSE) was significantly lower in TTS (15 vs. 20 mm; p = 0.004), indicating greater right ventricular systolic impairment, a well-recognized feature of Takotsubo cardiomyopathy involving biventricular dysfunction. Conversely, right ventricular inflow tract (RVIT) dimensions were similar between groups (37 vs. 36 mm; p = 0.41).
Taken together, these findings depict a characteristic echocardiographic pattern in TTS: more profound, transient global systolic impairment with relatively preserved LV volumes and diastolic function, accompanied by biventricular involvement and reduced TAPSE. This pattern contrasts with anterior STEMI, in which systolic dysfunction is regionally confined to the LAD territory and typically accompanied by greater LV hypertrophy and higher filling pressures.
3.4. Myocardial Strain Parameters
Quantitative strain analysis by 2D-STE demonstrated significant differences in myocardial deformation between TTS and anterior STEMI during the acute phase (
Table 4).
Across the six studies included, LV-GLS was significantly reduced in TTS compared with anterior STEMI (median 9.1 [3.5–13] vs. 10.5 [6.3–13]%, p = 0.01), indicating more extensive impairment of longitudinal systolic function. Similarly, apical longitudinal strain (LV-ALS) was markedly lower in TTS (4.4 [0.5–9.8] vs. 6.4 [3.4–10]%, p = 0.001), reflecting the characteristic apical ballooning and regional dysfunction beyond the LAD territory.
At the mid-ventricular level, LV-MLS was also significantly lower in TTS (9.9 [5.8–13.4] vs. 11.6 [5.7–17.4]%, p = 0.006), whereas LV-BLS showed a smaller but still significant difference (14.2 [11.4–18.1] vs. 14.2 [7.3–17.4]%, p = 0.03). This gradient pattern—more pronounced impairment toward the apex—illustrates the classical apical-to-basal recovery profile of TTS.
Conversely, global radial strain (LV-GRS) was substantially lower in TTS compared with anterior STEMI (15.7 [13.9–17.5] vs. 26.4 [23.8–29.1]%, p < 0.001), suggesting that radial myocardial thickening is globally impaired in TTS, consistent with the diffuse nature of myocardial stunning.
Collectively, these findings demonstrate a distinct strain pattern in TTS, characterized by severe but reversible global longitudinal and radial systolic dysfunction, predominantly involving apical and mid-ventricular segments, in contrast with the regional impairment confined to the LAD territory observed in anterior STEMI.
3.5. Effect of Takotsubo Syndrome versus Anterior STEMI on LVEF
Six studies [
22,
23,
24,
25,
26,
27] comparing LVEF between TTS and anterior STEMI were included in the quantitative analysis. Given the high degree of heterogeneity across studies (
Q = 121.4,
p < 0.001;
I² = 95.9%;
τ² = 1.63), a random-effects model was applied.
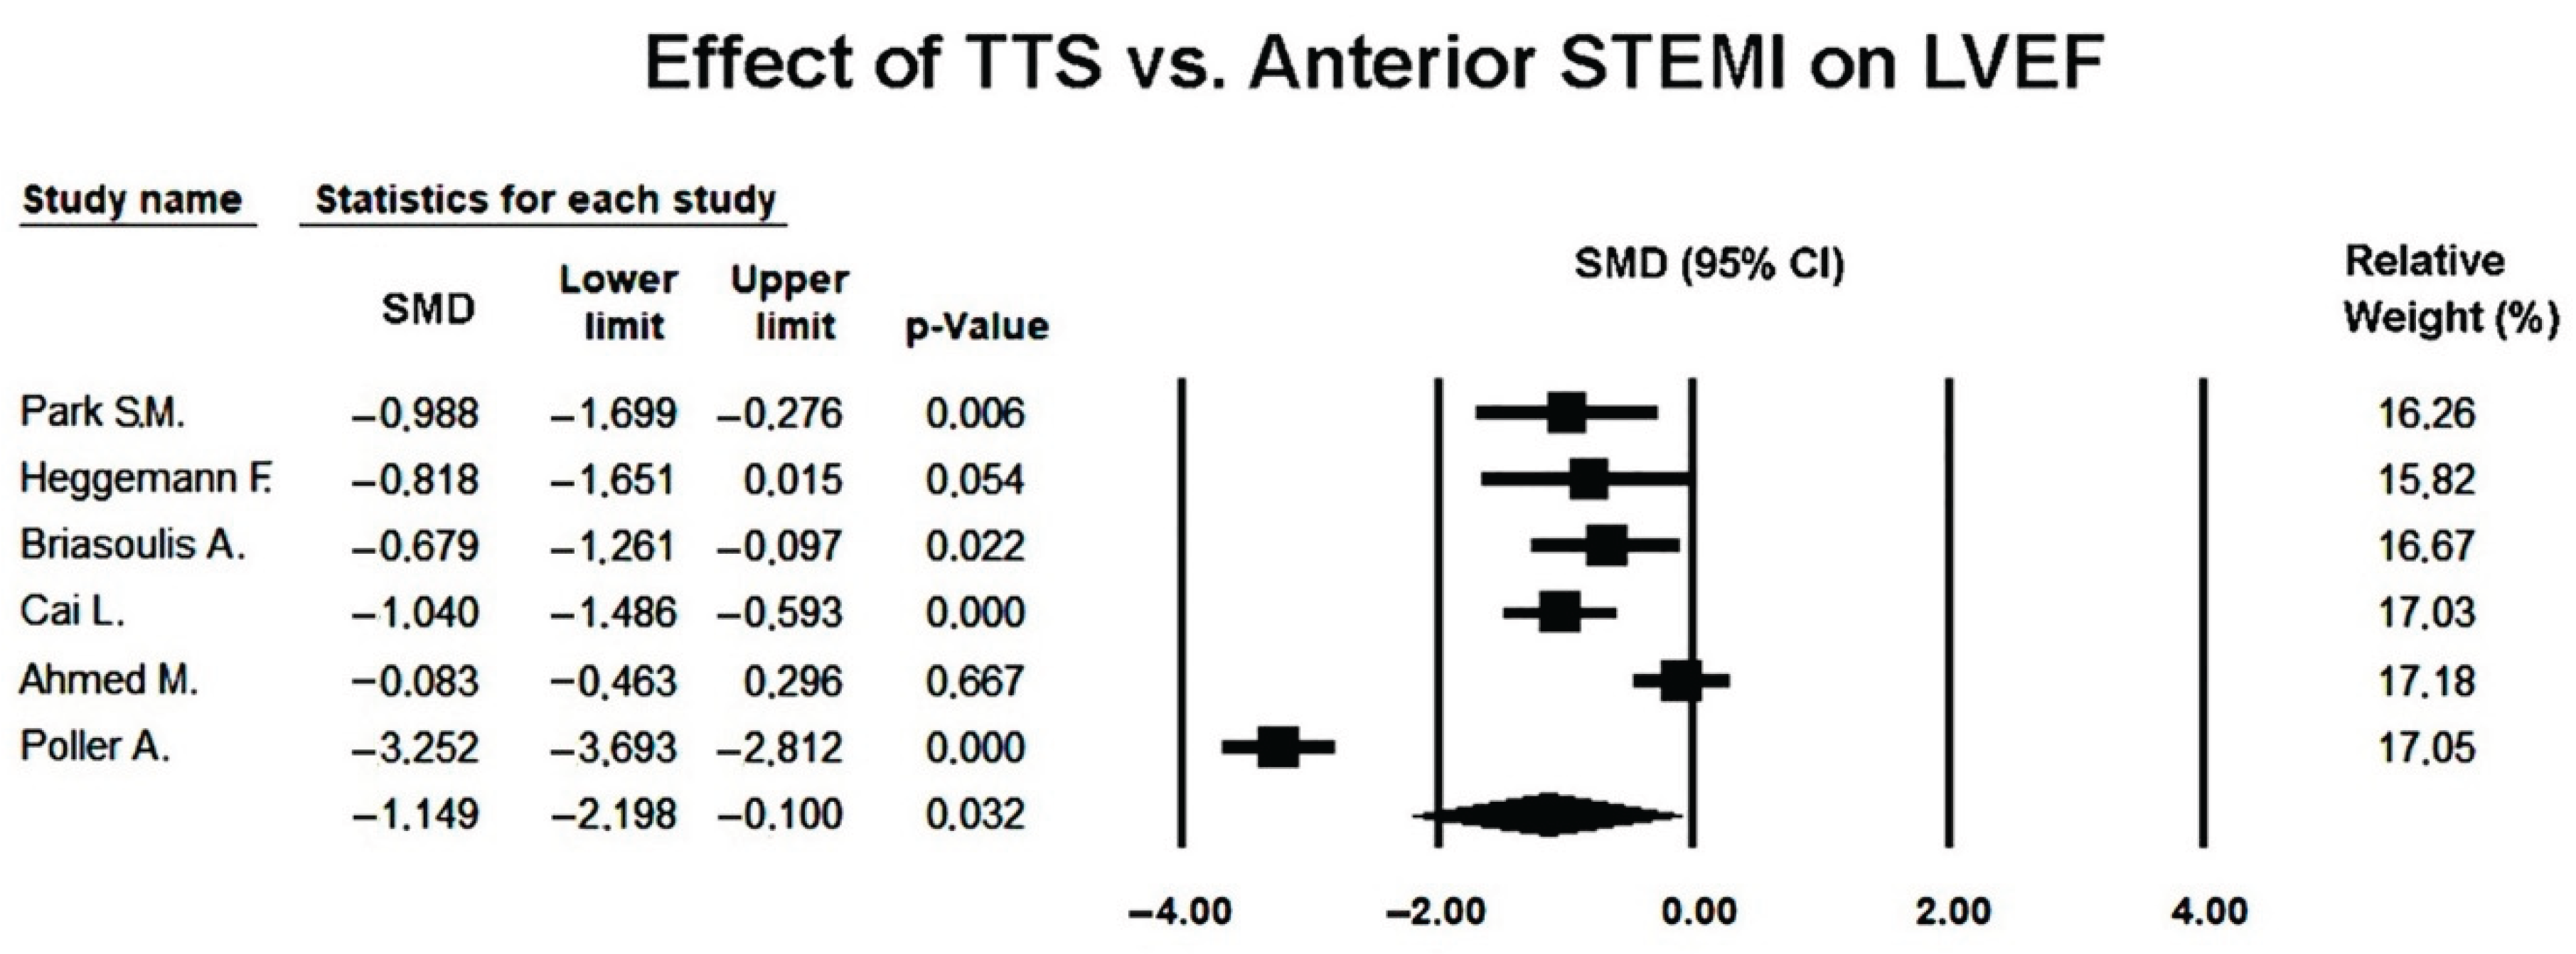
The pooled SMD in LVEF was −1.149 (95% CI −2.198 to −0.100;
p = 0.032), indicating that patients with TTS had significantly lower ejection fraction than those with anterior STEMI during the acute phase (
Figure 2).
This finding reflects a greater degree of global systolic impairment in TTS, consistent with the diffuse and transient nature of myocardial dysfunction in stress-induced cardiomyopathy.
Despite the consistent direction of effect across studies, substantial heterogeneity persisted, likely reflecting differences in imaging timing, patient selection, and echocardiographic quantification techniques.
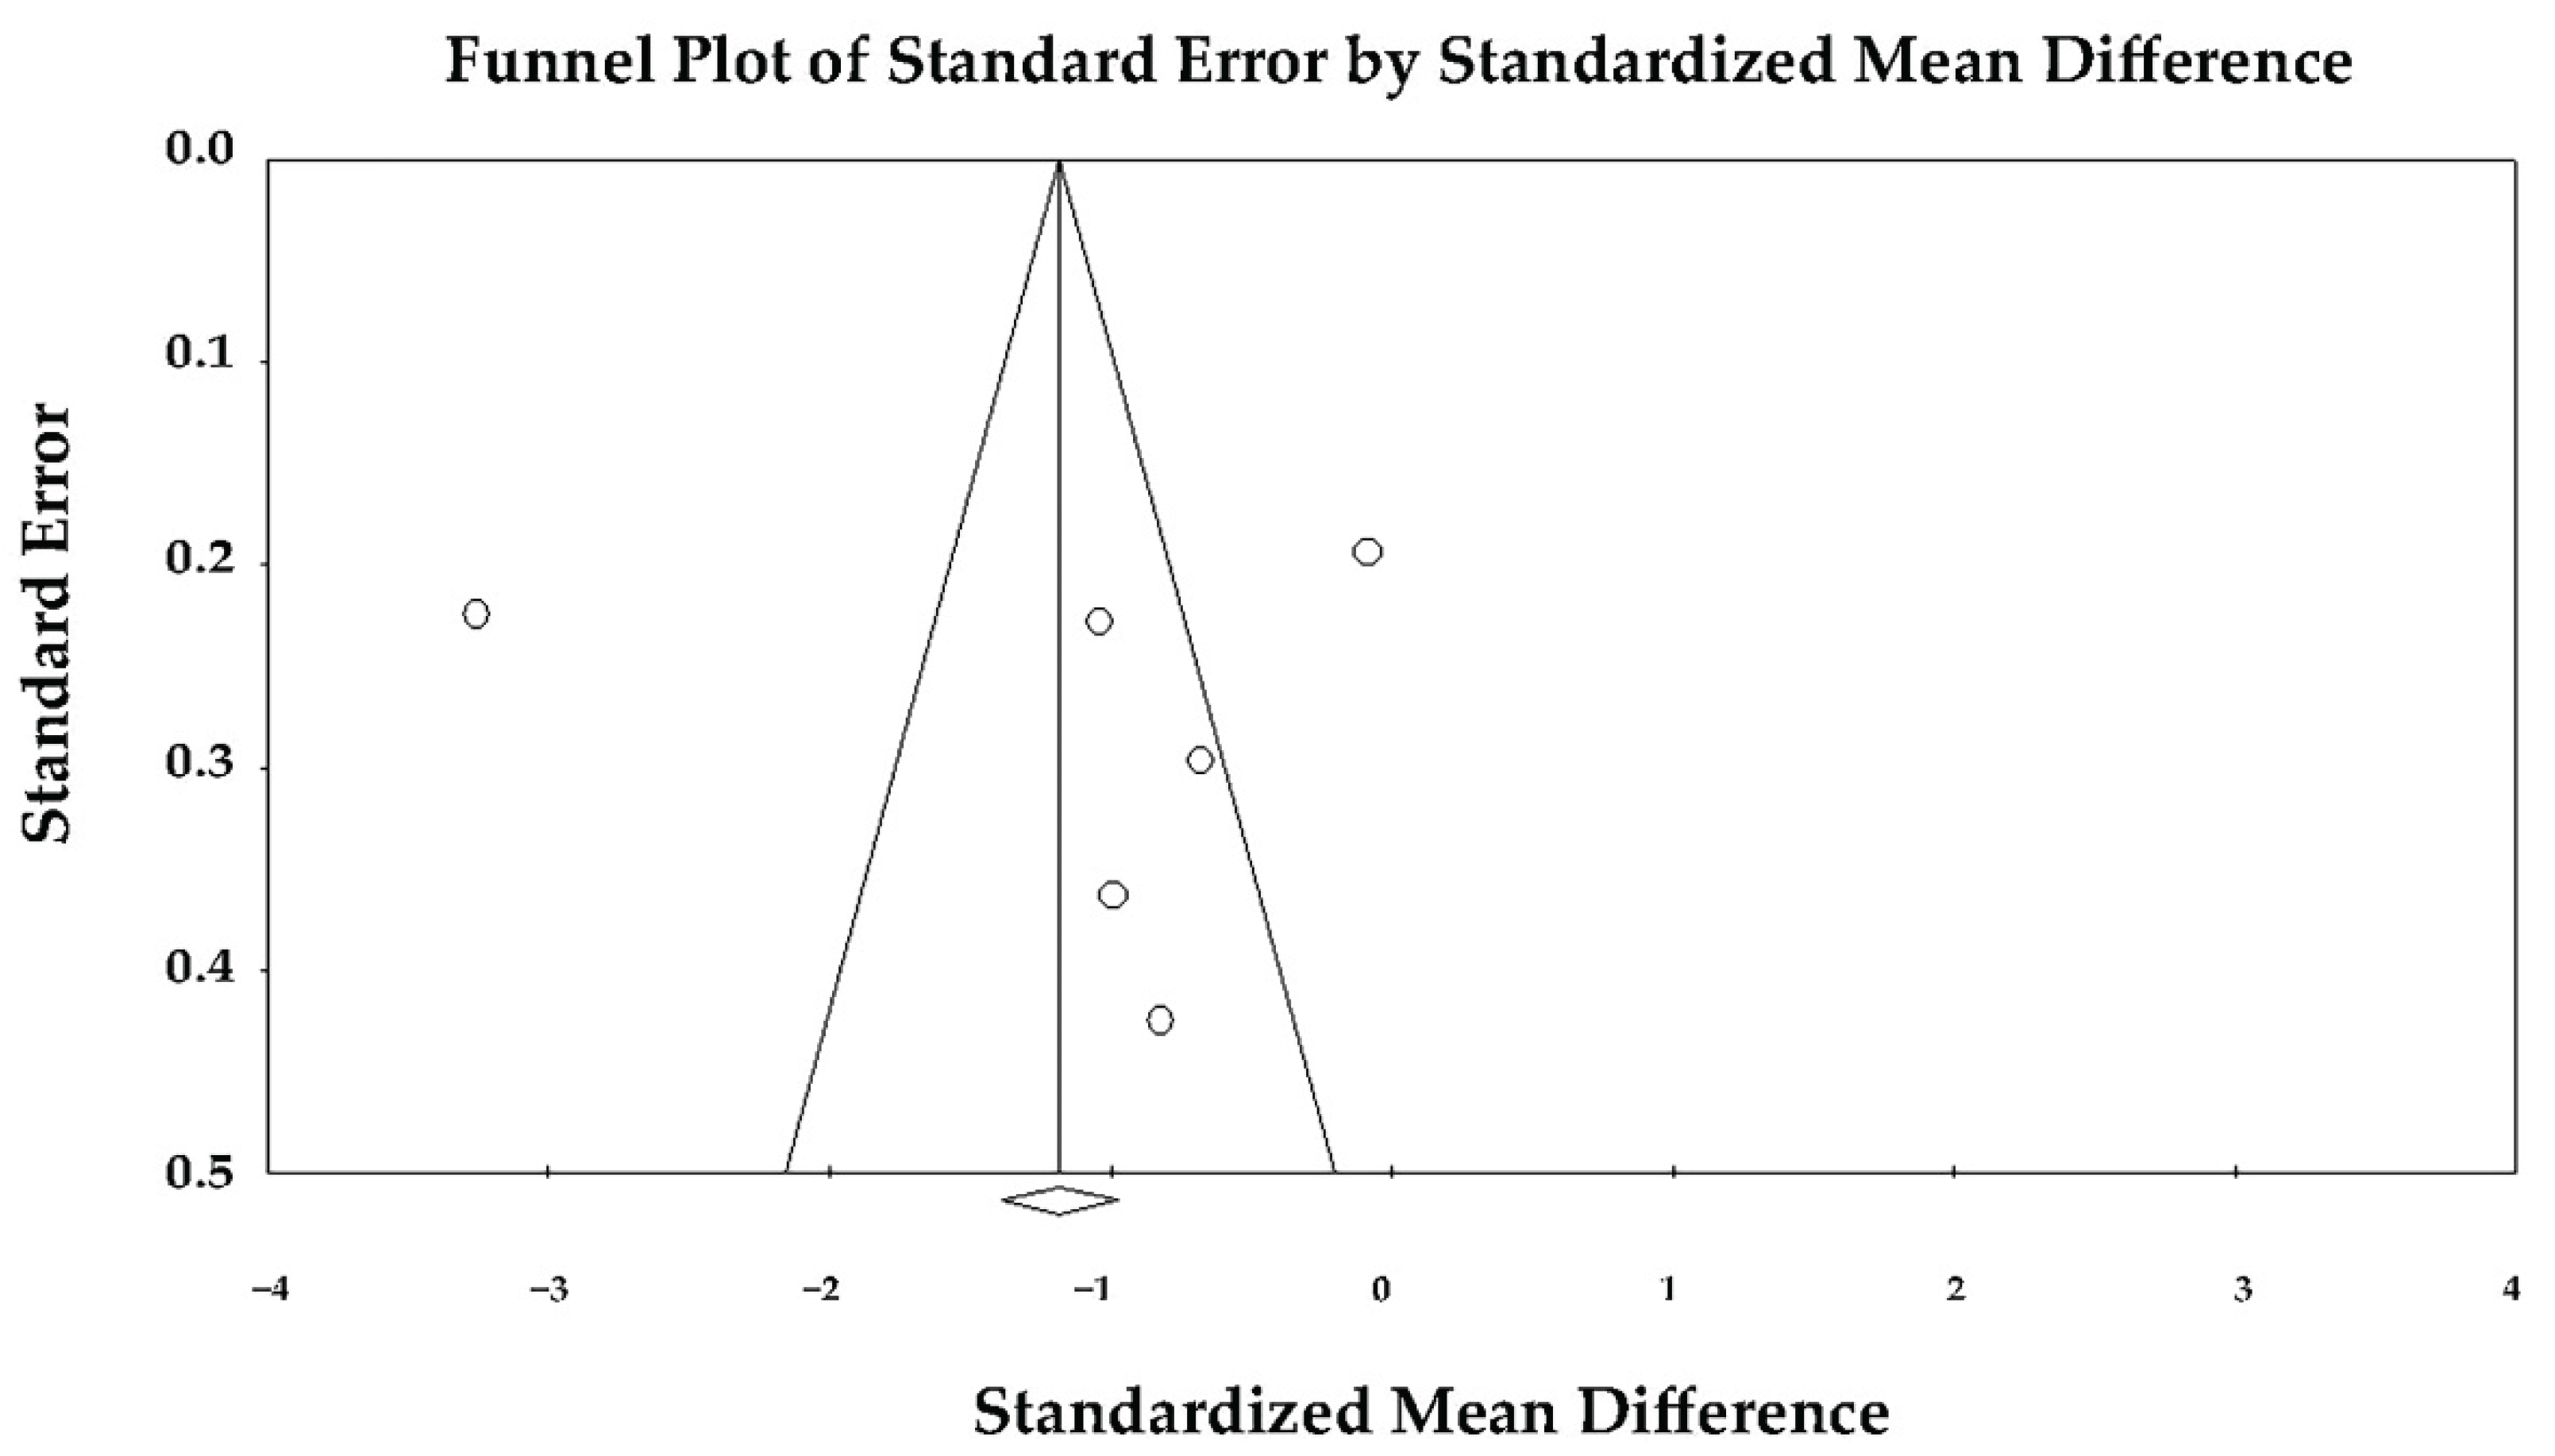
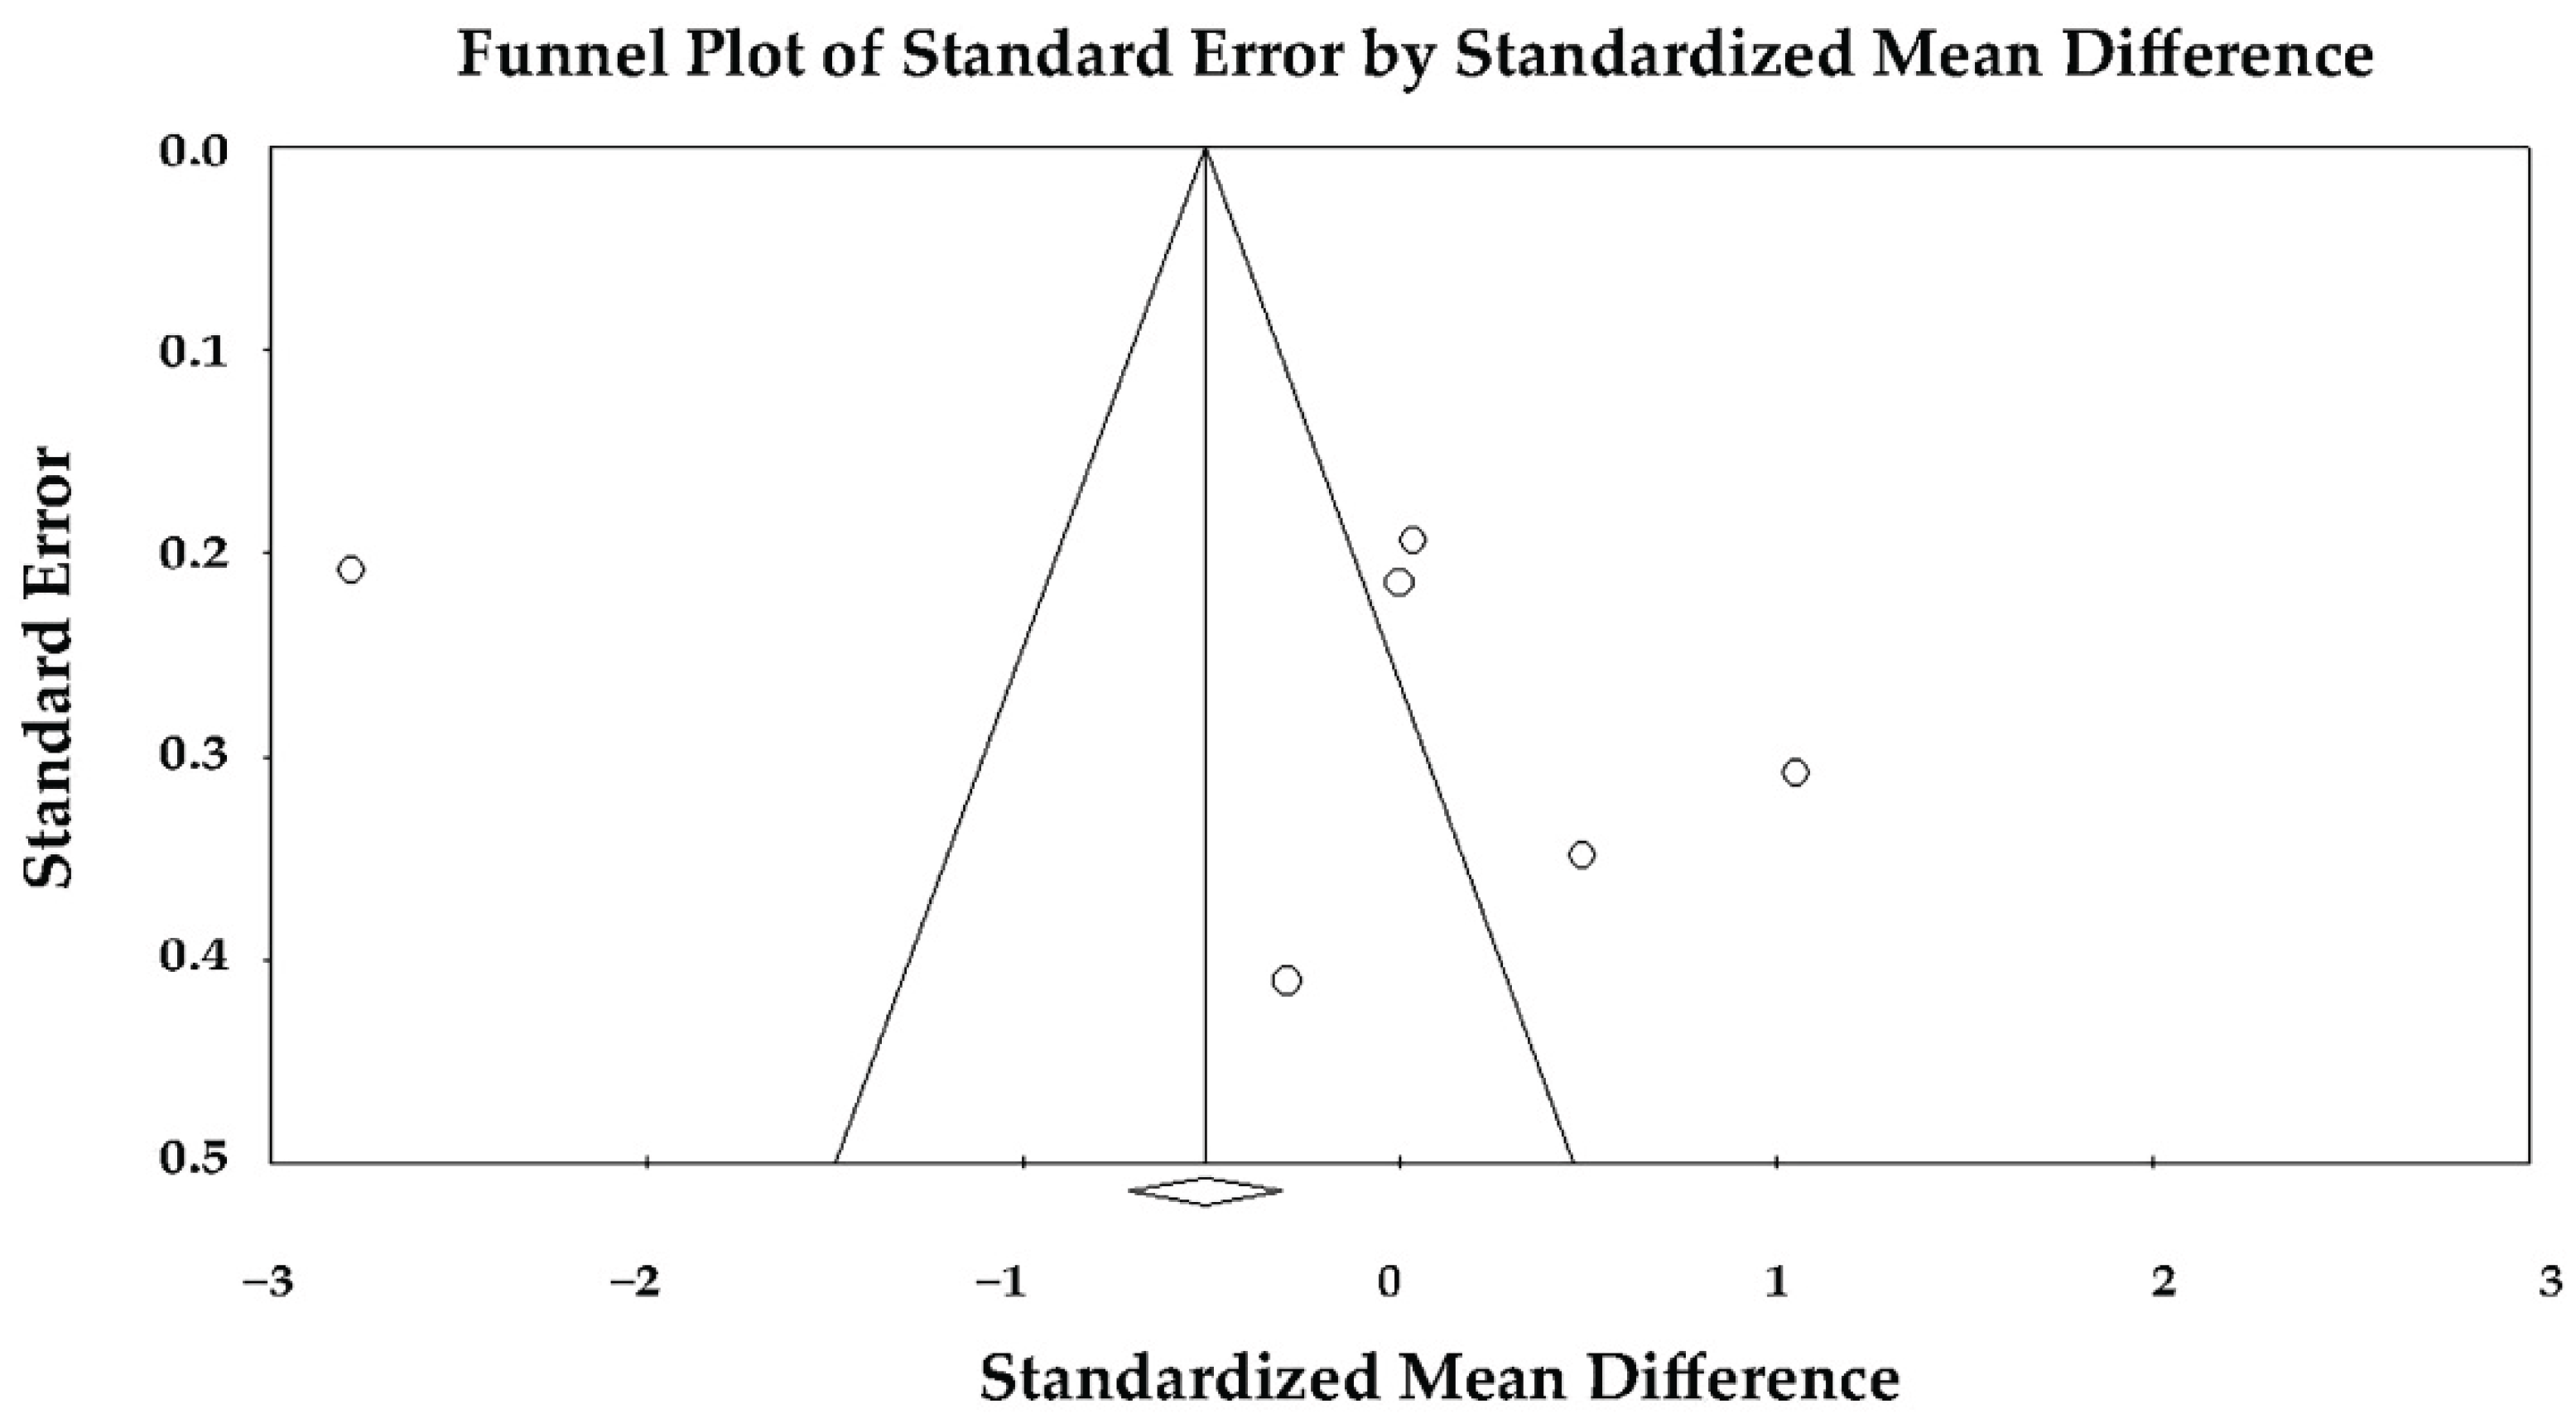
The funnel plot appeared symmetric (
Figure 3), and Egger’s regression test did not reveal any evidence of publication bias (intercept = 0.30 ± 8.73;
t(4) = 0.03;
p = 0.97). Therefore, the heterogeneity observed is unlikely to be attributable to selective reporting.
Meta-regression analysis did not identify age, prevalence of hypertension, or prevalence of diabetes as significant moderators of the LVEF effect size (
Table 5).
None of these covariates showed a statistically significant association with the difference in LVEF between TTS and anterior STEMI (Mean age: coefficient −0.086, p = 0.65; %Hypertension: coefficient 0.055, p = 0.29; %Diabetes: coefficient 0.133, p = 0.27). The overall test of moderators was not significant (Q = 1.66, df = 3, p = 0.64), indicating that these clinical factors did not explain the substantial between-study heterogeneity. The model accounted for approximately 11% of the between-study variance (R² analog = 0.11), suggesting that other unmeasured study-level factors likely contributed to variability in effect sizes.
In summary, the random-effects meta-analysis demonstrated that LVEF was significantly lower in TTS compared with anterior STEMI, indicating more pronounced acute systolic dysfunction in Takotsubo syndrome, without evidence of publication bias among the included studies.
Sensitivity analyses using leave-one-out exclusion procedures confirmed the robustness of the primary finding: across all iterations, the direction of effect remained unchanged, and the magnitude of the standardized mean difference consistently favored lower LVEF in TTS compared with anterior STEMI (SMD range −0.69 to −0.92; p value range 0.001−0.002), indicating that no single study disproportionately influenced the overall result.
3.6. Effect of Takotsubo Syndrome versus Anterior STEMI on LV-GLS
Six studies [
22,
23,
24,
25,
26,
27] comparing LV-GLS between TTS and anterior STEMI were included in the meta-analysis. Because of the marked heterogeneity among studies (Q = 117.0, p < 0.001; I² = 95.7%; τ² = 1.43), a random-effects model was used to obtain a conservative pooled estimate.
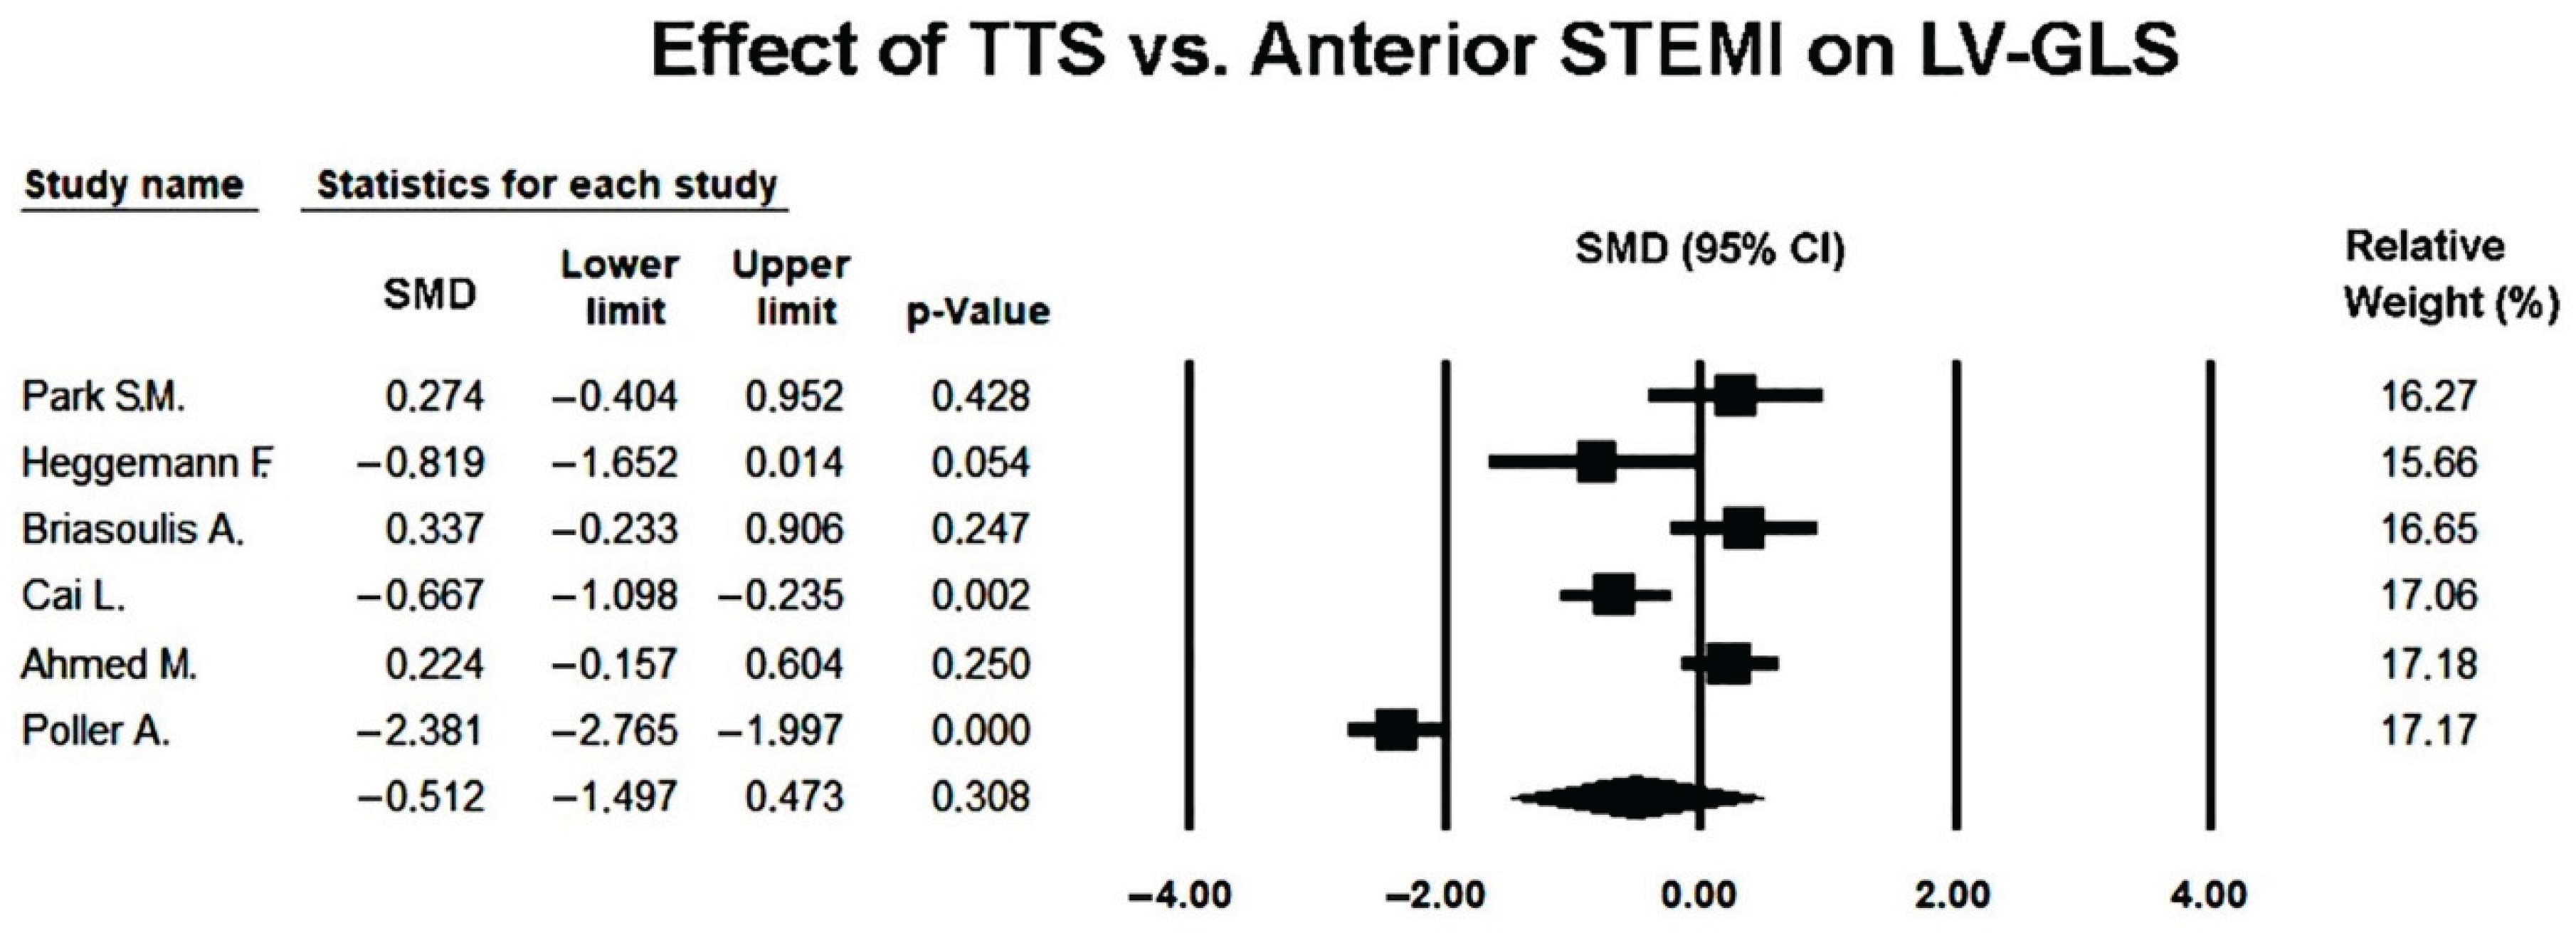
Under the random-effects model, the pooled SMD was −0.512 (95% CI −1.497 to 0.473; p = 0.308), indicating no statistically significant difference in global longitudinal strain between TTS and anterior STEMI during the acute phase (
Figure 4).
While most studies reported numerically lower GLS values in TTS, the wide confidence intervals and substantial heterogeneity suggest notable variability in study populations, echocardiographic timing, and strain analysis software.
The funnel plot appeared slightly asymmetric (
Figure 5), but Egger’s regression test did not indicate significant publication bias (intercept = 5.07 ± 7.88; t(4) = 0.64; two-tailed p = 0.55).
Therefore, the observed heterogeneity is unlikely to be explained by selective publication of positive findings. The forest plot showed that two studies [
23,
27] had the largest effect sizes, contributing disproportionately to between-study variability.
Meta-regression analysis did not identify any significant moderators of the GLS effect size. Neither mean age (coefficient 0.011, p = 0.96), percentage of female patients (coefficient −0.015, p = 0.86), nor use of non-GE software platforms (coefficient 0.979, p = 0.50) showed a statistically meaningful influence on the difference in GLS between TTS and anterior STEMI (
Table 6).
The overall test of moderators was not significant, indicating that these study-level characteristics did not explain the substantial between-study heterogeneity.
Overall, the random-effects analysis suggests that although TTS tends to show more impaired GLS compared with anterior STEMI, the difference was not statistically significant once heterogeneity was accounted for, and there was no evidence of publication bias across the included studies.
Sensitivity analyses using leave-one-out procedures demonstrated that the overall direction of effect was stable across all iterations, with SMDs ranging from −0.015 to −0.245 (p value range 0.49−0.96), confirming that no single study materially influenced the pooled estimate and that the non-significant difference in GLS between TTS and anterior STEMI was robust to the exclusion of individual studies.
3.7. Effect of Takotsubo Syndrome versus Anterior STEMI on LV-ALS
Six studies [
22,
23,
24,
25,
26,
27] comparing ALS between TTS and anterior STEMI were included in the quantitative analysis. Owing to significant inter-study variability (Q = 72.98, p < 0.001; I² = 93.1%; τ² = 0.85), a random-effects model was applied.
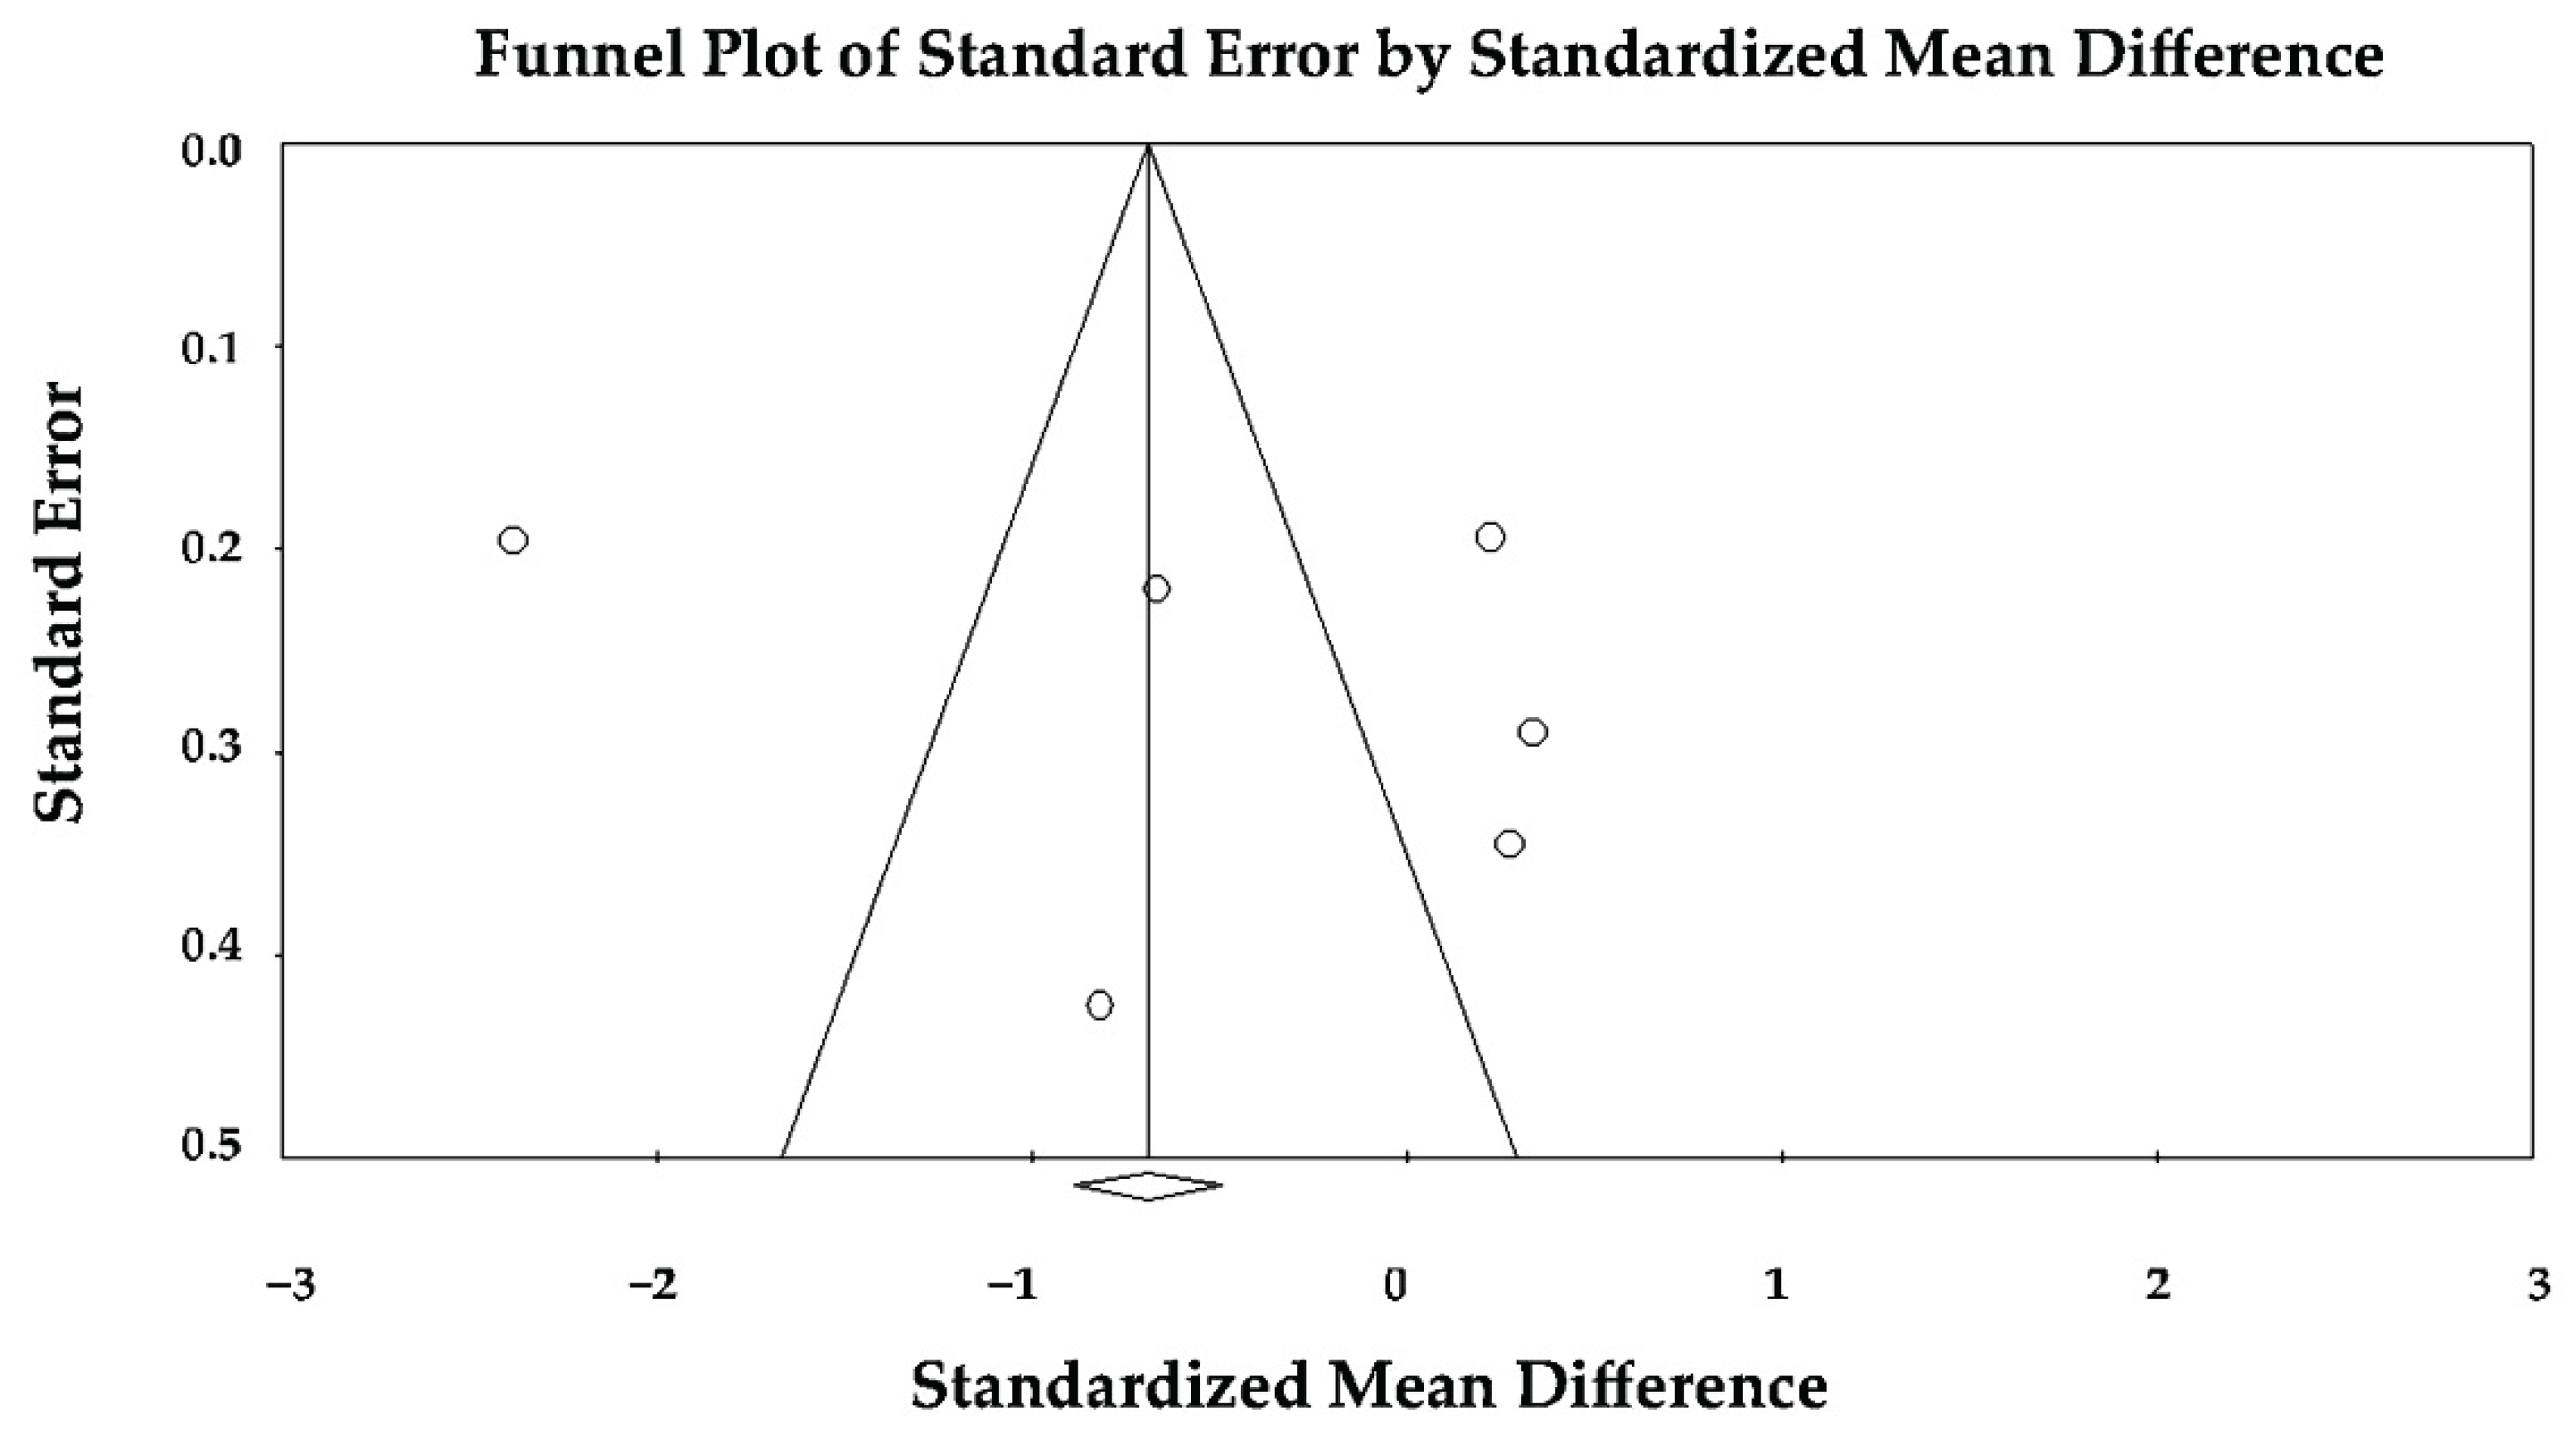
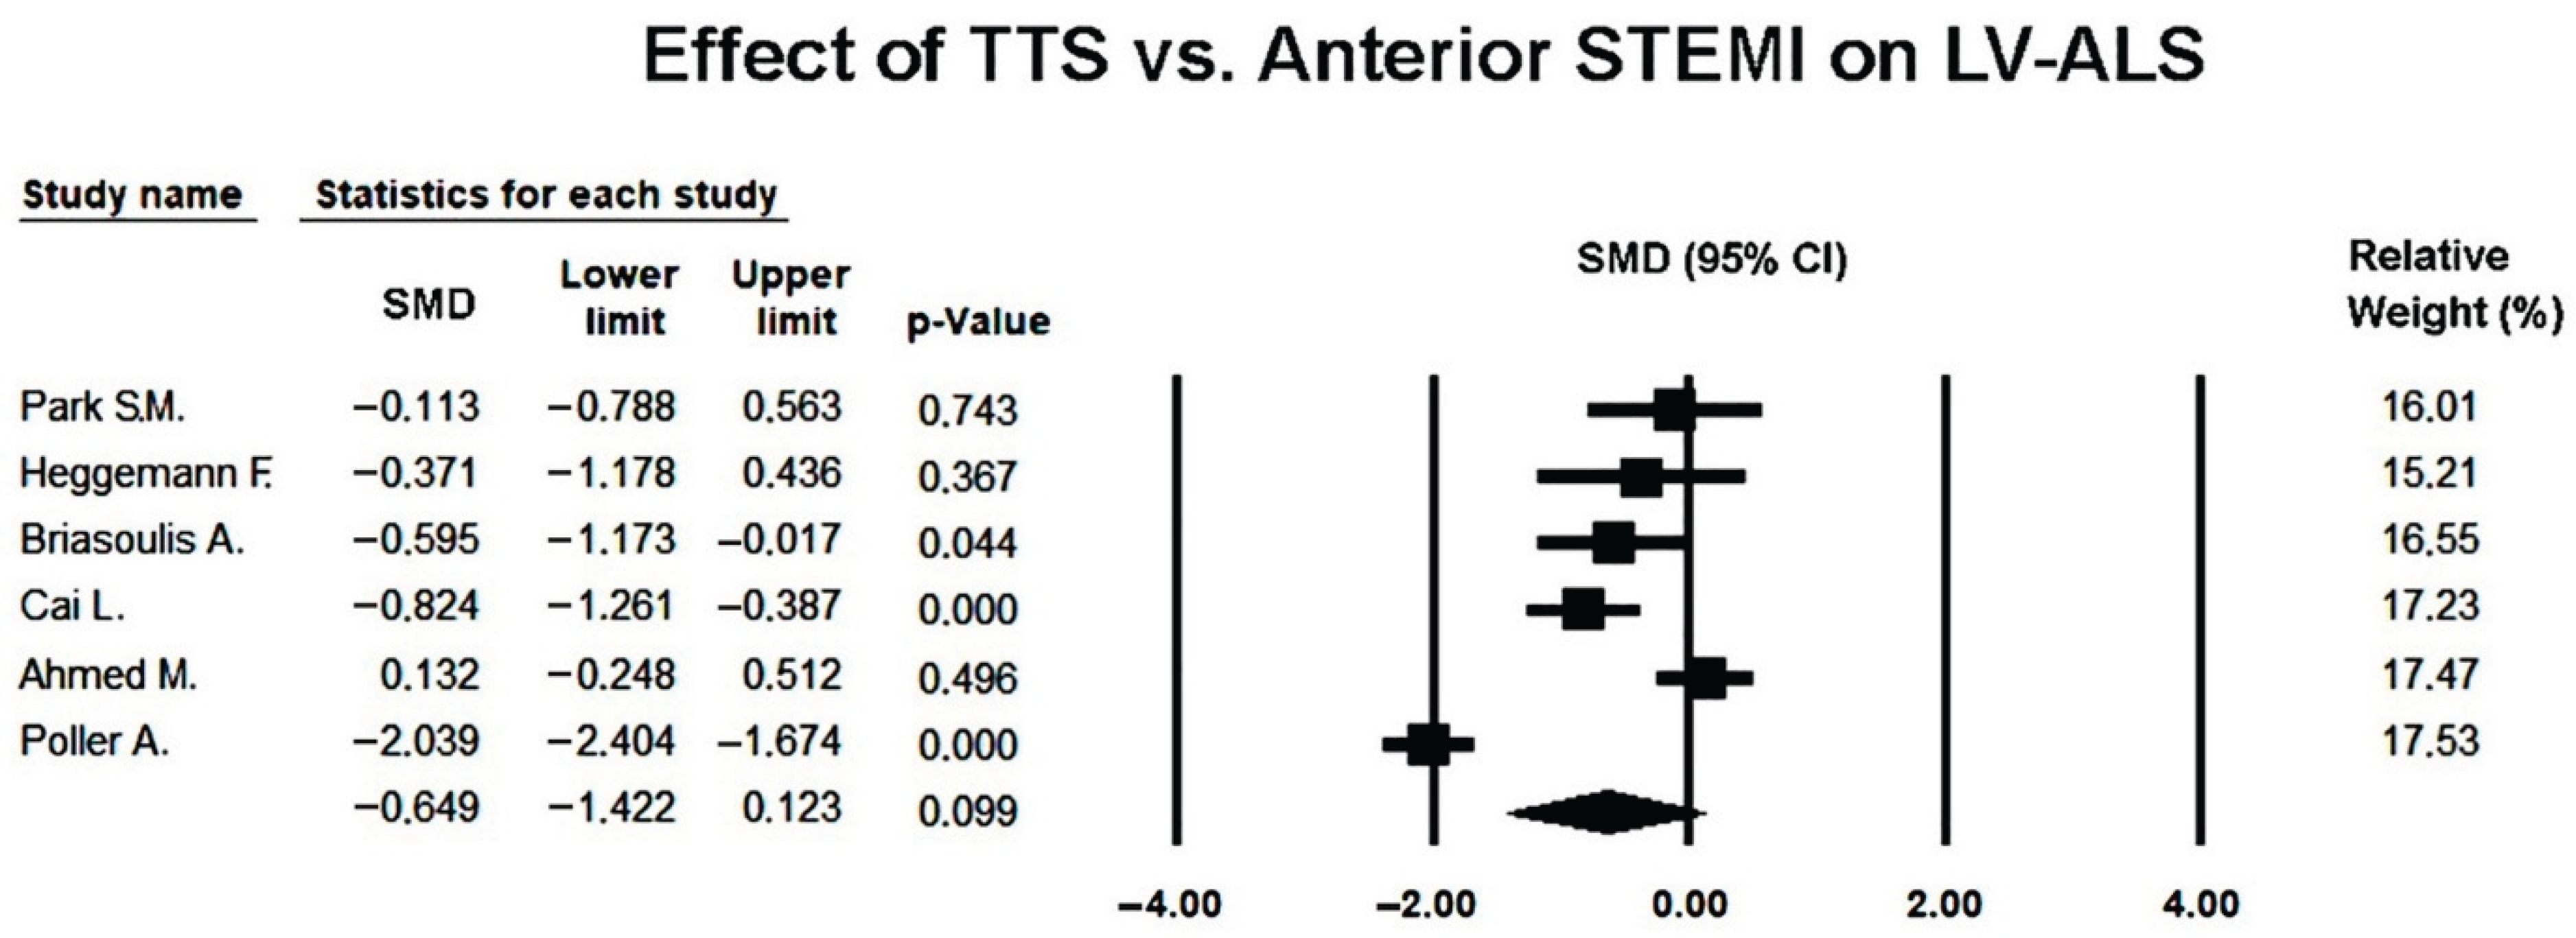
The pooled SMD under the random-effects model was −0.649 (95% CI −1.422 to 0.123; p = 0.099), indicating a non-significant trend toward lower (more impaired) apical strain in TTS compared with anterior STEMI during the acute phase (
Figure 6).
The large heterogeneity suggests that differences in imaging protocols, timing of echocardiography, and strain analysis software may have influenced the magnitude of observed effects.
Visual inspection of the forest plot revealed that most studies showed lower ALS values in TTS, consistent with greater apical dysfunction, although two studies [
25,
27] displayed larger effect sizes that contributed substantially to overall heterogeneity.
The funnel plot appeared relatively symmetric (
Figure 7), and Egger’s regression test did not reveal evidence of publication bias (intercept = 4.41 ± 6.02; t(4) = 0.73; two-tailed p = 0.50), suggesting that small-study effects were unlikely to have materially affected the results.
In summary, the random-effects meta-analysis indicates that patients with TTS tend to exhibit more pronounced impairment of apical longitudinal strain than those with anterior STEMI, but the difference did not reach statistical significance once heterogeneity was accounted for, and no publication bias was detected among the included studies.
Sensitivity analyses using a leave-one-out approach demonstrated that the direction of effect remained consistent across all iterations (SMD range −0.567 to −0.219; p-value range <0.001−0.41, respectively), indicating a persistent but variably significant trend toward more impaired apical strain in TTS. No single study disproportionately altered the pooled estimate, confirming that the overall non-significant difference in ALS was robust to the exclusion of individual datasets.
3.8. Effect of Takotsubo Syndrome versus Anterior STEMI on LV-MLS
Five studies [
23,
24,
25,
26,
27] comparing MLS between TTS and anterior STEMI were included in the meta-analysis. Because of the marked heterogeneity among studies (Q = 141.7, p < 0.001; I² = 97.2%; τ² = 2.06), a random-effects model was used.
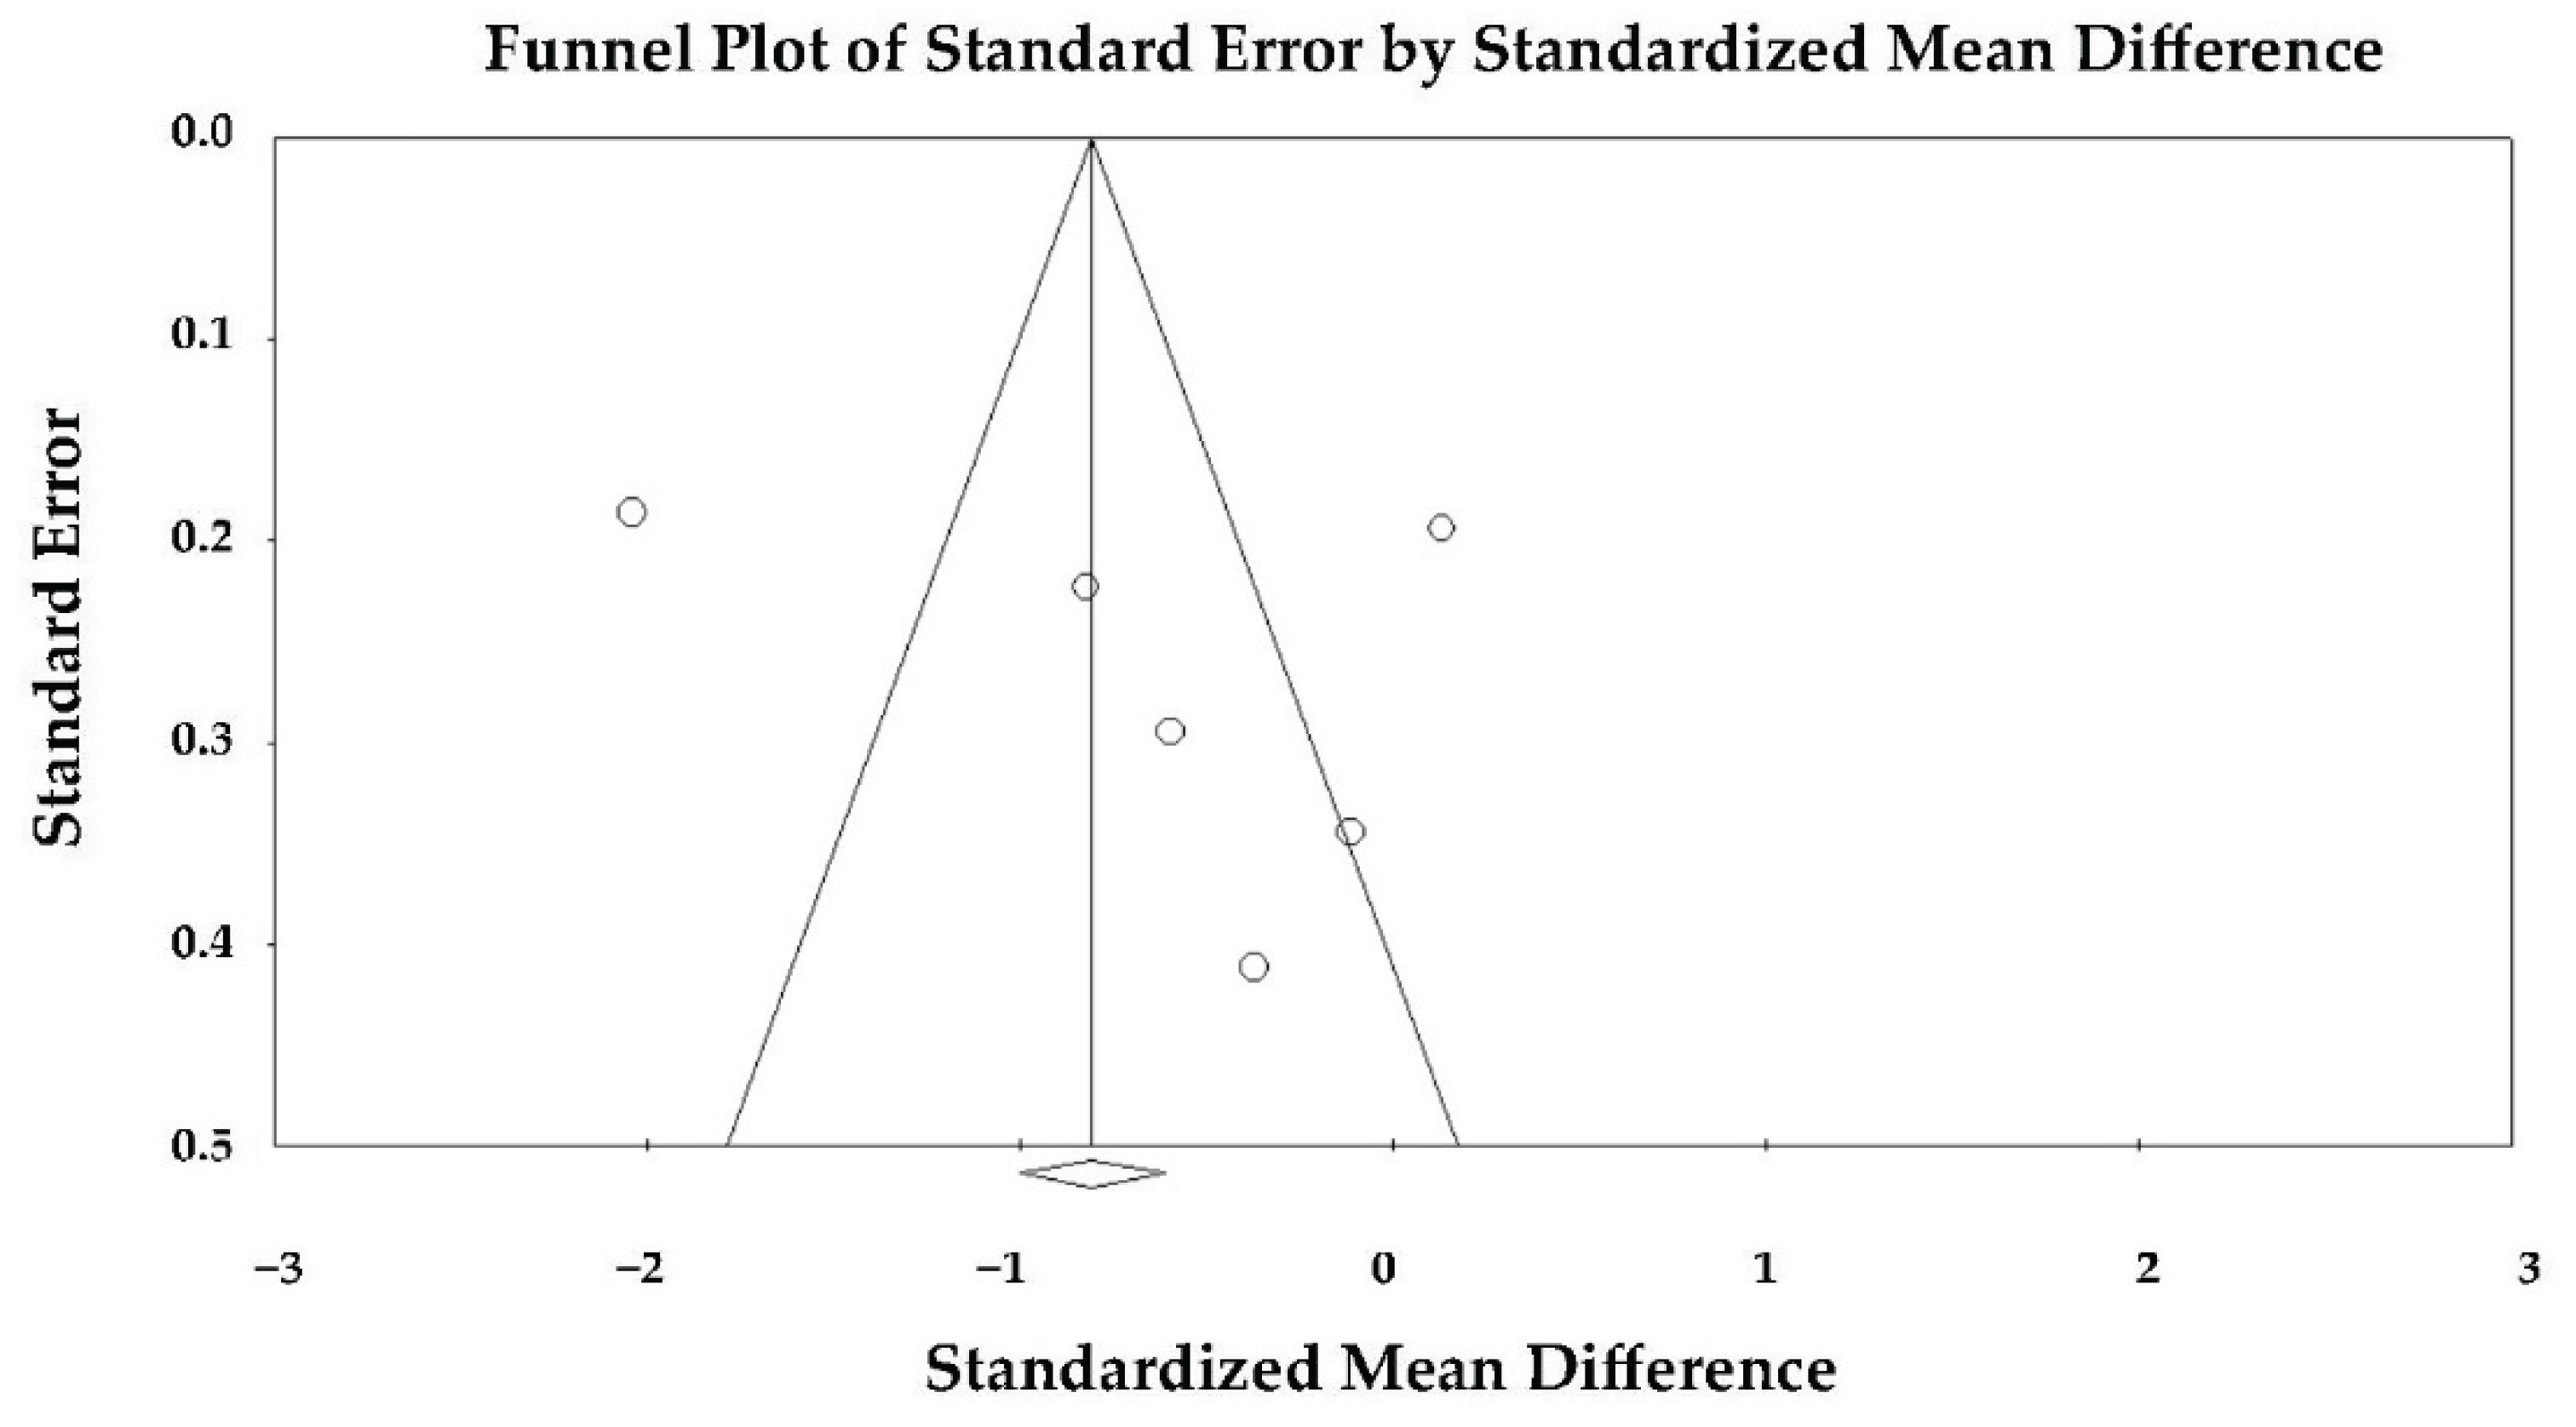
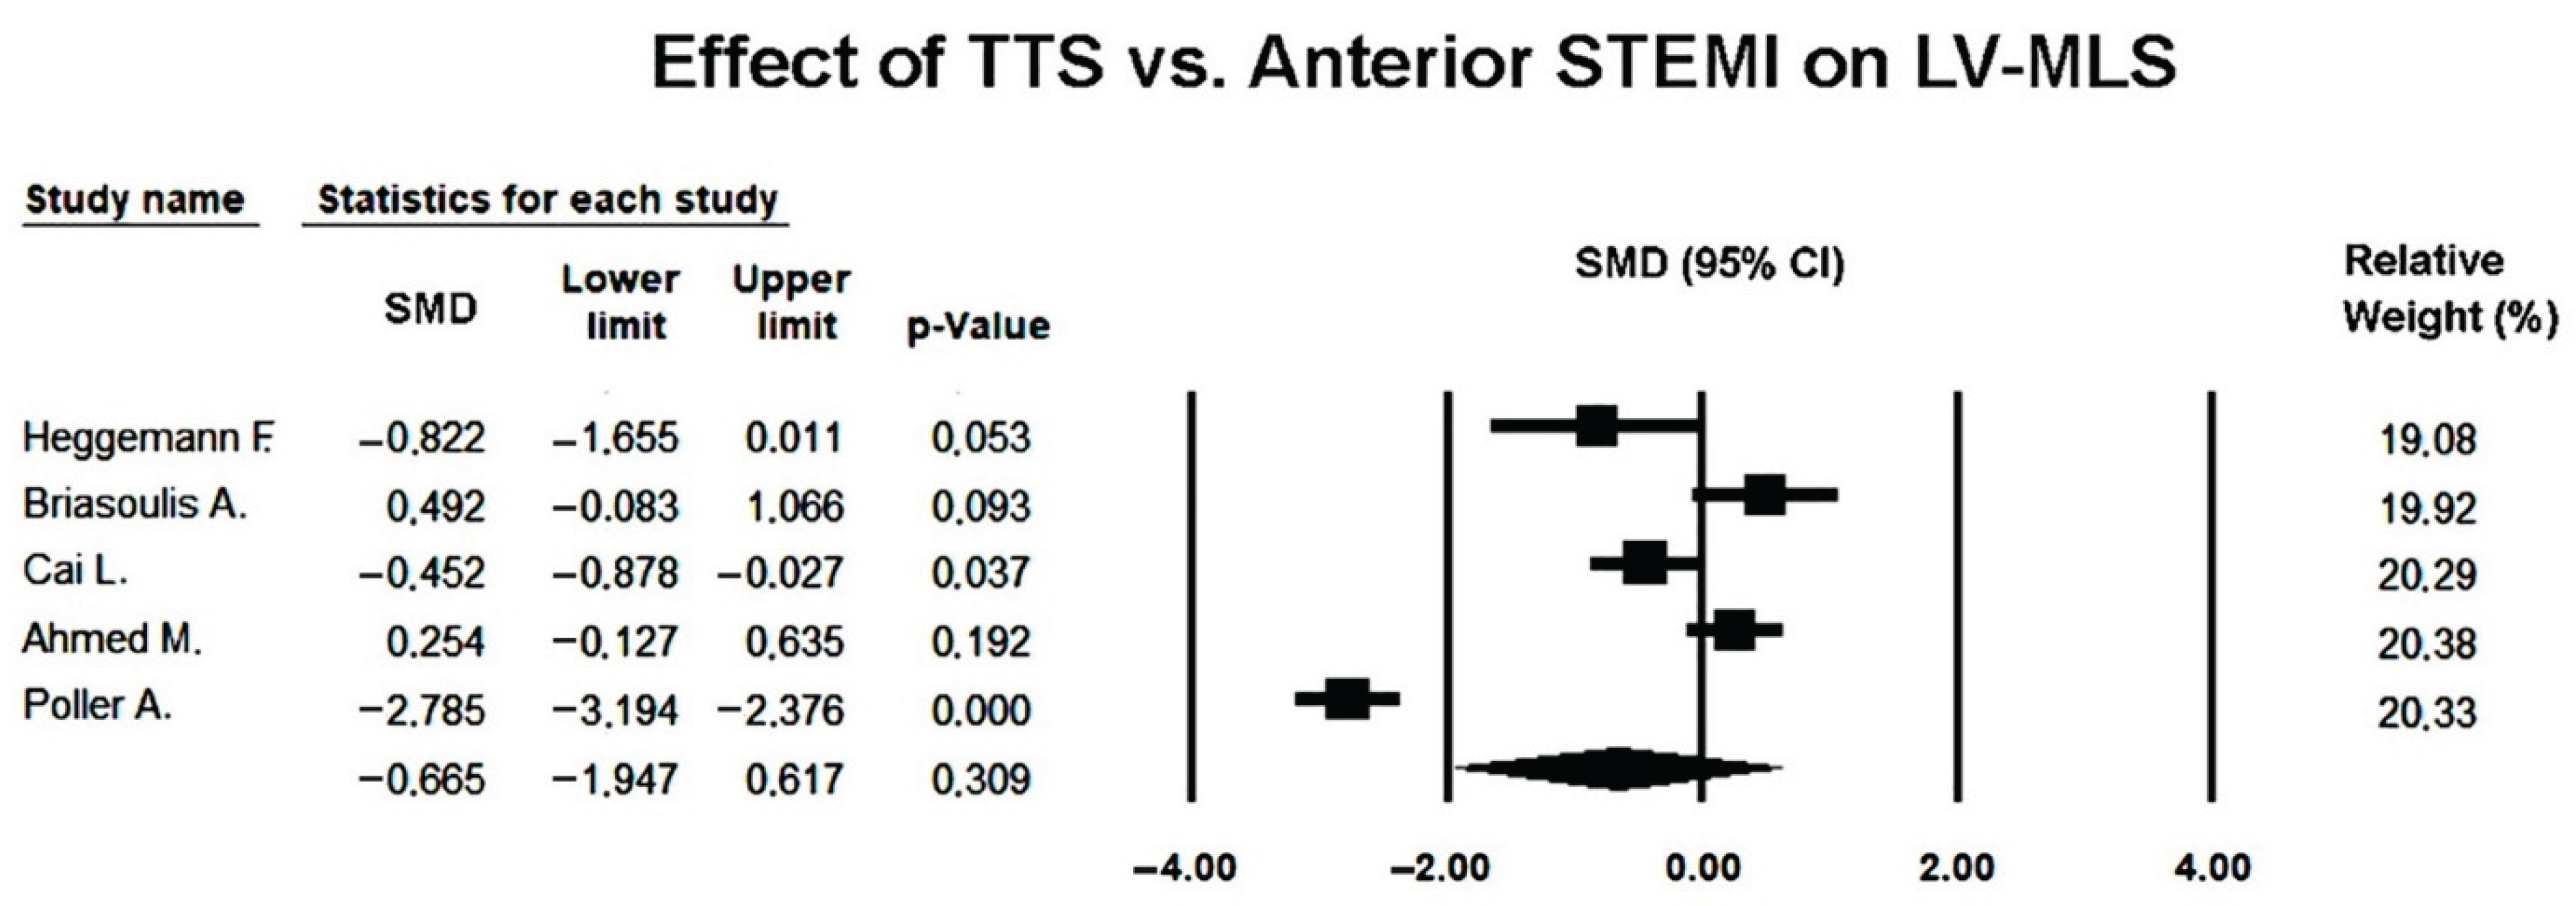
Under the random-effects model, the pooled SMD was −0.665 (95% CI −1.947 to 0.617; p = 0.309), indicating no statistically significant difference in mid-ventricular strain between TTS and anterior STEMI during the acute phase (
Figure 8).
Although individual studies generally reported lower strain values in TTS, the high degree of heterogeneity suggests that methodological variability (differences in imaging timing, speckle-tracking software, and regional analysis criteria) influenced the consistency of results.
The forest plot demonstrated a predominance of studies favoring greater impairment in TTS, though the magnitude and direction of effects varied widely. Two studies [
25,
27] showed larger negative differences, thereby contributing substantially to the observed heterogeneity.
Visual inspection of the funnel plot revealed no marked asymmetry (
Figure 9), and Egger’s regression test confirmed the absence of publication bias (intercept = 2.66 ± 12.36; t(3) = 0.22; two-tailed p = 0.84). Therefore, the variability among studies is more likely attributable to methodological and population differences rather than selective reporting.
Overall, the random-effects analysis indicates that mid-ventricular strain tends to be more impaired in TTS compared with anterior STEMI, but this difference did not reach statistical significance once inter-study heterogeneity was accounted for, and no publication bias was detected.
Sensitivity analyses using a leave-one-out approach showed that the direction of effect remained stable across all iterations (SMD range −0.231 to −0.085; p-value range = 0.533–0.844), indicating a persistent but non-significant trend toward more impaired mid-ventricular strain in TTS. None of the exclusions materially altered the pooled estimate, confirming that the overall non-significant difference in MLS was robust to individual study removal.
3.9. Effect of Takotsubo Syndrome versus Anterior STEMI on LV-BLS
Six studies [
22,
23,
24,
25,
26,
27] evaluating BLS in patients with TTS and anterior STEMI were included in the quantitative synthesis. Owing to substantial heterogeneity among studies (
Q = 166.7,
p < 0.001;
I² = 97.0%;
τ² = 2.13), a random-effects model was used.
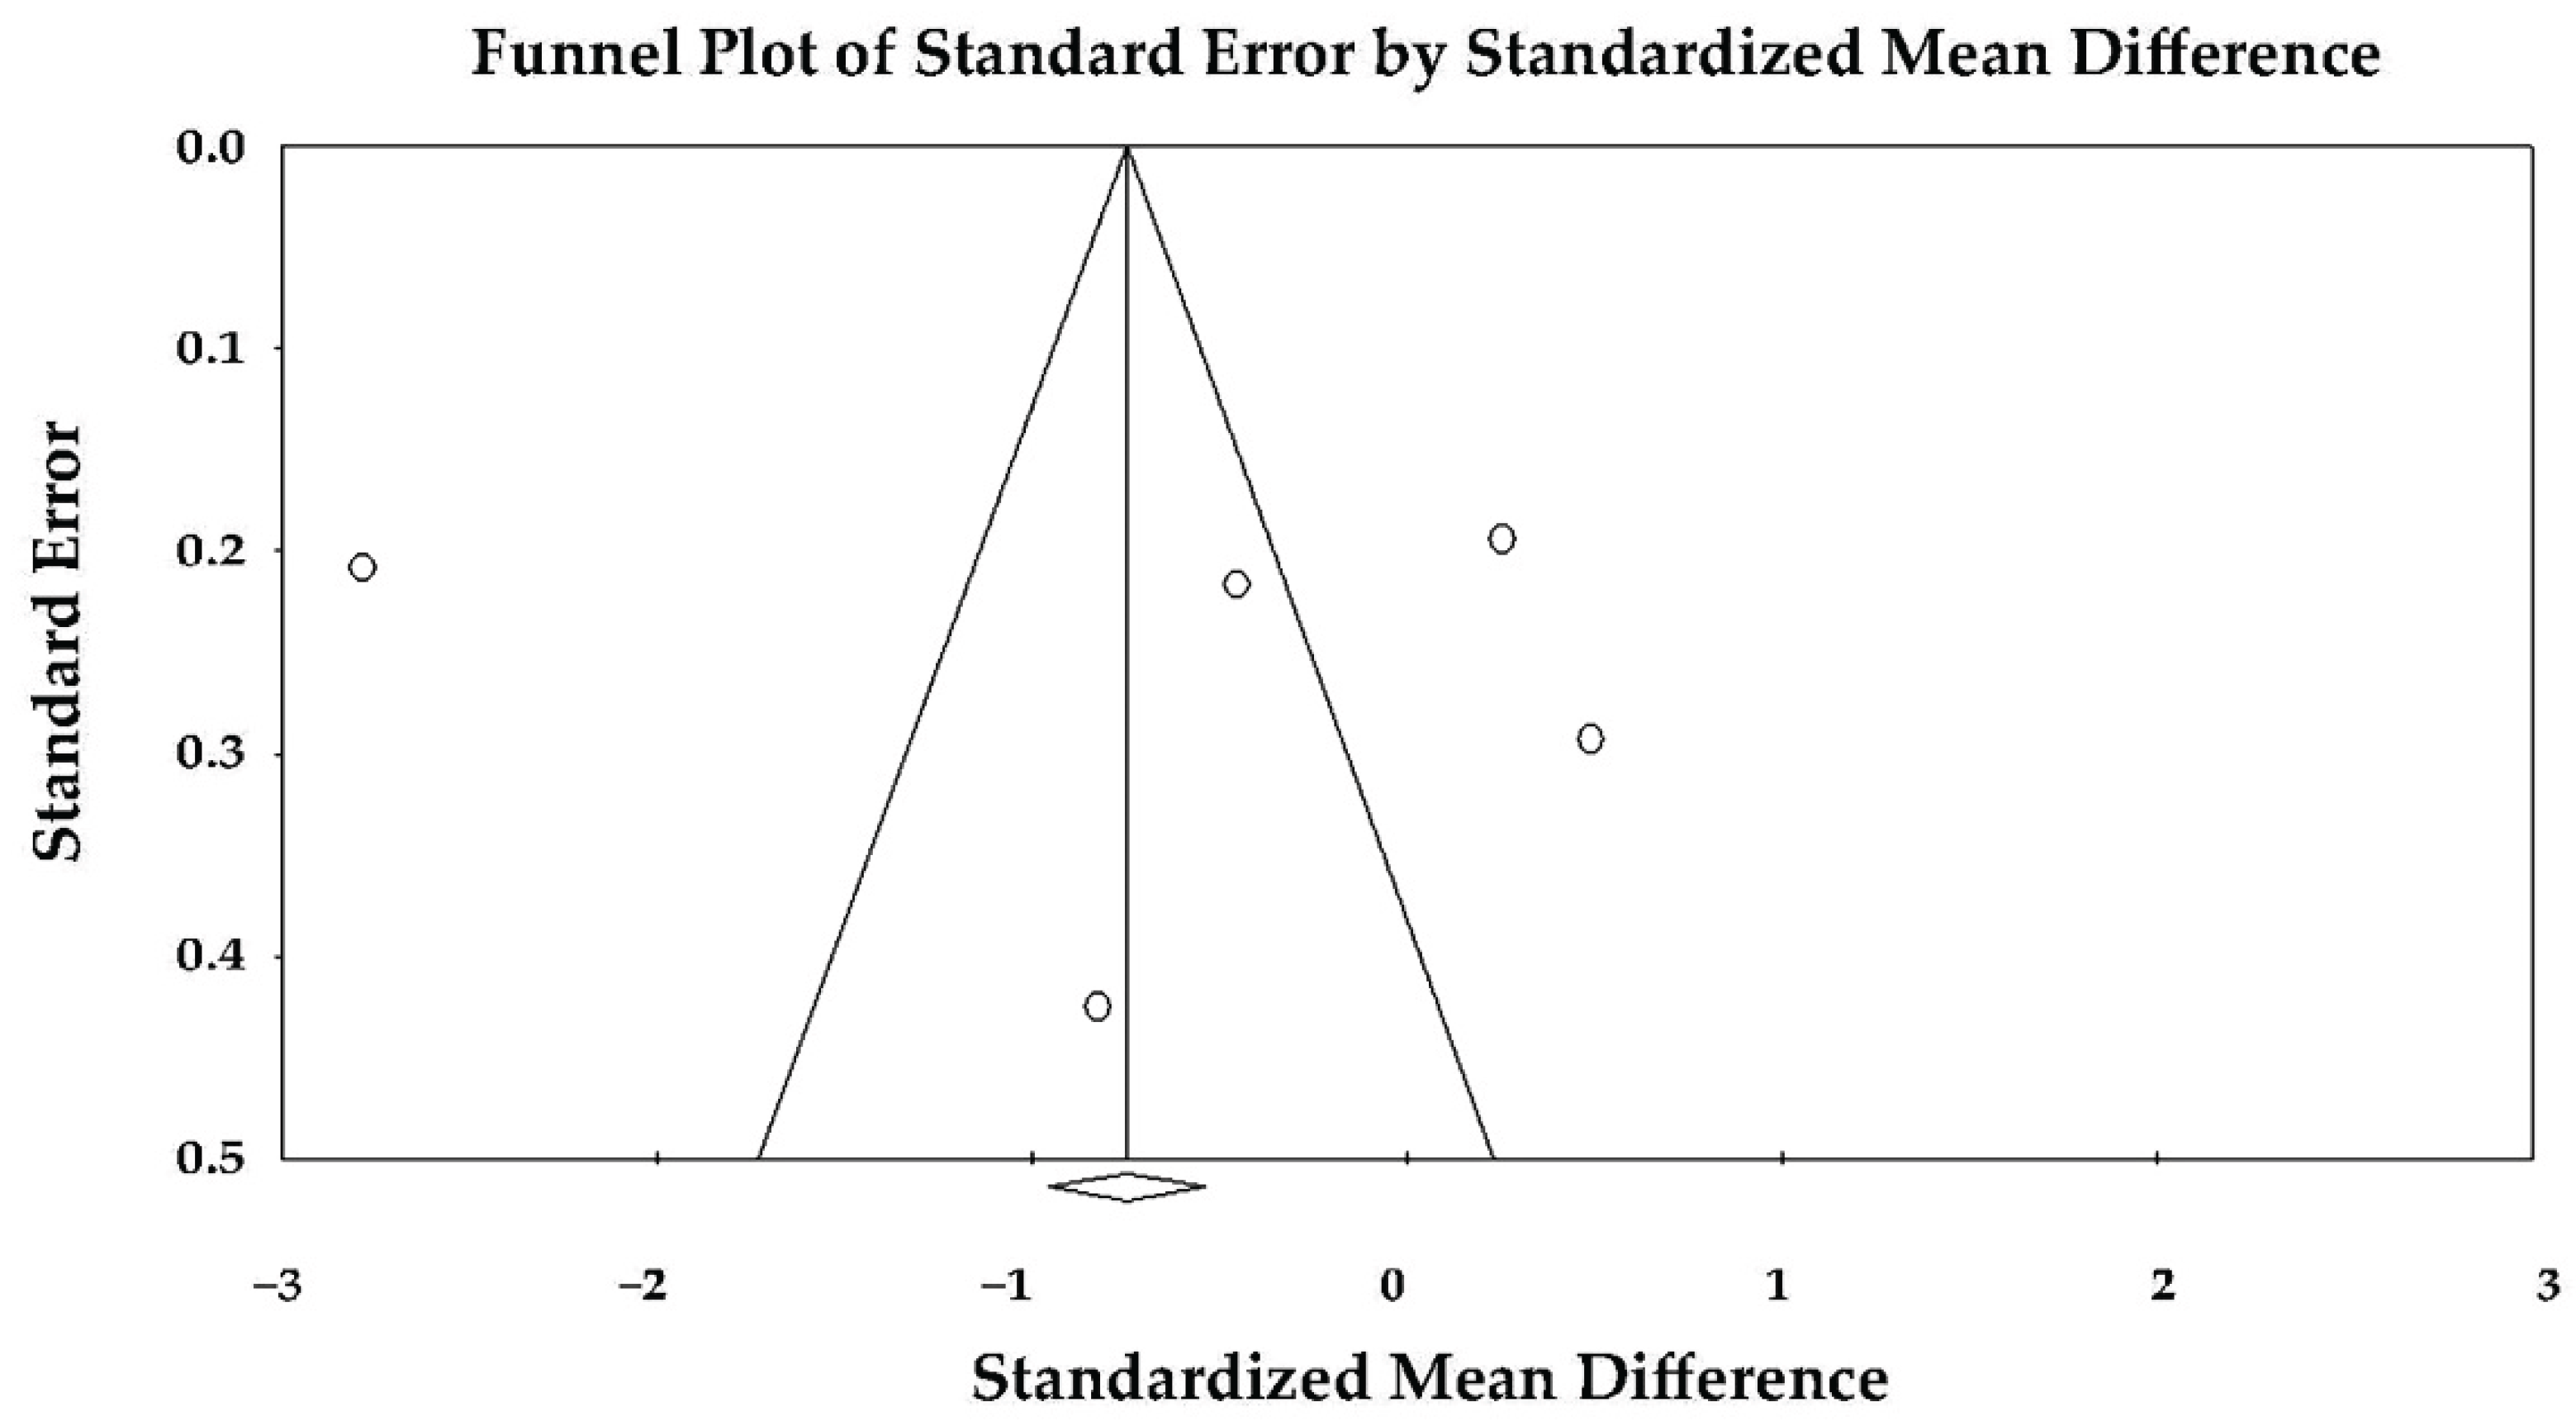
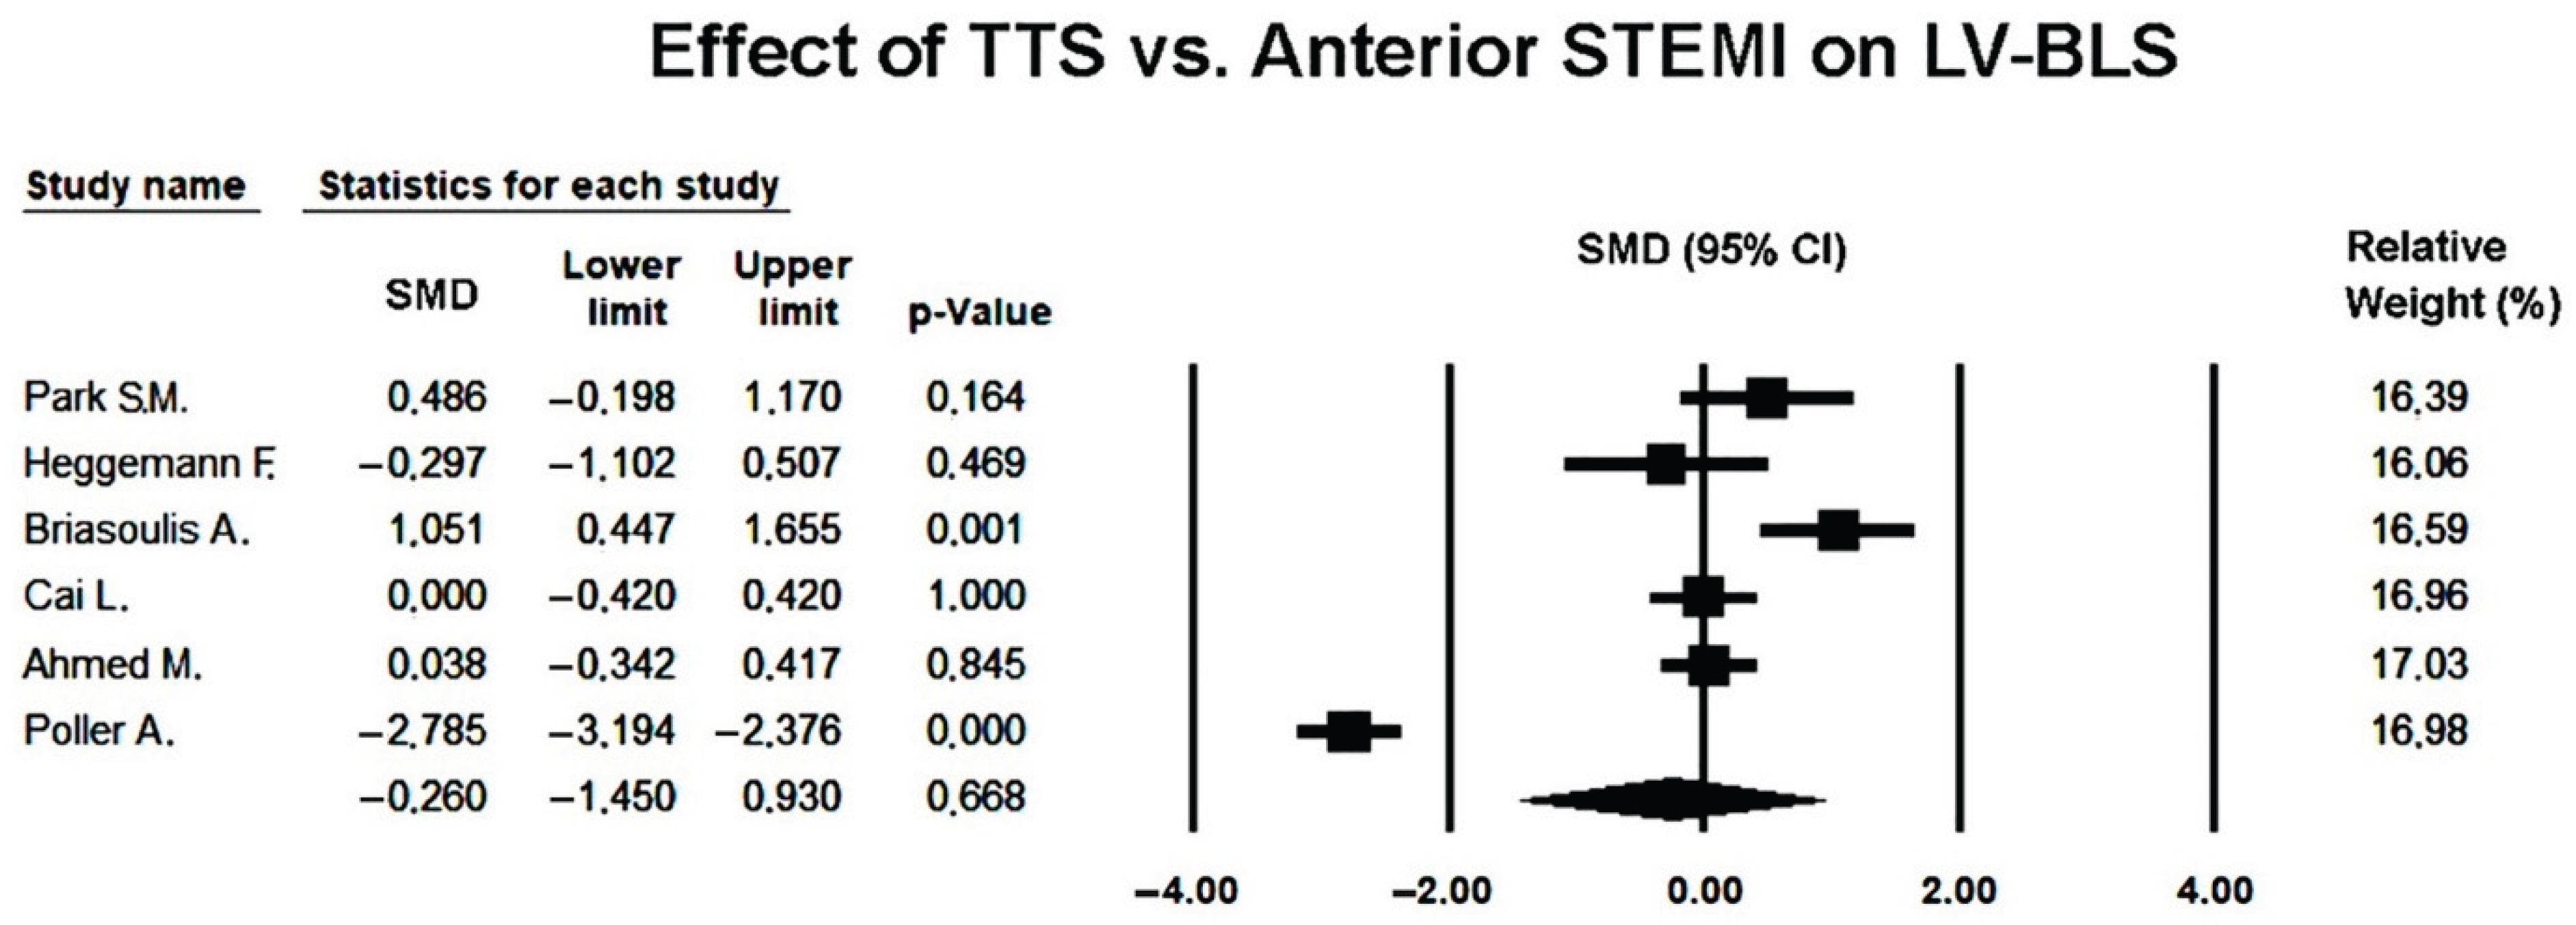
The pooled SMD under the random-effects model was −0.260 (95% CI −1.450 to 0.930;
p = 0.668), indicating no statistically significant difference in basal strain between TTS and anterior STEMI during the acute phase (
Figure 10).
Although several studies showed numerically less impaired basal strain in TTS, the overall effect was inconsistent across studies and highly variable.
The forest plot demonstrated wide confidence intervals and opposing effect directions, reflecting pronounced heterogeneity. This variability is likely attributable to differences in echocardiographic timing, image quality, and analytic methodology among the included studies.
The funnel plot appeared symmetric (
Figure 11), and Egger’s regression test did not indicate publication bias (intercept = 7.05 ± 9.41;
t(4) = 0.75; two-tailed
p = 0.50), suggesting that small-study effects are unlikely to have influenced the pooled result.
Overall, the random-effects meta-analysis indicates that basal longitudinal strain is not significantly different between TTS and anterior STEMI, and that no evidence of publication bias was detected. The findings highlight the high degree of variability across studies and the need for standardized regional strain assessment protocols.
Sensitivity analyses using a leave-one-out approach demonstrated that the effect estimates remained consistently non-significant across all iterations (SMD range 0.124 to 0.451; p-value range = 0.234–0.751), indicating that no single study materially influenced the pooled result and that the overall non-significant difference in BLS between TTS and anterior STEMI was robust to the exclusion of individual datasets.
3.10. Effect of Takotsubo Syndrome versus Anterior STEMI on LV-GRS
Two studies [
23,
27] comparing LV-GRS between TTS and anterior STEMI were included in the quantitative synthesis. Since the heterogeneity was negligible (
Q = 0.76,
p = 0.38;
I² = 0%), both fixed- and random-effects models yielded identical results.
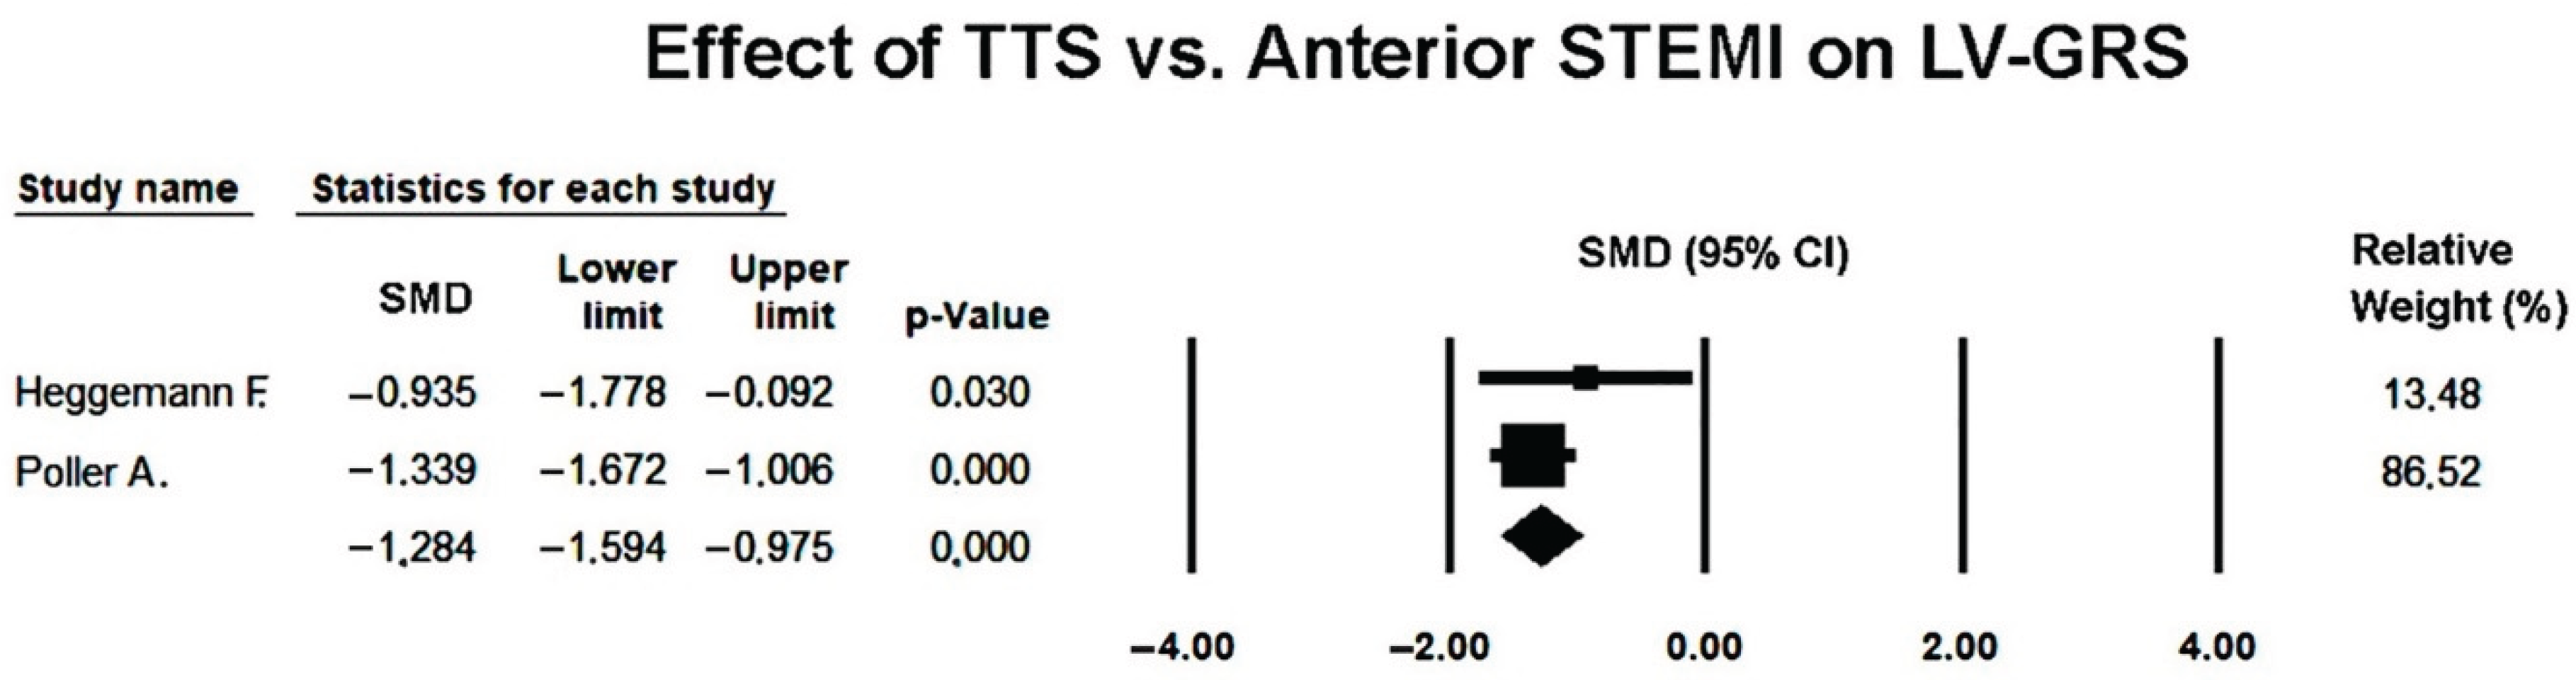
The pooled SMD was −1.284 (95% CI −1.594 to −0.975;
p < 0.001), indicating that GRS strain was significantly lower in TTS compared with anterior STEMI during the acute phase (
Figure 12).
This finding reflects more severe impairment of radial contractility in TTS, consistent with the extensive circumferential involvement of myocardial segments typical of stress-induced cardiomyopathy.
The forest plot demonstrated a consistent direction of effect across both studies, with non-overlapping confidence intervals indicating strong agreement. The relative contribution of Poller et al. [
27] was higher due to its larger sample size and smaller variance.
Because of the limited number of included studies, publication bias could not be formally assessed, but the lack of heterogeneity and consistency in the observed effects support the robustness of the pooled estimate.
Overall, this analysis indicates that patients with TTS exhibit significantly lower LV global radial strain than those with anterior STEMI, suggesting greater global impairment of radial myocardial deformation in the acute phase of TTS.
3.11. Publication Bias Assessment
Inter-rater reliability for the risk-of-bias assessment, quantified using Cohen’s kappa coefficient, demonstrated substantial agreement between reviewers (κ = 0.80).
Across the six included studies, overall methodological quality was predominantly fair, with one study rated as good according to the NIH Quality Assessment Tool for Case–Control Studies (Supplementary Material 3).
Although research objectives and case/control definitions were generally well described and imaging protocols were applied consistently, recurrent limitations included the absence of sample size justification, lack of assessor blinding, and limited adjustment for confounding variables. These weaknesses affect internal validity but do not suggest systematic bias in effect direction. In line with this, visual inspection of funnel plots and Egger’s regression testing revealed no significant small-study effects for GLS, ALS, MLS, or BLS, and no evidence of publication bias for LVEF. Overall, the heterogeneity observed across studies is more plausibly explained by methodological variation than by selective reporting.
4. Discussion
4.1. Main Findings
The present meta-analysis represents, to our knowledge, the most comprehensive quantitative synthesis to date comparing LV mechanics and conventional echocardiographic characteristics between TTS and anterior STEMI due to LAD artery occlusion. Six observational studies, conducted across South Korea, Germany, the United States, and Sweden, were included, comprising 221 patients with TTS and 290 with anterior STEMI. All studies assessed LV function using 2D-STE in the acute phase, adhering to Mayo Clinic or ESC diagnostic criteria for TTS and angiographically confirmed LAD occlusion for STEMI. By pooling these data, our analysis provides an integrated comparison of global, regional, and radial deformation patterns between the two conditions.
Clinically, patients with TTS were older, predominantly female, and had a lower prevalence of traditional cardiovascular risk factors compared with those with anterior STEMI, consistent with the well-recognized epidemiological differences between TTS and ischemic myocardial infarction.
Hemodynamically, TTS was associated with higher admission heart rates and lower systolic blood pressure, consistent with an acute stress response rather than ischemic pump failure. Despite overlapping clinical presentation, ST-segment elevation was present in nearly all STEMI cases but only in about half of TTS patients. The magnitude of myocardial injury, reflected by peak troponin I levels, was profoundly lower in TTS, confirming the absence of significant myonecrosis in stress-induced cardiomyopathy. Moreover, physical or emotional stressors were identified as precipitating factors in over 75% of TTS cases, highlighting the psychosomatic dimension of the disorder. This constellation of clinical findings aligns with the concept that TTS represents a neurohormonal storm rather than a primary vascular occlusion.
From a conventional echocardiographic perspective, TTS patients demonstrated significantly lower LVEF compared with anterior STEMI, indicating more severe acute systolic dysfunction despite the absence of obstructive coronary disease. LV dimensions and volumes were largely comparable between groups, suggesting that the reduced ejection fraction in TTS reflects diffuse myocardial stunning rather than geometric remodeling. The interventricular septum was slightly thinner in TTS, consistent with the typically non-hypertrophic phenotype of these patients. Importantly, the observation of more depressed LVEF in TTS supports the usefulness of conventional transthoracic echocardiography as an early discriminative tool, helping clinicians suspect stress-induced cardiomyopathy even before advanced imaging is available.
Quantitative strain analysis provided deeper mechanistic insight. GLS was significantly lower in TTS compared with anterior STEMI, indicating more severe diffuse longitudinal dysfunction. ALS was markedly reduced in TTS, while MLS and BLS showed smaller yet significant differences. This apex-to-base gradient reproduces the classical “apical ballooning” pattern characteristic of TTS. Conversely, GRS was also lower in TTS, reflecting impaired radial thickening consistent with diffuse myocardial stunning. These strain abnormalities, extending beyond a single coronary territory, further distinguish TTS from an LAD-mediated infarction pattern.
Collectively, these multi-parametric findings delineate a distinct and internally coherent mechanical signature for TTS: profound yet reversible global systolic impairment, with marked involvement of subendocardial longitudinal fibers, superimposed on relatively preserved geometry and disproportionately modest biomarker elevation. This contrasts sharply with anterior STEMI, in which systolic impairment is regional, irreversible, and confined to the LAD territory. The integrated analysis of clinical, conventional echocardiographic, and deformation parameters underscores the unique pathophysiological substrate of TTS—a syndrome driven by transient catecholamine-mediated myocardial dysfunction rather than ischemic necrosis—and supports the incremental diagnostic value of strain imaging in differentiating the two conditions.
4.2. Pathophysiological Mechanisms of LVEF and GLS Impairment in TTS vs. STEMI
Although TTS and anterior STEMI share similar acute LV systolic dysfunction, the underlying mechanisms of GLS impairment differ profoundly. In STEMI, GLS reduction primarily reflects irreversible ischemic necrosis within the LAD coronary artery territory, resulting in loss of contractile tissue, replacement fibrosis, and persistent mechanical dyssynchrony. Conversely, in TTS, GLS impairment occurs in the absence of obstructive coronary artery disease and is largely reversible, representing a functional rather than structural myocardial injury [
4,
8].
Catecholamine-mediated myocardial stunning remains the dominant hypothesis: excessive β-adrenergic stimulation during emotional or physical stress produces intracellular calcium overload, oxidative stress, and microvascular dysfunction, leading to transient myocyte injury and reduced contractile reserve [
7,
28].
Speckle-tracking echocardiography has revealed a characteristic apical-to-basal gradient of strain reduction in TTS, consistent with regional differences in sympathetic innervation density and β-adrenoceptor distribution [
29]. The apical myocardium exhibits higher β₂-receptor density and thinner wall-stress tolerance, predisposing it to greater catecholamine-induced stunning, while the basal segments—rich in β₁-receptors—may develop compensatory hypercontractility [
30]. The net effect is a “functional decoupling” between apical and basal mechanics, producing the classical ballooning pattern and depressed global strain values. In contrast, GLS impairment in anterior STEMI is geographically confined to the LAD perfusion zone, with preserved strain in remote territories.
Importantly, the mechanisms governing LVEF impairment differ between the two entities. In TTS, LVEF is often more severely depressed because systolic dysfunction is diffuse and involves multiple contiguous myocardial regions beyond a single coronary territory. By contrast, in anterior STEMI, LVEF reduction reflects the extent of irreversible necrosis within the LAD territory, yet global pump function is partially preserved through compensatory hyperkinesia of non-ischemic or remote LV segments. This “recruitment” of viable myocardium—mediated by increased adrenergic drive, enhanced regional perfusion, and augmented contractile performance in territories unaffected by ischemia—can mitigate the reduction in overall stroke volume despite substantial regional akinesia [
31,
32]. Such compensatory remodeling, consistently demonstrated by imaging studies linking remote hyperkinesis with preserved perfusion, is well-described in acute infarction physiology and may explain why, in the present meta-analysis, LVEF was paradoxically less reduced in STEMI compared with the more globally affected TTS phenotype.
Microvascular dysfunction contributes differently to both entities. In STEMI, no-reflow phenomena and microembolization exacerbate infarct expansion and limit recovery despite revascularization. In TTS, reversible microcirculatory spasm and endothelial dysfunction lead to patchy, non-territorial hypoperfusion that parallels the distribution of strain abnormalities [
33]; similarly, other reviews highlight direct catecholamine toxicity causing contraction-band necrosis and transient myocytolysis, explaining the disproportion between marked functional impairment and modest troponin elevation [
34,
35].
The temporal dynamics of GLS recovery further distinguish TTS from STEMI. Serial imaging studies demonstrate rapid normalization of GLS within weeks in TTS, reflecting restoration of calcium handling and microvascular tone [
36], whereas STEMI patients exhibit slower and often incomplete recovery due to irreversible tissue loss. Collectively, these findings suggest that GLS impairment in TTS arises from transient, diffuse myocardial stunning driven by catecholaminergic and microvascular mechanisms, whereas in STEMI it represents fixed regional loss of contractility from ischemic necrosis. Similarly, the mechanisms of LVEF impairment diverge: diffuse, transient contractile depression in TTS versus regional, partially compensated dysfunction in STEMI. The contrasting pathophysiology underscores why both syndromes may exhibit similar degrees of systolic dysfunction acutely but diverge profoundly in recovery potential and long-term prognosis. In this context, the nature of the triggering event emerges as a relevant modifier of myocardial response in TTS. In our pooled cohort, emotional triggers (36.8%) and physical triggers (41.4%) were similarly represented; however, recent evidence demonstrates that trigger patterns differ markedly according to age. Studies in octogenarians and nonagenarians show that physical stressors—such as acute illness, surgery, or frailty-related physiological perturbations—predominate overwhelmingly in older adults, whereas emotional triggers are more frequent in younger or middle-aged women [
37,
38,
39]. Large registry data further confirm that advancing age is independently associated with a shift toward physical precipitants and a more severe acute clinical profile, including higher rates of cardiogenic shock and complications [
40]. These observations suggest that the myocardial susceptibility to catecholamine surges in elderly patients is more often elicited by systemic physiologic stress rather than emotional stimuli, providing additional insight into the heterogeneous presentations and mechanical phenotype of TTS across the lifespan.
4.3. Implications for Clinical Practice
The integration of STE into the clinical assessment of acute LV dysfunction has major implications for the differential diagnosis and management of TTS and anterior STEMI. Although both conditions can present with comparable electrocardiographic and biomarker profiles, their therapeutic approaches and prognostic trajectories differ substantially. The present meta-analysis reinforces that TTS exhibits significantly lower LVEF and markedly reduced GRS compared with anterior STEMI, reflecting the diffuse nature of myocardial stunning in stress cardiomyopathy. Importantly, our results indicate that conventional TTE—particularly LVEF assessment—retains diagnostic value in the early evaluation of acute LV dysfunction. The observation that LVEF is often more profoundly reduced in TTS than in anterior STEMI, despite comparable clinical presentations, suggests that simple bedside echocardiography may aid the initial differentiation between the two entities before more advanced imaging becomes available.
Identifying specific patterns of GLS impairment can further assist clinicians in distinguishing TTS from ischemic injury at an early stage, particularly when coronary angiography is delayed or inconclusive. The typical apical-to-basal gradient of strain reduction, with relatively preserved basal contractility, provides a sensitive and reproducible imaging signature suggestive of TTS rather than LAD-related infarction. Moreover, STE enables a regional, segment-by-segment analysis of myocardial deformation that conventional LVEF cannot provide. In the context of anterior STEMI, STE highlights the territorial distribution of injury confined to the LAD watershed, while in TTS it reveals diffuse involvement extending beyond a single vascular territory. This capacity for regional mapping of myocardial mechanics represents a crucial complement to conventional echocardiography and significantly enhances diagnostic accuracy.
Beyond diagnostic value, GLS quantification offers incremental prognostic information in both entities. In STEMI, impaired GLS is a validated predictor of adverse remodeling, arrhythmias, and heart failure [
41], whereas in TTS, early GLS measurement may help identify patients at higher risk of cardiogenic shock, LV thrombus formation, or delayed recovery [
42,
43]. Incorporating STE into the acute diagnostic pathway therefore facilitates individualized monitoring and may optimize the timing of follow-up imaging [
44]. In TTS, GLS normalization during recovery can confirm functional recovery and guide de-escalation of therapy, while persistent strain abnormalities may prompt investigation for alternative or concomitant cardiomyopathies.
Moreover, awareness of the distinct pathophysiological basis of GLS impairment has therapeutic relevance. Unlike STEMI, where myocardial necrosis demands prompt reperfusion and secondary prevention, TTS primarily requires hemodynamic stabilization, avoidance of excessive catecholamine exposure, and management of LV outflow obstruction. Understanding that strain abnormalities in TTS—including depressed GRS and a characteristic apex-to-base gradient—largely reflect reversible myocardial stunning rather than infarction may prevent unnecessary invasive procedures and allow more tailored supportive strategies.
Finally, as GLS becomes increasingly integrated into risk stratification models, standardized acquisition protocols, vendor-independent strain analysis, and systematic reporting of reproducibility metrics are essential to ensure consistency across centers. The use of GLS in differentiating, monitoring, and prognosticating TTS and STEMI underscores its emerging role as a core component of precision echocardiography in contemporary cardiology.
4.4. Limitations of the Included Studies
Several methodological and technical limitations should be acknowledged when interpreting the findings of this meta-analysis. Most included studies were small, single-center investigations with retrospective or observational designs, which may introduce selection and reporting bias. Diagnostic criteria for TTS and anterior STEMI were not fully uniform across studies, and the timing of echocardiographic acquisition varied considerably—from within the first 24 hours to several days after symptom onset—likely contributing to the substantial heterogeneity observed across all strain parameters (I² often >90%).
From a technical standpoint, STE has recognized limitations. Inter-vendor variability remains substantial, as platforms such as GE EchoPAC, TomTec, and Philips QLAB use different proprietary algorithms for speckle tracking and strain computation, influencing absolute GLS values and regional strain patterns [
45]. Image quality, frame-rate settings, and region-of-interest placement also introduce variability, and STE measurements are sensitive to loading conditions, such as preload and afterload fluctuations, which may transiently alter myocardial deformation [
46]. Extrinsic mechanical factors—including chest wall deformities, hyperinflated lungs, or suboptimal acoustic windows—may further impair tracking accuracy and reproducibility [
47]. Notably, few studies reported intra- or inter-observer reproducibility metrics, limiting assessment of measurement reliability.
Several studies lacked blinded image interpretation and did not adjust for key confounders such as age, sex, cardiovascular risk factors, or hemodynamic status. The absence of such adjustments likely contributed to unexplained between-study heterogeneity, as confirmed by meta-regression analyses showing that standard clinical variables did not account for variability in LVEF or GLS effect sizes. Additionally, most studies did not provide longitudinal follow-up, preventing characterization of recovery patterns or long-term prognostic implications.
Finally, although funnel plots and Egger’s testing did not indicate statistically significant publication bias for most parameters, the predominance of small observational studies means that selective publication of negative or neutral findings cannot be fully excluded. These methodological and technical constraints collectively limit the precision of pooled estimates and highlight the need for larger, well-designed prospective studies with standardized strain protocols.
Figure 1.
PRISMA flow diagram of study selection for the systematic review.
Figure 1.
PRISMA flow diagram of study selection for the systematic review.
Figure 2.
Forest plot showing the effect of TTS vs. anterior STEMI on LVEF [
22,
23,
24,
25,
26,
27]. LVEF, left ventricular ejection fraction; STEMI, ST-elevation myocardial infarction; TTS, takotsubo syndrome.
Figure 2.
Forest plot showing the effect of TTS vs. anterior STEMI on LVEF [
22,
23,
24,
25,
26,
27]. LVEF, left ventricular ejection fraction; STEMI, ST-elevation myocardial infarction; TTS, takotsubo syndrome.
Figure 3.
Begg’s funnel plot used to assess publication bias in studies examining the impact of TTS compared with anterior STEMI on LVEF. LVEF, left ventricular ejection fraction; STEMI, ST-elevation myocardial infarction; TTS, takotsubo syndrome.
Figure 3.
Begg’s funnel plot used to assess publication bias in studies examining the impact of TTS compared with anterior STEMI on LVEF. LVEF, left ventricular ejection fraction; STEMI, ST-elevation myocardial infarction; TTS, takotsubo syndrome.
Figure 4.
Forest plot illustrating the effect of TTS vs. anterior STEMI on LV-GLS [
22,
23,
24,
25,
26,
27]. LV-GLS, left ventricular global longitudinal strain; STEMI, ST-elevation myocardial infarction; TTS, takotsubo syndrome.
Figure 4.
Forest plot illustrating the effect of TTS vs. anterior STEMI on LV-GLS [
22,
23,
24,
25,
26,
27]. LV-GLS, left ventricular global longitudinal strain; STEMI, ST-elevation myocardial infarction; TTS, takotsubo syndrome.
Figure 5.
Begg’s funnel plot illustrating the assessment of publication bias in studies investigating the effect of TTS versus anterior STEMI on LV-GLS. LV-GLS, left ventricular global longitudinal strain; STEMI, ST-elevation myocardial infarction; TTS, takotsubo syndrome.
Figure 5.
Begg’s funnel plot illustrating the assessment of publication bias in studies investigating the effect of TTS versus anterior STEMI on LV-GLS. LV-GLS, left ventricular global longitudinal strain; STEMI, ST-elevation myocardial infarction; TTS, takotsubo syndrome.
Figure 6.
Forest plot showing the effect of TTS vs. anterior STEMI on LV-ALS [
22,
23,
24,
25,
26,
27]. LV-ALS, left ventricular apical longitudinal strain; STEMI, ST-elevation myocardial infarction; TTS, takotsubo syndrome.
Figure 6.
Forest plot showing the effect of TTS vs. anterior STEMI on LV-ALS [
22,
23,
24,
25,
26,
27]. LV-ALS, left ventricular apical longitudinal strain; STEMI, ST-elevation myocardial infarction; TTS, takotsubo syndrome.
Figure 7.
Begg’s funnel plot for the assessment of publication bias in studies evaluating the effect of TTS versus anterior STEMI on LV-ALS. LV-ALS, left ventricular apical longitudinal strain; STEMI, ST-elevation myocardial infarction; TTS, takotsubo syndrome.
Figure 7.
Begg’s funnel plot for the assessment of publication bias in studies evaluating the effect of TTS versus anterior STEMI on LV-ALS. LV-ALS, left ventricular apical longitudinal strain; STEMI, ST-elevation myocardial infarction; TTS, takotsubo syndrome.
Figure 8.
Forest plot illustrating the effect of TTS vs. anterior STEMI on LV-MLS [
23,
24,
25,
26,
27]. LV-MLS, left ventricular mid-ventricular longitudinal strain; STEMI, ST-elevation myocardial infarction; TTS, takotsubo syndrome.
Figure 8.
Forest plot illustrating the effect of TTS vs. anterior STEMI on LV-MLS [
23,
24,
25,
26,
27]. LV-MLS, left ventricular mid-ventricular longitudinal strain; STEMI, ST-elevation myocardial infarction; TTS, takotsubo syndrome.
Figure 9.
Begg’s funnel plot illustrating the assessment of publication bias in studies examining the effect of TTS versus anterior STEMI on LV-MLS. LV-MLS, left ventricular mid-ventricular longitudinal strain; STEMI, ST-elevation myocardial infarction; TTS, takotsubo syndrome.
Figure 9.
Begg’s funnel plot illustrating the assessment of publication bias in studies examining the effect of TTS versus anterior STEMI on LV-MLS. LV-MLS, left ventricular mid-ventricular longitudinal strain; STEMI, ST-elevation myocardial infarction; TTS, takotsubo syndrome.
Figure 10.
Forest plot illustrating the effect of TTS vs. anterior STEMI on LV-BLS [
22,
23,
24,
25,
26,
27]. LV-BLS, left ventricular basal longitudinal strain; STEMI, ST-elevation myocardial infarction; TTS, takotsubo syndrome.
Figure 10.
Forest plot illustrating the effect of TTS vs. anterior STEMI on LV-BLS [
22,
23,
24,
25,
26,
27]. LV-BLS, left ventricular basal longitudinal strain; STEMI, ST-elevation myocardial infarction; TTS, takotsubo syndrome.
Figure 11.
Begg’s funnel plot used for the assessment of publication bias in studies evaluating the effect of TTS versus anterior STEMI on LV-BLS. LV-BLS, left ventricular basal longitudinal strain; STEMI, ST-elevation myocardial infarction; TTS, takotsubo syndrome.
Figure 11.
Begg’s funnel plot used for the assessment of publication bias in studies evaluating the effect of TTS versus anterior STEMI on LV-BLS. LV-BLS, left ventricular basal longitudinal strain; STEMI, ST-elevation myocardial infarction; TTS, takotsubo syndrome.
Figure 12.
Forest plot showing the effect of TTS vs. anterior STEMI on LV-GRS [
23,
27]. LV-GRS, left ventricular global radial strain; STEMI, ST-elevation myocardial infarction; TTS, takotsubo syndrome.
Figure 12.
Forest plot showing the effect of TTS vs. anterior STEMI on LV-GRS [
23,
27]. LV-GRS, left ventricular global radial strain; STEMI, ST-elevation myocardial infarction; TTS, takotsubo syndrome.
Table 1.
Summary of studies [
22,
23,
24,
25,
26,
27] comparing TTS effect on LV mechanics vs. anterior STEMI.
Table 1.
Summary of studies [
22,
23,
24,
25,
26,
27] comparing TTS effect on LV mechanics vs. anterior STEMI.
| Study name, year and country |
Design |
Size
(n) |
Mean age (yrs) |
Females (%) |
STE software |
Main findings in TTS vs anterior STEMI |
Park S.M. (2009),
S. Korea [22] |
Prosp. |
TTS = 13
STEMI = 24 |
TTS 70
STEMI = 67 |
TTS = 92
STEMI = 33 |
GE EchoPAC (Vivid 7) |
↓ LVEF; ↓ GLS;
↓ ALS; ↓ MLS; ↓ BLS |
| Heggemann F. (2011), Germany [23] |
Prosp. |
TTS = 12
STEMI = 12 |
TTS = 72
STEMI = 64 |
TTS = 83
STEMI = 25 |
TomTec 2D CPA |
↓ LVEF; ↓ GLS; ↓ ALS; ↓ MLS; ↓ BLS; ↓ GRS |
| Briasoulis A. (2016), USA [24] |
Retrosp. |
TTS = 24
STEMI = 24 |
TTS = 68
STEMI = 66 |
TTS = 96
STEMI = 41 |
Philips QLAB (iE33) |
↔ LVEF; ↔ GLS; ↑ BLS;
↔ ALS; ↔ MLS |
Cai L. (2017),
USA [25] |
Retrosp. |
TTS = 55
STEMI = 36 |
TTS = 69
STEMI = 64 |
TTS = 88
STEMI = 38 |
GE EchoPAC (Vivid E9) |
↔ LVEF; ↔ GLS; ↓ ALS;
↓ MLS; ↔ BLS |
Ahmed M. (2020),
USA [26] |
Retrosp. |
TTS = 60
STEMI = 48 |
TTS = 70
STEMI = 64 |
TTS = 89
STEMI = 42 |
GE EchoPAC (Vivid E9) |
↔ LVEF; ↔ GLS;
↑ ALS/MLS; ↓ BLS |
| Poller A. (2025), Sweden [27] |
Prosp. |
TTS = 57
STEMI = 146 |
TTS = 71
STEMI = 63 |
TTS = 91
STEMI = 39 |
TomTec Image Arena |
↓ LVEF; ↔ GLS; ↔ ALS;
↔ MLS; ↔ BLS; ↓ GRS |
Table 2.
Clinical characteristics of TTS and anterior STEMI cohorts assessed by the include studies.
Table 2.
Clinical characteristics of TTS and anterior STEMI cohorts assessed by the include studies.
| |
TTS
(n = 221) |
Anterior STEMI
(n = 290) |
P value |
| Demographics |
| Age (yrs) |
68.8 (62.9-73) |
63.1 (58-66.9) |
<0.001 |
| Females (%) |
91.4 (82-100) |
49.2 (28.1-100) |
<0.001 |
| Cardiovascular risk factors |
| Hypertension (%) |
52.8 (23-72) |
43.3 (33-58) |
0.04 |
| Diabetes (%) |
10.9 (0-23) |
20.8 (12.3-29) |
0.004 |
| Hypercholesterolemia (%) |
21.8 (17.5-25) |
41.4 (15.1-67) |
<0.001 |
| Smokers (%) |
18 (14-23) |
29.9 (21-42) |
0.003 |
| Hemodynamics |
| Heart rate (bpm) |
87.8 (82-94.3) |
83.1 (79.9-89.6) |
0.002 |
| SBP (mmHg) |
120.4 (98-132.3) |
129.1 (119-136.1) |
0.003 |
| ECG findings |
| ST elevation (%) |
48 (32-77) |
98 (92-100) |
<0.001 |
| Blood tests |
| Peak troponin I (µg/L) |
2.9 (2.3-3.3) |
62.2 (29-93.7) |
<0.001 |
| TTS trigger |
| Physical stress (%) |
41.4 (28.1-54) |
/ |
/ |
| Emotional stress (%) |
36.8 (17-47.3) |
/ |
/ |
Table 3.
Conventional echocardiographic parameters measured by the included studies in TTS and anterior STEMI groups.
Table 3.
Conventional echocardiographic parameters measured by the included studies in TTS and anterior STEMI groups.
| Conventional echocardiographic parameters |
Number of studies for parameters assessed
(n° pts in TTS vs STEMI) |
TTS |
Anterior STEMI |
P value |
| IVS thickness (mm) |
3 (94 vs. 194) |
9.4 (8.9–10.2) |
10 (9.5–10.3) |
0.03 |
| LV–EDD (mm) |
3 (141 vs. 218) |
46.8 (45–49.1) |
47.1 (45–50.7) |
0.44 |
| LV–ESD (mm) |
3 (141 vs. 218) |
33.3 (29–35.6) |
34.2 (32–36.3) |
0.29 |
| LV–EDVi (ml/m2) |
3 (130 vs. 218) |
62.5 (49.5–80) |
62.7 (45.2–90) |
0.96 |
| LV–ESVi (ml/m2) |
3 (130 vs. 218) |
36.9 (29.6–43) |
35.2 (26.2–51) |
0.61 |
| LVEF (%) |
6 (221 vs. 290) |
34.2 (25.4–39.7) |
41.6 (33.1–48.7) |
0.03 |
| E/A ratio |
2 (70 vs. 170) |
1.0 (0.7–1.3) |
1.15 (1–1.3) |
0.07 |
| E/e’ ratio |
3 (94 vs. 194) |
12.2 (11.4–13) |
12.3 (10.3–16.3) |
0.88 |
| LAVi (ml/m2) |
2 (70 vs. 170) |
30.8 (30.7–30.9) |
31.4 (31.2–31.7) |
0.05 |
| RVIT (mm) |
1 (55 vs. 36) |
37 (37–37) |
36 (36–36) |
0.41 |
| TAPSE (mm) |
1 (55 vs. 36) |
15 (15–15) |
20 (20–20) |
0.004 |
Table 4.
STE-derived myocardial strain parameters obtained by the included studies in TTS vs. anterior STEMI cohorts.
Table 4.
STE-derived myocardial strain parameters obtained by the included studies in TTS vs. anterior STEMI cohorts.
| STE variables |
Number of studies for parameters assessed (n° pts in TTS vs STEMI) |
TTS
|
Anterior STEMI
|
P value |
| LV–GLS (%) |
6 (221 vs. 290) |
–9.1 (–3.5,–13) |
–10.5 (–6.3,–13) |
0.01 |
| LV–ALS (%) |
6 (221 vs. 290) |
–4.4 (–0.5,–9.8) |
–6.4 (–3.4,–10) |
0.001 |
| LV–MLS (%) |
5 (208 vs. 266) |
–9.9 (–5.8,–13.4) |
–11.6 (–5.7,–17.4) |
0.006 |
| LV–BLS (%) |
6 (221 vs. 290) |
–14.2 (–11.4,–18.1) |
–14.2 (–7.3,–17.4) |
0.03 |
| LV–GRS (%) |
2 (69 vs. 158) |
15.7 (13.9,17.5) |
26.4 (23.8,29.1) |
<0.001 |
Table 5.
Meta-regression analysis performed to evaluate whether cardiovascular risk factors such as hypertension, diabetes, or age contributed to variability in LVEF effect sizes.
Table 5.
Meta-regression analysis performed to evaluate whether cardiovascular risk factors such as hypertension, diabetes, or age contributed to variability in LVEF effect sizes.
| Covariate |
Coefficient |
Standard error |
95% Lower |
95% Upper |
P-value |
| Intercept |
0.430 |
14.01 |
–27.02 |
27.883 |
0.975 |
| Mean age TTS (yrs) |
–0.086 |
0.191 |
–0.461 |
0.288 |
0.651 |
| %Hypertension TTS |
0.055 |
0.051 |
–0.046 |
0.155 |
0.286 |
| %Diabetes TTS |
0.133 |
0.120 |
–0.103 |
0.369 |
0.269 |
Table 6.
Meta-regression analysis performed to evaluate whether demographic or methodological factors—including age, sex distribution, and STE software vendor—modulated GLS outcomes.
Table 6.
Meta-regression analysis performed to evaluate whether demographic or methodological factors—including age, sex distribution, and STE software vendor—modulated GLS outcomes.
| Covariate |
Coefficient |
Standard error |
95% Lower |
95% Upper |
P-value |
| Intercept |
–0.394 |
18.24 |
–36.14 |
35.35 |
0.983 |
| Mean age TTS (yrs) |
0.011 |
0.240 |
–0.459 |
0.481 |
0.963 |
| %females TTS |
–0.015 |
0.088 |
–0.189 |
0.158 |
0.864 |
| Software: nonGE |
0.979 |
1.462 |
–1.886 |
3.844 |
0.503 |