Preprint
Article

This version is not peer-reviewed.

Interaction Between the Gut Microbiome, Genetic and Clinical Risk Factors for Metabolic Dysfunction‐Associated Steatotic Liver Disease (MASLD) in Patients with Type 2 Diabetes Mellitus from Different Geographical Regions of Argentina

Submitted:

17 November 2025

Posted:

18 November 2025

You are already at the latest version

Abstract

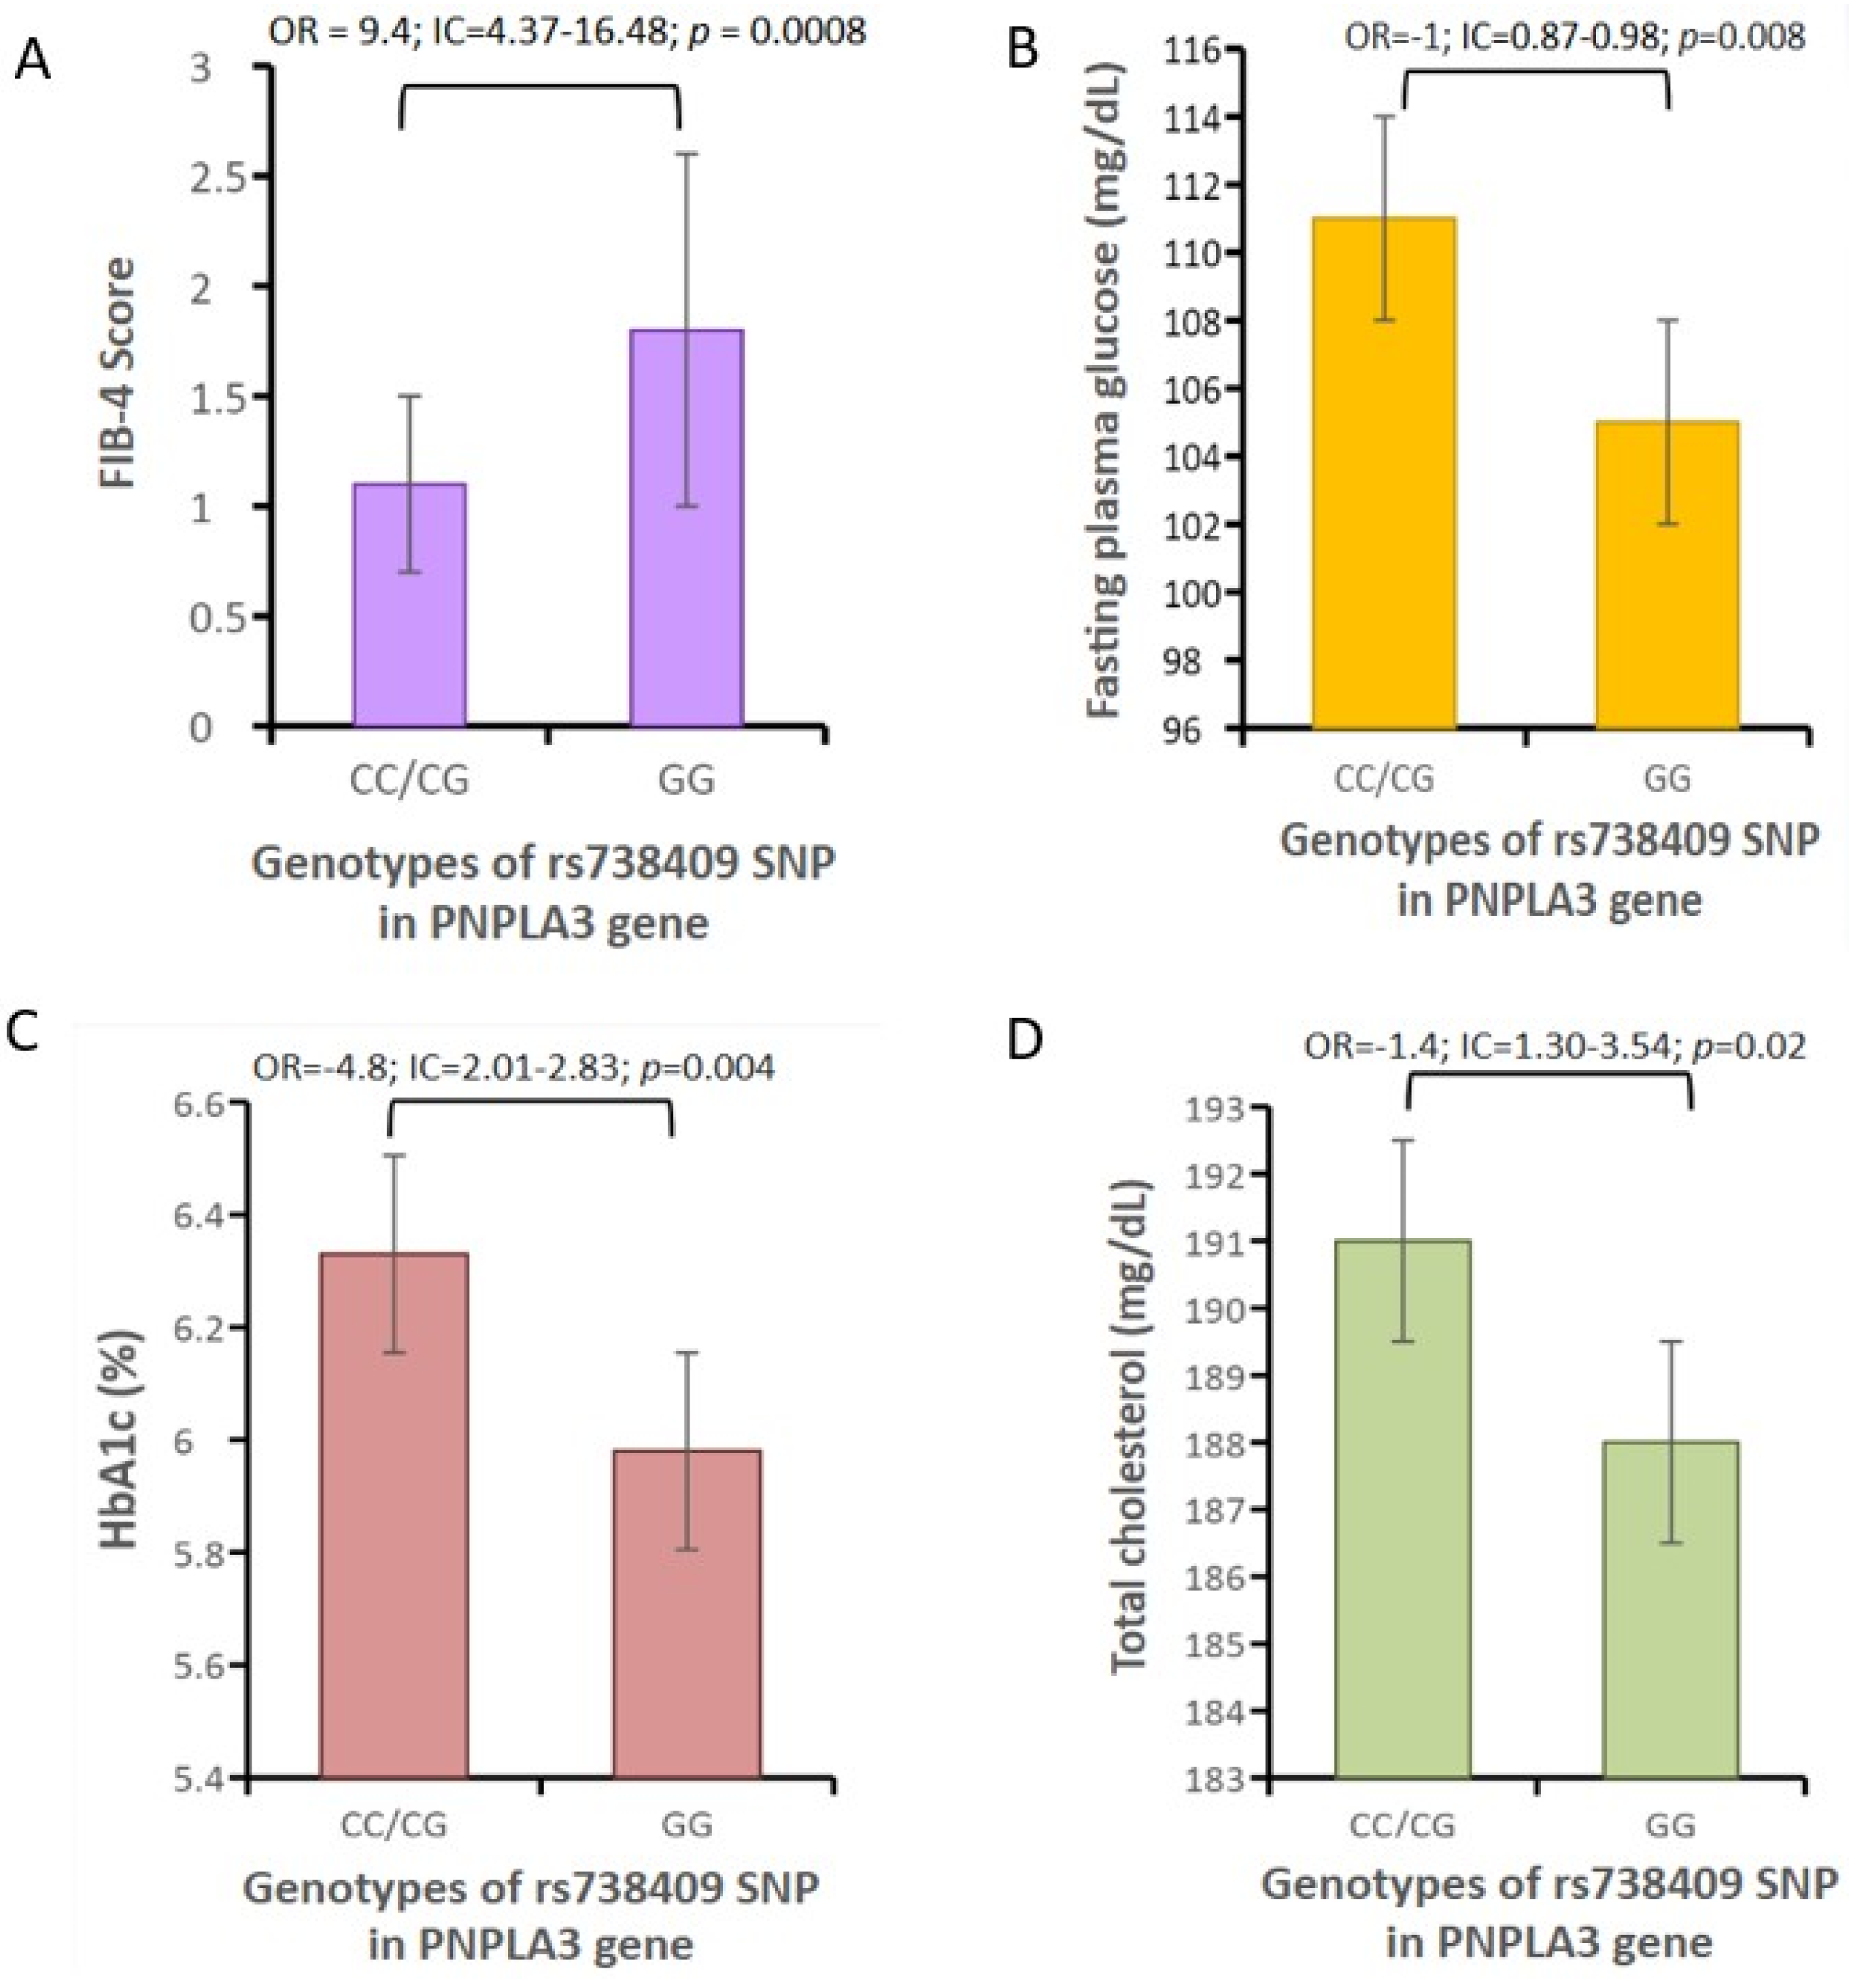
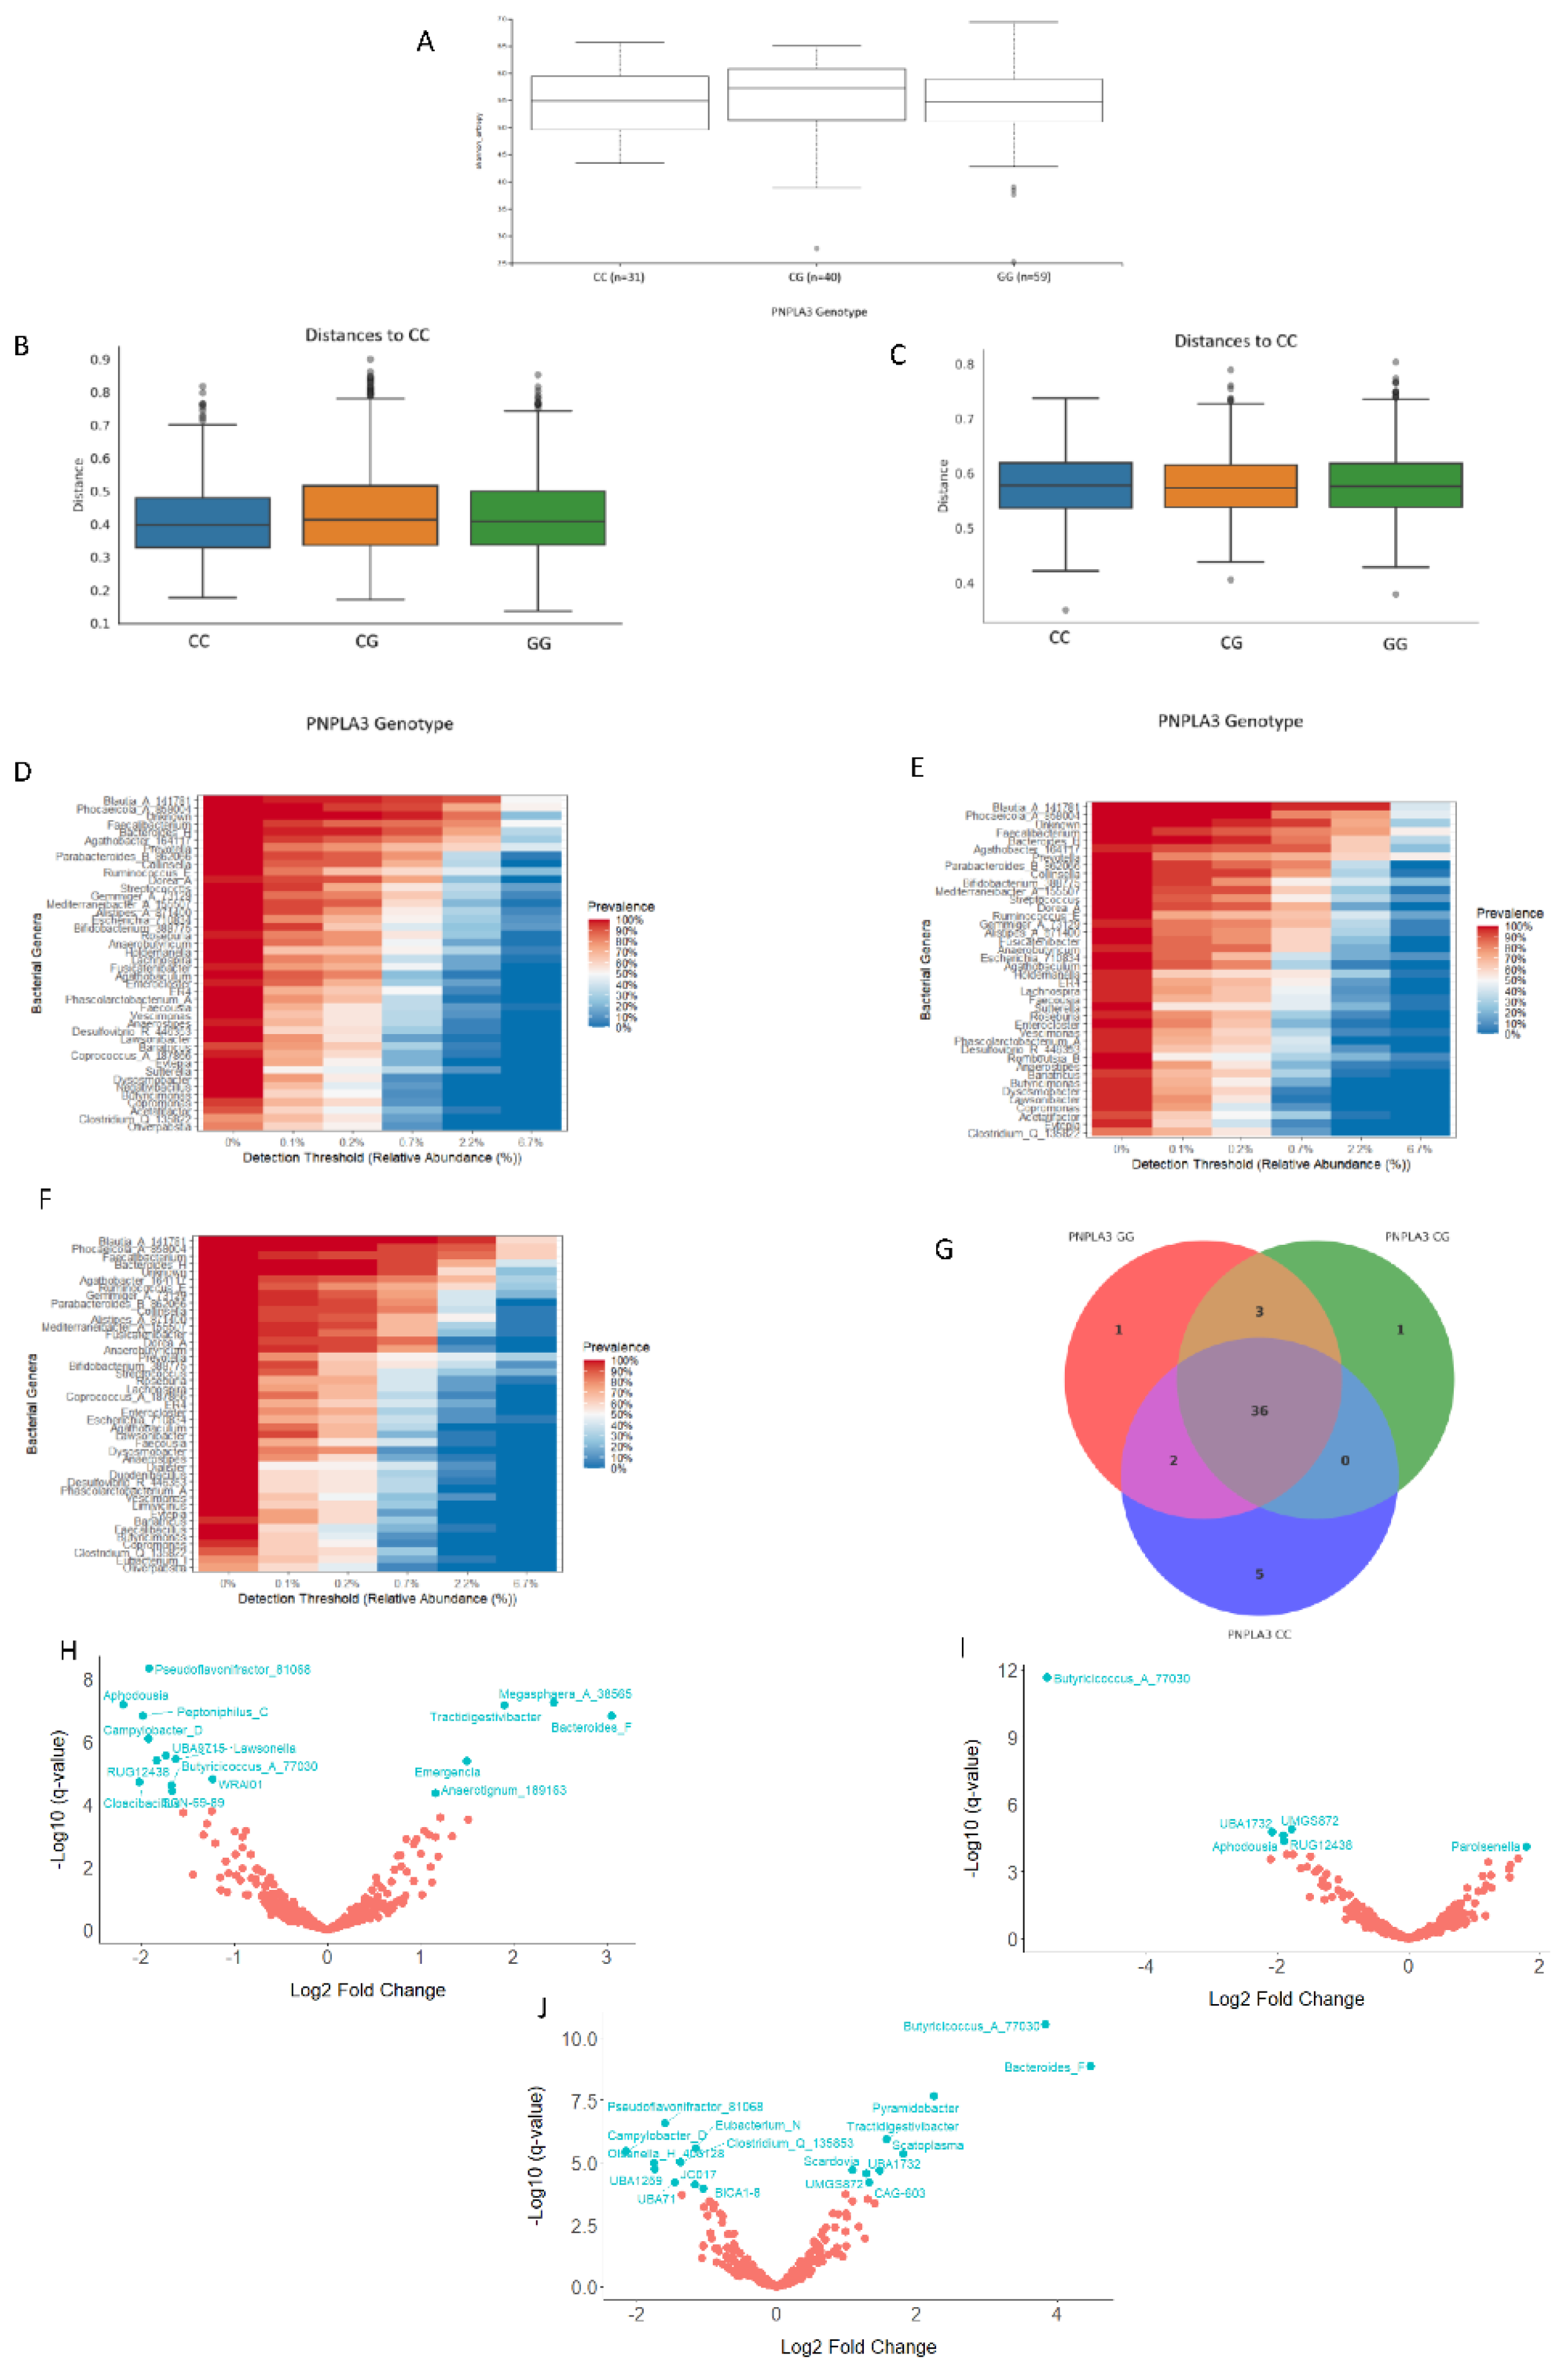
Background: Local specific biomarkers for MASLD risk stratification are urgently needed in Argentina. Aim: To characterized the interaction of gut microbiome signatures, genetic and clinical risk factors for MASLD in diabetics from different regions of Argentina. Material Methods: We recruited 214 diabetics from different regions. Anthropometric, clinical, and lifestyle data were obtained from all participants, who also underwent abdominal ultrasound for MASLD diagnosis and oral swabbing. PNPLA3 gene was amplified by PCR from the swabs, and rs738409 genotype was determined by bidirectional sequencing. To profile the MASLD-associated microbiome, stool was collected from 170 participants. V4 16S rRNA gene sequencing was performed and reads were analysed using QIIME2 2024.10.1. R Studio 2022.12.0 was used for statistical analyses. Results: MASLD prevalence was 77.9%, with similar rates in all regions. FIB-4 scores <1.3 and >2.67 were detected in 55.3% and 7.4% of patients, respectively. Half of diabetics had PNPLA3-GG genotype, with the highest rates in Northwestern Argentina (64.9%; p=0.02 vs Buenos Aires). PNPLA3-GG genotype was an independent risk factor for FIB-4 score (p=0.0008), and a protective factor against HbA1c (p=0.004), fasting plasma glucose (p=0.008), and cholesterol levels (p=0.02). Marked regional differences were observed in microbiota diversity and composition in Argentina. After adjusting for geographical region, Negativibacillus genus was exclusively detected in diabetics with MASLD and GG carriers. Catenibacterium genus was related to FIB-4>2.67. Short-chain fatty acids-producing bacteria were linked to absence of MASLD. Conclusions: These specific signatures could be potentially useful as MASLD biomarkers for risk stratification in diabetics from Argentina.

Keywords: 
;  ;  ;  

1. Introduction

Measures to overcome the rising epidemic of metabolic dysfunction-associated steatotic liver disease (MASLD) are centered on identifying people at the highest risk of progression, so they can be offered timely interventions [1]. Due to the limitations of liver biopsy, the need for new risk stratification methods has spurred the exploration of non-invasive diagnostics for MASLD, especially for steatohepatitis and fibrosis. These new methods mostly depend on biomarkers and algorithms derived from anthropometric measurements, serum tests, imaging techniques, and microbiome signatures [2,3]. However, despite all efforts, they could not yet be considered as analytically valid tests useful in MASLD clinical practice [4].
Another limitation to achieve MASLD risk categorization comprehensive to all worldwide populations, is the ongoing challenge to accurately assess the disease prevalence and its burden. While the global prevalence of MASLD is estimated to be 30.2%, there's a lack of high-quality data for specific regions and populations [5,6]. This scenario is worrisome in Latin America, where the prevalence of MASLD is the highest around the world (44.4%) [7]. Inequities in the region influence access to MASLD diagnosis and screening, resulting in lack of representative data [6,8].
Moreover, population’s ethnic background significantly impacts the performance of MASLD risk stratification tools. For example, the FIB-4 index, a non-invasive test for assessing liver fibrosis, may underperform in Black individuals [9]. In addition, lower cut-points for elastography techniques may be needed to optimize surveillance for significant fibrosis in Latin American patients with MASLD [10]. Furthermore, the rs738409 (c.444C>G) polymorphism in the PNPLA3 gene, which encodes the I148M variant associated with the susceptibility and severity of MASLD, exhibits the strongest effect and the highest prevalence in Latin America [11]. Finally, to date, although no specific gut microbiota signature has been reliably connected to any particular geographic area or ethnic group [12], alterations in bacterial composition and metabolic functions may affect systemic inflammation related to liver fat in ways that vary by ethnicity [13].
In this regard, Latin America with its multi-ethnic population [14], poses an extra challenge for MASLD risk stratification that reinforces the need for local studies with large cohorts, that adequately represent the embedded interindividual heterogeneity and regional and demographic variations in MASLD studies [15]. Thus, the aim of this research work was to determine the prevalence of MASLD and analyze the interaction of gut microbiome signatures, genetic and clinical risk factors for MASLD in patients with type 2 diabetes mellitus (T2DM) from different geographical areas of Argentina.

2. Material and Method

2.1. Study Population

During the period 2023-2024, a sub-cohort of 214 unrelated patients in outpatient care diagnosed with T2DM, who participated in a MASLD prevalence study in Argentina [16], were recruited. In order to take into account sample’s representativeness of all environments and populations of Argentina, endocrinologists carried out recruitment in 12 diabetes centers from different geographical regions (Figure S1) as follows: urban area of Buenos Aires city (BA city, n=71), rural area of Buenos Aires province (rural BA, n=40), northeastern Argentina (NEA, n=20), northwestern Argentina (NWA, n=52), and “Patagonia” or southern Argentina (SOUTH, n=31).
The study protocol was developed in accordance with the Declaration of Helsinki and it was approved by the Ethics Committee of Hospital Italiano de Buenos Aires. Written informed consent was obtained from all study participants.

2.2. Data and Sample Collection

Demographic data, anthropometric measurements (height, weight and body mass index or BMI), medical history (high blood pressure, cardiovascular disease history, physical activity, alcohol consumption and medications) were obtained from each subject. Individuals with dietary restrictions, significant alcohol consumption (>30 gr/day for males and >20 gr/day for females) and/or positive tests for human immunodeficiency virus (HIV), hepatitis B (HBV) and hepatitis C virus (HCV) were excluded from the study.
Fasting glucose, hemoglobin A1c (HbA1c), platelet count, total cholesterol, triglycerides, aspartate aminotransferase (AST), and alanine aminotransferase (ALT) levels were measured using standardized laboratory methods.
Cardiovascular risk was assessed by the calculator from the “HEARTS in the Americas” initiative developed by the Pan American Health Organization (PAHO) and the World Health Organization (WHO).
MASL diagnosis was carried out by an ultrasound study and using standard medical practice to rule out other liver conditions. The risk of advanced liver fibrosis was determined by the FIB-4 index. FIB-4<1.3 was considered low risk, scores between 1.3 and 2.67 were in the indeterminate risk range, and FIB-4>2.67 was considered high risk.
Moreover, participants were requested to perform a sterile buccal swab and to collect approximately 5g of stool from different locations of their entire bowel motion into a sterile bacteriostatic buffer tube. Both samples were sent at room temperature to our laboratory, and stored upon arrival at −20 °C until further analysis. Forty-four (20.6%) participants did not provide their stool sample.

2.3. Isolation of Human Genomic DNA and Determination of PNPLA3 rs738409 Genotype

Genomic DNA was extracted from buccal swabs by using QIAamp DNA Blood Mini Kit (QIAGEN, Hilden, Germany) following manufacturer’s instructions. PNPLA3 gene was amplified as previously described [17]. Presence of rs738409 genotype (CC, CG or GG) was confirmed by bi-directional sequencing with Big-Dye Termination chemistry system (Applied Biosystems, Life Technologies Corp., Foster City, CA, USA).

2.4. Microbial DNA Extraction, 16S rRNA Library Preparation and NGS

Faecal DNA samples were obtained using QIAamp DNA Stool Mini Kit (QIAGEN®) following manufacturer’s instructions.
The Earth Microbiome Project (EMP) 16S Illumina Amplicon library preparation methodology was followed (http://www.earthmicrobiome.org), with Illumina 16S V4 primer constructs 515F (Parada)-806R (Apprill) [18,19]. One hundred forty-five samples were sequenced using Illumina® HiSeq 3000 for 2x 150-base pair (bp) reads along with a 10-bp index region.

2.5. Bioinformatic Processing and Statistical Analysis

Reads were processed using QIIME2 (version 2024.10.1) [20]. Reads were trimmed, then merged, denoised, and representative sequences chosen using Deblur2 plugin [21].
Qiime fragment-insertion SEPP (version 2024.10.0) was used to place each sequence into a reference phylogenetic tree (sepp-refs-gg-13-8.qza reference database) [22]. QIIME2 feature classifier using the BLAST+ algorithm [23] aligned taxa against the Greengenes2 2022.10 from 515F/806R region of sequences [24].
Within the QIIME2 environment, samples were rarified to the depth of the sample with fewest QC-passed sequences (328,244). Shannon index alpha diversity was calculated, with significance assessed by the Kruskal-Wallis test. On the other hand, significance of differences in beta diversity between groups was assessed by PERMANOVA analysis of Bray-Curtis distances using the adonis function of the vegan R package [25].
The analysis of compositions of microbiomes with bias correction 2 (ANCOMBC2) framework [26] in R Studio (2025.05.1) was used to determine differences in taxa abundance at the family, genus and specie levels. Core microbiota was defined as the set of amplicon sequence variants at the genus level detected in 50--100% of the samples with a relative abundance threshold value above 0.001% (calculated with Core microbiome from R microbiome package [27]).
Given that the regional factor had the highest effect on the microbiome composition (R2=0.03), the PERMANOVA and ANCOMBC2 analyses for MASLD diagnosis, FIB-4 score and PNPLA3 rs738409 genotype were performed after adjusting for the geographical origin of the samples as a confounder.
Data were presented either as direct visualization of QIIME2 artifacts on QIIME2 View, or using ggplot2 [28] with data from R Studio (2025.05.1) or data extracted from QIIME2 artifacts by using qiime2R (version 0.99.20; https://github.com/jbisanz/qiime2R).
The primary endpoint of the study was defined as 1-year-mortality. One year after the TAVI procedure, all patients or their first-degree relatives were contacted via teleconsultation.
The mortality status of the patients was ascertained, and all surviving patients were invited to the hospital for examination.
Baseline clinical, laboratory, echocardiographic, and tomographic data of patients who died and those who survived after one year were compared.

2.6. Statistical Analysis

Data for continuous variables are shown as median ± interquartile range (IQR). Categorical variables are reported as proportions (%). Statistical analyses were performed using R (version 4.0.5). Differences between groups for categorical and continuous metadata were evaluated using Chi-Square and Kruskal-Wallis ANOVA tests, respectively. Post-hoc Dunn p values with Benjamini-Hochberg FDR adjustment (q values) were calculated.
The associations between PNPLA3 rs738409 genotype and demographical data, geographical origin and clinical variables were assessed using Spearman's correlation analysis and logistic regression analysis.

3. Results

3.1. Demographic, Clinical and PNPLA3 Genetic Background of the Study Subjects

Gender, age and BMI distribution were similar among all regions (Table 1). However, waist circumference was significantly higher in BA city (q=0.006) and the lowest levels of physical activity were observed in rural BA (q=0.005), whereas high blood pressure and cardiovascular risk score were significantly higher in the latter region and in NEA (q=0.03 and q=0.02, respectively).
MASL was diagnosed by US in 77.9% of T2DM patients, and no significant differences were observed among regions (Table 1). FIB-4 scores >2.64 were more frequently observed in rural BA (q=0.01; Table 1).
The PNPLA3 gene was successfully amplified in 190 samples (62 from BA city, 40 from rural BA, 37 from NWA, 20 from NEA, and 31 from SOUTH). Half of them showed the GG genotype, with the highest prevalence in NWA (64.9%) and NEA (60%) and the lowest in BA city (40.3%; p=0.02 vs. NWA).
Regarding diabetes treatment, 172 patients (90.5%) were on treatment at the time of recruitment. Metformin (47.3%) was the most common oral glucose-lowering agent prescribed, followed by Dipeptidyl peptidase 4 (DPP4) inhibitors (12.8%), Sodium glucose transport protein 2 (SGLT2) inhibitors (11.6%), and Glucagon-like peptide-1 (GLP-1) agonists (8.3%). Treatment with DPP4 inhibitors was significantly lower in rural BA (q=0.04) whereas GLP-1 agonists were more commonly prescribed in urban and rural BA (q=0.01).

3.2. Correlations Between PNPLA3 rs738409 Genotype and Clinical Markers

Logistic regression analysis revealed that the GG genotype was not associated with the geographic region of origin (p=0.2), but was considered a risk factor independently associated with FIB-4 scores (OR=9.4; p=0.0008), and a protective factor against HbA1c (OR=-4.8; p=0.004), fasting plasma glucose (OR=-1; p=0.008), and cholesterol (OR=-1.4; p=0.02) levels (Figure 1).

3.3. Analyses of the Gut Bacterial Metagenome of T2DM Patients

After sequencing the hypervariable V4 region of bacterial 16S gene, 25 out of the 170 samples were excluded due to low number of reads, which resulted in inclusion of 145 samples (60 from BA city, 40 from rural BA, 35 from NWA, and 10 from SOUTH). The median depth of sequencing, after exclusion of low-depth libraries, was 774,721 reads per sample (Interquartile range (IQR): 345,683 reads). Rarefaction plots reached an asymptotic state, indicating that the sequence depth was sufficient to represent the bacterial community richness and diversity (Figure S2).

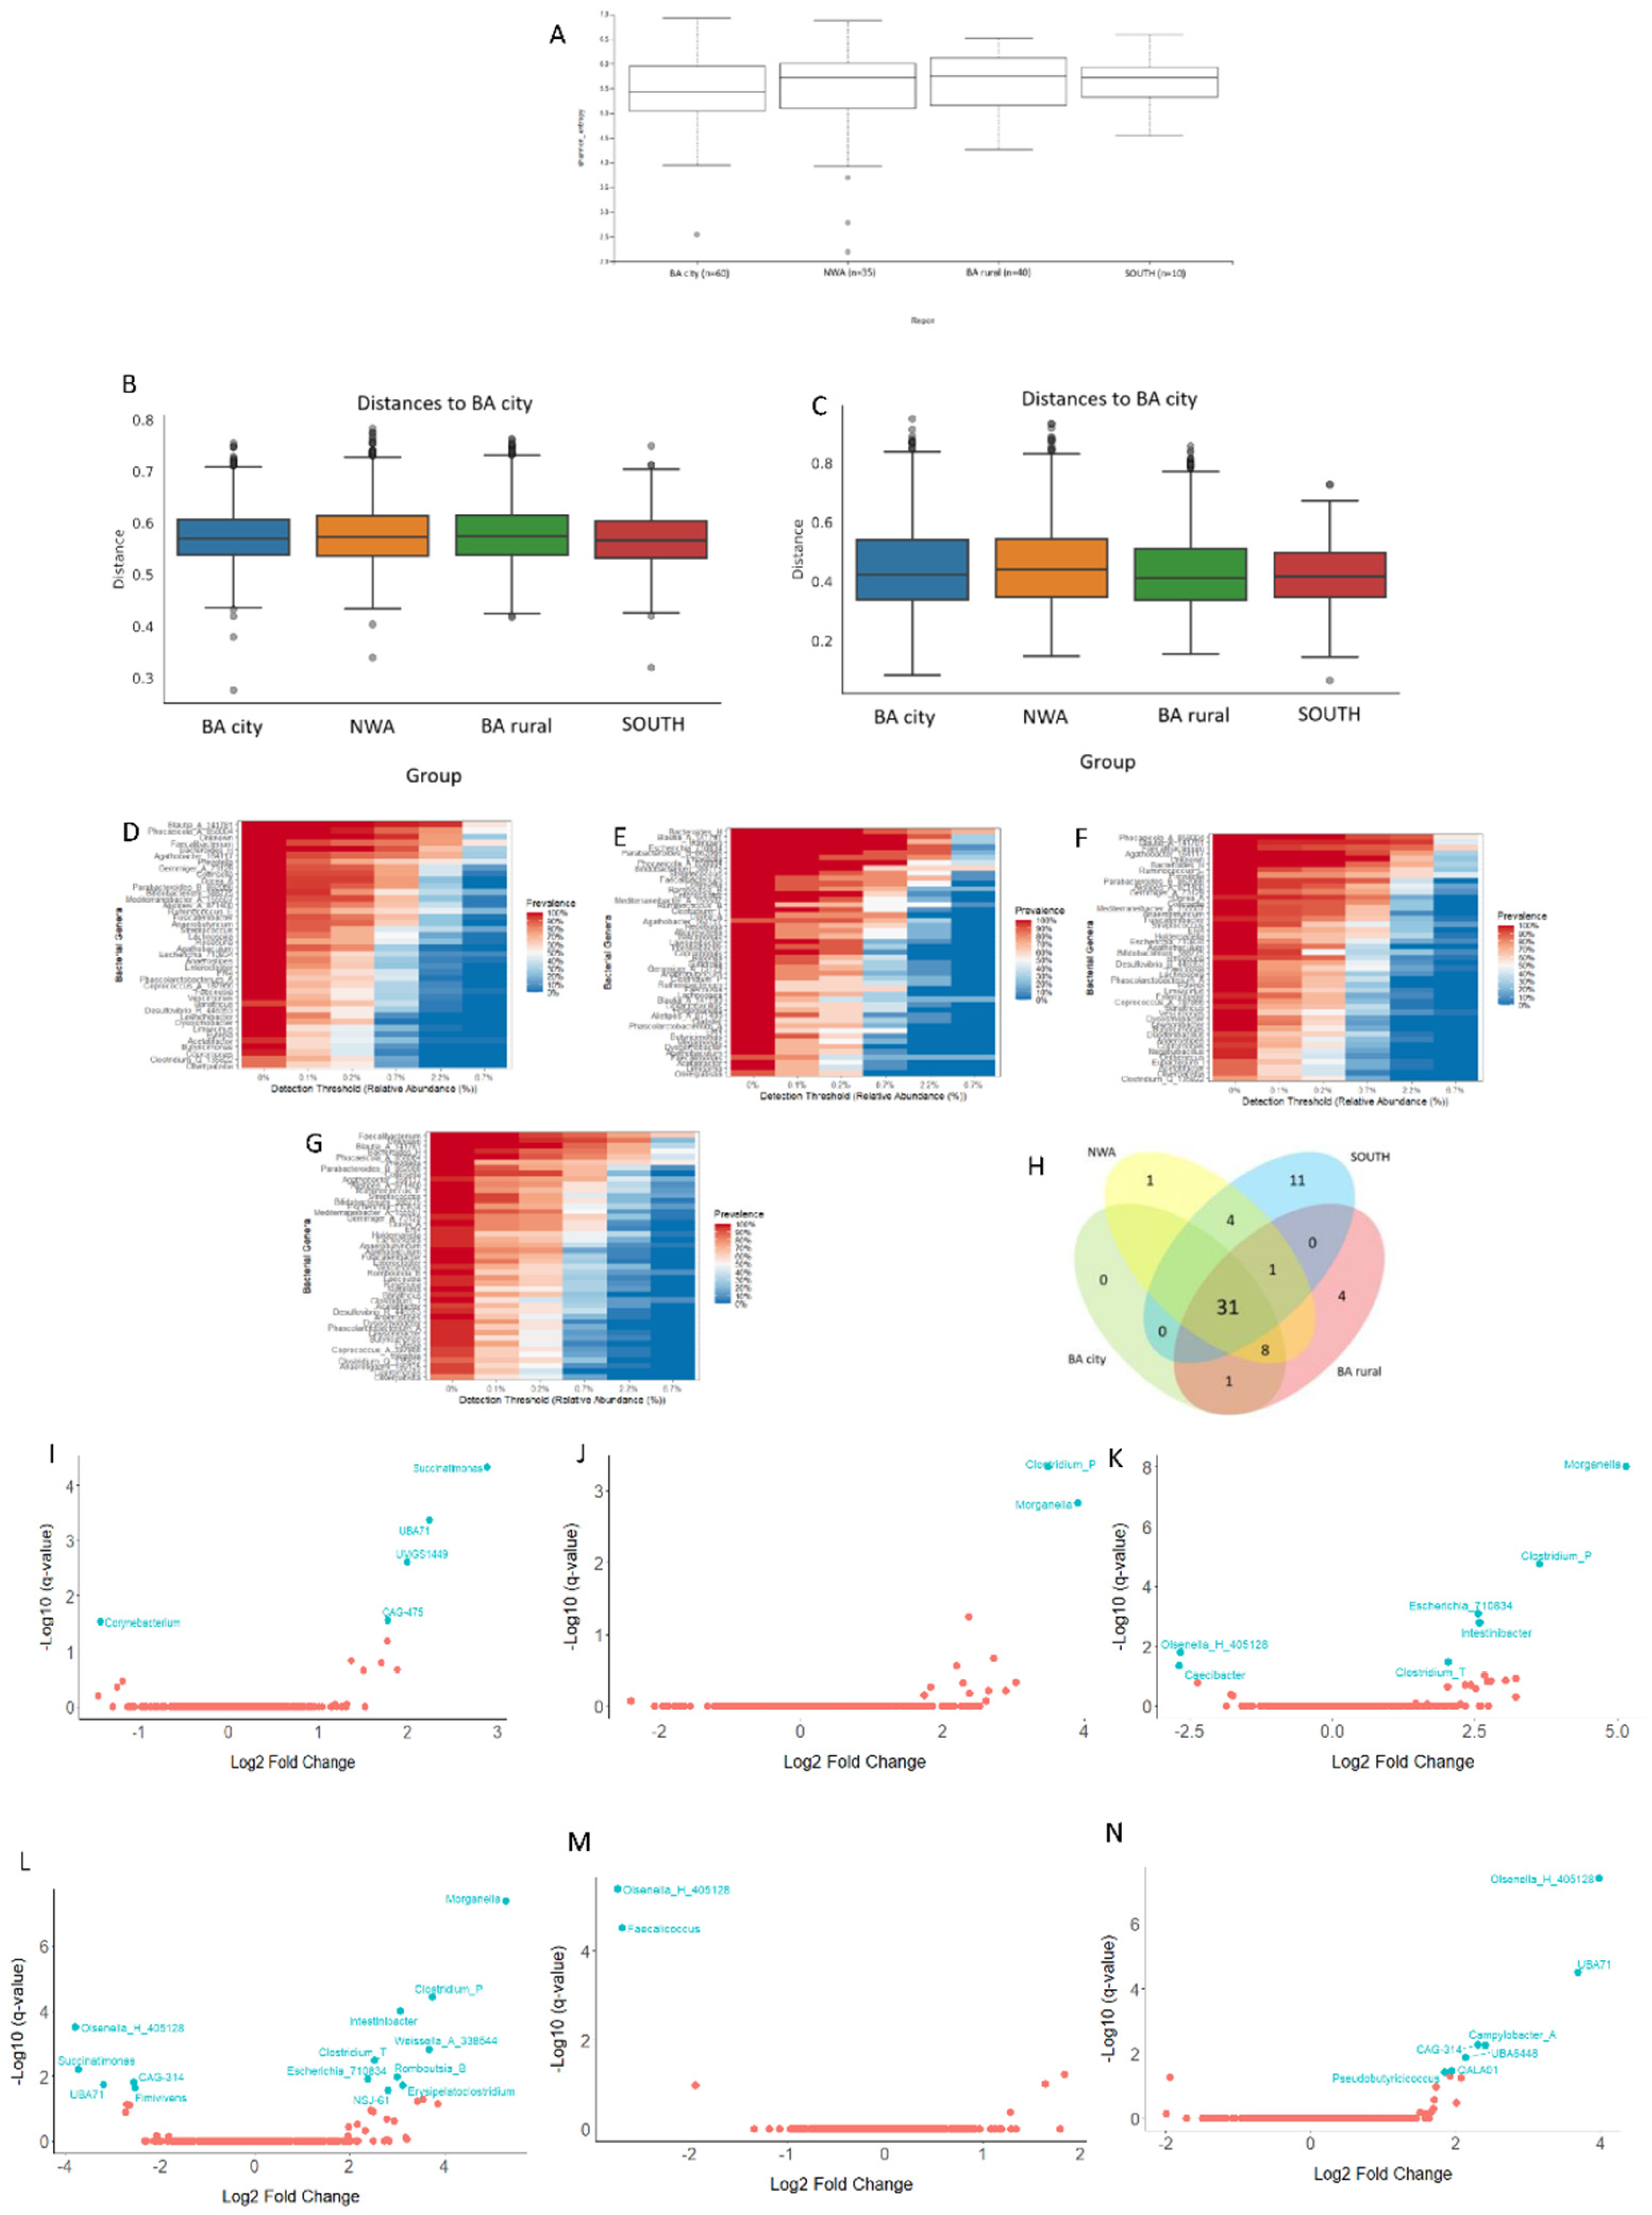
3.3.1. Analyses of the Gut Bacterial Metagenome According to the Geographical Origin of the Samples

Samples from SOUTH and rural BA had the lowest Shannon entropy indexes while those from BA city and NWA showed the highest alpha diversity, with no significant differences among geographical regions (p=0.54; Figure 2A).
Beta diversity (considering weighted and unweighted UniFrac distances) revealed that samples from SOUTH showed a statistically significant separation from those of the remaining regions in the unweighted (q=0.003; Figure 2B) and weighted (q=0.031; Figure 2C) Unifrac plots.
Forty bacterial genera (corresponding to 6.94% of the genera present in the group) were identified as core microbiota for samples from BA city (Figure 2D), whereas the core microbiota in SOUTH consisted of forty-seven genera (9.77% of the total, Figure 2E), and forty-five genera in both rural BA (8.74% of the total; Figure 2F) and in NWA (8.23% of the total; Figure 2G). No bacterial genera were exclusively observed in BA city (Figure 2H). However, four genera of the core microbiota were considered exclusive of rural BA (g__Onthenecus, g__Eubacterium_I, g__Negativibacillus, g__Duodenibacillus), one genus (g__Anaerotignum_189125) in NWA, and eleven genera (g__Alloprevotella, g__Limisoma, g__Clostridium_P, g__Blautia_A_141780, g__Faecalimonas, g__Ruminococcus_B, g__Ruthenibacterium, g__Intestinibacter, g__Megamonas, g__Dialister, g__Ligilactobacillus) in SOUTH (Figure 2D-H).
Differentially abundant taxa were identified between geographical regions (Figure 2I-N and Figure S3A-K). Rural BA differentiated itself from BA city by a higher abundance of Succinatimonas (q=4.78e-05), UBA71 (q=0.0004), UMGS1449 (q=0.002) and CAG-475 (q=0.03) bacterial genera, whereas Corynebacterium genera (q=0.03) prevailed in BA city (Figure 2I). Moreover, SOUTH portrayed the highest number of differential abundant taxa after comparison with other geographical areas (Figure 2J-L). For instance, it showed more abundance of Morganella (q=0.001) and Clostridium_P (q=0.0005) genera when compared with NWA (Figure 2J); these previous two bacterial genera (q=9.96e-09 and q=1.84e-05, respectively) in addition to Escherichia_710834 (q=0.0008), Intestinibacter (q=0.002) and Clostridium_T (q=0.03) genera after comparison with BA city (Figure 2K); and finally, SOUTH differentiated from rural BA by a higher prevalence of the beforementioned genera, Weissella_A_338544 (q=0.001), Romboutsia_B (q=0.01), Erysipelatoclostridium (q=0.02) and NSJ-61 (q=0.01; Figure 2L).

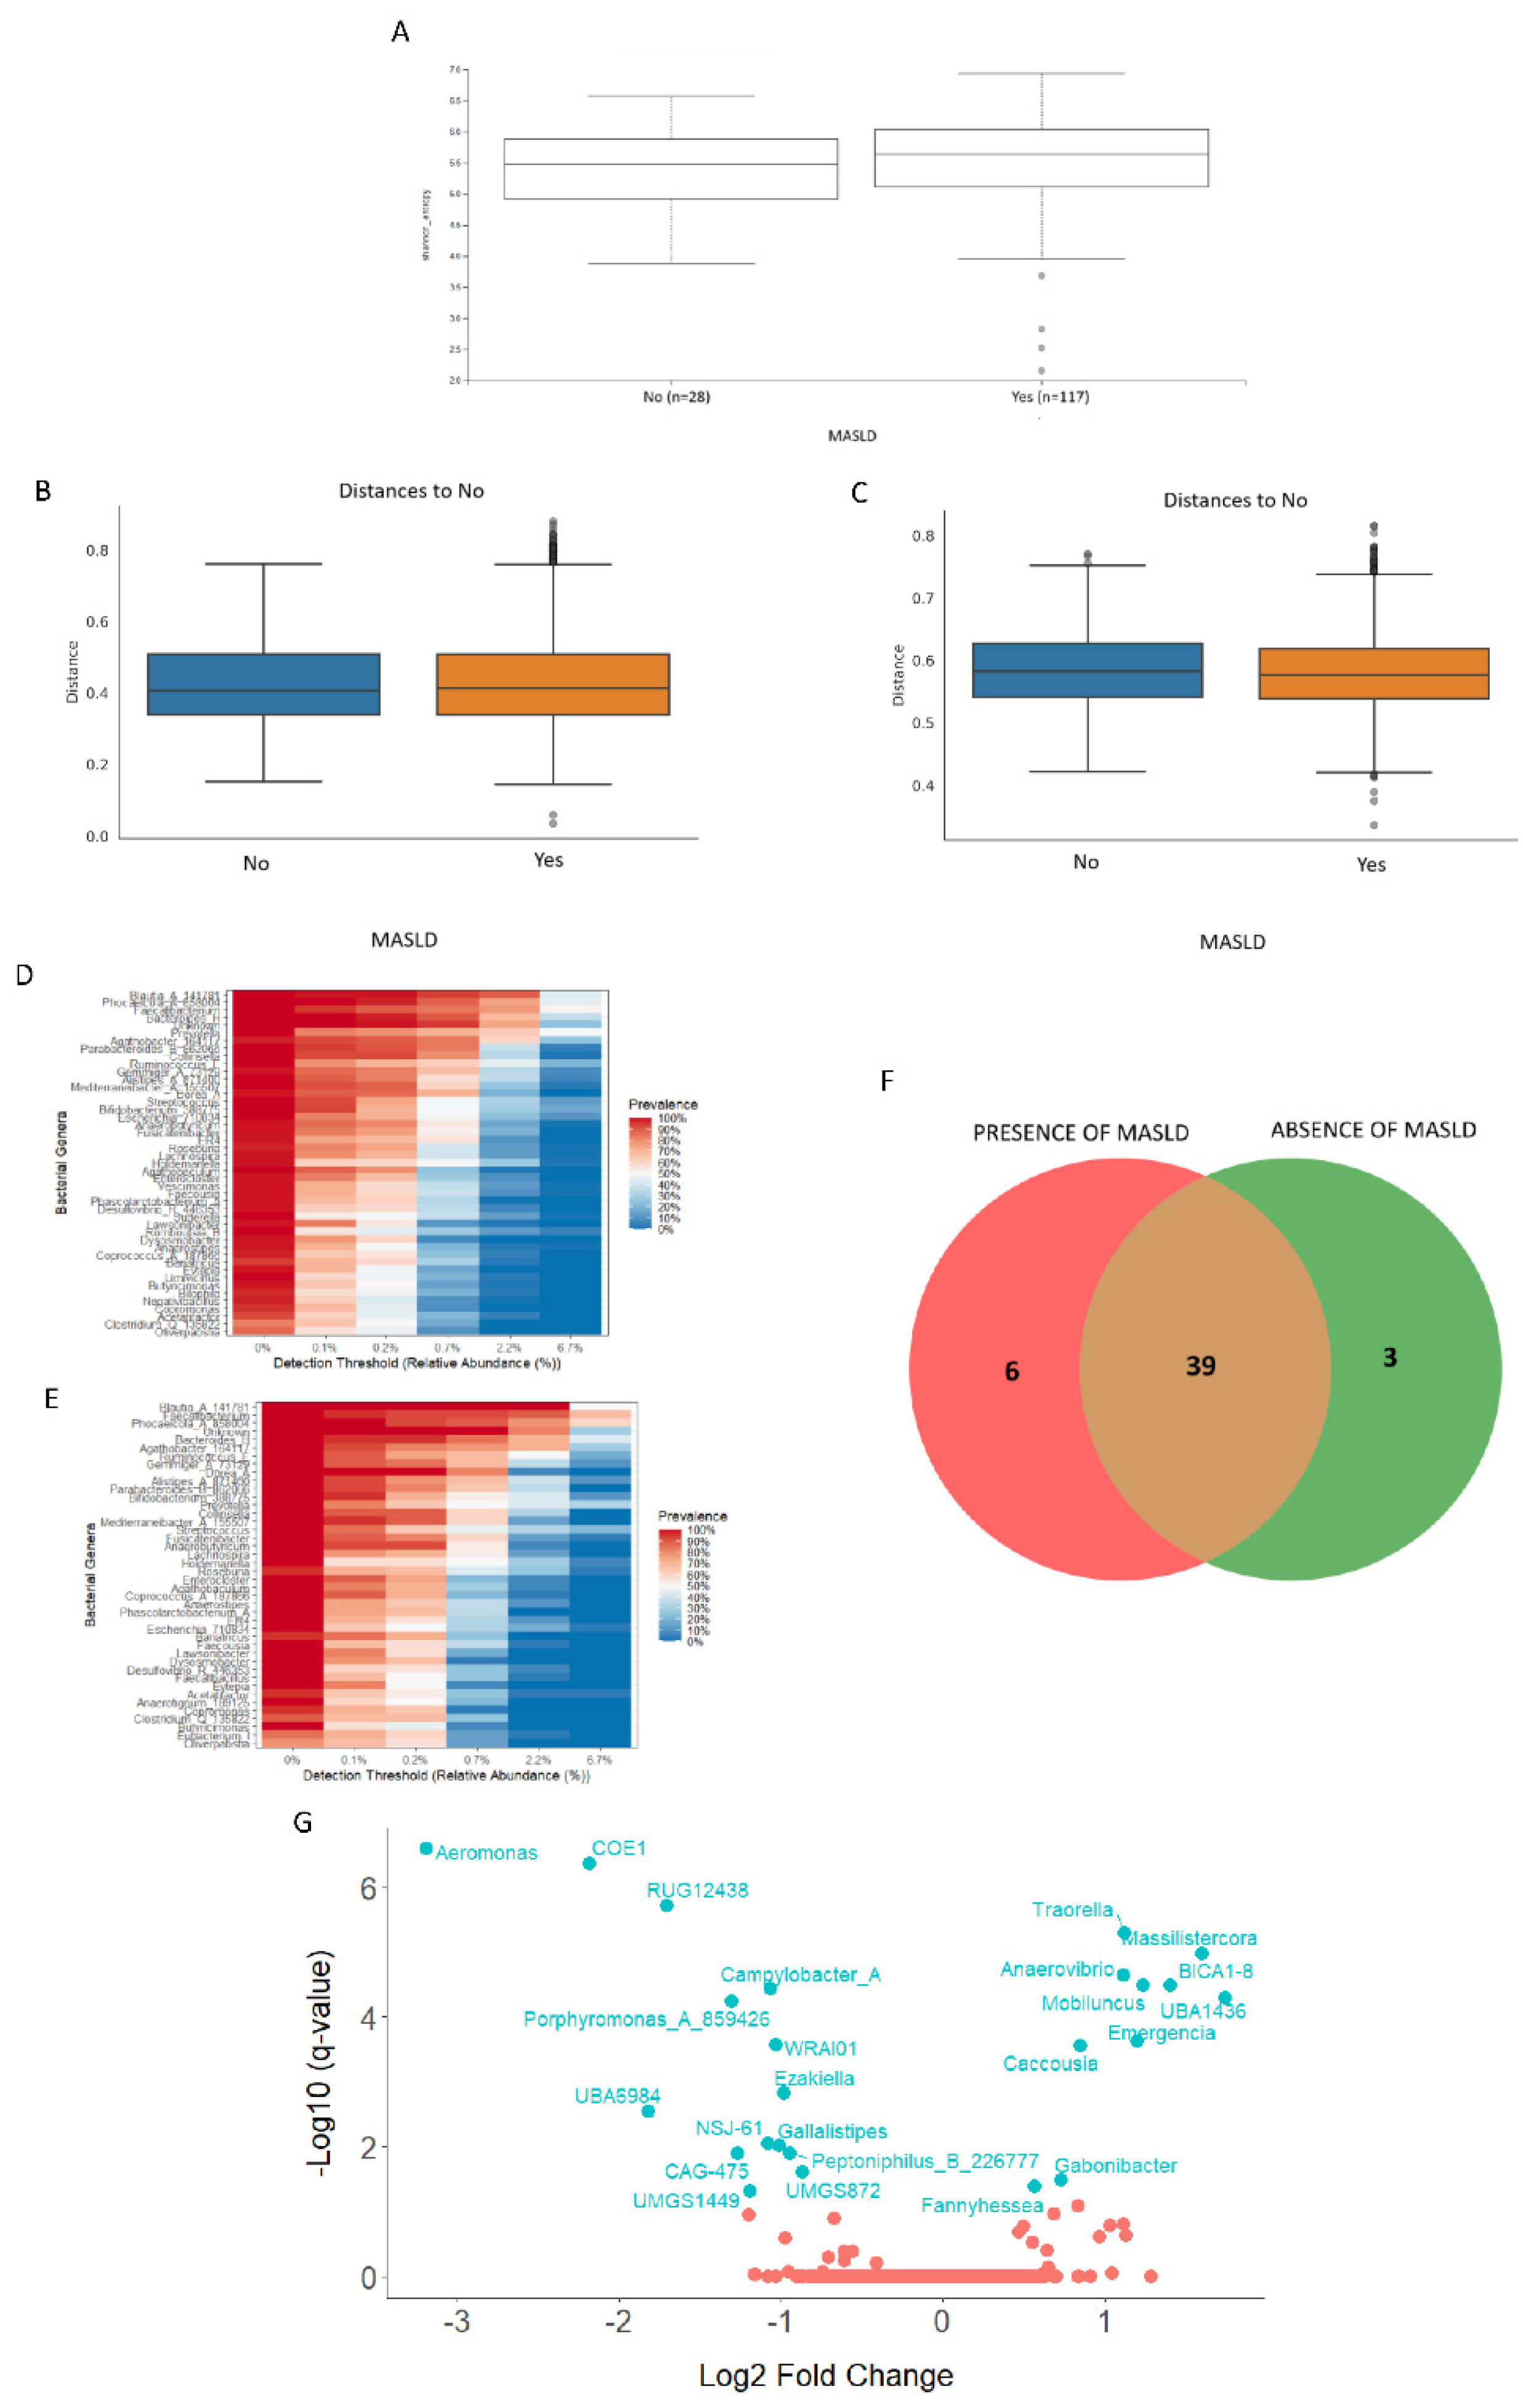
3.3.2. Analyses of the Gut Bacterial Metagenome According to the MASLD Diagnosis

Shannon entropy indexes were similar between MASLD and non-MASLD samples (p=0.56; Figure 3A). No significant differences were also observed in the weighted (q=0.81; Figure 3B) and unweighted UniFrac distances (q=0.9; Figure 3C) between both groups, after adjusting for geographical origin.
Forty-five bacterial genera (7.38% of the total) were identified as core microbiota for the MASLD group (Figure 3D) and forty-two (7.83% of the total) for the non-MASLD (Figure 3E). At the intersection of both groups (Figure 3F), thirty-nine genera were found. However, there were six genera present in the MASLD group that were absent in non-MASLD samples (g__Bilophila, g__Limivicinus, g__Vescimonas, g__Negativibacillus, g__Romboutsia_B, g_Sutterella), and three genera (g__Anaerotignum_189125, g__Eubacterium_I, g__Faecalibacillus) were exclusively present in the non-MASLD core (Figure 3D-F).
Taxa abundance significantly differed between MASLD and non-MASLD groups (Figure 3G and Figure S4A-B). Of the 382 observed genera, abundance of Traorella (q=5.28e-06), Massilistercora (q=1.07e-05), BICA1-8 (q=3.33e-05), Mobiluncus (q=3.34e-05), UBA1436 (q=5.19e-05), Anaerovibrio (q=2.34e-05), Emergencia (q=2.46e-04), Caccousia (q=2.8e-04), Gabonibacter (q=3.23e-02) and Fannyhessea (q=4.19e-02) genera were higher among patients with MASLD (Figure 3G). On the other hand, Aeromonas (q=2.64e-07), COE1 (q=4.36e-07), RUG12438 (q=1.93e-06), Campylobacter_A (q=3.74e-05), Porphyromonas_A_859426 (q=5.78e-05), WRAI01 (q=2.75e-04), Ezakiella (q=1.49e-03), UBA6984 (q=2.82e-03), NSJ-61 (q=8.72e-03), Gallalistipes (q=9.72e-03), Peptoniphilus_B_226777 (q=1.25e-02), CAG-475 (q=1.25e-02), UMGS872 (q=2.47e-02) and UMGS1449 (q=4.81e-02) genera were higher among those patients without MASLD (Figure 3G).

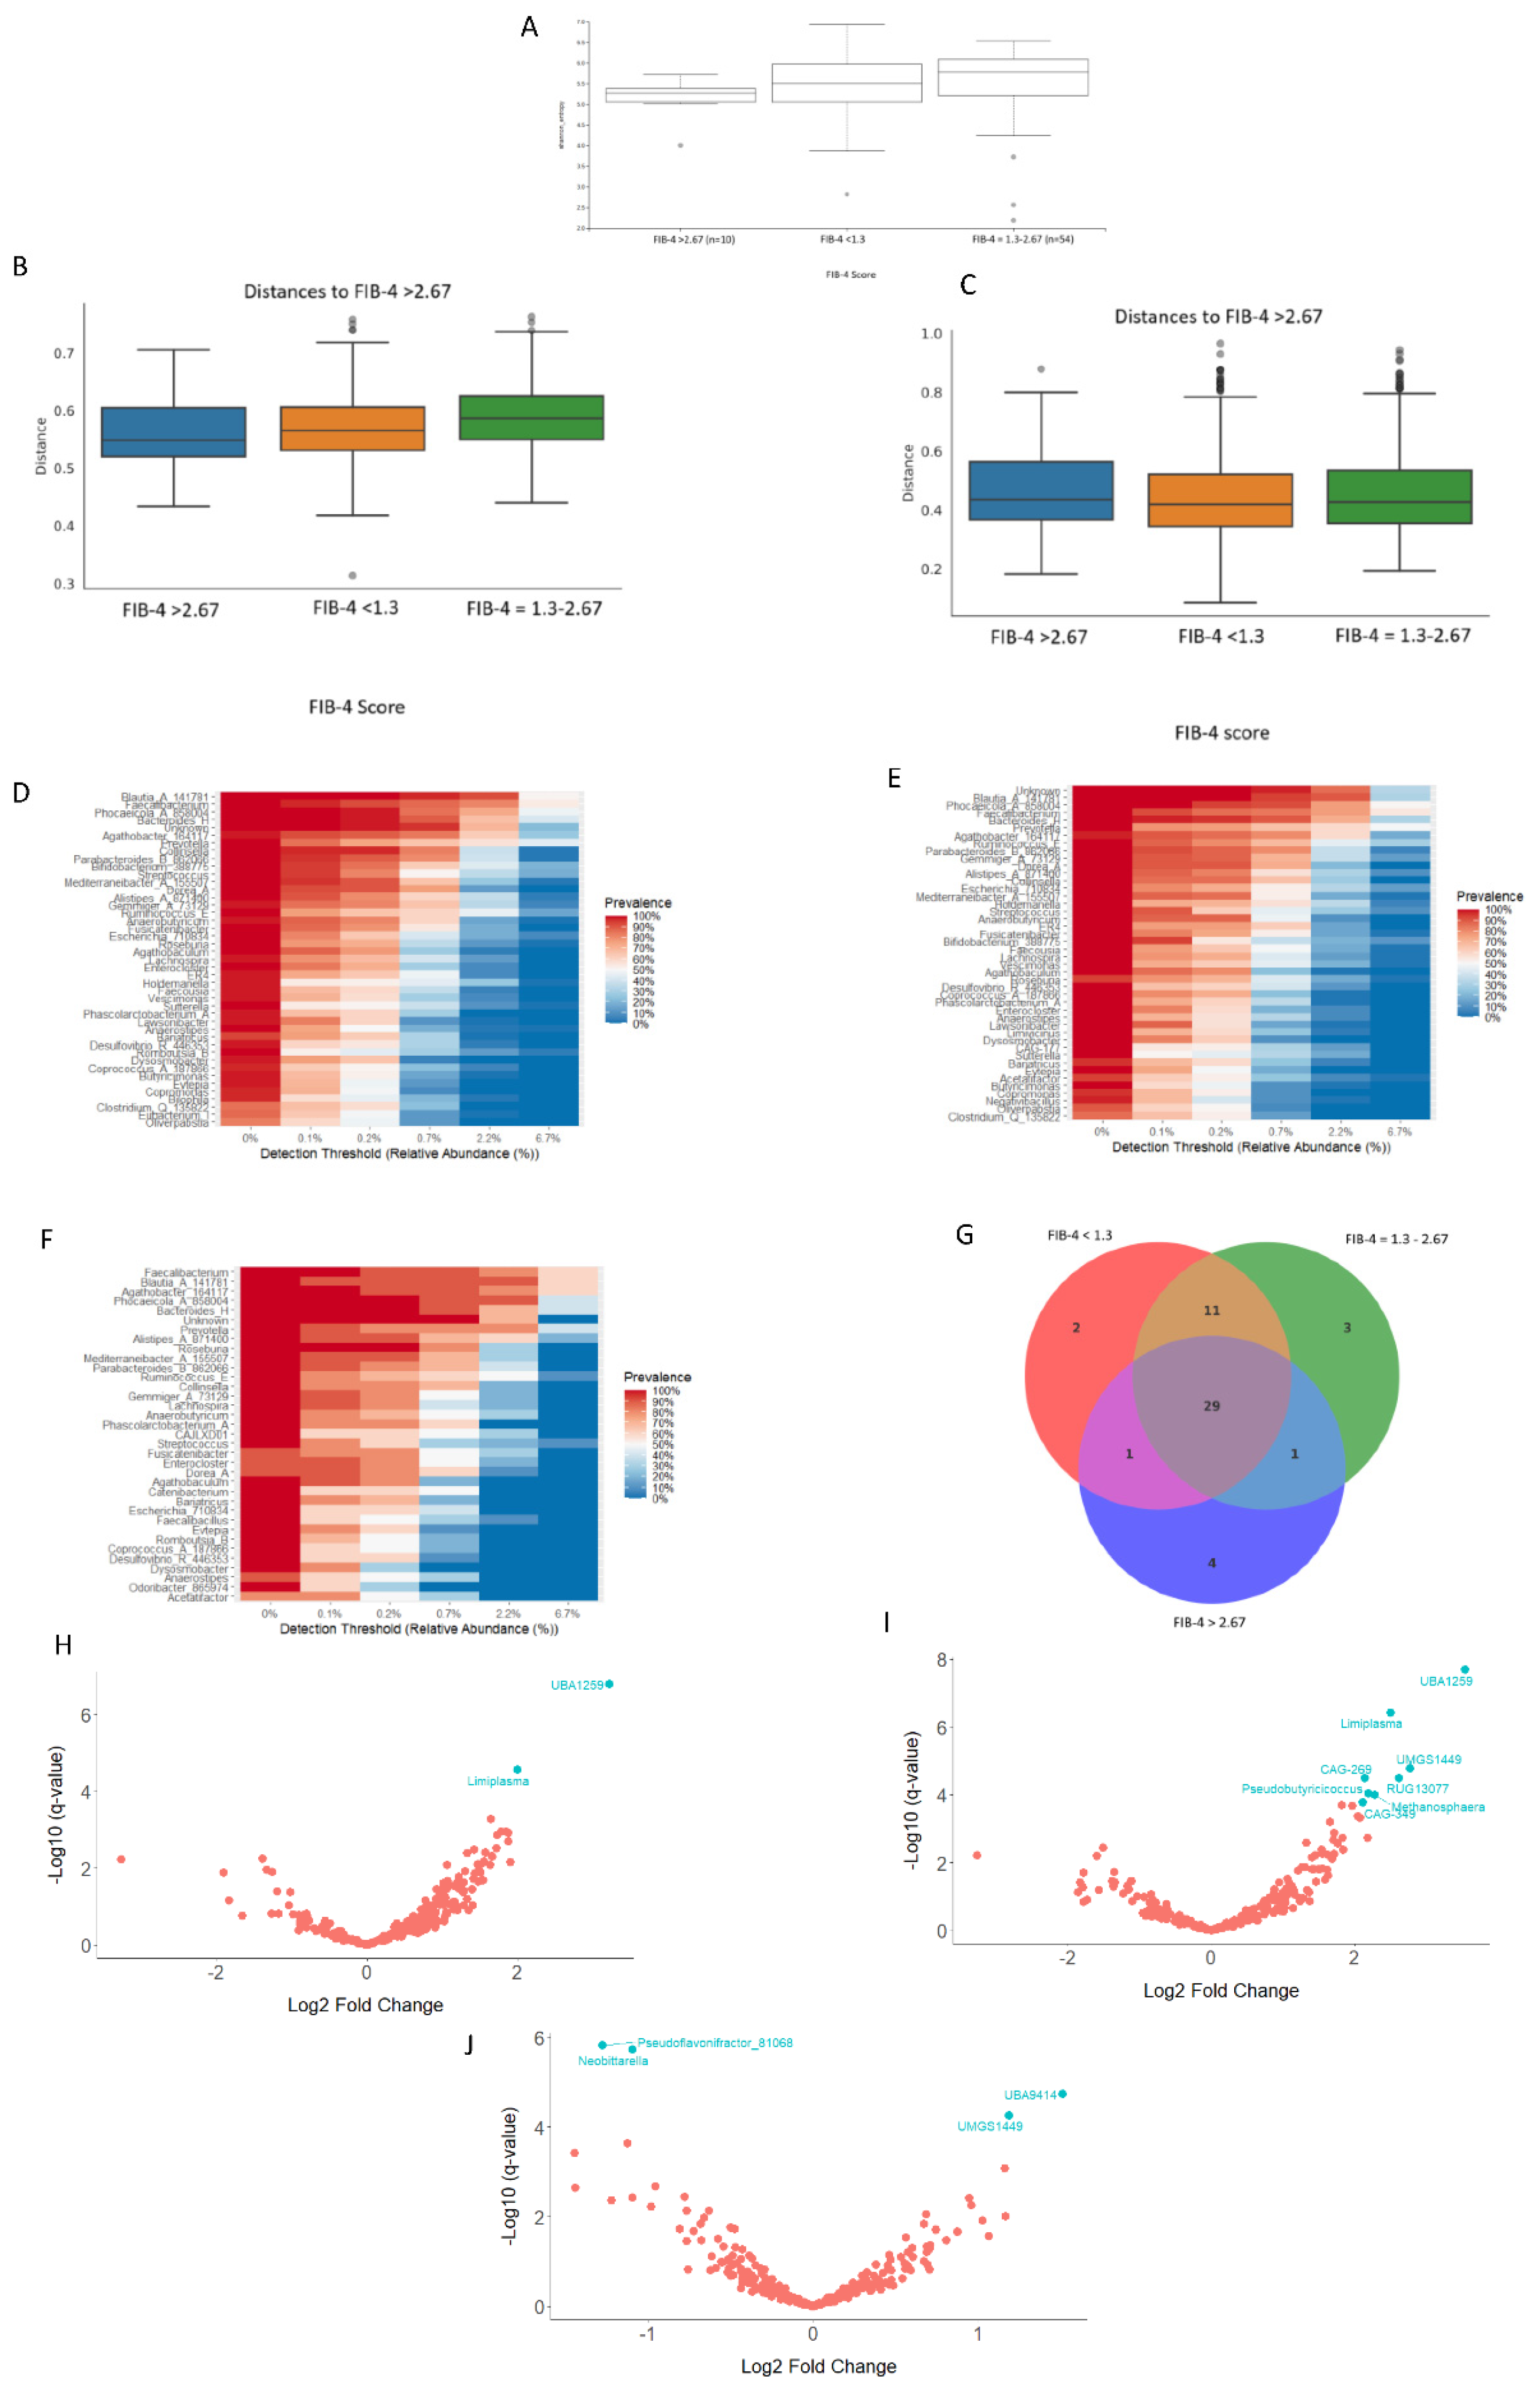
3.3.3. Analyses of the Gut Bacterial Metagenome According to the FIB-4 Score

Patients with the high-risk score had the lowest Shannon index when compared to those with FIB-4<2.67, with no significant differences between groups (p=0.07; Figure 4A). Patients with FIB-4>2.67 show a statistically significant separation from those of the intermediate FIB-4 scores in the unweighted Unifrac plot (q=0.04; Figure 4B), but not in the weighted Unifrac plot (q=0.33; Figure 4C). No differences in the beta diversity were observed between samples with the intermediate and low scores (Figure 4B-C).
The core microbiota of those patients with FIB-4<1.3 consisted of forty-three bacterial genera (7.18% of the total; Figure 4D), whereas forty-four genera were identified as core microbiota of FIB-4 1.3-2.67 scores (7.68% of the total; Figure 4E), and thirty-five of those with FIB-4>2.67 (8.82% of the total; Figure 4F). Two bacterial genera (g__Bilophila and g__Eubacterium_I) were exclusively observed in the FIB-4<1.3 group (Figure 4G), three genera (g__CAG177, g__Limivicinus, g__Negativibacillus) were solely observed in patients with intermediate FIB-4 values, and four genera (g__Odoribacter_865974, g__Catenibacterium, g__Faecalibacillus, g__CAJLXD01) were present only in the FIB-4>2.64 group (Figure 4D-G).
ANCOMBC2 analysis revealed significantly different gut taxa abundance among patients grouped by their FIB-4 scores (Figure 4H-J and Figure S5A-D). Out of the 289 observed bacterial genera, UBA1259 and Limiplasma genera were significantly more abundant among FIB-4<1.3 (q=4.85e-05 and q=8.11e-03, respectively) and FIB-4 1.3-2.67 scores (q=6.05e-06 and q=1.11e-04, respectively) when compared to FIB-4>2.67 (Figure 4H-I).

3.3.4. Analyses of the Gut Bacterial Metagenome According to the PNPLA3 rs738409 Genotype

Alpha diversity analysis revealed no significant differences between genotypes (p=0.57; Figure 5A). After adjusting for the geographical origin of the samples, PERMANOVA analysis showed similar weighted (q=0.21; Figure 5B) and unweighted UniFrac distances (q=0.42; Figure 5C) between PNPLA3 genotypes.
The core microbiota of GG carriers consisted of forty-two bacterial genera (7.43% of the total; Figure 5D), forty genera for heterozygous carriers (7.28% of the total; Figure 5E) and forty-three genera for CC carriers (8.04% of the total; Figure 5F). The Negativibacillus genus was exclusively detected among the GG carriers, whereas the Romboutsia_B genus was characteristic of heterozygous carriers and five bacterial genera (g__Eubacterium_I, g__Limivicinus, g__Dialister, g__Faecalibacillus, g__Duodenibacillus) were solely related to the beneficial CC genotype (Figure 5D-G).
Bacterial microbiota composition significantly differed regarding rs738409 genotype (Figure 5 H-J and Figure S6A-F). Out of the 368 observed bacterial genera, Megasphaera_A_38565 (q=2.11e-05), Tractidigestivibacter (q=2.6e-05), Bacteroides_F (q=5.54e-05), Emergencia (q=1.48e-03) and Anaerotignum_189163 (q=1.57e-02) were significantly more abundant among the GG carriers, when compared with the CC genotype (Figure 5H).

4. Discussion

People with T2DM are at higher risk of MASLD, disease progression, and overall liver-related mortality [29]. For this reason, patients with T2DM should be prioritized for MASLD screening and risk stratification [29].
As the pathophysiology mechanisms of MASLD may differ among patients with and without T2DM, studies focused on non-invasive methods for MASLD diagnosis and prognosis in the T2DM population are urgently needed. Thus, we characterized the interaction of gut microbiome signatures, genetic and clinical risk factors for MASLD in patients with T2DM from different geographical areas of Argentina.
In Argentina, MASLD affects approximately eight out of ten people with T2DM [16]. Moreover, MASLD prevalence is higher in southern Argentina (90.28%) when compared to other regions of the country (77.9%-86.7%) [16]. Although we randomly recruited herein a sub-cohort of 214 T2DM patients who also participated in [16], significant differences in MASLD prevalence were not observed, which could be explained by the limited number of participants from some geographical areas, meaning that these areas are underrepresented in our study.
However, we detected regional variations in physical activity patterns, cholesterol levels, hypertension and cardiovascular risk. Moreover, the PNPLA3 GG genotype, linked to the Native American ancestry [17], also showed a specific distribution pattern in Argentina reflecting the genetic background of the contemporary Argentine population after centuries of admixture [30]. Thus, the geographic, ethnic and sociocultural diversity of Argentina could reflect multiple regional determinants that influence conditions closely linked to the development of MASLD.
Gut microbiota is a promising source for non-invasive biomarkers for MASLD diagnosis and risk stratification [3,15]. Microbiota appear to be similar in people living within the same area who are in contact with one another [31]. However, within the same country, geographical and socio-economical differences between localities may contribute to shaping the human gut microbiota [31]. For that reason, national and multi-centric studies are mandatory for identification of microbiota-derived biomarkers [3,15].
In our study, the diversity and composition of the bacterial metagenome of patients with T2DM significantly differed between the four analyzed geographical regions, being the microbiomes from SOUTH the most distinctly diverse. These variations may be related to differences in dietary habits, cultural characteristics, and extreme climatic conditions [32]. In fact, polar weather is characteristic of the Patagonian region due to its southern location and influence from cold air masses originating from Antarctica. Interestingly, Megamonas genus, which was reported in Antarctic research stations [33], was exclusively present in the core microbiota from SOUTH in this study. Megamonas is considered to be an obesity-enriched bacteria across diverse worldwide populations that degrades myo-inositol, a polyol compound implied in glycemic and lipidic metabolism [34]. These findings suggest that, in the Patagonian region, microbe-induced obesity could be a way to alter the gut microbiota dynamics in response to extreme environmental changes.
The rural and urban areas of Buenos Aires markedly differ in their population density (15 and 15000 persons per km2 respectively as of the 2022 census) and, despite their geographical closeness (distance from Buenos Aires to Balcarce and Chacabuco is 416 and 212 km, respectively), we found significant differences in the gut microbiota of these populations. The metropolitan region of Buenos Aires city is the most urbanized area of Argentina, and the third largest urban agglomeration in Latin America, whereas Balcarce and Chacabuco are rural towns in the Buenos Aires province. Lifestyle and social overcrowding are important modifiers of gut microbiota diversity and composition [35]. In fact, the higher abundance of Succinatimonas genus in the rural environment of Argentina was also recently reported in rural microbiomes from individuals practicing traditional lifestyles [36].
In this study, we identified MASLD-specific bacterial signatures in our T2DM cohort, such as the proinflammatory genera Sutterella and Romboutsia which have been previously related to MASLD progression [37,38]. In addition, bacteria from the Bilophila genus synergize with high fat diet to promote higher glucose dysmetabolism and hepatic steatosis [39]. On the contrary, in the core microbiota of the non-MASLD group, we identified beneficial bacteria (g__Anaerotignum_189125, g__Eubacterium_I, g__Faecalibacillus) which play a role in improving insulin sensitivity and intestinal gluconeogenesis [40]. This finding was expected bearing in mind that 90.5% of the participants were on diabetes treatment at the time of recruitment, and that oral antidiabetic drugs increase the short-chain fatty acids-producing bacteria, responsible for losing weight and suppressing inflammation [41].
Improving our understanding of how risk factors for advanced liver disease interact with one another is crucial for their application in clinical practice. Previous studies, as well as the results in our population, suggested that PNPLA3 GG genotype impacts on fibrosis progression non-invasively assessed by FIB-4 score [42]. On the other hand, GG carriers in this population have reduced plasma lipid levels which could be explained by their reduced hepatic lipolysis and release of lipids to the circulation, in spite of their high liver fat content [43]. In individuals with T2DM, this genotype was also associated with a better glycemic control [44]. Although this observation has raised some controversy [42], it seems that the I148M variant increases hepatic retention of polyunsaturated fatty acids (PUFAs) and results in PUFA deficiency in triglycerides secreted by the liver both in the fasting state and postprandially [45]. PUFAs selectively suppress hepatic sterol regulatory element-binding protein (SREBP)-1 and carbohydrate response element-binding protein (ChREBP), two key transcription factors for the regulation of lipogenesis and glucose production in the liver, which are highly expressed in insulin-resistant states [46,47]. In addition, as this is a cross-sectional study, we do not know whether these patients with lower levels of HBA1c and fasting plasma glucose were treated more carefully justifying a better glycemic control.
The fact that gut microbiota markedly differed depending on PNPLA3 rs738409 genotype and FIB-4 score suggests that MASLD is induced in genetically predisposed subjects by multiple insults acting together [48]. In this regard, bacteria from the Eubacterium genus, which are important short-chain fatty acid producers and mediate colonic inflammation, gut barrier dysfunction and energy harvest [40], were present among both non-MASLD patients and those patients the lowest risk of MASLD or fibrosis progression.
On the other hand, in patients with FIB-4>2.67, we observed bacteria from the pro-inflammatory, pro-immunogenic and pro-fibrogenic Catenibacterium genus [49]; whereas in the core microbiota of diabetic patients with MASLD, the PNPLA3 GG genotype and in those with intermediate risk of fibrosis (FIB-4=1.3-2.67), we detected the Negativibacillus bacterial genus. A recent study which analyzed 16S rRNA sequences from 1189 subjects concluded that Negativibacillus has diagnostic potential to distinguish patients with MASLD from healthy controls and to predict MASLD progression [38]. Moreover, the presence of this bacterial genus in the human gut was correlated to reduced bile acid synthesis and increased hepatic cholesterol accumulation via the intestinal farnesoid X receptor-fibroblast growth factor 19 (FXR-FGF19) axis [50], thus exacerbating the hepatic lipid retention in PNPLA3 GG carriers. For these patients, actively consuming dietary fiber and other foods that increase short-chain fatty acids may help prevent and treat MASLD by fostering the growth of beneficial gut bacteria in detriment of the harmful Negativibacillus.
Our study has limitations that need to be addressed. First, the number of samples from some geographical regions was limited, and the central and Andean region of Argentina were not represented in this study. Therefore, results could not generalize to the entire country. Second, diet differences could not be ruled out as a confounder factor in our study. Finally, MASLD diagnosis and liver fibrosis were assessed by abdominal ultrasound and FIB-4 score respectively, and not by the gold standard, liver biopsy. However, given the significant burden of MASLD in Latin America, ultrasonography is recommended as the initial screening tool, while FIB-4 is preferred for fibrosis risk stratification in this region [8].

5. Conclusions

In conclusion, despite the regional and intrinsic differences of the gut microbiome, we reported specific signatures that could be useful biomarkers of MASLD diagnosis and risk stratification in diabetic patients from Argentina. In addition, the significant interactions of gut bacterial taxa with recognized predictors for advanced liver disease in these patients could establish the basis to build a potential risk prediction model based on their combination for assessing the risk of MASLD.

Supplementary Materials

The following supporting information can be downloaded at the website of this paper posted on Preprints.org, Figure S1: Map showing the location of the recruitment centers in the different geographical regions of Argentina. The size of the data point is proportional to the number of recruited patients in each center. The same colors are used to show each geographical region on the map; Figure S2: Rarefaction plot. The x axis represents the number of sequences sampled while the y axis represents a measure of the species richness detected (estimated number of observed features). The red vertical dotted line represents the rarefaction depth chosen (sample with the least amount of sequences); Figure S3: Differential taxa abundance at the family and species levels of the gut microbiota of DM2 patients from various geographical regions in Argentina. (A) Volcano plot from ANCOMBC2 analysis at the family level between BA city and rural BA. (B) Volcano plot from ANCOMBC2 analysis at the family level between NWA and SOUTH. (C) Volcano plot from ANCOMBC2 analysis at the family level between BA city and SOUTH. (D) Volcano plot from ANCOMBC2 analysis at the family level between rural BA and SOUTH. (E) Volcano plot from ANCOMBC2 analysis at the family level between NWA and rural BA. (F) Volcano plot from ANCOMBC2 analysis at the species level between BA city and rural BA. (G) Volcano plot from ANCOMBC2 analysis at the species level between NWA and SOUTH. (H) Volcano plot from ANCOMBC2 analysis at the species level between BA city and SOUTH. (I) Volcano plot from ANCOMBC2 analysis at the species level between rural BA and SOUTH. (J) Volcano plot from ANCOMBC2 analysis at the species level between NWA and rural BA. (K) Volcano plot from ANCOMBC2 analysis at the species level between BA city and NWA. In each volcano plot, X-axis (effect size) shows the log2 fold change, which represents the magnitude of the difference between the two analyzed geographical regions. Negative values indicate features that are more abundant in the first- mentioned region in the plot legend, while positive values on x-axis indicate that features are more abundant in the second-mentioned geographical region. Y-axis (significance) shows the −log10 (q values). A larger negative log-transformed q value means stronger statistical significance. Threshold for significance was set as q < 0.05, i.e., −log10 (FDR q value) > 1.3. No differential abundant taxa were detected at the family level between BA city and NWA. ANCOMBC2, Analysis of Composition of Microbiomes with Bias Correction 2; Figure S4: Differential taxa abundance at the family and species levels of the gut microbiota of DM2 patients with or without MASLD. (A) Volcano plot from ANCOMBC2 analysis at the family level between non-MASLD and MASLD samples. (B) Volcano plot from ANCOMBC2 analysis at the species level between non-MASLD and MASLD samples. X-axis (effect size) shows the log2 fold change, which represents the magnitude of the difference between the two analyzed groups. Negative values indicate features that are more abundant in the non-MASLD group, while positive values on x-axis indicate that features are more abundant in the MASLD group. Y-axis (significance) shows the −log10 (q values). A larger negative log-transformed q value means stronger statistical significance. Threshold for significance was set as q < 0.05, i.e., −log10 (FDR q value) > 1.3. ANCOMBC2, Analysis of Composition of Microbiomes with Bias Correction 2; Figure S5: Differential taxa abundance at the family and species levels of the gut microbiota of DM2 patients grouped by FIB-4 score. (A) Volcano plot from ANCOMBC2 analysis at the family level between FIB-4 >2.67 and FIB-4=1.3-2.67. (B) Volcano plot from ANCOMBC2 analysis at the species level between FIB-4 >2.67 and FIB-4 <1.3. (C) Volcano plot from ANCOMBC2 analysis at the species level between FIB-4 >2.67 and FIB-4=1.3-2.67. (D) Volcano plot from ANCOMBC2 analysis at the species level between FIB-4 <1.3 and FIB-4=1.3-2.67. In each volcano plot, X-axis (effect size) shows the log2 fold change, which represents the magnitude of the difference between the two analyzed groups. Negative values indicate features that are more abundant in the first-mentioned group in the plot legend, while positive values on x-axis indicate that features are more abundant in the second-mentioned group. Y-axis (significance) shows the −log10 (q values). A larger negative log-transformed q value means stronger statistical significance. Threshold for significance was set as q < 0.05, i.e., −log10 (FDR q value) > 1.3. ANCOMBC2, Analysis of Composition of Microbiomes with Bias Correction 2; Figure S6: Differential taxa abundance at the family and species levels of the gut microbiota of DM2 patients grouped by PNPLA3 rs738409 genotype. (A) Volcano plot from ANCOMBC2 analysis at the family level between CC and GG carriers. (B) Volcano plot from ANCOMBC2 analysis at the family level between CC and heterozygous carriers. (C) Volcano plot from ANCOMBC2 analysis at the family level between heterozygous and GG carriers. (D) Volcano plot from ANCOMBC2 analysis at the species level between CC and GG carriers. (E) Volcano plot from ANCOMBC2 analysis at the species level between CC and heterozygous carriers. (F) Volcano plot from ANCOMBC2 analysis at the species level between heterozygous and GG carriers. In each volcano plot, X-axis (effect size) shows the log2 fold change, which represents the magnitude of the difference between the two analyzed PNPLA3 rs738409 genotypes. Negative values indicate features that are more abundant in the first-mentioned genotype in the plot legend, while positive values on x-axis indicate that features are more abundant in the second-mentioned genotype. Y-axis (significance) shows the −log10 (q values). A larger negative log-transformed q value means stronger statistical significance. Threshold for significance was set as q < 0.05, i.e., −log10 (FDR q value) > 1.3. ANCOMBC2, Analysis of Composition of Microbiomes with Bias Correction 2.

Author Contributions

Conceptualization, Adriana Mabel Álvarez; Formal analysis, Bárbara Suarez and María Florencia Mascardi; Funding acquisition, Adriana Mabel Álvarez, Adrián Gadano and Julieta Trinks; Investigation, Bárbara Suarez, Adriana Mabel Álvarez, María Florencia Mascardi, Ana Laura Manzano Ramos, Dong Hoon Woo, María Mercedes Gutiérrez, Guillermo Alzueta, María del Carmen Basbus, Santiago Bruzone, Patricia Cuart, Guillermo Dieuzeide, Teresita García, Olga Escobar, Ramón Diego José Carulla, Cristina Oviedo, Natalia Segura, Olguita Del Valle Vera and Javier Nicolás Giunta; Methodology, Bárbara Suarez, María Florencia Mascardi and Ana Laura Manzano Ramos; Project administration, Julieta Trinks; Resources, Adrián Gadano; Supervision, Julieta Trinks; Writing – original draft, Bárbara Suarez and Julieta Trinks; Writing – review & editing, Adriana Mabel Álvarez, Adrián Gadano and Julieta Trinks.

Funding

This study was funded by the PUE-CONICET [grant N° 22920200100009CO] and Sociedad Argentina de Diabetes Translational Research Grant 2023. This publication was produced independently by the MASLD Group from Argentine Diabetes Society. Novo Nordisk Pharma Argentina S.A. provided financial support only for the bibliographic search and medical writing of the document, as well as for the publication fees.

Institutional Review Board Statement

Approval was obtained from the Ethics Committee of Hospital Italiano de Buenos Aires.

Informed Consent Statement

Written informed consent was obtained from all study participants.

Data Availability Statement

Raw sequences of 16S rRNA gene reported herein have been deposited in NCBI database (https://www.ncbi.nlm.nih.gov/sra/PRJNA1291719).

Acknowledgements

The authors would like to thank the patients for their cooperation.

Conflicts of Interest

None

References

  1. Younossi, Z.M.; Zelber-Sagi, S.; Lazarus, J.V.; Wong, V.W.; Yilmaz, Y.; Duseja, A.; Eguchi, Y.; Castera, L.; Pessoa, M.G.; Oliveira, C.P.; et al. Global Consensus Recommendations for Metabolic Dysfunction-Associated Steatotic Liver Disease and Steatohepatitis. Gastroenterology 2025, 169, 1017–1032.e2. [Google Scholar] [CrossRef] [PubMed]
  2. Sanyal, A.J.; Castera, L.; Wong, V.W. Noninvasive Assessment of Liver Fibrosis in NAFLD. Clin Gastroenterol Hepatol 2023, 21, 2026–2039. [Google Scholar] [CrossRef] [PubMed]
  3. Trinks, J.; Mascardi, M.F.; Gadano, A.; Marciano, S. Omics-based biomarkers as useful tools in metabolic dysfunction-associated steatotic liver disease clinical practice: How far are we? World J Gastroenterol 2024, 30, 1982–1989. [Google Scholar] [CrossRef]
  4. El-Kassas, M.; Othman, H.A.; Elbadry, M.; Alswat, K.; Yilmaz, Y. Risk Stratification of Patients with Metabolic Dysfunction-associated Steatotic Liver Disease: Steatohepatitis, Fibrosis, and Hepatocellular Carcinoma. J Clin Exp Hepatol 2025, 15, 102415. [Google Scholar] [CrossRef]
  5. Pinto Marques Souza de Oliveira, C.; Pinchemel Cotrim, H.; Arrese, M. Nonalcoholic Fatty Liver Disease Risk Factors in Latin American Populations: Current Scenario and Perspectives. Clin Liver Dis (Hoboken) 2019, 13, 39–42. [Google Scholar] [CrossRef]
  6. Arab, J.P.; Díaz, L.A.; Dirchwolf, M.; Mark, H.E.; Lazarus, J.V.; Vaughan, E.; Méndez-Sánchez, N.; Oliveira, C.P.; Gadano, A.; Arrese, M. NAFLD: Challenges and opportunities to address the public health problem in Latin America. Ann Hepatol 2021, 24, 100359. [Google Scholar] [CrossRef]
  7. Younossi, Z.M.; Kalligeros, M.; Henry, L. Epidemiology of metabolic dysfunction-associated steatotic liver disease. Clin Mol Hepatol 2025, 31, S32–S50. [Google Scholar] [CrossRef] [PubMed]
  8. Diaz, L.A.; Arab, J.P.; Idalsoaga, F.; Perelli, J.; Vega, J.; Dirchwolf, M.; Carreño, J.; Samith, B.; Valério, C.; Moreira, R.O.; et al. Updated recommendations for the management of metabolic dysfunction-associated steatotic liver disease (MASLD) by the Latin American working group. Ann Hepatol 2025, 30, 101903. [Google Scholar] [CrossRef]
  9. Bril, F.; Gray, M. Noninvasive tests to identify liver fibrosis in metabolic dysfunction-associated steatotic liver disease are affected by race. Obesity (Silver Spring) 2024, 32, 612–622. [Google Scholar] [CrossRef]
  10. Tincopa, M.A.; Díaz, L.A.; Huang, D.Q.; Arab, J.P.; Arrese, M.; Gadano, A.; Oliveira, C.P.; Bettencourt, R.; Madamba, E.; Kim, S.; et al. Disparities in screening and risk stratification for Hispanic adults with metabolic dysfunction-associated steatotic liver disease. Hepatology 2025, 81, 1792–1804. [Google Scholar] [CrossRef]
  11. Kozlitina, J.; Sookoian, S. Global Epidemiological Impact of PNPLA3 I148M on Liver Disease. Liver Int 2025, 45, e16123. [Google Scholar] [CrossRef]
  12. Zaiou, M.; Joubert, O. Racial and Ethnic Disparities in NAFLD: Harnessing Epigenetic and Gut Microbiota Pathways for Targeted Therapeutic Approaches. Biomolecules 2025, 15, 669. [Google Scholar] [CrossRef]
  13. Hullar, M.A.J.; Jenkins, I.C.; Randolph, T.W.; Curtis, K.R.; Monroe, K.R.; Ernst, T.; Shepherd, J.A.; Stram, D.O.; Cheng, I.; Kristal, B.S.; et al. Associations of the gut microbiome with hepatic adiposity in the Multiethnic Cohort Adiposity Phenotype Study. Gut Microbes 2021, 13, 1965463. [Google Scholar] [CrossRef]
  14. Belbin, G.M. , Nieves-Colón, M.A.; Kenny, E.E.; Moreno-Estrada, A.; Gignoux, C.R. Genetic diversity in populations across Latin America: implications for population and medical genetic studies. Curr Opin Genet Dev 2018, 53, 98–104. [Google Scholar] [CrossRef]
  15. Byndloss, M.; Devkota, S.; Duca, F.; Niess, J.H.; Nieuwdorp, M.; Orho-Melander, M.; Sanz, Y.; Tremaroli, V.; Zhao, L. The Gut Microbiota and Diabetes: Research, Translation, and Clinical Applications-2023 Diabetes, Diabetes Care, and Diabetologia Expert Forum. Diabetes Care 2024, 47, 1491–1508. [Google Scholar] [CrossRef]
  16. Giunta J, Marciano S, Alzueta G, Basbus M, Bruzzone S, Carulla R, Cicchitti A, et al. Prevalencia de Hígado Graso Asociado a Disfunción Metabólica (MASLD) en Pacientes con Diabetes tipo 2: Estudio Transversal Multicéntrico Argentino [Prevalence of Fatty Liver Associated with Metabolic Dysfunction (MASLD) in Patients with Type 2 Diabetes: An Argentine Multicenter Cross-Sectional Study]. RSAD in press. 2025.
  17. Pontoriero, A.C.; Trinks, J.; Hulaniuk, M.L.; Caputo, M.; Fortuny, L.; Pratx, L.B.; Frías, A.; Torres, O.; Nuñez, F.; Gadano, A.; et al. Influence of ethnicity on the distribution of genetic polymorphisms associated with risk of chronic liver disease in South American populations. BMC Genet 2015, 16, 93. [Google Scholar] [CrossRef]
  18. Apprill, A.; Mcnally, S.; Parsons, R.; Weber, L. Minor Revision to V4 Region SSU RRNA 806R Gene Primer Greatly Increases Detection of SAR11 Bacterioplankton. Aquatic Microbial Ecology 2015, 75, 129–137. [Google Scholar] [CrossRef]
  19. Parada, A.E.; Needham, D.M.; Fuhrman, J.A. Every base matters: assessing small subunit rRNA primers for marine microbiomes with mock communities, time series and global field samples. Environ Microbiol 2016, 18, 1403–1414. [Google Scholar] [CrossRef]
  20. Bolyen, E.; Rideout, J.R.; Dillon, M.R.; Bokulich, N.A.; Abnet, C.C.; Al-Ghalith, G.A.; Alexander, H.; Alm, E.J.; Arumugam, M.; Asnicar, F.; et al. Reproducible, interactive, scalable and extensible microbiome data science using QIIME 2. Nat Biotechnol 2019, 37, 852–857. [Google Scholar] [CrossRef]
  21. 21 Amir, A.; McDonald, D.; Navas-Molina, J.A.; Kopylova, E.; Morton, J.T.; Zech Xu, Z.; Kightley, E.P.; Thompson, L.R.; Hyde, E.R.; Gonzalez, A.; et al. Deblur Rapidly Resolves Single-Nucleotide Community Sequence Patterns. mSystems 2017, 2, e00191-16. [Google Scholar] [CrossRef]
  22. Mirarab, S.; Nguyen, N.; Warnow, T. SEPP: SATé-enabled phylogenetic placement. Pac Symp Biocomput 2012, 247–258. [Google Scholar] [CrossRef]
  23. Bokulich, N.A.; Kaehler, B.D.; Rideout, J.R.; Dillon, M.; Bolyen, E.; Knight, R.; Huttley, G.A.; Gregory Caporaso, J. Optimizing taxonomic classification of marker-gene amplicon sequences with QIIME 2’s q2-feature-classifier plugin. Microbiome 2018, 6, 90. [Google Scholar] [CrossRef]
  24. McDonald, D.; Jiang, Y.; Balaban, M.; Cantrell, K.; Zhu, Q.; Gonzalez, A.; Morton, J.T.; Nicolaou, G.; Parks, D.H.; Karst, S.M.; et al. Greengenes2 unifies microbial data in a single reference tree. Nat Biotechnol 2024, 42, 715–718. [Google Scholar] [CrossRef]
  25. Anderson, M.J. A New Method for Non-Parametric Multivariate Analysis of Variance. Austral Ecology 2001, 26, 32–46. [Google Scholar] [CrossRef]
  26. Lin, H.; Peddada, S.D. Multigroup analysis of compositions of microbiomes with covariate adjustments and repeated measures. Nat Methods 2024, 21, 83–91. [Google Scholar] [CrossRef]
  27. Microbiome R package. Available online: https://doi.org/10.18129/B9.bioc.microbiome (accessed on 7 November 2025).
  28. Wickham, H. ggplot2: Elegant Graphics for Data Analysis, 2nd ed.; Springer-Verlag: New York, USA, 2016. [Google Scholar] [CrossRef]
  29. Cusi, K.; Abdelmalek, M.F.; Apovian, C.M.; Balapattabi, K.; Bannuru, R.R.; Barb, D.; Bardsley, J.K.; Beverly, E.A.; Corbin, K.D.; ElSayed, N.A.; et al. Metabolic Dysfunction-Associated Steatotic Liver Disease (MASLD) in People With Diabetes: The Need for Screening and Early Intervention. A Consensus Report of the American Diabetes Association. Diabetes Care 2025, 48, 1057–1082. [Google Scholar] [CrossRef] [PubMed]
  30. Luisi, P.; García, A.; Berros, J.M.; Motti, J.M.B.; Demarchi, D.A.; Alfaro, E.; Aquilano, E.; Argüelles, C.; Avena, S.; Bailliet, G.; et al. Fine-scale genomic analyses of admixed individuals reveal unrecognized genetic ancestry components in Argentina. PLoS One 2020, 15, e0233808. [Google Scholar] [CrossRef]
  31. Senghor, B.; Sokhna, C.; Ruimy, R.; Lagier, J.C. Gut microbiota diversity according to dietary habits and geographical provenance. Hum Microbiome 2017, 7-8, 1–9. [Google Scholar] [CrossRef]
  32. Wang, Z.; Wu, Y.; Li, X.; Ji, X.; Liu, W. The gut microbiota facilitate their host tolerance to extreme temperatures. BMC Microbiol 2024, 24, 131. [Google Scholar] [CrossRef]
  33. Lee, M.J.; Lee, S.H.; Min, H.; Nam, T.W.; Hong, S.G.; Oh, B.; Kim, J.H.; Kim, Y.R.; Kim, B.S.; Seok, Y.J. Longitudinal gut microbiota dynamics in Antarctic research mission crews. Front Microbiol 2025, 16, 1593617. [Google Scholar] [CrossRef]
  34. Zhou, J.; Zhang, Q.; Zhao, Y.; Zou, Y.; Chen, M.; Zhou, S.; Wang, Z. The relationship of Megamonas species with nonalcoholic fatty liver disease in children and adolescents revealed by metagenomics of gut microbiota. Sci Rep 2022, 12, 22001. [Google Scholar] [CrossRef]
  35. Delaroque, C.; Chervy, M.; Gewirtz, A.T.; Chassaing, B. Social overcrowding impacts gut microbiota, promoting stress, inflammation, and dysglycemia. Gut Microbes 2021, 13, 2000275. [Google Scholar] [CrossRef]
  36. Tamburini, F.B.; Maghini, D.; Oduaran, O.H.; Brewster, R.; Hulley, M.R.; Sahibdeen, V.; Norris, S.A.; Tollman, S.; Kahn, K.; Wagner, R.G.; et al. Short- and long-read metagenomics of urban and rural South African gut microbiomes reveal a transitional composition and undescribed taxa. Nat Commun 2022, 13, 926. [Google Scholar] [CrossRef] [PubMed]
  37. Si, J.; Lee, G.; You, H.J.; Joo, S.K.; Lee, D.H.; Ku, B.J.; Park, S.; Kim, W.; Ko, G. Gut microbiome signatures distinguish type 2 diabetes mellitus from non-alcoholic fatty liver disease. Comput Struct Biotechnol J 2021, 19, 5920–5930. [Google Scholar] [CrossRef] [PubMed]
  38. Mai, H.; Yang, X.; Xie, Y.; Zhou, J.; Wang, Q.; Wei, Y.; Yang, Y.; Lu, D.; Ye, L.; Cui, P.; et al. The role of gut microbiota in the occurrence and progression of non-alcoholic fatty liver disease. Front Microbiol 2024, 14, 1257903. [Google Scholar] [CrossRef]
  39. Natividad, J.M.; Lamas, B.; Pham, H.P.; Michel, M.L.; Rainteau, D.; Bridonneau, C.; da Costa, G.; van Hylckama Vlieg, J.; Sovran, B.; Chamignon, C.; et al. Bilophila wadsworthia aggravates high fat diet induced metabolic dysfunctions in mice. Nat Commun 2018, 9, 2802. [Google Scholar] [CrossRef]
  40. Zhang, Z.; Mocanu, V.; Deehan, E.C.; Hotte, N.; Zhu, Y.; Wei, S.; Kao, D.H.; Karmali, S.; Birch, D.W.; Walter, J.; et al. Recipient microbiome-related features predicting metabolic improvement following fecal microbiota transplantation in adults with severe obesity and metabolic syndrome: a secondary analysis of a phase 2 clinical trial. Gut Microbes 2024, 16, 2345134. [Google Scholar] [CrossRef]
  41. Kyriachenko, Y.; Falalyeyeva, T.; Korotkyi, O.; Molochek, N.; Kobyliak, N. Crosstalk between gut microbiota and antidiabetic drug action. World J Diabetes 2019, 10, 154–168. [Google Scholar] [CrossRef] [PubMed]
  42. Speliotes, E.K.; Schneider, C.V. PNPLA3 I148M Interacts With Environmental Triggers to Cause Human Disease. Liver Int 2025, 45, e16106. [Google Scholar] [CrossRef]
  43. Luo, Z.; Liu, Y.; Li, H.; Zhou, Y.; Peng, Y.; Lin, X.; Fang, Y.; Wan, J.; Wei, B. Associations of PNPLA3 rs738409 Polymorphism with Plasma Lipid Levels: A Systematic Review and Meta-Analysis. Horm Metab Res 2022, 54, 686–695. [Google Scholar] [CrossRef]
  44. Machado, C.M.; Leite, N.C.; França, P.H.; Cardoso, C.R.; Salles, G.F.; Villela-Nogueira, C.A. PNPLA3 gene polymorphism in Brazilian patients with type 2 diabetes: A prognostic marker beyond liver disease? Nutr Metab Cardiovasc Dis 2019, 29, 965–971. [Google Scholar] [CrossRef]
  45. Luukkonen, P.K.; Nick, A.; Hölttä-Vuori, M.; Thiele, C.; Isokuortti, E.; Lallukka-Brück, S.; Zhou, Y.; Hakkarainen, A.; Lundbom, N.; Peltonen, M.; et al. Human PNPLA3-I148M variant increases hepatic retention of polyunsaturated fatty acids. JCI Insight 2019, 4, e127902. [Google Scholar] [CrossRef]
  46. Dentin, R.; Benhamed, F.; Pégorier, J.P.; Foufelle, F.; Viollet, B.; Vaulont, S.; Girard, J.; Postic, C. Polyunsaturated fatty acids suppress glycolytic and lipogenic genes through the inhibition of ChREBP nuclear protein translocation. J Clin Invest Oct 2005, 115, 2843–2854. [Google Scholar] [CrossRef]
  47. Takeuchi, Y.; Yahagi, N.; Izumida, Y.; Nishi, M.; Kubota, M.; Teraoka, Y.; Yamamoto, T.; Matsuzaka, T.; Nakagawa, Y.; Sekiya, M.; et al. Polyunsaturated fatty acids selectively suppress sterol regulatory element-binding protein-1 through proteolytic processing and autoloop regulatory circuit. J Biol Chem 2010, 285, 11681–11691. [Google Scholar] [CrossRef]
  48. Tilg, H.; Adolph, T.E.; Moschen, A.R. Multiple Parallel Hits Hypothesis in Nonalcoholic Fatty Liver Disease: Revisited After a Decade. Hepatology 2021, 73, 833–842. [Google Scholar] [CrossRef]
  49. Li, Z.; Ni, M.; Yu, H.; Wang, L.; Zhou, X.; Chen, T.; Liu, G.; Gao, Y. Gut Microbiota and Liver Fibrosis: One Potential Biomarker for Predicting Liver Fibrosis. Biomed Res Int 2020, 2020, 3905130. [Google Scholar] [CrossRef]
  50. Xu, H.; Fang, F.; Wu, K.; Song, J.; Li, Y.; Lu, X.; Liu, J.; Zhou, L.; Yu, W.; Yu, F.; et al. Gut microbiota-bile acid crosstalk regulates murine lipid metabolism via the intestinal FXR-FGF19 axis in diet-induced humanized dyslipidemia. Microbiome 2023, 11, 262. [Google Scholar] [CrossRef]
Figure 1. Association of the genotype of the rs738409 polymorphism in the PNPLA3 gene with FIB-4 score (A), fasting blood glucose levels (B), HbA1c (C), and serum total cholesterol concentrations (D) in enrolled patients. Mean values and standard deviations, odds ratios (ORs), and P values from multivariate logistic regression analysis are shown.
Preprints 185496 g001
Figure 2. Bacterial diversity and taxa abundance differences of the gut microbiota of DM2 patients from various geographical regions in Argentina. (A) Shannon diversity index plotted based on the geographical origin of the samples. (B) Unweighted UniFrac distances (beta diversity) plotted based on the geographical region of origin of the samples. (C) Weighted UniFrac distances (beta diversity) plotted based on the geographical region of origin of the samples. (D) Core microbiome for samples from BA city. (E) Core microbiome for samples from SOUTH. (F) Core microbiome for samples from rural BA. (G) Core microbiome for samples from NWA. (H) Venn diagrams represent shared core genera between groups. Core genera were defined as 0.1% of detection and 50% of prevalence. (I) Volcano plot from ANCOMBC2 analysis at the genus level between BA city and rural BA. (J) Volcano plot from ANCOMBC2 analysis at the genus level between NWA and SOUTH. (K) Volcano plot from ANCOMBC2 analysis at the genus level between BA city and SOUTH. (L) Volcano plot from ANCOMBC2 analysis at the genus level between rural BA and SOUTH. (M) Volcano plot from ANCOMBC2 analysis at the genus level between BA city and NWA. (N) Volcano plot from ANCOMBC2 analysis at the genus level between NWA and rural BA. In each volcano plot, X-axis (effect size) shows the log2 fold change, which represents the magnitude of the difference between the two analysed geographical regions. Negative values indicate features that are more abundant in the first- mentioned region in the plot legend, while positive values on x-axis indicate that features are more abundant in the second-mentioned geographical region. Y-axis (significance) shows the −log10 (q values). A larger negative log-transformed q value means stronger statistical significance. Threshold for significance was set as q < 0.05, i.e., −log10 (FDR q value) > 1.3. ANCOMBC2, Analysis of Composition of Microbiomes with Bias Correction 2.
Preprints 185496 g002
Figure 3. Bacterial diversity and taxa abundance differences of the gut microbiota of DM2 patients with or without MASLD. (A) Shannon diversity index plotted based on MASLD diagnosis. (B) Weighted UniFrac distances (beta diversity) plotted based on MASLD diagnosis. (C) Unweighted UniFrac distances (beta diversity) plotted based on MASLD diagnosis. (D) Core microbiome for MASLD samples. (E) Core microbiome for non-MASLD samples. (F) Venn diagrams represent shared core genera between groups. Core genera were defined as 0.1% of detection and 50% of prevalence. (G) Volcano plot from ANCOMBC2 analysis at the genus level between non-MASLD and MASLD samples. X-axis (effect size) shows the log2 fold change, which represents the magnitude of the difference between the two analysed groups. Negative values indicate features that are more abundant in the non-MASLD group, while positive values on x-axis indicate that features are more abundant in the MASLD group. Y-axis (significance) shows the −log10 (q values). A larger negative log-transformed q value means stronger statistical significance. Threshold for significance was set as q < 0.05, i.e., −log10 (FDR q value) > 1.3. ANCOMBC2, Analysis of Composition of Microbiomes with Bias Correction 2.
Preprints 185496 g003
Figure 4. Bacterial diversity and taxa abundance differences of the gut microbiota of DM2 patients grouped by FIB-4 score. (A) Shannon diversity index plotted based on FIB-4 score. (B) Unweighted UniFrac distances (beta diversity) plotted based on FIB-4 score. (C) Weighted UniFrac distances (beta diversity) plotted based on FIB-4 score. (D) Core microbiome for patients with FIB-4 <1.3. (E) Core microbiome for patients with FIB-4=1.3-2.67. (F) Core microbiome for patients with FIB-4 >2.67. (G) Venn diagrams represent shared core genera between groups. Core genera were defined as 0.1% of detection and 50% of prevalence. (H) Volcano plot from ANCOMBC2 analysis at the genus level between FIB-4 >2.67and FIB-4 <1.3. (I) Volcano plot from ANCOMBC2 analysis at the genus level between FIB-4 >2.67 and FIB-4=1.3-2.67. (J) Volcano plot from ANCOMBC2 analysis at the genus level between FIB-4 <1.3 and FIB-4=1.3-2.67. In each volcano plot, X-axis (effect size) shows the log2 fold change, which represents the magnitude of the difference between the two analysed groups. Negative values indicate features that are more abundant in the first-mentioned group in the plot legend, while positive values on x-axis indicate that features are more abundant in the second-mentioned group. Y-axis (significance) shows the −log10 (q values). A larger negative log-transformed q value means stronger statistical significance. Threshold for significance was set as q < 0.05, i.e., −log10 (FDR q value) > 1.3. ANCOMBC2, Analysis of Composition of Microbiomes with Bias Correction 2.
Preprints 185496 g004
Figure 5. Bacterial diversity and taxa abundance differences of the gut microbiota of DM2 patients grouped by PNPLA3 rs738409 genotype. (A) Shannon diversity index plotted based on PNPLA3 genotype. (B) Weighted UniFrac distances (beta diversity) plotted based on PNPLA3 rs738409 genotype. (C) Unweighted UniFrac distances (beta diversity) plotted based on PNPLA3 rs738409 genotype. (D) Core microbiome for GG carriers. (E) Core microbiome for heterozygous carriers. (F) Core microbiome for CC carriers. (G) Venn diagrams represent shared core genera between groups. Core genera were defined as 0.1% of detection and 50% of prevalence. (H) Volcano plot from ANCOMBC2 analysis at the genus level between CC and GG carriers. (I) Volcano plot from ANCOMBC2 analysis at the genus level between CC and heterozygous carriers. (J) Volcano plot from ANCOMBC2 analysis at the genus level between heterozygous carriers and GG carriers. In each volcano plot, X-axis (effect size) shows the log2 fold change, which represents the magnitude of the difference between the two analysed PNPLA3 genotypes. Negative values indicate features that are more abundant in the first-mentioned genotype in the plot legend, while positive values on x-axis indicate that features are more abundant in the second-mentioned genotype. Y-axis (significance) shows the −log10 (q values). A larger negative log-transformed q value means stronger statistical significance. Threshold for significance was set as q < 0.05, i.e., −log10 (FDR q value) > 1.3. ANCOMBC2, Analysis of Composition of Microbiomes with Bias Correction 2.
Preprints 185496 g005
Table 1. Characteristics of the recruited patients.
ALL (n=214) BA City (n=71) Rural BA (n=40) NEA (n=20) NWA (n=52) SOUTH (n=31) q Value
Age, years, median (IQR) 61.7 (14) 62.5 (17.25) 63 (13.5) 63.6 (11) 62.9 (10) 59.9 (14) 0.07
Male gender, % 51.60% 51.60% 55% 40% 61.10% 60% 0.2
BMI, kg/m2, median (IQR) 32.3 (7) 32.5 (6.75) 32.9 (5) 32.2 (6.75) 31.1 (5) 31.8 (8) 0.06
Waist circumference, cm, median (IQR) 105.5 (14) 106.4 (22) 105.7 (12.75) 102.8 (9.75) 104.3 (14.75) 103.5 (17) 0.006
Time since T2DM diagnosis, years, median (IQR) 11.1 (10.25) 12.1 (10) 12.6 (15.5) 12.9 (14.25) 11.1 (11) 8.9 (7) 0.1
Physical activity, % 48.9% 50% 28% 82% 59.4% 35.5% 0.005
HbA1c, %, median (IQR) 7 (1.5) 6 (1.5) 7 (1.55) 6.95 (1.925) 6.5 (1.9) 8 (3.75) 0.4
Fasting plasma glucose, mg/dL, median (IQR) 116 (40.5) 119 (40) 116 (48.75) 126.5 (35.5) 115 (33) 114 (107) 0.5
Total platelets, cells per mm3, median (IQR) 234000 (73500) 243000 (68550) 212500 (93500) 232000 (71500) 223000 (70500) 253000 (72000) 0.38
ALT, IU/L, median (IQR) 23 (18.5) 22 (15.5) 22 (22.5) 25.5 (10.35) 24 (19) 30 (34) 0.11
AST, IU/L, median (IQR) 21 (11.5) 19 (9.5) 23 (13.5) 24.5 (7.2) 19 (16.5) 26 (19) 0.03
Total cholesterol, mg/dL, median (IQR) 165.5 (53.5) 152.5 (55.25) 163 (55.5) 175.5 (39.25) 165 (53.5) 187 (73) 0.01
Triglycerides, mg/dL, median (IQR) 136 (77) 112 (49) 142 (80) 166.5 (120.5) 135 (76) 166 (77) 0.48
High blood pressure, % 68.90% 74.20% 77.50% 80% 48.60% 61.30% 0.03
Cardiovascular risk, high to critic, % 62.10% 74.20% 95% 95% 75.70% 71% 0.02
PNPLA3, GG genotype, % 50% 40.30% 45% 60% 64.90% 51% 0.14
Diagnosis of MASL, % 77.90% 74.20% 80% 85% 76% 83.90% 0.75
FIB-4 score higher than 1.3, % 44.7% 32.3% 65% 55% 40.5% 35.5% 0.01
IQR: interquartile range.
Disclaimer/Publisher’s Note: The statements, opinions and data contained in all publications are solely those of the individual author(s) and contributor(s) and not of MDPI and/or the editor(s). MDPI and/or the editor(s) disclaim responsibility for any injury to people or property resulting from any ideas, methods, instructions or products referred to in the content.
Copyright: This open access article is published under a Creative Commons CC BY 4.0 license, which permit the free download, distribution, and reuse, provided that the author and preprint are cited in any reuse.
Prerpints.org logo

Preprints.org is a free preprint server supported by MDPI in Basel, Switzerland.

Subscribe

Disclaimer

Terms of Use

Privacy Policy

Privacy Settings

© 2025 MDPI (Basel, Switzerland) unless otherwise stated