Submitted:
14 November 2025
Posted:
21 November 2025
You are already at the latest version
Abstract
This study investigates the spatial and temporal dynamics of carbon dioxide (CO₂) and methane (CH₄) in the Hefei region from 2009 to 2020 using satellite-based column ob-servations (GOSAT) and the HYSPLIT model. The results reveal a significant increasing trend for both greenhouse gases, with Hefei's CO₂ growth rate (2.43 ppm/year) exceed-ing the global average. Pronounced seasonal cycles were identified: CO₂ concentrations peak in winter due to enhanced fossil fuel combustion for heating and weakened plant photosynthesis, and reach a minimum in summer owing to strong biospheric carbon uptake. In contrast, CH₄ concentrations are highest in summer and autumn, likely driven by agricultural activities such as rice cultivation, and lowest in winter and spring. Diurnal variations show a synchronous pattern for CO₂ and CH₄, peaking around noon, influenced by the interplay of anthropogenic emission cycles and plane-tary boundary layer dynamics. Backward trajectory analysis and clustering further elu-cidate that the transport pathways and source regions of greenhouse gases are domi-nantly controlled by the East Asian monsoon. The summer is characterized by clean, locally-influenced marine air masses, while the winter is predominantly influenced by long-range transport from the polluted northwestern interior of China, which acts as a critical pollution corridor. This research underscores the combined roles of local an-thropogenic activities, regional transport, and meteorological systems in driving the characteristics of greenhouse gases in an inland subtropical city.
Keywords:
carbon dioxide (CO₂)
; methane (CH₄)
; greenhouse gases
; HYSPLIT trajectory model
; seasonal variation
1. Introduction
The relentless increase of atmospheric greenhouse gases (GHGs), primarily carbon dioxide (CO₂) and methane (CH₄), constitutes a primary driver of global climate change, demanding urgent policy responses from local to global scales [1]. Scientific monitoring provides the indispensable foundation for these actions, from validating the effectiveness of international agreements like the Paris Accord to shaping national carbon neutrality strategies. However, a significant gap exists between global-scale models and the granular, city-level data required for targeted mitigation, as highlighted by studies in other urban environments [2]. As a major urban center and a hub of scientific innovation in China, Hefei represents a critical, yet understudied, case. Investigating the variation trends of CO₂ and CH₄ here is therefore not merely an academic exercise, but a crucial step in bridging science and policy, offering a template for understanding the emissions dynamics of rapidly developing Chinese cities.
While the annual growth of atmospheric CO₂ and CH₄ is a global phenomenon, as underscored by IPCC (2022), their exact multi-year trends and seasonal amplitude variations at the city level exhibit significant heterogeneity, as documented in studies of other Chinese metropolises [3]. For Hefei, a critical knowledge gap persists: the relative contributions of key drivers—such as fossil fuel combustion, biogenic activities, and meteorological conditions—remain unquantified for this specific region. This study systematically investigates these trends by employing long-term, ground-based observational data and establishes a statistical model to attribute their variability, drawing on methodologies refined in urban greenhouse gas studies [4]. By doing so, it seeks to determine whether the observed changes in Hefei align with broader global patterns or exhibit distinct characteristics driven by local urban processes. This paper addresses the question of what the specific long-term trends and seasonal dynamics of CO₂ and CH₄ are in Hefei, and to what extent they are driven by local anthropogenic and natural factors.
To effectively monitor global greenhouse gas concentrations, satellite remote sensing has become an indispensable tool, overcoming the limitations of sparse ground-based networks through its continuous, large-scale coverage. This capability is demonstrated by specialized satellites like GOSAT [5,6] and the OCO-2 [7,8], which were launched specifically to observe atmospheric carbon. These missions hold profound significance for carbon cycle science. The data they provide are crucial not only for tracking real-time concentration fields but also for independently verifying emission inventories and informing international climate mitigation efforts, as highlighted by the IPCC (2022).
Within the global framework for satellite monitoring of greenhouse gases, China's independent research efforts, while initiating after those of other space agencies, have shown decisive and strategic advancement. The launch of the TanSat carbon satellite in late 2016 was a critical milestone, providing a new and independent data stream for global carbon flux inversion models [9,10,11,12]. The ongoing enhancement of China's capabilities is demonstrated by the synergistic use of multiple orbiting platforms, such as TanSat and the Fengyun-3D satellite [13]. This burgeoning fleet significantly strengthens China's autonomous monitoring capacity and, as noted by the World Meteorological Organization, enriches the overall integrity of the global observing system for climate-relevant gases [14].
This study provides several key contributions to the understanding of urban greenhouse gas (GHG) dynamics by conducting a comprehensive analysis of CO₂ and CH₄ in Hefei, China, a representative inland city. It addresses a critical data gap by providing a systematic, long-term analysis of GHG trends in an understudied inland urban center. Previous research on GHG dynamics in Chinese cities has predominantly focused on major coastal metropolises like Beijing and Shanghai, creating a knowledge gap regarding rapidly developing inland hubs [15,16,17,18,19,20,21]. This research fills this void by employing twelve years (2009-2020) of GOSAT satellite observations to delineate the precise long-term trends, growth rates, and seasonal cycles of CO₂ and CH₄ over Hefei, thereby offering a vital case study and a foundational dataset for this region, in contrast to the reliance on national-scale inventories.
The research elucidates the complex drivers of urban methane variability, moving beyond simplistic attributions. While agricultural sources are often cited as the primary driver of CH₄ in regional studies, the complex interplay of local emissions and regional transport remains poorly quantified for specific cities [22,23,24,25]. Our study not only confirms the overall upward trend but, crucially, reveals the significant interannual variability and distinct summer peak in Hefei's CH₄ concentrations. By integrating local data with HYSPLIT backward trajectory analysis, we disentangle the contributions of local agricultural emissions from those of cross-regional transport, providing a more nuanced mechanistic understanding of urban CH₄ drivers that aligns with calls for more source-apportionment studies [26].
It innovatively combines analytical methods to quantify the role of regional transport, offering direct policy implications. Many city-level studies prioritize local emission inventories, often underestimating the impact of atmospheric transport on observed concentrations. This work employs an integrated approach, correlating spatiotemporal concentration data with CO/CO₂ correlation analysis and air mass trajectory modelling. This allows us to definitively show that the seasonal GHG pattern in Hefei is governed by the East Asian monsoon, identifying a northwesterly "pollution transport corridor" in winter as a key driver of CO₂ peaks. This finding provides direct scientific evidence to inform the development of coordinated cross-regional emission mitigation strategies, a critical yet underdeveloped area of climate policy.
2. Description of the Study Area, Data Sources, and Methodology
Hefei, located in Anhui Province, is an inland city situated at 31°49′21.30″ north latitude and 117°13′18.25″ east longitude, with an altitude of 37.51 meters. It has a subtropical inland climate, and the annual average temperature in Hefei is 24°C.The data used in this study are derived from the L2 standard carbon dioxide and methane product data of the GOSAT satellite. We analyzed the trends of CO2 and CH4, two carbon-containing greenhouse gases, in the Hefei area from 2009 to 2020. Taking Hefei as the reference center, a rectangular area of ±1.5° around it is used as the sample for the Hefei region.
To remove the effects of surface pressure variation, the column-averaged dry air mole fraction (DMF) is defined as (1), using the column abundance of O2 as a reference for reduce the systematic errors:
Where column gas and column O2 are the column abundance of the retrieval gas and O2 respectively.
The HYSPLIT (Hybrid Single Particle Lagrangian Integrated Trajectory) model, developed by the National Oceanic and Atmospheric Administration (NOAA) of the United States in collaboration with the Environmental Protection Agency (EPA), is an air quality model widely employed to investigate the transport of atmospheric pollutants.
Cluster analysis is a method that groups samples into distinct categories by identifying a statistic capable of objectively reflecting the proximity between individual samples. The HYSPLIT model employs this technique to group a large number of trajectories based on their spatial similarity. It utilizes a hierarchical clustering algorithm, specifically the agglomerative method. When merging clusters, HYSPLIT provides two primary methods: the average linkage method and Ward's method. Due to its robustness against the influence of anomalous trajectories, the average linkage method was adopted for the backward trajectory analysis in this study. Its formula is presented below:
3. Results and Discussion
3.1. Changes in CO2 and CH4 Column Concentrations in Hefei Region
This study reveals significant temporal variations in the column-averaged concentrations of carbon dioxide (XCO₂) and methane (XCH₄) over the Hefei region. Analysis of ground-based and satellite observations from 2009 to 2020 indicates a clear upward trend in both gases. Figure 1 displays the annual average changes in CO2 concentrations in Hefei from 2009 to 2020. Overall, CO2 concentrations showed an upward trend during this period, with a slight decrease only in 2014 and steady increases in all other years. Specifically, from 2009 to 2020, CO2 concentrations rose from 388.12ppm to 414.82ppm, representing a net increase of 26.70ppm and an annual growth rate of 2.43ppm/year.
When comparing Figure 1 with Figure 2, it is evident that the annual growth rate of CO2 concentrations in Hefei is higher than the global average. This discrepancy may be attributed to the inclusion of sparsely populated areas in the global data, which tends to lower the overall figure. In contrast, Hefei, as a densely populated city, naturally reports higher CO2 concentrations. However, it is noteworthy that Hefei's CO2 concentration in 2020 was approximately 414.82ppm, which is quite close to the global average of 410.60ppm. This similarity further confirms the global nature of CO2 concentration increases. From a broader perspective, the impact of global climate change is also evident. According to the “Global Climate Change Indicators Report” the human-induced warming over the past decade (2014-2023) has risen to 1.19℃, higher than the 1.14℃ of the previous decade2. This data not only echoes the upward trend in CO2 concentrations but also reminds us once again of the severity of global climate change.
Methane emissions and its contribution to global warming are second only to carbon dioxide. Globally, methane emissions are growing rapidly, and since the Industrial Revolution, human-induced methane emissions have contributed about a quarter to global warming. The anthropogenic sources of methane are widespread, including coal mining, oil and gas leaks, rice cultivation, ruminant digestion, animal manure, fuel combustion, landfill, and wastewater treatment. Among them, agriculture is the primary source of methane, with 32% of agricultural methane emissions coming from ruminant digestion and 8% from rice cultivation. Hefei has a total cultivated area of 486,300 hectares, of which 414,100 hectares are paddy fields, accounting for 85.15%.
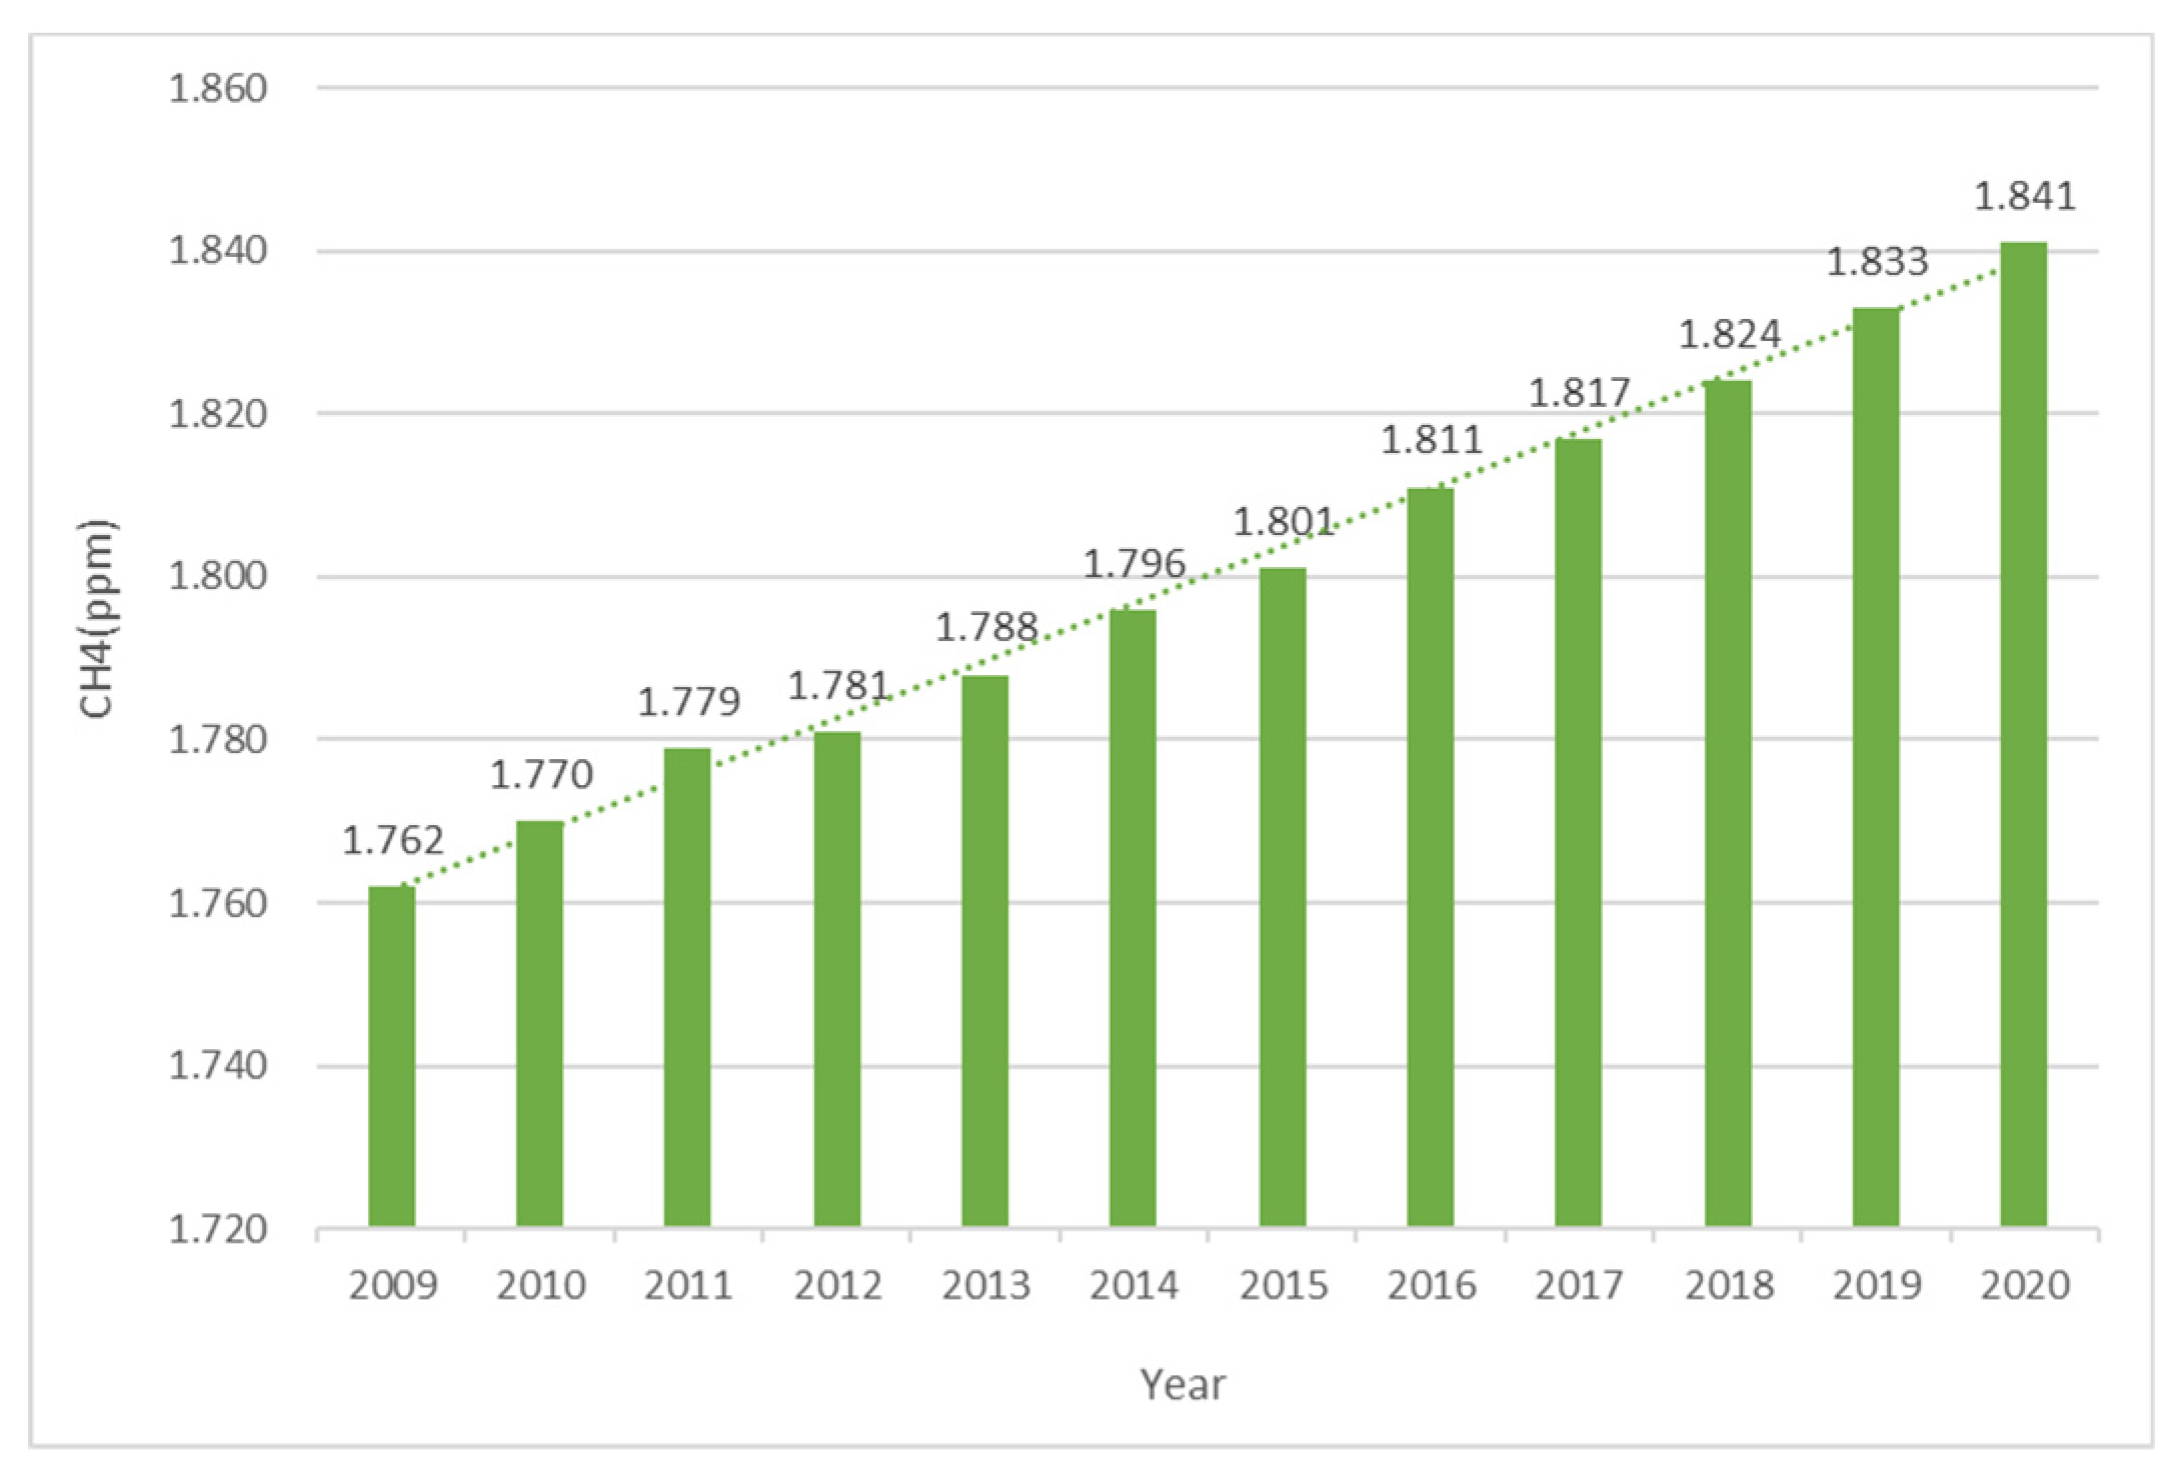
Figure 3 visually presents the trend of CH4 concentration from 2009 to 2020. During this period, the overall CH4 concentration showed an upward trend, but the growth process was unstable. Specifically, from 2009 to 2011, the CH4 concentration decreased by a total of 9 ppb. However, in 2012, the concentration suddenly increased by 26 ppb, and although it stabilized afterwards, it still exhibited a downward trend. By 2016, the CH4 concentration rose significantly again, reaching 30 ppb. Over these 11 years, the net increase in CH4 concentration was 72 ppb, with an annual growth rate of approximately 6.545 ppb/year. The growth process of CH4 concentration was quite intense, indicating that besides natural sources, fluctuations in anthropogenic sources had a significant impact on CH4 concentrations. Compared with global CH4 data, the annual growth rate in Hefei was relatively low. However, in 2009, the CH4 concentration in Hefei was 51 ppb higher than the global figure. This indirectly suggests that CH4 concentrations tend to be higher in densely populated areas. Looking at the data for 2020, the CH4 concentration in Hefei was 1.885 ppm, slightly higher than the global average for that year, but the difference was not significant. Overall, although the data from Hefei and the global average were generally similar, the fluctuations in Hefei's data were greater. This was mainly attributed to the large population and the influence of human activities.
Figure 3.
The trend of CH4 column concentration in Hefei from 2009 to 2020.
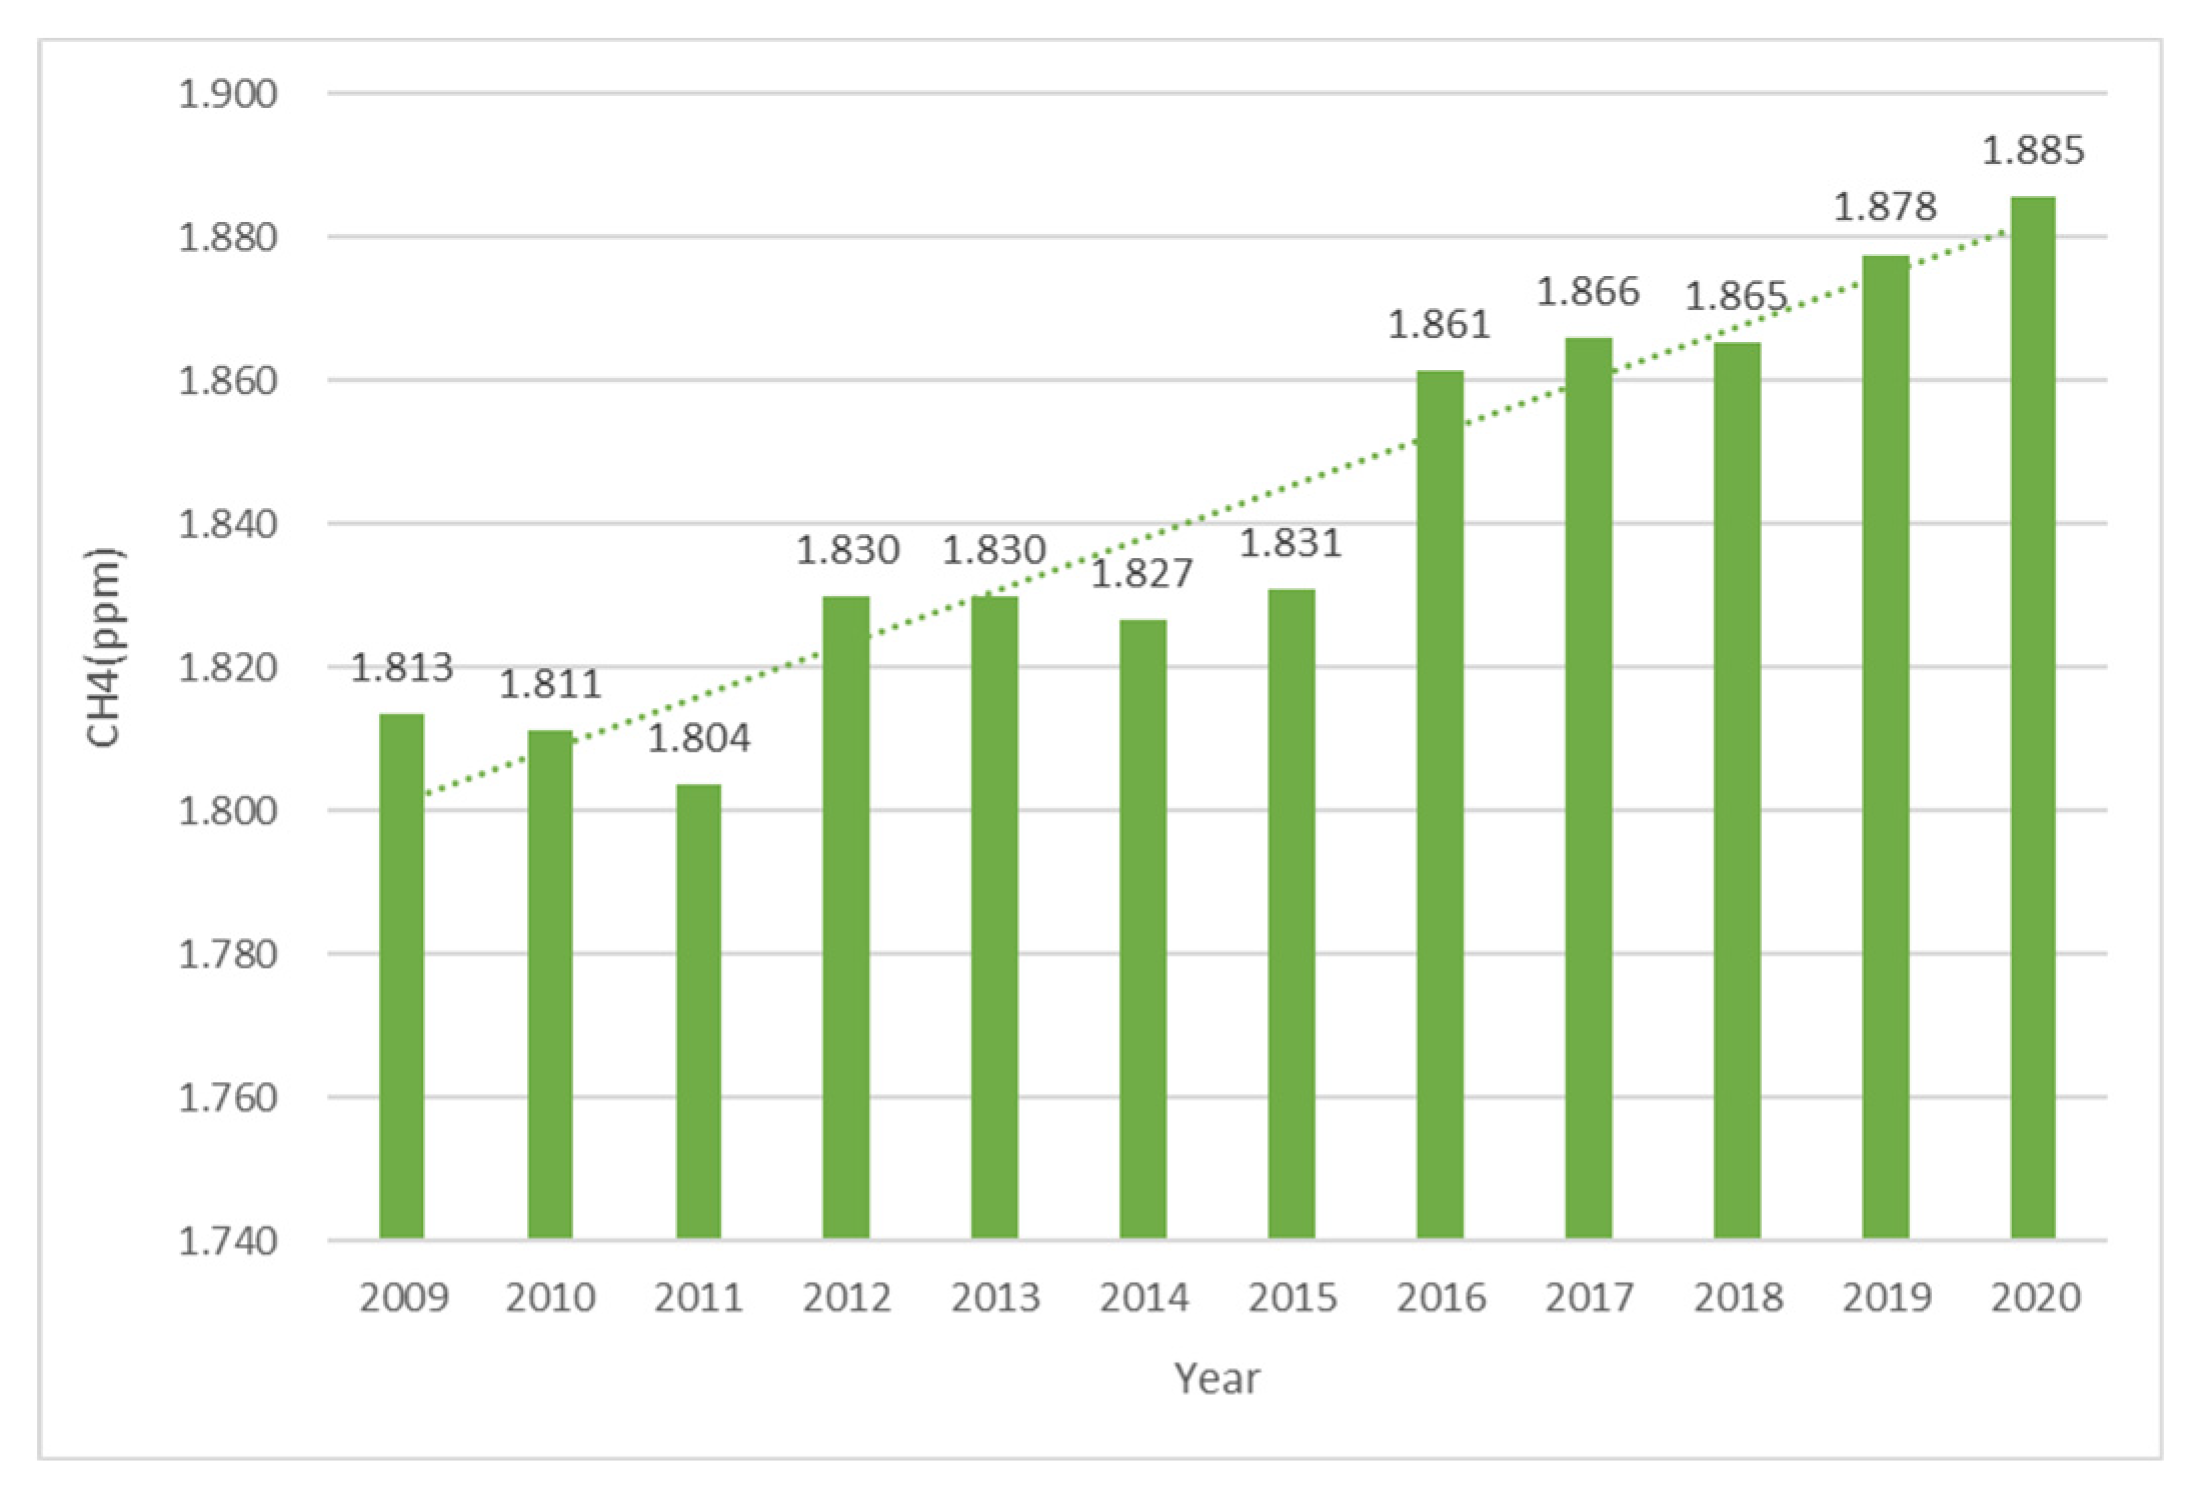
Figure 4.
The trend of global CH4 concentration from 2009 to 2020.
3.2. The Seasonal Variation of Column Concentrations of Greenhouse Gases CO2 and CH4
The concentration of greenhouse gases (such as carbon dioxide, methane, etc.) in the atmosphere is not constant. They are subject to variations influenced by multiple natural and human factors. Seasonal changes are one of the important influencing factors. Due to seasonal climate variations (such as temperature, precipitation, wind direction, etc.) and changes in human activities (such as fossil fuel combustion, agricultural production, etc.), the concentration of greenhouse gases may exhibit seasonal fluctuations. The impact of seasonal changes on the greenhouse effect is mainly reflected in variations in greenhouse gas concentration and distribution, changes in Earth's surface temperature, and the resulting alterations in climate patterns.
Firstly, seasonal changes affect the concentration and distribution of greenhouse gases. Human activities (such as fossil fuel combustion) and natural processes (such as plant growth and decay) differ across seasons, leading to variations in the emission and absorption rates of greenhouse gases. For example, during winter, the increased demand for heating may result in a rise in the use of fossil fuels like coal and oil, subsequently increasing emissions of greenhouse gases such as carbon dioxide. These seasonal changes impact the total amount and distribution of greenhouse gases in the atmosphere, thereby influencing the greenhouse effect. Secondly, seasonal changes lead to variations in Earth's surface temperature, which is also a significant manifestation of the greenhouse effect. Due to the periodic changes in Earth's rotation and revolution, the angle and intensity of solar radiation reaching Earth vary with seasons, causing changes in Earth's surface temperature. These temperature variations affect the absorption and radiation characteristics of greenhouse gases like water vapor and carbon dioxide in the atmosphere, further regulating the greenhouse effect. Lastly, seasonal changes also trigger alterations in climate patterns. The global warming caused by the greenhouse effect exacerbates the instability of the climate system, increasing the frequency and intensity of extreme weather events (such as heatwaves, droughts, heavy rainfall, etc.). These extreme weather events are often closely related to seasonal changes; for instance, high temperatures and heatwaves are more likely to occur in summer, while cold waves and snowfall are more prevalent in winter. These changes in climate patterns not only affect human production and life but also have profound impacts on ecosystems and the natural environment. Specifically, during winter, the increased demand for heating may lead to a rise in the use of fossil fuels like coal and oil, resulting in higher emissions of greenhouse gases such as carbon dioxide. Additionally, the atmospheric structure is relatively stable in winter, which is not conducive to the dispersion of pollutants, potentially leading to an increase in greenhouse gas concentrations in the atmosphere. Conversely, in summer, the higher temperatures make the atmospheric structure relatively unstable, favoring the dispersion of pollutants. However, these seasonal changes are not absolute, as greenhouse gas concentrations are also influenced and diluted by factors such as global climate change, the intensity of human activities, geographical location, and others, which may result in relatively lower concentrations of greenhouse gases.
Hefei's climate is classified as a subtropical humid monsoon climate, with distinct seasons, each possessing its unique climatic characteristics. For instance, spring is characterized by heavy rainfall, summer by intense heat, autumn by cool temperatures, and winter by cold weather. These seasonal variations not only influence weather patterns but also have profound impacts on the local ecology, agriculture, and residents' lives. In this paper, the data from March to May is considered as spring, June to August as summer, September to November as autumn, and December to February as winter.
Figure 5 displays the trend of XCO2 concentration over time (from 2010 to 2020) across different seasons (winter, spring, summer, and autumn) in Hefei. By fitting the data points with a linear regression model, it is evident from the figure that XCO2 concentrations exhibit an annual increasing trend in all seasons. The rates of increase are relatively stable in winter, spring, and autumn, whereas in summer, the rate fluctuates, resulting in a slightly lower R² value and a poorer fit between the model and the data. For winter, spring, and autumn, the data points show a consistent yearly upward trend, with high R² values (above 0.95) for the linear regression equations, indicating a good fit between the model and the data. The slopes for all four seasons are greater than 2.3, suggesting that the annual growth rate of XCO2 is above 2.3 ppmv for each season. The growth rates for spring, summer, and winter hover around 2.3, while the growth rate for autumn reaches 2.7 ppmv, possibly due to weakened plant photosynthesis and enhanced respiration, as well as human activities such as burning crop residues like wheat straw. The figure also reveals significant seasonal variations in CO2 concentrations in the region. Specifically, CO2 concentrations are generally lower in summer and higher in winter. This seasonal pattern is particularly pronounced in Hefei's atmosphere. During summer, enhanced plant photosynthesis leads to the absorption of large amounts of CO2, reducing its concentration in the atmosphere. Conversely, in winter, weakened plant photosynthesis coupled with increased human activities such as heating contribute to higher CO2 emissions, thereby elevating atmospheric CO2 concentrations. Overall, the seasonal changes in CO2 concentrations in Hefei are influenced by a combination of factors, including plant photosynthesis, human activities, and meteorological conditions.
The Figure 6 illustrates the trend of XCH4 over time from 2010 to 2020. It is evident from the figure that the concentration of CH4 in the atmosphere of Hefei exhibits distinct seasonal variations and an annual upward trend. The column concentration of CH4 in Hefei is higher during summer and autumn, while it is relatively lower in winter and spring. This seasonal variation may be attributed to complex factors such as the balance between sources and sinks, as well as meteorological and climatic conditions. For instance, during summer, enhanced plant activity and potential increased emission sources (such as agricultural activities) may lead to an increase in atmospheric CH4 concentration. Conversely, in winter, weakened plant activity, reduced emission sources, and possibly poorer atmospheric dispersion conditions result in relatively lower CH4 concentrations. The linear fit coefficients for all four seasons are above 0.92 (with potential bias in the fit for autumn due to limited data), indicating a good fit. Despite seasonal fluctuations, the overall concentration of CH4 in the atmosphere of Hefei shows a gradual annual increase. XCH4 exhibits an upward trend in different seasons, but the rate and variability of this increase differ. The rates of increase are relatively slower in winter and autumn, while the fastest increase is observed in summer, with an average annual growth rate of XCH4 reaching 0.014 ppmv.
3.3. The Correlation Between XCH4 and XCO2
The main sources of carbon dioxide include natural processes and human activities. Natural processes such as respiration and volcanic eruptions, and human activities such as fossil fuel combustion and deforestation. Carbon dioxide is one of the main components of greenhouse gases. The increase of its concentration will lead to the intensification of the greenhouse effect, which will lead to a series of environmental problems such as global warming, glacier melting, sea level rise and so on. Carbon monoxide mainly comes from incomplete combustion of carbonaceous substances, such as coal, wood, natural gas, etc. Automobile exhaust, factory exhaust and indoor heating equipment are common sources.
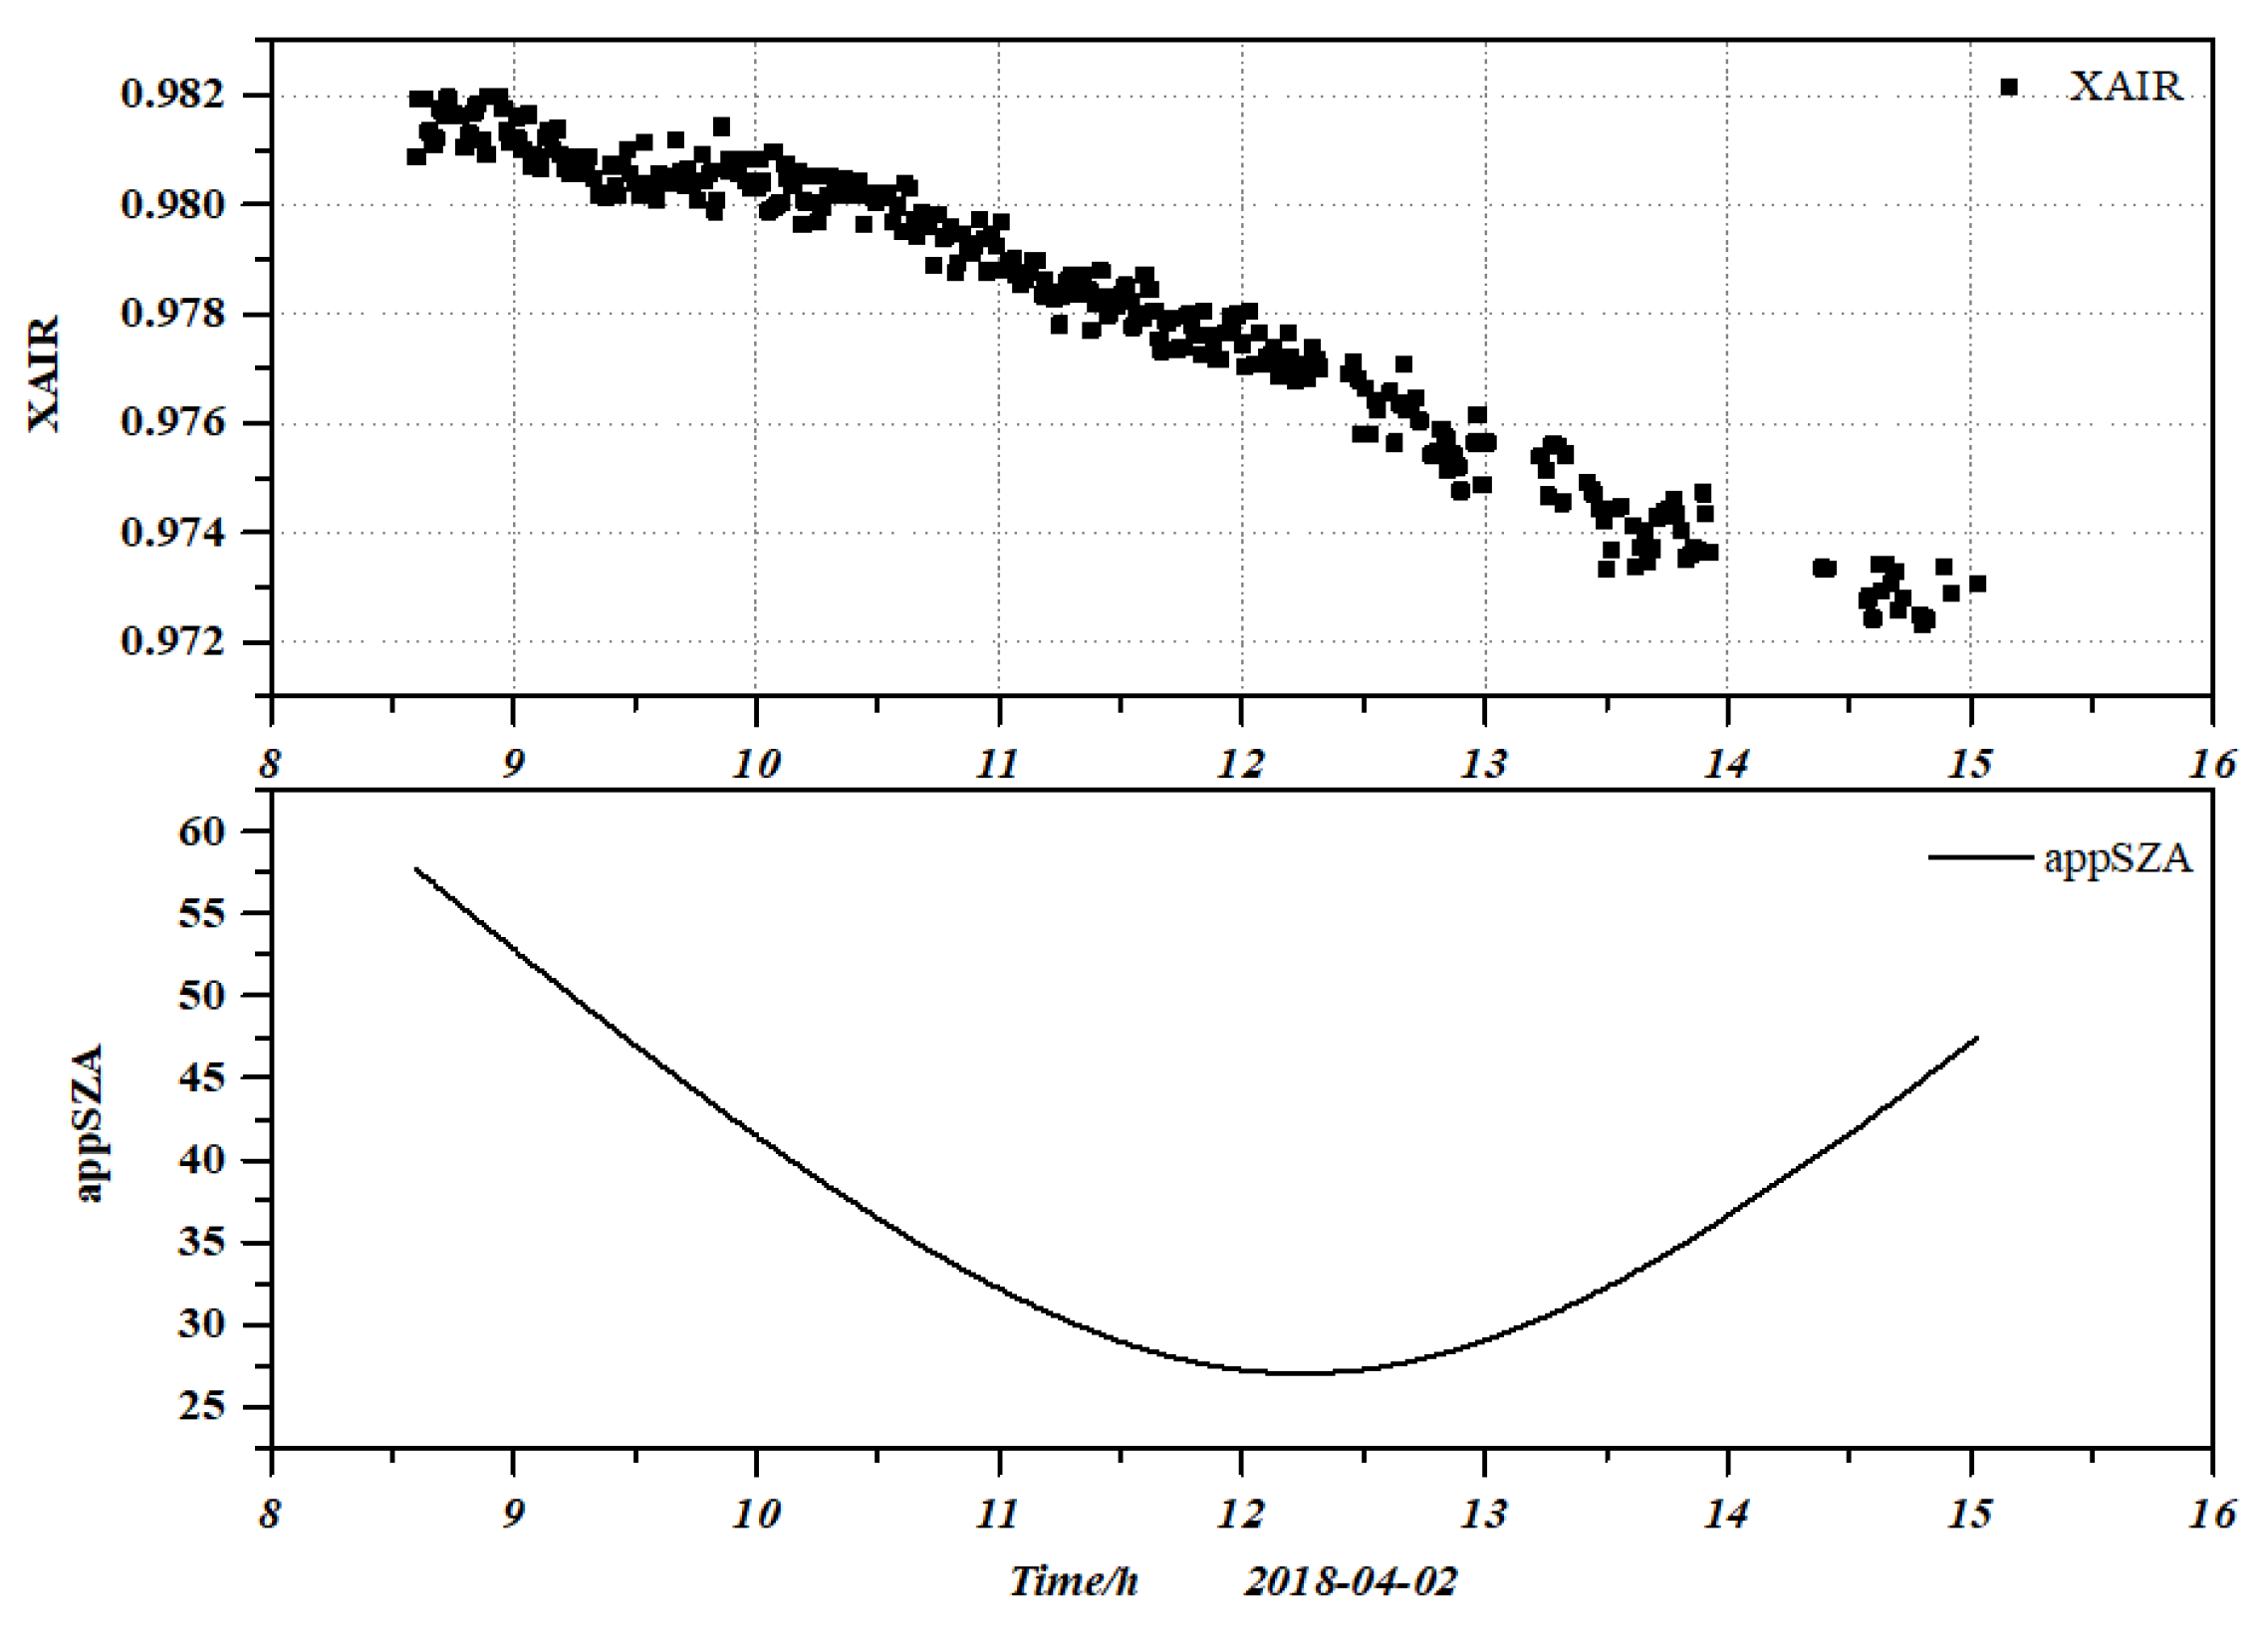
The Figure 7 shows variation of air quality and zenith angle with time. XAIR likely represents a parameter related to air quality or atmospheric transmission. It shows a decreasing trend from 9:00 to 15:00. This decline could reflect changes in atmospheric scattering/absorption (e.g., due to aerosols or trace gases). The apparent solar zenith angle (appSZA) follows a U-shaped curve, reaching a minimum around noon. This matches the diurnal cycle of solar elevation (zenith angle is smallest when the sun is highest).
The diurnal variations of CO2 and CH4 were further analyzed. The Figure 8 shows the diurnal variations in column concentrations of CO2 and CH4 retrieved by Fourier transform spectrometer on April 2, 2018. The weather on that day was sunny and the observation conditions were superior. It can be seen from the figure that the air quality showed a linear relationship with time. The change trends of CO2 and CH4 shown in the figure are similar, showing the characteristics of low in the morning and evening and high at noon, and reaching the peak at 13:00 noon. The observed trends can be attributed to the following factors. First, the daily periodic characteristics of human activity emissions, the early peak of urban traffic and the start of industrial production release a large number of CO2 and CH4 gases. At the same time, the main CH4 emission sources in agricultural production, such as paddy field irrigation and livestock breeding, are enhanced under the condition of sufficient sunshine. The second is the regulation of boundary layer dynamics. When the solar radiation increases, the surface heat causes convective activities, and the height of the boundary layer rises. This process will vertically transport the gas emitted from the surface to the top of the mixing layer, resulting in the measured column concentration gradually rising with the development of the mixing layer. In the afternoon, the boundary layer tends to be stable, and the diffusion ability of pollutants in the vertical direction is weakened, forming the concentration accumulation effect.
The change trends of CO2 and CH4 are highly synchronous, indicating that they have their homologous emission characteristics, which may be due to the coordinated change of common emission sources such as traffic sources, energy production and waste disposal during the day, resulting in the same trend of daily change patterns of the two. The correlation between the two will be analyzed in next Section.
Figure 8.
The diurnal variations XCO2 and XCH4 retrieved by Fourier transform spectrometer on April 2, 2018.
Figure 8.
The diurnal variations XCO2 and XCH4 retrieved by Fourier transform spectrometer on April 2, 2018.
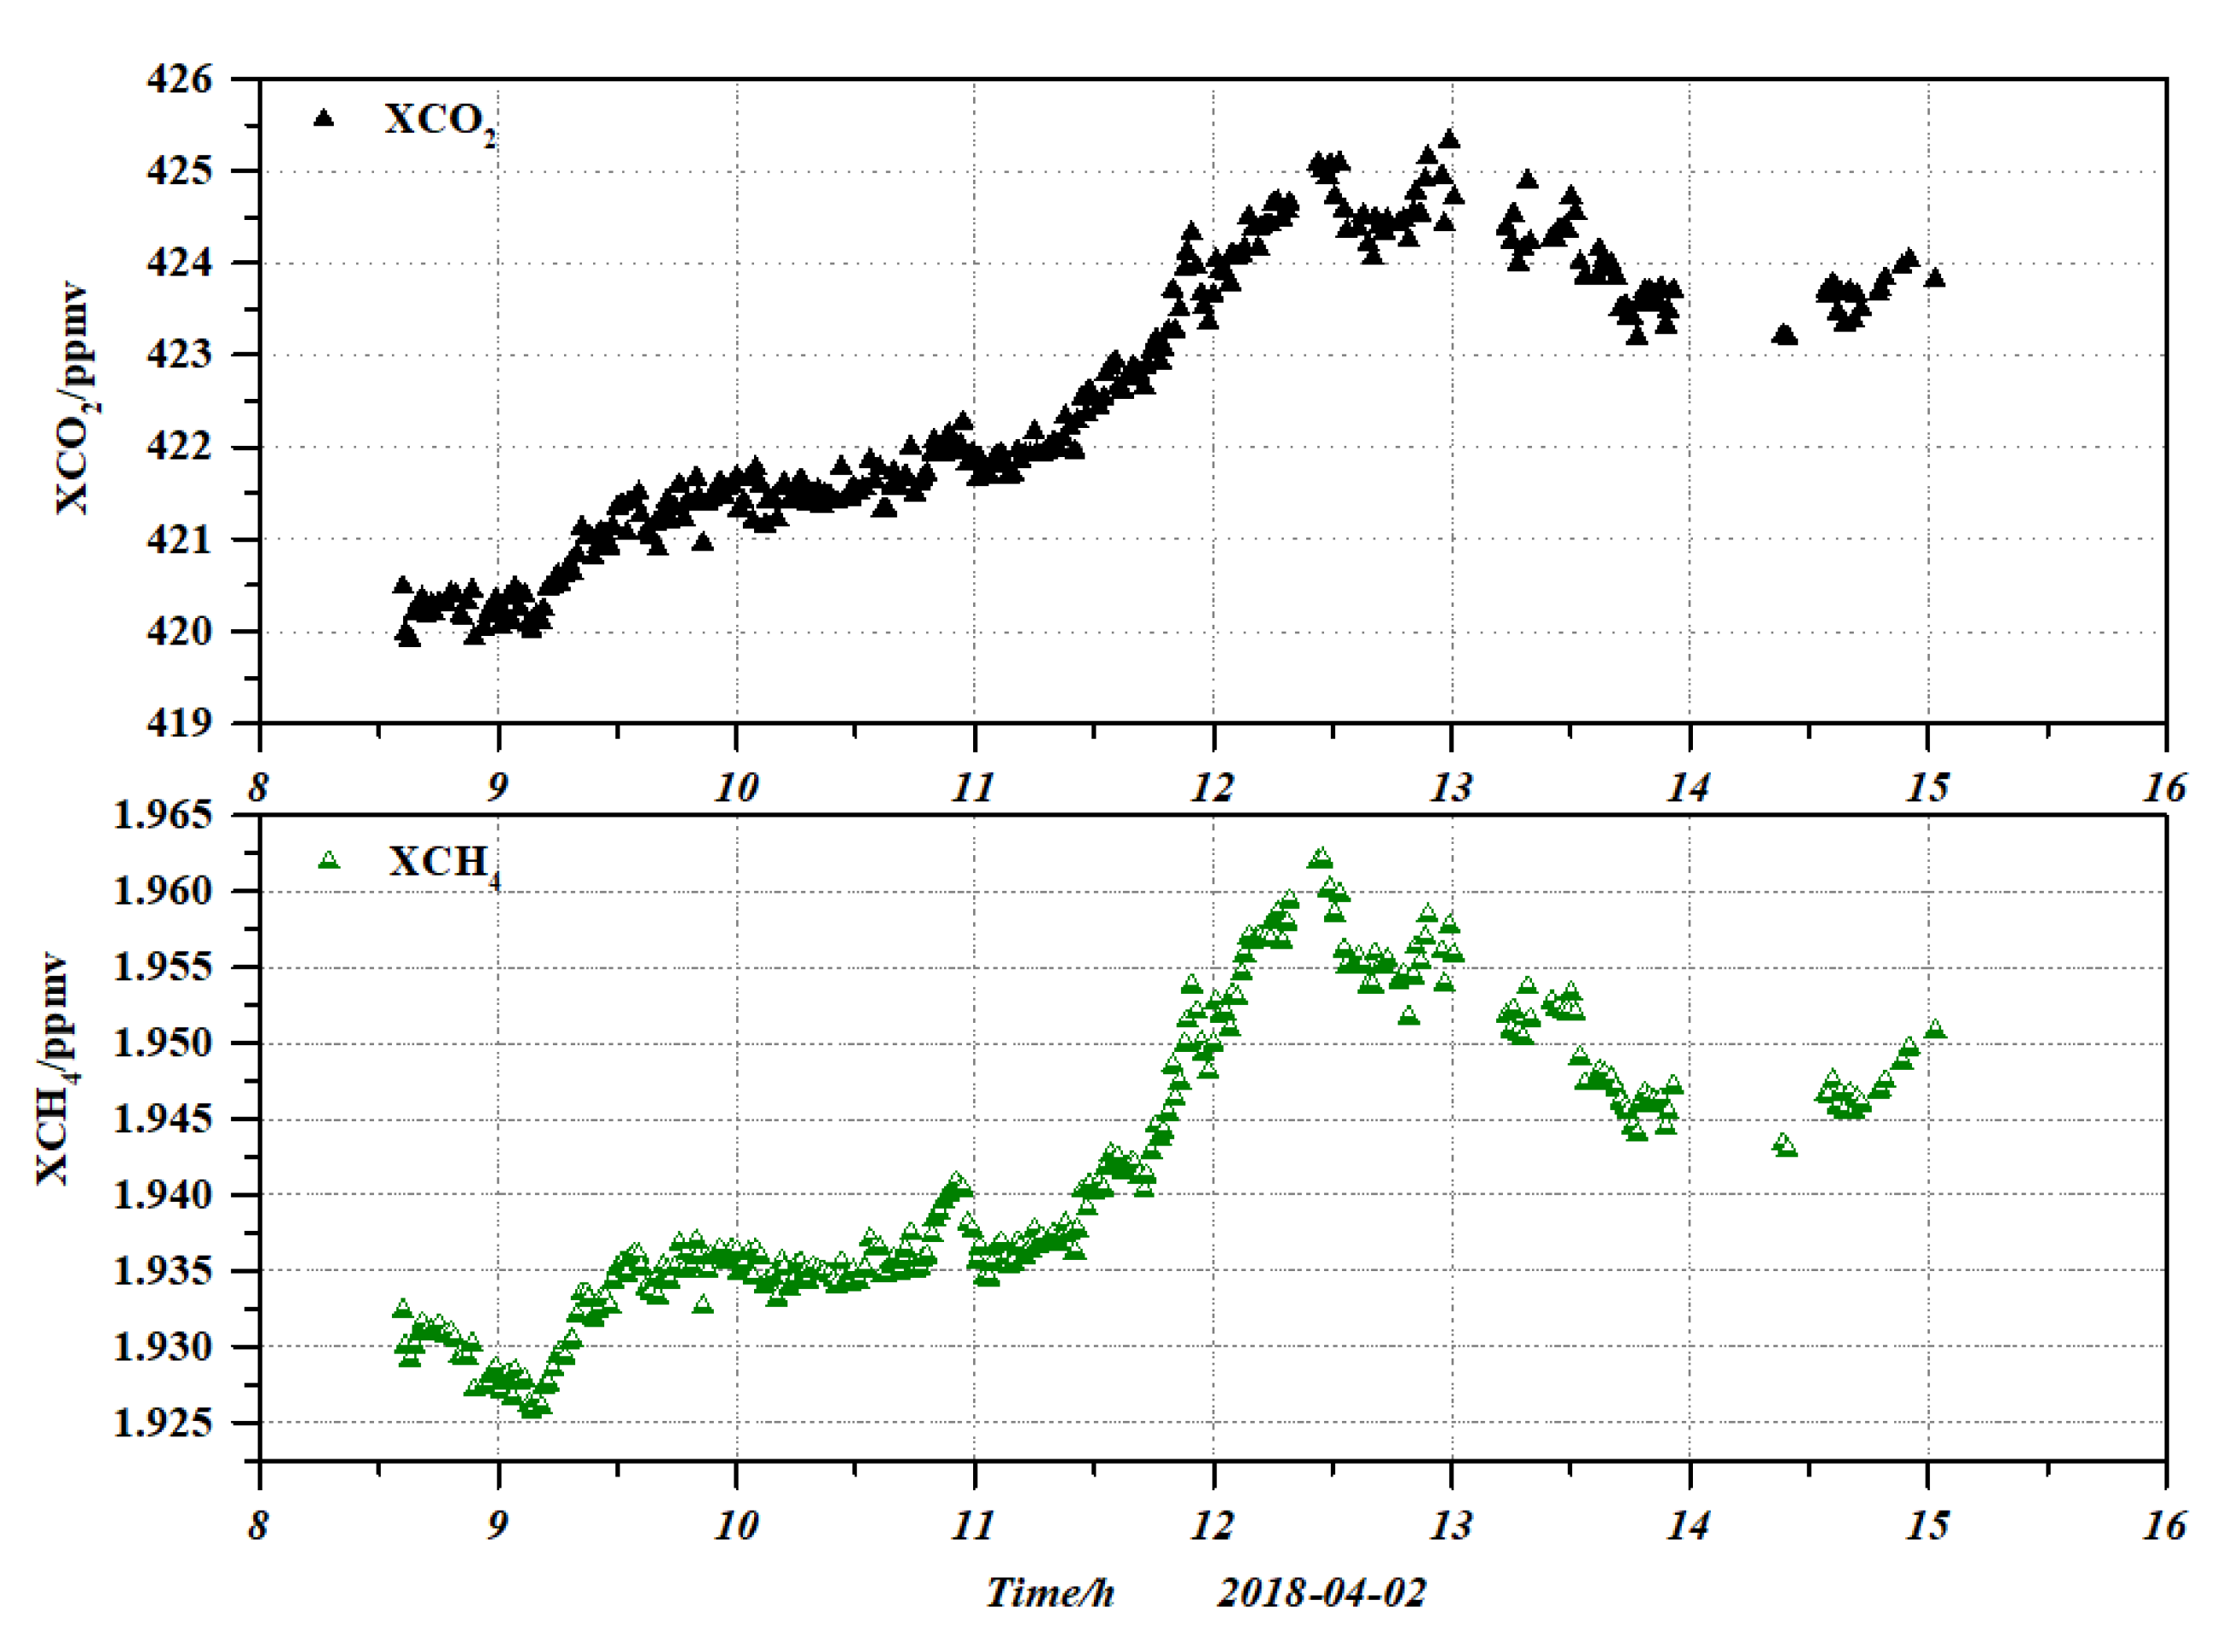
Figure 9.
The correlation between CO2 and CH4 in different seasons.
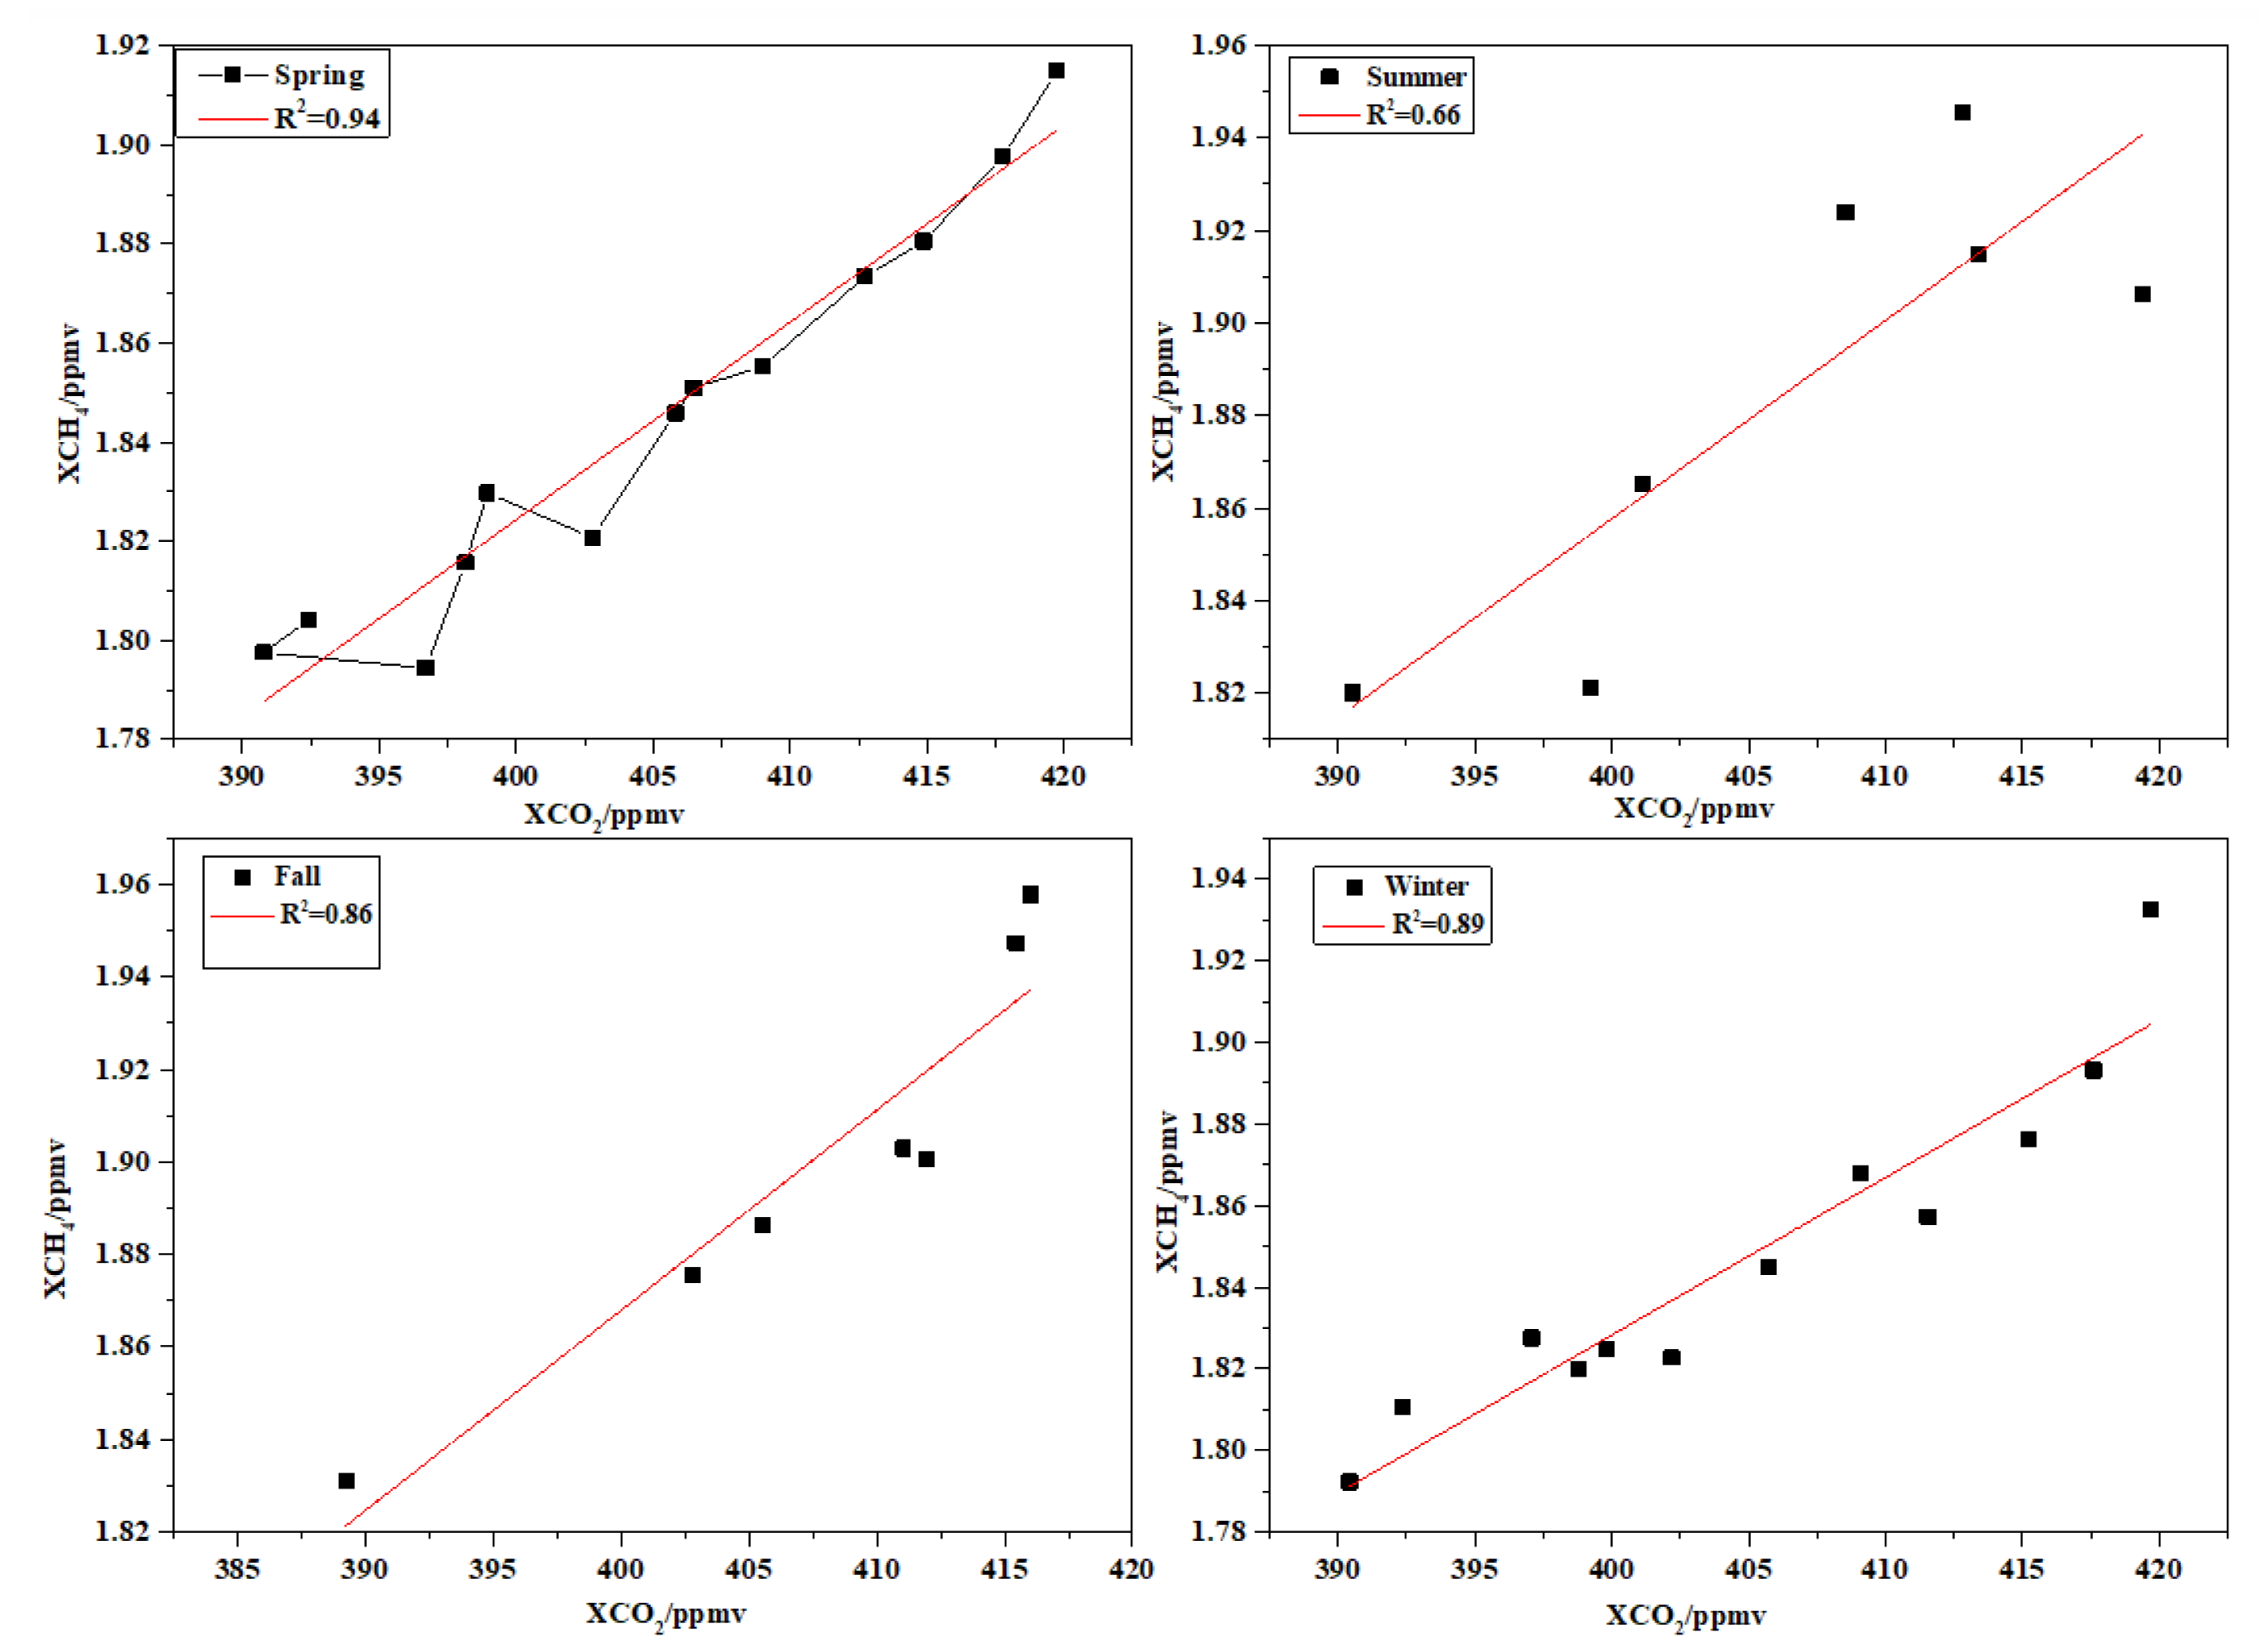
Linear analysis is usually used to determine whether they both come from combustion sources. It can be seen from the figure that the correlation degree of CO2 and CH4 concentrations is very high in spring, autumn and winter, and the correlation coefficient R2 is higher than 0.86, especially 0.94 in spring, indicating that they are driven by the same emission activities or atmospheric processes. This is because the boundary layer is low and the atmosphere is stable in spring, autumn and winter, and the diffusion of CO2 and CH4 emitted from the surface is limited in the vertical direction. At this time, seasonal anthropogenic activities such as coal-fired heating and biomass combustion release two kinds of gases simultaneously, and their emission intensity is strongly coupled with meteorological conditions (such as low temperature and calm wind), thus showing a high correlation. In summer, photosynthesis is strong, and plants absorb a large amount of CO2 through photosynthesis, while high temperature promotes CH4 emissions from natural sources such as wetlands and paddy fields, resulting in a decrease in the correlation between the two sources. In addition, strong convective weather enhances pollutant diffusion and further weakens the synchronization of concentration changes. From the daily variation Figure 8, we can see that the peaks of CO2 and CH4 are consistent, indicating that they do not have homology. This may be related to the monsoon. For further analysis, the backward trajectory model is used for analysis.
In this study, the model was applied to Hefei (31.51°N, 117.17°E) to simulate daily 72-hour backward trajectories from January to December 2020. The meteorological year was divided into four seasons: spring (March–May), summer (June–August), autumn (September–November), and winter (December–February). Simulations were conducted for three arrival heights (500 m, 1000 m, and 1500 m above ground level) to represent different transport layers. A clustering analysis was subsequently performed on the trajectory endpoints for each season to identify dominant transport pathways and their seasonal variations.
Figure 10.
Cluster analysis of 72 h back trajectories of HeFei in spring, 2020.
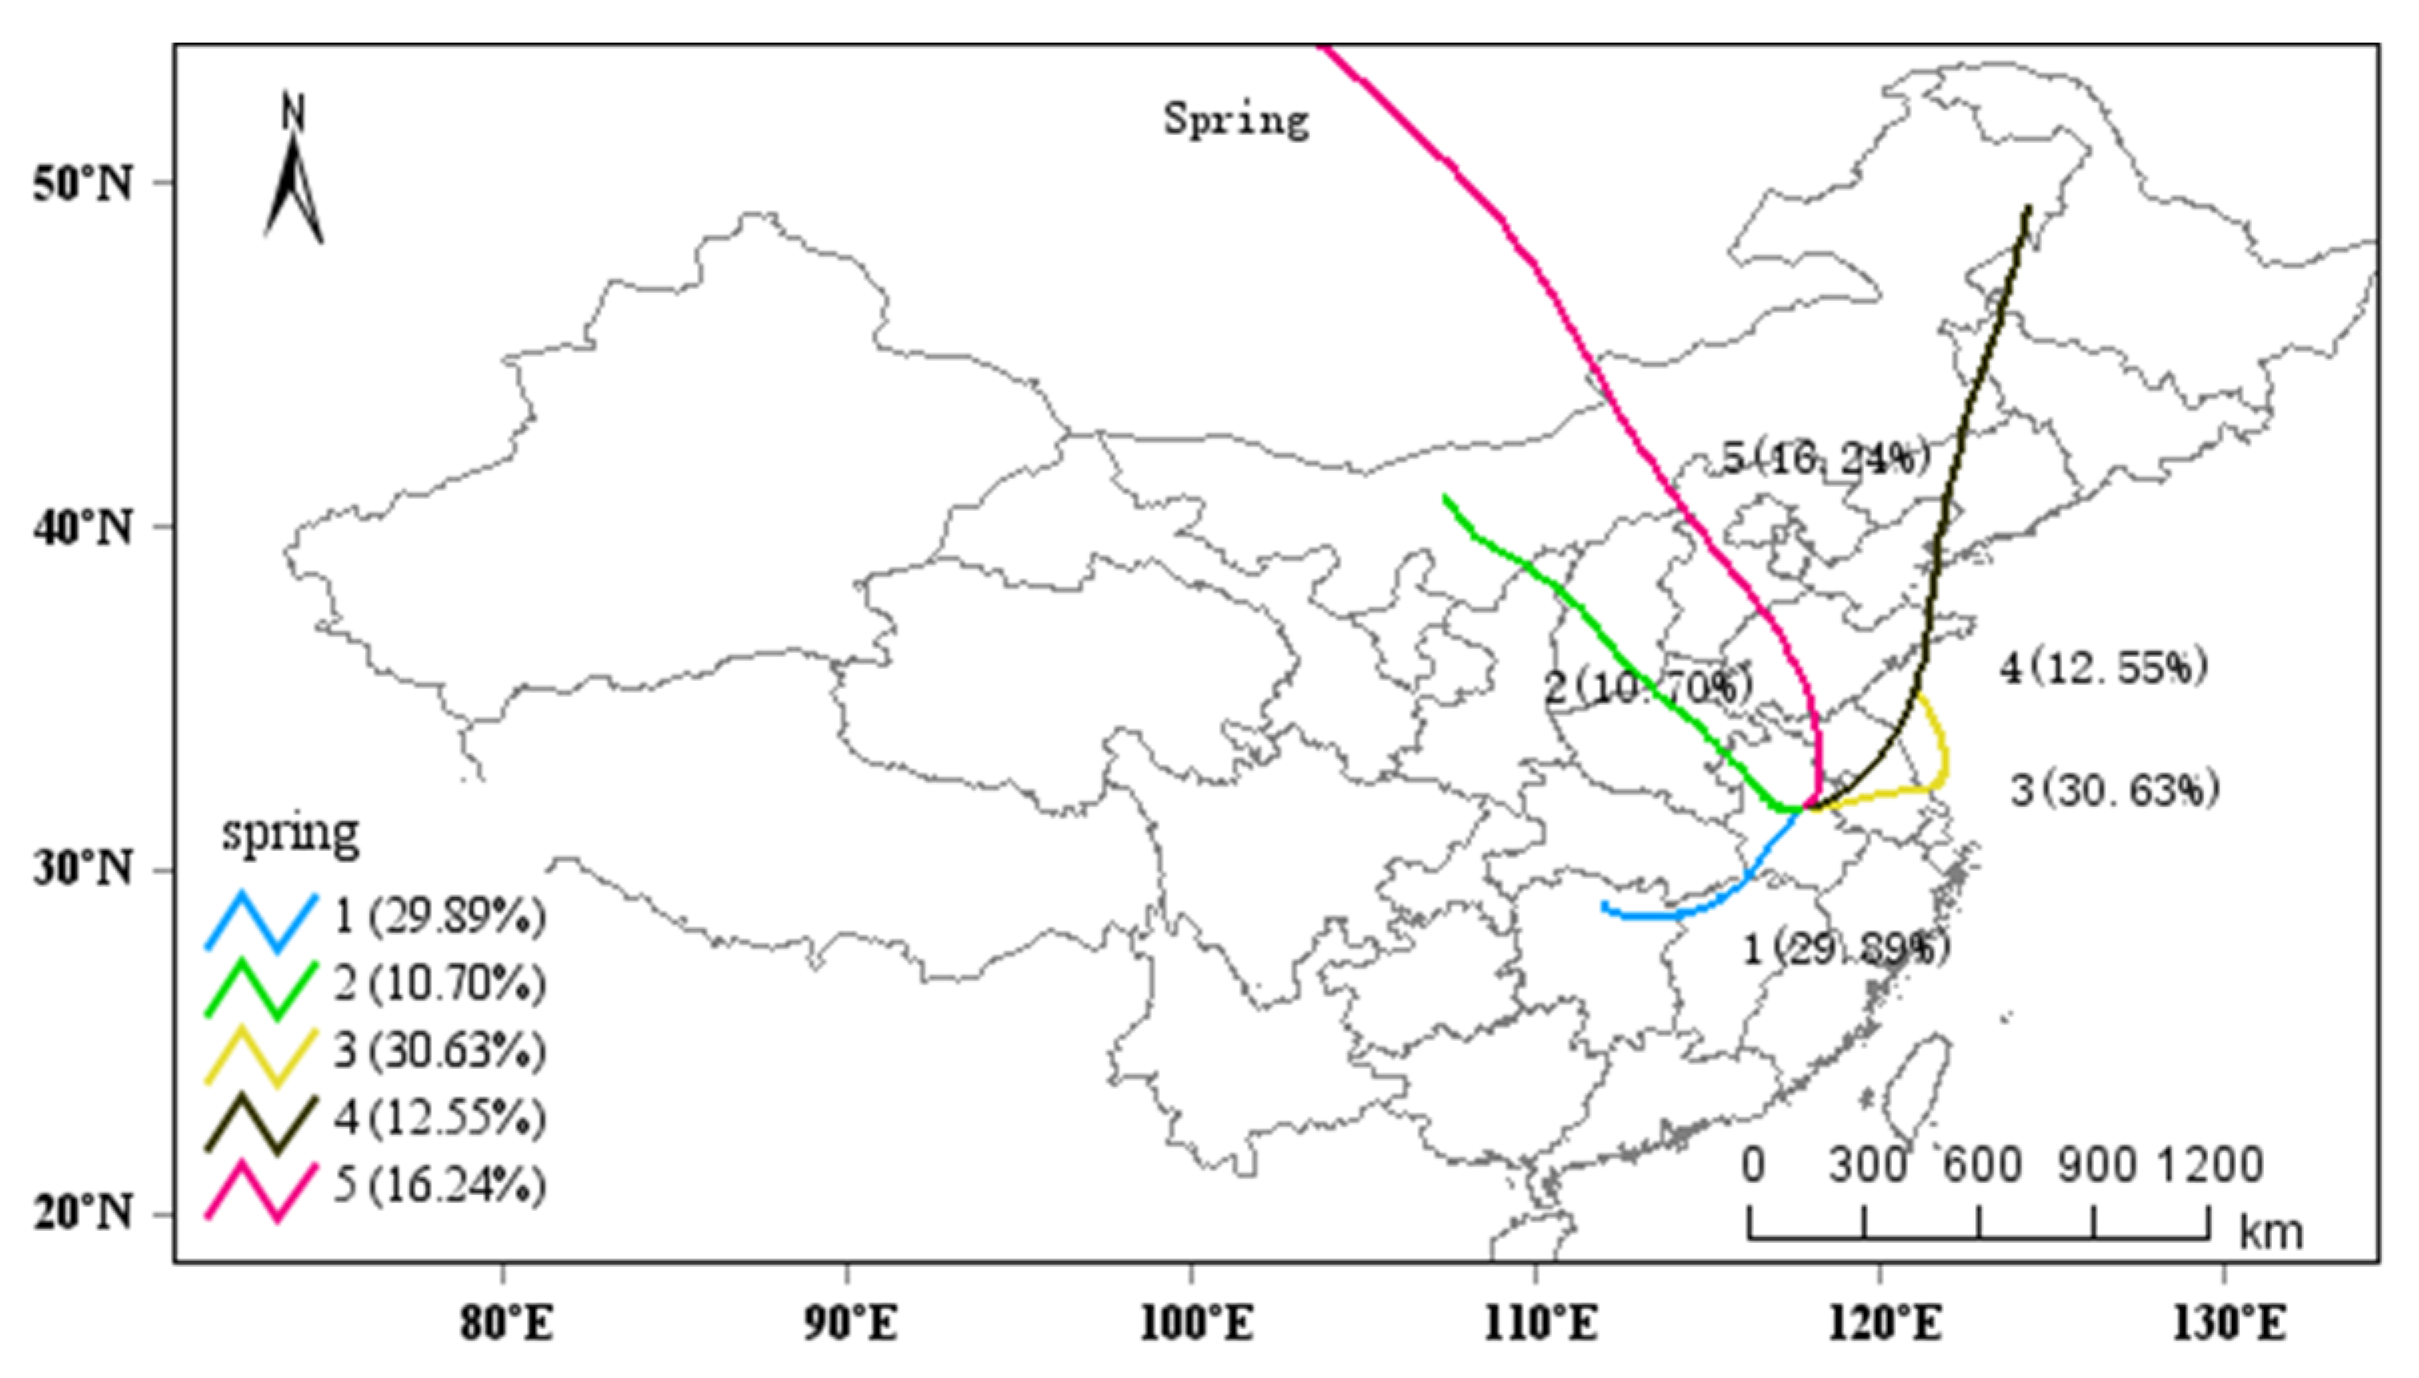
The three prevailing trajectories during spring comprise a southwesterly trajectory (30.63%, originating from the Indian Peninsula/Bay of Bengal), a northwesterly trajectory (29.89%, originating from Central Asia), and a northerly trajectory (16.24%, originating from Mongolia/Siberia). Air masses are characterized by diverse origins, reflecting both maritime and continental influences.
The southwesterly trajectory may facilitate the transport of methane emissions from agricultural activities in South Asia—such as rice cultivation and livestock—as well as CO₂ derived from biomass burning practices, including seasonal agricultural residue burning in spring. The northwesterly trajectory, traversing the arid regions of Central Asia, is associated with relatively low local anthropogenic emissions. However, it may convey background levels of greenhouse gases resulting from long-range transport from industrial regions in Europe or Western Asia. The northerly trajectory originates from the relatively pristine boreal forests and high-latitude zones, and is generally associated with lower background concentrations of greenhouse gases.
Trajectories during summer exhibit a high degree of spatial concentration, with notably shortened paths clustered around the study region, indicating the dominance of strong local circulation systems. The predominant southeastern and southern trajectories collectively account for the highest proportion (26.36% + 21.20%), reflecting the overwhelming influence of the summer monsoon originating from the ocean.
The prevalence of marine air masses—clean and moist—from the Pacific Ocean leads to dilution of greenhouse gas concentrations at the receptor site. Consequently, the observed levels are likely closer to regional background values. Furthermore, summer corresponds to the peak growing season in the Northern Hemisphere, during which vegetation acts as a strong CO₂ sink. The dominance of local trajectories implies that the carbon sequestration effect of ecosystems around the receptor site significantly contributes to reducing observed CO₂ concentrations.
In contrast, elevated temperatures and rice paddy irrigation during this season enhance methane emissions. Local trajectories are likely to capture these intense regional methane sources.
The autumn trajectory pattern is characterized by the coexistence of a long-range northwesterly path (31.94%) and a short-range local path (22.50%). This period represents a transitional phase in which the summer monsoon has retreated, while the full establishment of the winter monsoon has not yet occurred, resulting in complex airflow regimes. The northwesterly trajectory is likely associated with elevated CO₂ concentrations, attributable to the commencement of heating activities—primarily fossil fuel combustion—in regions of Central Asia and Siberia.
In contrast, the local trajectory reflects biogenic influences during the autumn season: vegetation senescence leads to a reduction in carbon sink capacity, and ecosystems may transition toward becoming net carbon sources due to processes such as soil respiration and litter decomposition. Air masses associated with this local path may thus capture the shift in regional ecosystem function from a carbon sink to a carbon source.
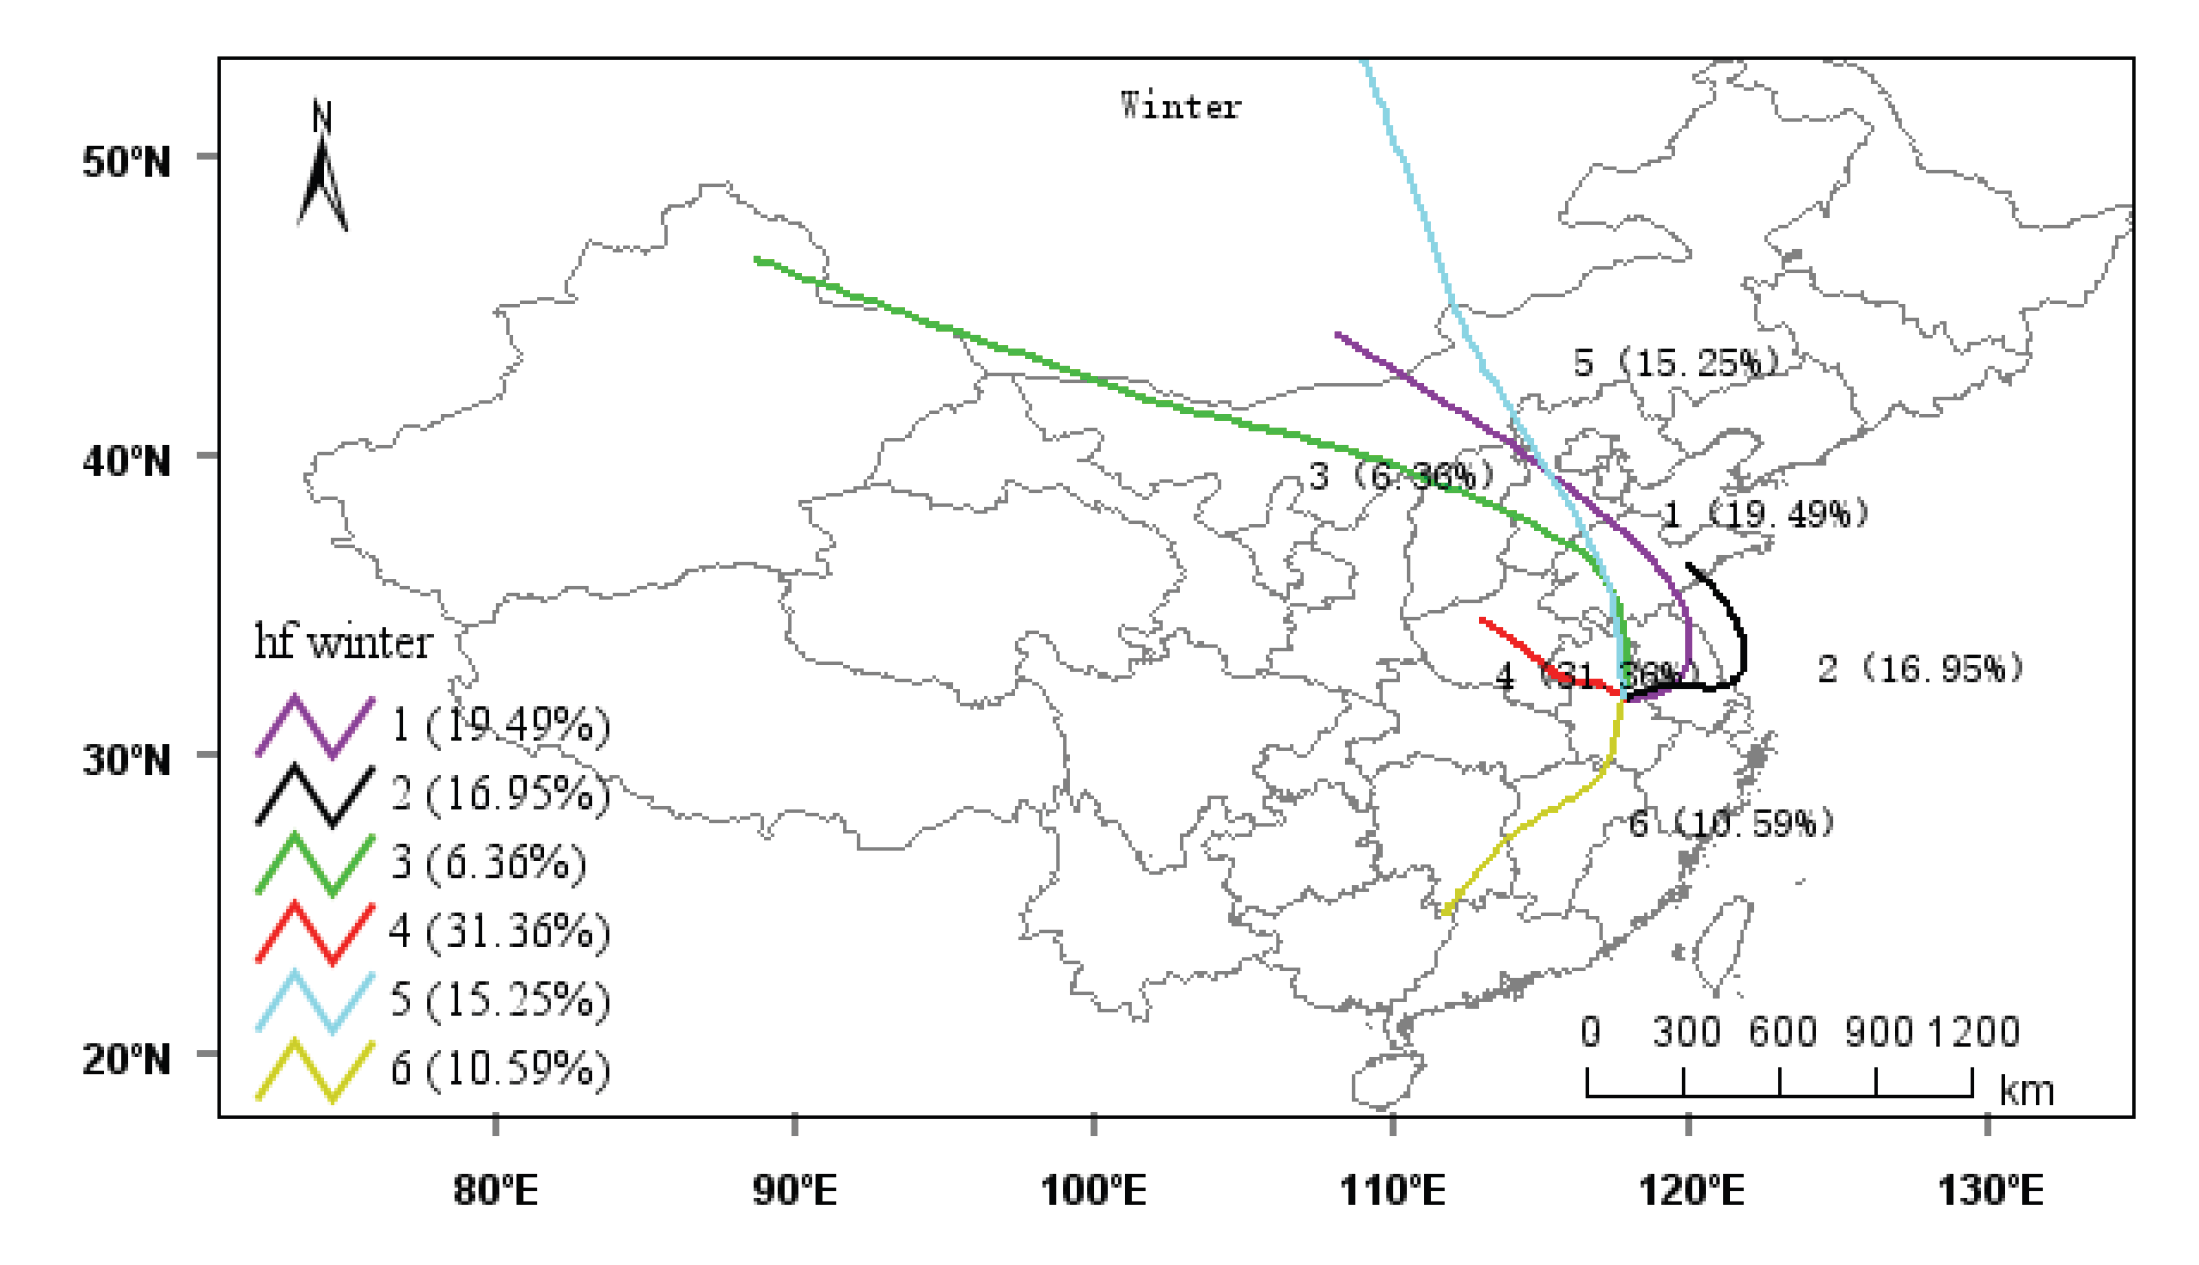
The winter trajectory pattern is distinctly dominated by a long-range northwesterly path (31.36%), characterized by its straight and stable pathway, reflecting the influence of a strong and persistent winter monsoon. Additional trajectories include a northern path (19.49%) and a southwestern path (16.95%), which play secondary roles. The northwesterly trajectory acts as a critical pollution transport corridor, passing over regions with substantial heating demands in northern China and Central Asia. This pathway carries significant amounts of CO₂ derived from fossil fuel combustion. The rapid and stable airflow ensures highly efficient transport, effectively moving greenhouse gases emitted in upwind regions to downwind areas such as southeastern China, leading to episodic concentration peaks at the receptor site. In contrast, the southwesterly trajectory may convey modest levels of methane originating from South Asia. However, its influence is generally overshadowed by the dominant northwesterly flow in terms of overall impact on greenhouse gas concentrations.
Figure 11.
Cluster analysis of 72 h back trajectories of HeFei in summer, 2020.
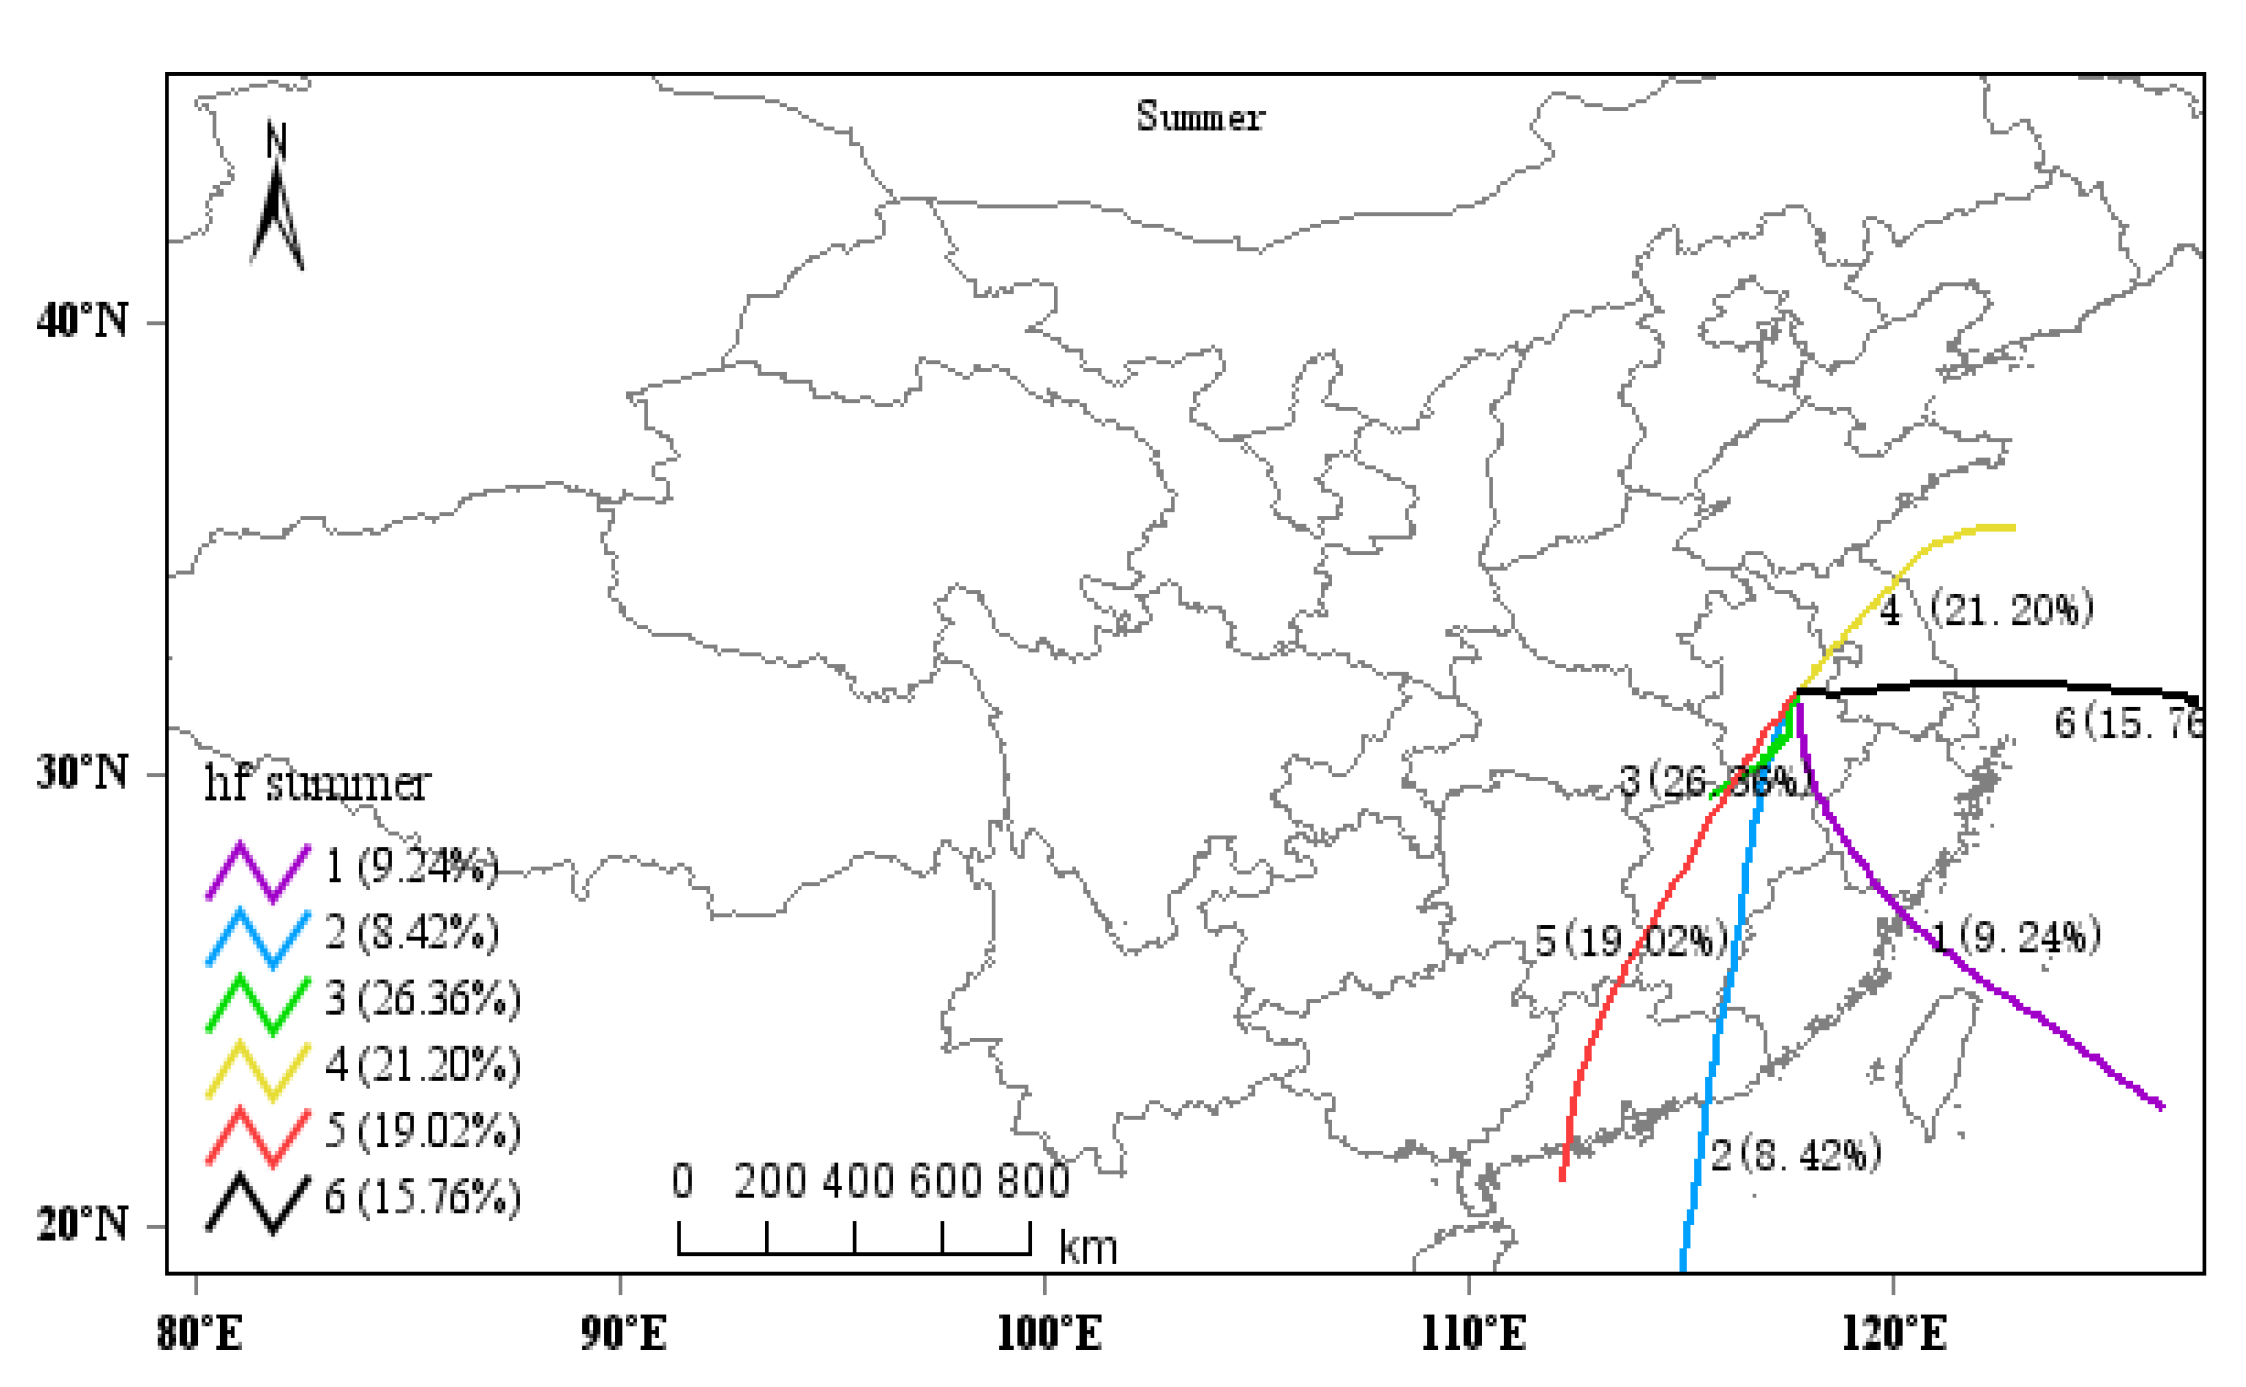
Figure 12.
Cluster analysis of 72 h back trajectories of HeFei in autumn, 2020.
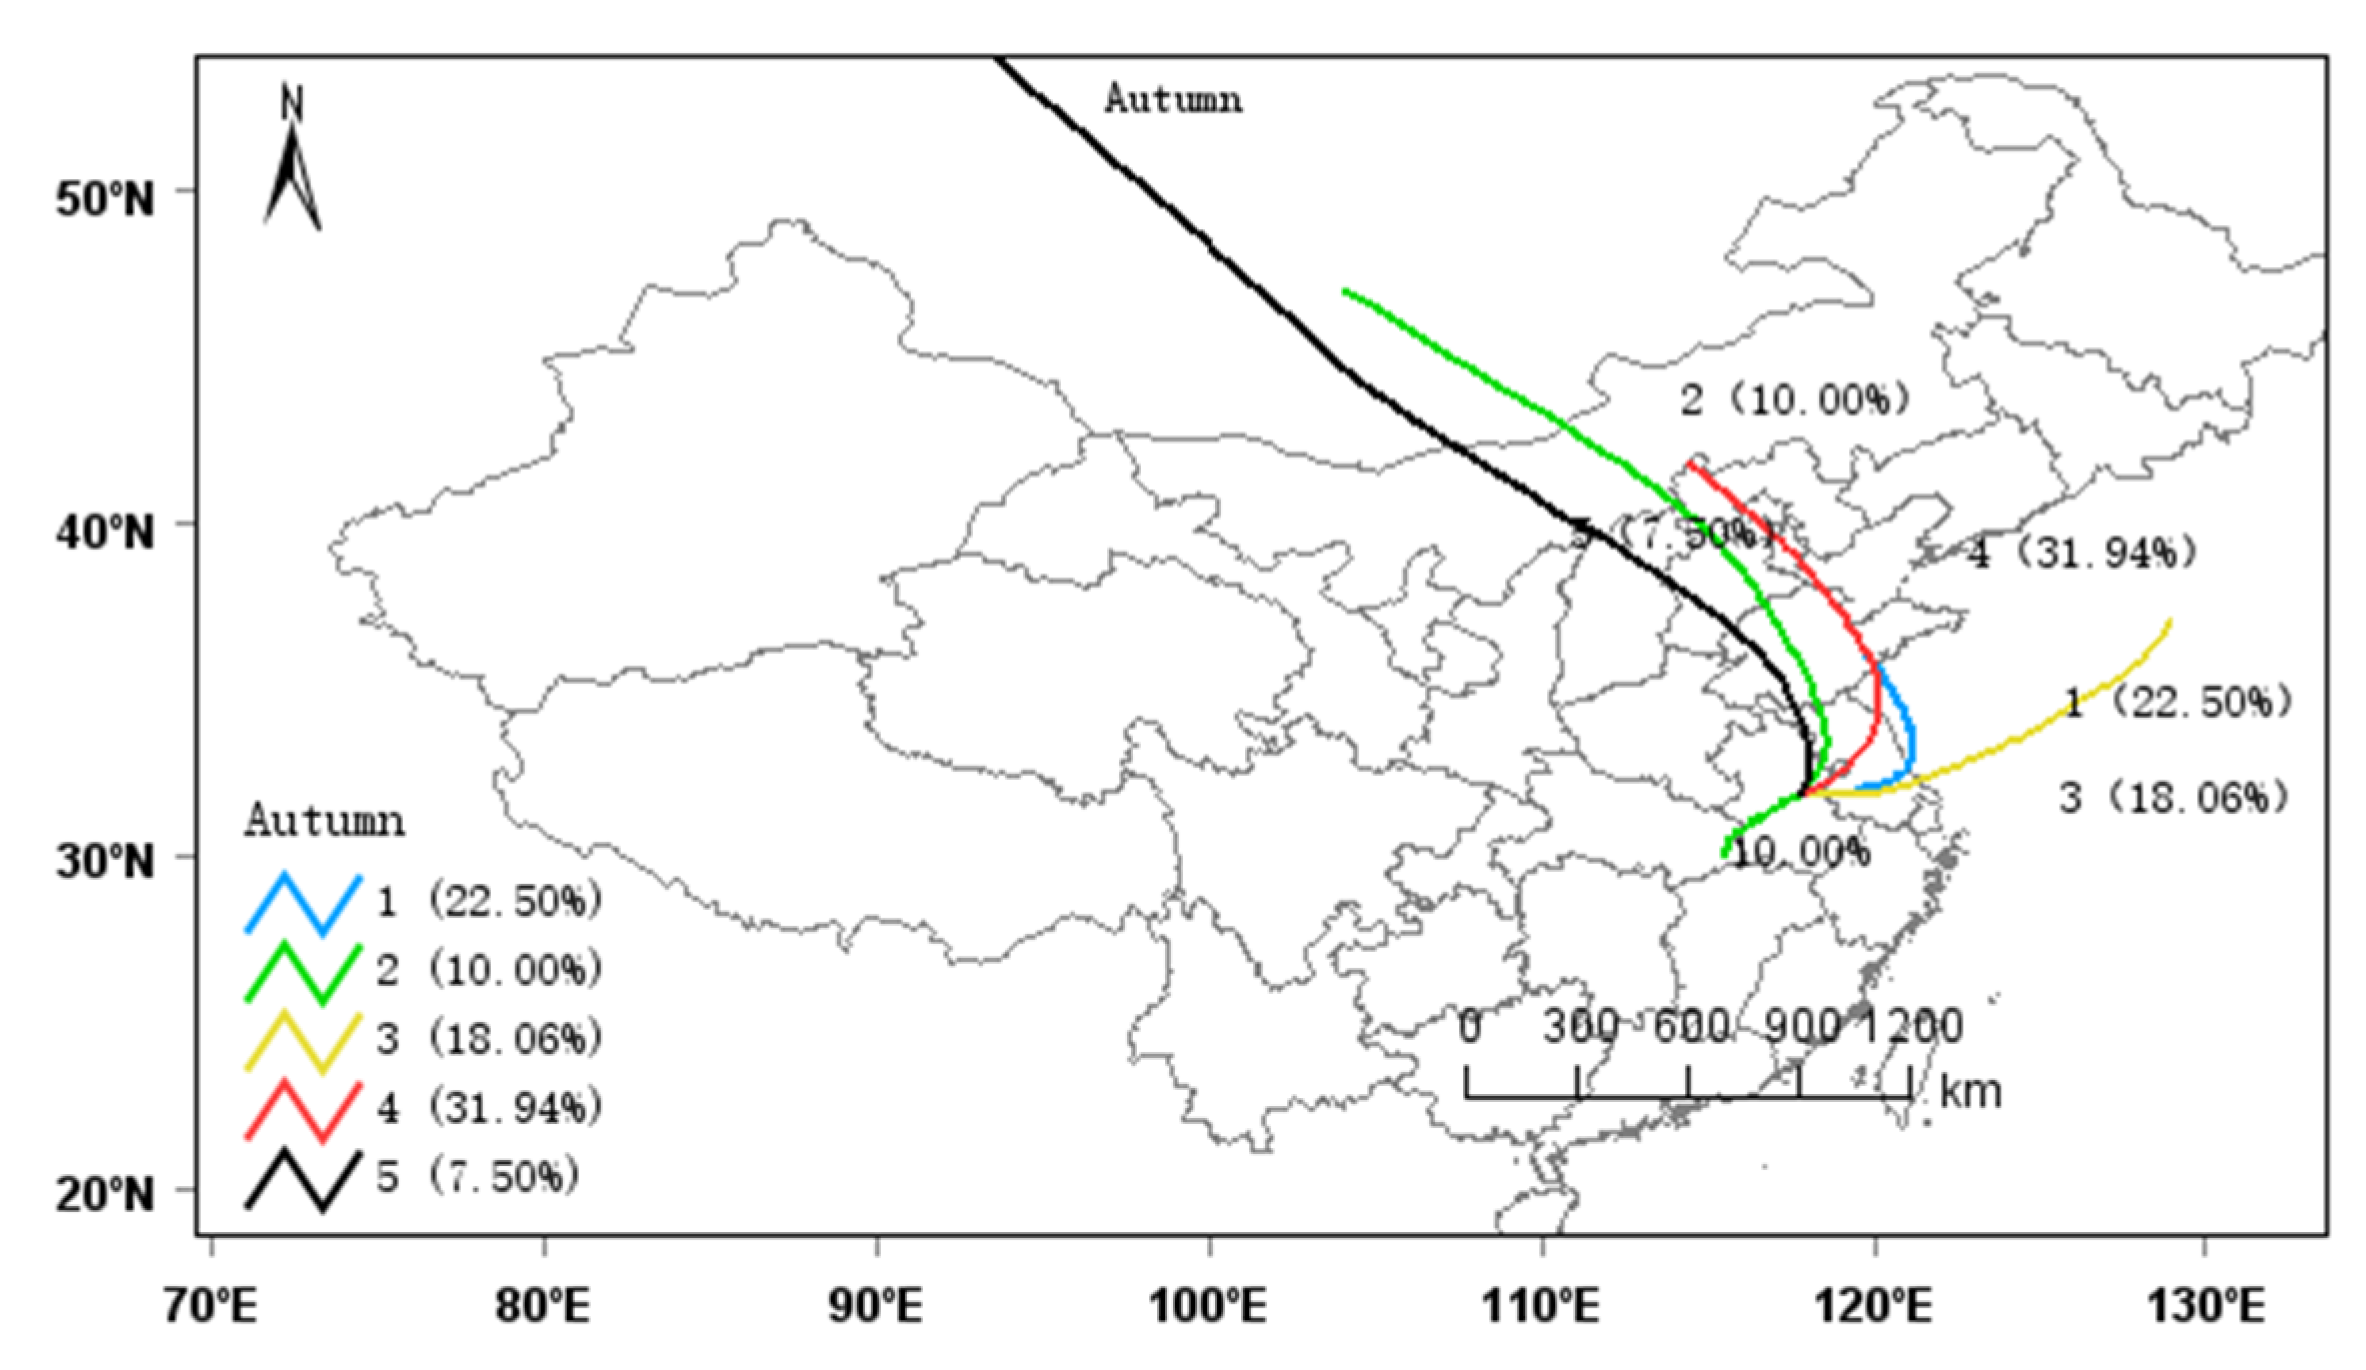
Figure 13.
Cluster analysis of 72 h back trajectories of HeFei in winter, 2020.
Based on the above analysis, it is evident that the Hefei region exhibits a pronounced seasonal cycle in greenhouse gas characteristics, which is predominantly governed by the East Asian monsoon system. During the summer half of the year, clean marine air masses and the carbon sequestration effect of ecosystems lead to relatively lower greenhouse gas concentrations. In contrast, the winter half-year is characterized by the dominance of polluted continental air masses and emissions from fossil fuel combustion, resulting in elevated concentration levels.
The northwestern inland regions are identified as the most critical external source area influencing CO₂ concentrations at the receptor site during winter. Meanwhile, the areas surrounding the receptor site in summer function as significant CO₂ sinks, although their substantial methane emissions cannot be overlooked. Additionally, South Asia appears to contribute persistently to the background methane levels at the receptor site during both spring and winter seasons.
4. Conclusions
This study presents a comprehensive analysis of the spatiotemporal dynamics of carbon dioxide (CO₂) and methane (CH₄) in the Hefei region from 2009 to 2020, leveraging satellite observations from GOSAT and the HYSPLIT trajectory model. The integrated approach has yielded a detailed understanding of the trends, patterns, and governing mechanisms of greenhouse gas (GHG) concentrations in this subtropical inland city.
The principal findings confirm a significant long-term increasing trend for both CO₂ and CH₄, with Hefei's CO₂ growth rate (2.43 ppm/year) surpassing the global average, underscoring the pronounced impact of localized anthropogenic emissions. A distinct seasonal cycle was identified for each gas: CO₂ peaks in winter, driven by enhanced fossil fuel combustion for heating and weakened plant photosynthesis, and reaches a minimum in summer due to strong biospheric carbon uptake. Conversely, CH₄ concentrations peak in summer and autumn, closely linked to agricultural activities, particularly rice cultivation under warm conditions. Diurnal variations for both gases are synchronous, peaking around noon, which is attributed to the interplay of anthropogenic emission cycles and the dynamics of the planetary boundary layer.
A critical contribution of this research is the elucidation of the dominant role played by regional transport, governed by the East Asian monsoon system. Backward trajectory cluster analysis quantitatively delineates the seasonal shift in air mass origins. Summer is characterized by clean, locally-influenced marine air masses that dilute pollutant concentrations and highlight the region's role as a CO₂ sink. In stark contrast, winter is dominated by long-range transport from the polluted northwestern interior of China, which acts as a critical pollution transport corridor, efficiently advecting CO₂-rich air masses and leading to seasonal concentration maxima.
In summary, the characteristics of CO₂ and CH₄ in Hefei are not merely a function of local emissions but are determined by the complex interplay of local anthropogenic activities (energy consumption, agriculture), regional biospheric processes (carbon sequestration in summer), and large-scale meteorological forcing (the monsoon-driven transport patterns). This research fills a critical knowledge gap concerning GHG dynamics in rapidly developing inland Chinese cities. The findings provide a scientific foundation for targeted mitigation strategies, emphasizing that effective climate action in Hefei requires not only local emission controls but also regional cooperation to manage the substantial impact of cross-boundary transport, particularly during the winter season.
Author Contributions
Conceptualization, D. L.; methodology, X.L. and D. L.; software, D.L. and X.L.; validation, D. L. and X. L.; formal analysis, D.L.; investigation, D. L.; resources, D. L. and K.T..; data curation, D. L.; writing—original draft preparation, D. L.; writing—review and editing, D. L.; visualization, D. L.; supervision, K.T. and P.Y.; project administration, D. L.; funding acquisition, D. L. and X. L. All authors have read and agreed to the published version of the manuscript..
Funding
This research was funded by High level Talents Project of Wanxi University, grant number WGKQ2021007 and the Academic Award for Top Talents in University Disciplines(2022), grant number gxyq2022063.
Data Availability Statement
The data presented in this study are available on request from the corresponding author.
Acknowledgments
The processing environment of PROFFIT programs is provided by Institute of Meteorology and Climate Research. We thank Qiansi Tu and Frank Hase for support in inver-sion, and the work was supported by High level Talents Project of Wanxi University (Grant No. WGKQ2021007) and the Academic Award for Top Talents in University Disciplines(2022)(Grant No. gxyq2022063).
Conflicts of Interest
The authors declare that they have no known competing financial interests or personal relationships that could have appeared to influence the work reported in this paper.
References
- IPCC (2022). Climate Change 2022: Impacts, Adaptation and Vulnerability. Contribution of Working Group II to the Sixth Assessment Report of the Intergovernmental Panel on Climate Change.
- McKain, K.; et al. . Assessment of ground-based atmospheric observations for verification of greenhouse gas emissions from an urban region. Proceedings of the National Academy of Sciences 2012, 12(14), 4257-4262.
- Chen, J.; Lian, X.; Su, H.; Zhang, Z.; Ma, X.; Chang, B. Analysis of China’s carbon emission driving factors based on the perspective of eight major economic regions. Environ Sci Pollut Res. 2021, 28, 8181–8204. [Google Scholar] [CrossRef] [PubMed]
- Lauvaux, T.; et al. . High-resolution atmospheric inversion of urban CO2 emissions during the dormant season of the Indianapolis Flux Experiment (INFLUX). Environmental Science & Technology 2016, 50 2309-2323.
- Akihiko Kuze, Hiroshi Suto, Masakatsu Nakajima, and Takashi Hamazaki, "Thermal and near infrared sensor for carbon observation Fourier-transform spectrometer on the Greenhouse Gases Observing Satellite for greenhouse gases monitoring," Appl. Opt. 2009, 48, 6716–6733.
- JAXA (2009). Greenhouse gases Observing SATellite "IBUKI" (GOSAT) Project. Earth Observation Research Center, Japan Aerospace Exploration Agency.
- Eldering, A.; O'Dell, C. W.; Wennberg, P. O.; Crisp, D.; Gunson, M. R.; Viatte, C.; Avis, C.; Braverman, A.; Castano, R.; Chang, A.; Chapsky, L.; Cheng, C.; Connor, B.; Dang, L.; Doran, G.; Fisher, B.; Frankenberg, C.; Fu, D.; Granat, R.; Hobbs, J.; Lee, R. A. M.; Mandrake, L.; McDuffie, J.; Miller, C. E.; Myers, V.; Natraj, V.; O'Brien, D.; Osterman, G. B.; Oyafuso, F.; Payne, V. H.; Pollock, H. R.; Polonsky, I.; Roehl, C. M.; Rosenberg, R.; Schwandner, F.; Smyth, M.; Tang, V.; Taylor, T. E.; To, C.; Wunch, D.; and Yoshimizu, J. : The Orbiting Carbon Observatory-2: first 18 months of science data products, Atmos. Meas. Tech.; 2017, 10, 549–563. [Google Scholar] [CrossRef]
- Peiro, H.; Crowell, S.; Schuh, A.; Baker, D. F.; O'Dell, C.; Jacobson, A. R.; Chevallier, F.; Liu, J.; Eldering, A.; Crisp, D.; Deng, F.; Weir, B.; Basu, S.; Johnson, M. S.; Philip, S.; and Baker, I. : Four years of global carbon cycle observed from the Orbiting Carbon Observatory 2 (OCO-2) version 9 and in situ data and comparison to OCO-2 version 7, Atmos. Chem. Phys.; 2022, 22, 1097–1130. [Google Scholar] [CrossRef]
- SHI Jiancheng, LÜ Daren, WANG Yu, DU Yan, PANG Yong, YANG Dongxu, WANG Xin, DONG Xiaolong, YANG Xiaofeng. Recent Progress of Earth Science Satellite Missions in China. Chinese Journal of Space Science, 2022, 42(4): 712-723.
- Yang, D. X. ; and Coauthors. The first global carbon dioxide flux map derived from TanSat measurements.Adv. Atmos. Sci.; 2021,38(9), 1433−1443.
- Chen, C. ; and Coauthors. China and India lead in greening of the world through land-use management. Nature Sustainability, 2019, 2, 122–129. [Google Scholar] [PubMed]
- Peiqi, Y.A.N.G.; Jianping, T.A.N.G.; Yutong, L.U.; Yi, X.U.; Shuyu, W.A.N.G. Evaluation of Very High-Resolution Regional Climate Downscaling over CORDEX East Asia: Climatology and Interannual Variability. Journal of Meteorological Research, 2025,39 (5): 1-19.
- Hong, X. H.; P. Zhang, Y. M. Bi, et al. Retrieval of global carbon dioxide from TanSat satellite and comprehensive validation with TCCON measurements and satellite observations. IEEE Trans. Geosci. Remote Sens.2021, 99, 1–16.
- WMO (World Meteorological Organization). (2022). IG3IS 2022 Report: Towards Operational Greenhouse Gas Monitoring Networks. WMO.
- Bing Q, Cheng H, Yan Y, Yuting P, Fangqi W, Xinjie Y, Huili L, Junqing Z, Qitao X, Cheng L, Wei X. Using urban-suburban difference of atmospheric CO2 to evaluate carbon neutrality capacity in Hangzhou, China. Journal of Environmental Sciences. 2025, 157, 908–923.
- Yu, Z.; Ma, W.; Hu, J.; et al. Greening dominates greenspace exposure inequality in Chinese cities. npj Urban Sustain. 2025, 5, 73. [Google Scholar] [CrossRef]
- Huaxing, L.; Jingan, Z.; Ping, J.; Zhongyao, C.; Xinyu, Y.; Xiaohui, Y.; Ziqian, Z.; Jing, W. Assessing drivers of coordinated control of ozone and fine particulate pollution: Evidence from Yangtze River Delta in China, Environmental Impact Assessment Review.2022, 96, 106840.
- Yuli, S.; Dabo, G.; Klaus, H.; et al. City-level climate change mitigation in China. Adv, 2018, 4(6).
- BJLA; AXL; ASL; et al. Understanding the impact of vehicular emissions on air pollution from the perspective of regional transport: A case study of the Beijing-Tianjin-Hebei region in China[J].Science of The Total Environment, 2021,147304.
- Shan, Y.; Guan, D.; Hubacek, K.; et al. City-level climate change mitigation in China[J]. publishup, 2021, 47154.
- Niu, L.; Zhang, Z.; Liang, Y.; et al. Spatiotemporal patterns and drivers of the urban air pollution island effect for 2273 cities in China. Environment International, 2024, 184(000).
- Lo, K. Urban carbon governance and the transition toward low-carbon urbanism: review of a global phenomenon. Carbon Management. 2014, 5(3), 269–283. [Google Scholar] [CrossRef]
- Gurney, K.R.; Liang, J.; Roest, G.; et al. Under-reporting of greenhouse gas emissions in U. S. cities. Nat Commun. 2021, 12, 553. [Google Scholar] [CrossRef] [PubMed]
- Byrne, B.; Baker, D. F.; Basu, S.; Bertolacci, M.; Bowman, K. W.; Carroll, D.; Chatterjee, A.; Chevallier, F.; Ciais, P.; Cressie, N.; Crisp, D.; Crowell, S.; Deng, F.; Deng, Z.; Deutscher, N. M.; Dubey, M. K.; Feng, S.; García, O. E.; Griffith, D. W. T.; Herkommer, B.; Hu, L.; Jacobson, A. R.; Janardanan, R.; Jeong, S.; Johnson, M. S.; Jones, D. B. A.; Kivi, R.; Liu, J.; Liu, Z.; Maksyutov, S.; Miller, J. B.; Miller, S. M.; Morino, I.; Notholt, J.; Oda, T.; O'Dell, C. W.; Oh, Y.-S.; Ohyama, H.; Patra, P. K.; Peiro, H.; Petri, C.; Philip, S.; Pollard, D. F.; Poulter, B.; Remaud, M.; Schuh, A.; Sha, M. K.; Shiomi, K.; Strong, K.; Sweeney, C.; Té, Y.; Tian, H.; Velazco, V. A.; Vrekoussis, M.; Warneke, T.; Worden, J. R.; Wunch, D.; Yao, Y.; Yun, J.; Zammit-Mangion, A.; and Zeng, N. : National CO2 budgets (2015–2020) inferred from atmospheric CO2 observations in support of the global stocktake, Earth Syst. Sci. Data, 2023, 15, 963–1004. [Google Scholar]
- Shahtahmassebi, A.R.; et al. Remote sensing of urban green spaces: a review. Urban For. Urban Green. 57, 126946 (2021).
- Turner, A. J.; Jacob, D. J. ; Wecht,K.J.; Maasakkers, J.D.; Wunch, D.. Estimating global and North American methane emissions with high spatial resolution using Gosat satellite data. Atmospheric Chemistry and Physics, 2015,15 (4), 4495-4536.
Figure 1.
The trend of CO2 column concentration in Hefei from 2009 to 2020.
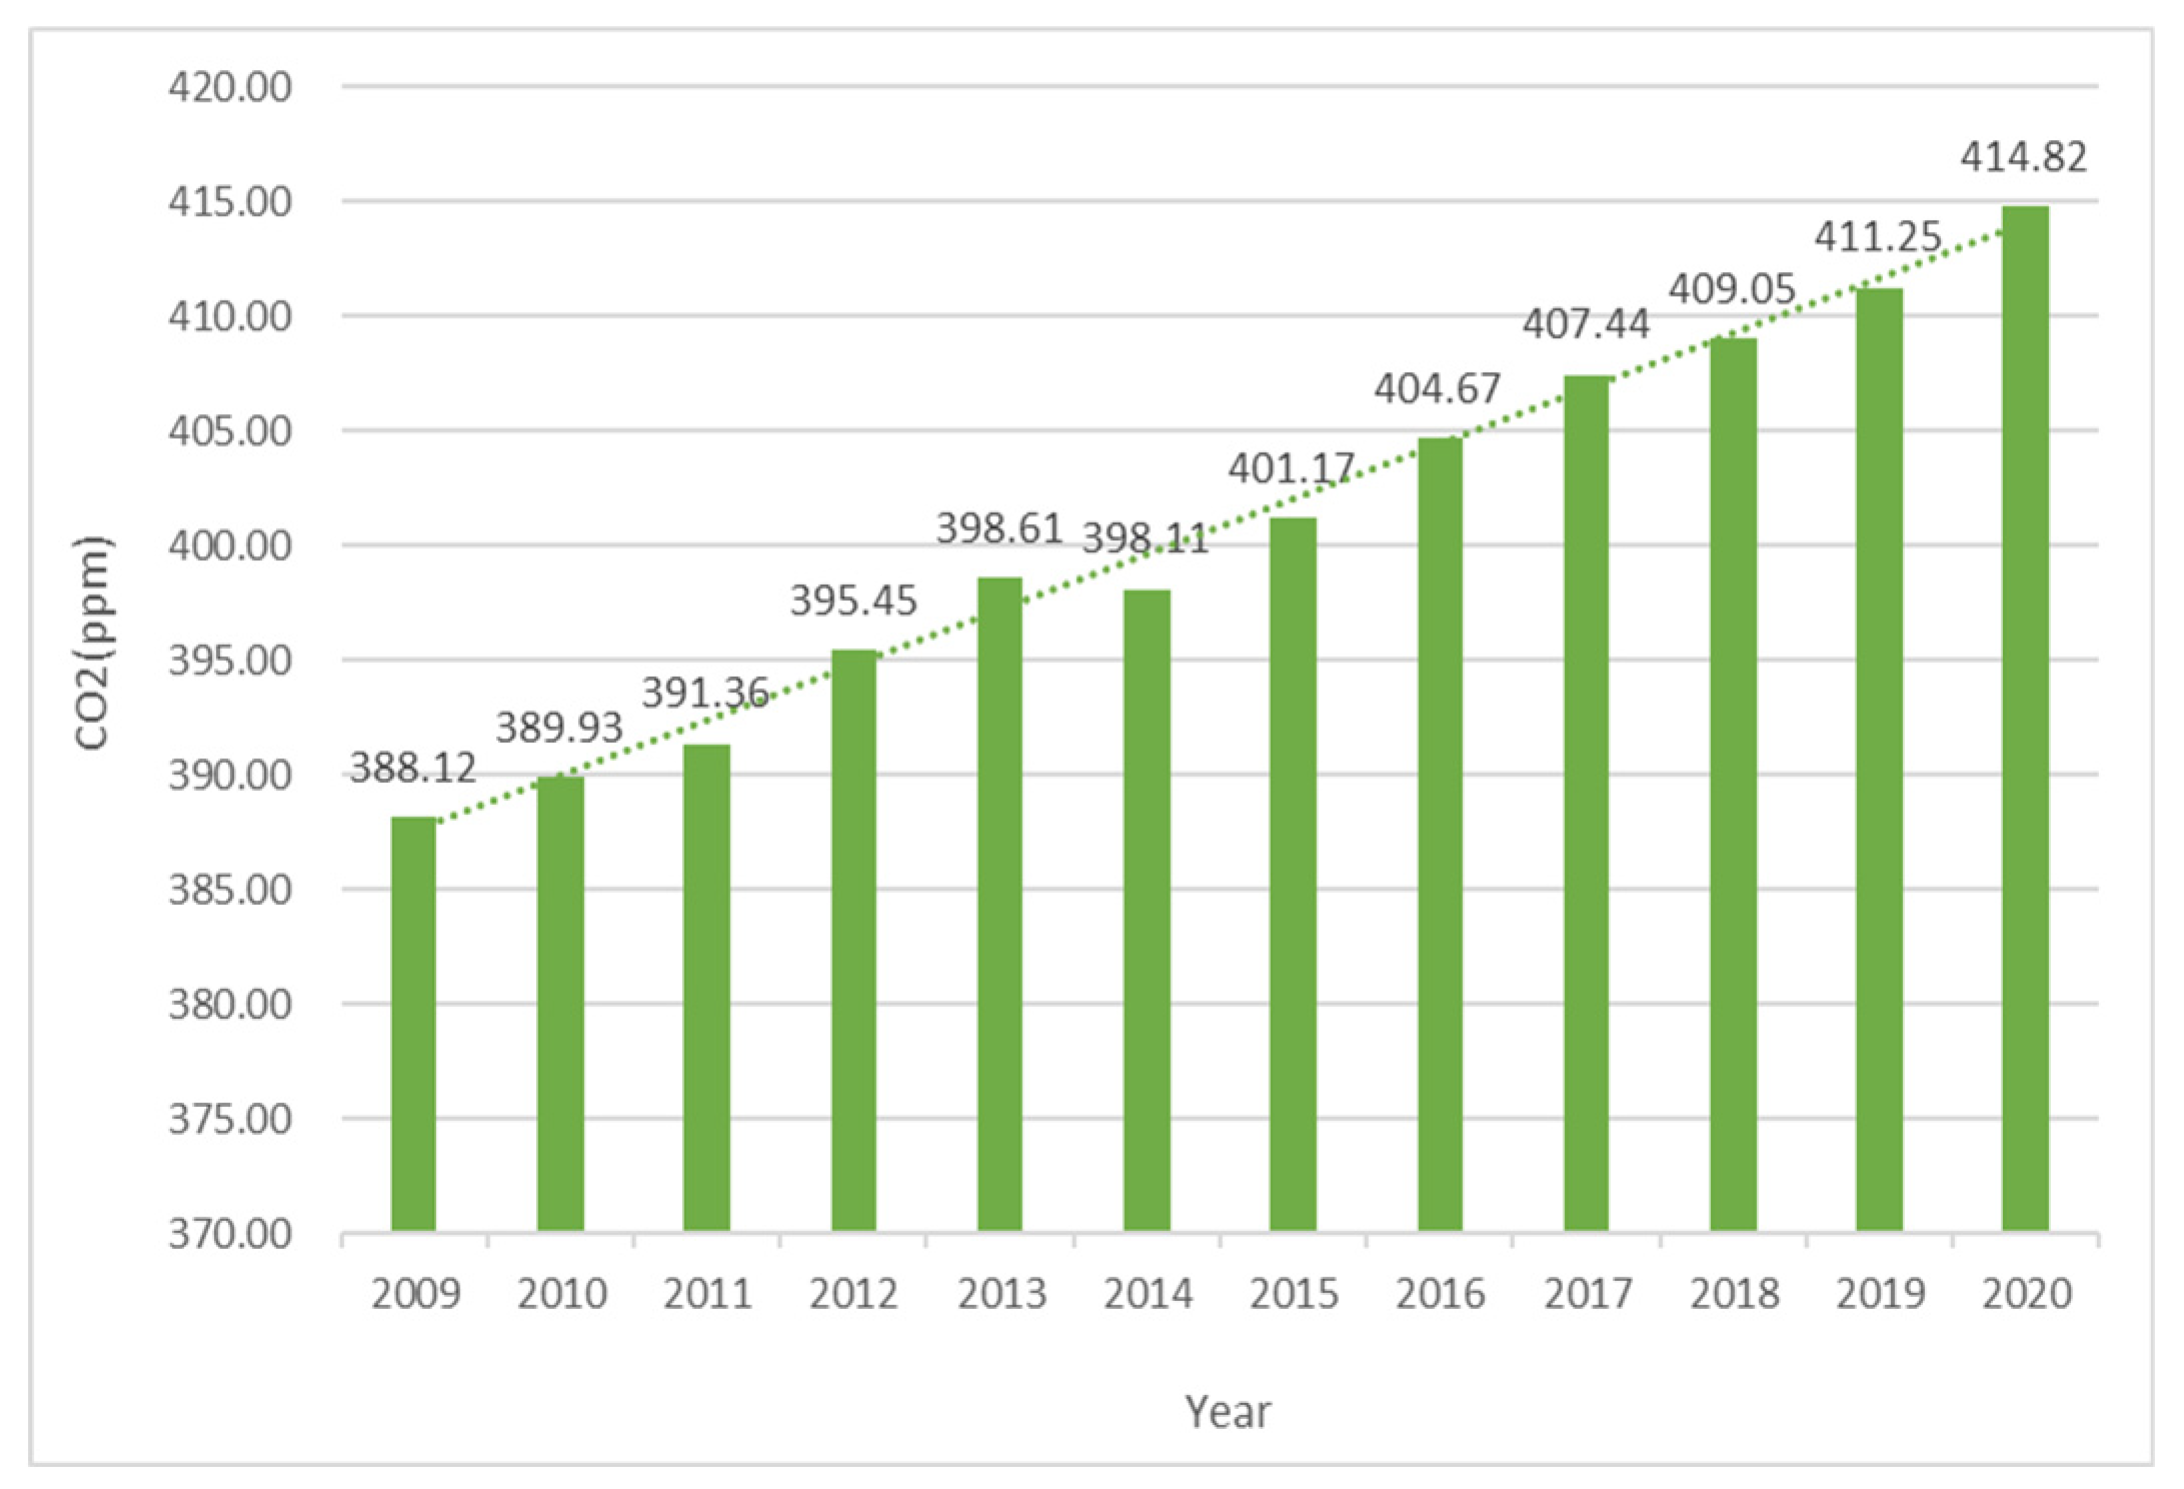
Figure 2.
The trend of global CO2 concentration from 2009 to 2020.
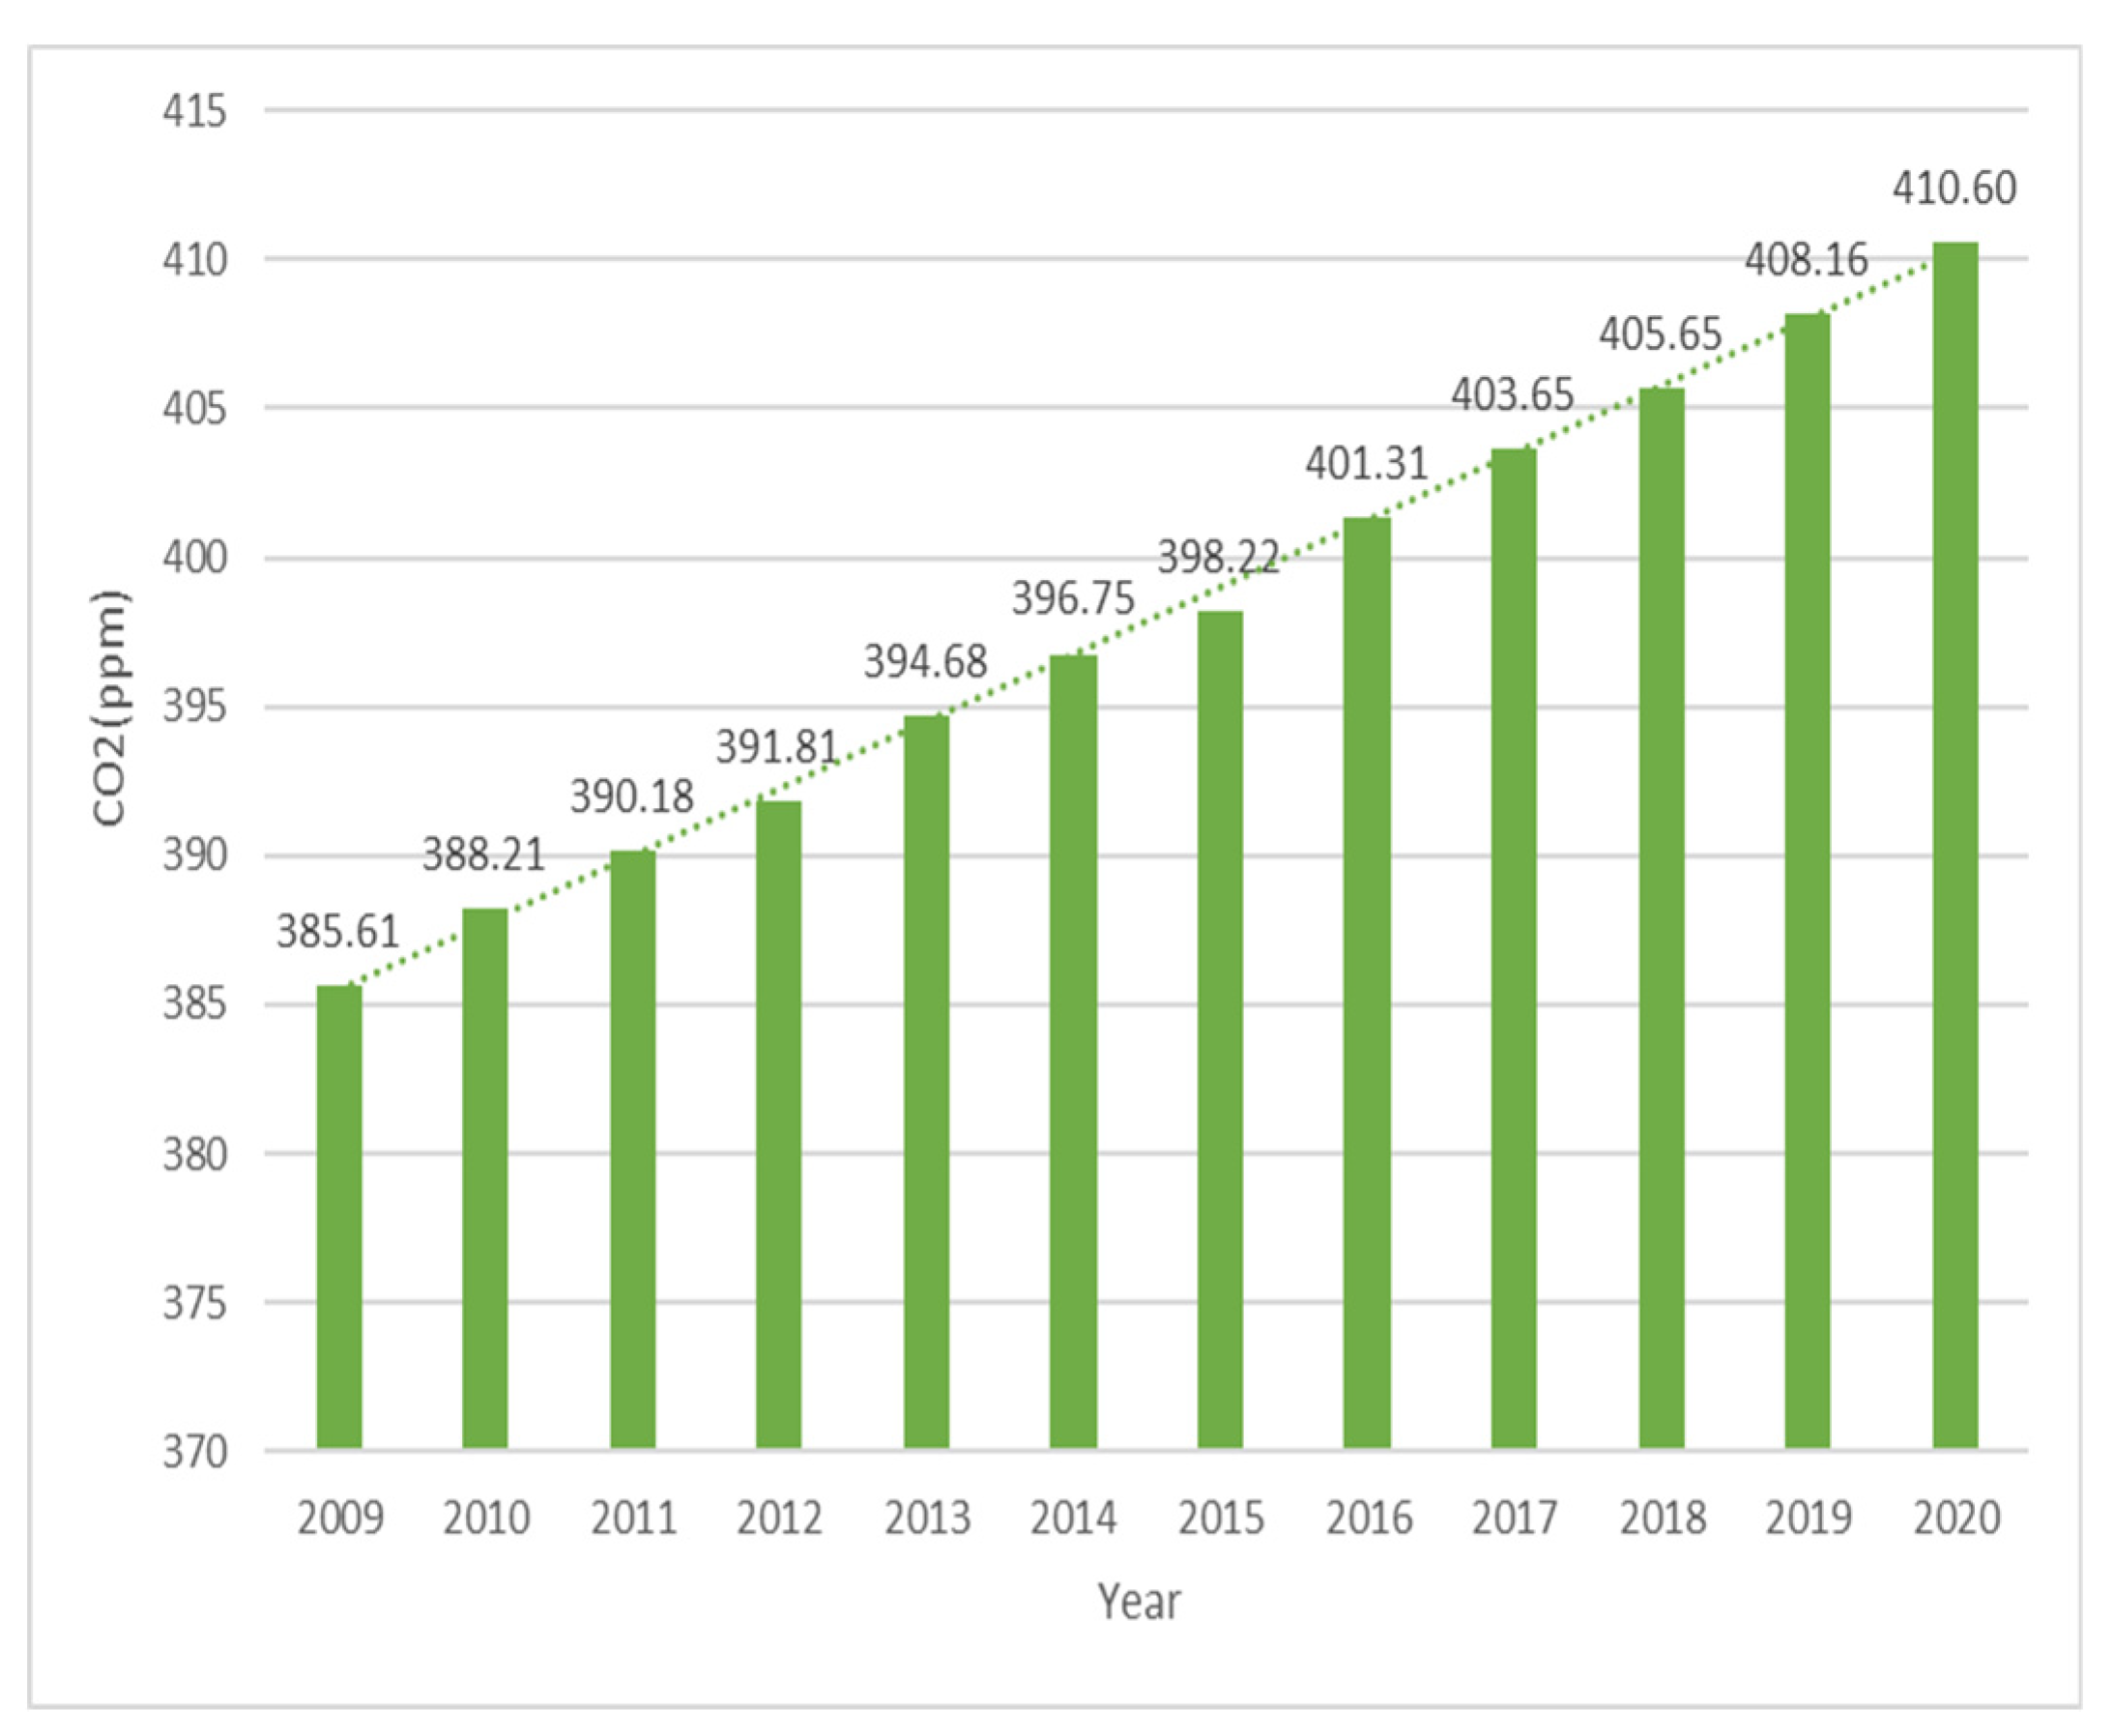
Figure 5.
The trend of XCO2 over time from 2010 to 2020 across different seasons in Hefei.
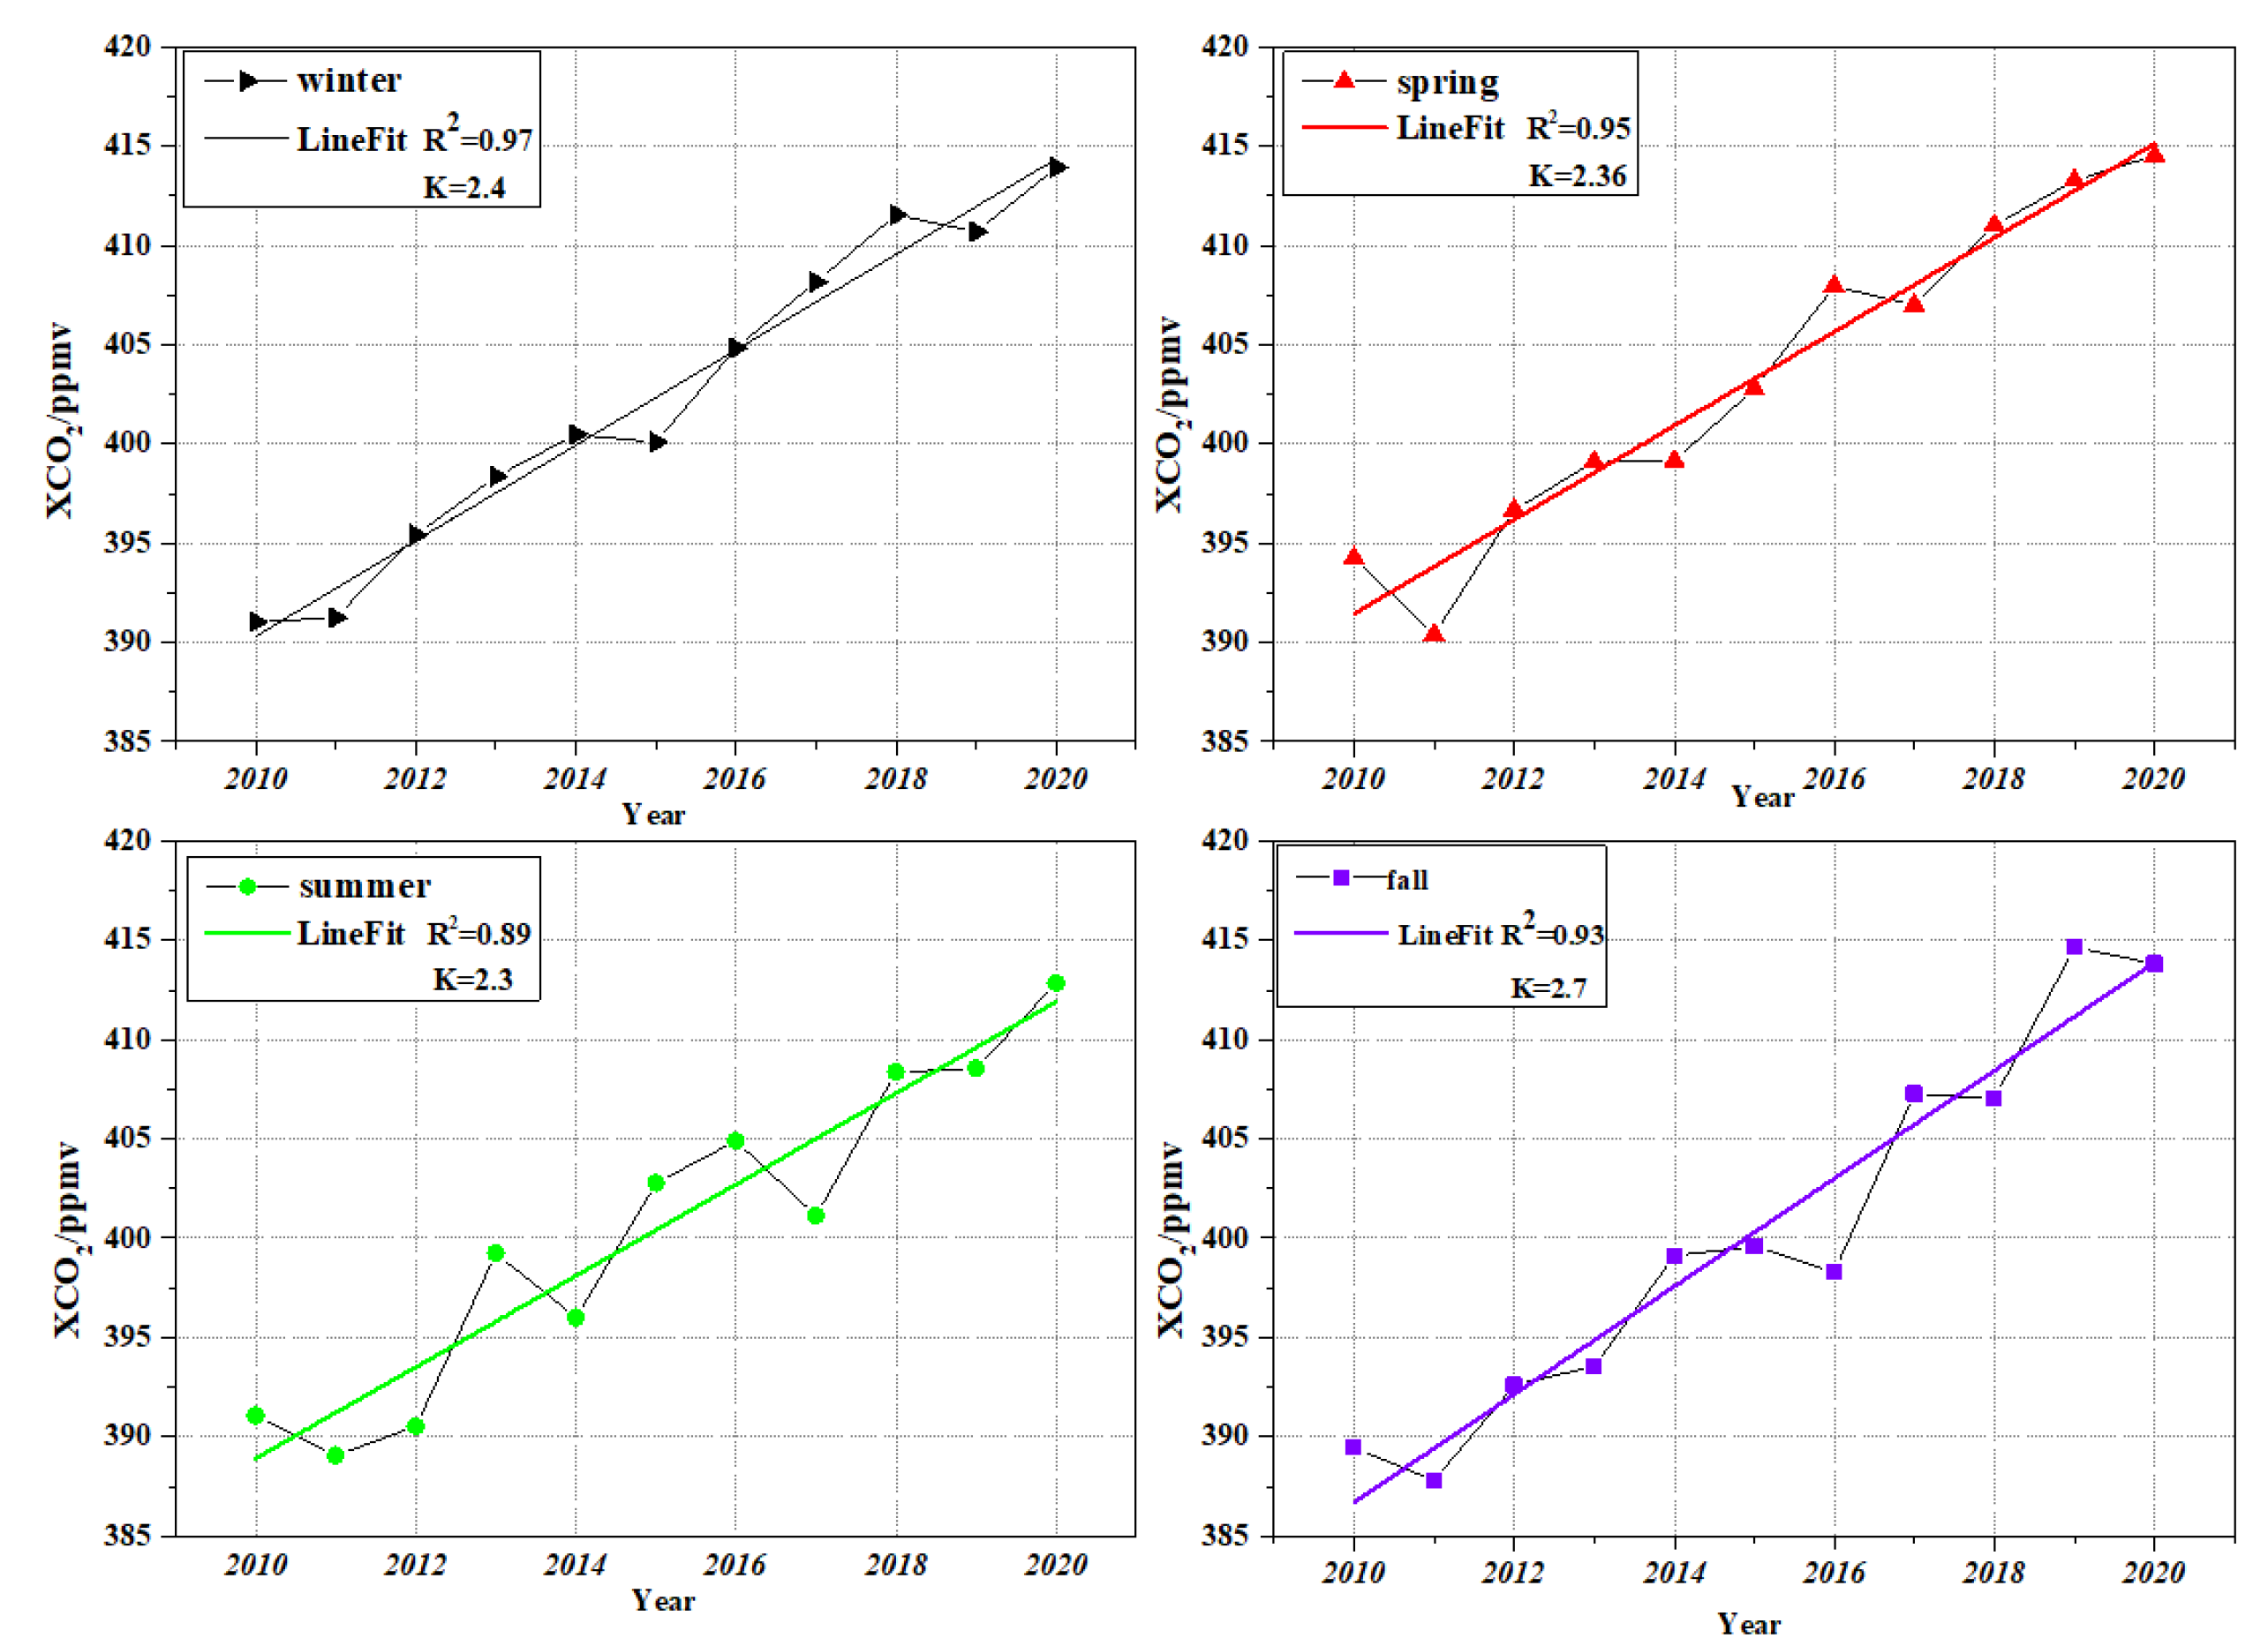
Figure 6.
The trend of XCH4 over time from 2010 to 2020 across different seasons in Hefei.
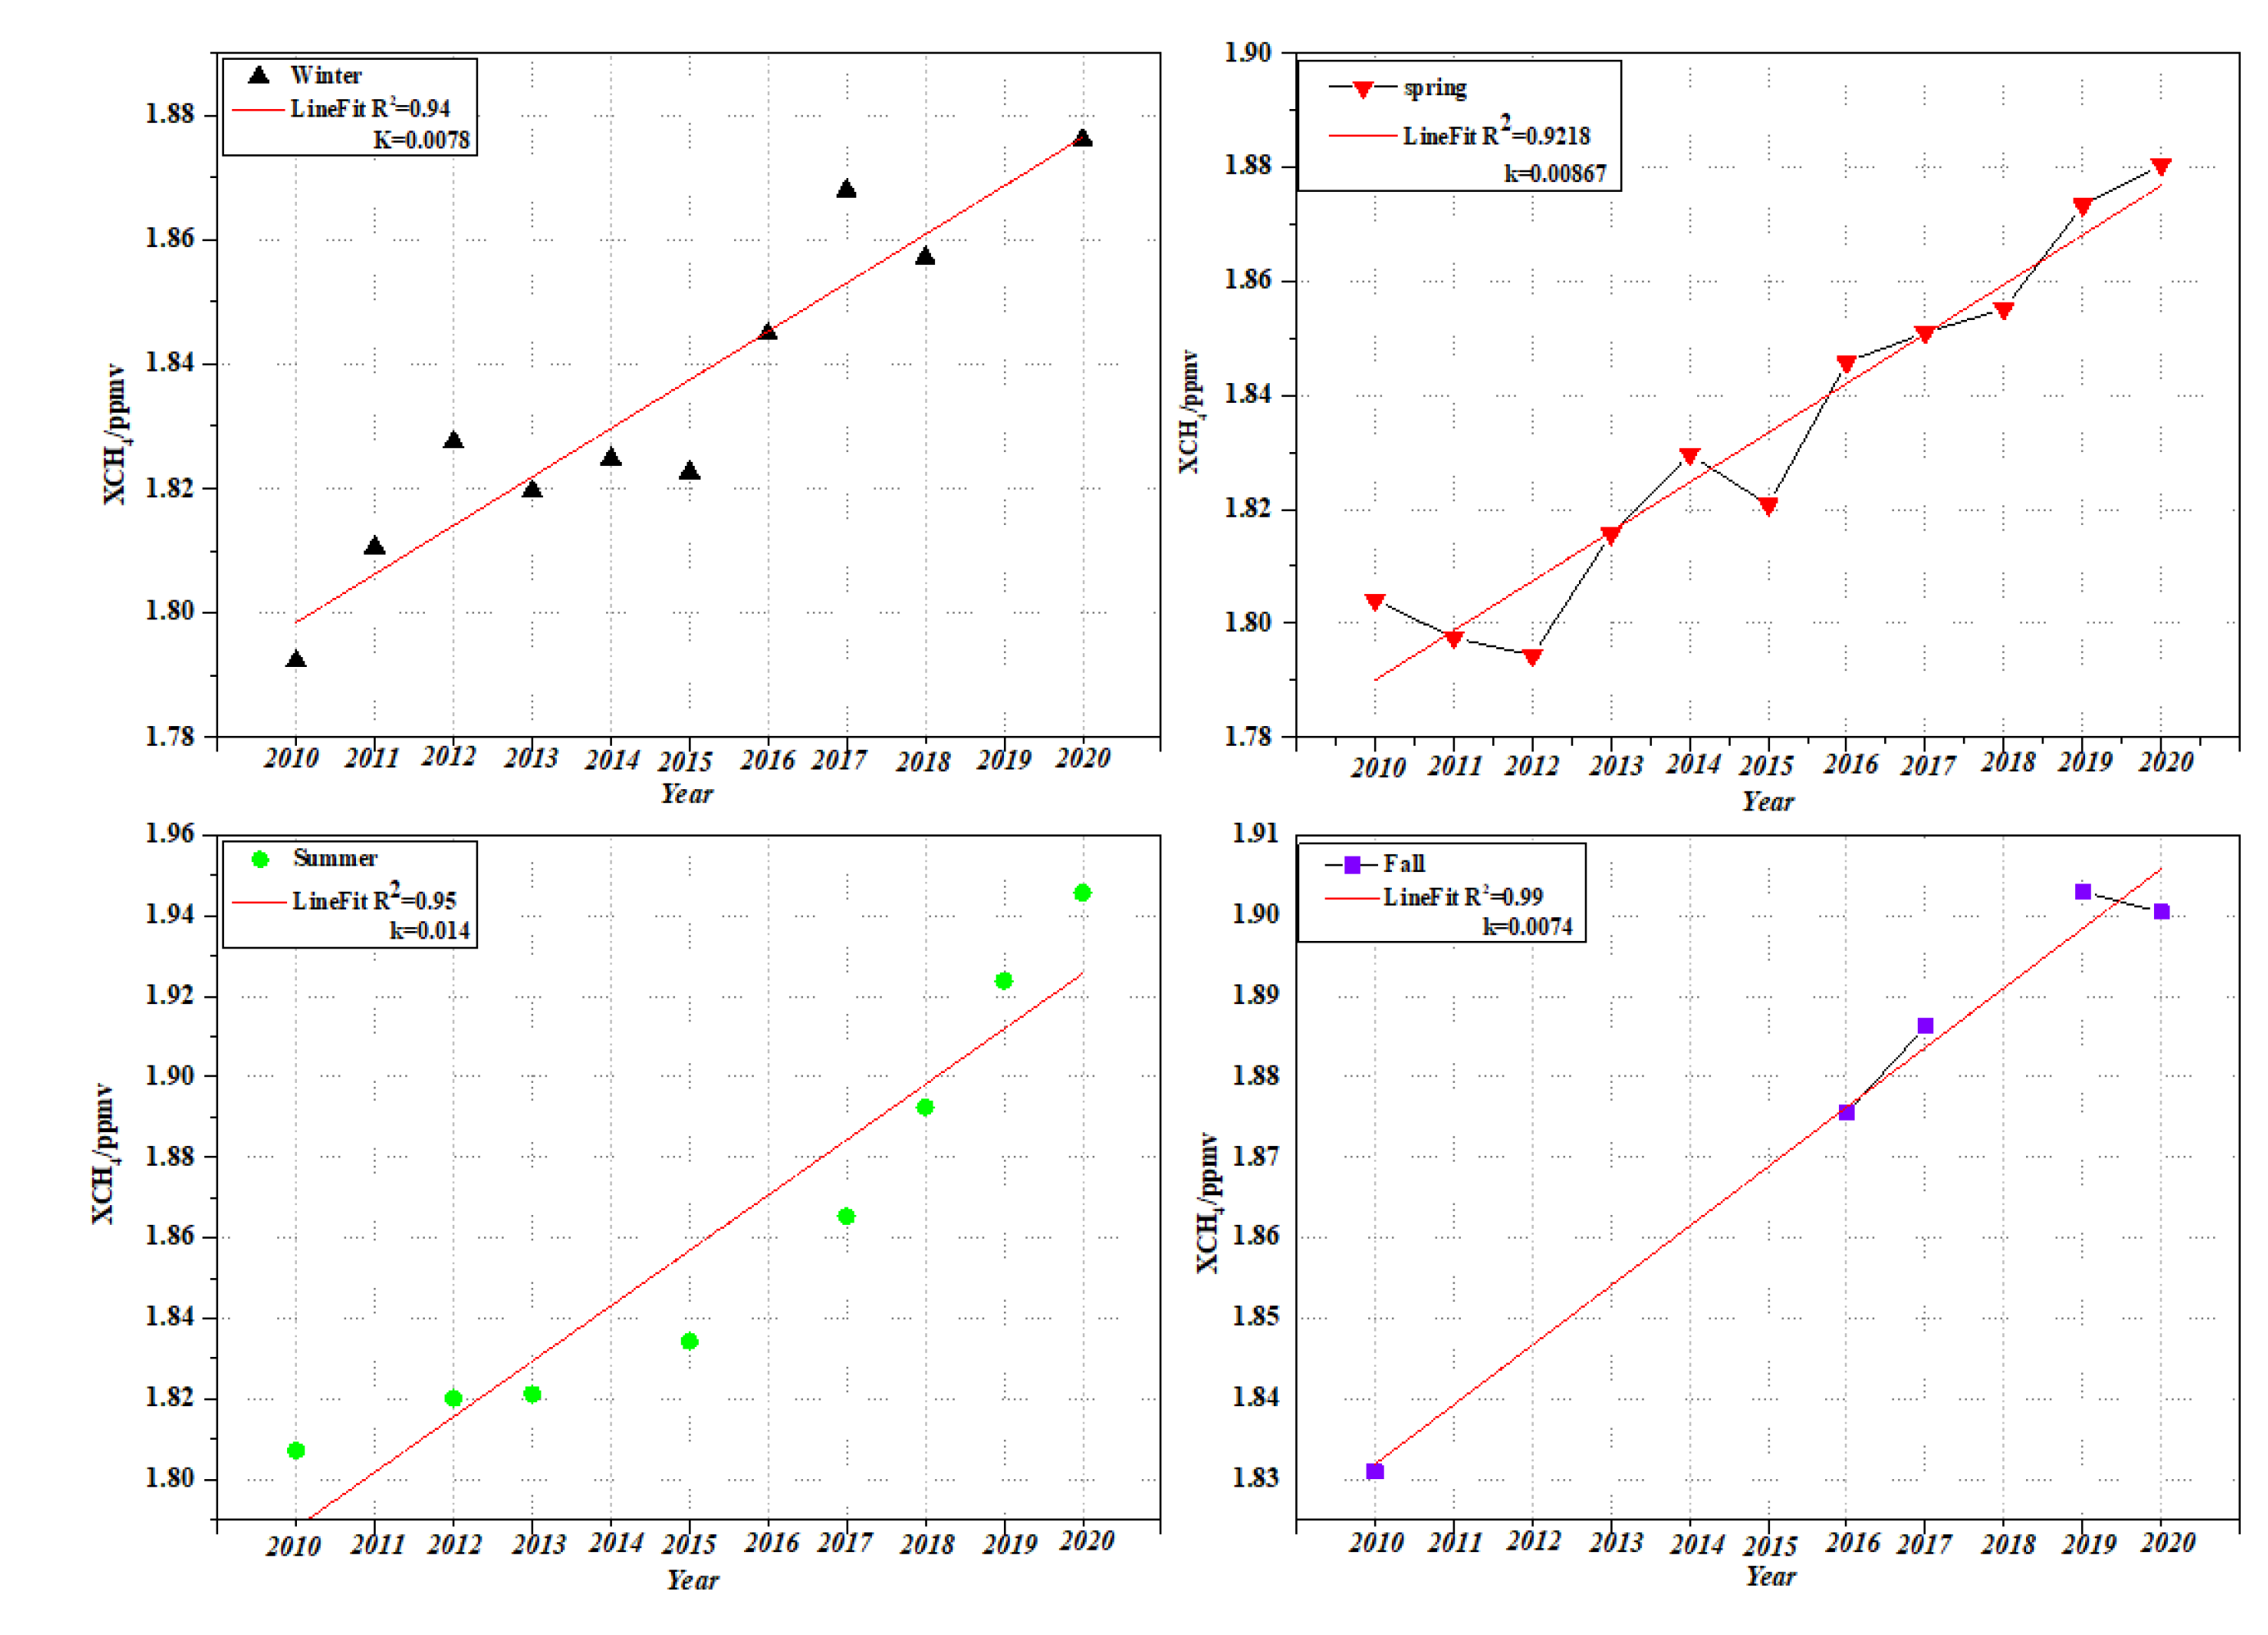
Figure 7.
The variation of air quality and zenith angle with time.
Disclaimer/Publisher’s Note: The statements, opinions and data contained in all publications are solely those of the individual author(s) and contributor(s) and not of MDPI and/or the editor(s). MDPI and/or the editor(s) disclaim responsibility for any injury to people or property resulting from any ideas, methods, instructions or products referred to in the content. |
© 2025 by the authors. Licensee MDPI, Basel, Switzerland. This article is an open access article distributed under the terms and conditions of the Creative Commons Attribution (CC BY) license (http://creativecommons.org/licenses/by/4.0/).
Copyright: This open access article is published under a Creative Commons CC BY 4.0 license, which permit the free download, distribution, and reuse, provided that the author and preprint are cited in any reuse.


