
Submitted:
16 November 2025
Posted:
17 November 2025
You are already at the latest version
Abstract
Environmental awareness and sustainable development in the context of energy secu-rity, including reduced energy consumption, increasingly require the introduction of innovative solutions in urban areas. These will primarily be systems based on natural architecture, particularly green facades and green roofs. In the near future, they will undoubtedly constitute an integral element of most architectural solutions and are al-ready a standard within global development strategies. Society faces the priority of achieving carbon neutrality, reducing the consumption of natural resources, and minimising the carbon footprint. This paper analyses the temperature around the canopy and the rear surfaces of two experimental models of green facades located on the campus of the University of Life Sciences in the centre of Wroclaw and at the Re-search and Educational Station of the same institution located in the suburban area of Swojec, southern Poland. In both cases, the locations can be classified within the same region, a transitional temperate climate zone. The purpose of the study was to evaluate the thermal effect of two locations with different characteristics, determined in the first case by dense urban development, and in the second by open and sparsely devel-oped areas. Analysis of average temperature reductions for warm and sunny days re-vealed a significant cooling effect. This effect was observed for green surfaces, regard-less of the location and display of the model. For the variant at a distance of 5 cm from the plants, a higher data concentration and a lower variability were recorded. In the same group, on sunny days, the cooling effect, depending on the location, was 4-7° C. On cloudy days, average maximum cooling in this group did not exceed 4° C. It should be emphasised that future research should focus on other elements of these systems, employ a multidisciplinary approach, and additionally have a significant impact on the urban microclimate and the immediate surroundings of the facades.
Keywords:
green facades
; microclimate
; urban and suburban zones
; system efficiency
1. Introduction
Green facades, sometimes referred to as vertical vegetation systems [1,2], offer sustainable solutions that improve building performance, reduce energy consumption, and positively impact the microclimate at both the building and the city levels.
Their ability to regulate temperature, improve thermal comfort, and mitigate environmental impacts, including mitigating the heat island effect while simultaneously reducing energy consumption, water reuse, noise reduction, air pollution control, and aesthetics and wind barriers, makes them a valuable element of sustainable architectural design. In dense urban areas, this can be particularly important in limiting and reducing the human impact on the environment [3,4,5]. They contribute to regulating the outdoor microclimate through mechanisms such as cooling. By providing shading and cooling effects, they can help reduce heat stress and improve indoor thermal comfort [6,7]. In addition, they effectively control the surface temperature of the’ walls of buildings, influencing the overall energy performance of the structure. The insulation capacity of vertical greenery significantly affects facades by influencing the levels of temperature and relative humidity [8]. Green facades not only influence the microclimate of buildings by reducing heat waves and losses, but also influence the urban microclimate at the pedestrian level by influencing variables such as air temperature, humidity, and mean radiant temperature [9]. They influence the exchange of heat and mass between the external environment, the facades and the surface of the building, thus shaping the microclimate of the building [10,11]. The passive cooling effectiveness of green facades increases with increasing levels of solar radiation, especially in warm, humid continental climates [12,13]. Although vertical green facades lower temperatures in the summer months, they also regulate indoor heat levels by providing thermal insulation in the winter months [14]. By optimising the environmental performance of buildings using vertical greening systems, such as green facades, energy consumption can be reduced, leading to improved energy efficiency [15,16]. It should also be noted that the greening of a significant portion of city facades can reduce air temperature by up to 1 °C, contributing to improved outdoor environmental comfort [17]. Furthermore, green facades will change sensible heat flux, leading to a reduction in indoor air temperature [18]. Green facades support biodiversity in urban environments by increasing species diversity compared to non-vegetated walls [19]. They also contribute to the reduction of pollution in densely populated cities, thus improving air quality and creating a healthier urban environment [20]. In addition, green facades help to manage stormwater, which can help mitigate the effect of urban heat island and provide additional environmental benefits [21,22]. In addition, they can cause economic stimulation, increased property values and the creation of new jobs in the horticulture and maintenance sectors [23,24], as well as positively impacting the value of real estate in the areas where they are designed [20]. Green vertical systems can be classified, among other things, according to their design features and solutions [1]. Typically, these solutions are designed as modular solutions or as potted plants at various heights on the façade. However, they are most often implemented as modular elements attached to walls or using structural elements, along with an irrigation system. In each case, a 3–10 cm gap is designed directly behind the system to act as a thermal buffer. These solutions have a significant impact on building’s thermal insulation [25].
The cooling efficiency of vertical green structures is widely known and is described in the literature. However, it can be assumed that the few experiments described have demonstrated differences in the efficiency of the same system solutions for different locations in urban and suburban climates. Depending on the experimental objectives presented in the literature, some researchers demonstrated differences in the temperature of green surfaces relative to atmospheric air temperature as maximum values, while others demonstrated average values. Furthermore, the efficiency of these systems was determined based on reference surfaces without plants [26]. The orientation of the wall, the species of plants, the size and development stage, and the LAI index also had a significant impact on thermal efficiency and, to a lesser extent, the type of substrate. The influence of multiple components on the efficiency of green systems can create difficulties and problems during the conducted analyses. Another important factor is the appropriate selection of assumptions for future experiments, primarily in terms of the measurement methodology used in the experiment [27]. Taking into account the characteristics of the microclimate and thermal comfort conditions, two factors are considered the most in the analyses: the temperature of the surface of the exterior wall and the ambient humidity. Therefore, the research methodology must take into account the structural and technological characteristics and properties [28].
This paper conducts a detailed analysis of the temperature around the canopy and the rear surface for two experimental models of green facades on the campus of the University of Environmental and Life Sciences in the city centre of Wrocław and at the Research and Educational Centre of the University of Environmental and Life Sciences in Wrocław, located in the Swojec district in the suburban area. These models were located in southern Poland in the Lower Silesian Voivodeship. The purpose of the study was to assess the thermal effect of two locations with different characteristics, determined by the compact urban development in the first case and the open development in the second. Both locations can be classified within the same region, a transition zone of temperate climate [29].
The methodology chapter describes the experimental green facade models, the characteristics of the facility locations, and discusses the laboratory tests and experimental equipment. The next section presents the impact of climatic conditions on the thermal insulation of green facades, considering two weather scenarios (sunny and rainy days) based on a measurement campaign conducted between June and September 2023. The thermal properties were assessed, including maximum and average temperatures in the plant environment. The impact of solar radiation on the facade surface temperature was assessed using the nonparametric Kruskal-Wallis test, which is an equivalent of ANOVA. The study was preceded by a Shapiro-Wilk test for normality at a significance level of P < 0.05. The same nonparametric test was used to assess the impact of wind speed and relative humidity on the temperature distributions of the studied surfaces. Chapter 4 provides a discussion comparing the results obtained with those available in the literature. Chapter 5, the final chapter, presents a summary and conclusions of the research.
Implementation of Green Systems Solutions and Climatic Conditions
In the analysis of the two locations included in the research experiment, the effect of geographical latitude may have been marginal. The variation in climatic conditions, particularly the calculated radiation flux, was not consistent across the different periods of the measurement campaign. The local extent of these differences may be due to changes in the natural landscape. However, for the urban agglomeration of Wrocław, these differences were shaped by a specific urban climate. It was characterised primarily by different temperatures and humidity compared to the suburban zone. Both areas were characterised by tight development on the one hand and permeable surfaces on the other, and to a greater extent, by the spatial structure of the buildings. In addition to the type of ground surface that results from tight development, the spatial structure of the buildings had a significant impact on microclimate. It could directly influence changes in wind direction and speed, as well as the magnitude of turbulent exchange. Furthermore, it should be emphasised that the agglomeration has surfaces that strongly absorb thermal energy. This may compensate for the energy losses resulting from limited direct radiation. Consequently, this situation will result in higher temperatures. In urban areas, increased atmospheric pollution, including gas and dust emissions, may also play a role in shaping the climate, which will affect the reduction of direct radiation to varying degrees.
2. Materials and Methods
The experiment was conducted at two sites during the summer period from June to October 2023. The first site was located on the campus of the University of Environmental and Life Sciences in the city centre of Wroclaw, at latitude 51 ̊ 10’and longitude 17 ̊ 3’. The second site was located at the Research and Educational Station of the University of Environmental and Life Sciences in the Swojec district, at 51 ̊ 11’and 17 ̊ 14’, respectively. Both sites are located in southern Poland in the Lower Silesian Voivodeship at an altitude of 117 m above sea level. The entire area belongs to the temperate transitional climate zone. The average annual air temperature for the 1991-2020 multi-year period is 9.6 ̊ C, and in the summer half-year (May-October) it is 15.8 ̊ C. The warmest month is July with a temperature of 19.8 ̊ C and the coldest is January (0.0 ̊ C). The total annual precipitation for the 1991-2000 period is 576 mm, including 376 mm during the summer half-year (May-October). February has the lowest rainfall, with 28 mm, and July has the highest rainfall, with 89 mm.
The study was conducted using experimental models constructed as cuboidal wood-composite structures measuring 1.3 m x 1.3 m and 2.1 m high. The model solution was designed with three-layer wood-based composite panels. To protect against weather conditions, the façade was covered with PVC panels. The interior was insulated with a 15 cm layer of extruded polystyrene (EPS). The roof insulation was constructed using the same EPS material, additionally protected with standard bituminous material. The technical parameters and physical properties of the materials used are summarised in Table 1. The models were positioned in the same direction in both locations. This model should be considered a retention solution equipped with aluminium panels with plants measuring 40x40x20cm. The panel structure was coated in white. The panels were filled with a substrate and plants were planted. The substrate was placed in prepared geotextile bags made of 50 g·m-² agrotextile. To provide plants with the right conditions for growth, a specially prepared substrate was used: a soil substrate consisting of garden soil, peat with a pH of 6.5, fine sand, 4-6mm fine expanded clay aggregate and 10-16mm coarse aggregate. The substrate was prepared in a 50:15:10:25 ratio. The HYPROP 2 measuring system [30], which uses the evaporation method, was used to measure the characteristic curve of soil water (SWCC). Complete measurements were performed according to the procedure described by the manufacturer. Based on the retention characteristics obtained, the characteristic values were determined, including the full saturation Qs = 0.858, the state at pF 2.0 and pF 3.0 of 0.55 and 0.39, respectively, and the readily available water at 16% of the volume.
The vegetation panels were equipped with automatic controlled drip irrigation systems using pressure-compensated emitters with a capacity of 2 l/min. Irrigation was initiated three and four times daily, depending on weather conditions. Each panel was irrigated by two emitters with the specified capacity. The volume of the panel with plants and substrate was 0.032 m³, and two emitters delivered 2 x 33.3 cm³ of water per minute. The plantings used were: geranium macrorrhizum, Heuchera alumroot, including “Melting Fire” (Heuchera americana), “Palace Purple” (Heucher micrantha) and “Coral Forest” (Heuchera sanguinea), sedum spectabile and grasses: Carex flacca and Carex Montana (Figure 1).
For both locations, the Leaf Area Index (LAI) was measured using an AccuPar/LAI LP-80 Meter Group device (formerly Decagon Devices Inc.). This allowed for a general assessment of the condition and development of the plant. The measured values for the University of Life Sciences Campus, regardless of their eastern and western exposure, were slightly higher compared to the Swojec site. Similarly, in both cases, the thickness of the vegetation portion did not differ significantly (Table 2).
The experiment used a data acquisition system (Figure 2) consisting of an IoT subsystem designed around ESP8266 modules and a set of sensors to monitoring environmental factors. The modules’ functionality allowed for time correction using a connection to the pool.ntp.org server via an NTP client. A detailed description of the data acquisition system in the following sections relates to the data used in the analysis. These included the drip irrigation control system, the data acquisition subsystem using an SQL database, and the application layer enabling real-time data review. Observations also included measurements of atmospheric air temperature, relative humidity, and wind speed. Solar radiation was measured on both horizontal and vertical surfaces. Air temperature and humidity were measured using Humicap HMP155 sensors from Vaisala Finland. The sensors were typically installed in a radiation shield. Wind speed measurements were performed using a Windcap WMT700 sensor from Vaisala. At the Swojec site, solar radiation was measured horizontally and vertically using a Kipp Zonen CMP11 pyranometer and at the UPWr SR2—D2 campus, a Hukseflux pyranometer. The former was measured in the 285-2800 nm range, and the latter in the 285-3000 nm range. Meteorological data were measured at a 1-minute interval and recorded using a Vaisala QML201C.
For the purposes of this study, temperature data at characteristic points in the green systems were obtained on the basis of measurements using profile probes (a proprietary solution). The probes consisted of Maxim Integrated 18B20 sensors, which allowed measurements with an accuracy of 0.3 °C. In this case, the measurement concept was based on a 1-Wire serial bus. The integrated probe contained six temperature sensors connected to the ESP8266 Wi-Fi transmission modules. The modules are connected to a database hosted on a remote SQL server with a 1-minute time interval. The controller software was designed to provide a functional connection to an online website, enabling real-time access to the data. Air temperature measurements were taken in the immediate vicinity of the green model, among other places, right next to the plant panel, at a distance of 5 and 10 cm from the plants, as well as in the plant substrate and the air gap behind the panel in front of the wall. These measurements were taken at the centre points of the green structures on each façade.
The design of the cuboidal models presented in this study was not intended to simulate the thermal conditions within the structure, and therefore, the functionality of the technical solutions was not ensured. The geometric and thermophysical characteristics of the structural elements, such as conductivity and thermal capacity, will be omitted in the remainder of this paper.
Statistical analyses aimed at identifying significant differences between temperatures at characteristic points and assessing the impact of solar radiation, wind speed, and air humidity on cooling efficiency were conducted using the Tibco Statistica v.13 software. Identification was performed using the nonparametric Kruskal-Wallis test, which is equivalent to the parametric Anova test. The use of this nonparametric test was necessary due to the characteristics of the data distribution. The Shapiro-Wilk test for normality at a level of P < 0.05 was the basis for rejecting the hypothesis of normality for the study population.
3. Results
Thermal Efficiency
The impact of meteorological and climate conditions on the thermal performance of vertical green structures was analysed for two weather scenarios: sunny and cloudy days. The summer of 2023 was characterized by air temperatures in the Wrocław metropolitan area ranging from 12.1 to 35.5° C, with an average of 21.4° C, and in the Swojec district from 3.7 to 33.1° C, with an average of 19.6° C. Considering only sunny days, the average energy reaching the surface, depending on the location, was 0.7667 MJ·m²·h-1
for the UPWr Campus and 1.485 MJ·m²·h-1 for Swojec, while the average wind speed during the same period was 0.74 and 1.97 m² s-1, respectively. The following section presents the temperature distribution in the immediate vicinity of the plants, at a distance of 5 cm, and in the air gap behind the panel in front of the wall, against the background of solar radiation and air temperature. The graphs show a representative sunny and cloudy day, while the second is cloudy. In both cases, the data presented includes two facades: east and west (Figure 3, 4).
A warm sunny day (5 July) and a warm cloudy day (13 July) were selected for detailed analysis. For the first case (Figure 3), the maximum radiation for both locations varied; for the UPWR campus, it was 961.9 W m-2, and in the Swojec district it was 1219.8 Wm-2. The maximum temperatures on this day were 30.2 and 30.3° C, respectively. The time shift of the temperatures relative to the maximum radiation was 12 and 22 minutes. For green facades, the measured temperatures in the foliage (gr1), regardless of the facade, were significantly lower than the air temperature, at 19.6° C. At an average distance of 5 cm from the plants (gr2), the temperature was observed to be approximately 5° C higher. For both cases, the time shift to reach the maximum temperature in the relation – eastern elevation and western elevation - was nearly 60 minutes for the UPWr campus and 120 minutes for the Swojec district.
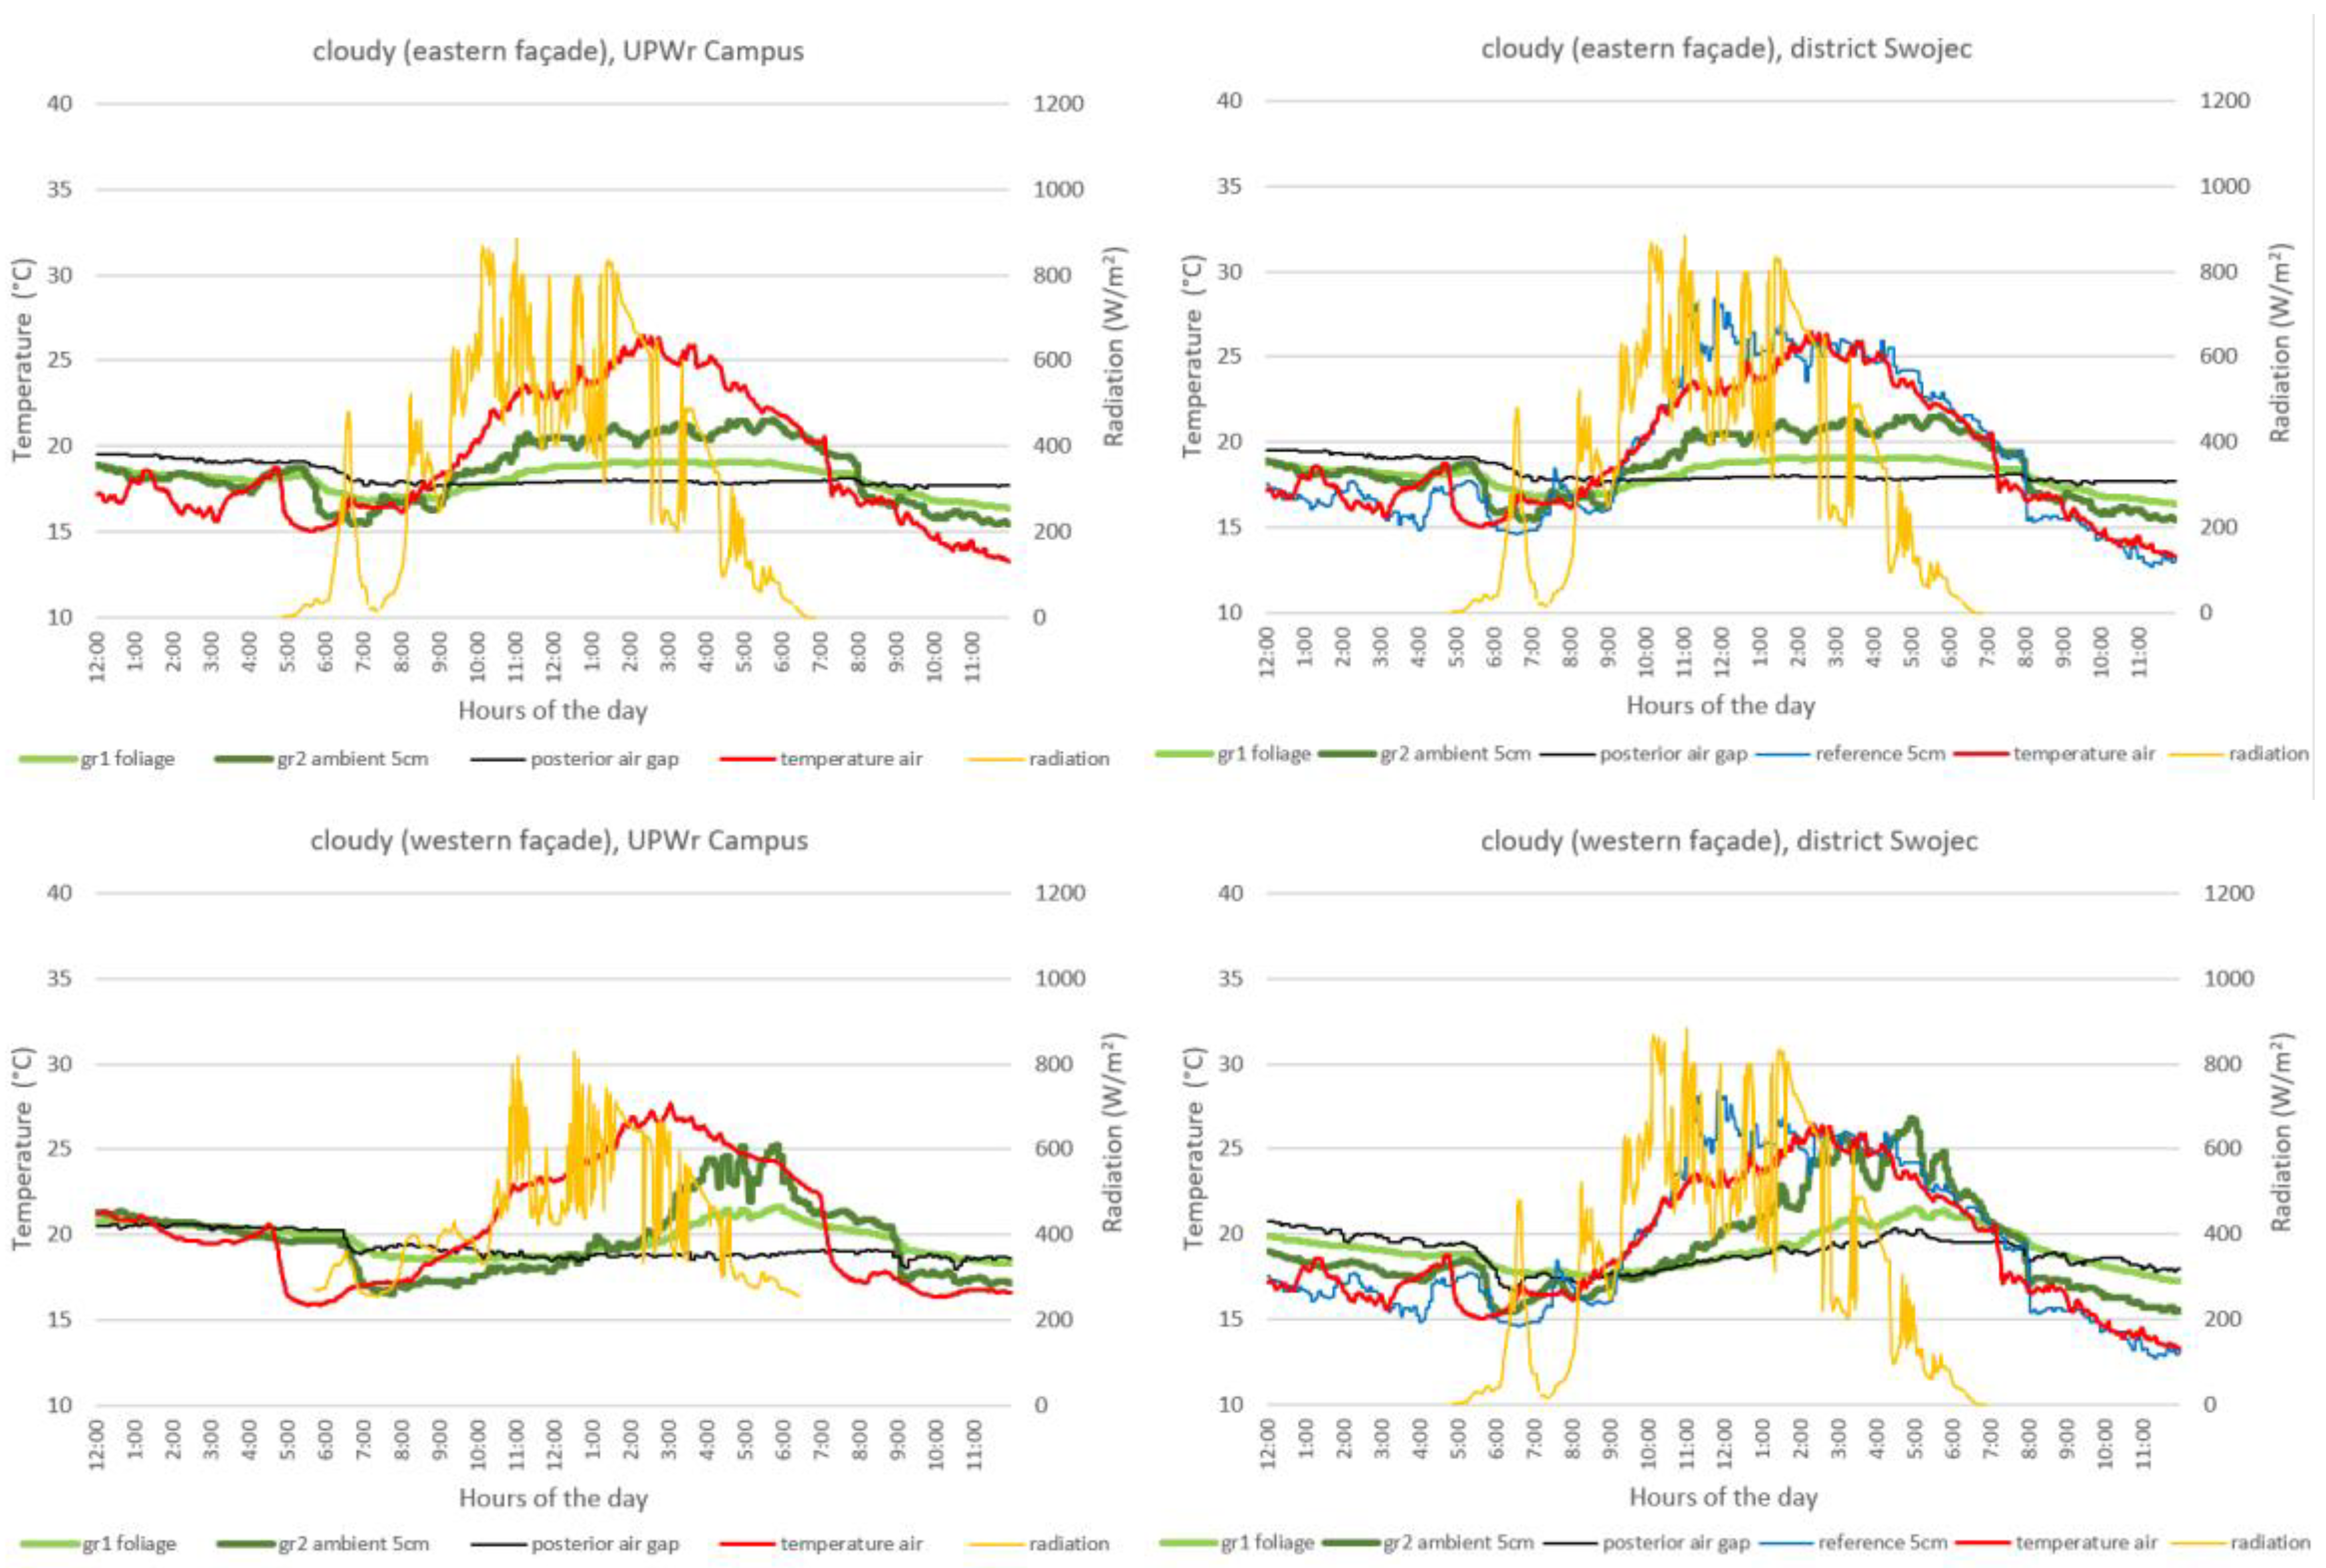
On a cloudy day on July 13, the maximum radiation intensity for the UPWr campus was 828 W m-2 and for the Swojec district, 884 W m-2, with maximum air temperatures of 27.7 and 26.4 °C, respectively. On this day, despite the temperature reductions around the green façade (gr1 and gr2), it can be concluded that these properties were not controlled by radiation to the same extent as on the first date, regardless of the eastern and western exposures.
On both dates, on sunny and cloudy days in the late afternoon and at night, for two locations, the temperatures in gr1 and gr2 were higher than the temperature on the control wall and the air temperature.
Figure 4.
Air temperature and solar radiation, as well as temperature in the immediate vicinity of plants gr1, at a distance of 5 cm from plants gr2 and in the air gap behind the panels on the eastern and western facades on a cloudy day on July 13, 2023.
Figure 4.
Air temperature and solar radiation, as well as temperature in the immediate vicinity of plants gr1, at a distance of 5 cm from plants gr2 and in the air gap behind the panels on the eastern and western facades on a cloudy day on July 13, 2023.
To assess the impact of vertical greening on structures and the cooling effect on air temperature, data groups from the entire measurement campaign were analysed, taking into account the maximum cooling value. The maximum daily averages for the entire experiment for the east and west facades for two locations are presented in box plots (Figure 5 for sunny days, Figure 6 for cloudy days). The analysis included selected groups, including the cooling effect directly in the foliage (gr1), at a distance of 5 cm from the plants (gr2), and in the air gap behind the plant panels. In each of the cases considered, the characteristics indicate a significant cooling effect for all groups. For green surfaces in gr2, regardless of exposure and model location, a higher data concentration and lower variability can be observed. In the same group, on sunny days, the cooling effect, depending on the location, was 4-7° C. On cloudy days, the average maximum cooling in group gr2 did not exceed 4° C (third quartile Q3) and did not exceed 8° C for non-outlier observations. It is worth noting that the cooling efficiency for the model at the UPWr Campus was higher than for the model at Swojec. In the former case, it was 7.0° C (maximum 12.0° C) on the eastern façade, and in the latter it was 4.2° C (maximum 7.1° C). Slightly smaller differences were observed on the western façade. Similarly, for the UPWr campus, it was 6.0° C (maximum 10.1° C) and for Swojec, 6.1° C (maximum 8.2° C).
Regardless of the chosen date for the cooling effect analysis and the location of the model, the maximum effect resulting from the difference between ambient air temperature and the façade temperature occurred in the air gap behind the panels.
Statistical tests allowed for a more detailed study of the thermal behavior of green facades. For this purpose, the relationship between outdoor temperature and solar radiation intensity was assessed. The nonparametric Kruskal-Wallis test and the median test were used. The possibility of using Anova tests for normal distributions of the variables studied was previously excluded. Analysis with the Shapiro-Wilk test at the level of P < 0.05 for each group allowed for rejection of the hypothesis of normal distribution. Comparison of the median temperature reduction as a function of solar radiation intensity partially confirmed the relationship between groups a and c (up to 400 and 600-800 W⋅m-2) for both locations in the Swojec district and additionally in group d (>800 W⋅m-2). On cloudy days, this relationship could only be observed in the western exhibition area on the UPWr campus in groups a and c (up to 400 and 600-800 W⋅m-2), Table 3.
Relative air humidity (RH) affected cooling efficiency in a decreasing manner with increasing relative humidity. The maximum effect was observed for values between 40-60%. However, for both locations, a reduction in efficiency was observed at relative humidity <40% and >60%, Table 4.
The wind had an increasing effect on the cooling efficiency of vertical facades, reaching its maximum effect at v > 3 m⋅s-1. Comparison of median values between groups revealed no statistically significant differences at the level of P < 0.05, as confirmed by the Kruskal-Wallis test, Table 5.
4. Discussion
The cooling capacity of vertical greenery systems is achieved through shading, evaporation, and additional insulation. These systems improve the energy efficiency of buildings and mitigate the effects of the urban heat island effect. However, their effectiveness varies according to climate, design, and plant selection. In the case of the described experiment, the study area belonged to a transition zone of temperate climate. The essence of the experiment was to compare the performance of two technically identical solutions in different locations. In the first case, this was a location typical of dense urban development, while in the second, the model was located in an open suburban area. The tested characteristics demonstrated a significant cooling effect for both the green surfaces and the gap behind the panel. For green surfaces, the cooling effect, depending on the location, was 4-7° C. On cloudy days, average maximum cooling did not exceed 4° C. The maximum effect resulting from the difference between the ambient and façade temperatures occurred in the air gap behind the panels. Other studies confirm that green walls can reduce the temperature of the exterior wall surface by up to 6-11° C. However, the extent will depend largely on the density of vegetation and the orientation of the wall. In virtually every case, the cooling effect was confirmed to be most pronounced on warm and sunny days and dependent on the type of plant, substrate, and irrigation method. Experimental studies by Cuce [31] showed that, for 10 cm thick Hedera helix plants, temperature regulation in green wall systems was highly dependent on vegetation type and growth rate. On a sunny day in a temperate climate, a temperature reduction of more than 6° C was achieved. Frewan et al. [32] investigated the shading and energy efficiency of VGS in buildings in hot climates. They showed that green walls are effective shading systems. In this case, the green wall helped reduce the external surface temperature by 6–11° C compared to the base case of a wall without VGS. Susca [33] and Banti [34] in their studies assessing the results of green facades achieved a temperature reduction of 8° C on a hot day. Assimakopoulos [35] confirmed a decrease in the temperature of the surface of the external façade. In the summer season, for more than 60% of the hours, the temperature difference of the external wall surface before and after the application of the green system ranged from 6 to 11° C. On a city scale, such solutions will have a mitigating effect on the urban heat island phenomenon. Sendra-Arranz [36] in their studies confirmed that the average control temperature was higher than the temperature of the green wall, with a maximum difference of about 20° C on the south façade. Nonparametric hypothesis tests regarding the equality of means confirmed these observations. These results were not confirmed for night hours. In our study, nonparametric Kruskal-Wallis tests and the median temperature reduction test as a function of solar radiation intensity confirmed the relationship between the groups for both locations, i.e., up to 400 and 600-800 W⋅m-2. In the case of the Swojec location, this relationship was also observed in the >800 W⋅m-2 group. On cloudy days, this relationship was observed only at the Western Exhibition on the Wrocław University of Environmental and Life Sciences campus, in the up to 400 and 600-800 W⋅m-2 groups.
Considering other green solutions for urban areas, such as green roofs and walls, we always obtain a heat island reduction effect through shading, water evaporation, and lowering surface temperatures. Barriuso and Urbano [37] confirm the effects of reducing urban air temperature by up to 11.3° C. However, their results show that green roofs and walls have varying effectiveness in mitigating extreme climate phenomena depending on the location. According to Wong et al. [38], green infrastructure has a cooling effect on the urban environment by providing shade and evapotranspiration. Above-ground greenery reduces peak surface temperatures by 2–9° C, while green roofs and green walls reduce surface temperatures by up to 17° C. This provides additional thermal insulation to the building envelope. In this case, it was also confirmed that the cooling potential varies greatly and depends on the city’s infrastructure, the extent of greenery, and the selection and arrangement of plants.
5. Conclusions
To assess the impact of green walls on temperature and thus the efficiency of the systems, due to their different locations, two experimental models of green facades were used: one on the campus of the University of Environmental and Life Sciences in the city centre and the other at the Research and Educational Station of the University of Environmental and Life Sciences in Wroclaw, located in the Swojec district in the suburban area. These models were located in southern Poland in the Lower Silesian Voivodeship. Both locations had different characteristics, characterized by dense urban development in the former and open development in the latter. A common feature was the climatic region, classified as a transition zone of temperate climate. Preliminary data from the entire experimental period, containing 2.4 million samples, and meteorological data, corresponding to nearly 500,000 samples for each station, were used in the detailed analysis.
Analysis of average temperature reductions on sunny and warm days revealed a significant cooling effect for green surfaces, regardless of the location and exposure of the model. Greater data concentration and lower variability were observed for the green gr2 surfaces. In the same group, the cooling effect on sunny days, depending on the location, was 4-7° C. On cloudy days, average maximum cooling in this group did not exceed 4° C. It was also observed that the model located in the densely populated area of the city centre of Wroclaw had higher cooling efficiency compared to the model located in Swojec. In the former case, on the eastern facade, it was 7.0° C with a maximum of 12.0° C, and in the latter case it was 4.2° C with a maximum of 7.1° C. In the western facade, the trend was similar, but the efficiency differences between the models were smaller. Regardless of the date and location for which the cooling effect was analysed, the maximum effect resulting from the difference between atmospheric air temperature and facade temperature occurred in the air gap behind the panels. The daily temperature profile on the exterior surface of the wall behind the panels was practically flat. Consequently, this may result in greater thermal stability of the external wall. The air gap also acts as a thermal buffer and can increase the thermal stability of the wall. It was also found that the time delay for the change in temperature on the green surfaces of Gr1 and Gr2 on a warm, sunny day, relative to maximum radiation, was twice as long at the Swojec location compared to the UPWr campus (12 and 22 minutes). At the same time, for air temperature, the time lag for reaching maximum temperature on Gr1 and Gr2 surfaces, relative to the eastern and western facades, was nearly 60 and 120 minutes, respectively.
It should be emphasised that the information obtained from the experiment and the statistical analyses may be somewhat insufficient. Future research under similar conditions would be advisable, taking into account the direct impact of green facades on the microclimate in the immediate surroundings, including relative humidity.
Author Contributions
Conceptualization, G.P., R.W.; methodology, G.P., W.O.; validation, G.P.; formal analysis, G.P., R.W., W.O.; resources, G.P., W.O.; writing—review and editing, G.P., W.O., R.W.; supervision, G.P. All authors have read and agreed to the published version of the manuscript.
Funding
This research received no external funding.
Institutional Review Board Statement
Not applicable.
Informed Consent Statement
Not applicable.
Data Availability Statement
All the data are provided in the main manuscript.
Conflicts of Interest
The authors declare no conflicts of interest.
Abbreviations
The following abbreviations are used in this manuscript:
| UPWr | Wroclaw University of Environmental and Life Sciences |
References
- Manso, M. , Castro-Gomes, J. Green wall systems: a review of their characteristics Renew. Sust. Energ. Rev., 41, 2015, pp. 863-871. [CrossRef]
- Coma, J. , Pérez, G., de Gracia, A., Burés, S., Urrestarazu M., Cabeza L.F. Vertical greenery systems for energy savings in buildings: a comparative study between green walls and green facades Build. Environ., 111, 2017, pp. 228-237. [CrossRef]
- Santos, T.D.O. , Pacheco, F.A.L., Fernandes, L.F.S. A systematic analysis on the efficiency and sustainability of green facades and roofs. Science of The Total Environment, V932, 2024. [CrossRef]
- Pérez, G. , Rincón, L., Vila, A., González, J.M., Cabeza, L.F. Green vertical systems for buildings as passive systems for energy savings Appl. Energy, 88, 2011, pp. 4854-4859. [CrossRef]
- Vijayaraghavan, K. Green roofs: a critical review on the role of components, benefits, limitations and trends Renew. Sust. Energ. Rev., 57, 2016, pp. 740-752. [CrossRef]
- Chabada, M. Influence of the active irrigation system on the vegetation façade. Journal of Physics Conference Series, 2654(1), 012116, 2023. [CrossRef]
- Marx, D. (2023). Automated workflow for simulating the effect of green façades on indoor thermal comfort. Journal of Physics Conference Series, 2600(9), 092007. [CrossRef]
- Groeve, M. Preliminary experimental laboratory methods to analyse the insulation capacity of vertical greening on temperature and relative humidity. Sustainability, 15(15), 11758, 2023. [CrossRef]
- Silva, P. , Duarte, D. Are green walls a suitable environmental compensation in densifying cities? quantifying the urban microclimate effects at the pedestrian level in sao paulo. Pós Revista Do Programa De Pós-Graduação Em Arquitetura E Urbanismo Da Fauusp, 29(55), e195441, 2022. [CrossRef]
- Aldeek, Z. Towards efficient green architecture and sustainable facades using novel brick design. International Journal of Design & Nature and Ecodynamics, 15(2), 205-210, 2020. [CrossRef]
- Convertino, F. , Vox, G., & Schettini, E. Heat transfer mechanisms in vertical green systems and energy balance equations. International Journal of Design & Nature and Ecodynamics, 14(1), 07-18, 2019. [CrossRef]
- Vox, G. , Blanco, I., & Schettini, E. Green façades to control wall surface temperature in buildings. Building and Environment, 129, 154-166, 2018. [CrossRef]
- Convertino, F. , Blanco, I., Schettini, E., & Vox, G. A nature-based system for improving mediterranean buildings’ performance: contribution to energy saving by heat transfer reduction and influence of climatic parameters. Journal of Agricultural Engineering 54(3), 2023. [CrossRef]
- Kobya, H. and Canan, F. Examination of vertical green facades and green roofs in terms of ecological criteria and evaluation of energy efficiency. 2021; 11, 1047–1058. [Google Scholar] [CrossRef]
- Jezzini, Y. , Assaf, G., Assaad, R. Models and methods for quantifying the environmental, economic, and social benefits and challenges of green infrastructure: a critical review. Sustainability, 15(9), 7544, 2023. [CrossRef]
- Saadatian, O. , Sopian, K., Salleh, E., Lim, C.H., Riffat, S., Saadatian, E., Toudeshki, A., Sulaiman M.Y. A review of energy aspects of green roofs Renew. Sust. Energ. Rev., 23, 2013, pp. 155-168. [CrossRef]
- Nasrollahi, N. , Ghosouri, A., Khodakarami, J., & Taleghani, M. Heat-mitigation strategies to improve pedestrian thermal comfort in urban environments: a review. Sustainability, 12(23), 2020. 10000. [CrossRef]
- Lin, C. Comprehensive analysis on the thermal comfort of various greening forms: a study in hot-humid areas. Environmental Research Communications, 6(2), 025010, 2024. [CrossRef]
- Oloś, G. Green facades support biodiversity in urban environment – a case study from poland. Journal of Water and Land Development, 257-266, 2023. [CrossRef]
- Hamling, A. Vertical green landscape facades as a reducer of pollution in high density cities: a review. upc, 2(1), 2024. [CrossRef]
- Palermo, S. Nature-based solutions for urban stormwater management: an overview. Iop Conference Series Earth and Environmental Science, 1196(1), 012027, 2023. [CrossRef]
- Vijayaraghavan, K. , Joshi, U.M. Application of seaweed as substrate additive in green roofs: enhancement of water retention and sorption capacity Landsc. Urban Plan., 143, 2015, pp. 25-32, 10.1016/j.landurbplan.2015.06.006.
- Reyes, M. Sustainability factor for the cost–benefit analysis of building-integrated greenery systems. Sustainability, 16(1), 157, 2023. [CrossRef]
- Ichihara, K. , Cohen, J.P. New York City property values: what is the impact of green roofs on rental pricing? Lett. Spat. Resour. Sci., 4, 2011, pp. 21–30. [CrossRef]
- Pérez, G. , Coma, J., Martorell, I., Cabeza, L.F. Vertical Greenery Systems (VGS) for energy saving in buildings: a review Renew. Sustain. Energy Rev., 39, 2014, pp. 139–165. [CrossRef]
- Charoenkit, S. , Yiemwattana, S. Living walls and their contribution to improved thermal comfort and carbon emission reduction: a review Build. Environ., 105, 2016, pp. 82–94. [CrossRef]
- Pęczkowski, G. , Szawernoga, K., Kowalczyk, T., Orzepowski W., Pokładek R. Runoff and Water Quality in the Aspect of Environmental Impact Assessment of Experimental Area of Green Roofs in Lower Silesia, Sustainability, 2020, vol. 12, nr 11, s.1-14, 4793. [CrossRef]
- Hunter, A.M. , Williams, N.S.G., Rayner, J.P., Aye, L., Hes, D., Livesley, S.J. Quantifying the thermal performance of green façades: a critical review Ecol. Eng., 63, 2014, pp. 102–113. [CrossRef]
- Szawernoga, K. , Pęczkowski, G. Experimental tests of thermal properties pertaining to vertical plant systems in the climate of Lower Silesia, Acta Scientiarum Polonorum Formatio Circumiectus, 2018, vol. 17, nr 4, s.223-232. [CrossRef]
- UMS Gmb, H Munich. HYPROP©–Laboratory evaporation method for the determination of pF-curves and unsaturated conductivity, 2011.
- Cuce, E. Thermal regulation impact of green walls: An experimental and numerical investigation. Applied Energy, 2017, 194, 247–254. [Google Scholar] [CrossRef]
- Freewan, A. , Jaradat, N., & Amaireh, I. (2022). Optimizing Shading and Thermal Performances of Vertical Green Wall on Buildings in a Hot Arid Region. Buildings. [CrossRef]
- Susca, T. , Zanghirella, F., Colasuonno, L., & Del Fatto, V. Effect of green wall installation on urban heat island and building energy use: A climate-informed systematic literature review. Renewable and Sustainable Energy Reviews, Vol. 159,1121002022, 2022. [CrossRef]
- Banti, N. , Ciacci, C. , Di Naso, V., & Bazzocchi, F. Green Walls as Retrofitting Measure: Influence on Energy Performance of Existing Industrial Buildings in Central Italy. Buildings, 2023, 13, 369. [Google Scholar] [CrossRef]
- Assimakopoulos, M.-N.; De Masi, R.F.; de Rossi, F.; Papadaki, D.; Ruggiero, S. Green Wall Design Approach Towards Energy Performance and Indoor Comfort Improvement: A Case Study in Athens. Sustainability 2020, 12, 3772. [Google Scholar] [CrossRef]
- Sendra-Arranz, R. , Oquendo, V., Olivieri, L., Olivieri, F., Bedoya, C., Gutiérrez, Á. Monitorization and statistical analysis of south and west green walls in a retrofitted building in Madrid. Building and Environment, 183, 107049. [CrossRef]
- Barriuso, F. , & Urbano, B. Green Roofs and Walls Design Intended to Mitigate Climate Change in Urban Areas across All Continents. Sustainability. 2021, 13, 2245. [Google Scholar] [CrossRef]
- Wong, N. , Tan, C., Kolokotsa, D. i Takebayashi, H. Zieleń jako strategia łagodzenia i adaptacji do miejskiego upału. Nature Reviews Earth & Environment, 2, 166–181, 2121. [CrossRef]
Figure 1.
Experimental models on the campus of the Wroclaw University of Environmental and Life Sciences (a) and at the Research and Educational Station in the Wroclaw-Swojec district (b, c), cross-section of the panel with plants and a multi-probe (d).
Figure 1.
Experimental models on the campus of the Wroclaw University of Environmental and Life Sciences (a) and at the Research and Educational Station in the Wroclaw-Swojec district (b, c), cross-section of the panel with plants and a multi-probe (d).

Figure 2.
Overview of system and data collection.
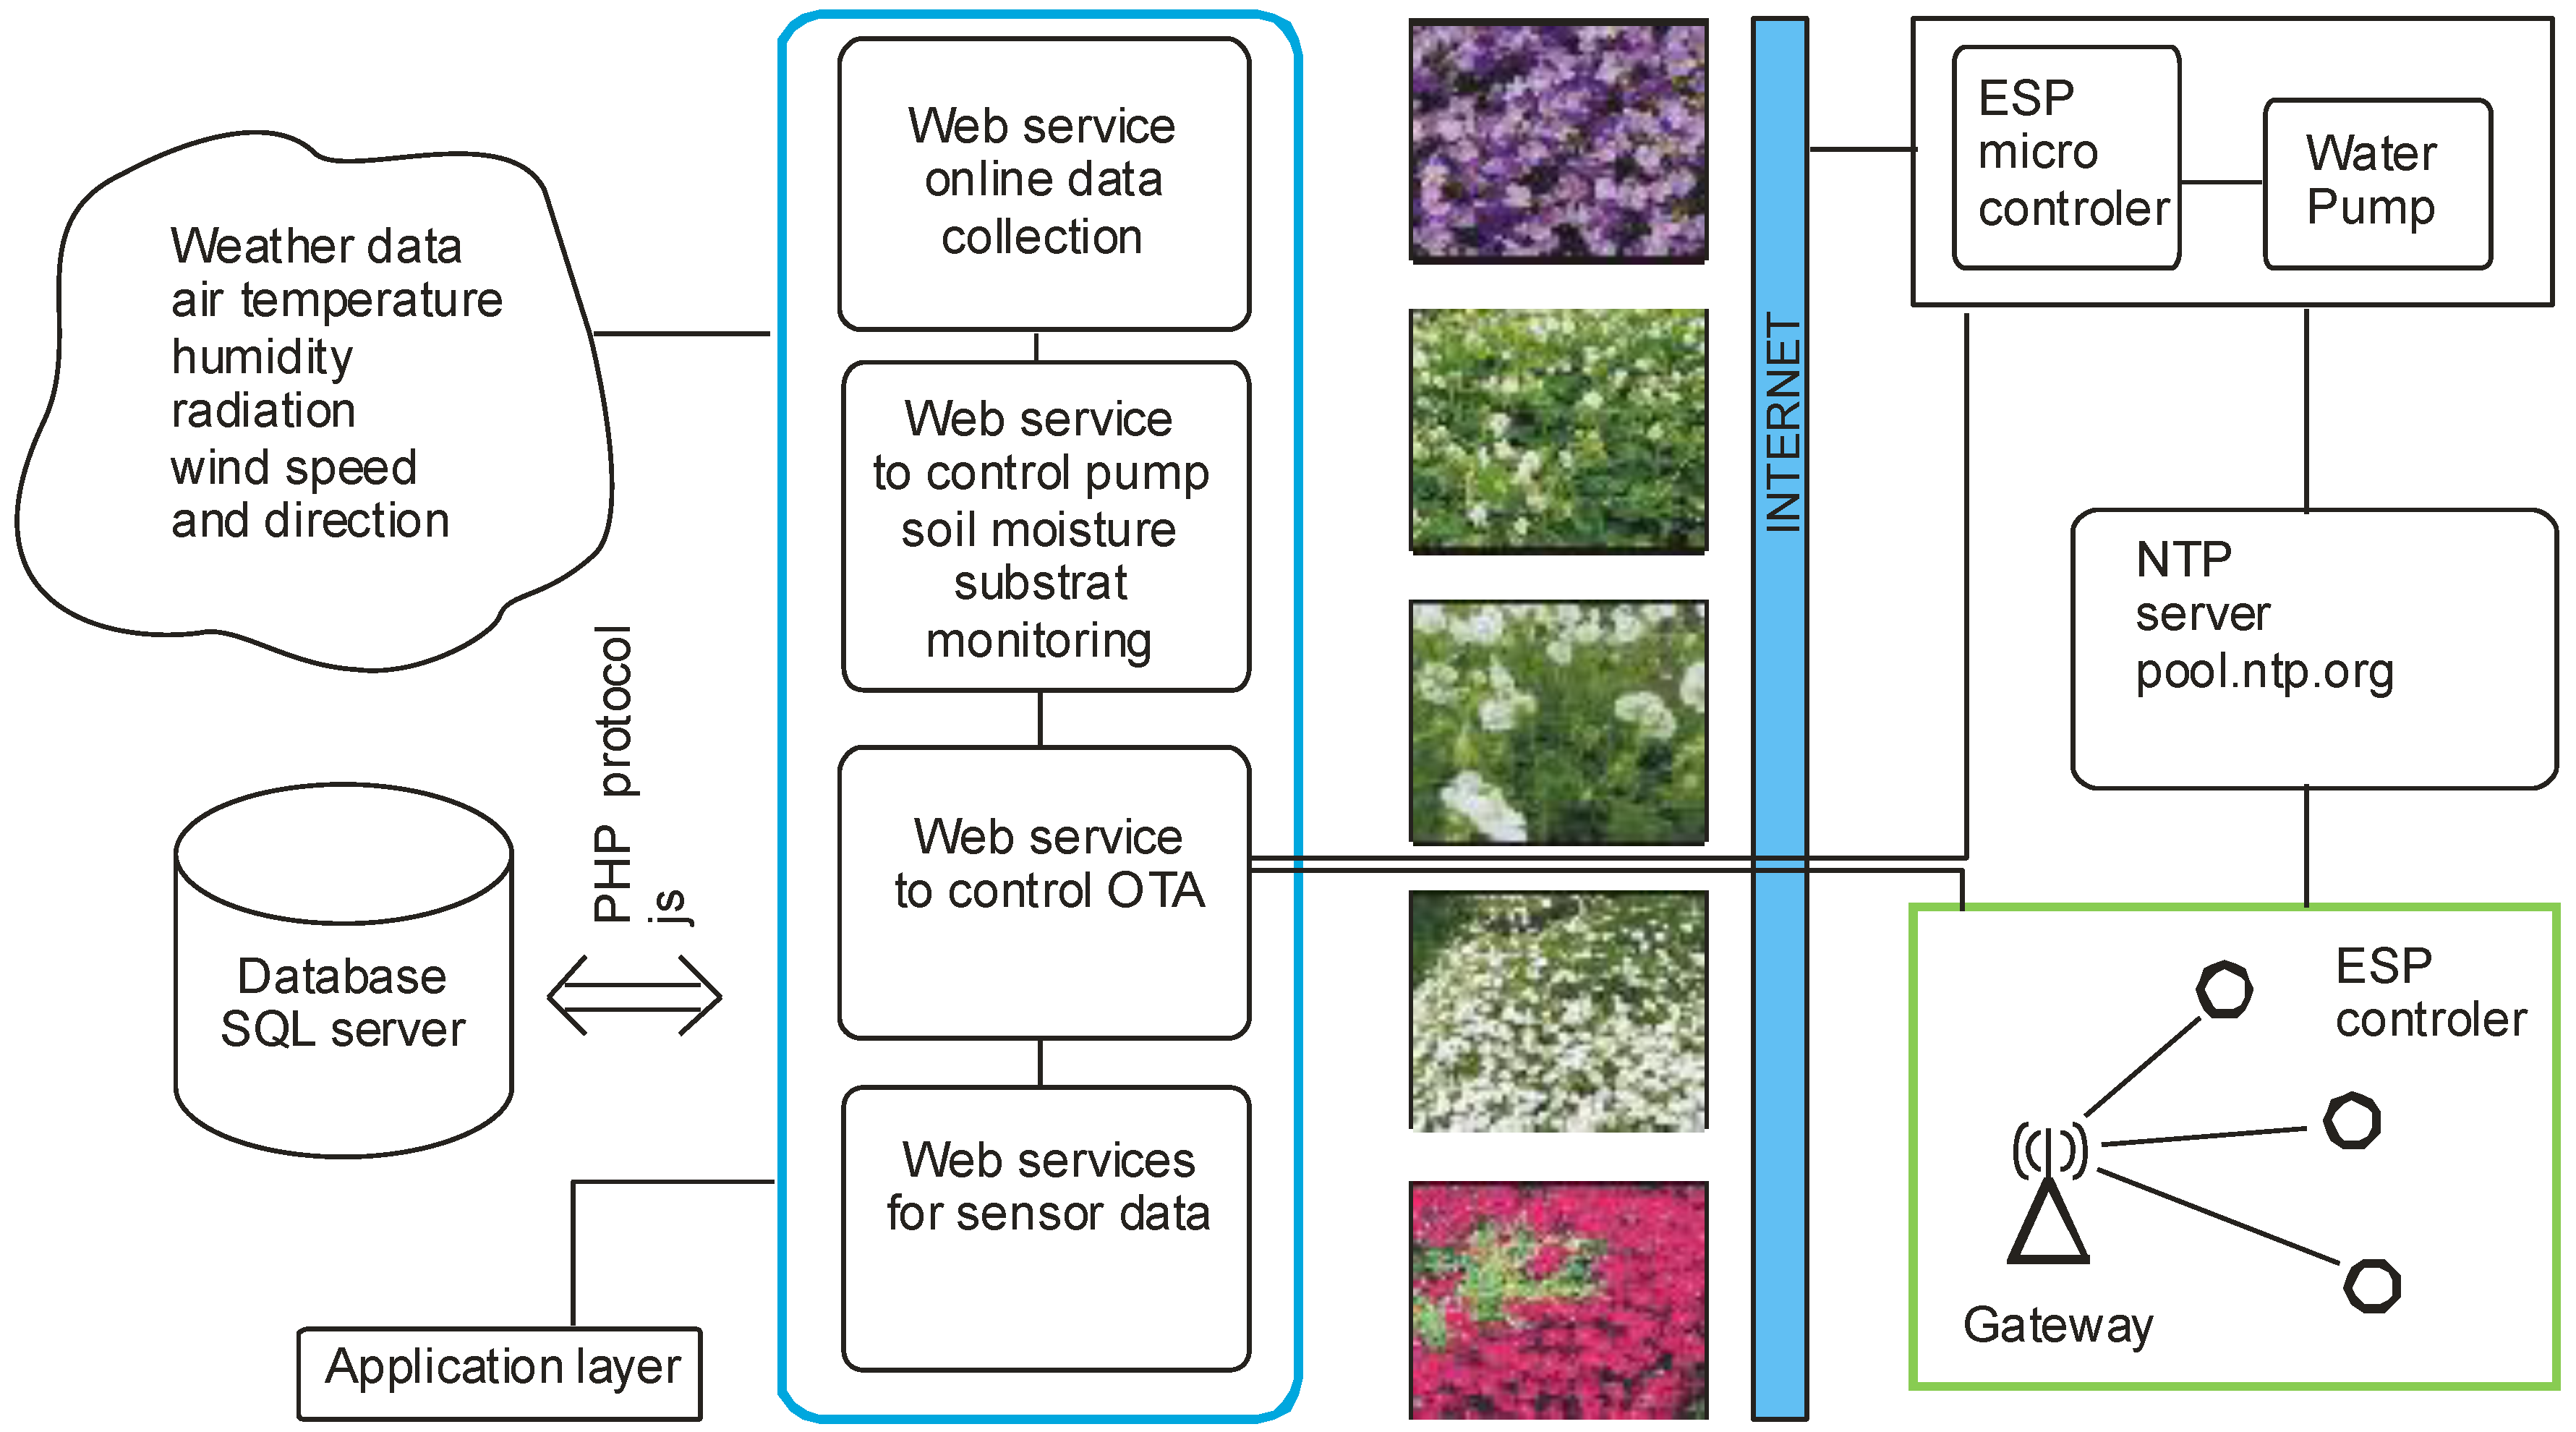
Figure 3.
Air temperature and solar radiation as well as the temperature in the immediate vicinity of plants gr1, at a distance of 5 cm from plants gr2 and in the air gap behind the panels on the eastern and western facades on a warm, sunny day on July 5, 2023.
Figure 3.
Air temperature and solar radiation as well as the temperature in the immediate vicinity of plants gr1, at a distance of 5 cm from plants gr2 and in the air gap behind the panels on the eastern and western facades on a warm, sunny day on July 5, 2023.
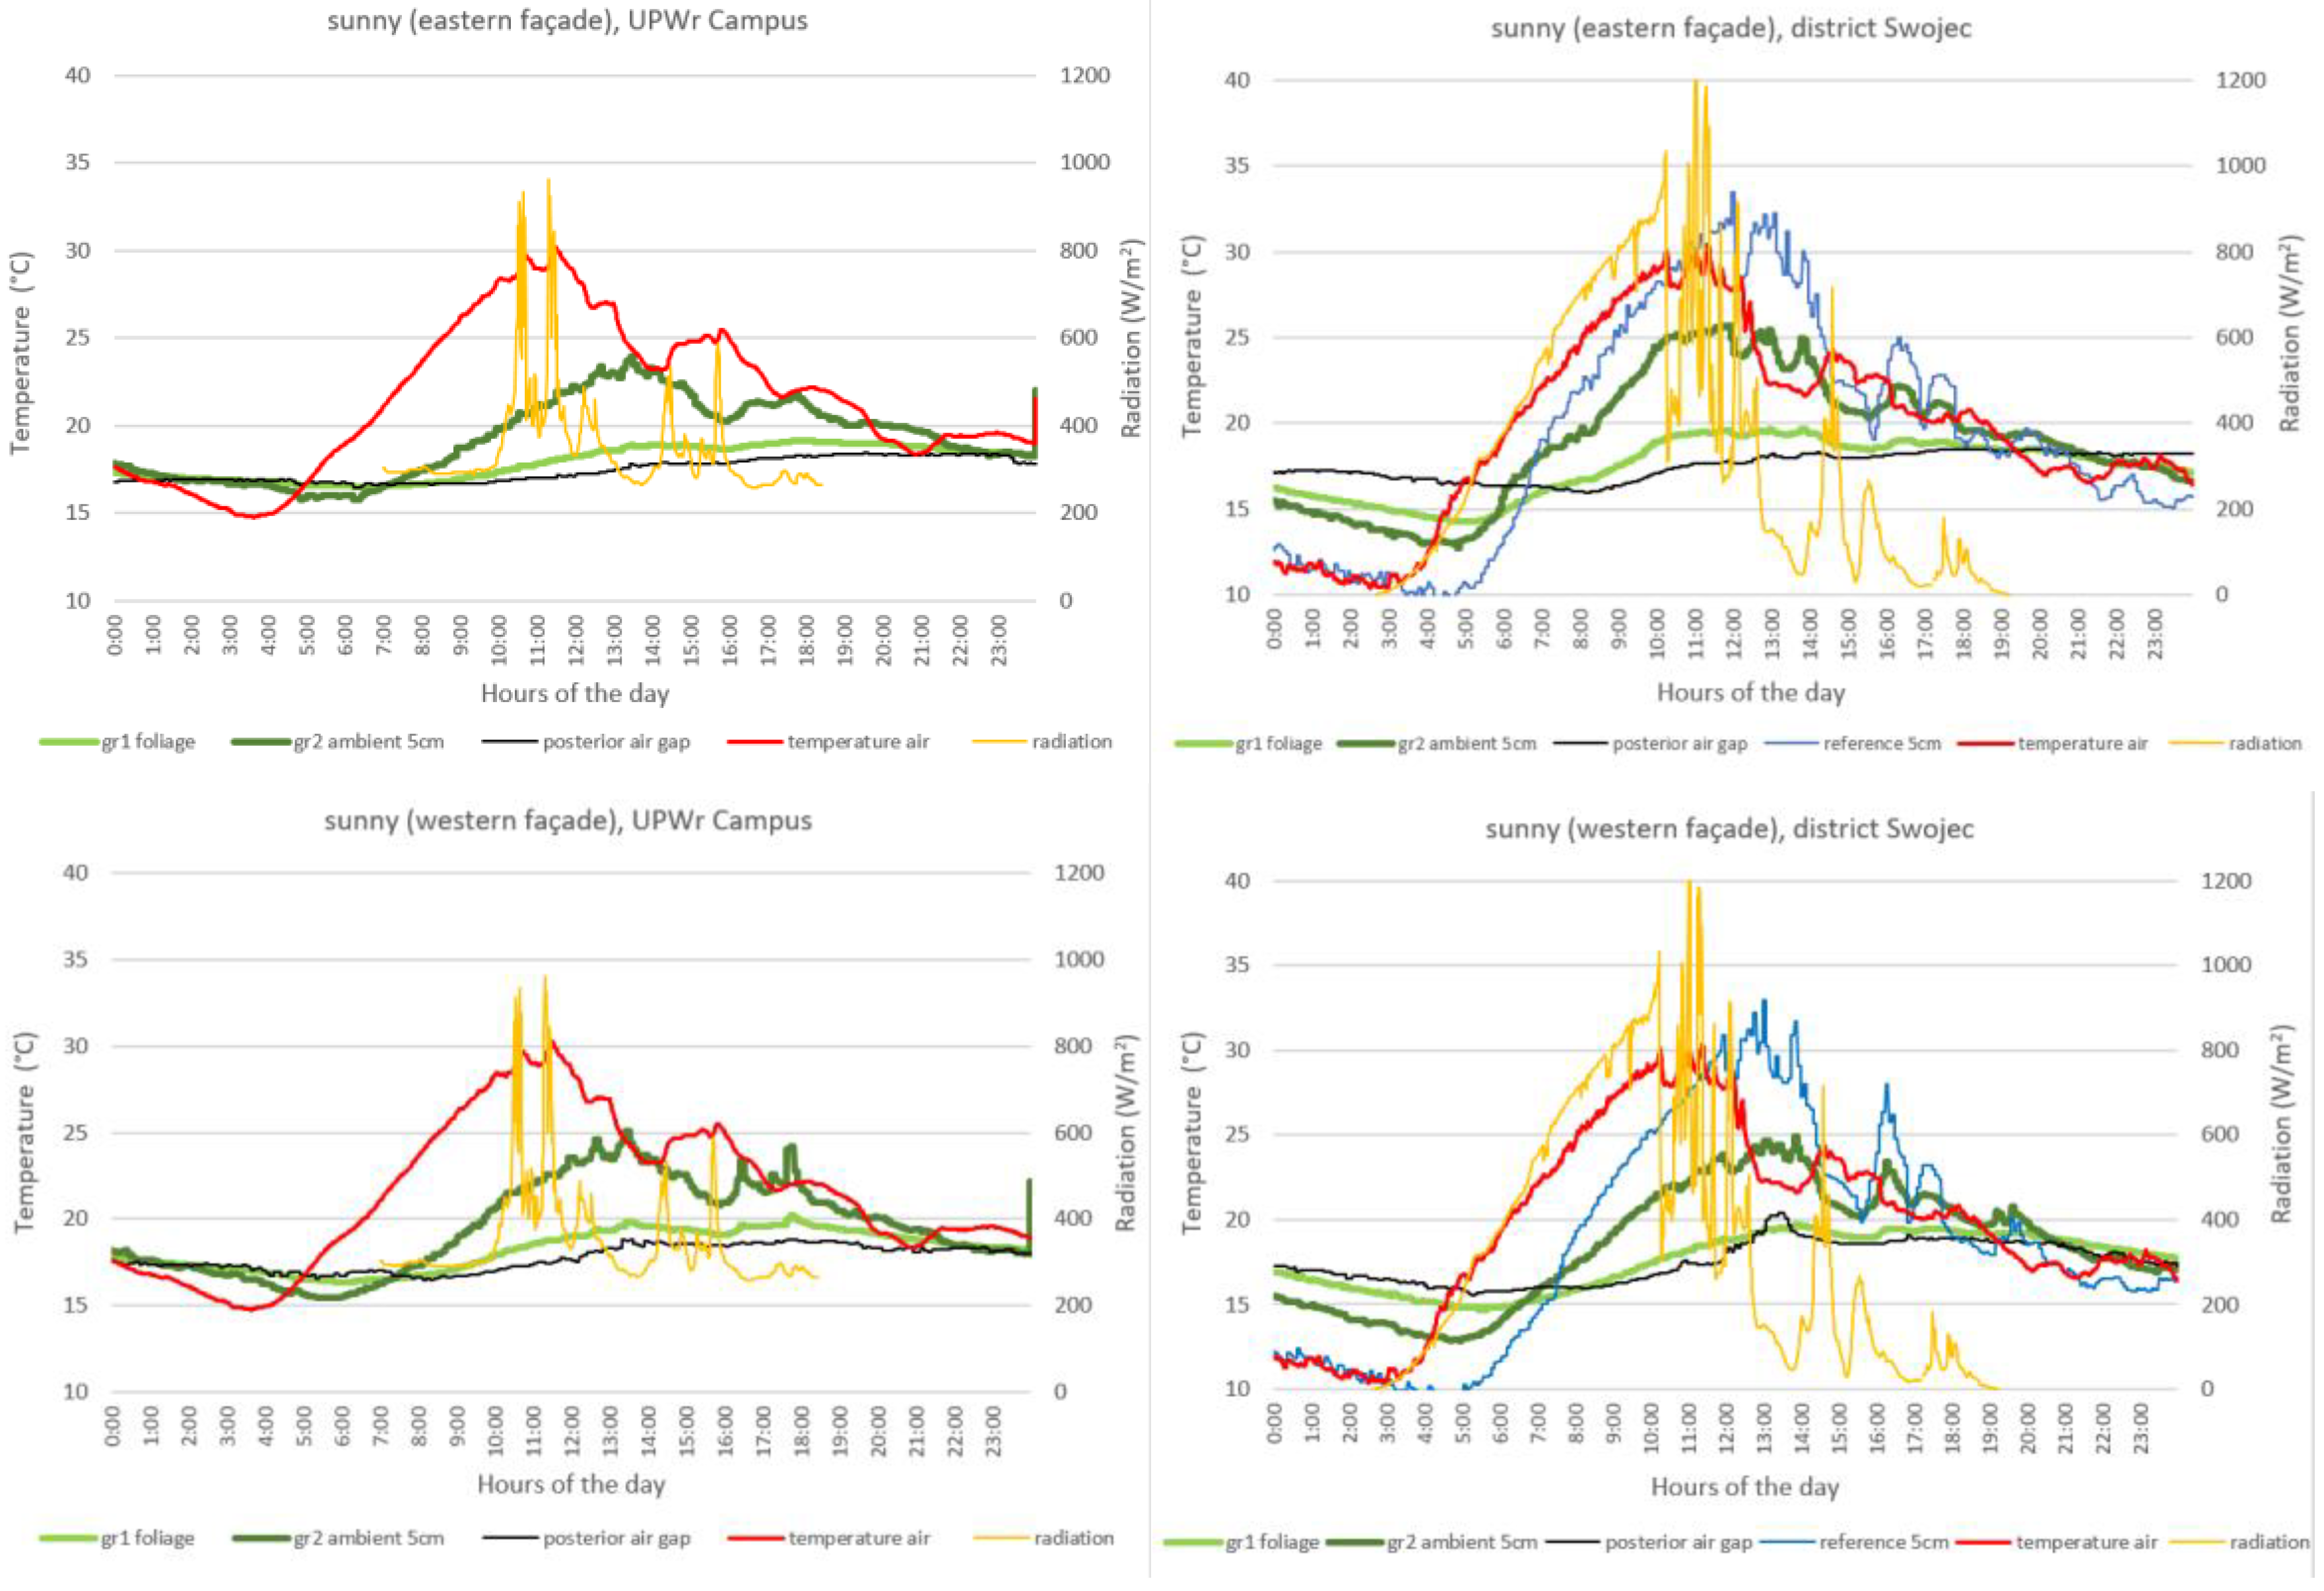
Figure 5.
Maximum average cooling value for the entire test period t [°C] of the green surfaces gr1, gr2 and in the air gap behind the panel in relation to air temperature on dry sunny days on the eastern and western facades for the location of the UPWr campus and the Swojec district.
Figure 5.
Maximum average cooling value for the entire test period t [°C] of the green surfaces gr1, gr2 and in the air gap behind the panel in relation to air temperature on dry sunny days on the eastern and western facades for the location of the UPWr campus and the Swojec district.
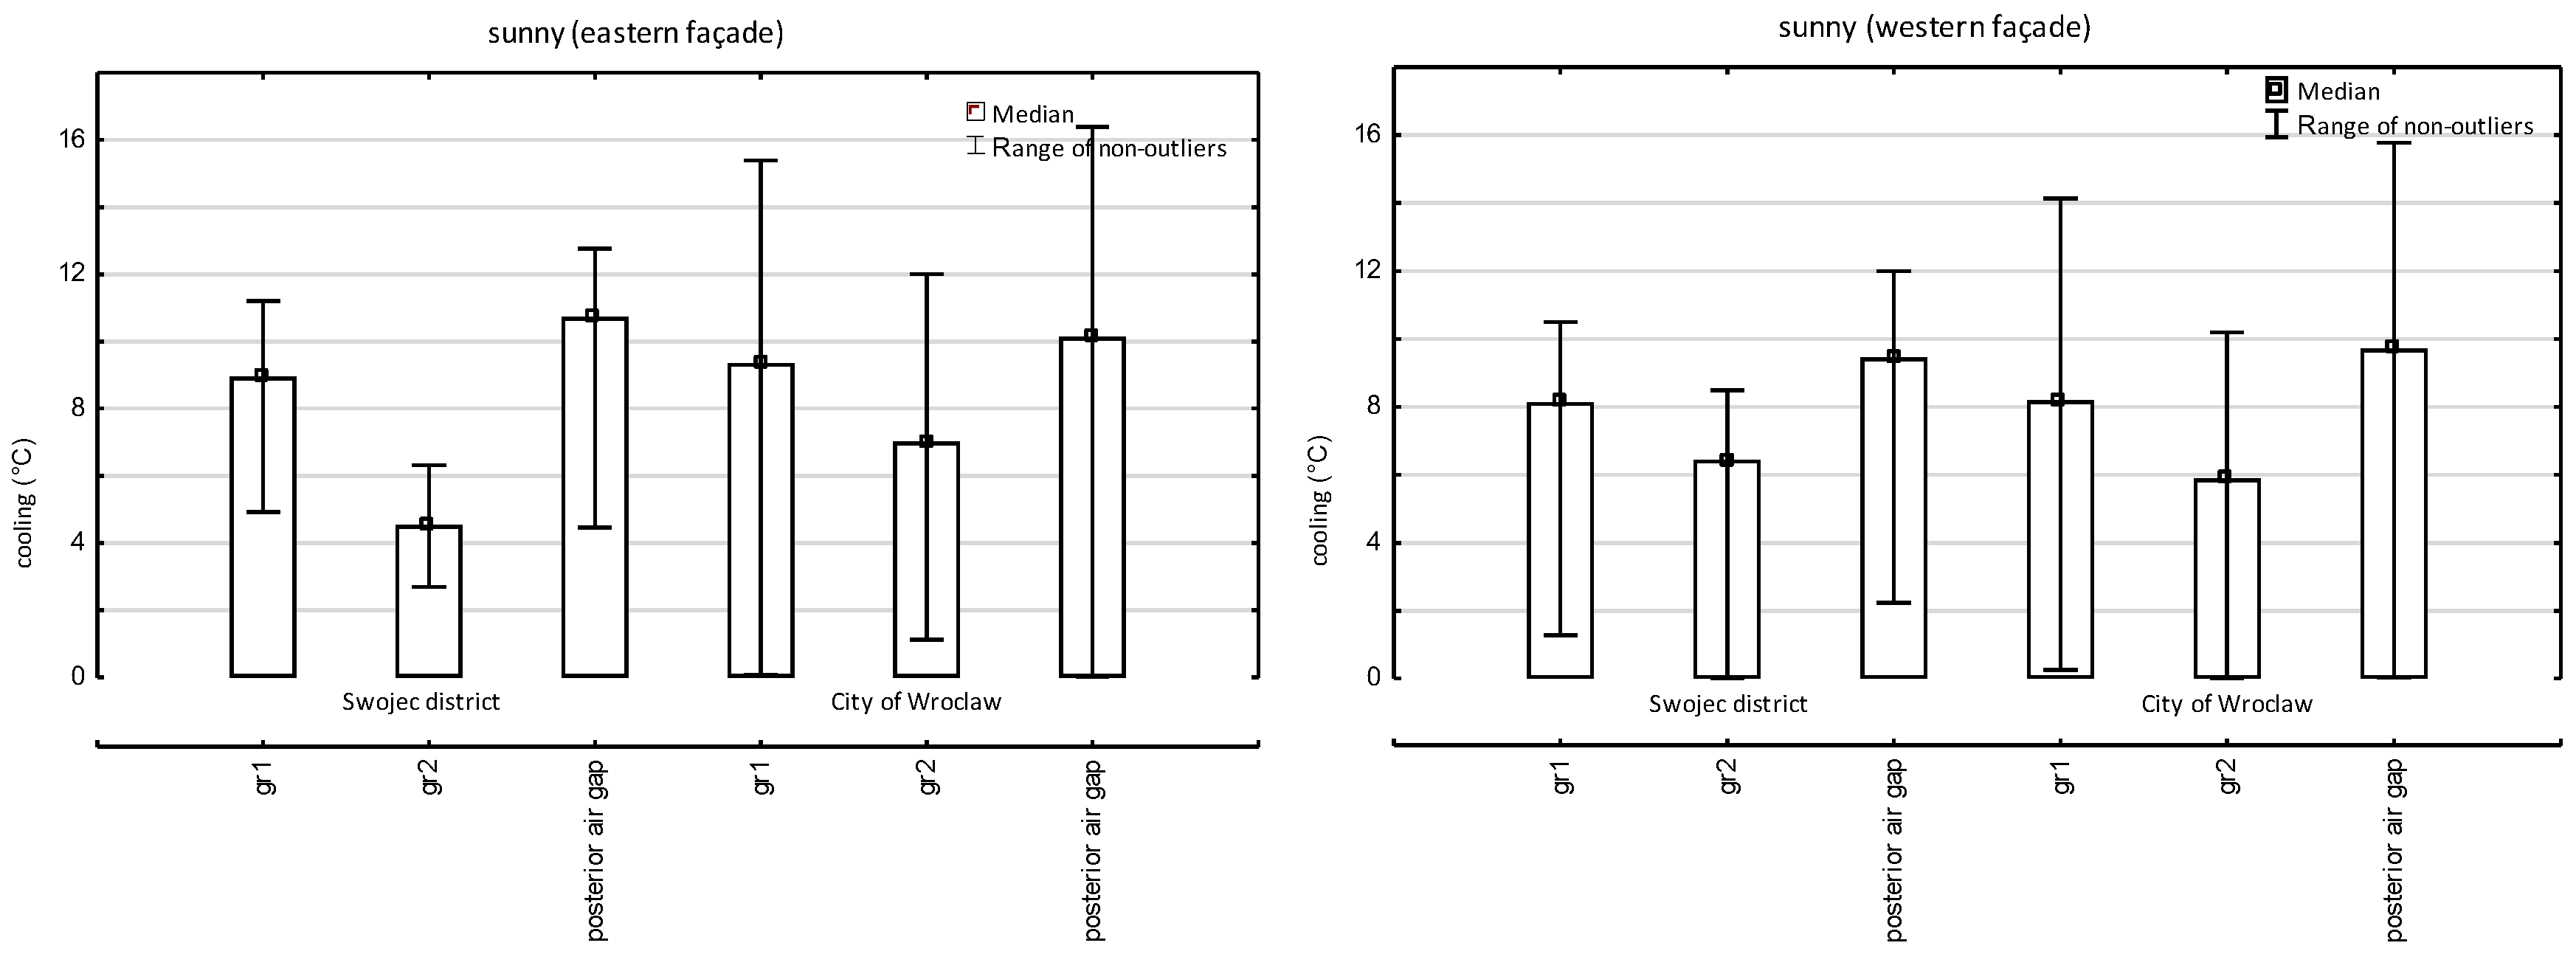
Figure 6.
Maximum average cooling value for the entire test period t [°C] of the green surfaces gr1, gr2 and in the air gap behind the panel in relation to air temperature on cloudy days in the eastern and western facades for the location of the UPWr campus and the Swojec district.
Figure 6.
Maximum average cooling value for the entire test period t [°C] of the green surfaces gr1, gr2 and in the air gap behind the panel in relation to air temperature on cloudy days in the eastern and western facades for the location of the UPWr campus and the Swojec district.
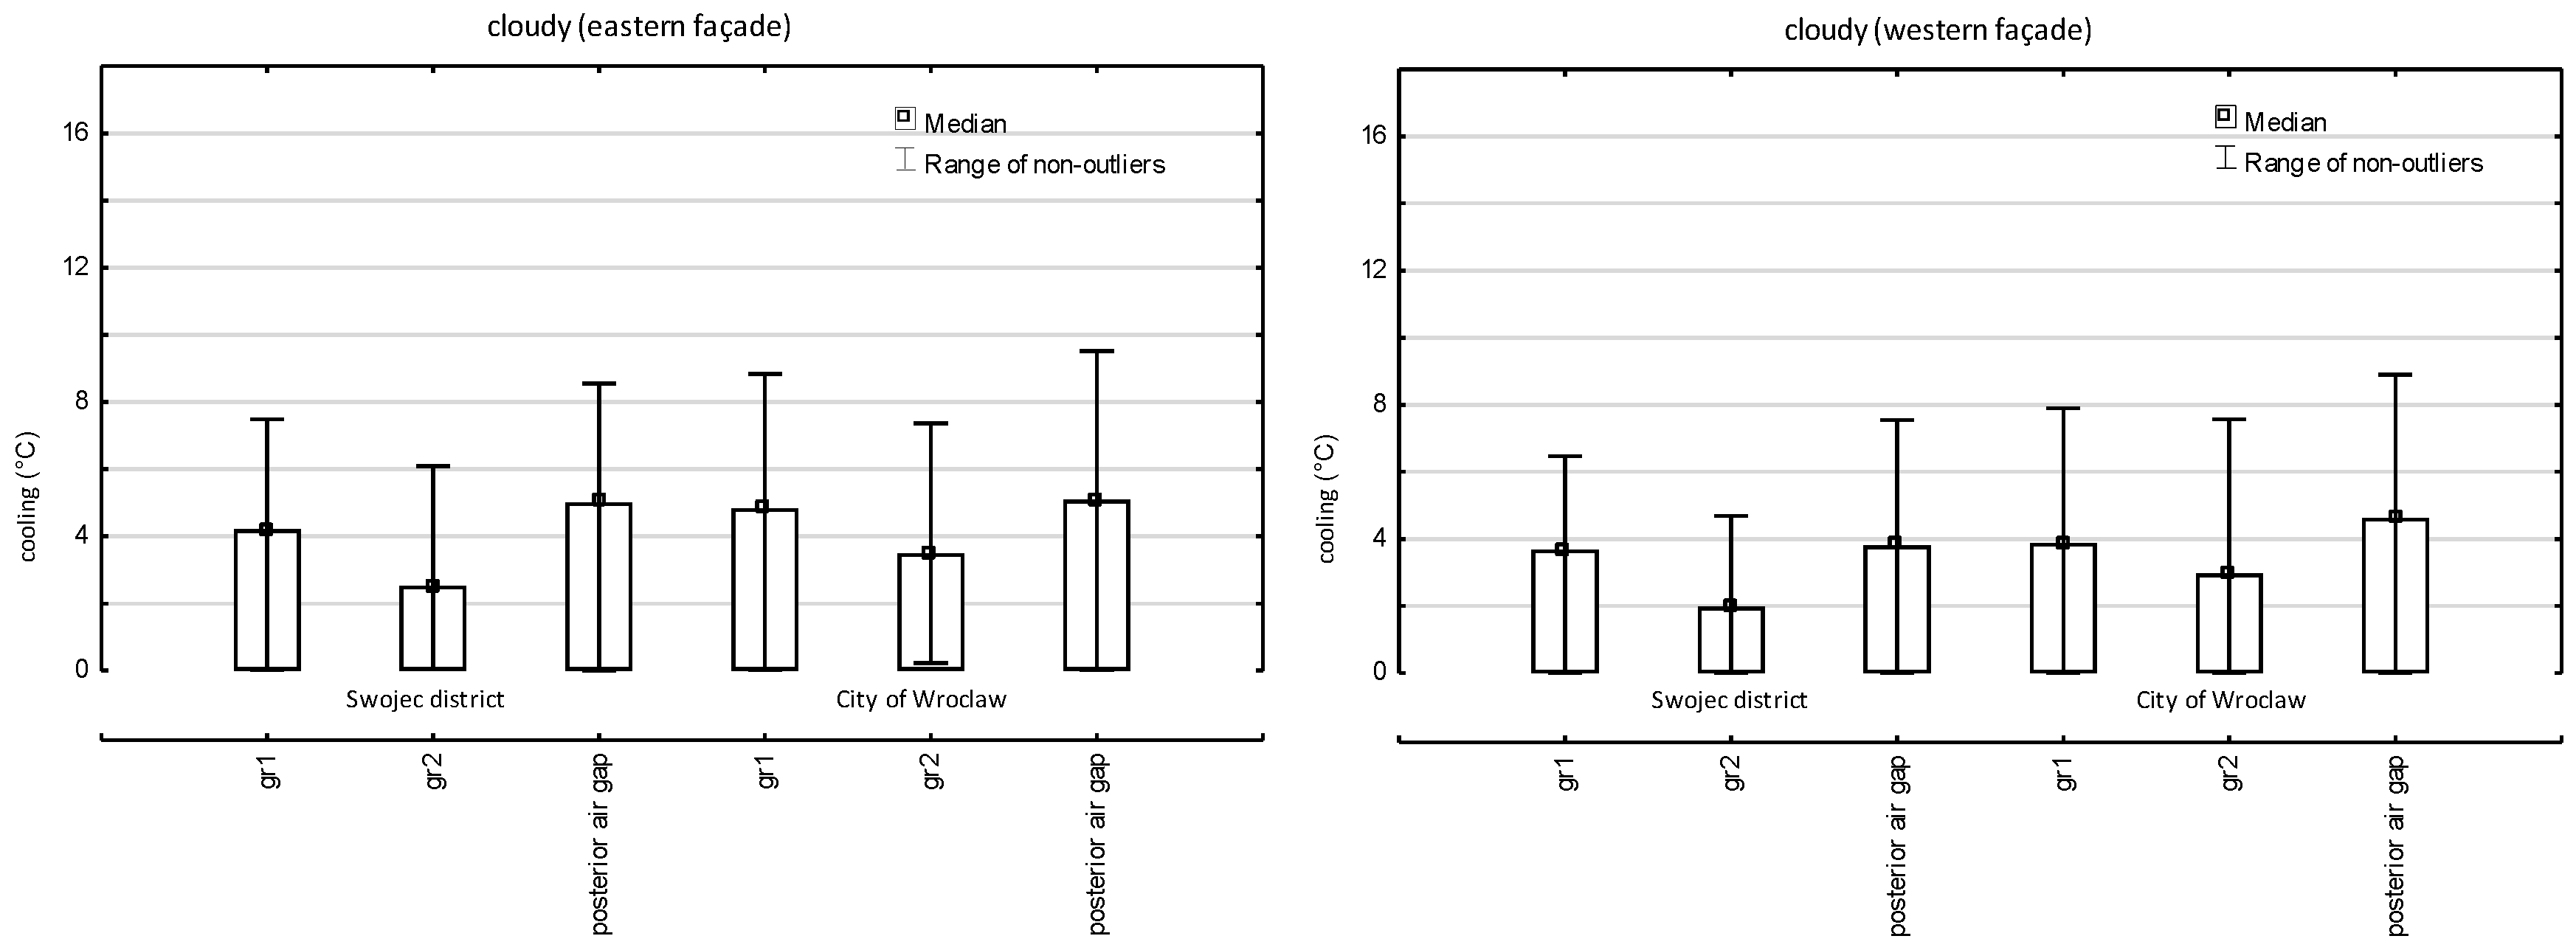

Table 1.
Geometrical characteristics and physical properties of experimental models.
| Location | Structure dimensions [m] | Layer Material (in order from the outside in) | Layer thickness [m] |
Total thickness [m] |
Thermal conductivity [W·m-1·K-1] |
Density [kg m-1] |
Specific heat Cp [J kg-1 K-1] |
|---|---|---|---|---|---|---|---|
| Campus Center, Wrocław University of Environmental and Life Sciences Swojec District |
1.3x1.3 x2.05 |
PVC panel Composite oriented strand board (OSB) EPS polystyrene Composite (OSB) |
0.01 0.025 0.1 0.025 |
0.16 | 0.17 0.14 0.23 |
1.35 600 13.5 |
900 1700 1800 |
Table 2.
Vertical greenery systems of the campus of the Wroclaw University of Environmental and Life Sciences and the Swojec district.
Table 2.
Vertical greenery systems of the campus of the Wroclaw University of Environmental and Life Sciences and the Swojec district.
| Experimental wall | Leaf Area Index (LAI) | Medium thickness [m] | Total [m] | ||
|---|---|---|---|---|---|
| Wall | Gap | Plants | |||
| Campus Center, Swojec District: Geranium makrorrhizum, Heuchera alumroot, Heuchera americana, Heuchera Palace Purple, Heuchera sanguinea, Carex flacca, Carex Montana |
2.5-4.0 2.5-3.5 |
0.16 | 0.04 | 0.25 0.20 |
0.45 0.40 |
Table 3.
Averages of the median temperature reduction period in the plant environment in the experimental models of the UPWr campus and the Swojec district during the day on sunny and cloudy days as a function of solar radiation intensity. Analysis using the nonparametric Kruskal-Wallis test.
Table 3.
Averages of the median temperature reduction period in the plant environment in the experimental models of the UPWr campus and the Swojec district during the day on sunny and cloudy days as a function of solar radiation intensity. Analysis using the nonparametric Kruskal-Wallis test.
| Median temperature reduction sunny day foliage 5cm | Solar radiation intensity on a horizontal surface (Wm-2) | |||
| 0 - 400 | 400 - 600 | 600 – 800 | >800 | |
| Campus UPWr | ||||
| Eastern exposure | 3.91 | 6.46 | 7.66a | 7.91 |
| Western exposure | 3.38 | 5.42 | 6.94a | 7.22 |
| Swojec district | ||||
| Eastern exposure | 2.54 | 3.96 | 4.65 | 4.44 |
| Western exposure | 0.97cd | 4.11 | 4.38a | 4.91a |
| Median temperature reduction cloudy day foliage 5cm | Solar radiation intensity on a horizontal surface (Wm-2) | |||
| 0 - 400 | 400 - 600 | 600 – 800 | >800 | |
| Campus UPWr | ||||
| Eastern exposure | 3.40 | 5.07 | 5.96 | 5.57 |
| Western exposure | 2.83c | 4.14 | 5.56a | 5.26 |
| Swojec district | ||||
| Eastern exposure | 2.92 | 4.18 | 4.42 | 5.26 |
| Western exposure | 2.10 | 3.45 | 3.72 | 5.05 |
abcd median temperature values marked with a different letter differ statistically at the P<0.05 level,. Kruskal-Wallis test, a,b,c,d – groups, solar radiation intensity.
Table 4.
Averages of the median period of temperature reduction in the plant environment in the experimental models of the UPWr campus and the Swojec district during the day on sunny and cloudy days as a function of relative humidity. Analysis using the nonparametric Kruskal-Wallis test. .
Table 4.
Averages of the median period of temperature reduction in the plant environment in the experimental models of the UPWr campus and the Swojec district during the day on sunny and cloudy days as a function of relative humidity. Analysis using the nonparametric Kruskal-Wallis test. .
| Median temperature reduction sunny day foliage 5cm | Relative air humidity RH (%) | |||||
| < 40 | 40 - 50 | 51 – 60 | 61 - 70 | 71 – 80 | >80 | |
| Campus UPWr | ||||||
| Eastern exposure | 6.9e | 7.81ef | 5.35 | 3.88 | 2.24ab | 0.38b |
| Western exposure | 6.3 | 6.9e | 5.0 | 5.04 | 2.17b | 0.02 |
| Swojec district | ||||||
| Eastern exposure | 4.25f | 4.38f | 3.97 | 3.37 | 1,64 | -1.5ab |
| Western exposure | 3.64 | 3.93 | 4.36 | 3.31 | 1.78 | -2.0 |
| Median temperature reduction cloudy day foliage 5cm | Relative air humidity RH (%) | |||||
| < 40 | 40 - 50 | 51 – 60 | 61 - 70 | 71 – 80 | >80 | |
| Campus UPWr | ||||||
| Eastern exposure | - | 6.33f | 4.91 | 4.37 | 3.56 | 1.45a |
| Western exposure | - | 5.83 | 4.03 | 4.24 | 3.39 | 1.19 |
| Swojec district | ||||||
| Eastern exposure | 6.0 | 4.58 | 3.90 | 2.51 | 3.52 | 1.60 |
| Western exposure | 4.16 | 1.94 | 2.42 | 3.02 | 3.92 | 1.57 |
abcdef median temperature value marked with a different letter differ statistically at the P<0.05 level, Kruskal-Wallis test, a,b,c,d,e,f– groups, relative air humidity.
Table 5.
Period-averaged median temperature reductions in the plant environment in the experimental models of the UPWr campus and the Swojec district during the day on sunny and cloudy days as a function of wind speed. Analysis using the nonparametric Kruskal-Wallis test.
Table 5.
Period-averaged median temperature reductions in the plant environment in the experimental models of the UPWr campus and the Swojec district during the day on sunny and cloudy days as a function of wind speed. Analysis using the nonparametric Kruskal-Wallis test.
| Median temperature reduction sunny day foliage 5cm | Wind speed v (ms-1) | ||||
| < 0.5 | 0.5 – 1.0 | 1.1 – 2.0 | 2.1 – 3.0 | >3 | |
| Campus UPWr | |||||
| Eastern exposure | 4.6 | 4.72 | 5.46 | 6.21 | 6.71 |
| Western exposure | 4.14 | 4.14 | 4.78 | 5.62 | 5.76 |
| Swojec district | |||||
| Eastern exposure | 2.66 | 3.63 | 3.79 | 3.46 | 4.35 |
| Western exposure | 4.60 | 3.19 | 3.46 | 2.78 | 3.82 |
| Median temperature reduction cloudy day foliage 5cm | Wind speed v (ms-1) | ||||
| < 0.5 | 0.5 – 1.0 | 1.1 – 2.0 | 2.1 – 3.0 | >3 | |
| Campus UPWr | |||||
| Eastern exposure | 3.33 | 3.99 | 4.42 | 4.58 | 5.11 |
| Western exposure | 3.98 | 4.36 | 3.93 | 4.0 | 4.77 |
| Swojec district | |||||
| Eastern exposure | 0.59 | 2.79 | 2.42 | 3.01 | 4.02 |
| Western exposure | 2.22 | 2.67 | 1.59 | 1.97 | 1.41 |
a,b,c,d,e– groups, wind speed.
Disclaimer/Publisher’s Note: The statements, opinions and data contained in all publications are solely those of the individual author(s) and contributor(s) and not of MDPI and/or the editor(s). MDPI and/or the editor(s) disclaim responsibility for any injury to people or property resulting from any ideas, methods, instructions or products referred to in the content. |
© 2025 by the authors. Licensee MDPI, Basel, Switzerland. This article is an open access article distributed under the terms and conditions of the Creative Commons Attribution (CC BY) license (http://creativecommons.org/licenses/by/4.0/).
Copyright: This open access article is published under a Creative Commons CC BY 4.0 license, which permit the free download, distribution, and reuse, provided that the author and preprint are cited in any reuse.


