1. Introduction
Plant diseases pose a major threat to agricultural productivity, resulting in significant crop losses and economic difficulties for farmers [
1]. Effective disease management requires continuous monitoring and rapid, accurate diagnostics throughout the entire crop lifecycle, from planting to harvest [
2,
3]. Traditional diagnostic methods often depend on manual inspection, which can be time-consuming, subject to human error, and inappropriate for wide-ranging agricultural operations. In response to these challenges, the role of Computer-Aided Diagnostics (CAD) systems has become increasingly critical. The shift towards end-to-end, field-deployable applications represents a new paradigm in agricultural technology [
4,
5,
6]. These systems offer a proactive approach to crop monitoring, enabling real-time detection and early intervention to prevent the spread of diseases. This technological integration is essential for enhancing sustainability, increasing crop productivity, and minimizing agricultural losses [
7,
8,
9]. Olive products, including olive oil and table olives, are staples of the local diet and have been used for food and traditional medicine since ancient times. Given the importance of this crop, safeguarding olive groves from disease is a national priority [
10,
11]. The olive sector faces challenges from various leaves diseases such as "Aculus olearius" and "Peacock spot (olive scab)", which affects the olive productivity [
12,
13]. This paper, therefore, presents a solution to this problem by developing OLIVE-CAD, a novel, on-site, and end-to-end CAD system. The system's ability to provide immediate diagnostic results and log data to a database for long-term health monitoring offers a practical, field-deployable tool that addresses a critical need in modern agriculture. Reviewing the existing literature summarized in
Table 1 reveals a prevailing focus among researchers on developing sophisticated deep learning models for olive leaf disease identification. While these efforts have yielded impressive diagnostic accuracies, there is a notable lack of research that focuses on the implementation of a complete, end-to-end CAD system, especially one that incorporates robust data storage and review capabilities. The most significant research gap lies in the absence of a comprehensive, integrated system for agricultural disease management.
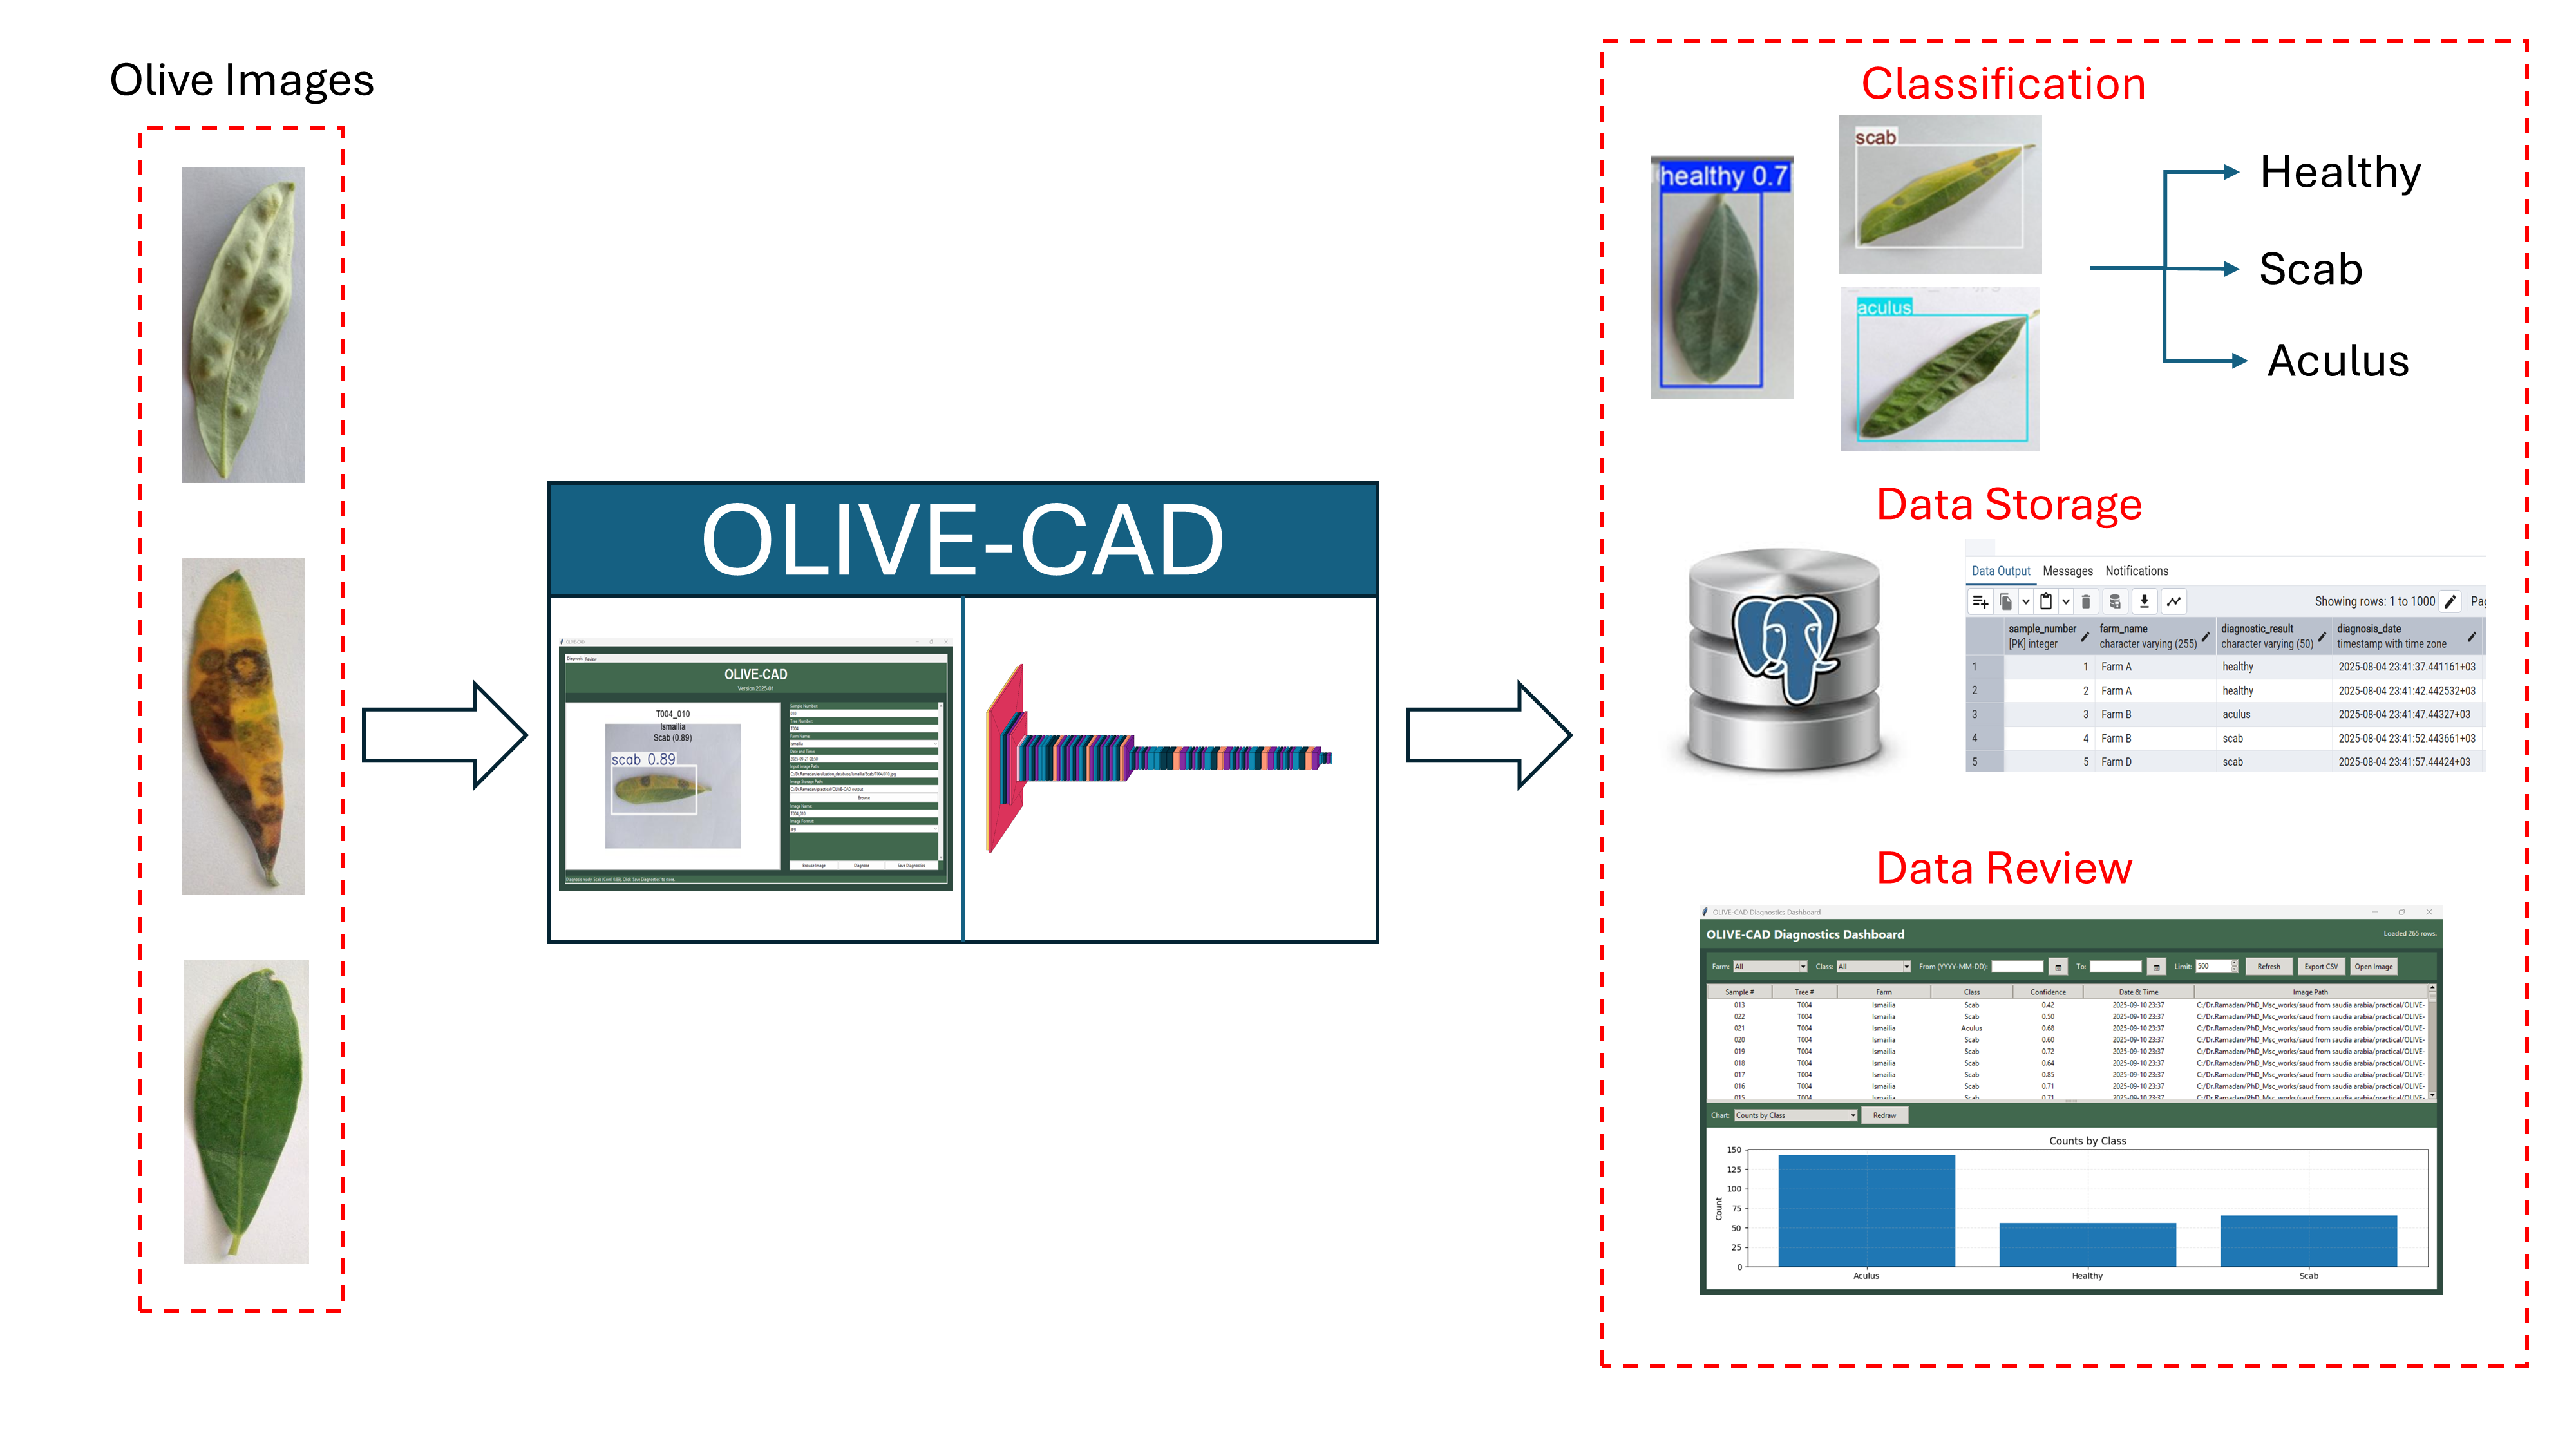
This research presents a comprehensive, end-to-end solution for olive leaf disease management, addressing significant gaps in current methodologies by integrating advanced deep learning with a practical end user application. The major contributions of this paper are as follows: (1) Setup an olive leaf disease dataset, comprising 11,315 images. This dataset was compiled from three distinct data sources, includes three primary classes: "Healthy," "Scab," and "Aculus.". (2) A specialized YOLOv12 model was developed for efficient and accurate olive leaf disease detection. This model was trained on our collected dataset, achieving mean average precision of 98.2% and mean average recall of 95.4%. (3) Development of a fully integrated CAD system, this user-friendly application integrates the trained YOLOv12 model to provide real-time diagnostic results. (4) OLIVE-CAD was practically tested through real-world simulation, we proposed and implemented an "olive farms model," where the test dataset was logically divided among four distinct olive farms. By assigning a unique identifier to each sample, we demonstrated the application's capability to function as a diagnostic and management system for a geographically distributed network of farms.
2. Materials and Methods
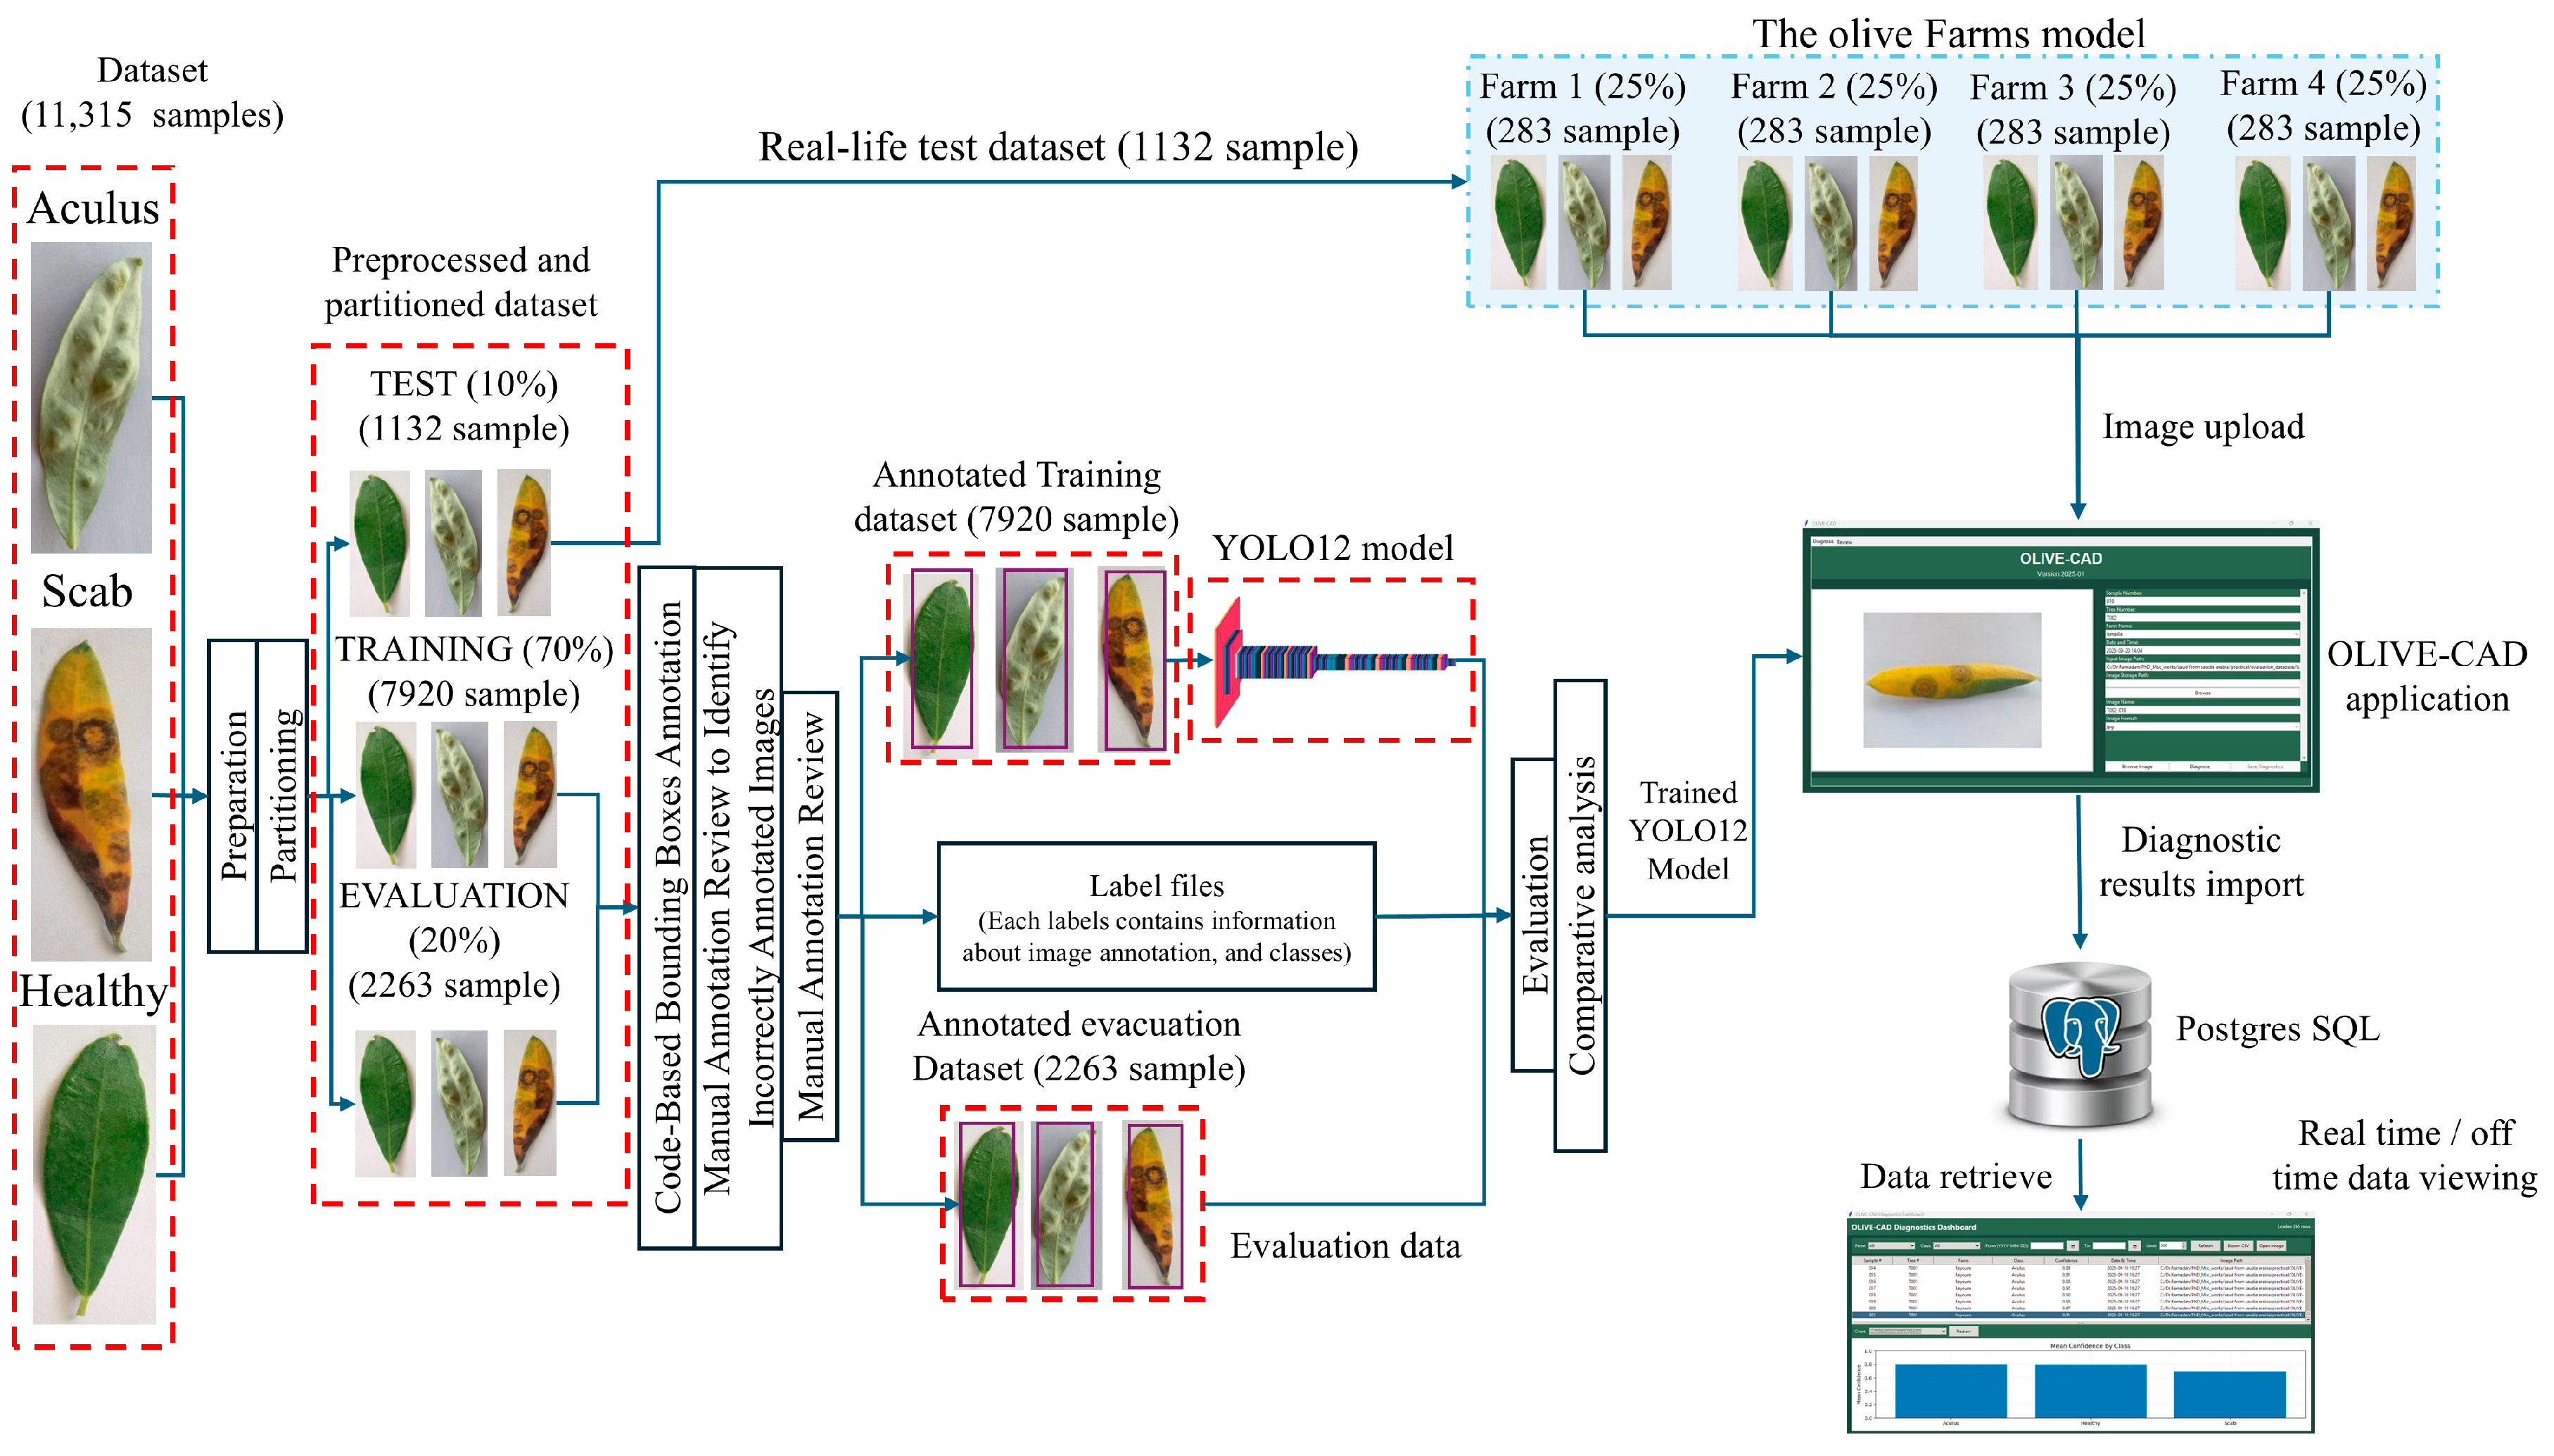
The proposed methodology, comprehensively outlined in
Figure 1, details the approach to develop, train, and deploy the OLIVE-CAD system for the real-time recognition of olive leaf diseases. The process begins with the preparation and annotation of a large-scale image dataset, followed by the design and evaluation of a custom YOLOv12 model. Finally, the integration of the trained model with end-to-end diagnostic application for real-world application and subsequent validation in an agricultural setting.
2.1. Dataset Description and Preparation
The dataset presented in
Table 2 was collected from three sources [
27,
28,
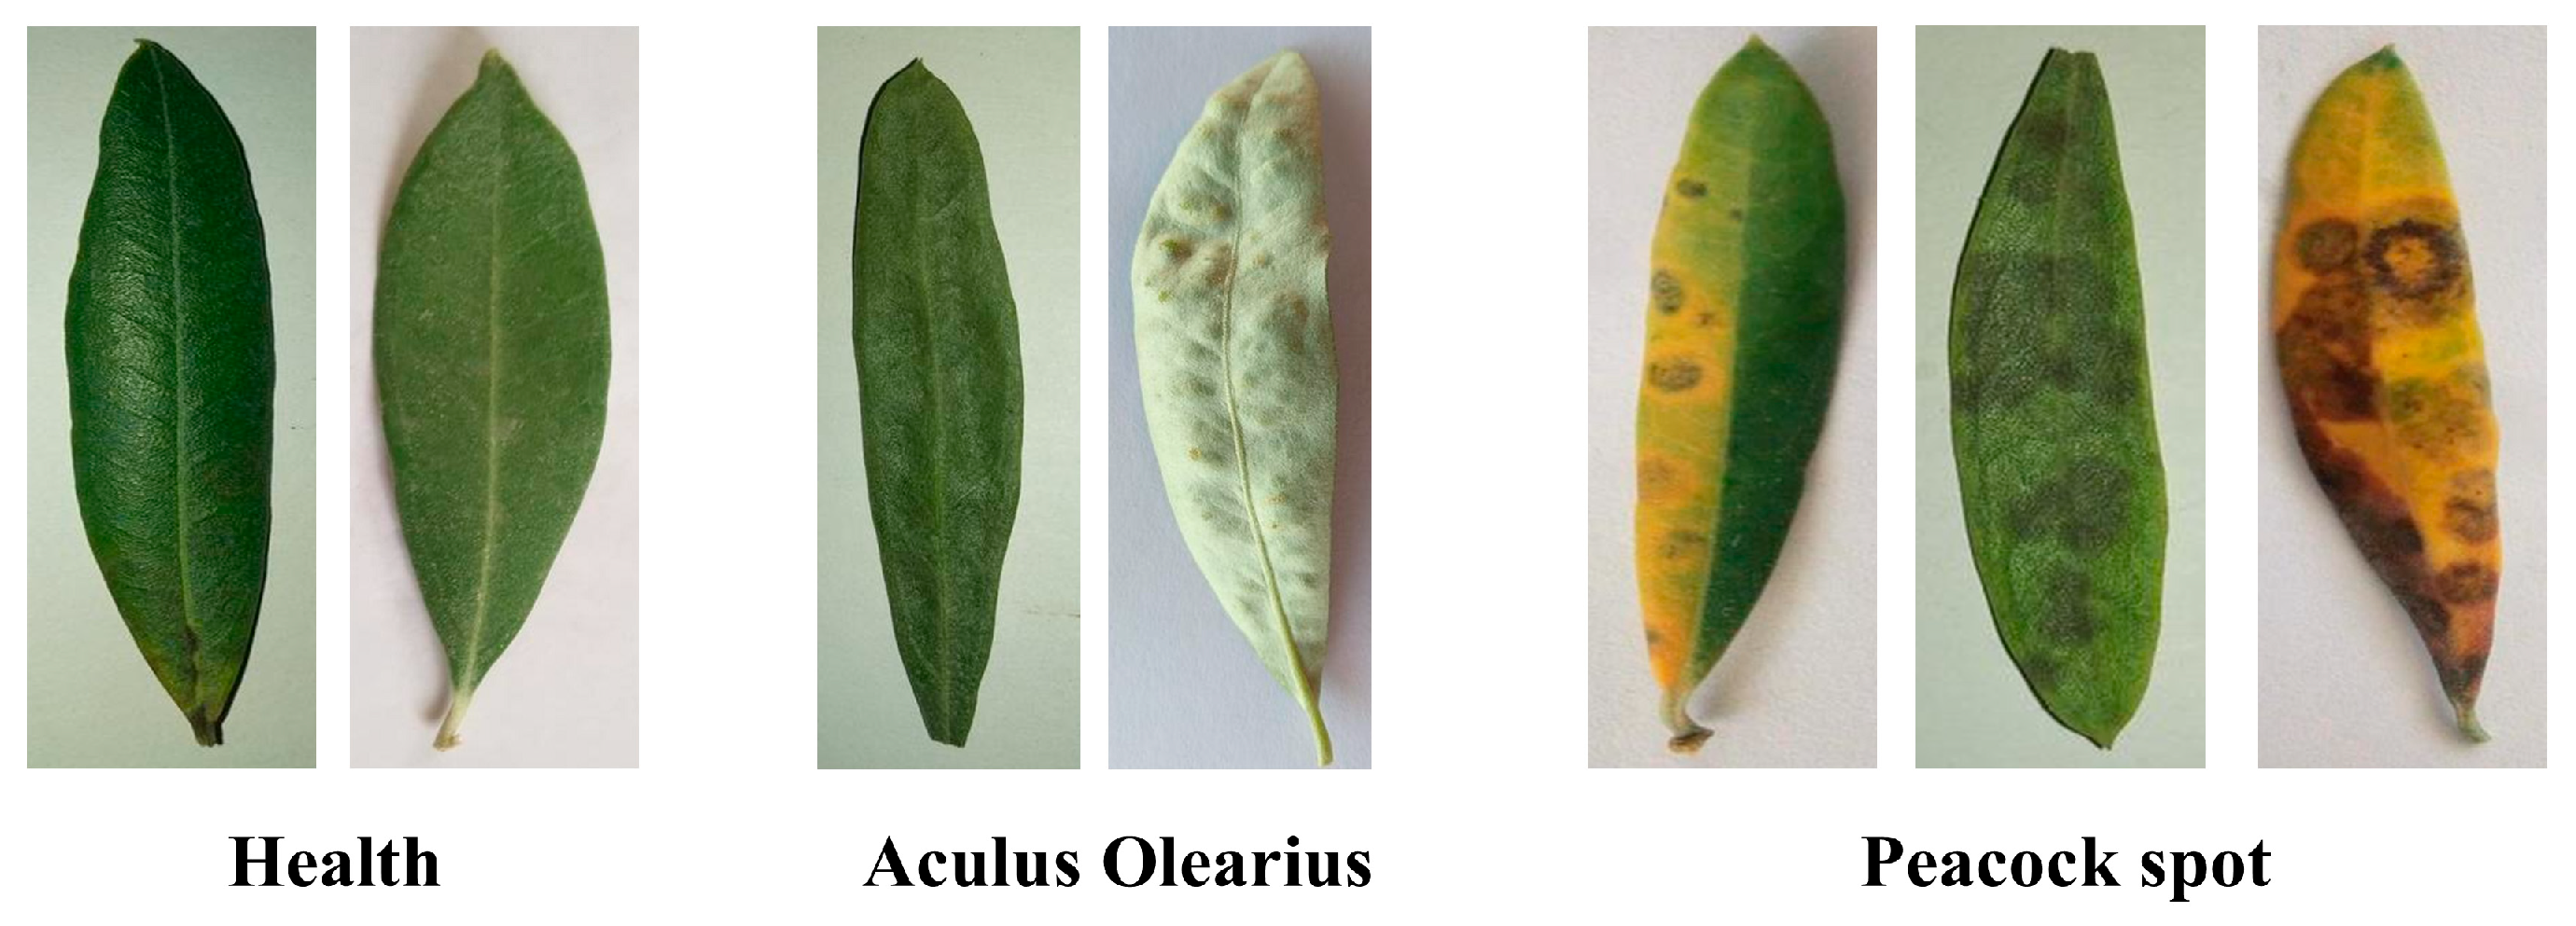
29]. The dataset is structured into three primary classes: "Healthy" olive leaf samples, and two significant olive leaf diseases, "Aculus olearius" and "Peacock spot (olive scab)". Aculus olearius, commonly known as the olive bud mite, causes deformations and discoloration of olive leaves, often leading to reduced yield [
30]. Peacock spot, or olive scab, caused by the fungus Spilocaea oleaginea, is characterized by circular, dark spots with a light halo on the leaves, severely impacting photosynthesis and overall tree health [
31]. Visual examples of these disease symptoms are presented in
Figure 2. As shown in
Table 3 a "real-life Test dataset" comprising 10% (1132 samples) of the total dataset is specifically set aside for the final assessment of the trained model's real-world performance. The remaining 90% of the dataset is then further partitioned for the YOLOv12 model development. This portion is split into a "Training" subset of 70% (7920 samples) and "Evaluation" subset of 20% (2263 samples).
2.2. Dataset Preparation
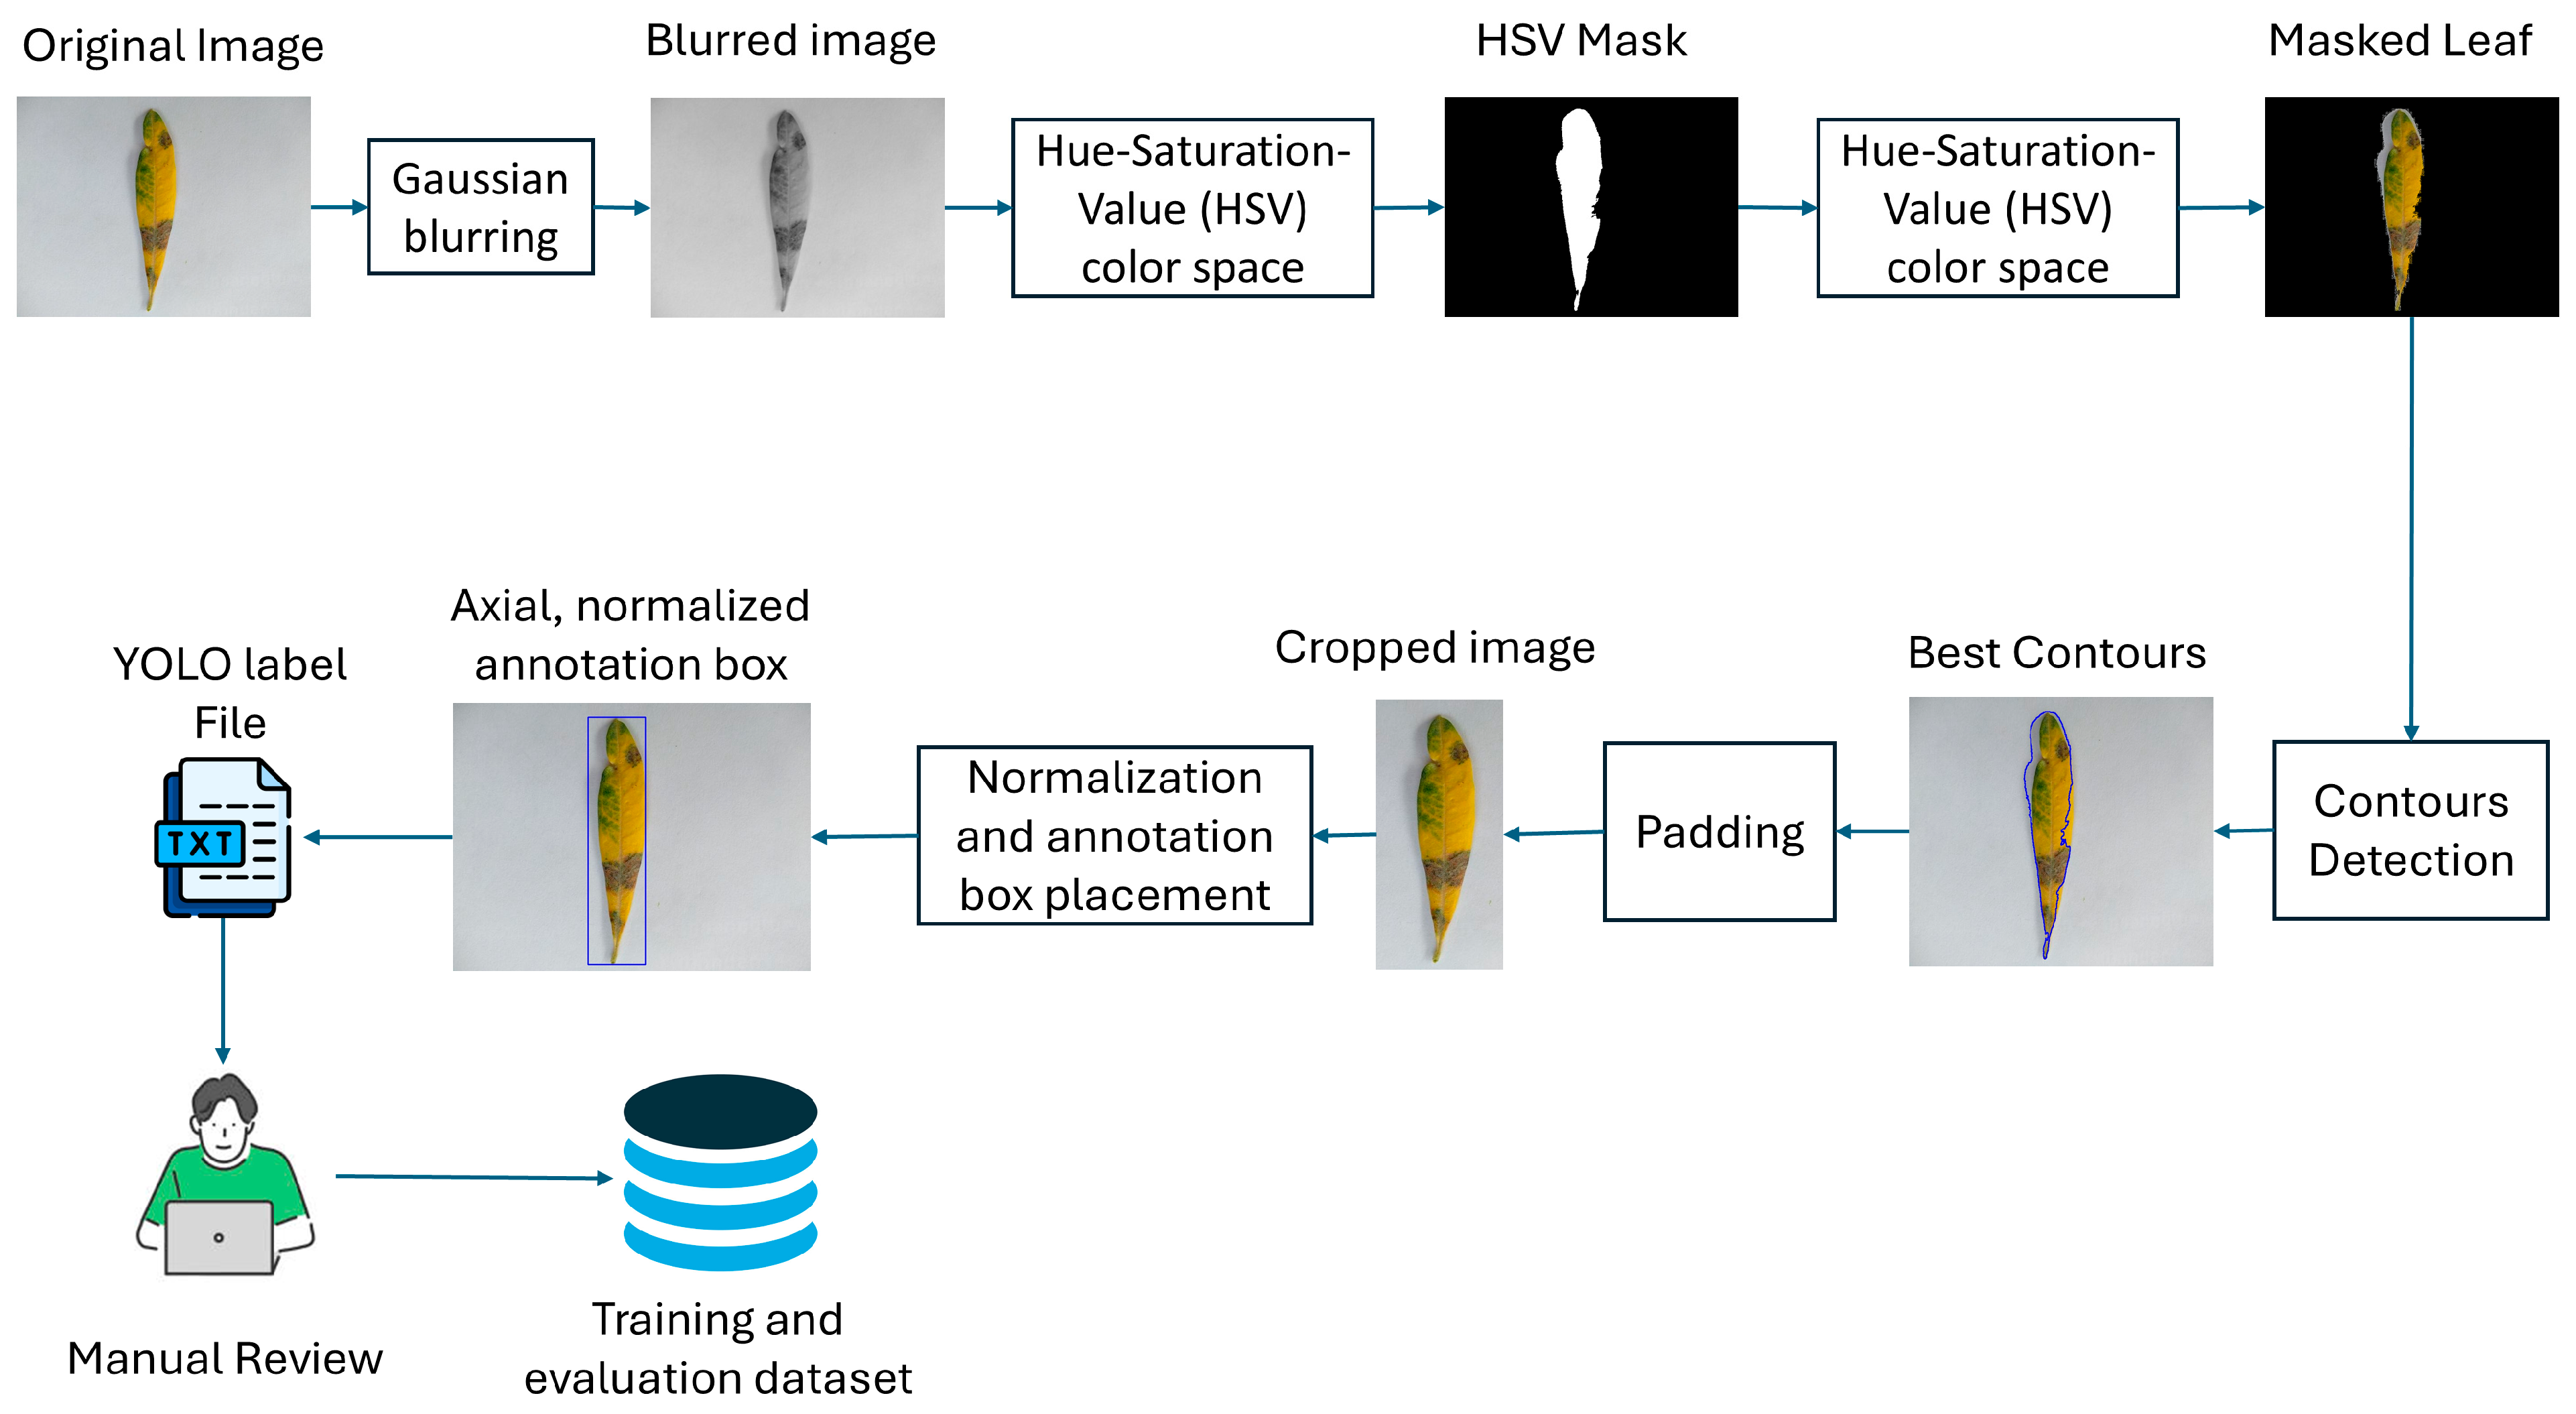
to train the YOLOV12 model we need to prepare the training and evaluation dataset in certain way to suit the model training and evaluation. The training and test dataset should combine with annotation files that contains information about the classes and the features inside the images. The Annotation process detailed in the flowchart in
Figure 3, for each image in both the training and evaluation subsets, the process applies a Gaussian blurring [
32], converting to Hue-Saturation-Value (HSV) color space [
33], defining specific HSV color ranges to isolate green leaf areas, and creating a mask through color filtering [
34].
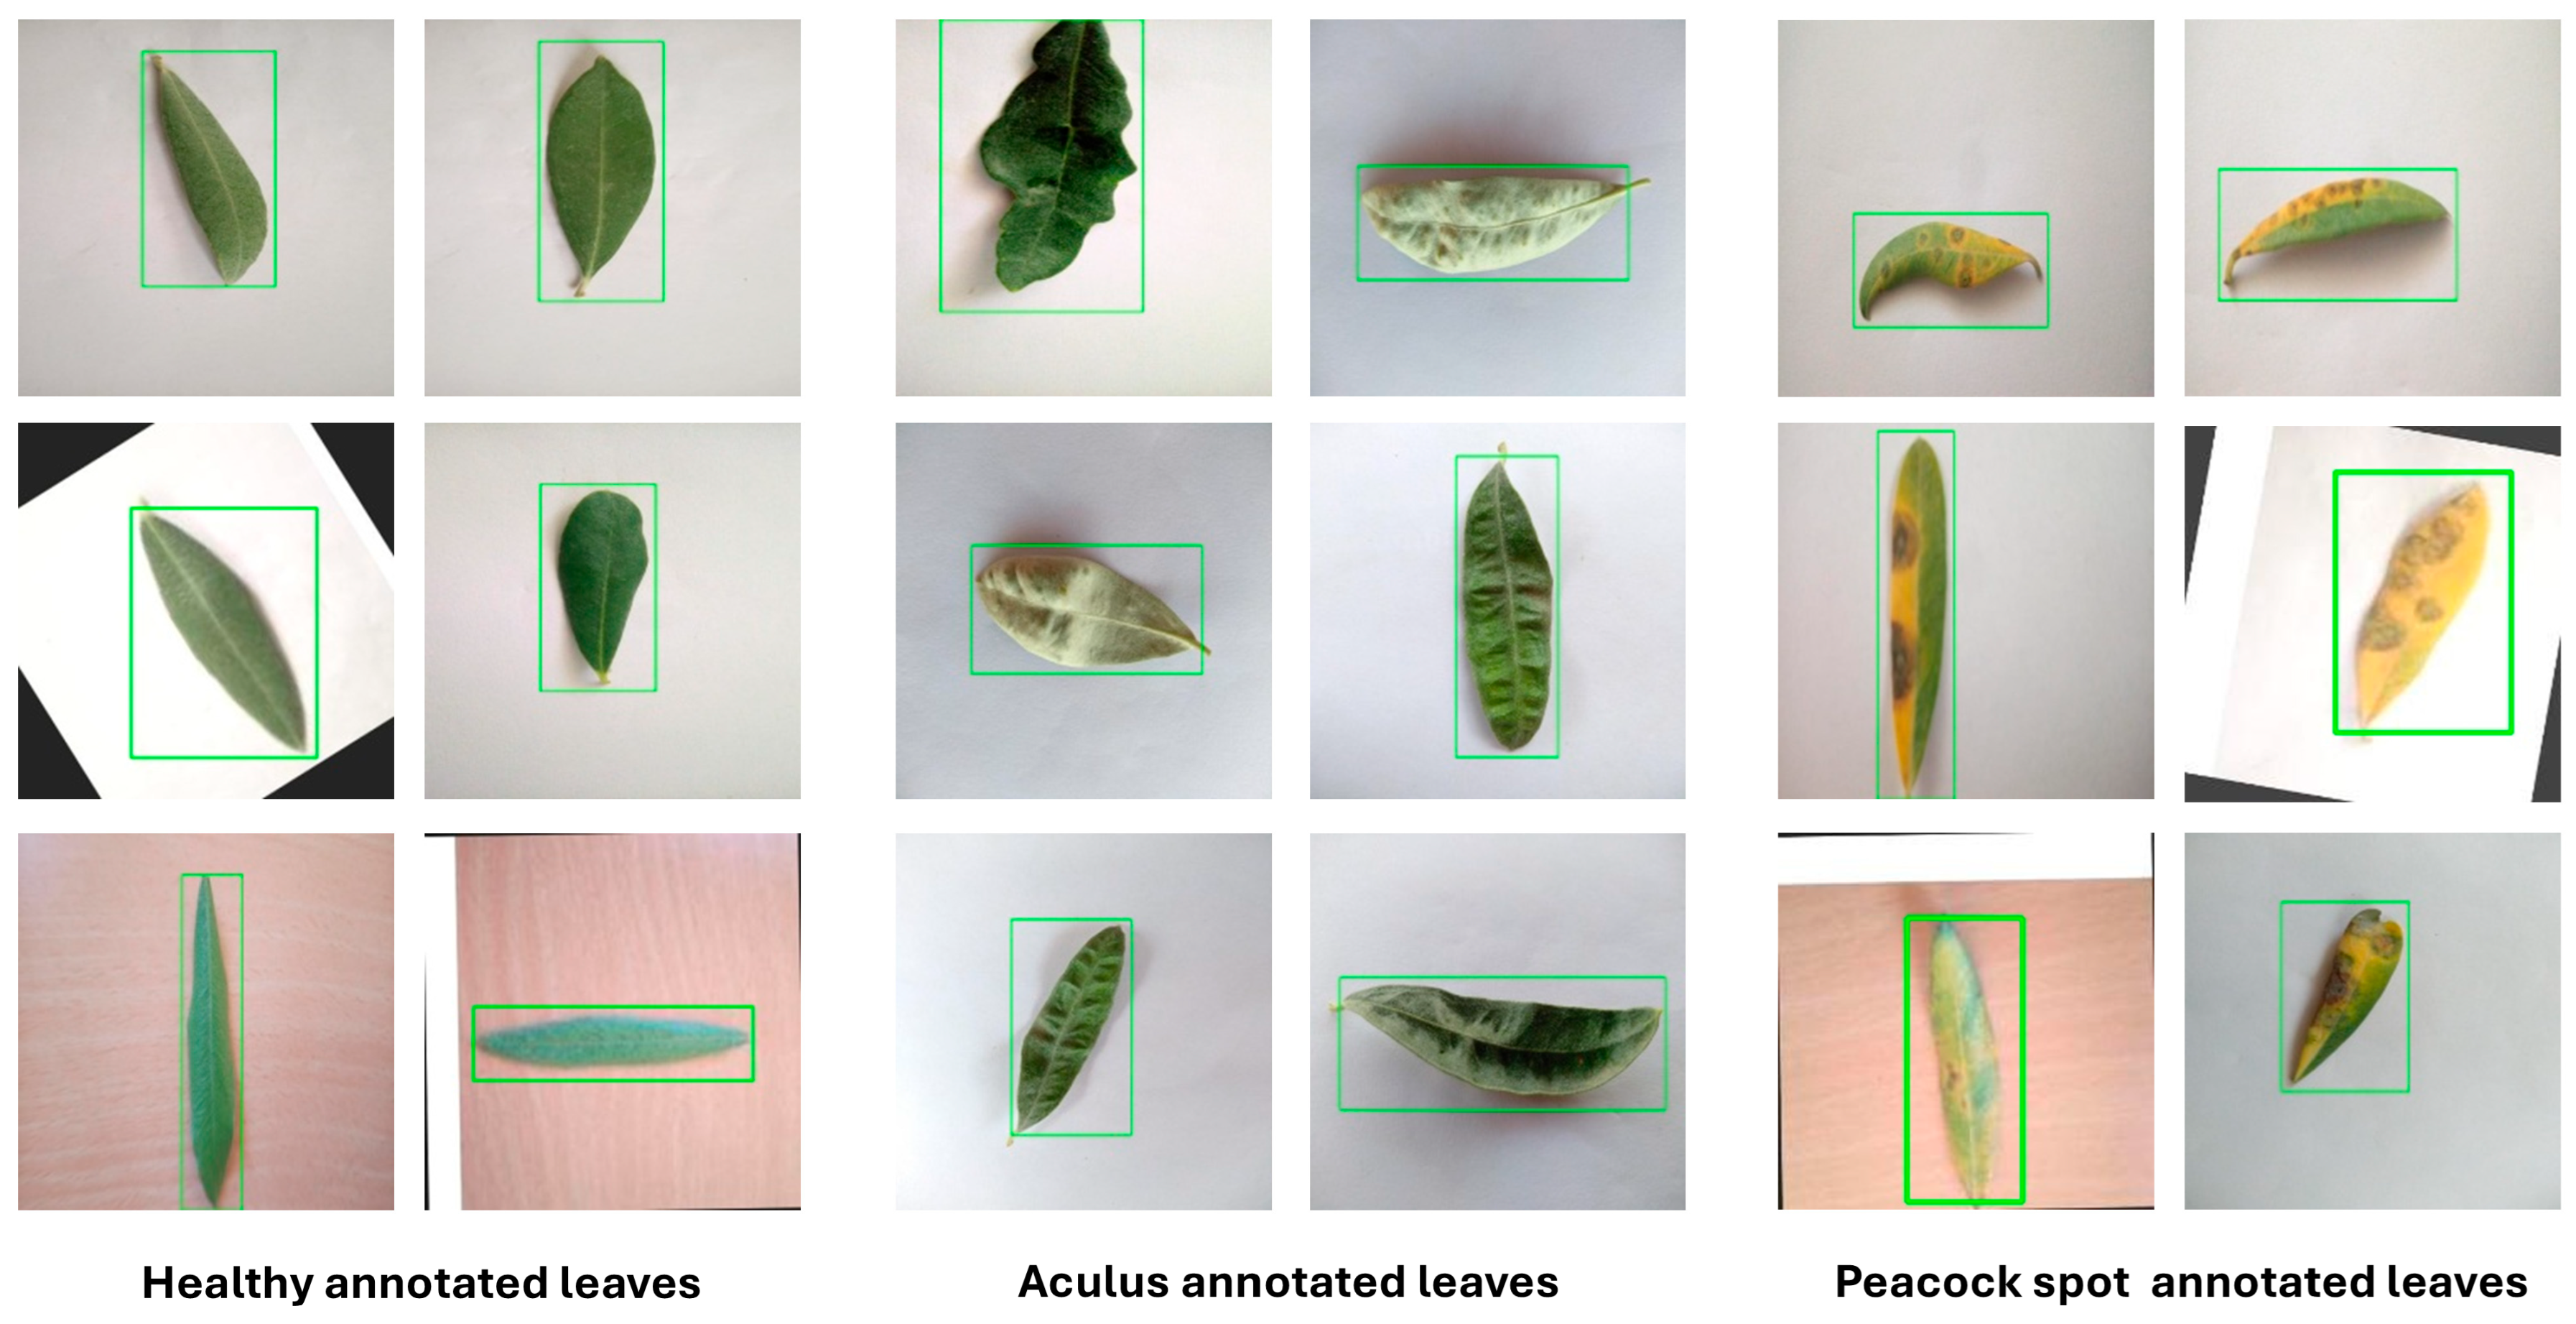
Subsequently, contours are detected from this refined mask. If contours are found, the system enters a loop to identify the "best leaf contour" by calculating and scoring various properties for each contour, including its area, aspect ratio, solidity, and its centeredness within the image. The contour of highest score is used. Once the suitable leaf contour is identified, a padded rectangular bounding box is then generated. The coordinates of this bounding box are then meticulously scaled and normalized to a 0-1 range relative to a fixed target image size (224×224 pixels), generating YOLO-compatible label files. Representative examples of these automatically generated annotations for “healthy”, “Aculus”, and “Scab” infected olive leaves are presented in
Figure 4. Following this initial automated labeling, a rigorous Manual Annotation Review is conducted by human experts
2.3. YOLOv12 Model
The YOLOv12 model was used as the core of the diagnostic system, a Convolutional Neural Network (CNN) specifically chosen for its real-life object detection capabilities. The primary input for training is the "Annotated Training dataset" (7920 samples). This dataset consists of olive leaf images paired with their corresponding annotation label files. The annotation labels are provided in the standard YOLO format, where each line in a (.txt) file corresponds to one detected object in the image [
35]. The format specifies the class ID of the object followed by its normalized bounding box coordinates. The normalization ensures that the coordinates are between 0 and 1, making them independent of the image's original dimensions and suitable for models that resize inputs. The structure of each line in a YOLO label file is as follows, as detailed in
Table 4.
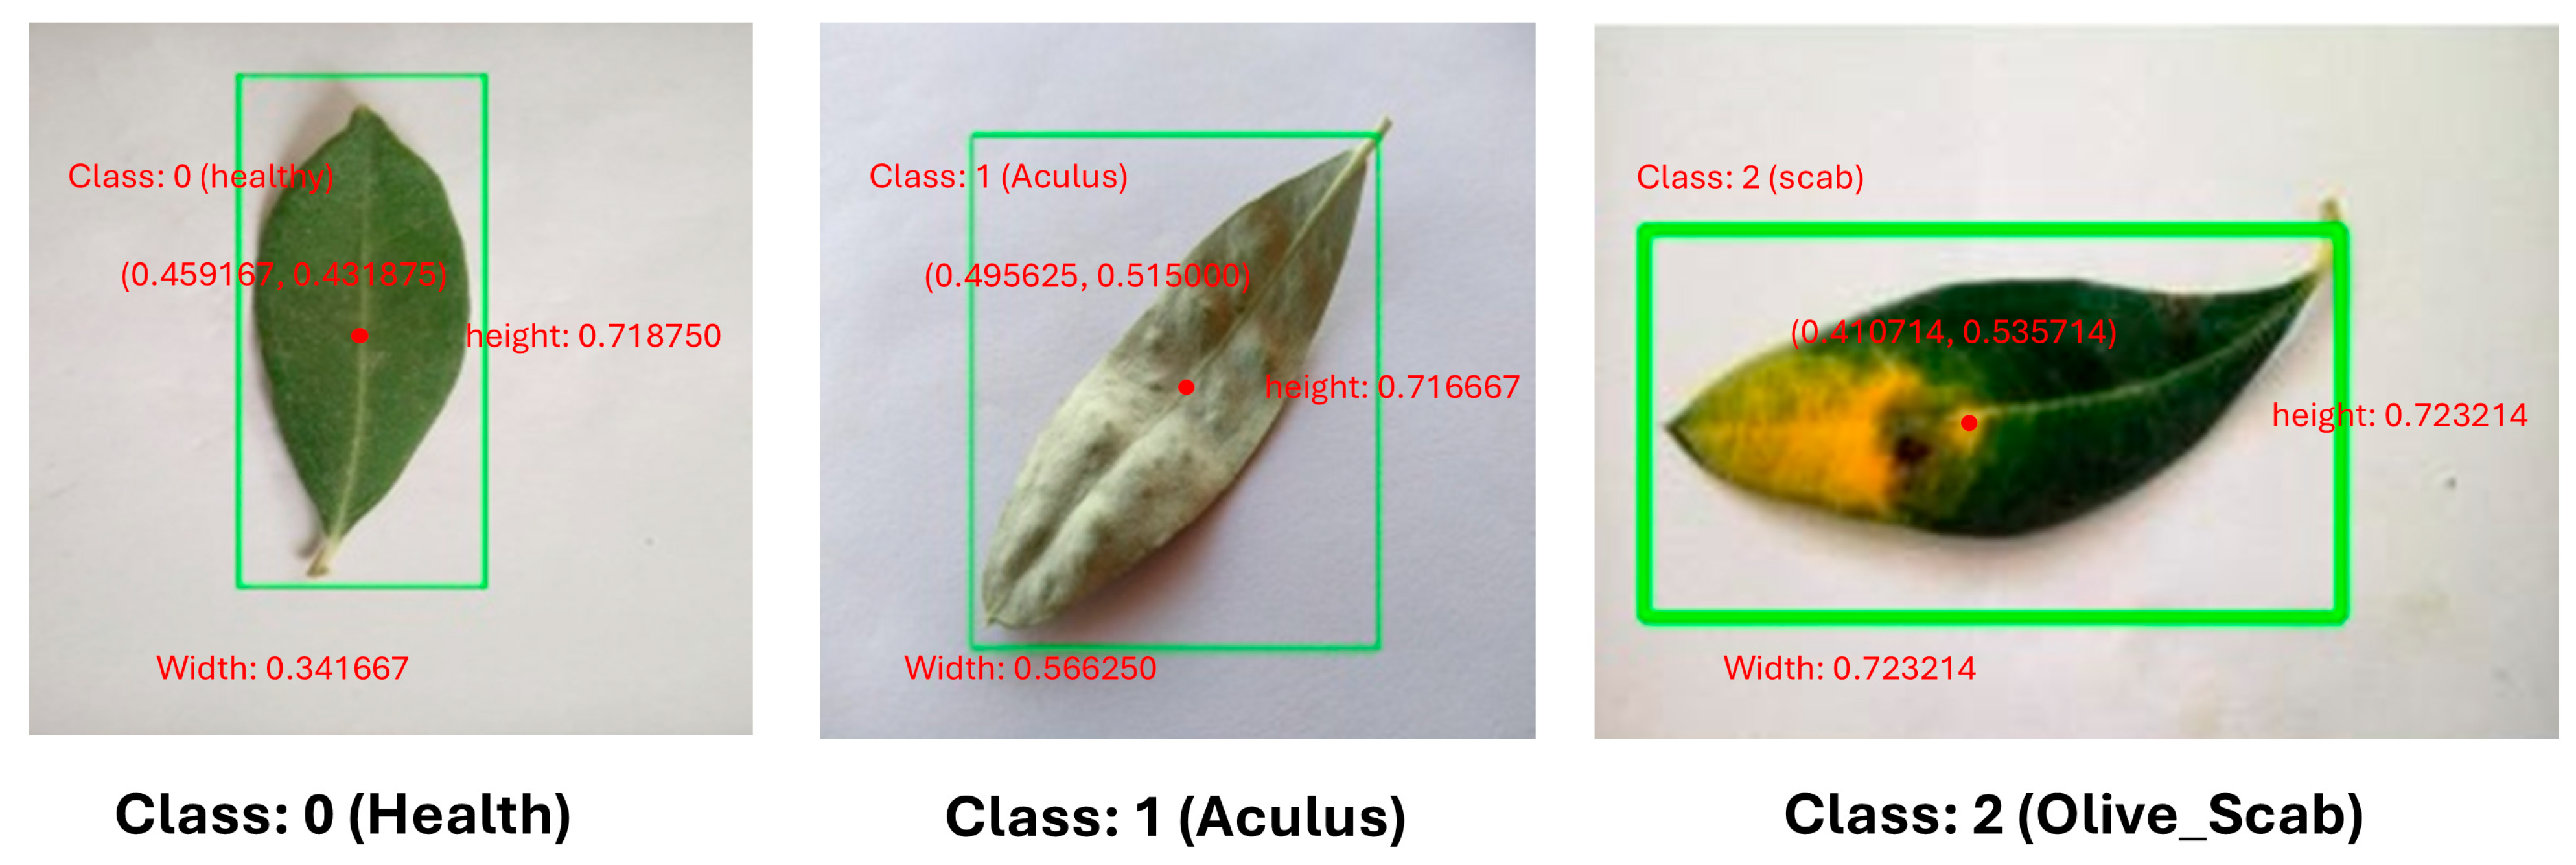
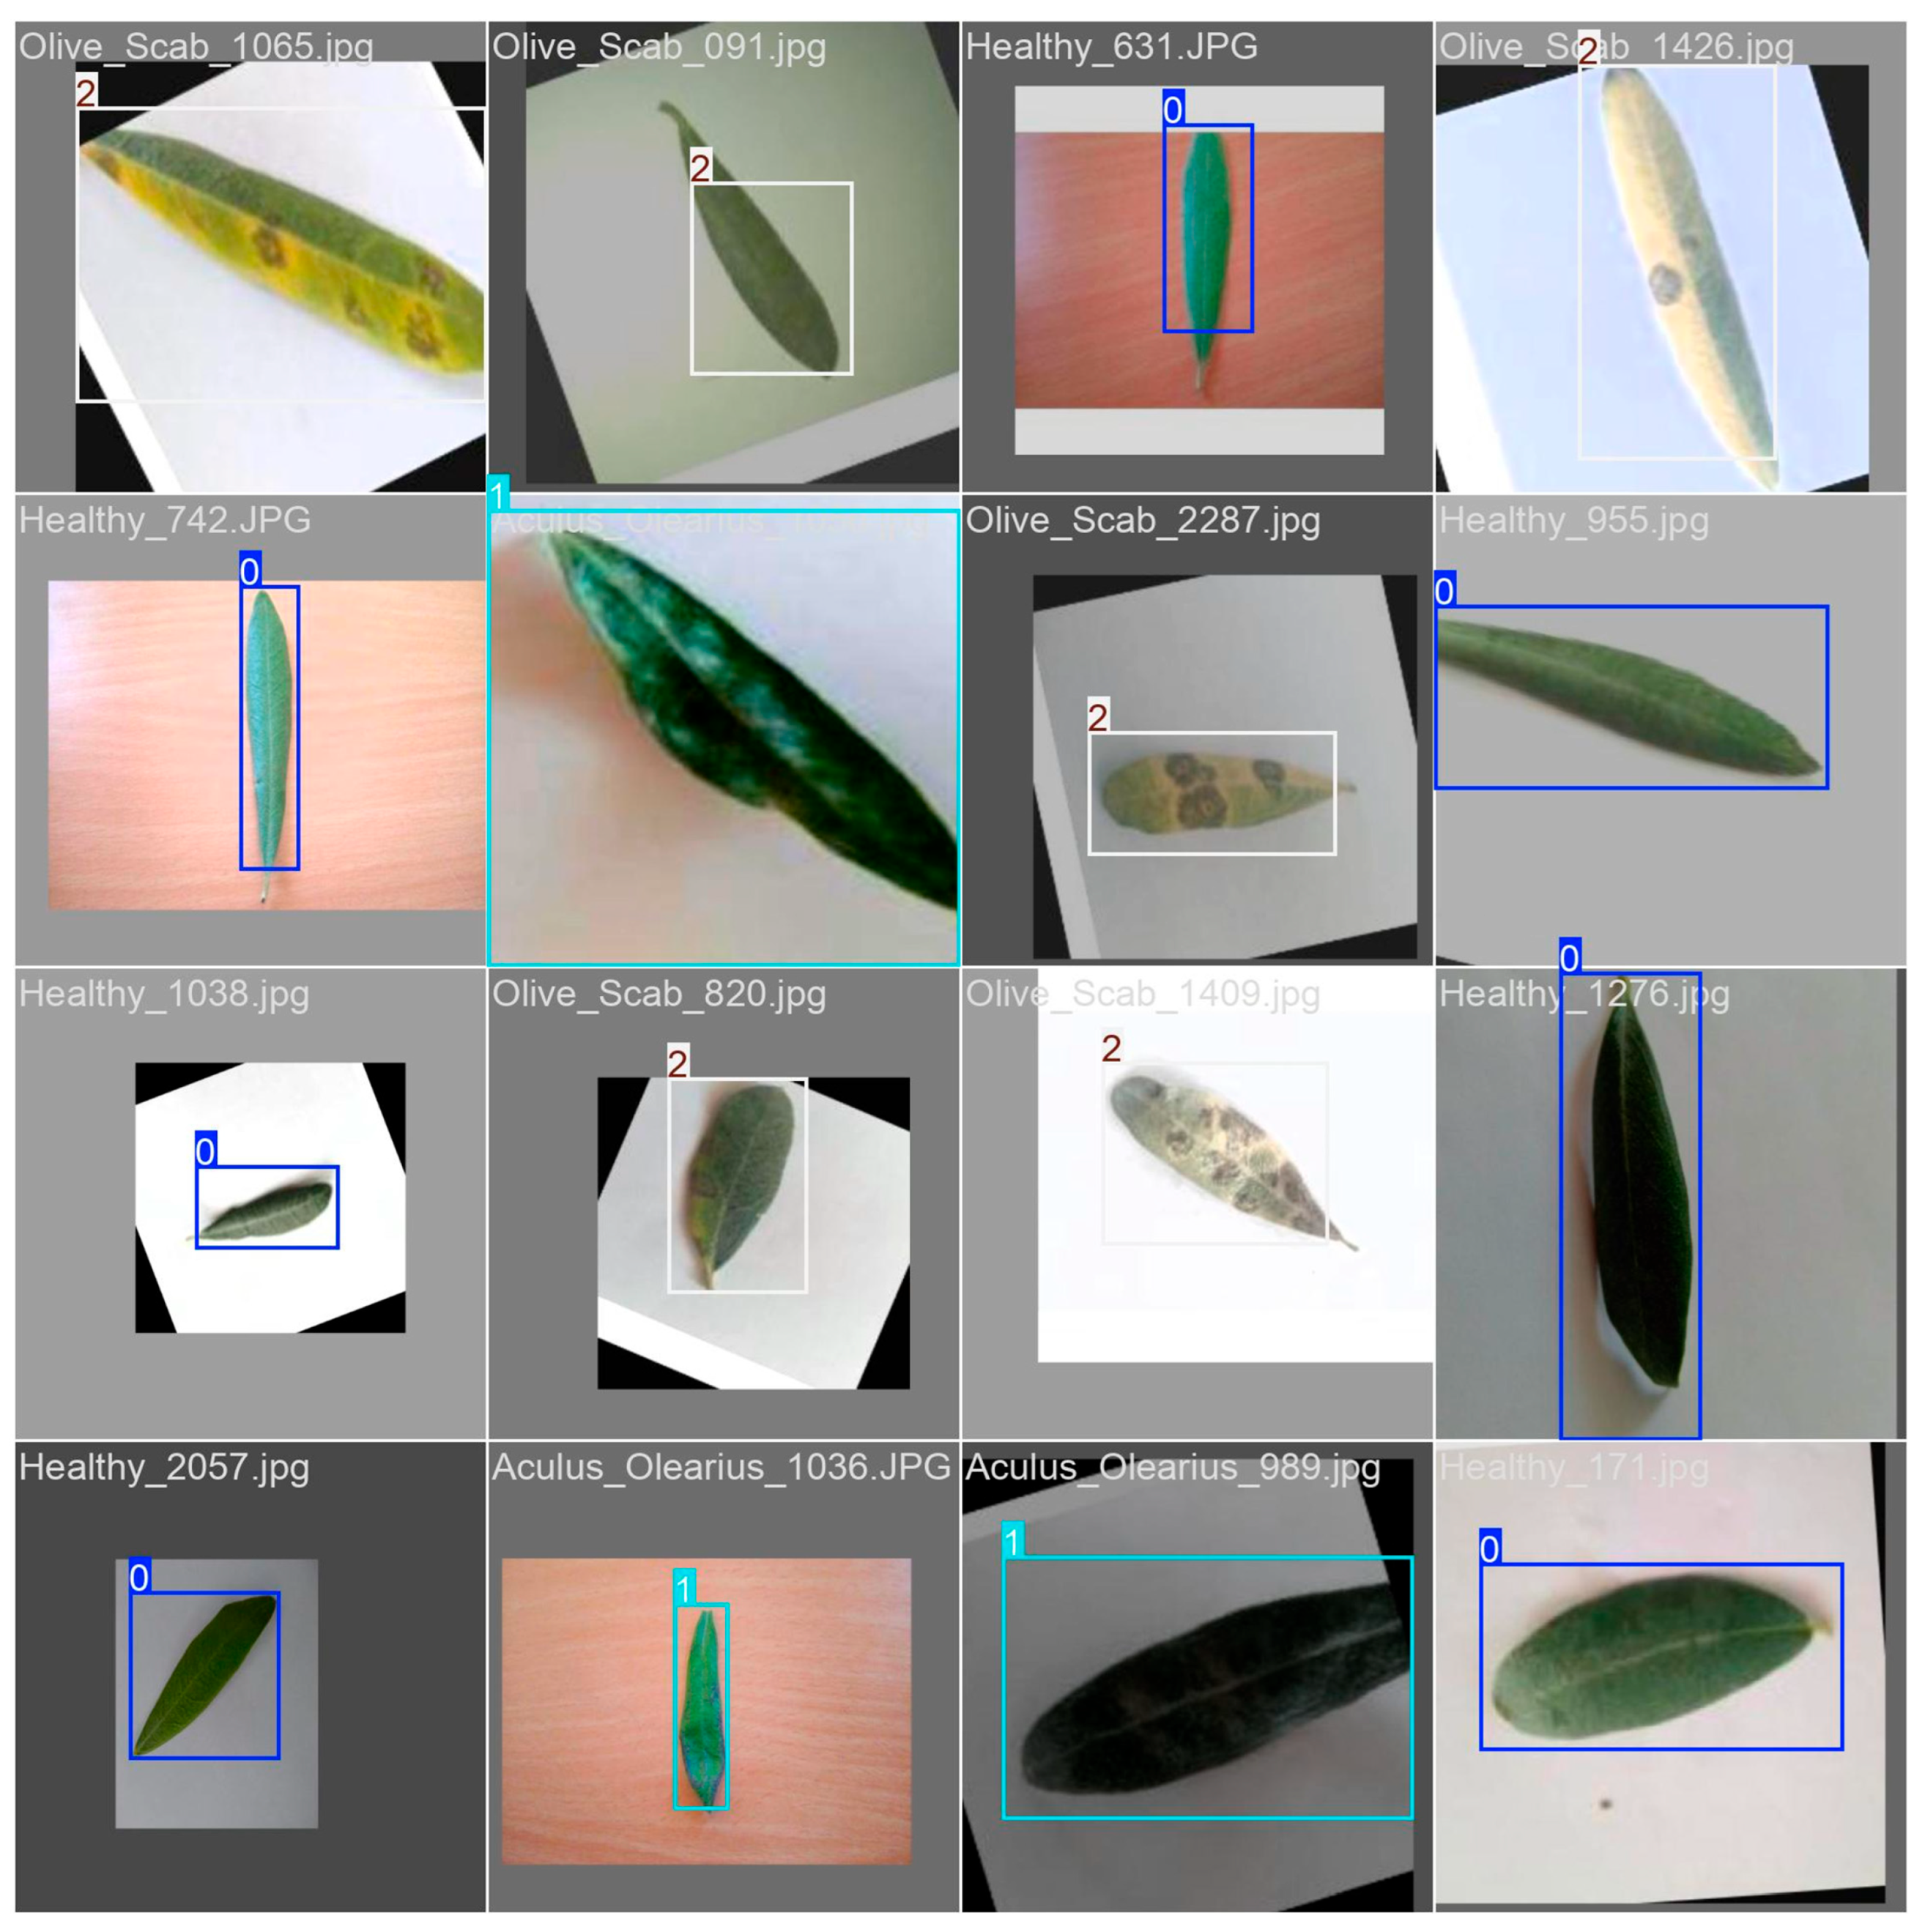
Figure 5 illustrates a sample image for each class overlaid with its bounding box, alongside the content of its corresponding YOLO (.txt) label file [
36]. For this research, the output classes of the YOLOv12 model are defined with specific integer IDs: “0: Healthy”, “1: Aculus”, and “2: Peacock spot”. During training, the YOLOv12 model iteratively adjusts its internal parameters by processing batches of images from the "Annotated Training dataset" [
36]. The objective is to minimize loss function, which reports the relative error between the model's predicted bounding boxes and class probabilities, and the ground-truth annotations. The validation set is periodically used to evaluate the model's performance on unseen data, guiding hyperparameter tuning and preventing overfitting. Upon completion of the training phase, the final performance of the trained YOLOv12 model is rigorously assessed using the independent "Annotated Validation dataset". This evaluation is crucial to ensure the model's generalization capability to unseen data [
37].
2.4. The OLIVE-CAD Diagnostic System
The OLIVE-CAD system was deployed across four distinct olive farms (A, B, C, and D), these farms serve as real-world examples for data collection and system performance assessment. The real-life evaluation of the OLIVE-CAD system was conducted to assess its performance and practicality in simulated real-life agricultural settings. This phase specifically utilized the 10% "Testing" dataset, which consists of a total of 1,132 samples, initially set aside to ensure an unbiased assessment of the integrated system. For this evaluation, the 1,132 samples from the test dataset were logically divided among four distinct olive farms, as detailed in
Table 5. The dataset was portioned as follows: Farm A (88 Healthy, 85 Aculus, 108 Scab), Farm B (88 Healthy, 85 Aculus, 108 Scab), Farm C (88 Healthy, 85 Aculus, 108 Scab), and Farm D (91 Healthy, 88 Aculus, 110 Scab). This "four-farm model" serves as a simulation for a real-world, and demonstrates the system's ability to manage group of farms. The real-life evaluation process was conducted directly through the OLIVE-CAD graphical user interface (GUI) software, which was deployed on a local PC either in the farm or at a central diagnostic center (as illustrated in
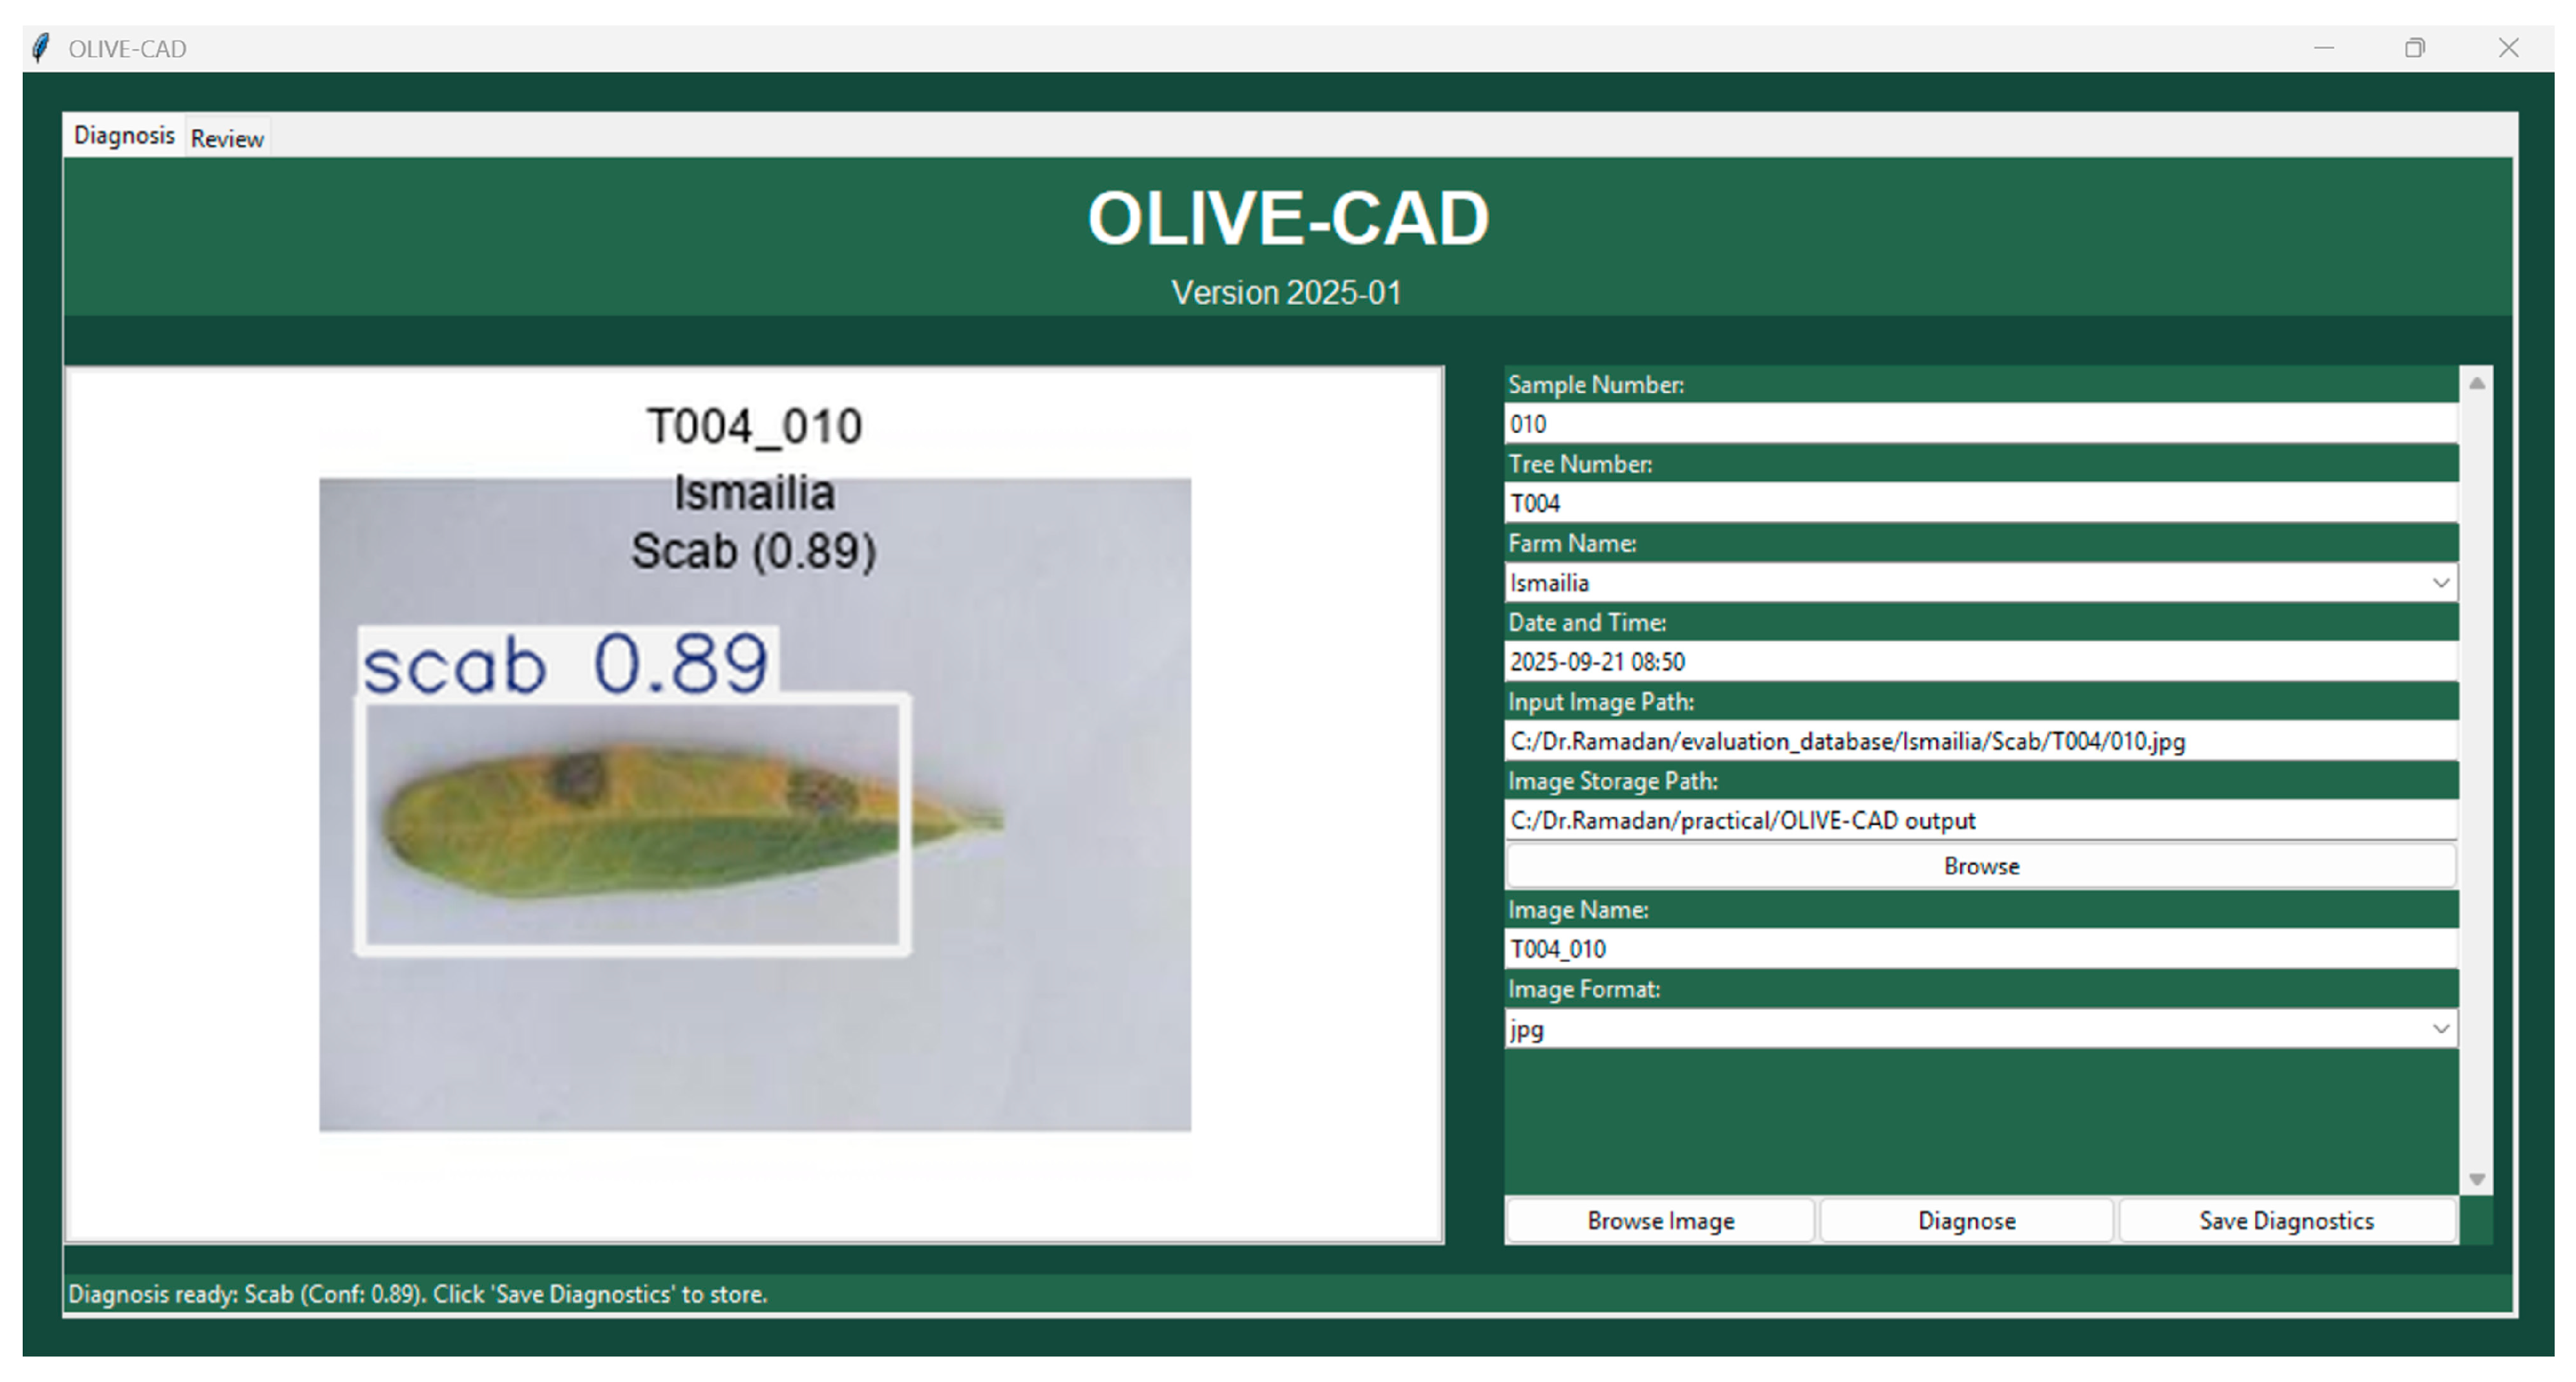
Figure 6). Within this interface, farmers or field technicians could browse and upload the olive leaf sample image, specify metadata such as the sample number, tree number, and farm name, and then initiate the diagnostic process. Once the image was selected, the OLIVE-CAD system—powered by the integrated YOLOv12 deep learning model—performed real-time inference to detect and classify potential diseases. The GUI immediately displayed the diagnostic result, including the identified disease and its associated confidence score. Alongside the visual annotation of the infected region on the leaf image, contextual information such as the sample ID, farm location, and timestamp of analysis were also recorded. All results and metadata were automatically stored in a local PostgreSQL database linked to the OLIVE-CAD unit.
3. Results
Model Training and Evaluation
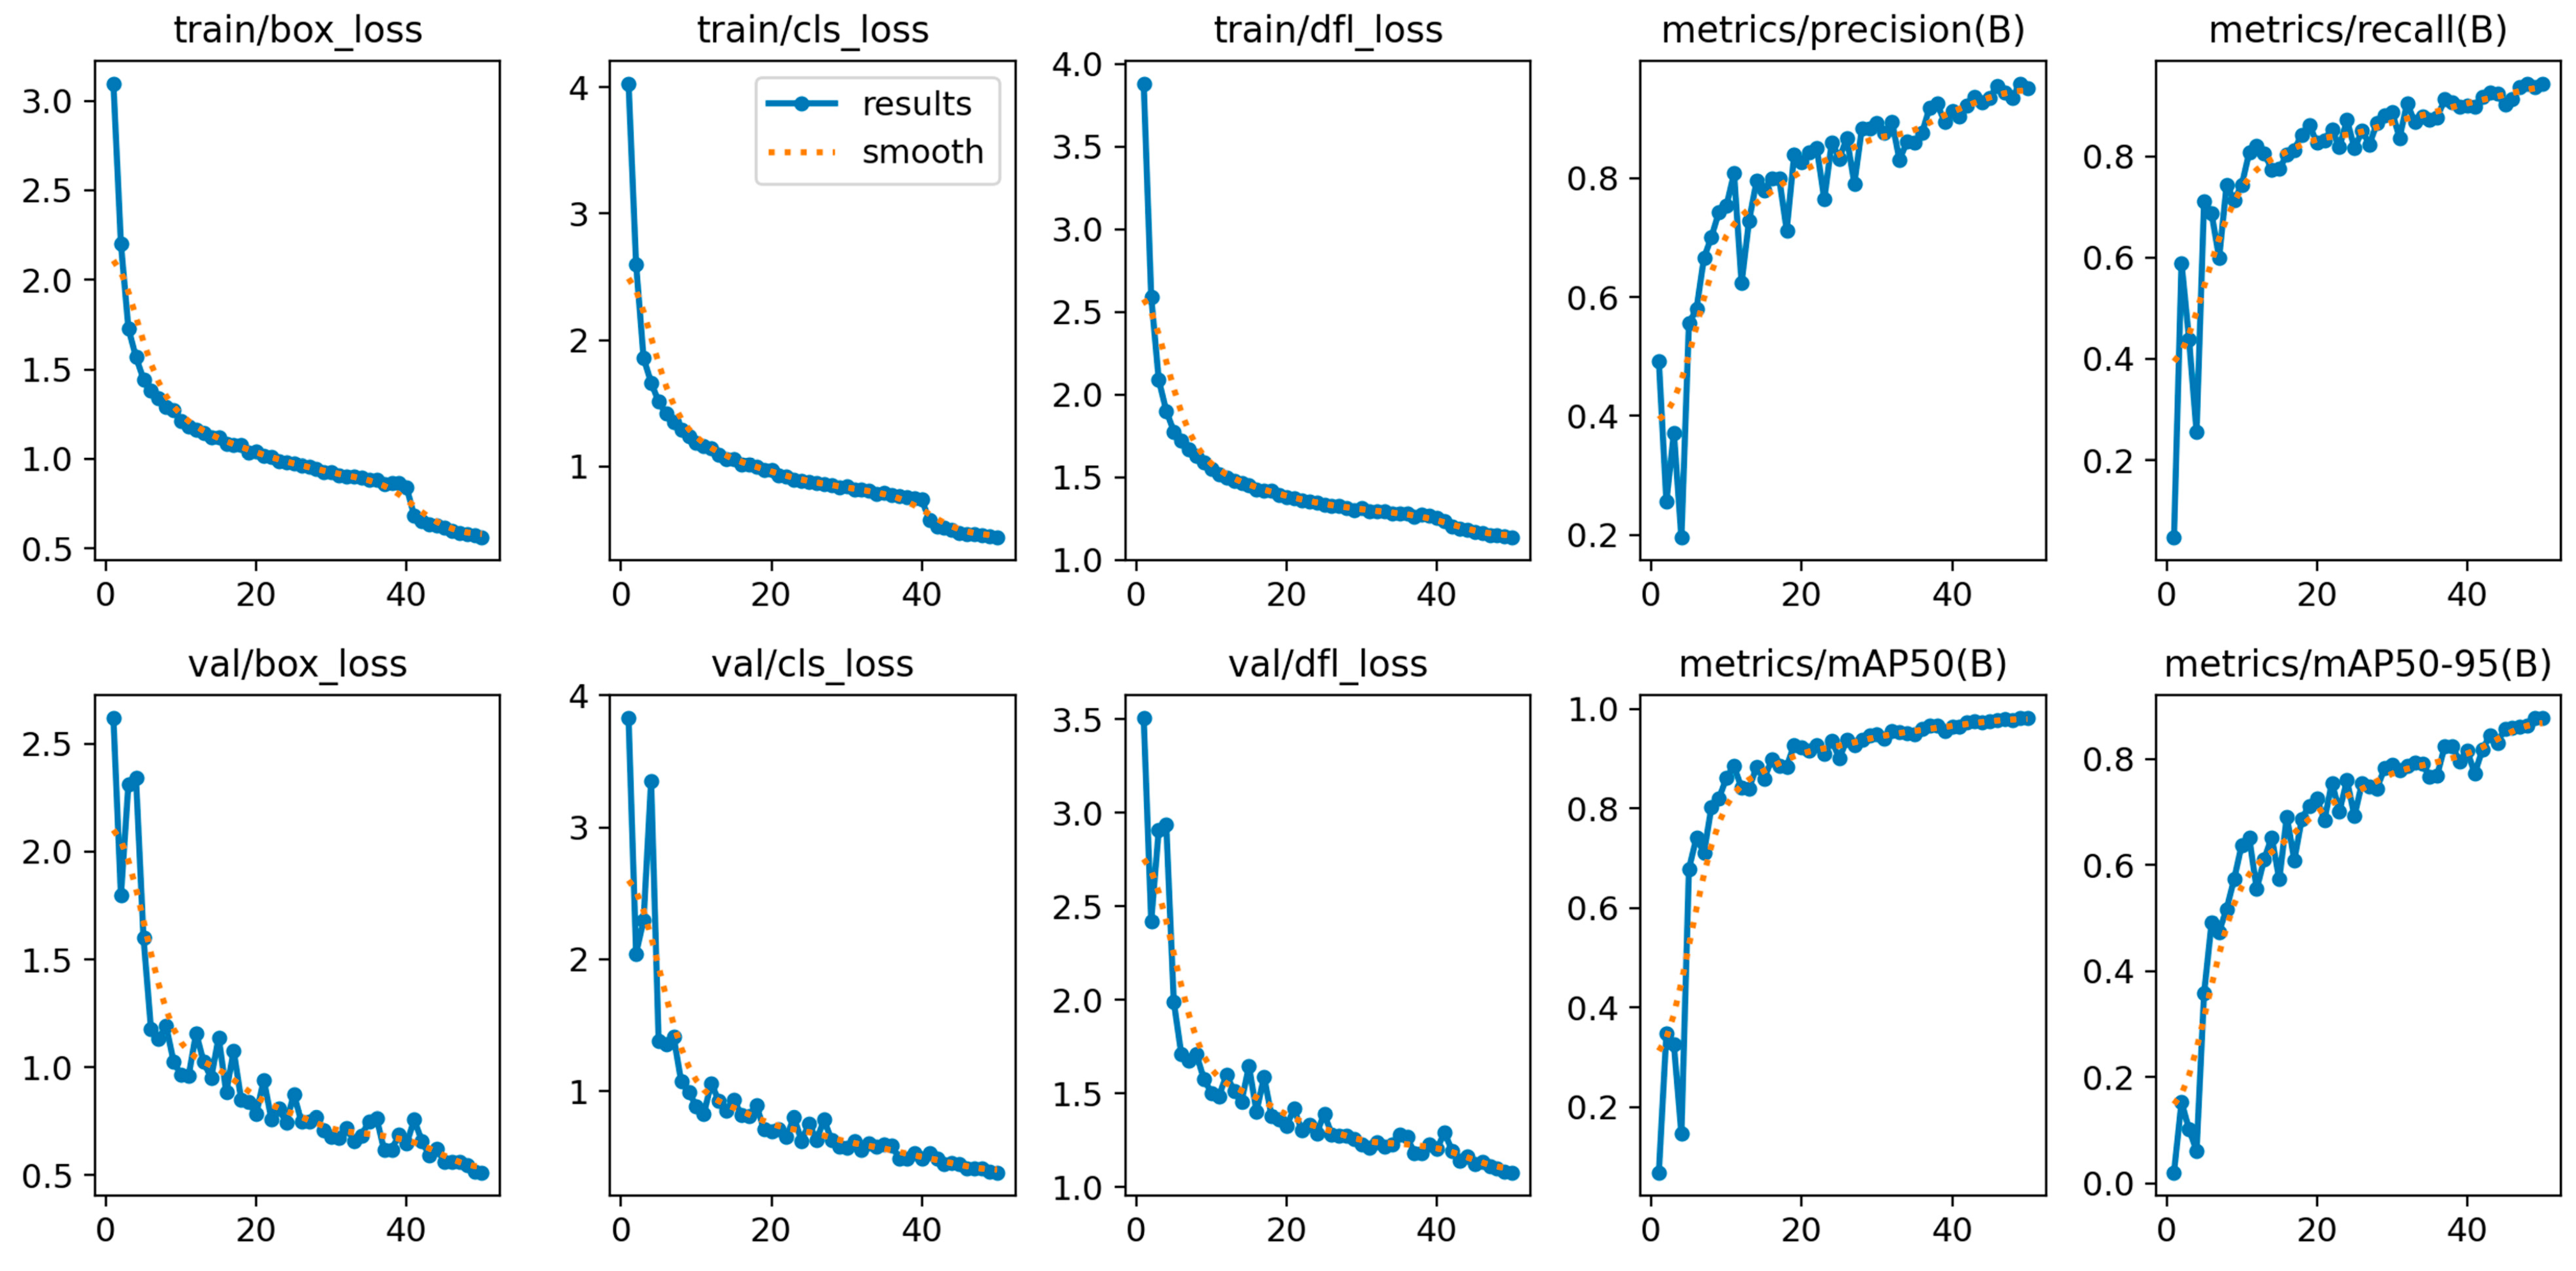
We assessed the performance of the model by analyzing key training and validation metrics.
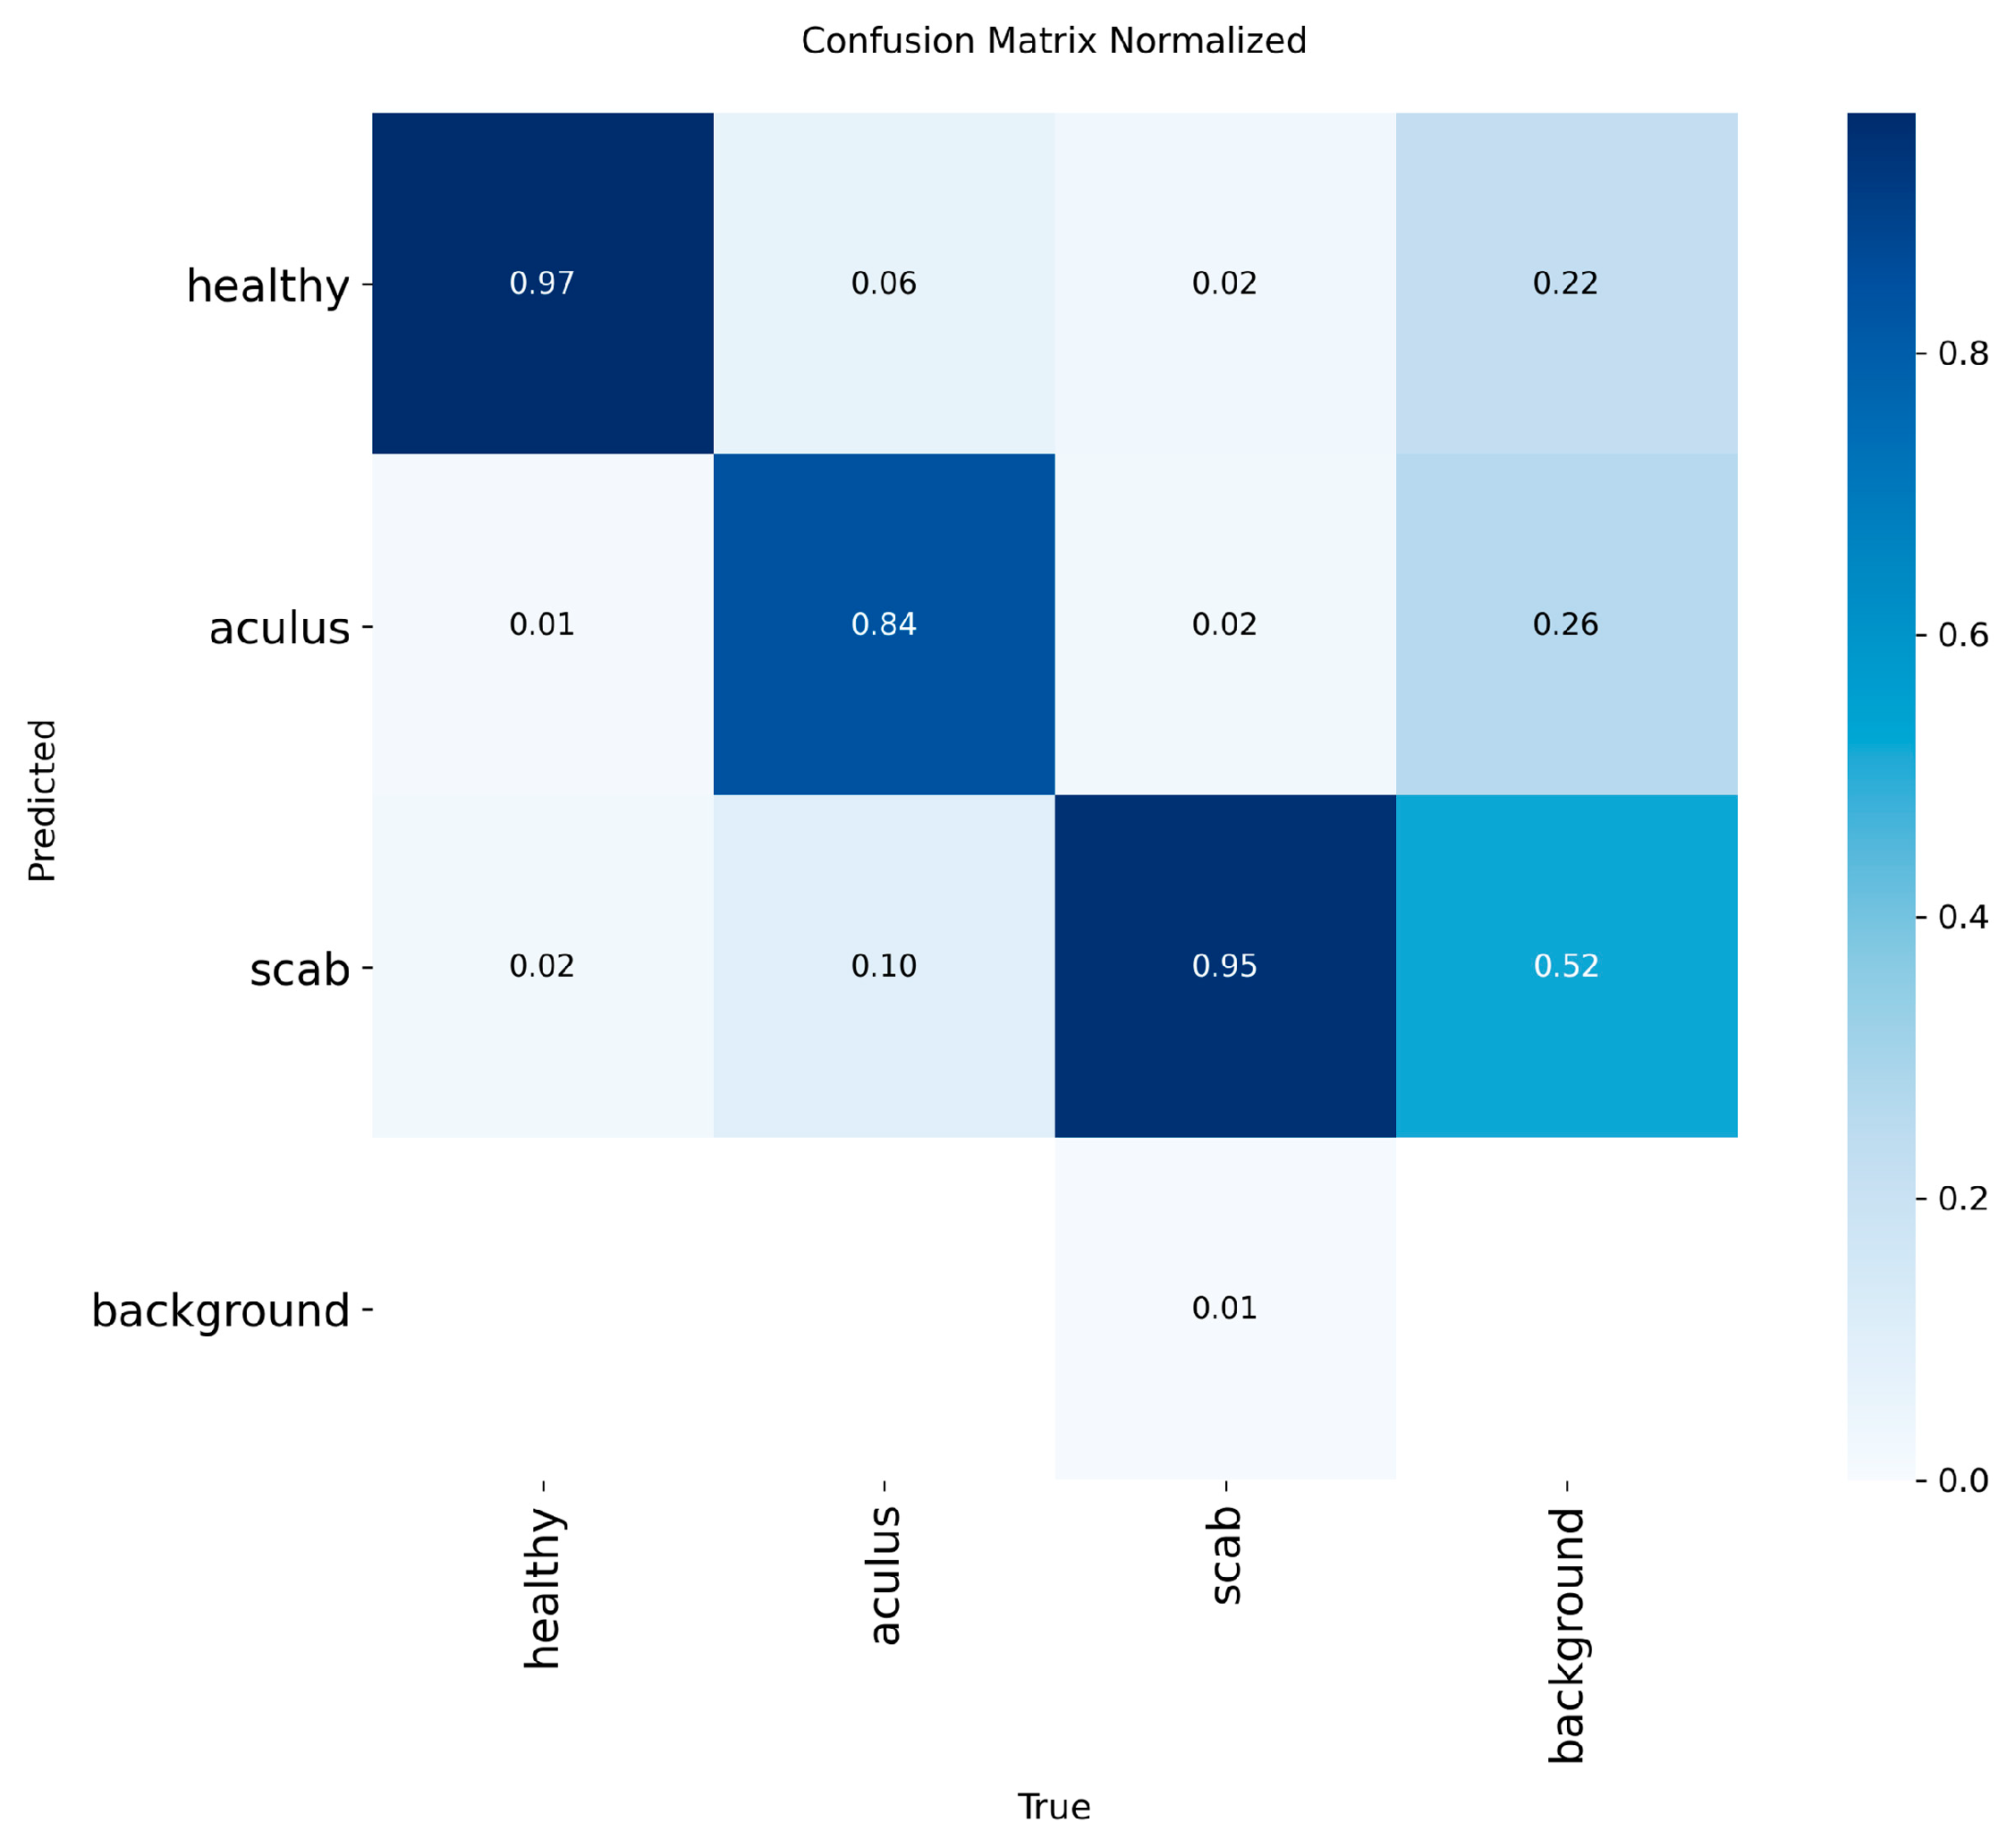
Figure 7 illustrates the model's learning progression over a series of training epochs. The training loss curves, including bounding box loss, classification loss, and distribution focal loss, demonstrate a consistent and steep decline, indicating that the model was effectively minimizing error and learning the features of the dataset. Concurrently, the validation loss curves for the same metrics also showed a stable downward trend. This synchronicity between training and validation losses signifies that the model was not overfitting to the training data and was successfully generalizing its learned knowledge to unseen data. This is further substantiated by the steady increase in validation precision, recall, and mAP metrics throughout the training process. A normalized confusion matrix, as depicted in
Figure 8, was employed to visualize the performance of the model at a class-specific level.
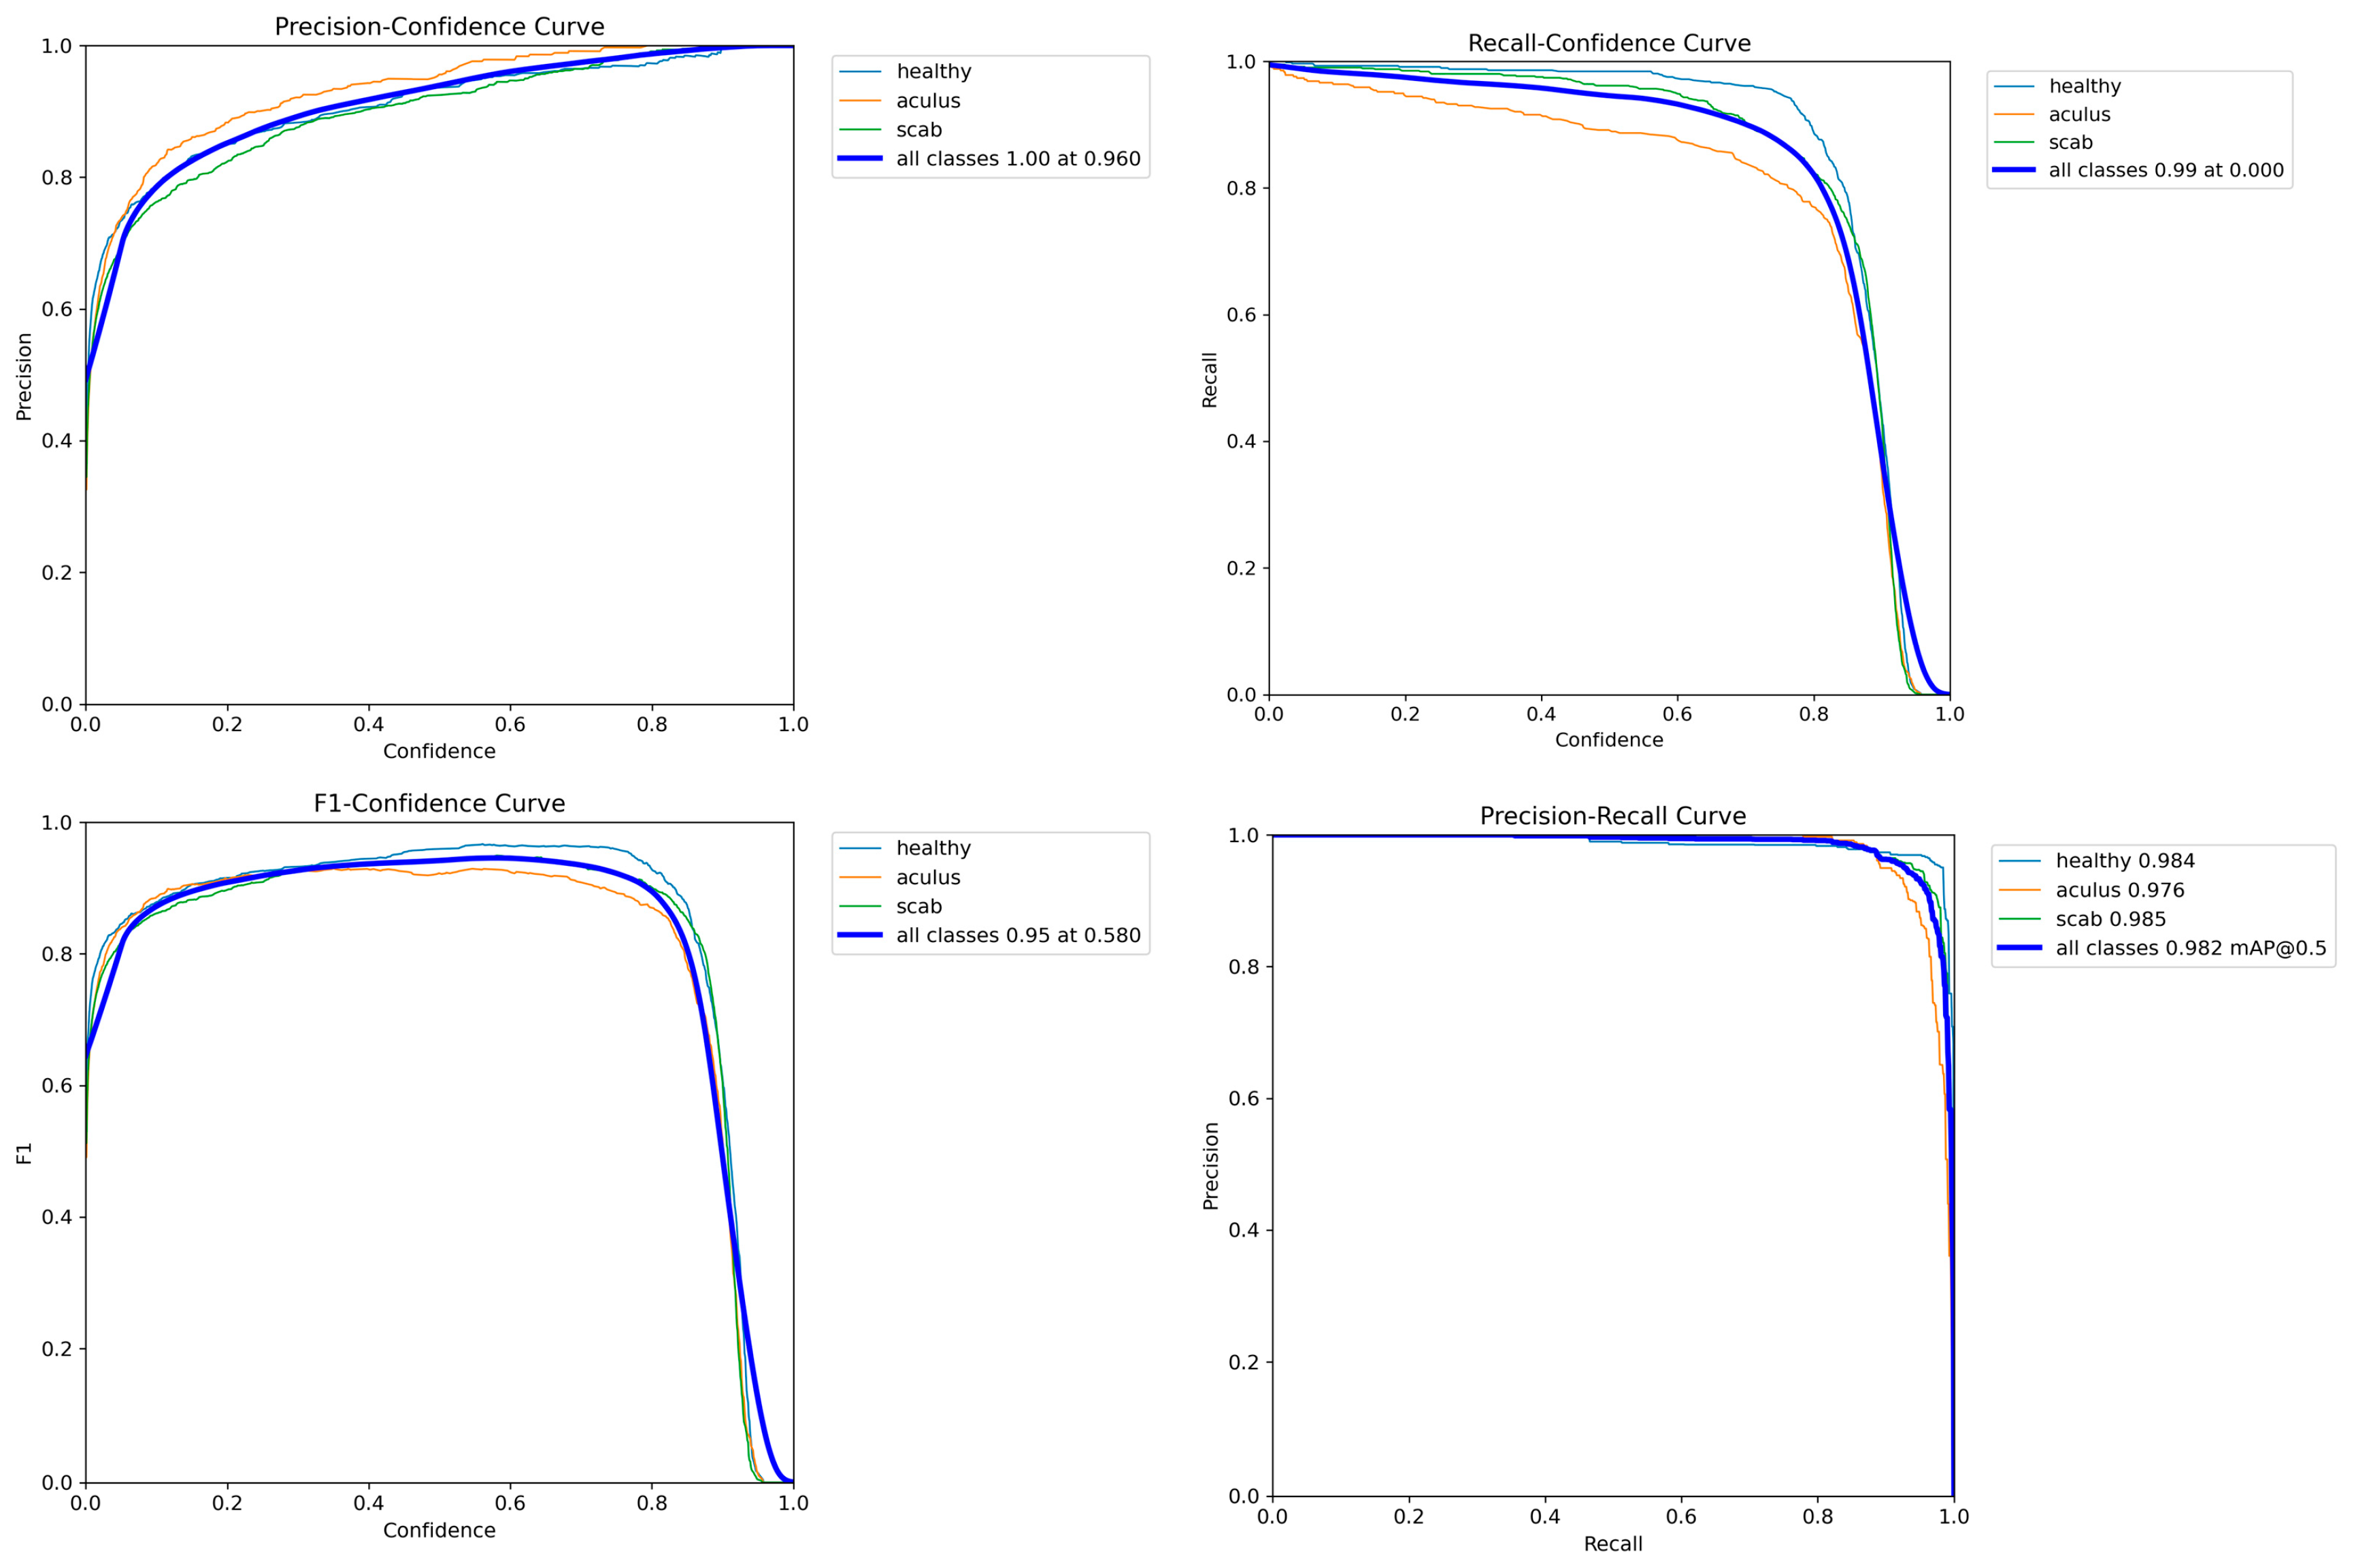
This analysis highlighted a primary area of misclassification between the 'aculus' and 'scab' classes, with 10% of actual 'aculus' leaves being predicted as 'scab'. This suggests that these two classes share some visual similarities that the model found challenging to distinguish consistently. However, overall inter-class confusion remained low, with negligible misclassifications with the 'background' class. The Precision-Confidence curve shown in
Figure 9, demonstrates that the model maintains precision, approaching a value of 1.00 at a confidence threshold of 0.960. Conversely, the Recall-Confidence curve illustrates the trade-off between recall and prediction confidence, where recall remains high at lower confidence thresholds but decreases as the threshold increases. The F1-Confidence curve identifies the optimal balance between precision and recall, with the highest F1 score of 0.95 being achieved at a confidence threshold of 0.580. The large area under the curve indicates a high average precision for each class, contributing to an overall mAP of 0.982 at an IoU threshold of 0.5. The training process was visually confirmed by examining training batches with augmented data. A representative training batch,
Figure 10 shows several images with their corresponding ground truth bounding boxes and class IDs.
The validation batch was visually inspected. The ground truth labels for the batch,
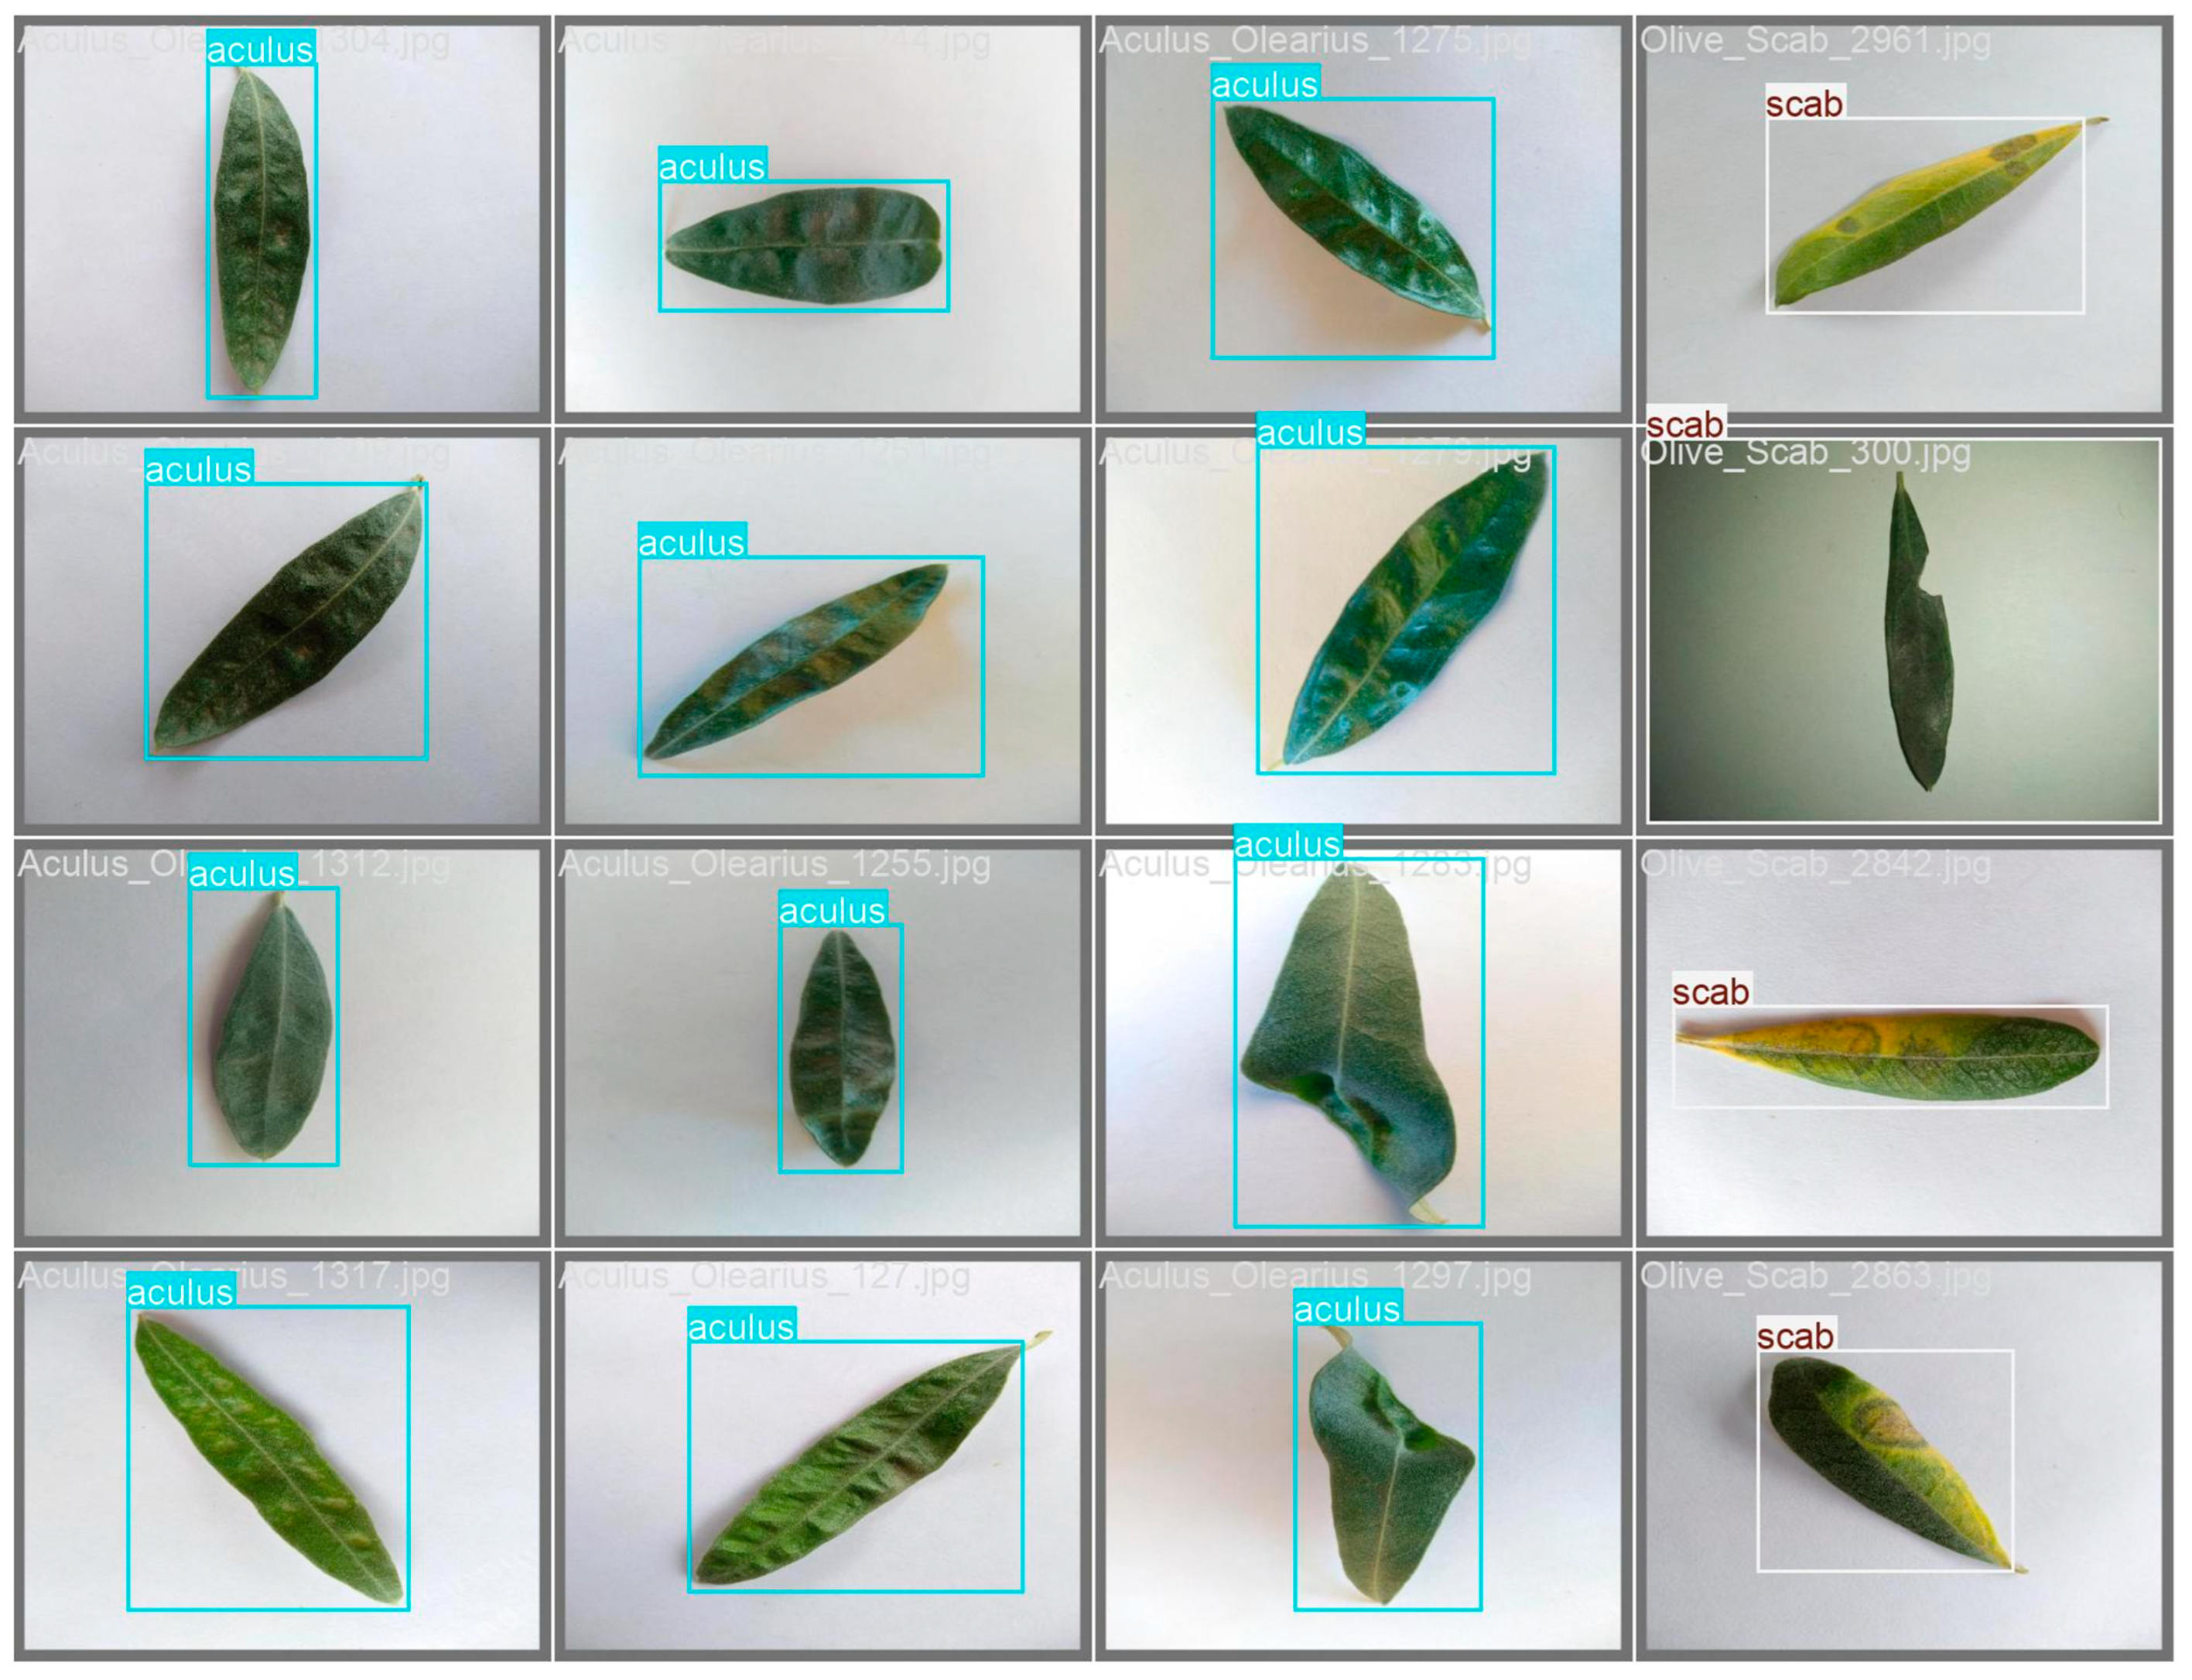
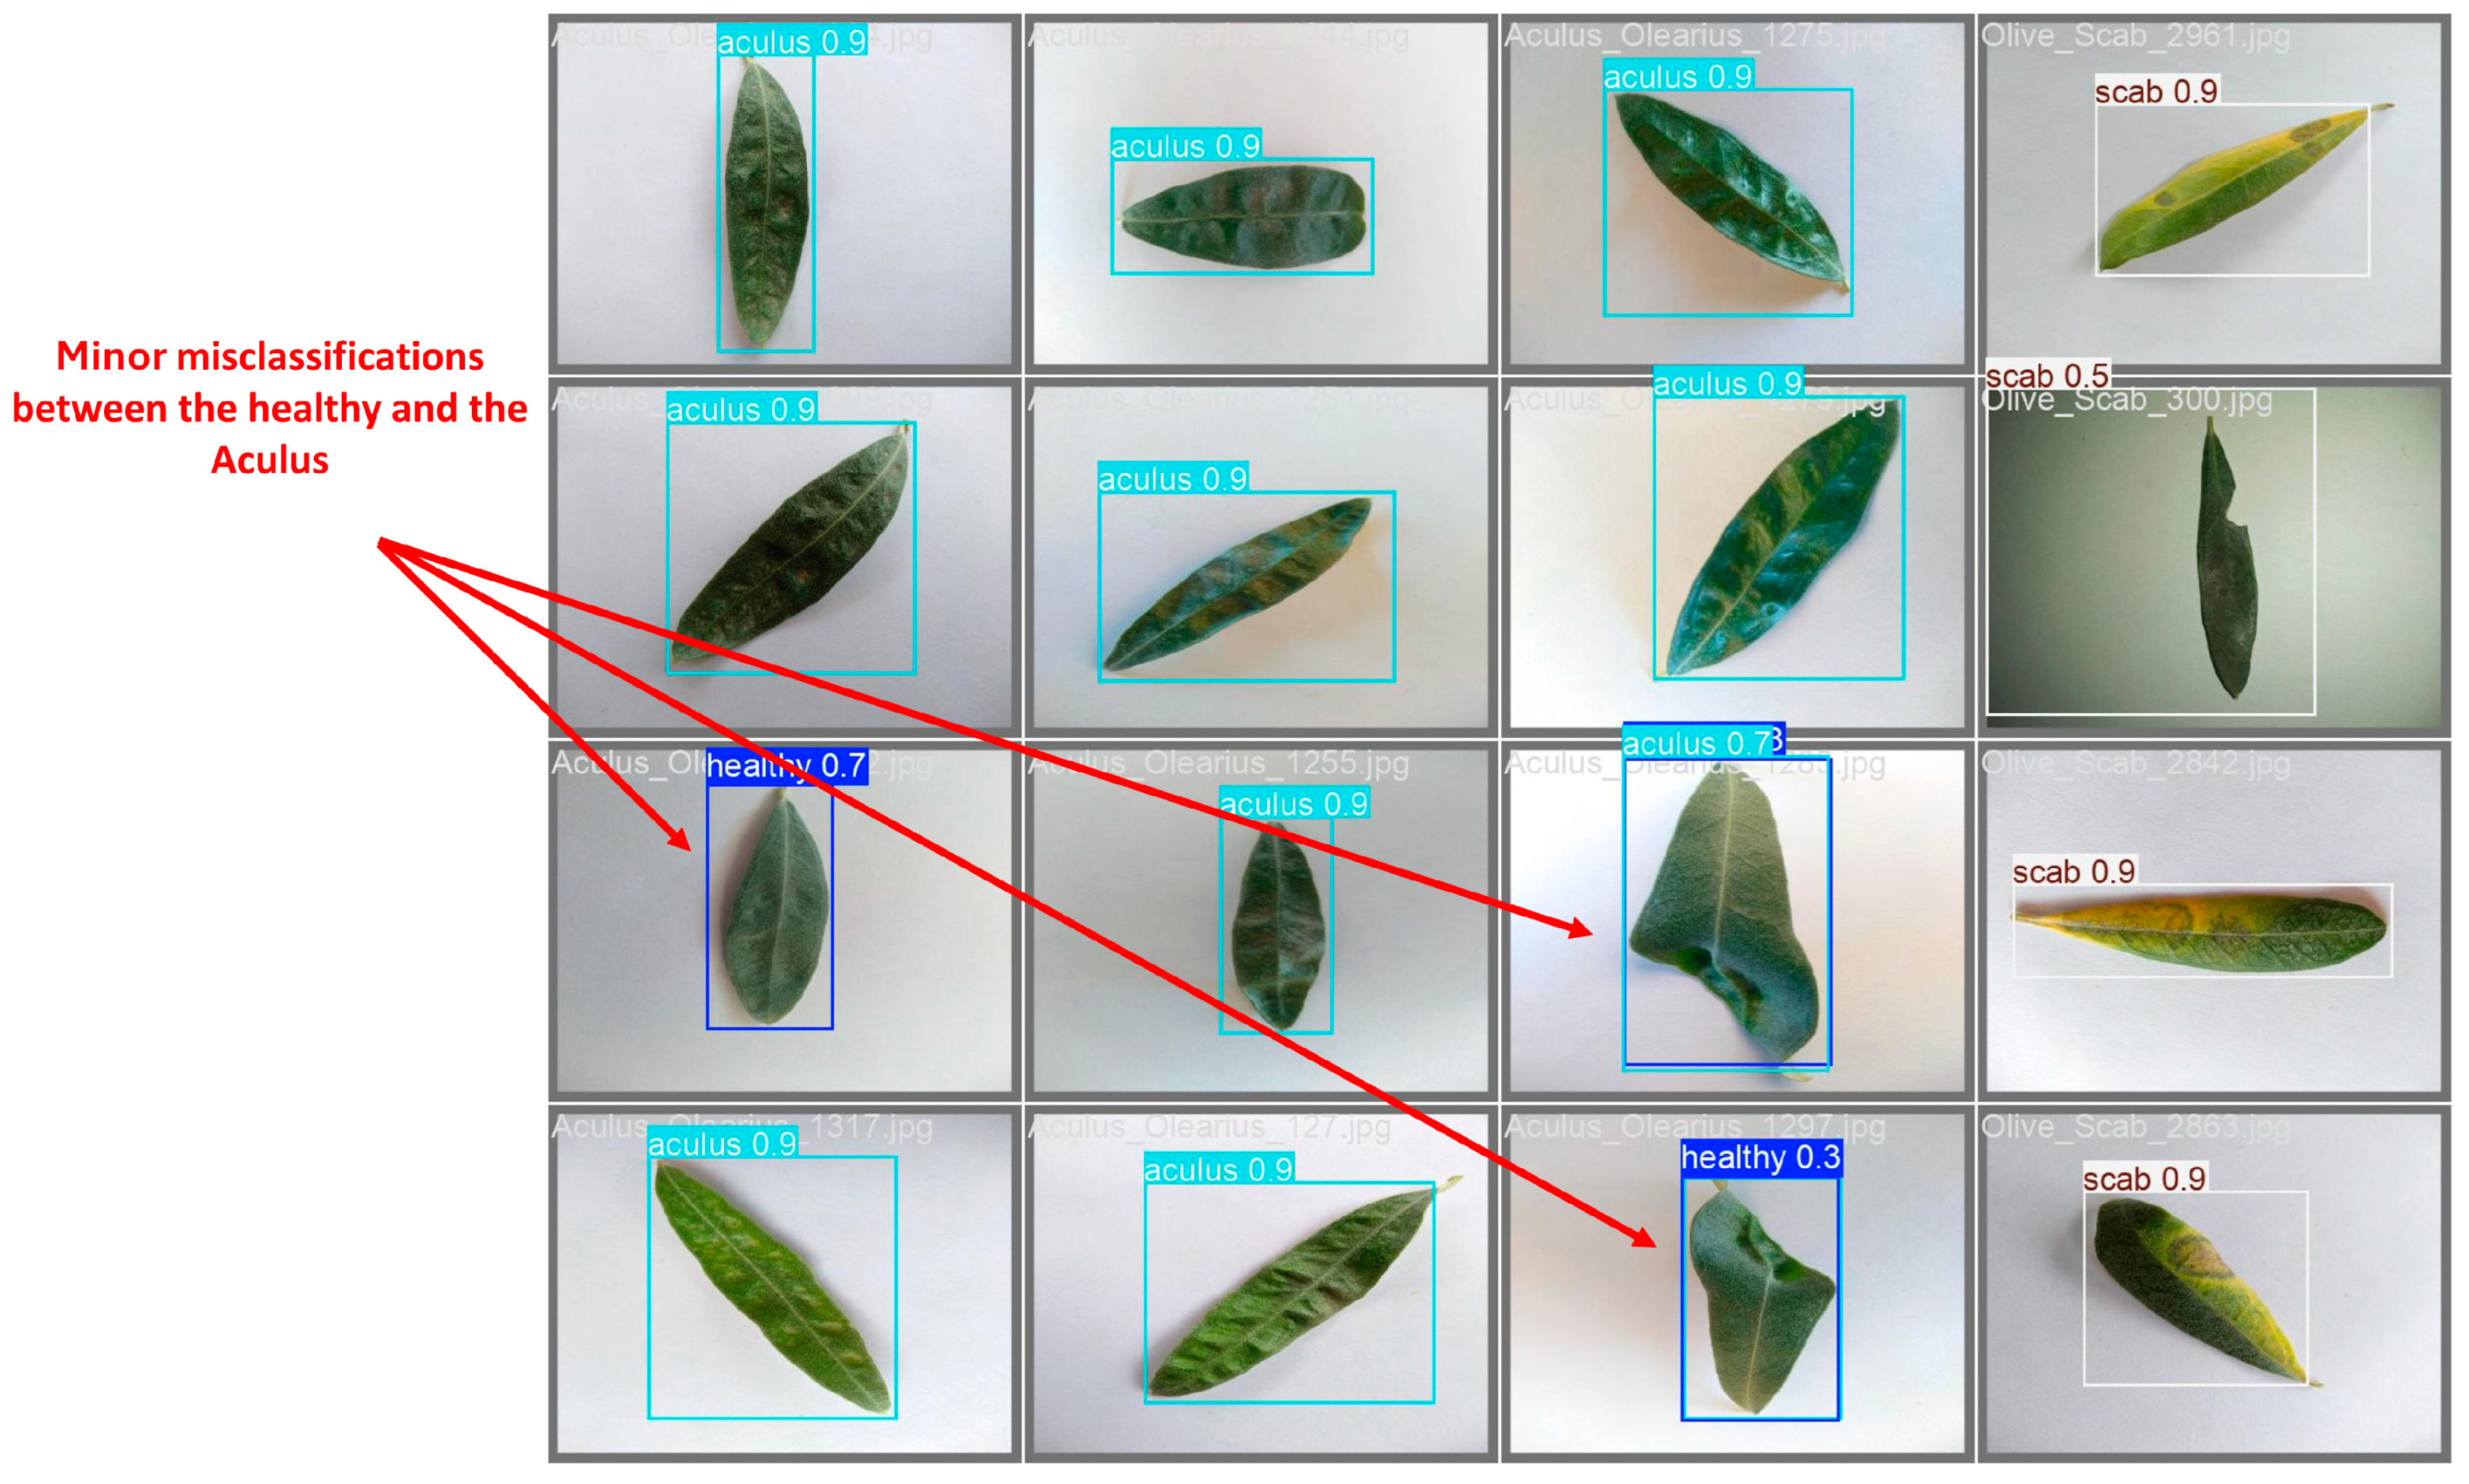
Figure 11 show correctly annotated leaves belonging to the 'aculus' and 'scab' classes. A comparison with the model's predictions,
Figure 12 reveals that the model successfully identified the majority of leaves with high confidence scores.
The presence of a few minor misclassifications and bounding box inaccuracies in this batch provides a qualitative explanation for the small performance gaps observed in the confusion matrix and other evaluation curves.
The OLIVE-CAD system was further evaluated using 1,132 real test samples distributed across four different farms, covering three major classes: Healthy (355 samples), Aculus (343 samples), and Scab (434 samples). As presented in
Table 6, the performance varied across farms and disease categories. For Farm A, the system achieved moderate recognition for Healthy leaves (63.3%), while demonstrating strong accuracy for Aculus (89.4%) and Scab (95.3%). In Farm B, the test ratio dropped significantly for Healthy leaves (51.4%), whereas Aculus and Scab detection remained consistently high (95.3% and 94.4%, respectively). Conversely, Farm C reported excellent performance on Healthy samples (92.1%) and acceptable detection for Scab (90.7%), but a sharp decline in Aculus recognition (34.1%) was observed, highlighting a critical weakness in class separation. Finally, Farm D achieved balanced and robust performance across all classes, with Healthy at 83.5%, Aculus at 93.2%, and Scab at 93.7%.
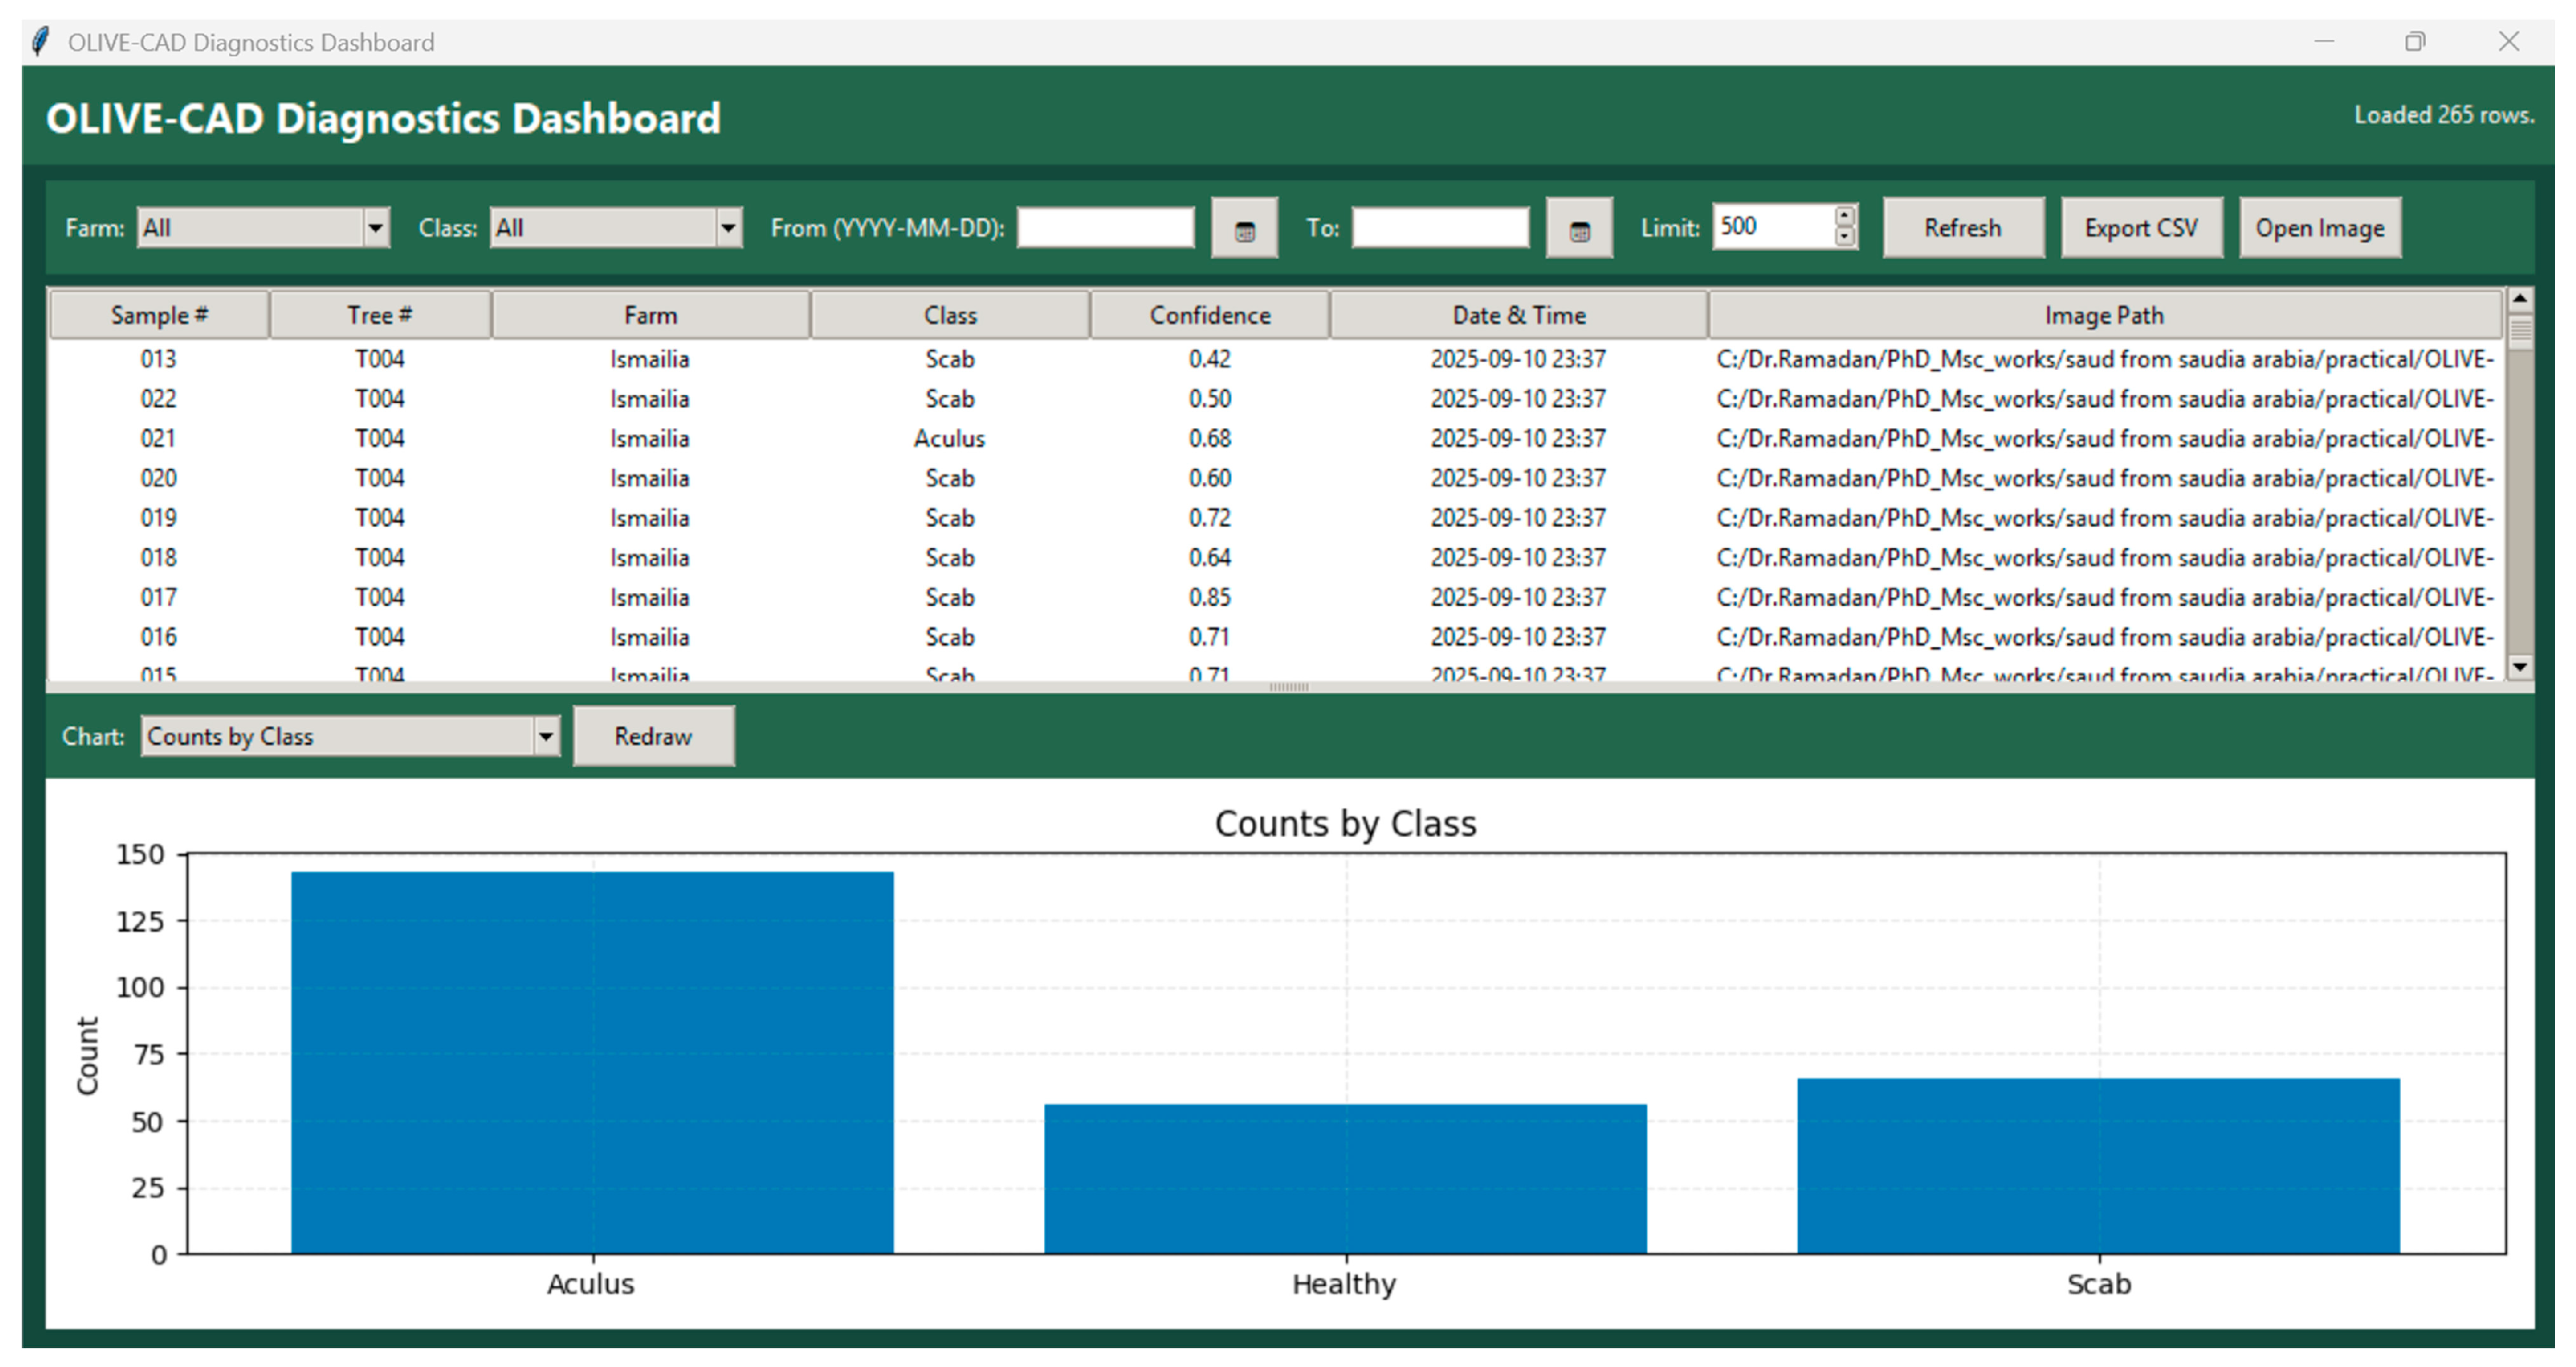
Overall, the average test ratios across farms were 72.67% for Healthy, 78.13% for Aculus, and 93.54% for Scab, confirming the system’s strong diagnostic reliability for Scab but revealing vulnerabilities in discriminating Healthy from Aculus. To ensure transparency and to validate these diagnostic outcomes, the test dataset was systematically reviewed using the OLIVE-CAD Reviewing Dashboard,
Figure 13. This review interface allowed comprehensive inspection of each processed sample by displaying its metadata, along with aggregated analytics. During the review, clear trends emerged: Aculus appeared disproportionately high in comparison to Healthy samples, while Scab remained consistently well classified. In addition, poor image quality and background noise further complicated class separation, making it difficult for the model to learn clear boundaries.
Since the annotation process was conducted directly based on the provided dataset labels, potential misplacements were inherited into the training pipeline. This highlights the urgent need for specialist review of the database to ensure accurate class labeling, improved dataset quality, and ultimately more reliable model training.
Similar limitations have been documented in prior studies, where dataset bias and mislabeling significantly impacted classification accuracy in plant disease recognition tasks [
38,
39].
4. Discussion
This paper introduced OLIVE-CAD; a novel computer-aided diagnosis system designed for the real-time, on-site identification of olive leaf diseases. The system provides a localized, end-to-end workflow that integrates a custom-built graphical user interface with a local PostgreSQL database for secure storage and review. At its core, OLIVE-CAD employs a custom-trained YOLOv12 convolutional neural network, developed on a dataset of 11,315 olive leaf images, which achieved strong baseline performance metrics, including a mean average precision of 98.2% and mean average recall of 95.4%, while the model achieves class-specific evaluation precision of 95.3% and recall of 97.7% for 'Healthy' class; 97.9% precision and 88.3% of recall for 'Aculus' class; and precision of 94.3% and 95.4% of recall for 'Scab' class. The system’s functionality was validated through a large-scale real-life evaluation of 1,132 test samples across four distinct farms. The farm-level analysis revealed variations in diagnostic accuracy: Farm A (Healthy 63.3%, Aculus 89.4%, Scab 95.3%), Farm B (Healthy 51.4%, Aculus 95.3%, Scab 94.4%), Farm C (Healthy 92.1%, Aculus 34.1%, Scab 90.7%), and Farm D (Healthy 83.5%, Aculus 93.2%, Scab 93.7%). On average, OLIVE-CAD achieved 72.67% accuracy for Healthy, 78.13% for Aculus, and 93.54% for Scab. These results confirm the system’s robustness in diagnosing Scab while also highlighting dataset-level weaknesses, particularly the misplacement of borderline samples between Healthy and Aculus. The integrated review dashboard made these flaws visible by providing class distribution analytics and on-demand inspection of results, underscoring the need for expert-reviewed dataset enhancement.
Supplementary Materials
The following supporting information can be downloaded at the website of this paper posted on Preprints.org.
Supporting information are:
Dataset: dataset download links are includes within references, [
27,
28,
29]
Dataset preparation codes: included with submission
Model Training and evaluation codes: model trained and evaluated on Kaggle platform
https://www.kaggle.com/code/ramadanmadialibakir/olive-leaf-classification-using-yoy. Code: included with submission
Trained model: included with submission
OLIVE-CAD software: included with submission
Figures: are included within submission
Author Contributions
Conceptualization, methodology, software, data analysis, discussion, writing—original draft preparation: HEM, SSA, RMAB; literature review: EAM; data downloading: RMAB; writing—review and editing: HEM, SSA, EAM, RMAB; visualization: SSA, RMAB; supervision: HEM, EAM. All authors read and approved of the final manuscript.
Funding
This research received no external funding
Data Availability Statement
dataset download links are includes within references, [
27,
28,
29].
Acknowledgments
The authors employed ChatGPT (OpenAI) for language polishing, drafting alternative figure captions, and paraphrasing selected passages (I. INTRODUCTION, literature part; II. METHODOLOGY, image annotation part). All AI-assisted text was reviewed and approved by the authors, who take full responsibility for the work. Analytical methods, experiments, and results were conceived and executed by the authors without AI-generated content. References were prepared using Mendeley.
Conflicts of Interest
“The authors declare no conflicts of interest.”
Abbreviations
The following abbreviations are used in this manuscript:
| OLIVE-CAD |
Olive Computer Aided Diagnostic system |
| HSV |
Hue-Saturation-Value |
| CNN |
Convolutional Neural Network |
| GUI |
Graphical User Interface |
References
- A. Rhouma, “Plant Diseases: Types, Causes & Impacts,” Egyptian Journal of Agricultural Sciences, vol. 76, no. 3, pp. 21–46, Jul. 2025. [CrossRef]
- C. L. Nkwocha and A. K. Chandel, “Towards an End-to-End Digital Framework for Precision Crop Disease Diagnosis and Management Based on Emerging Sensing and Computing Technologies: State over Past Decade and Prospects,” Computers 2025, Vol. 14, Page 443, vol. 14, no. 10, p. 443, Oct. 2025. [CrossRef]
- Madhavi, T. P. Singh, and S. P. Singh, “Plant Disease Detection: Comprehensive Review of Methods and Techniques,” Machine Learning for Disease Detection, Prediction, and Diagnosis, pp. 367–383, 2025. [CrossRef]
- M. Bagga and S. Goyal, “A Comparative Study of the Deep Learning Based Image Segmentation Techniques for Fruit Disease Detection,” Reviews in Agricultural Science, vol. 13, no. 1, pp. 81–104, Mar. 2025. [CrossRef]
- A. K. M. F. K. Siam, P. Bishshash, M. A. S. Nirob, S. Bin Mamun, M. Assaduzzaman, and S. R. H. Noori, “A comprehensive image dataset for the identification of lemon leaf diseases and computer vision applications,” Data Brief, vol. 58, p. 111244, Feb. 2025. [CrossRef]
- S. A. Patil, A. Bhosale, and A. Patil, “Advancements in plant leaf disease detection: a comprehensive review of latest trends and technologies,” in 2024 3rd International Conference for Innovation in Technology (INOCON), IEEE, 2024, pp. 1–5.
- S. K. Borah, M. Padhiary, L. N. Sethi, A. Kumar, and P. Saikia, “Precision Farming with Drone Sprayers: A Review of Auto Navigation and Vision-Based Optimization,” Journal of Biosystems Engineering 2025 50:2, vol. 50, no. 2, pp. 255–273, May 2025. [CrossRef]
- J. J. Liu, H. Wu, and I. Riaz, “Advanced Technologies for Smart Fertilizer Management in Agriculture: A Review,” IEEE Access, vol. 13, pp. 139766–139790, 2025. [CrossRef]
- D. A. Anagnostopoulos and D. Tsaltas, “Current status, recent advances, and main challenges on table olive fermentation: The present meets the future,” Front Microbiol, vol. 12, p. 797295, 2022.
- A. J. Huertas-Alonso et al., “Table olive wastewater as a potential source of biophenols for valorization: A mini review,” Fermentation, vol. 8, no. 5, p. 215, 2022.
- A. Benítez-Cabello, A. M. Delgado, and C. Quintas, “Main challenges expected from the impact of climate change on microbial biodiversity of table olives: current status and trends,” Foods, vol. 12, no. 19, p. 3712, 2023.
- I. Alrashdi and A. Abozeid, “An efficient deep-learning model for olive tree diseases diagnosis in Al-Jouf region,” Alexandria Engineering Journal, vol. 130, pp. 709–723, Oct. 2025. [CrossRef]
- S. Chouchf, W. Zarrik, and A. E. B. El Alaoui, “A Comparison of Quantization Techniques for Mobile Olive Disease Detection,” in 2025 5th International Conference on Innovative Research in Applied Science, Engineering and Technology (IRASET), IEEE, 2025, pp. 1–5.
- E. Jain and A. Singh, “Olive Leaf Disease Classification Using the Xception Model: A Deep Learning Approach,” in 2024 International Conference on Cybernation and Computation (CYBERCOM), IEEE, 2024, pp. 715–719.
- K. U. Majikumna, M. Zineddine, and A. E. H. Alaoui, “FLVAEGWO-CNN: Grey Wolf Optimisation-Based CNN for Classification of Olive Leaf Disease via Focal Loss Variational Autoencoder,” Journal of Phytopathology, vol. 172, no. 6, p. e13438, 2024.
- A. Diker et al., “An effective feature extraction method for olive peacock eye leaf disease classification,” European Food Research and Technology, vol. 250, no. 1, pp. 287–299, 2024.
- S. Huaquipaco et al., “Peacock spot detection in olive leaves using self supervised learning in an assembly meta-architecture,” IEEE Access, 2024.
- I. F. Kallel, M. Kallel, K. Kammoun, M. Salhi, and M. A. Triki, “Deep learning models for automatic detection and classification of pathogens in olive leaves,” in 2024 4th International Conference on Innovative Research in Applied Science, Engineering and Technology (IRASET), IEEE, 2024, pp. 1–6.
- M. Dammak, A. Makhloufi, B. Louati, and A. Kallel, “Detection and Classification of Olive Leaves Diseases Using Machine Learning Algorithms,” in International Conference on Computational Collective Intelligence, Springer, 2024, pp. 292–304.
- E. Guermazi, A. Mdhaffar, M. Jmaiel, and B. Freisleben, “LIDL4Oliv: A Lightweight Incremental Deep Learning Model for Classifying Olive Diseases in Images.,” in ICAART (2), 2024, pp. 583–594.
- A. Ksibi, M. Ayadi, B. O. Soufiene, M. M. Jamjoom, and Z. Ullah, “MobiRes-net: a hybrid deep learning model for detecting and classifying olive leaf diseases,” Applied Sciences, vol. 12, no. 20, p. 10278, 2022.
- H. Hamdaoui, Y. Zarrouk, N.-E. Kouddane, Y. Hsana, H. AL Kaddouri, and F. Chkird, “A Deep Learning-Based Model for Efficient Olive Leaf Disease Classification,” in International Conference on Electronic Engineering and Renewable Energy Systems, Springer, 2024, pp. 477–487.
- I. Pacal, S. Kilicarslan, B. Ozdemir, M. Deveci, and S. Kadry, “Efficient and autonomous detection of olive leaf diseases using AI-enhanced MetaFormer,” Artificial Intelligence Review 2025 58:10, vol. 58, no. 10, pp. 1–35, Jul. 2025. [CrossRef]
- “View of Olive Leaf Disease Detection using Improvised Machine Learning Techniques.” Accessed: Nov. 12, 2025. [Online]. Available: https://semarakilmu.my/index.php/sijml/article/view/239/304.
- F. M. Talaat, M. Y. Shams, S. A. Gamel, and H. ZainEldin, “DeepLeaf: an optimized deep learning approach for automated recognition of grapevine leaf diseases,” Neural Computing and Applications 2025 37:15, vol. 37, no. 15, pp. 8799–8823, Feb. 2025. [CrossRef]
- F. Rahman and K. S. Raghatate, “Smart Agriculture: Predicting Diseases in olive using Deep Learning Algorithms,” SHS Web of Conferences, vol. 216, p. 01009, 2025. [CrossRef]
- “Olive Leaf Image Dataset.” Accessed: Aug. 12, 2025. [Online]. Available: https://www.kaggle.com/datasets/habibulbasher01644/olive-leaf-image-dataset.
- “Olive Leaf Disease Detection.” Accessed: Aug. 12, 2025. [Online]. Available: https://www.kaggle.com/code/mahmoudlimam/olive-leaf-disease-detection/input.
- “Olive Leaf Disease.” Accessed: Aug. 12, 2025. [Online]. Available: https://www.kaggle.com/datasets/serhathoca/zeytin.
- M. Bagga and S. Goyal, “A Comparative Study of the Deep Learning Based Image Segmentation Techniques for Fruit Disease Detection,” Reviews in Agricultural Science, vol. 13, no. 1, pp. 81–104, 2025.
- H. Hamzaoui et al., “Assessment of Peacock Spot Disease (Fusicladium oleagineum) in Olive Orchards Through Agronomic Approaches and UAV-Based Multispectral Imaging,” Horticulturae, vol. 11, no. 1, p. 46, 2025.
- B. Lee, H. Lee, X. Sun, U. Ali, and E. Park, “Deblurring 3d gaussian splatting,” in European Conference on Computer Vision, Springer, 2024, pp. 127–143.
- C. Wu, D. Wang, and K. Huang, “Enhancement of mine images based on hsv color space,” IEEE Access, vol. 12, pp. 72170–72186, 2024.
- J. Bayón, J. Recas, and M. Guijarro, “An optimized, color-adaptive blue light filtering approach using a novel color space transformation,” Displays, vol. 90, p. 103124, 2025.
- M. L. Ali and Z. Zhang, “The YOLO Framework: A Comprehensive Review of Evolution, Applications, and Benchmarks in Object Detection,” Computers 2024, Vol. 13, Page 336, vol. 13, no. 12, p. 336, Dec. 2024. [CrossRef]
- R. Sapkota, Z. Meng, M. Churuvija, X. Du, Z. Ma, and M. Karkee, “Comprehensive performance evaluation of yolov12, yolo11, yolov10, yolov9 and yolov8 on detecting and counting fruitlet in complex orchard environments,” arXiv preprint arXiv:2407.12040, 2024.
- N. Jegham, C. Y. Koh, M. Abdelatti, and A. Hendawi, “Yolo evolution: A comprehensive benchmark and architectural review of yolov12, yolo11, and their previous versions,” arXiv preprint arXiv:2411.00201, 2024.
- S. P. Mohanty, D. P. Hughes, and M. Salathé, “Using deep learning for image-based plant disease detection,” Front Plant Sci, vol. 7, p. 215232, 2016.
- K. P. Ferentinos, “Deep learning models for plant disease detection and diagnosis,” Comput Electron Agric, vol. 145, pp. 311–318, 2018.
Figure 1.
Methodology for OLIVE-CAD System Development and Deployment.
Figure 1.
Methodology for OLIVE-CAD System Development and Deployment.
Figure 2.
Healthy, Aculus olearius, and Peacock spot leaves.
Figure 2.
Healthy, Aculus olearius, and Peacock spot leaves.
Figure 3.
Step-by-step procedure for the code-based bounding box annotation.
Figure 3.
Step-by-step procedure for the code-based bounding box annotation.
Figure 4.
Visual examples of the output from the automated annotation process.
Figure 4.
Visual examples of the output from the automated annotation process.
Figure 5.
Sample Annotated Olive Leaf Images with YOLO Label Details.
Figure 5.
Sample Annotated Olive Leaf Images with YOLO Label Details.
Figure 6.
OLIVE-CAD GUI of the OLIVE-CAD software.
Figure 6.
OLIVE-CAD GUI of the OLIVE-CAD software.
Figure 7.
YOLOV12 of OLIVE-CAD training and validation metrics
Figure 7.
YOLOV12 of OLIVE-CAD training and validation metrics
Figure 8.
Normalized confusion matrix for trained model
Figure 8.
Normalized confusion matrix for trained model
Figure 9.
Confidence-based evaluation profiles showing how performance varies with threshold selection.
Figure 9.
Confidence-based evaluation profiles showing how performance varies with threshold selection.
Figure 10.
Training batches.
Figure 10.
Training batches.
Figure 11.
Validation batch label.
Figure 11.
Validation batch label.
Figure 12.
Validation Batch Predictions, showing bounding boxes, labels, and confidence scores.
Figure 12.
Validation Batch Predictions, showing bounding boxes, labels, and confidence scores.
Figure 13.
The OLIVE-CAD review GUI dashboard used for systematic evaluation of diagnostic results.
Figure 13.
The OLIVE-CAD review GUI dashboard used for systematic evaluation of diagnostic results.
Table 1.
Summary of kay literature in olive leaf disease detection.
Table 1.
Summary of kay literature in olive leaf disease detection.
| Ref |
Year |
Dataset |
CAD design |
Data storage/review |
Performance % |
| [14] |
2024 |
Aculus, Scab, Healthy |
No |
No |
99.72 |
| [15] |
2024 |
Olive leaf diseases (multi-class) |
No |
No |
93 |
| [16] |
2024 |
Scab vs Healthy |
No |
No |
99 |
| [17] |
2024 |
Scab |
No |
No |
97.55 |
| [18] |
2024 |
Olive leaf pathogens (multi-class) |
No |
No |
99.2 |
| [19] |
2024 |
Olive leaf diseases (multi-class) |
No |
No |
98.63 |
| [20] |
2024 |
Aculus, Peacock spot, Healthy |
Yes |
No |
95.22 |
| [21] |
2024 |
Healthy, Aculus, Scab, Peacock |
No |
No |
94 |
| [22] |
2024 |
Olive leaf diseases (multi-class) |
No |
No |
89 |
| [23] |
2025 |
healthy and infected |
No |
No |
99.31 |
| [24] |
2025 |
healthy and infected |
NO |
NO |
98.2 |
| [25] |
2025 |
healthy and unhealthy |
NO |
NO |
99.7% |
| [26] |
2025 |
healthy and infected |
NO |
NO |
94% |
Table 2.
detailed composition of the olive leaf disease dataset.
Table 2.
detailed composition of the olive leaf disease dataset.
| Dataset |
Ref |
Source |
Total |
Healthy |
Aculus |
Scab |
Total |
| Dataset1 |
[27] |
Kaggle |
3400 |
1,050 |
1,460 |
890 |
11315 |
| Dataset2 |
[28] |
Kaggle |
6961 |
1,926 |
1,778 |
3,257 |
| Dataset3 |
[29] |
Kaggle |
954 |
572 |
382 (one file, manually separated) |
Table 3.
breaking down of the olive leaf dataset samples into training, testing, and evaluation subsets.
Table 3.
breaking down of the olive leaf dataset samples into training, testing, and evaluation subsets.
| Samples |
Subset |
Percentage |
Samples |
Description |
| 11315 |
Training |
70% |
7920 |
Train YOLOv12 model. |
| Evaluation |
20% |
2263 |
YOLOv12 model evaluation |
| Test |
10% |
1132 |
YOLOv12 model real-world testing |
Table 4.
YOLOV12 annotation label file format.
Table 4.
YOLOV12 annotation label file format.
| Field |
Description |
Range |
| Class Id |
object class. |
0, 1, 2 |
| X-center |
Normalized X-coordinate of center point |
0.0 - 1.0 |
| Y-center |
Normalized Y-coordinate of center point |
0.0 - 1.0 |
| Width |
Normalized width |
0.0 - 1.0 |
| Height |
Normalized height |
0.0 - 1.0 |
Table 5.
portioning test dataset for real life application test.
Table 5.
portioning test dataset for real life application test.
| Test dataset |
Olive disease |
Farm A (25%) |
Farm B (25%) |
Farm C (25%) |
Farm D (25%) |
| 1132 sample |
Healthy |
355 |
88 |
88 |
88 |
91 |
| Aculus |
343 |
85 |
85 |
85 |
88 |
| Scab |
434 |
108 |
108 |
108 |
110 |
Table 6.
real time Farms model test results.
Table 6.
real time Farms model test results.
| Test dataset |
1132 sample |
| Olive disease |
Healthy |
Aculus |
Scab |
| 355 sample |
343 sample |
434 sample |
| Farm A |
Original |
88 |
85 |
108 |
| Predicted |
56 |
76 |
103 |
| Missed |
32 |
9 |
5 |
| Test ratio |
63.3% |
89.4% |
95.3% |
| Farm B |
Original |
88 |
85 |
108 |
| Predicted |
45 |
81 |
102 |
| Missed |
43 |
4 |
6 |
| Test ratio |
51.4% |
95.3% |
94.4% |
| Farm C |
Original |
88 |
85 |
108 |
| Predicted |
81 |
29 |
98 |
| Missed |
7 |
56 |
10 |
| Test ratio |
92.1% |
34.1% |
90.7% |
| Farm D |
Original |
91 |
88 |
110 |
| Predicted |
76 |
82 |
103 |
| Missed |
15 |
6 |
7 |
| Test ratio |
83.5% |
93.2% |
93.7 |
| Average test ratio |
72.67% |
78.13% |
93.54% |
|
Disclaimer/Publisher’s Note: The statements, opinions and data contained in all publications are solely those of the individual author(s) and contributor(s) and not of MDPI and/or the editor(s). MDPI and/or the editor(s) disclaim responsibility for any injury to people or property resulting from any ideas, methods, instructions or products referred to in the content. |
© 2025 by the authors. Licensee MDPI, Basel, Switzerland. This article is an open access article distributed under the terms and conditions of the Creative Commons Attribution (CC BY) license (http://creativecommons.org/licenses/by/4.0/).