
Submitted:
10 February 2025
Posted:
10 February 2025
You are already at the latest version
Abstract
The detection and identification of tea leaf diseases and pests play a crucial role in determining the yield and quality of tea. However, the high similarity between different tea leaf diseases and the difficulty of balancing model accuracy and complexity pose significant challenges during the detection process. This study proposes an enhanced Tea Leaf Disease Detection Model (TLDDM), an improved model based on YOLOv8 to tackle the challenges. Initially, the C2f-Faster-EMA module is employed to reduce the number of parameters and model complexity while enhancing image feature extraction capabilities. Furthermore, the Deformable Attention mechanism is integrated to improve the model's adaptability to spatial transformations and irregular data structures. Moreover, the slim neck structure is incorporated to reduce the model scale. Finally, a novel detection head structure, termed EfficientPHead, is proposed to maintain detection performance while improving computational efficiency and reducing parameters which leads to inference speed acceleration. Experimental results demonstrate that the TLDDM model achieves an AP of 98.0%, which demonstrates a significant performance enhancement compared to the SSD and Faster R-CNN algorithm. Furthermore, the proposed model is not only of great significance in improving the performance in accuracy, but also can provide remarkable advantages in real-time detection applications with an FPS (frames per second) of 58.0.
Keywords:
tea leaf disease detection
; YOLOv8
; C2f-Faster-EMA
; deformable attention
; slimneck
; EfficientPHead
1. Introduction
Tea holds a significant place as a traditional beverage. However, tea cultivation faces significant threats from plant diseases and pests, which in turn hinder the quality and quantity of production [1]. The rapid and precise detection of such issues enables the implementation of effective prevention and management strategies. Currently, the identification of diseases and pests largely relies on manual inspection which is both time-consuming and costly [2].
With the development of computer vision technologies, researchers have initiated the application of image processing and machine learning techniques for the detection of crop diseases and pests. Bauriegel et al. [3] utilized spectral angle mapping with hyperspectral imaging (HSI) systems to detect Fusarium head blight in wheat. Sethy et al. [4] employed deep features combined with a support vector machine (SVM) model for the identification of rice leaf diseases. Behmann et al. [5] distinguished well-irrigated plants from those subjected to drought stress using ordinal classification with SVMs to HSI. Xie et al. [6] leveraged K-nearest neighbor and C5.0 models with HSI for classifying healthy and Botrytis-infected tomato leaves. Zhang et al. [7] proposed a method for cucumber disease identification based on leaf images, integrating K-means clustering and sparse representation classification. Hossain et al. [8] developed an image processing system that employed an SVM classifier capable of identifying and categorizing brown spots and algae leaf diseases, distinguishing them from healthy leaves. Sun et al. [9] introduced an innovative approach that combined simple linear iterative clustering (SLIC) with SVMs, enabling the precise extraction of saliency maps for tea leaf diseases under complex backgrounds. In summary, classical machine learning methods for plant disease detection usually require manual feature extraction, thereby significantly reducing the accuracy of disease diagnosis.
In recent years, the rapid evolution of deep learning technologies has prompted an increasing number of researchers to explore the technique for detecting crop leaf diseases and pests. Breakthroughs in image recognition have facilitated the widespread application of convolutional neural networks (CNNs) in the automated classification and identification. Chen et al. [10] proposed a CNN model named LeafNet, specifically designed to automatically extract features related to tea plant diseases from images. Hu et al. [11] introduced a few-shot learning approach utilizing SVMs to isolate diseased regions in tea leaf photographs. They further addressed the issue of limited sample sizes by employing an enhanced C-DCGAN. Moreover, Hu et al. [12] presented a detection model based on the CIFAR10-quick framework, incorporating multi-scale feature extraction modules and depthwise separable convolutions to improve performance. Jiang et al. [13] employed CNNs to extract image features of rice leaf diseases and used SVMs to classify and predict specific diseases. CNN-based methods for tea disease identification have demonstrated significant advantages over traditional machine learning approaches. While promising, these methods primarily focus on the recognition and classification, rather than addressing comprehensive disease management.
Deep learning-based image detection networks can be divided into one-stage and two-stage detection networks [14]. The region-based Faster R-CNN [15] is one of the two-stage detection networks. Zhou et al. proposed a rice disease detection algorithm based on the fusion of Faster R-CNN and FCM-KM, which achieved relatively favorable performance [16]. Despite its high detection accuracy, the slower processing speed of Faster R-CNN renders it unsuitable for real-time applications. In contrast, one-stage detection networks are more efficient, though they may sacrifice some accuracy. Representative one-stage detectors include You Only Look Once (YOLO), Single Shot MultiBox Detector (SSD) [17], and RetinaNet [18]. Among these, the YOLO series has gained widespread adoption in agricultural applications due to its efficient and accurate detection capabilities [19,20,21,22]. Tian et al. designed a YOLOv3-based system capable of real-time detection of apples at three distinct growth stages in orchards [23,24]. Roy et al. developed a high-performance real-time fine-grained detection framework to tackle challenges such as dense distributions and irregular shapes [25]. Building on YOLOv4 [26], Sun et al. introduced an innovative approach leveraging the YOLOv4 deep learning network for ITC segmentation, refining overlapping crown segmentation results using computer graphics algorithms [27]. Dai et al. proposed a YOLOv5-based crop disease detection method, called YOLOv5-CAcT [28]. Hoang et al. presented a hybrid model combining Autoencoder with YOLOv6 for the identification of poultry diseases [29]. Zhao et al. introduced a lightweight version, LW-YOLOv7, based on YOLOv7, designed for real-time detection of maize seedlings in field environments[30]. While the YOLO series has seen extensive use in crop disease and pest detection, its application in detecting tea leaf diseases and pests remains relatively underexplored.
To address this gap, this study proposes a model named TLDDM, which is a tea disease detection system based on an improved YOLOv8 framework. The main contributions of this study are as follows: (1) the traditional YOLOv8 backbone’s C2f module is replaced with the C2f-Faster-EMA module. (2) Deformable Attention is introduced at the end of the backbone structure. (3) Slimneck components, including Generalized-Sparse Convolution (GSConv) and Vector of Visual Geometry Group and Scene Parsing (VoVGSCSP), are embedded into the Neck network of the original algorithm. (4) The detection head of YOLOv8 is restructured into EfficientPHead, achieving a well-balanced trade-off between model performance, speed, and size.
2. Materials and Methods
2.1. Dataset Collection
This study utilizes the publicly available dataset Tea_Leaf_Disease for model training. The dataset comprises a total of 5,867 images, categorized into six classes, adhering to the COCO128 format. Among them, there are 1,000 photos of algal leaf spot, 867 photos of brown blight, 1,000 photos of gray blight, 1,000 photos of healthy, 1,000 photos of helopeltis, and 1,000 photos of redspot.
Each image is labeled with the corresponding class name: algal spot, brown blight, gray blight, healthy, helopeltis, or redspot. Representative samples from the dataset are illustrated in Figure 1.
The dataset is randomly divided in a ratio of 7:1:2. The detailed information of the dataset is shown in Table 1.
2.2. TLDDM Model
2.2.1. YOLOv8 Model
YOLOv8 is a versatile framework that integrates multiple tasks, including object detection, instance segmentation, and keypoint detection. The model offers five variants—n, s, m, l, and x—all of which share a unified network architecture.
The YOLOv8 network is comprised of four primary components: input, backbone, neck, and output. The input stage includes Mosaic data augmentation, adaptive anchor box computation, and adaptive grayscale padding. The backbone consists of Conv, C2f, and SPPF structures, with the C2f module serving as the core unit for learning residual features. This module is inspired by the Efficient Layer Aggregation Network (ELAN) structure introduced in YOLOv7. By incorporating additional branched cross-layer connections, the gradient flow is enriched, resulting in a neural network module with enhanced feature representation capabilities. YOLOv8 also features an optimized Spatial Pyramid Pooling-Fast (SPPF) module. This enhancement significantly accelerates training, reduces redundant gradient information, and strengthens the network’s learning capacity. The neck module adopts the Path Aggregation Network (PAN) structure, improving the network's ability to fuse features from objects at varying scales. The output stage decouples the classification and detection processes, including loss computation and object detection box filtering. For loss computation, the network utilizes positive and negative sample assignment strategies, and the loss calculation process includes two branches: classification and regression, without an objectness branch. The classification branch continues to utilize BCE loss, while the regression branch incorporates both Distribution Focal Loss and Complete Intersection over Union (CIOU) loss. The enhanced YOLOv8 network architecture proposed in this study is illustrated in Figure 2.
2.2.2. C2f-faster-EMA
YOLOv8 replaces the C3 module with the C2f module to achieve high-quality image feature extraction and down sampling. However, this substitution also increases the model's parameter count and complexity. To enhance training and inference speed, inspired by the concept of partial convolution (PConv), the FasterNet [31] module is used to replace the bottleneck in the C2f module, enabling efficient spatial feature extraction.
The C2f module leverages multiple bottleneck operations to obtain richer gradient information. Each bottleneck consists of two 1×1 convolution layers and one 3×3 convolution layer, performing dimension reduction, convolution, and dimension expansion on the input. However, this approach involves a large number of floating-point operations. To reduce the floating-point operations per second (FLOPS), the FasterNet block incorporates PConv, minimizing memory access and computational redundancy. PConv applies regular convolution to extract spatial features from a portion of the input channels while keeping the remaining channels unchanged [32]. The FLOPS of PConv is calculated as follows:
 where h and w represent the width and height of the feature map, respectively; k is the kernel size; and cp denotes the number of channels involved in the convolution operation. Typically, cp equals one-fourth of the channels used in standard convolution. Consequently, the FLOPS of PConv are merely 1/16 of those in standard convolution.
where h and w represent the width and height of the feature map, respectively; k is the kernel size; and cp denotes the number of channels involved in the convolution operation. Typically, cp equals one-fourth of the channels used in standard convolution. Consequently, the FLOPS of PConv are merely 1/16 of those in standard convolution.FasterNet is constructed based on PConv. It comprises four hierarchical stages, each preceded by an embedding layer (a standard 4×4 convolution with stride 4) or a merging layer (a standard 2×2 convolution with stride 2) for spatial downsampling and channel expansion. Each stage consists of a stack of FasterNet blocks. Each block contains a PConv layer followed by two 1×1 convolution layers. Batch normalization and ReLU are employed as normalization and activation layers, effectively reducing FLOPS [33].
To enhance pixel-level dependencies, attention mechanisms such as the CBAM [34] and SE [35] modules have been introduced into convolutional neural networks, demonstrating improvements in object detection and recognition performance. However, these attention modules involve manual design and a significant number of pooling operations, which substantially increase computational demands. For the tea tree leaf pest and disease dataset, this model integrates an Efficient Multi-scale Attention (EMA) module into the YOLOv8 C2f-Faster module.
EMA is an innovative and efficient multi-scale attention module that eliminates the need for dimensionality reduction. By reshaping a portion of the channels into the batch dimension and grouping the channel dimension into multiple sub-features, it achieves uniform distribution of spatial semantic features within each feature group.
Building on the original YOLOv8 network, this study replaces the C2f module with the C2f-Faster-EMA module, as illustrated in Figure 3. This improvement reduces floating-point operations during the feature extraction process within the backbone network. Additionally, the attention mechanism is integrated into the forward propagation process to enhance the accuracy of target detection and the capability of image feature extraction [36].
2.2.3. Deformable Attention
Deformable Attention is an attention mechanism in deep learning designed to handle images, videos, and other structured data effectively. The core idea of Deformable Attention is to adapt the attention mechanism to focus more flexibly on specific regions of the input data rather than relying solely on fixed, regular data structures. This flexibility is achieved by dynamically selecting subsets of input features, enhancing the model's adaptability to spatial transformations and irregular data structures.
In standard Transformer models, the Self-Attention mechanism allows the model to consider the entire sequence while processing each element by computing attention weights across all elements. However, this approach may be suboptimal for data with complex spatial structures (e.g., images), as correlations in images often exhibit locality and can dynamically change with object movement and deformation.
Deformable Attention addresses this issue by introducing deformable sampling positions. Instead of uniformly computing attention weights across all positions, it dynamically selects a set of key positions (or sampling points) based on the input features and computes attention weights only at these positions. This enables the model to focus more precisely on significant regions within an image, improving both efficiency and performance.
The implementation of Deformable Attention involves several steps. First and foremost, the model learns a set of offsets which determine the sampling point locations for the input feature map. These offsets are dynamically computed based on the input features, allowing the model to adapt to variations in the input data and selecting key positions of interest. Secondly, attention weights are calculated based on the sampled features, which are then used to aggregate information. Finally, the model applies the calculated attention weights to the sampled features, generating the output feature map. This output is utilized in subsequent tasks such as classification, detection, or segmentation. This approach significantly improves efficiency and effectiveness in handling vision tasks with complex spatial structures and dynamic variations [37]. Figure 4 illustrates the Deformable Attention module.
This approach enables us to effectively leverage the information from the input feature map while maintaining training stability, providing precisely adjusted reference points and associated features for subsequent processing steps.
The advantage of Deformable Attention lies in its adaptability to the input data, allowing it to handle spatial variations and irregular structures within images effectively. This flexibility makes it particularly well-suited for visual tasks, where it consistently delivers outstanding performance. Moreover, by reducing the number of positions where attention weights need to be computed, Deformable Attention enhances computational efficiency. Overall, Deformable Attention offers an efficient and flexible mechanism for addressing complex visual tasks, significantly enhancing the performance of deep learning models across a broad range of vision-related challenges.
2.2.4. Slimneck
In YOLOv8, the Neck network is strategically placed between the Backbone and the Head to optimize the use of features extracted by the Backbone and facilitate effective feature fusion. It employs a PANet dual pyramid structure, which enhances the feature integration process. The traditional Feature Pyramid Network (FPN) transmits rich semantic features from the top to the bottom, thereby strengthening the entire pyramid. However, FPN focuses solely on enhancing semantic information and does not address the transfer of localization information. PANet overcomes this limitation by introducing a bottom-up pyramid, which has shallower convolutional layers and larger spatial size, alongside the conventional FPN, then forming a dual pyramid structure. PANet employs a path aggregation strategy to enhance the representation of strong localization features from lower layers.
To achieve an optimal balance between lightweight architecture and detection accuracy in YOLOv8, this study employs the Slim-Neck module. This module ensures a lightweight design while simultaneously enhancing detection performance. Key components such as GSConv and VoVGSCSP from the Slim-Neck module are integrated into the original algorithm's Neck network.
The GSConv workflow begins by sub-sampling the input using standard convolution (SC), followed by depthwise convolution (DWConv) [38]. And the outputs of SC and depthwise separable convolution (DSC) are concatenated. A uniform mixing strategy is then applied via a Shuffle operation, which randomly rearranges ordered data samples, ensuring that each sample has an equal probability of belonging to either data type when read sequentially. GSConv retains the feature extraction capability of standard convolution while leveraging the parameter-reduction advantages of DSC. The structural design of GSConv is illustrated in Figure 5.
To accelerate algorithm inference and prediction, the input image undergoes a transformation process within the Backbone network. As the spatial dimensions of the feature map decrease, the number of channels increases, which may lead to a loss of semantic information. The time complexities of SC, DSC, and GSConv are as follows:
GSConv demonstrates significant advantages in lightweight models. By integrating the DSC layer with the Shuffle operation, it enhances the model's nonlinear representation capability. However, if GSConv is extensively applied in the model, it may result in an excessively deep network, thereby restricting data flow and increasing inference time. Consequently, GSConv is exclusively employed in the Neck component, where the received feature maps have the highest number of channels and the smallest spatial dimensions. In this scenario, the feature maps contain minimal redundant information and do not require additional compression, enabling the attention module to function more effectively.
Furthermore, in order to enhance the learning capacity of CNNs, and reduce computational complexity, while ensuring sufficient model accuracy, this study employs the VoVGSCSP module in the Neck section, replacing the CSP module. This adjustment results in an average reduction of FLOPs by 15.72%. The VoVGSCSP module integrates several concepts from DenseNet, VoVNet, and CSPNet [39]. As illustrated in Figure 6, it adopts the lightweight convolution technique GSConv to replace SC and further incorporates the GSbottleneck on top of GSConv. This enhancement improves the model's learning ability, and reduces computational complexity while maintaining sufficient accuracy.
2.2.5. EfficientPHead: A Lightweight Detection Head
YOLOv8 employs a decoupled head structure, which separates the classification and localization tasks to optimize the loss function and improve detection performance. However, this design introduces increased training complexity and difficulty. Furthermore, it necessitates fine-tuning a greater number of hyperparameters and training strategies to ensure the effective collaboration between the classification and localization heads. The decoupling of these tasks may also lead to an imbalance in training samples, which can negatively impact the model’s ability to detect rare classes or challenging samples. Additionally, the increased network complexity can result in slower inference speeds, particularly in resource-constrained environments.
Although the decoupled head structure enhances performance in object detection tasks, it still presents challenges and limitations. To address the dual requirements of lightweight design and detection accuracy for a tea leaf pest and disease detection model, this study reconstructs YOLOv8’s detection head by introducing a novel structure called EfficientPHead, as shown in Figure 7.
By using PConv, the model’s parameter count is reduced since only a portion of the input channels is processed, effectively lowering model complexity and mitigating the risk of overfitting. This approach also accelerates both the training and inference phases. Despite the reduction in computation and parameter count, PConv maintains high detection performance. The detection head in YOLOv8 faces performance bottlenecks when applied to large-scale datasets, such as those used for tea tree pest and disease detection, which require real-time inference. The PConv technique in EfficientPHead can address this issues, and improve the model’s flexibility and generalization capabilities.
In conclusion, EfficientPHead significantly enhances computational efficiency, reduces the parameter count, and accelerates inference speed, all while maintaining high detection performance, making the model more suitable for a wide range of practical applications.
2.2.6. TLDDM Model
To enhance the detection of tea leaf pests and diseases, this study introduces an enhanced model named Tea Leaf Disease Detection Model (TLDDM). TLDDM builds upon YOLOv8 with a series of modifications, as depicted in Figure 8. Firstly, the C2f module in YOLOv8's backbone network is replaced with C2f-Faster-EMA, which reduces the number of floating-point operations during feature extraction, while simultaneously improving detection accuracy and the model's feature extraction capabilities.
At the end of the backbone network, a deformable attention mechanism is incorporated. This mechanism dynamically selects a set of key positions (referred to as sampling points) based on the characteristics of the input data and learns a set of offsets that define their locations. These offsets are computed dynamically based on the input features, allowing the model to adapt to variations in the data. By using these learned offsets, the model samples features at the key positions, calculates attention weights based on the sampled features, and aggregates the information accordingly. The computed attention weights are then applied to the sampled features to generate the output feature map. This mechanism allows the model to focus more effectively on critical regions within tea leaf pest and disease images, improving both processing efficiency and overall model performance.
In the feature fusion network of YOLOv8, the PAFPN module is replaced by Slimneck. Slimneck reduces the number of channels in each convolutional layer, thereby significantly lowering the model's parameter count without adversely affecting performance. Slimneck utilizes lightweight convolutional operations, such as DSC and pointwise convolution, to minimize computational complexity by reducing the number of multiplication operations during convolution. Moreover, Slimneck integrates techniques like skip connections and residual modules to reduce network depth while maintaining high performance. Additionally, Slimneck incorporates efficient attention mechanisms and feature fusion modules, which not only reduce the parameter count but also decrease computational complexity. These optimizations ensure that Slimneck meets the dual objectives of lightweight design and high accuracy for tea leaf pest and disease detection, making the model well-suited for resource-constrained environments such as mobile devices and embedded systems.
Finally, YOLOv8’s detection head is restructured through the introduction of EfficientPHead, which leverages PConv to enhance computational efficiency. Unlike traditional convolution, PConv performs calculations on only a subset of the input channels, dramatically reducing computation. This approach lowers the model's parameter count, decreases complexity, and mitigates the risks of overfitting. Furthermore, it accelerates both the training and inference processes. Despite the reduction in computation and parameter count, PConv preserves high detection performance by effectively processing input feature maps, thus improving the model’s precision and accuracy in detecting targets. The original detection head in YOLOv8 encounters performance bottlenecks when applied to large-scale datasets, such as those required for tea leaf pest and disease detection, which demand real-time inference. The Partial Convolution technique in EfficientPHead addresses these bottlenecks by enhancing the model’s adaptability and generalization capabilities. EfficientPHead increases computational efficiency, reduces parameter count, and speeds up inference while maintaining strong detection performance, making it highly suitable for a broad range of practical application scenarios.
2.3. Model Evaluation
To evaluate the performance of the TLDDM, a set of evaluation metrics was employed, including precision (P), recall (R), average precision (AP), F1 score (F1), FPS (frames per second), parameter count, floating-point operations per second (FLOPs), and model size. FLOPs and parameter count serve as indicators of the model's complexity and size, respectively. Precision (P) represents the ratio of true positive samples among all positive samples predicted by the detector. Recall (R) indicates the proportion of true positive samples correctly predicted by the detector out of all actual positive samples.
However, relying solely on P and R may not provide a comprehensive evaluation of detection accuracy. Therefore, additional metrics, AP and F1, were introduced. AP represents the average precision achieved during the detection process [40], while F1 is the harmonic mean of precision and recall, offering a balanced assessment of detection performance. Higher AP and F1 values indicate a higher level of detection accuracy. Moreover, average detection time, which includes preprocessing time, inference time, and non-maximum suppression (NMS) time, was measured. Equations (9)–(12) can be used to calculate P, R, F1, and AP.
In these equations, TPTPTP represents the number of positive samples correctly predicted as positive, FNFNFN corresponds to the number of positive samples incorrectly predicted as negative, and FPFPFP denotes the number of negative samples mistakenly predicted as positive. Intersection over Union (IoU) measures the overlap ratio between the predicted bounding box and the ground truth bounding box. Typically, an IoU threshold of 0.5 is used. When the IoU exceeds 0.5, the sample is classified as a true positive (TP). Conversely, if the IoU is below 0.5, the sample is considered a false positive (FP).
3. Results
3.1. Experimental Configuration
All training and evaluation in this study were conducted under consistent parameter settings. The computer system operated on Windows 11, equipped with an Intel Core i5-9300H processor (2.40 GHz), 16 GB of RAM, and a 4 GB NVIDIA GeForce GTX 1650 GPU. GPU acceleration was enabled using CUDA 11.8.0 and CUDNN 8.9.1.
During model training, SGD was selected as the optimizer, with an input image size of 640. The YOLOv8 model was implemented using the PyTorch 2.0 deep learning framework. The parameter settings are detailed in Table 2.
3.2. Ablation Experiment
In order to verify the effectiveness of each improved module, this study conducted an ablation experiment based on the original YOLOv5 network. The experimental results are listed in detail in Table 3.
The original YOLOv8 model achieved an average precision (AP) of 97.9%. Building upon this baseline, Model1, which incorporated the C2f-Faster-EMA module, improved the AP to 98.0%. This improvement was achieved while reducing the model's parameter count and complexity, thereby enhancing its image feature extraction capabilities. Subsequently, Model2 integrated the DAttention module on top of Model1, which resulted in a further slight increase in AP to 98.1%. This addition enhanced the model's adaptability to spatial transformations and irregular data structures. Model3 introduced the Slimneck structure, reducing the model's size but leading to a slight decrease in accuracy, reflecting Slimneck's focus on balancing speed optimization with performance. Finally, the TLDDM model, which integrated the Faster-EMA, DAttention, and EfficientPHead modules, achieved an AP comparable to YOLOv8, while also reaching a frames per second (FPS) of 98.2 and reducing the model size to 4.3 MB. These results demonstrate that the integrated improvement strategy effectively maintains detection performance while significantly reducing the model's size and enhancing processing speed.
Overall, these improvements and integrations highlight the potential for maintaining a high AP while increasing FPS and reducing model size. The TLDDM model stands out by achieving an optimal trade-off between performance, speed, and size, showcasing its potential for practical real-world applications.
3.3. Comparative Experiments
To further validate the efficiency of the proposed algorithm, TLDDM was compared across various performance metrics with Faster R-CNN, SSD, and earlier versions of the YOLO series. As shown in Table 4, TLDDM outperformed these models across all performance metrics, demonstrating its superior capabilities.
As shown in Table 3, the TLDDM model achieved an AP of 98.0%, significantly surpassing Faster R-CNN and SSD models, while also demonstrating superior performance in both precision and recall. Moreover, its FPS reached 98.2, comparable to the best value among the experimental results, highlighting its advantage in real-time detection.
Figure 9 compares the detection performance of different models. The TLDDM model achieved the best detection performance across various categories in the dataset.
3.4. Comparison of Test Results
Precision-Recall (PR) curves and F1 curves are two critical evaluation metrics in object detection algorithms, providing detailed insights into model performance across different thresholds.
Figure 10 presents the PR curve of TLDDM, where the blue TLDDM curve completely envelops the yellow YOLOv8n curve, indicating that TLDDM outperforms YOLOv8n in terms of performance.
The F1 curve of TLDDM and its comparison with YOLOv8n are illustrated in Figure 11. In the left chart, at a confidence threshold of 0.770, the overall F1 score across all categories reaches 0.98. The category-specific curves approach the maximum F1 score of 1.0 at different confidence thresholds, indicating that each category achieves a distinct balance between precision and recall.
The right chart shows that the TLDDM curve is wider at the top and closer to 1, representing a broader range of confidence thresholds. This demonstrates that the TLDDM model achieves better performance on the training dataset.
During the training process of YOLOv8n and TLDDM, both models were trained on the same dataset with identical parameter settings. Based on the log files recorded during training, the training loss curves for the two models are plotted, as shown in Figure 12.
Although the loss reduction speed and stability differ at various stages for TLDDM and YOLOv8n, the overall trend indicates that both models achieve similar performance levels after sufficient training.
In an effort to demonstrate the detection capabilities of the models clearly, the EigenCAM heatmap visualization method was employed. The heatmap visualization results for six different categories of tea leaves using YOLOv8n and TLDDM are shown in Figure 13. The heatmaps for YOLOv8n are more scattered, focusing on multiple areas of the tea leaves, whereas the TLDDM heatmaps are more accurate, concentrated, and consistent. The highlighted regions align closely with the diseased areas of tea leaves affected by pests and diseases. This demonstrates that the proposed improvement strategies significantly enhance the detection performance of the tea leaf pest and disease detection model.
4. Conclusions
Accurate detection and identification of tea leaf pests and diseases are of great significance for reducing tea production losses, improving tea quality, and increasing farmers' income. However, existing deep learning models still face limitations in the detection performance of tea leaf pests and diseases. To address this, this study proposes a deep learning-based detection model, TLDDM (Tea Leaf Disease Detection Model), which incorporates several key innovations.
The model introduces C2f-Faster-EMA to reduce parameter count and complexity while enhancing image feature extraction capabilities. The addition of the DAttention module improves the model's adaptability to spatial transformations and irregular data structures. The integration of the Slimneck structure reduces model size, while the detection head is reconstructed as EfficientPHead, which maintains detection performance, improves computational efficiency, reduces parameters, and accelerates inference speed.
Experimental results demonstrate that the TLDDM model outperforms existing models on the dataset, achieving a comprehensive performance of 98.0% mAP and 58 FPS, with a model size of only 4.3 MB. By achieving a well-balanced trade-off between performance, speed, and size, TLDDM provides robust support for the development of the tea industry.
Author Contributions
Data curation, J.S. and Y.Z; methodology, J.S.; software, H.H.; validation, H.H.; writing—original draft, S.L.; writing—review and editing, X.Y. All authors have read and agreed to the published version of the manuscript.
Funding
This research was funded by the Postgraduate Research & Practice Innovation Program of Jiangsu Province (grant number: SJCX24_0384) and the college student innovation and entrepreneurship training program of Jiangsu Province (grant number: 202410298057Z).
Data Availability Statement
The data that support the findings of this study are available from the author Jun Song (songjun@njfu.edu.cn) upon reasonable request.
Conflicts of Interest
The authors declare no conflicts of interest.
References
- Dong, Z.; Li, J.; Zhao, Y. Investigation on the types of pests and diseases in Shangluo tea trees and the distribution of major pests and diseases. Journal of Shanxi Agricultural University (Natural Science Edition) 2018, 38, 33–7. [Google Scholar]
- Bao, W.; Fan, T.; Hu, G.; Liang, D.; Li, H. Detection and identification of tea leaf diseases based on AX-RetinaNet. Sci Rep. 2022, 12, 2183. [Google Scholar] [CrossRef] [PubMed]
- Bauriegel, E.; Giebel, A.; Geyer, M.; Schmidt, U.; Herppich, W. Early detection of Fusarium infection in wheat using hyper-spectral imaging. Computers and electronics in agriculture 2011, 75, 304–12. [Google Scholar] [CrossRef]
- Prabira, K.; Nalini, K.; Amiya, K.; Santi, K. Deep feature based rice leaf disease identification using support vector machine. Computers and Electronics in Agriculture 2020, 175, 105527. [Google Scholar]
- Behmann, J.; Steinrücken, J.; Plümer, L. Detection of early plant stress responses in hyperspectral images. ISPRS Journal of Photogrammetry and Remote Sensing 2014, 93, 98–111. [Google Scholar] [CrossRef]
- Xie, C.; Yang, C.; He, Y. Hyperspectral imaging for classification of healthy and gray mold diseased tomato leaves with different infection severities. Computers and electronics in agriculture 2017, 135, 154–62. [Google Scholar] [CrossRef]
- Zhang, S.; Wu, X.; You, Z.; et al. Leaf image based cucumber disease recognition using sparse representation classification. Computers and electronics in agriculture 2017, 134, 135–41. [Google Scholar] [CrossRef]
- Hossain, S.; Mou, R.; Hasan, M.; Chakraborty, S.; Razzak, M. Recognition and detection of tea leaf's diseases using support vector machine. proceedings of the 2018 IEEE 14th International Colloquium on Signal Processing & Its Applications (CSPA), F, 2018. IEEE.
- Sun, Y.; Jiang, Z.; Zhang, L. ; Dong, Wei; Rao Y. SLIC_SVM based leaf diseases saliency map extraction of tea plant. Computers and electronics in agriculture 2019, 157, 102–9. [Google Scholar]
- Yuan, W.; Lan, L.; Xu, J.; Sun, T.; Wang, X.; Wang, Q.; Hu, J.; Wang, B. Smart Agricultural Pest Detection Using I-YOLOv10-SC: An Improved Object Detection Framework. Agronomy 2025, 15, 221. [Google Scholar] [CrossRef]
- Hu, G.; Wu, H.; Zhang, Y.; Wan, M. A low shot learning method for tea leaf's disease identification - sciencedirect. Computers & Electronics in Agriculture 2021, 163, 104852–104852. [Google Scholar]
- Hu, G.; Yang, X.; Zhang, Y. Identification of tea leaf diseases by using an improved deep convolutional neural network. Sustain Computation Information System 2019, 24, 100353. [Google Scholar] [CrossRef]
- Jiang, F.; Lu, Y.; Chen, Y.; Cai, D.; Li, G. Image recognition of four rice leaf diseases based on deep learning and support vector machine. Computers and electronics in agriculture 2020, 179, 105824. [Google Scholar] [CrossRef]
- Jiao, L.; Zhang, F.; Liu, F.; Yang, S.; Li, L.; Feng, Z. A survey of deep learning-based object detection. IEEE access 2019, 7, 128837–68. [Google Scholar] [CrossRef]
- Ren, S.; He, K.; Girshick, R.; Sun, J. Faster R-CNN: Towards real-time object detection with region proposal networks. IEEE transactions on pattern analysis and machine intelligence 2016, 39, 1137–1149. [Google Scholar] [CrossRef] [PubMed]
- Zhou, G.; Zhang, W.; Chen, A.; He, M.; Ma, X. Rapid detection of rice disease based on FCM-KM and faster R-CNN fusion. Advances in neural information processing systems 2019, 7, 143190–206. [Google Scholar] [CrossRef]
- Liu, W.; Anguelov, D.; Erhan, D.; Szegedy, C.; Reed, S.; Fu, C.; Berg, A. Ssd: Single shot multibox detector. In 2016: 14th European Conference on Computer Vision–ECCV, The Netherlands, 2016, Springer, Part I 14: 21-37).
- Lin, T.; Goyal, P. , Girshick, R.; Focal loss for dense object detection. proceedings of the Proceedings of the IEEE international conference on computer vision, F, 2017.
- Redmon, J.; Divvala, S.; Girshick, R. You only look once: Unified, real-time object detection. Proceedings of the IEEE conference on computer vision and pattern recognition(CVPR), F, 2016.
- Wu, D.; Lv, S.; Jiang, M.; Song, H. Using channel pruning-based YOLO v4 deep learning algorithm for the real-time and accurate detection of apple flowers in natural environments. Computers and Electronics in Agriculture 2020, 178, 105742. [Google Scholar] [CrossRef]
- Liu, G.; Nouaze, J. Touko Mbouembe. YOLO-tomato: A robust algorithm for tomato detection based on YOLOv3. Sensors 2020, 20.7, 2145. [Google Scholar]
- Dang, F.; Chen, D.; Lu, Y.; Li, Z. YOLOWeeds: A novel benchmark of YOLO object detectors for multi-class weed detection in cotton production systems. Computers and Electronics in Agriculture 2023, 205, 107655. [Google Scholar] [CrossRef]
- Tian, Y.; Yang, G.; Wang, Z.; Wang, H.; Li, E.; Liang, Z. Apple detection during different growth stages in orchards using the improved YOLO-V3 model. Computers and electronics in agriculture, 2019, 157, 417–26. [Google Scholar] [CrossRef]
- Redmon J, Farhadi A. Yolov3: An incremental improvement. arXiv arXiv:1804.02767, 2018.
- Roy A M, Bose R, Bhaduri J. A fast accurate fine-grain object detection model based on YOLOv4 deep neural network. Neural Computing and Applications 2022, 34, 3895–921.
- Bochkovskiy A, Wang C., Liao H. Yolov4: Optimal speed and accuracy of object detection. arXiv arXiv:2004.10934, 2020.
- Sun C, Huang C, Zhang H. Individual tree crown segmentation and crown width extraction from a heightmap derived from aerial laser scanning data using a deep learning framework. Frontiers in plant science 2022, 13, 914974.
- Dai, G.; Fan, J. An industrial-grade solution for crop disease image detection tasks. Frontiers in Plant Science 2022, 13, 921057. [Google Scholar] [CrossRef]
- Nguyen, K.; Nguyen, H.; Tran, H.; Quach, L. Combining autoencoder and YOLOv6 model for classification and disease detection in chickens. In Proceedings of the 2023 8th International Conference on Intelligent Information Technology 2023, 132–138. [Google Scholar]
- Zhao, K.; Zhao, L.; Zhao, Y.; Deng, H. Study on lightweight model of maize seedling object detection based on YOLOv7. Applied sciences 2023, 13, 7731. [Google Scholar] [CrossRef]
- Chen, J.; Kao, S.; He, H.; Zhuo, W.; Wen, S.; Lee, C.; Chan, S. Run, don't walk: chasing higher FLOPS for faster neural networks. Proceedings of the IEEE/CVF conference on computer vision and pattern recognition. 2023, IEEE, 12021-12031.
- Chen, J.; Ma, A.; Huang, L.; Li, H.; Zhang, H.; Huang, Y.; Zhu, T. Efficient and lightweight grape and picking point synchronous detection model based on key point detection. Computers and Electronics in Agriculture 2024, 217. [Google Scholar] [CrossRef]
- Duan, E.; Han, G.; Zhao, S.; Ma, Y.; Lv, Y.; Bai, Z. Regulation of Meat Duck Activeness through Photo period Based on Deep Learning. Animals 2023, 13. [Google Scholar]
- Woo, S.; Park, J.; Lee, J.; Kweon, I. Cbam: Convolutional block attention module. In Proceedings of the European conference on computer vision (ECCV). 2018, 3–19. [Google Scholar]
- Hu, J.; Shen, L.; Sun, G. Squeeze-and-excitation networks. In Proceedings of the IEEE conference on computer vision and pattern recognition. 2018, IEEE, 7132–7141. [Google Scholar]
- Ouyang, D.; He, S.; Zhang, G.; Luo, M.; Guo, H.; Zhan, J.; Huang, Z. Efficient multi-scale attention module with cross-spatial learning. In ICASSP 2023-2023 IEEE International Conference on Acoustics, Speech and Signal Processing (ICASSP). IEEE, 1-5.
- Xia, Z.; Pan, X.; Song, S.; Li, L.; Huang, G. Vision transformer with deformable attention. In Proceedings of the IEEE/CVF conference on computer vision and pattern recognition. 2022; 4794-4803. [Google Scholar]
- Martinelli, F.; Matteucci, I. Partial Model Checking for the Verification and Synthesis of Secure Service Compositions. In Public Key Infrastructures, Services and Applications. EuroPKI 2013. Lecture Notes in Computer Science, vol 8341. Springer, Berlin, Heidelberg.
- Li, H.; Li, J.; Wei, H.; Liu, Z.; Zhan, Z.; Ren, Q. Slim-neck by GSConv: A better design paradigm of detector architectures for autonomous vehicles. ArXiv abs/2206.02424 (2022): n. pag.
- Sozzi, M.; Cantalamessa, S.; Cogato, A.; Kayad, A.; Marinello, F. Automatic Bunch Detection in White Grape Varieties Using YOLOv3, YOLOv4, and YOLOv5 Deep Learning Algorithms. Agronomy 2022, 12, 319. [Google Scholar] [CrossRef]
Figure 1.
Tea leaf disease species.
Figure 2.
Schematic of structure of Yolov8.
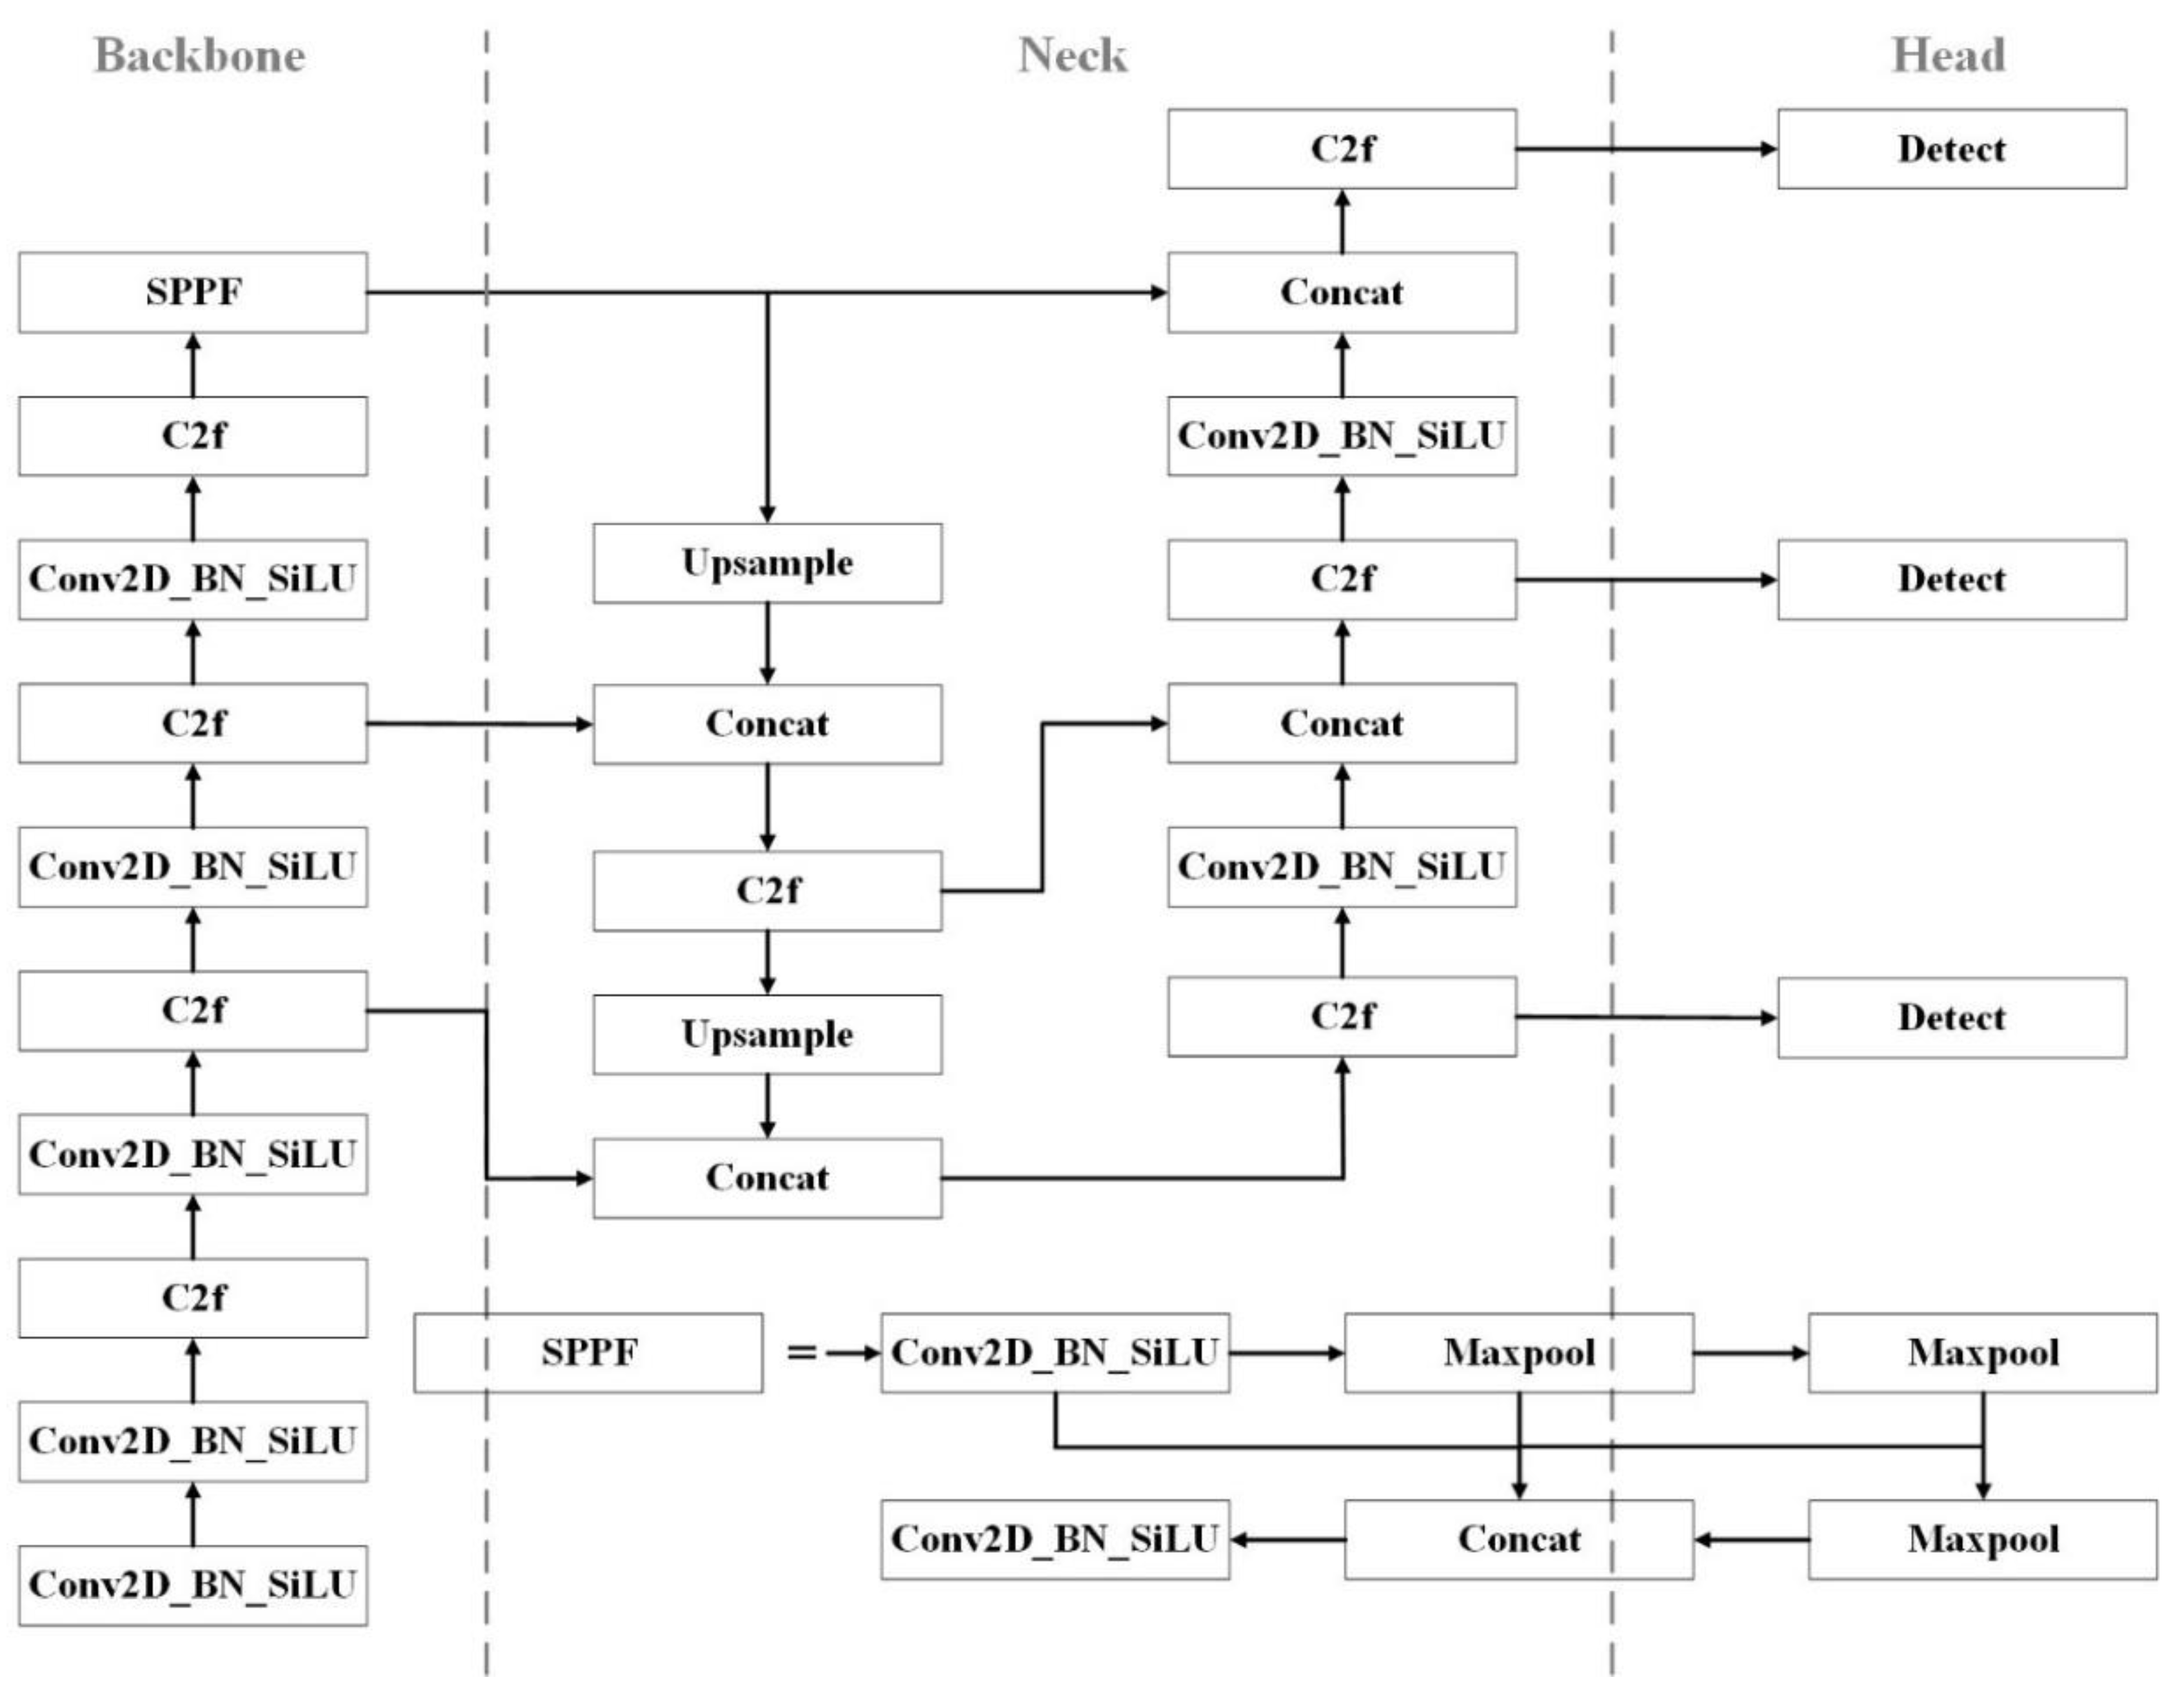
Figure 3.
Schematic of C2f_faster_EMA.
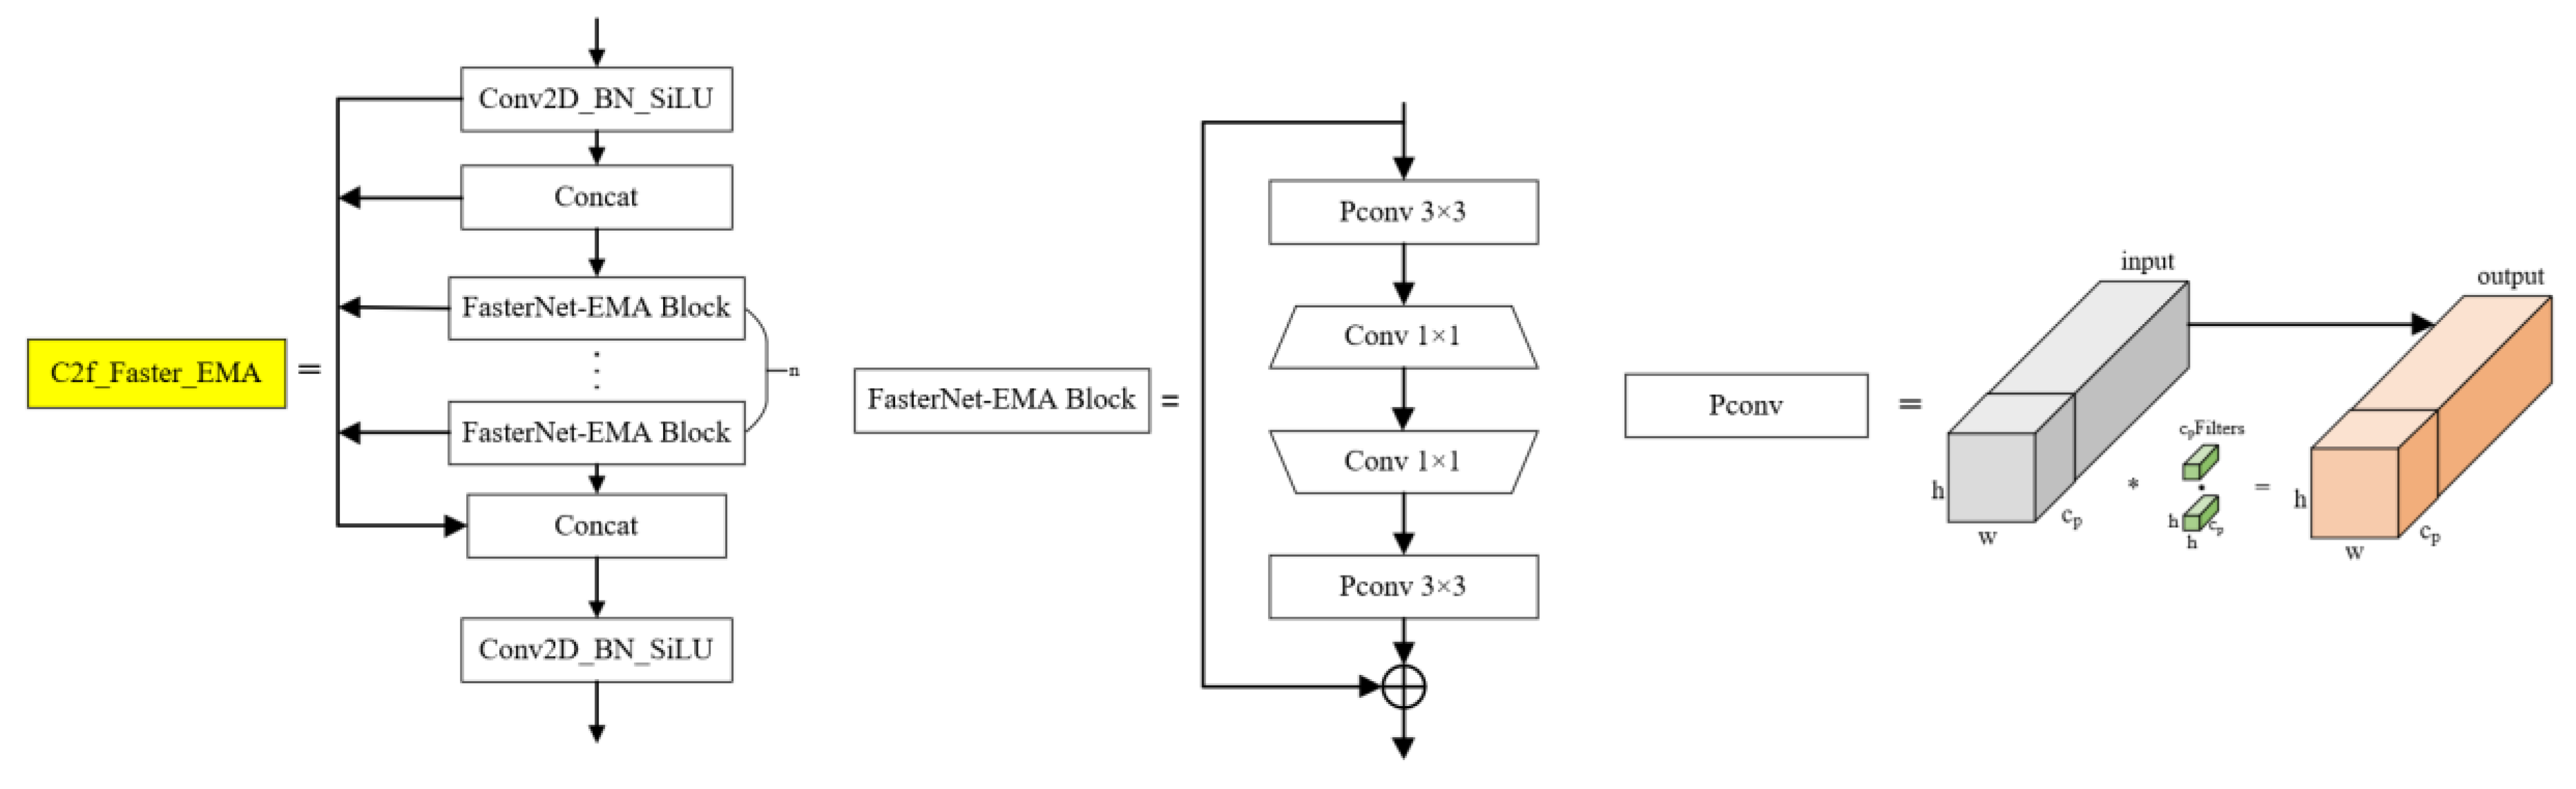
Figure 4.
Schematic of Deformable attention module.
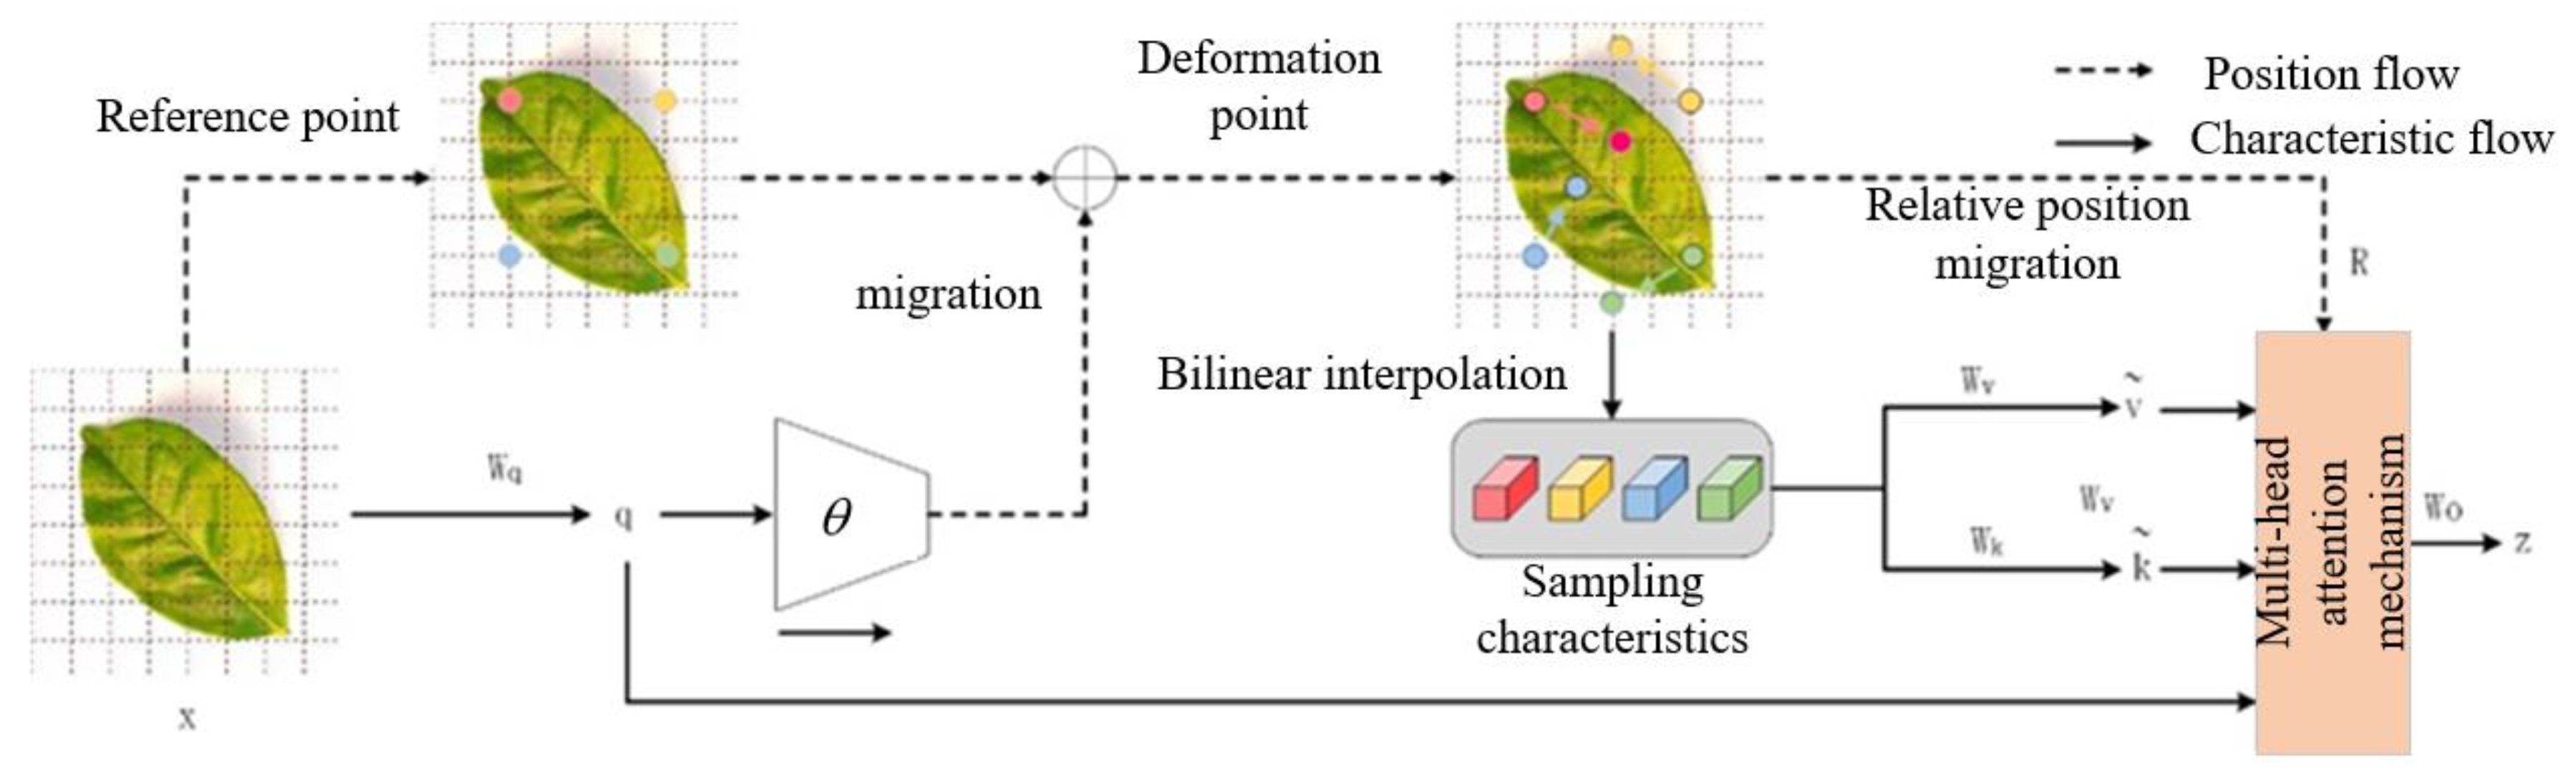
Figure 5.
Schematic of GSConv.
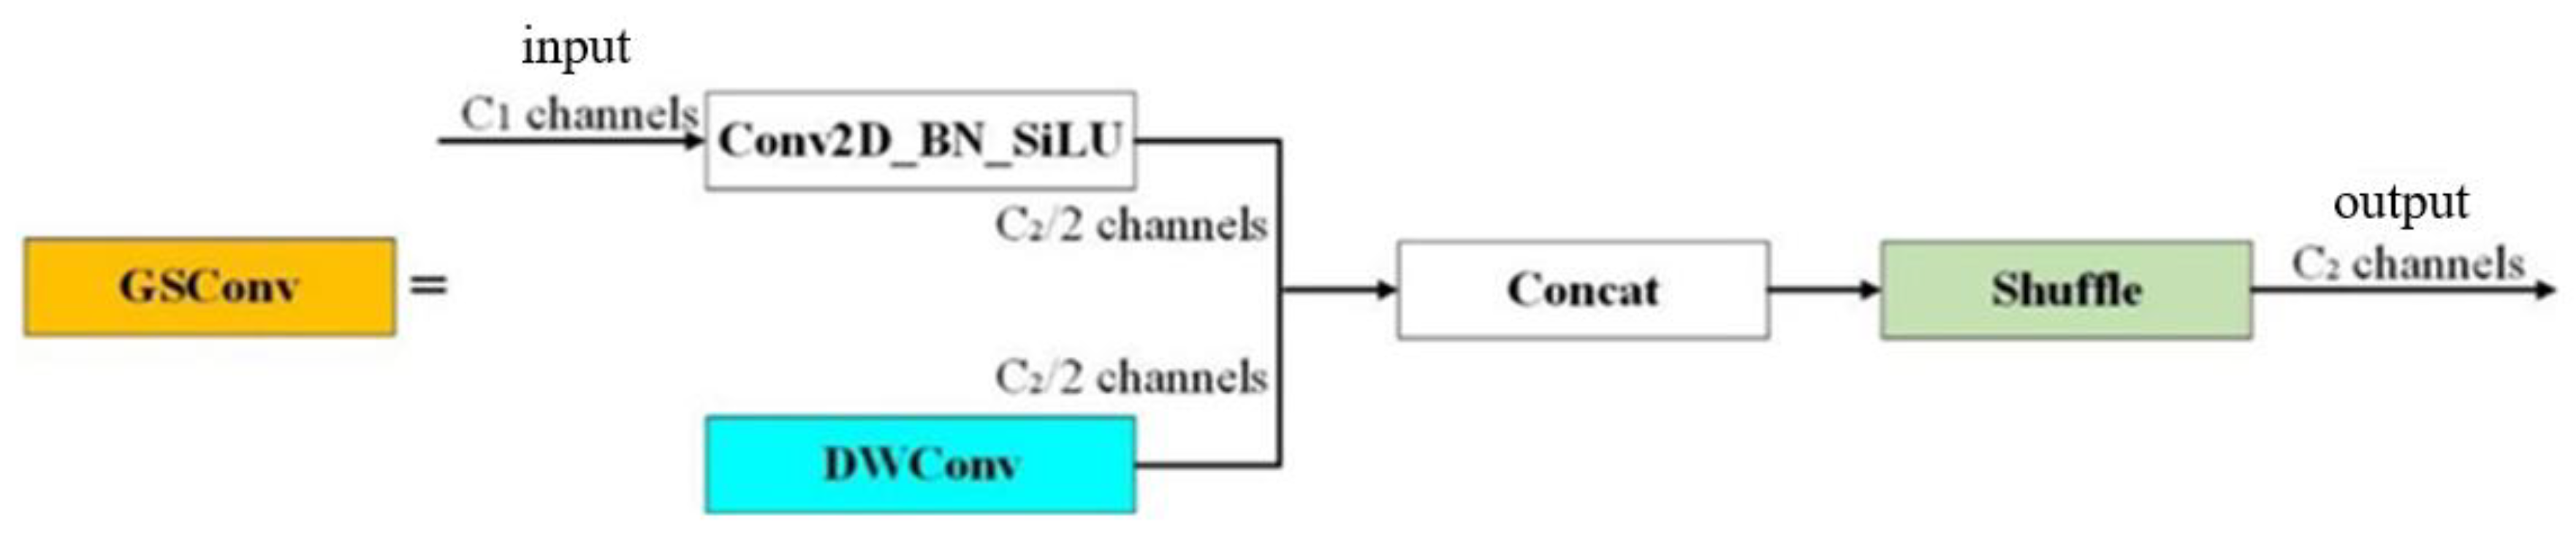
Figure 6.
Schematic of VoVGSCSP.
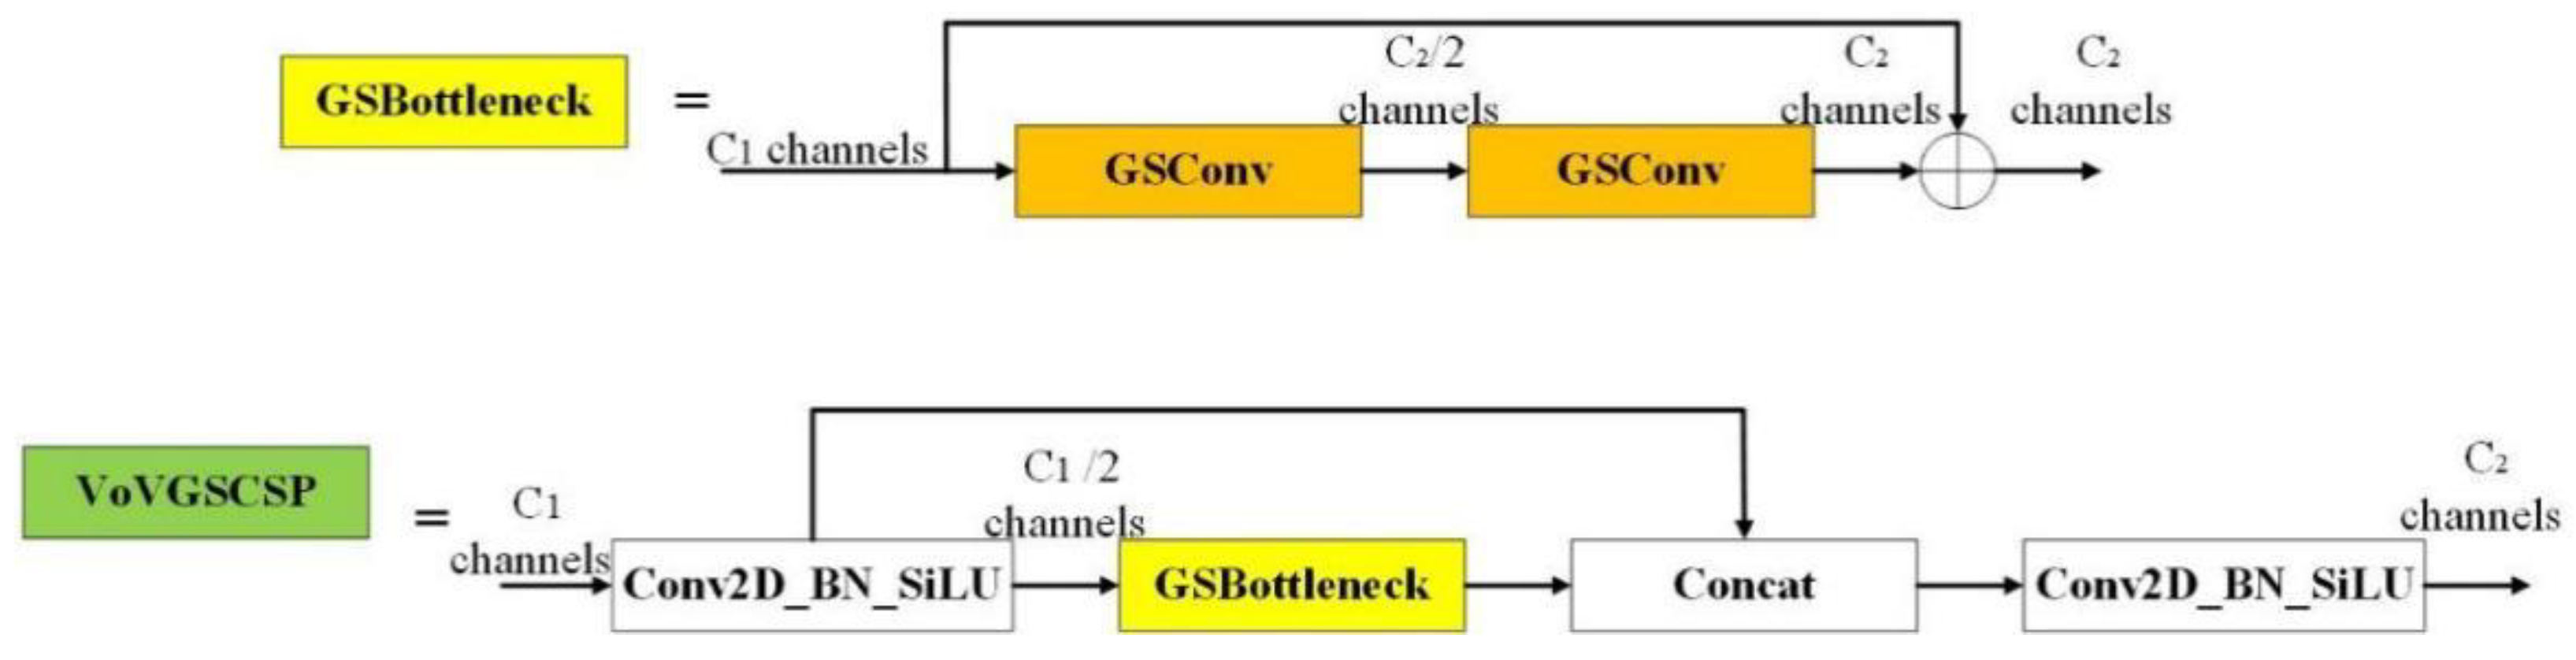
Figure 7.
Schematic of EfficientPHead.
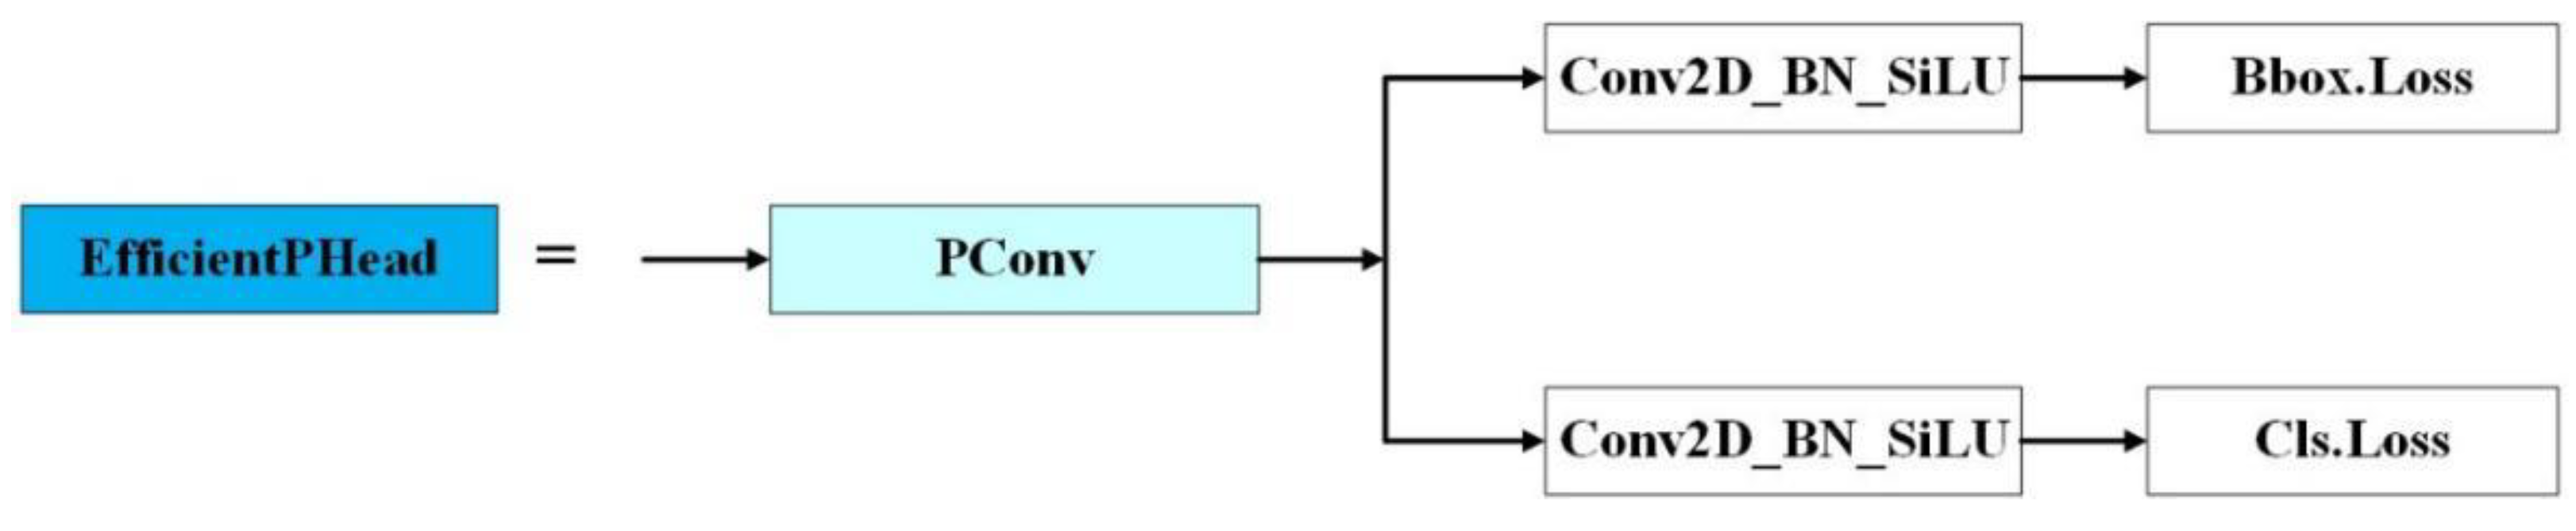
Figure 8.
Schematic of structure of TLDDM network.
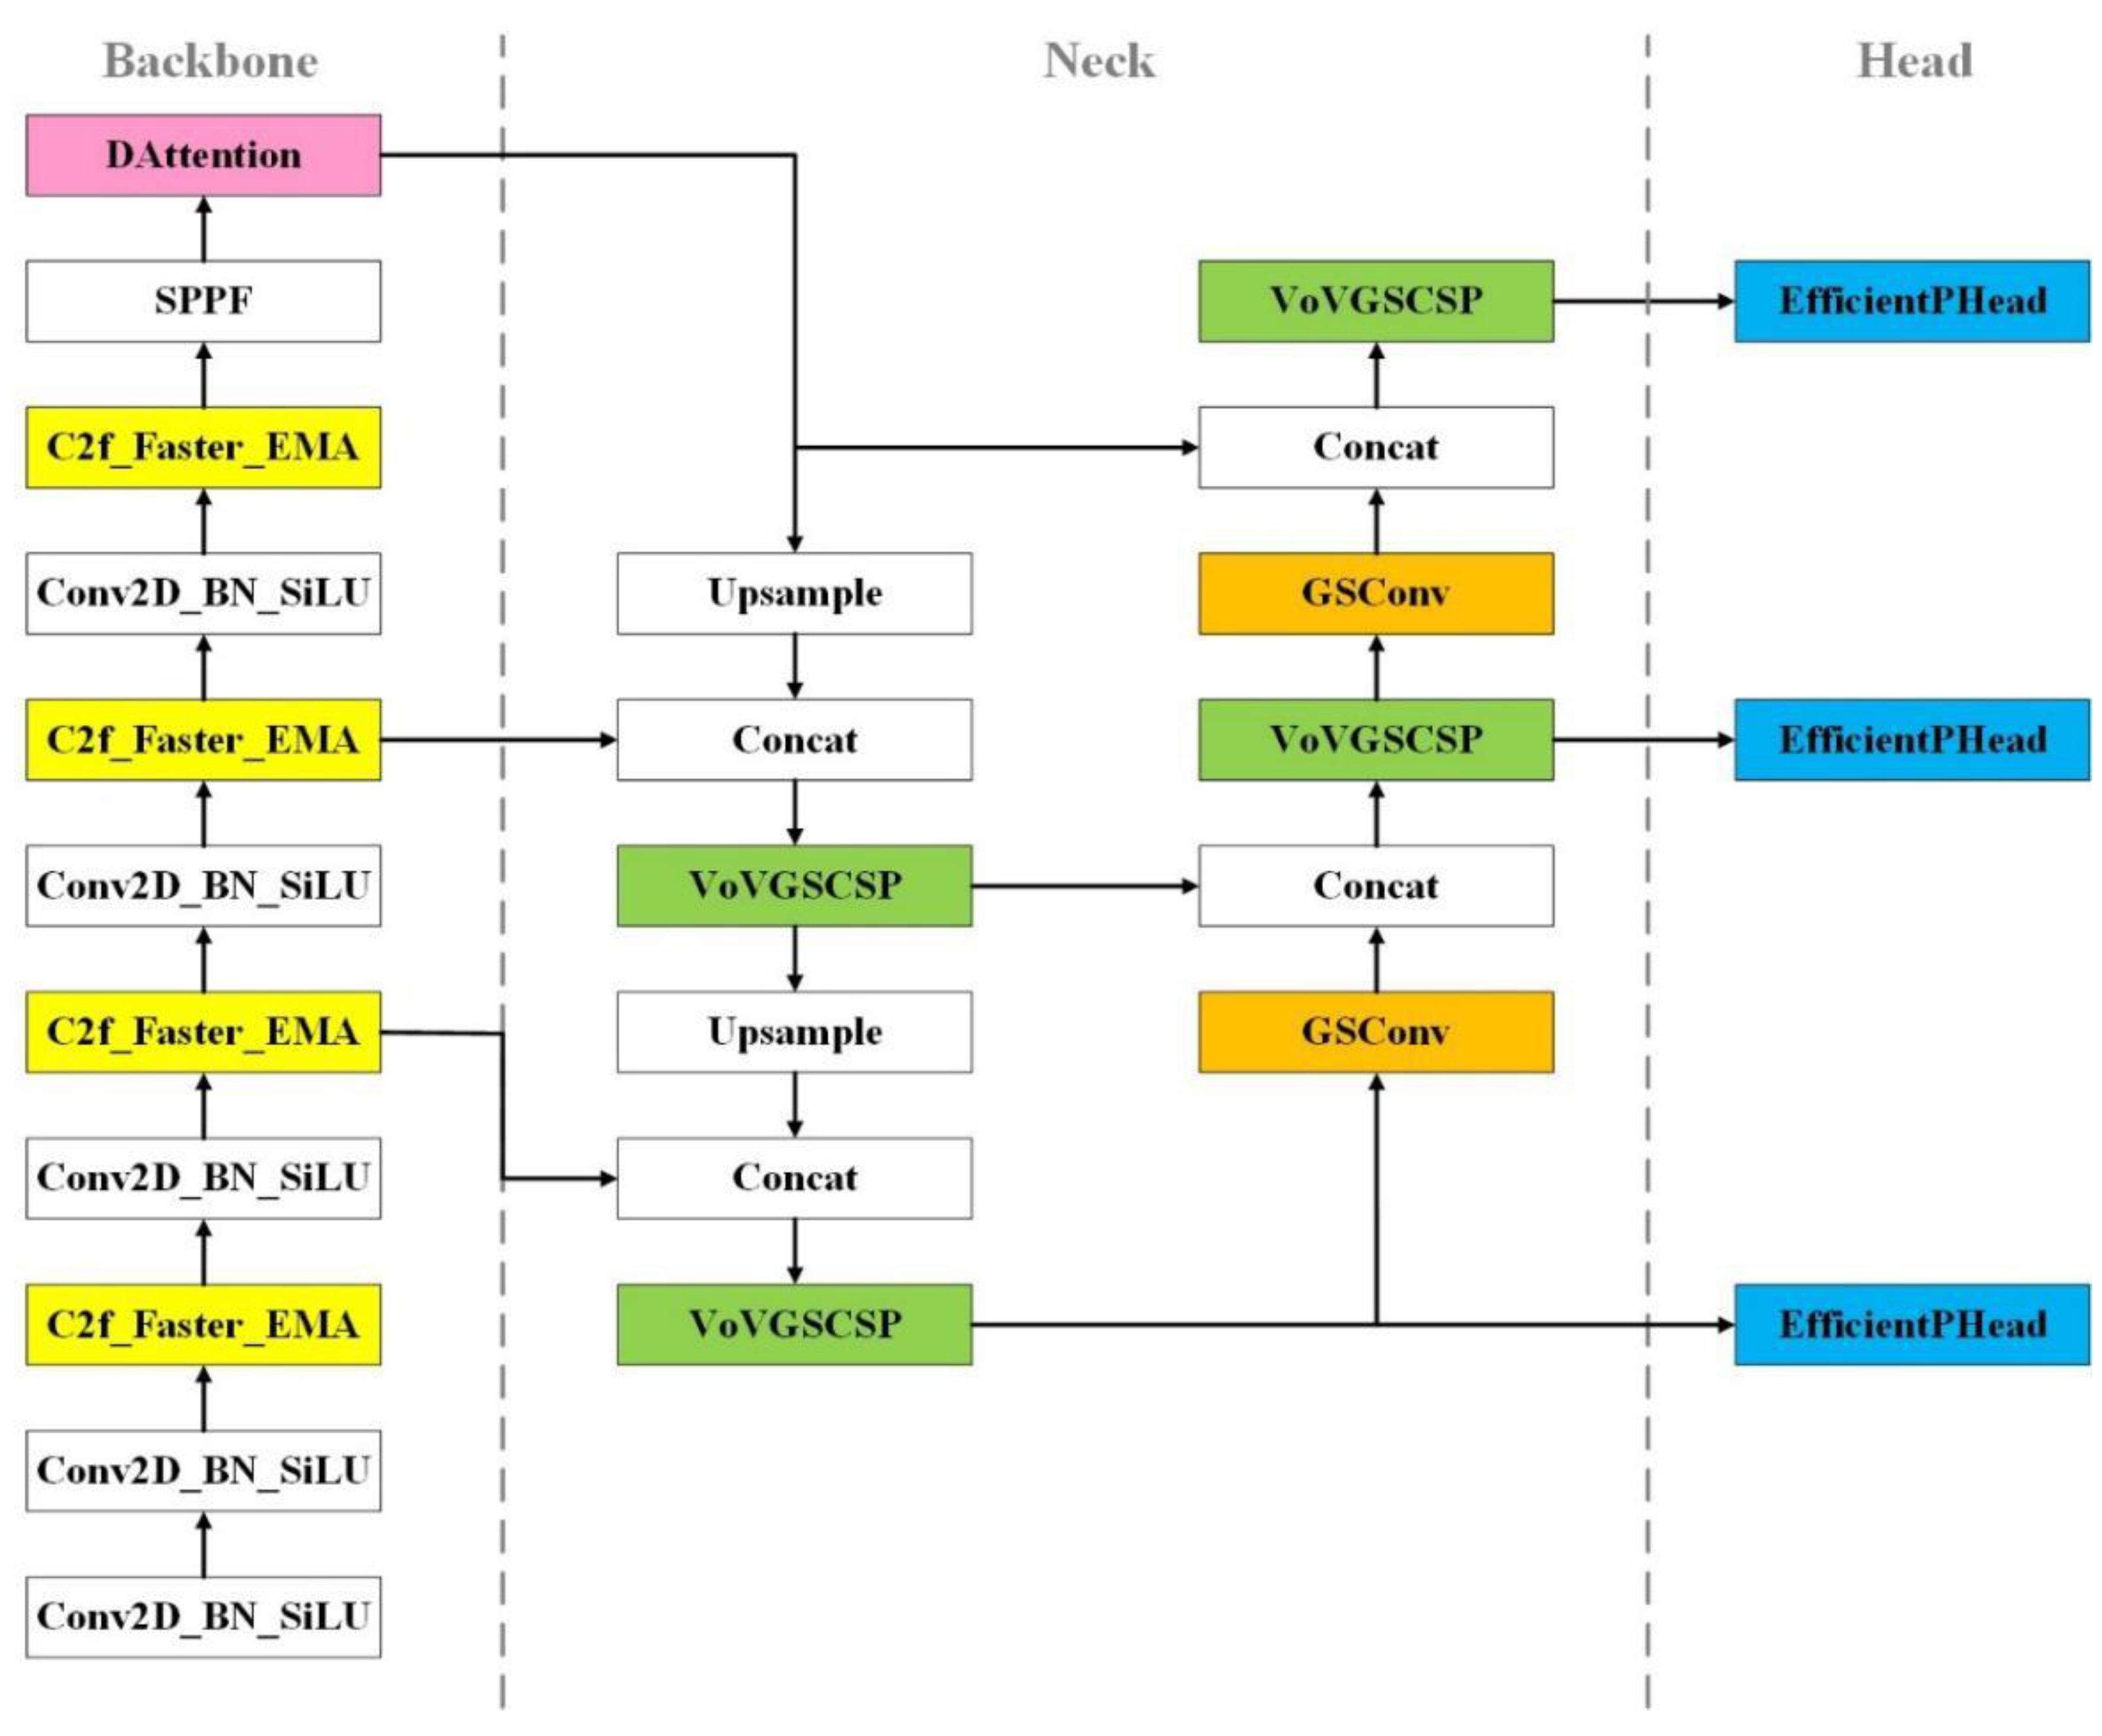
Figure 9.
Comparison of detection results of different models.
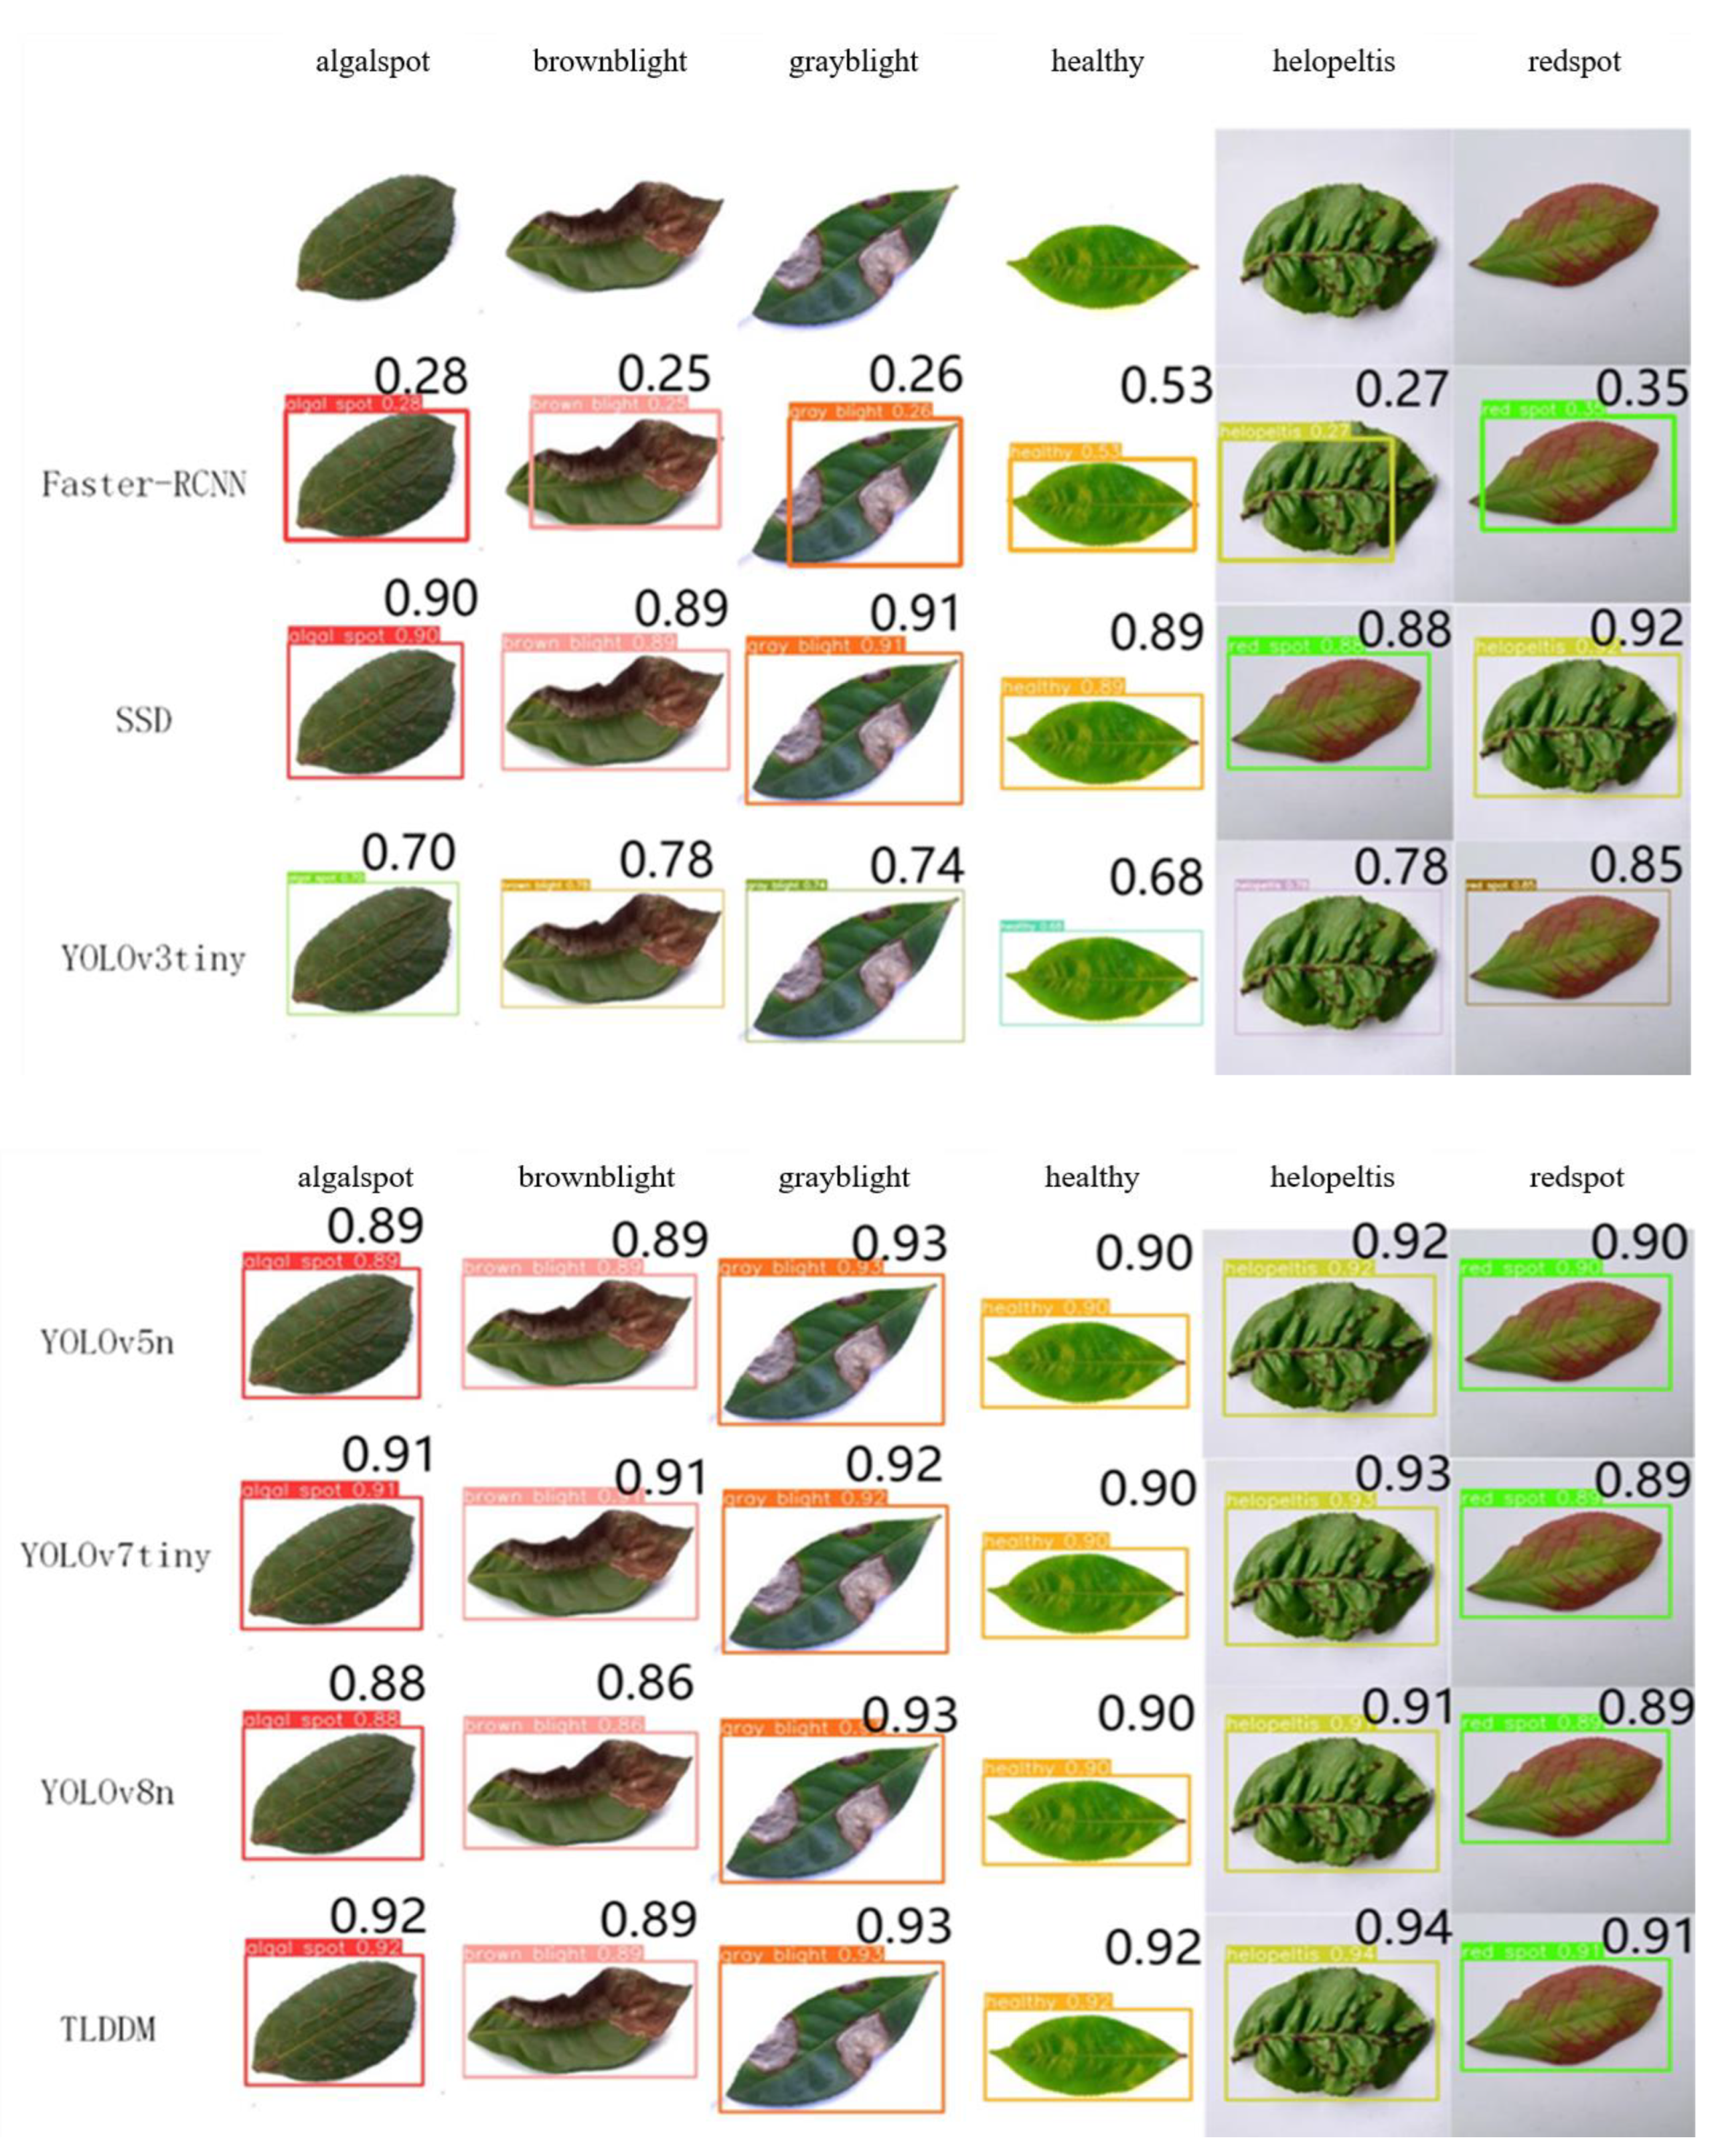
Figure 10.
Curve of PR.
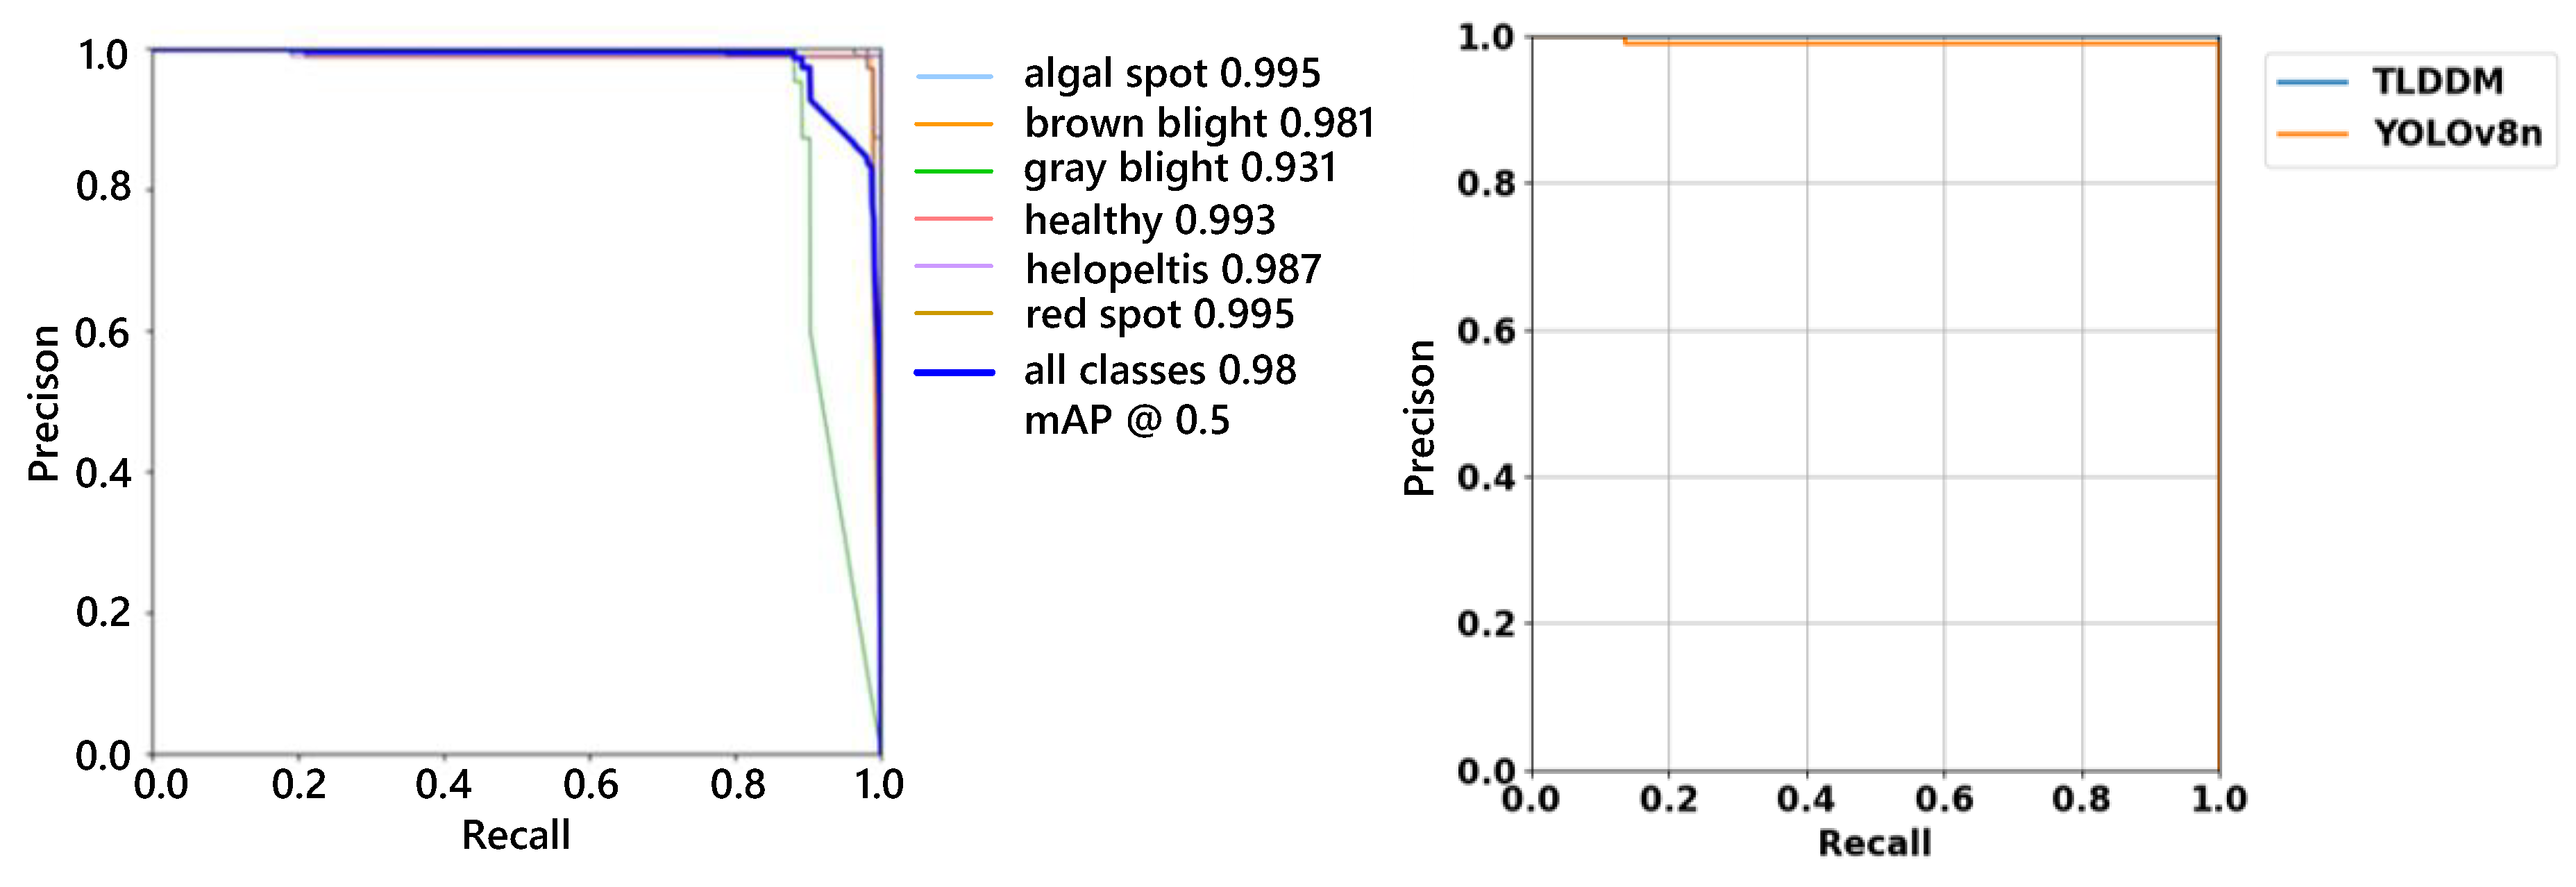
Figure 11.
Curve of F1.
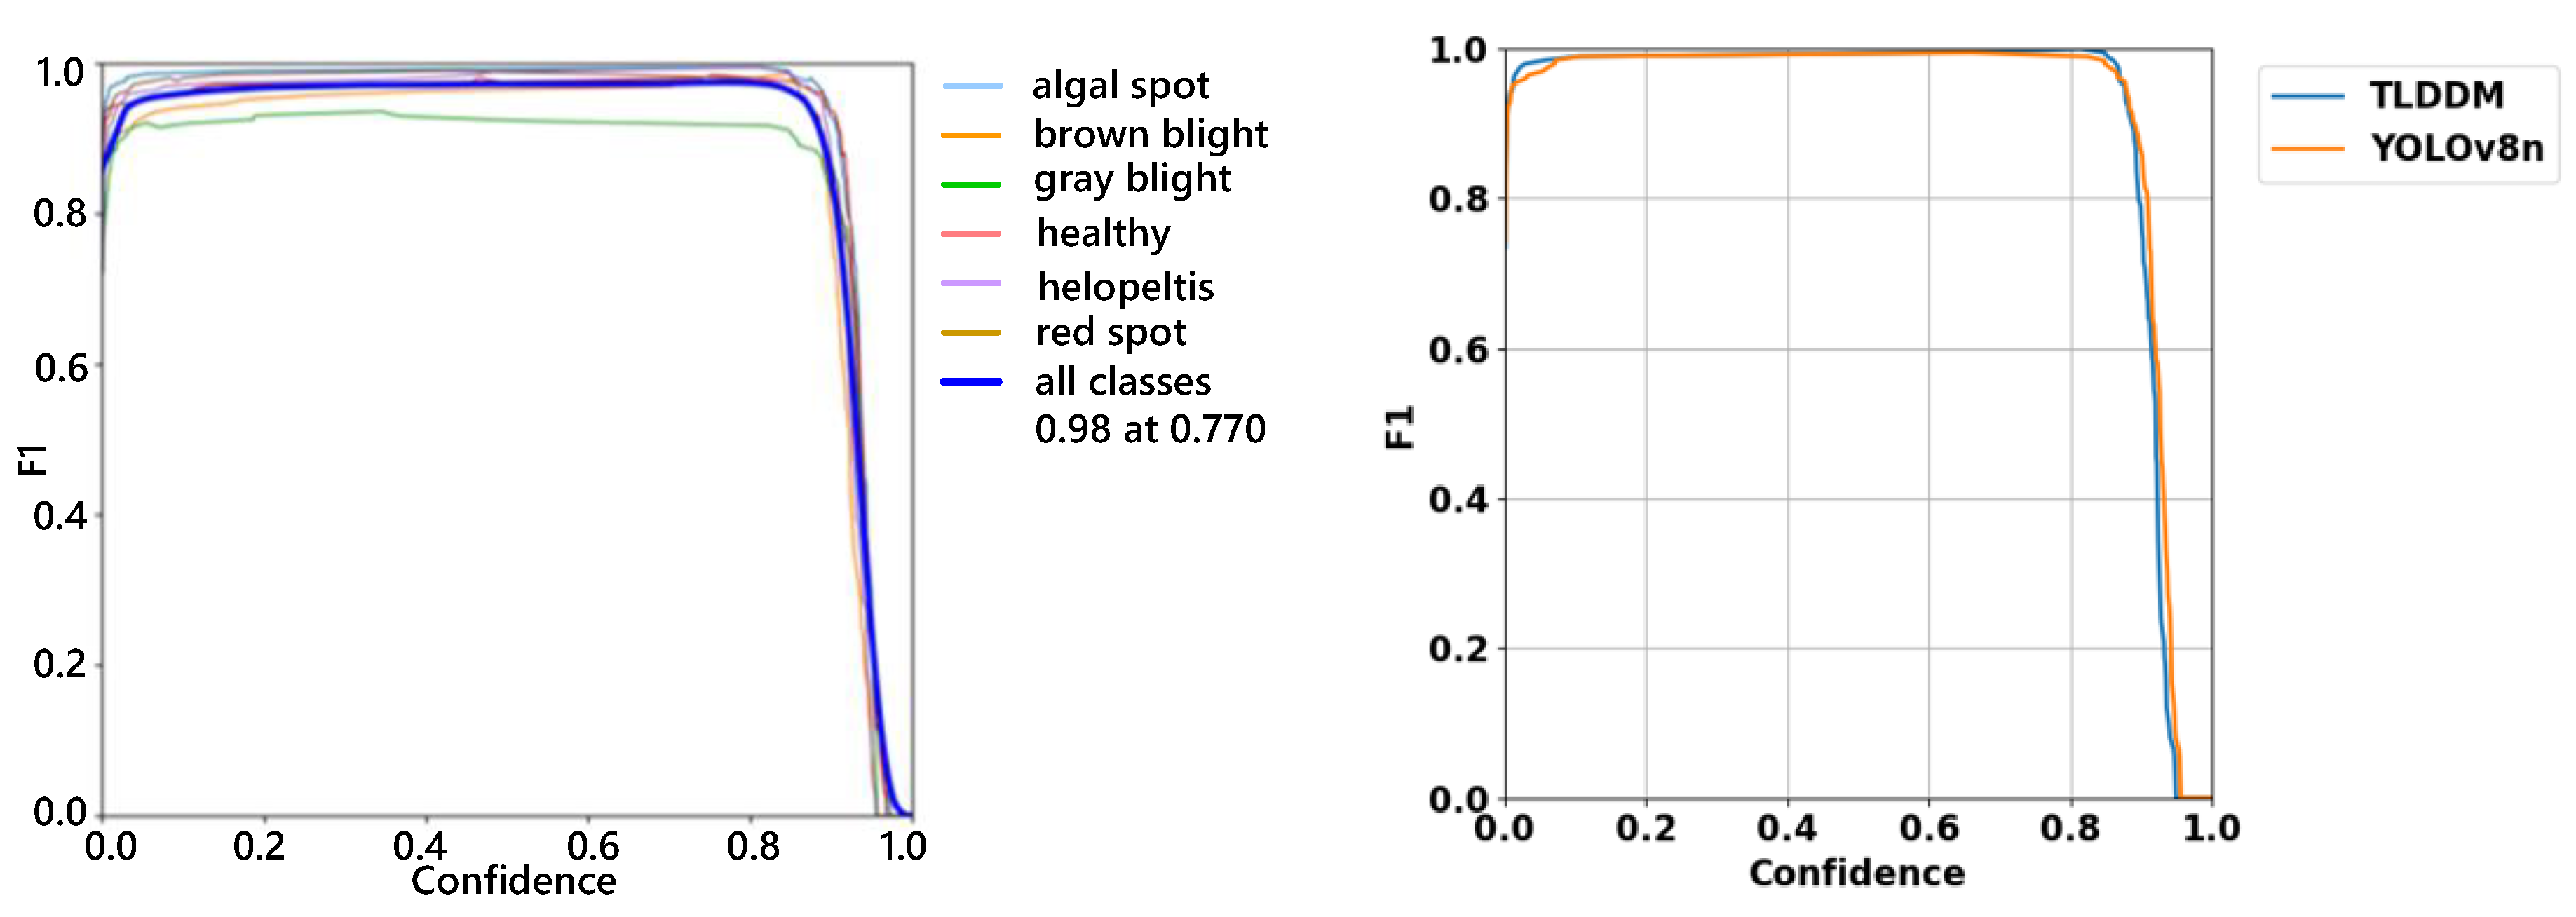
Figure 12.
Curve of training loss.
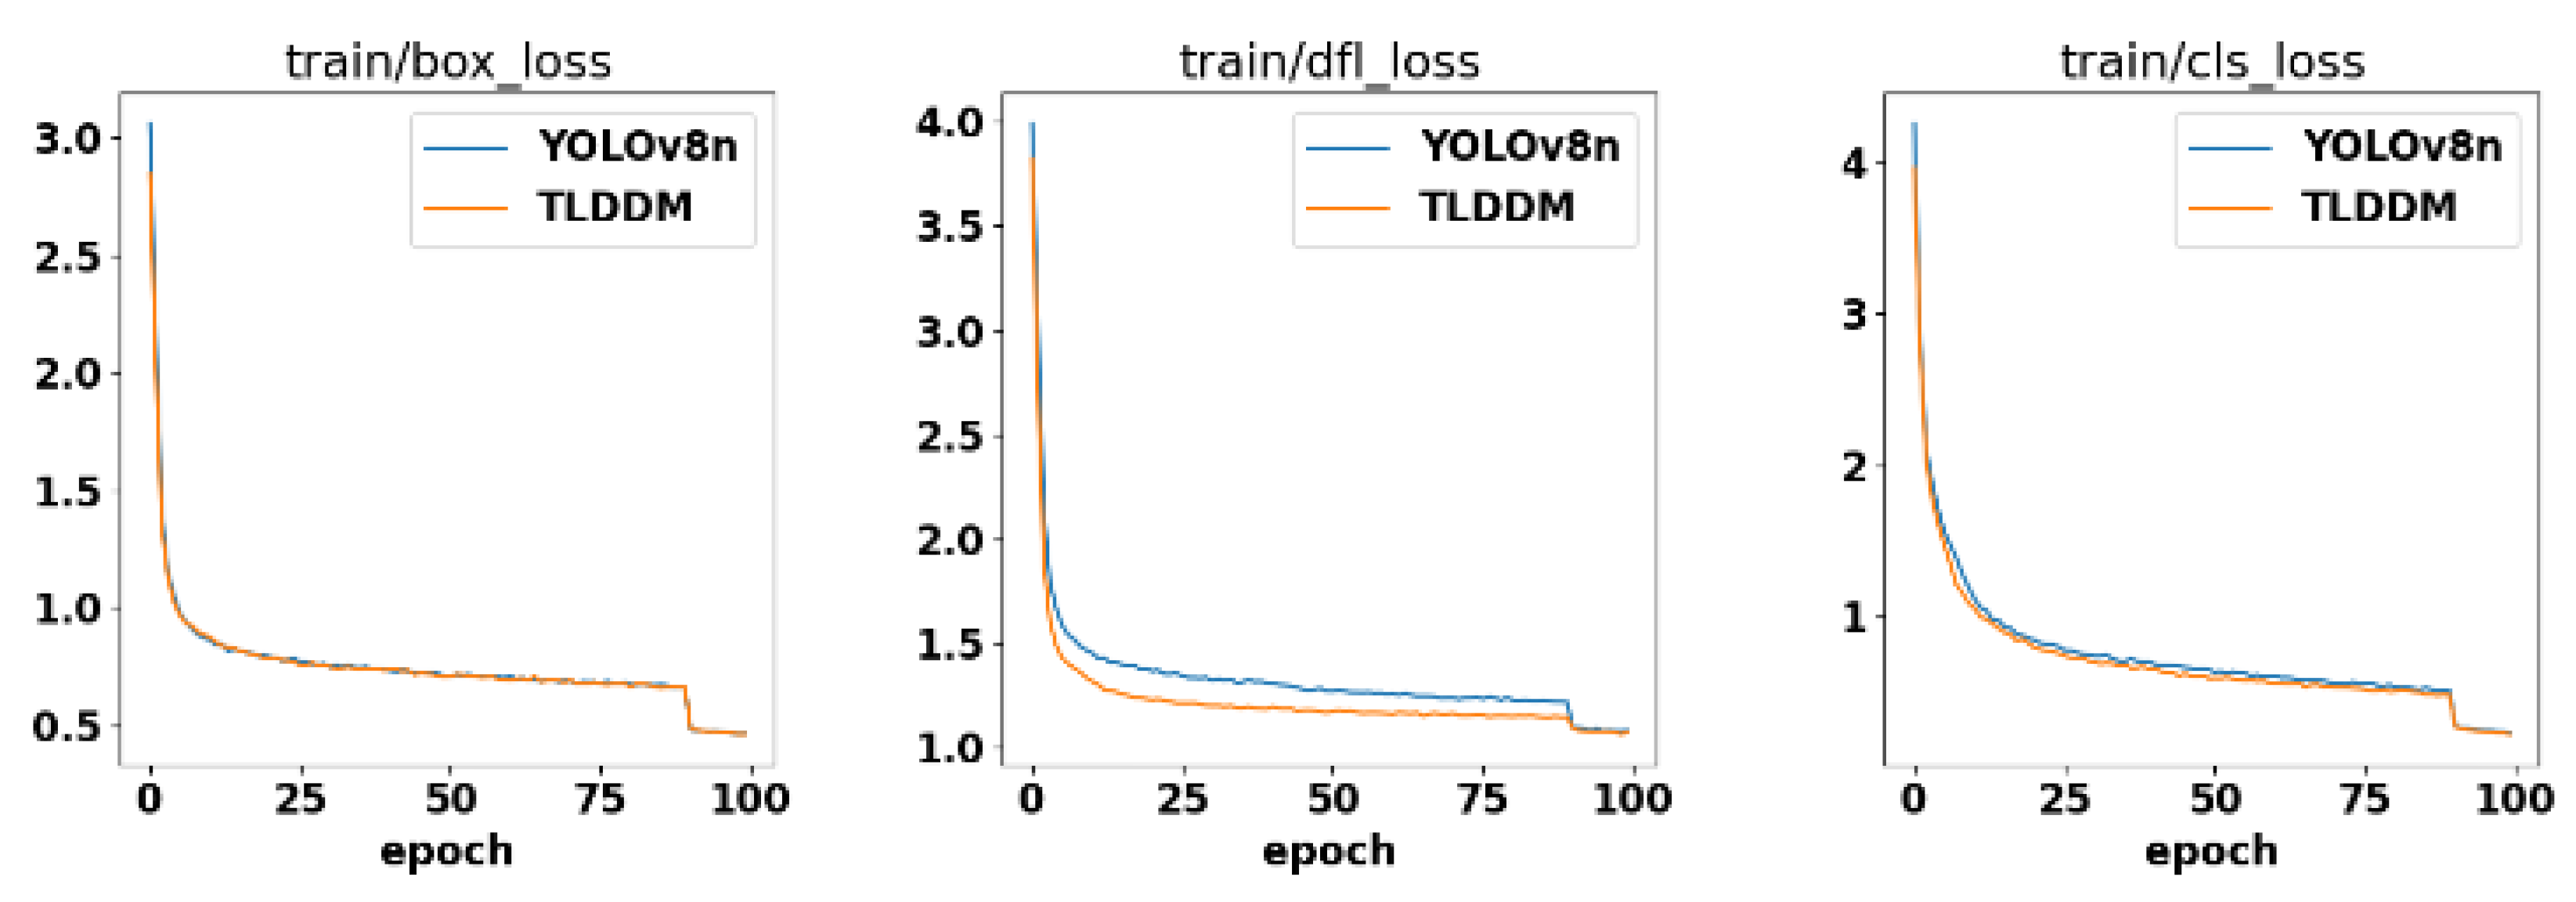
Figure 13.
Heat map visualization results.
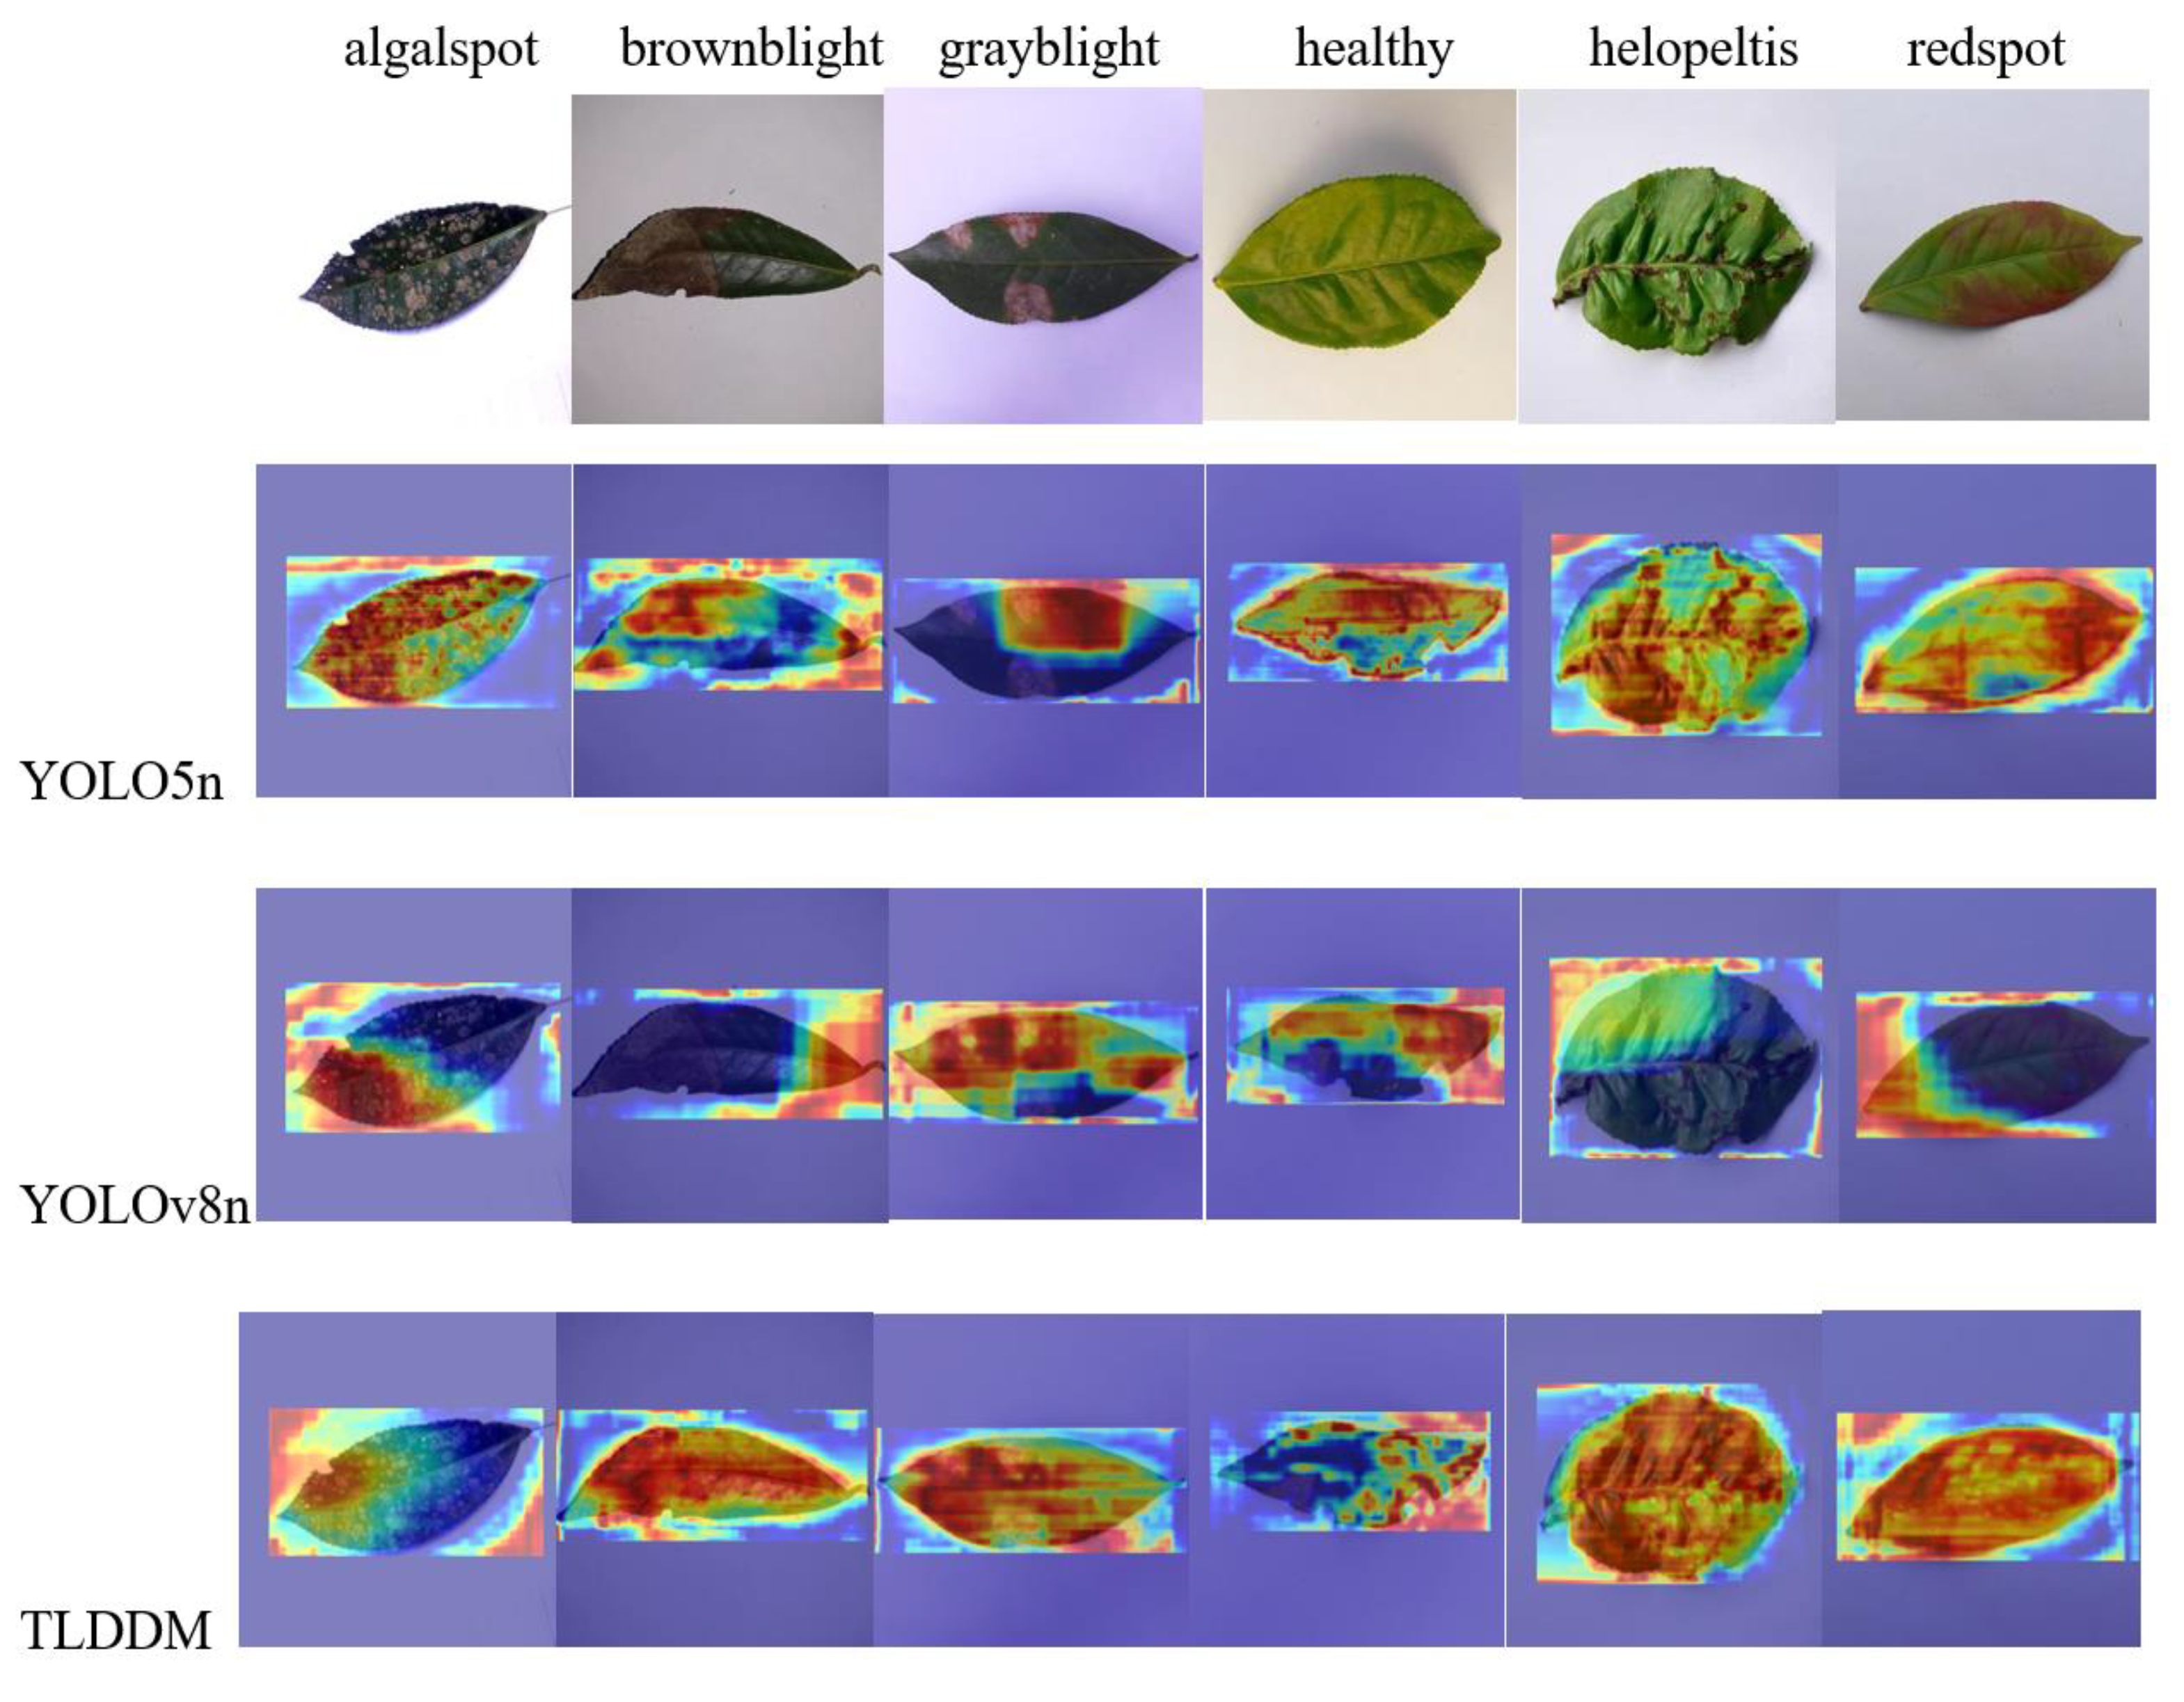

Table 1.
Dataset partitioning.
| Train | Val | Test | |
|---|---|---|---|
| algal spot | 681 | 109 | 210 |
| brown blight | 612 | 81 | 174 |
| gray blight | 714 | 92 | 194 |
| healthy | 693 | 104 | 203 |
| helopeltis | 718 | 95 | 187 |
| redspot | 688 | 106 | 206 |
Table 2.
Parameters Set.
| Training parameters | Value |
|---|---|
| Momentu | 0.937 |
| Weight_decay | 0.0005 |
| Batch_size | 16 |
| Learning_rate | 0.01 |
| Epochs | 101 |
Table 3.
Ablation results.
| Model | C2f-Faster-EMA | DAttention | Slimneck | Efficient PHead |
AP(%) | Fps | F1 | Size(MB) |
|---|---|---|---|---|---|---|---|---|
| YOLOv8n | 97.9 | 82.0 | 0.87 | 6.3 | ||||
| Model1 | ✔ | 98.0 | 64.1 | 0.97 | 5.5 | |||
| Model2 | ✔ | ✔ | 98.1 | 69.5 | 0.98 | 6.0 | ||
| Model3 | ✔ | ✔ | ✔ | 97.8 | 77.5 | 0.98 | 5.6 | |
| TLDDM | ✔ | ✔ | ✔ | ✔ | 98.0 | 98.2 | 0.98 | 4.3 |
Table 4.
Comparison of results.
| Model | Weight/MB | AP/% | fps | Precision/% | Recall/% |
|---|---|---|---|---|---|
| Faster R-CNN | 111.5 | 77.68 | 20 | 75.34 | 79.21 |
| SSD | 102.7 | 73.96 | 44 | 73.45 | 76.17 |
| YOLOv3tiny | 17.0 | 80.6 | 20.9 | 68.6 | 78.4 |
| YOLOv5n | 5.0 | 98.0 | 69.4 | 98.82 | 96.89 |
| YOLOv7tiny | 11.7 | 97.1 | 88.3 | 90.69 | 94.16 |
| YOLOv8n | 6.0 | 97.9 | 82 | 98.3 | 96.8 |
| TLDDM | 4.3 | 98.0 | 98.2 | 98.34 | 96.57 |
Disclaimer/Publisher’s Note: The statements, opinions and data contained in all publications are solely those of the individual author(s) and contributor(s) and not of MDPI and/or the editor(s). MDPI and/or the editor(s) disclaim responsibility for any injury to people or property resulting from any ideas, methods, instructions or products referred to in the content. |
© 2025 by the authors. Licensee MDPI, Basel, Switzerland. This article is an open access article distributed under the terms and conditions of the Creative Commons Attribution (CC BY) license (http://creativecommons.org/licenses/by/4.0/).
Copyright: This open access article is published under a Creative Commons CC BY 4.0 license, which permit the free download, distribution, and reuse, provided that the author and preprint are cited in any reuse.


