Submitted:
07 July 2025
Posted:
09 July 2025
You are already at the latest version
Abstract
Rice leaf disease poses a significant threat to global food security and ecological stability. While existing studies predominantly concentrate on detecting symptoms after visible lesions emerge, early-stage disease features—which are often subtle—are critical for timely intervention. This paper introduces a novel detection approach based on an enhanced YOLOv11n architecture, tailored for the precise and efficient recognition of early-stage rice leaf disease indicators. To address the limitations of traditional detection techniques in identifying fine-grained features, we propose three key modules: the Multi-branch Large-kernel Fusion Depthwise (MLFD) module, the Multi-scale Dilated Transformer-based Attention (MDTA) module, and the Lightweight Detection Head (Lo-Head). The MLFD module enhances multi-scale feature extraction via parallel pathways and depthwise convolutions with large kernels. The MDTA module integrates both spatial and channel attention through a multi-head mechanism, improving the representation of diverse lesion features. Meanwhile, the Lo-Head detection head significantly reduces model complexity and parameter count, facilitating deployment on edge devices without compromising accuracy. Experimental results show that the proposed network achieves substantial performance gains. At an input resolution of 640×640, the model reaches a mean Average Precision (mAP@50:95) of 0.7927—an increase of 1.84 percentage points over the baseline YOLOv11n. It also outperforms Faster R-CNN, YOLOv5n, YOLOv8n, and YOLOv10n by 17%, 7.2%, 3%, and 2.5% respectively, while maintaining a low computational load of 6.2 GFLOPs and 2.66M parameters. These findings underscore the model’s potential for real-world agricultural applications, particularly in enabling early detection and precise disease control. The proposed method represents a step toward proactive plant health monitoring and precision agriculture.
Keywords:
rice leaf disease detection
; YOLO
; multi-branch feature learning
; multi-head attention
; lightweight detection
1. Introduction
Rice is an irreplaceable staple food on which a large number of people around the world depend, and it dominates agricultural production in many Asian countries. Rice has a high yield per unit area and can efficiently utilize land resources; therefore, protecting the healthy growth of rice is to protect food security, which not only improves the economic efficiency of the land, but also maintains the ecological balance [1,2]. As the world’s largest producer and consumer of rice, China has ranked first in the world in terms of total rice production for many years. However, in recent years, with climate change, planting structure adjustment, and the occurrence of pests and diseases, rice production faces many challenges [3]. Among them, a number of rice leaf diseases such as rice blast, brown spot, bacterial streak, and blight are particularly prominent, posing a serious threat to food security [4]. Rice blast is a fungal disease caused by fungi and is the most complex and potentially harmful of all rice diseases. It can occur throughout the entire process of rice growth and is characterized by multiple sites of infestation and long duration of damage. The disease causes diamond-shaped, oval or fusiform spots on the leaves with gray or white centers and brown edges, which can lead to complete drying of the leaves in severe cases, affecting the photosynthesis and growth of rice, and ultimately resulting in reduced yields [5]. Brown spot is also a fungal disease that appears as small oval spots that are initially light brown and then darken with a yellow halo. These spots cause necrosis of leaf tissue [6]. Bacterial Stripe Disease A bacterial disease caused by bacteria. Under favorable conditions of warmth, high humidity, rainfall and deep water, the bacteria invade rice leaves and form small dark green translucent watery spots that gradually expand into yellowish brown streaks between the leaf veins [7]. Stripe blight is a fungal disease caused by a fungus that infects rice stalks, leaf sheaths, or leaves at the base of the stalks, forming dark green water-soaked blotches with fuzzy edges, which eventually expand into cloudy spots. These spots can lead to leaf dieback, reduced seed fullness, and even collapse or dieback of the entire rice plant [8]. Traditional disease detection methods mainly rely on manual experience, which is inefficient and subjective and difficult to meet the needs of modern agriculture. Therefore, the development of efficient and accurate disease detection technology is of great significance for improving disease prevention and control ability and guaranteeing food security [9].
Early detection and precise identification of rice diseases are key aspects of disease prevention and control. In recent years, image-based target detection technology has gradually become a research hotspot in the field of disease detection due to its efficiency, objectivity and scalability [10]. Early diagnosis and precise localization of diseases can be achieved by acquiring leaf images from high-resolution cameras or drones, combined with advanced image processing and machine learning algorithms [11]. There are two main types of research on disease detection in rice or other plants in agriculture. One is a two-stage detection model based on candidate frames, which is typically represented by networks such as Faster R-CNN [12] and Mask-RCNN [13] , which are able to improve detection accuracy by generating candidate frames during the detection process. The other is a phase of regression-based detection networks such as YOLO [14] and SSD [15] , which are known for their remarkable real-time detection speed. Among them, the YOLO network has been iterated in several versions in recent years to further improve the detection accuracy and detection speed, and has been widely used in product defect detection in industry and large area detection of fruits and leaves in agriculture [16].
Existing studies have made some progress in plant leaf detection, such as Ramadan,et al. [17] Augmentation of rice leaf data using Generative Adversarial Networks (GANs) effectively enlarges the dataset size, increases the data diversity, and reduces the risk of fitting, thus improving the detection capability.Tao J, et al. [18] Proposes a lightweight detection network based on YOLOv11n, CEFW- YOLO, through channel compression convolution and cross-channel attention, improves the ability to capture global features, and improves the detection accuracy and robustness. Wang, Chun, et al. [19] By improving YOLOv8, it achieves a mAP as high as 94.8, which not only recognizes fresh leaves of tea tree, but also can be graded. Xu, Kang, et al. [20]Proposed a new detection network SPLDPvB to accurately identify leaf spot disease and pests in sweetpotato. Zhou, Siyi, et al. [21] contributed a new method for high-precision detection of gray spot disease in apple cultivation. Shi, Hang, et al. [22] improved the detection accuracy of cabbage seedlings in the field by introducing CBAM [23] and BiFPN [24]. Abulizi, Abudukelimu, et al. fused the mAP in YOLOv9 with a high accuracy of 94.8 mAP, which not only can recognize fresh leaves of tea tree but also can grade them. [25]Incorporating DySample [26] in YOLOv9 enhances the extraction of small lesion features and suppresses the interference of the background environment, in addition to the use of MPDIoU [27] for the learning of tomato leaf lesion edges, which improves the detection ability of the model. Zhou, Hongliang, et al. [28] introduces cross-modal retrieval into the field of rice leaf lesion retrieval using ViT [29] and BERT [30] to extract the top-line rich fine-grained image and text feature sequences in the text, which are then augmented with bidirectional hybrid self-attention, and finally the warm-up bat algorithm is used to optimize the learning rate [31] , which improves the detection accuracy of the model. Deari [32] uses the combination of classification and detection networks to test the robustness of the rice leaf classification and eliminates the false predictions.
However, existing methods still face many challenges. Li, Pan, et al. [33] solved the problems of field environment and inter- and intra-class differences, but still has the problem of detecting diseases in complex environments and multiple types of diseases. Li, Zhuqi, et al. [34] proposed a tailor-made detection model for rice disease identification, which improves the accuracy, but also reveals the lack of model generalization ability, which is inappropriate for multi-type plant leaf detection. plant leaf detection. Fang, Kui, et al. [35] proposed RLDD-YOLO to significantly improve the localization accuracy and robustness, but there exists a dependence on GPU computing power. Therefore, to address the above difficulties, this study aims to develop an efficient and robust method for rice leaf disease detection that addresses the key issues of complex environmental diversity, lightweighting, and improving the generalization ability of model detection. We proposed a joint multi-disease detection framework based on improved YOLOv11, verified its detection performance through large-scale experiments, and examined the generalization ability of the model through multiple datasets. The method can accurately identify multiple plant leaf disease types and also realize the precise localization of disease spots, which not only provides technical support for early warning and precise prevention and control of rice diseases, but also can be applied to leaf detection of more crops. The main contributions of this study are as follows:
- Multi-branch Large-kernel Fusion Depthwise (MLFD)module is introduced into the backbone, which utilizes the multi-branch structure to enhance the feature learning ability of the model, and at the same time adds a large convolutional kernel to extract a wide range of contextually complex features.
- MDTA (Multi-scale Dilated Transformer Attention) module: Captures contextual dependencies in both channel and spatial dimensions via dilated self-attention.
- Lo-Head detection head:Reduces model complexity by optimizing the bounding box and classification branches using grouped and depthwise convolution strategies,enabling the model to achieve a better balance between efficiency and performance.
- Multiple datasets such as rice leaves, potato leaves and tomato leaves were used for disease detection, and the results of the generalization experiments were compared, demonstrating the model’s excellent ability to detect diseases across plant classes.
2. Materials and Methods
2.1. Data Set
The dataset RiceLeaf Disease used in the first stage of this study is from robotflow website, with original images provided by DreamyDaisy, totaling 2695 images of rice leaf diseases, including Bacteria Leaf Blight, Brown Spot, Rice blast and other typical disease types. In order to solve the overfitting caused by insufficient training samples in the experiments, the situations of insufficient light, backlighting, severe shading by multiple leaves and blurred pictures were simulated to a certain extent, and by refining the dataset, the trained model has a stronger robustness.
Despite the availability of a labeled dataset, its limited size presents significant challenges for effective model training. A smaller dataset often fails to encompass the wide variability of rice leaf disease manifestations observed in real-world agricultural environments. Factors such as lighting conditions, viewing angles, seasonal fluctuations, and differing growth stages contribute to substantial visual diversity, which cannot be adequately represented with insufficient data. As a result, the model’s exposure to comprehensive disease characteristics becomes constrained, thereby hindering its capacity to generalize to unseen conditions. Moreover, deep neural networks typically require large-scale, diverse datasets to capture the underlying distribution of feature patterns effectively. In scenarios with limited training data, the risk of overfitting increases—wherein the model achieves high accuracy on training samples but performs poorly on validation or test data. To mitigate these limitations, this study applies a set of data augmentation techniques to artificially expand the dataset. These augmentations include random horizontal flips and small-angle rotations ranging from -15° to +15°, brightness adjustments varying between -30% and +30%, and the addition of Gaussian noise with a density of 3.74% per pixel. After augmentation, the dataset was expanded to 6,715 images, offering richer visual diversity for training. All images were cropped and normalized such that the disease lesions were centrally located, and uniformly resized to 640x640 pixels to match the input requirements of the network. The enhanced dataset was split into training, validation, and test subsets in a ratio of 8:1:1. A visual example of the dataset is provided in Figure 1.:
2.2. General Technical Route
In this study, the development of a rice leaf disease detection network based on improved YOLOv11 is systematically carried out by strictly following the standardized process of deep learning model development. The research process begins with a comprehensive and accurate data preparation phase, which is designed to lay a solid foundation for subsequent model training. In the data preprocessing stage, various data enhancement operations are performed to improve the data quality. In the model design and optimization phase, improved algorithms are cleverly integrated to enhance the model performance, and the model training phase is refined with efficient algorithms to accurately learn rice leaf disease characteristics. The performance evaluation and testing phase includes internal validation and external testing, and objectively evaluates the model performance based on predefined indicators, and optimizes and iterates the model when problems are found. Finally, the trained model is applied to the test data for reasoning and validation, and its effectiveness in real-world scenarios is examined in a rigorous scientific manner. The whole research process is closely connected at all stages, and the detailed flow is shown in Figure 2.
2.3. The Proposed MML-YOLO
First, we replace the original C3k2 component in YOLOv11n with a novel Multi-branch Large-kernel Fusion Depthwise (MLFD) module. This module employs a parallel multi-branch topology, allowing the network to learn complementary features across different processing paths. Internally, it integrates depthwise separable convolutions and large-kernel operations to enhance both feature extraction depth and receptive field diversity. Each branch unit—referred to as a Block—is implemented using a DepthBottleneckUniv2 structure, which balances computational cost with expressive capacity.
To improve contextual representation and mitigate the limitations of channel-wise attention in multi-scale settings, we introduce the Multi-scale Dilated Transformer Attention (MDTA) module. This module leverages Transformer-inspired attention mechanisms with spatial dilation, enabling it to capture long-range dependencies and minimize attention blind spots across feature scales. Within MDTA, CA refers to Channel Attention, while SA denotes Spatial Attention, reflecting the dual-path attention design.
Finally, the standard detection head is replaced by a lightweight variant named Lo-Head, which significantly reduces the number of parameters and floating-point operations. This redesign makes the architecture more suitable for deployment on edge devices and real-time agricultural platforms.The complete structure of the MML-YOLO network is illustrated in Figure 3, showing the integration of MLFD, MDTA, and Lo-Head modules within the overall pipeline.
2.3.1. MLFD Module
In the task of disease detection on rice leaves or other plant leaves, a lightweight and efficient detection network is often able to strike a balance between speed and accuracy. Therefore, after considering the resource requirements and performance requirements, it was decided to conduct an in-depth study based on YOLOv11n to solve the problems in real-world applications. The C3k2 module in the original network is able to capture multi-scale features by combining convolutional kernels of different sizes, which improves the model’s ability to detect targets of different sizes. However, in some cases, its multi-scale feature fusion and the combination of different convolutional kernels will increase certain computational complexity and affect the real-time performance of the model. Moreover, for very small targets, the C3k2 module may not be able to fully capture their detailed features, resulting in relatively low detection accuracy for small targets. On the other hand, the original module is not sufficient to solve the variations of shading, light and some small target diseases due to the special characteristics of the detection targets are all in the natural environment, resulting in diverse and complex input data. This makes the original C3k2 module weak in disease detection of rice leaves.
The Multi-branch Large-kernel Fusion Depthwise (MLFD) module is designed to improve feature diversity and enhance semantic representation by combining a parallel branching structure with efficient inter-branch fusion mechanisms. As illustrated in Figure 4, the input feature map is processed simultaneously through several branches (see subfigure (a)), where each branch contains multiple DepthBottleneckUniv2 units. These units are responsible for extracting features along independent paths, thereby capturing complementary spatial information.To enhance the synergy between branches, the MLFD module incorporates a cascaded fusion mechanism and utilizes ELAN-style feature concatenation to merge representations (as depicted in subfigure (b)). This cross-branch interaction facilitates improved information flow, ensuring the network can learn more expressive and discriminative features. The internal structure of the DepthBottleneckUniv2 unit—shown in subfigure (c)—is composed of depthwise and pointwise convolutions, designed to balance computational efficiency and representation capacity.
Within the MLFD pipeline, the data flow proceeds as follows: Given an input feature map of size , a 1x1 convolution is first applied to adjust the number of channels to an intermediate value , resulting in an output of size . Each branch then applies a stack of DepthBottleneckUniv2 blocks, which perform both depthwise separable convolutions and conventional convolutions to capture essential features with minimal computational overhead. Through cascaded residual connections, features from preceding branches are propagated to subsequent branches, enriching the feature space.Finally, the outputs from all branches are aggregated and passed through a normalization layer (BatchNorm) and an activation function such as SiLU to ensure training stability and accelerate convergence. The overall operation of the module can be mathematically expressed as:
where is the output tensor, DBUv2 refers to the DepthBottleneckUniv2 unit, conv represents a standard convolution, BN is batch normalization, and SiLU is the activation function.
The MLFD module addresses several challenges in disease detection under real-world field conditions, particularly for small-scale targets embedded in cluttered backgrounds. First, the parallel multi-branch structure increases the model’s representational flexibility, enabling it to capture lesion features at various scales, orientations, and shapes. Second, the use of depthwise separable convolutions substantially reduces both parameter count and floating-point operations, making the module suitable for low-power or embedded hardware platforms.
Moreover, the feature aggregation strategy ensures that spatially distinct features can be integrated via residual and ELAN-style connections, thereby enhancing the overall feature expressiveness. The use of large convolutional kernels further allows the model to access extended spatial context, which is critical for recognizing lesions with complex boundaries or subtle textural variations. Lastly, the MLFD module exhibits adaptive fusion behavior, meaning it dynamically adjusts to different types of features during training, making it versatile across various detection scenarios.These design advantages make MLFD an effective module for improving both accuracy and efficiency in real-time agricultural disease detection systems.
2.3.2. Execution Process of the MDTA Module
In rice leaf disease detection, the diversity and complexity of leaf lesions pose a challenge for accurate identification. The original C2PSA module is deficient in capturing the directionality and subtle changes of lesion features, especially in natural environments, where factors such as light variations and leaf shading further exacerbate the detection difficulty. In order to enhance the detection performance of the model under complex conditions, we propose a new module Multi-scale Dilated Transformer-based Attention, or MDTA for short, which enhances the model’s ability to capture lesion features by fusing multi-scale convolution and spatial and channel attention.The main network structure of MDTA is illustrated is shown in Figure 5:
The Multi-scale Dilated Transformer Attention (MDTA) module enhances both channel-wise and spatial representations of feature maps through a two-stage attention mechanism: Channel Group Attention (CGA) and Window Multi-head Attention (WMA). These two components are executed sequentially to reinforce complementary information at different levels of the feature hierarchy.
The CGA design draws inspiration from the group interaction mechanism in Restormer [36]. It begins by decomposing the input tensor into query (), key (), and value () matrices using a convolutional layer. The attention map is computed by first applying scaled dot-product attention between queries and keys, followed by weighted aggregation over the values. The entire input tensor is first normalized via LayerNorm, which helps stabilize the mean and variance across feature dimensions and accelerates convergence.
Let the input tensor be denoted as , where B, C, H, and W represent the batch size, number of channels, height, and width, respectively.The channel attention weights are computed as:
where represents the channel attention matrix, and denote the query and key matrices, and is the dimensionality of the key vectors. The result is then used to weight , yielding a refined output with enhanced inter-channel dependencies.
Subsequently, the processed tensor is passed to the WMA module, which performs local attention computation within fixed-size windows. This design is conceptually similar to the shifted window-based self-attention mechanism proposed in Swin-Transformer [37]. The input feature map is partitioned into non-overlapping spatial windows. Within each window, attention is computed independently to capture localized spatial correlations.In each window, queries, keys, and values are generated via pointwise () convolutions, and the spatial attention is computed as follows:
Here, denotes the spatial attention matrix within a window, and is the dimensionality of the query vectors. After attention is applied within all windows, their outputs are concatenated to restore the original spatial resolution of the feature map.Following the attention layers, the MDTA module employs a feed-forward network (FFN) consisting of dilated convolutions and non-linear activation to further process the attended features. This stage deepens the feature abstraction and improves the model’s capacity to encode complex visual patterns.
The MDTA module proves particularly effective in capturing fine-grained lesion characteristics of rice leaf diseases, including scale variations and orientation diversity. The use of directional convolution helps the network respond to features across multiple angles, thereby enhancing sensitivity to local lesions. Additionally, the channel interaction mechanism facilitates improved communication across feature channels, enabling the model to exploit inter-channel correlations more effectively. Empirical results show that the proposed MDTA architecture consistently outperforms the baseline C2PSA attention module in both accuracy and robustness. Its ability to handle spatial heterogeneity and multi-scale patterns makes it a valuable component for disease detection tasks in complex field environments.
2.3.3. Lo-Detect Head.
The Lo-Detect module shows significant performance advantages in the rice leaf disease detection task, especially in improving detection accuracy, reducing computational complexity and enhancing model adaptability, providing a new solution for realizing efficient and accurate disease identification. Its network structure is shown in Figure 6:
The Stem module within the Lo-Detect detection head incorporates two sequential 3×3 group convolutional layers, effectively reducing both parameter count and computational burden. In group convolution, the input channels are divided into multiple groups, with each group undergoing independent convolution operations. The resulting outputs are subsequently concatenated along the channel dimension to form the complete feature representation. This design not only minimizes computational overhead but also preserves essential spatial and semantic information within the feature maps. As a result, the module is well-suited for deployment on resource-constrained embedded devices, supporting real-time processing in practical agricultural environments.
Lo-Detect achieves effective feature fusion by employing two dedicated branches: the cv2 module, which extracts bounding box regression features, and the cv3 module, which generates class probability features. During the fusion process, outputs from these two branches are concatenated along the channel dimension, enabling the network to integrate spatial and semantic cues into a unified representation. This comprehensive fusion improves the model’s capacity to make informed decisions when detecting lesion regions, particularly in complex field conditions. By leveraging the complementary nature of localization and classification features, the model achieves improved performance in rice leaf disease detection.
The Distribution Focal Loss (DFL) module in Lo-Detect can be conditionally activated depending on the value of the reg_max parameter. When reg_max exceeds 1, the DFL mechanism models the discrete probability distribution of bounding box offsets. This probabilistic modeling enables the network to produce more precise boundary estimations by capturing fine-grained variations in object localization.
During inference, the model converts the predicted distribution into continuous offsets using an expectation-based computation. The resulting bounding box coordinates are scaled according to the stride of the feature map. The computation can be formally expressed as:
where represents the final bounding box coordinates, denotes the expected offset values computed from the predicted distribution, and refers to the stride used to rescale coordinates to the input image resolution.
This formulation allows the model to better capture subtle variations in lesion size and position, thereby improving localization accuracy for small or complex disease regions.
If , the DFL module is bypassed to avoid unnecessary computation, enhancing the model’s adaptability and efficiency. During inference, Lo-Detect decodes the output of the DFL module using the dist2bbox function, which transforms the offset-based representation into absolute bounding box coordinates and appends class probability predictions. The entire decoding process can be summarized as:
Here, is the final prediction output containing bounding box positions and corresponding class confidence scores, and represent the anchor priors used for decoding.
Where in Equation (5) is the spliced feature map, and the split operation divides the feature map into bounding box features (box) and category probability features (cls) according to the dimension d. Here, d is defined as , which is used to distinguish the dimensions of bounding box features and category probability features. In Equation (6), is the result after distributional modeling of the bounding box features, anchors are the preset anchor box parameters, and strides are the steps used to resize the bounding box. The formula converts the bounding box features into specific bounding box coordinates through decoding operations, resulting in dbox. In Equation (7), the sigmoid activation function is first applied to the category probability feature, which is converted to a probability value in the range of , and then the decoded bounding box coordinates (dbox) and activated category probabilities () are spliced together in the specified dimensions to obtain the final output y, which contains the bounding box coordinates of the detected target and the corresponding category probabilities. The final output y contains the bounding box coordinates and category probabilities, which provides accurate localization and classification results for disease detection.
The detection head dynamically generates anchor points and steps according to the shape of the input feature map during the training process, ensuring that the model can adapt itself to input images of different sizes. This dynamic adjustment mechanism enables the model to maintain good detection performance in the face of diverse shapes and sizes of rice leaves of different growth stages and varieties, and improves the model’s generalization ability and adaptability. For the small-target disease areas commonly found in rice leaf disease detection, the Lo-Detect detector head is able to capture the detailed features of small targets more effectively through its lightweight and efficient feature extraction and powerful feature fusion capability.
In conclusion, the Lo-Detect detection head shows significant advantages in the rice leaf disease detection task by virtue of its lightweight and efficient feature extraction, powerful feature fusion capability, flexible DFL application, accurate bounding box decoding and classification probability calculation, and superior small target detection performance. It not only improves the accuracy of disease detection, but also reduces the consumption of computational resources, so that the model can better adapt to the complex conditions and diversified needs in the actual application scenarios, and provides powerful technical support for the early identification and precise prevention and control of rice leaf diseases.
2.4. Experimental Platform and Evaluation Metrics
All experiments were conducted on a workstation running Ubuntu 22.04.3 LTS (64-bit). The hardware configuration includes an Intel® Core™ i9-14900K processor clocked at 4.20 GHz, 80 GB of RAM, and an NVIDIA GeForce RTX 4090 GPU with 24 GB of VRAM. The software stack consisted of NVIDIA driver version 550.100, PyTorch 2.6.0, CUDA 12.4, and Python 3.10.8. The model was trained for 300 epochs using a batch size of 32. An initial learning rate of 0.01 was selected based on empirical tuning. The optimizer used was Stochastic Gradient Descent (SGD), coupled with cosine annealing to gradually reduce the learning rate to a minimum value of lrf = 0.01. To accelerate convergence and reduce gradient oscillations, the momentum parameter was set to 0.937. A warm-up strategy was implemented to avoid instability at the beginning of training. The learning rate warm-up lasted for the first 3 epochs, during which the learning rate increased linearly from 0.1, and the momentum started at 0.8. These strategies improved convergence stability and training effectiveness. The model’s performance was evaluated using standard object detection metrics, including GFLOPs, FPS, Precision, Recall, and mean Average Precision (mAP). The definitions are as follows:
Here, refers to true positives (correctly detected disease regions), indicates false positives (incorrect detections), and denotes false negatives (missed detections). The metric mAP consists of two variants: mAP@0.5 and mAP@0.5:0.95. The former is computed at a fixed IoU threshold of 0.5, while the latter averages AP values across thresholds from 0.5 to 0.95 with an interval of 0.05. Each AP is derived as the area under the Precision-Recall curve, and mAP is the average of AP across all categories.
3. Results
3.1. Selection of Baseline Model
Five versions of network models of YOLOv11 were used separately to train the research subjects of this experiment under the same experimental conditions to determine their efficacy in rice leaf disease detection, and the results are shown in the Table 1. The analysis of this table shows that YOLOv11n has a lower P of 1.87%, 2.85%, 2.26%, 2.99%, and a lower R than Yolov11s, Yolov11m, Yolov11l, and Yolov11x, respectively, compared to the other versions. However, in terms of mAP@50 performance, the difference between the YOLOv11n version and the remaining four versions is less than 1%.The computational volume of YOLOv11n is 6.3GFLOPs, the number of parameters is 2.58M, and the size of the model is 5.2M, which are far better than the other four models, and also taking into account the differences in the model precision, the recall rate, and the mAP@50, and on the basis of guaranteeing the detection accuracy and network efficiency, YOLOv11n is selected as the benchmark model for this experiment.
3.2. Ablation Experiments
To evaluate the individual and combined contributions of the MLFD, MDTA, and Lo-Head modules within the proposed MML-YOLO framework, a series of ablation studies were conducted. The detailed results of these experiments are summarized in Table 2. As shown in Table 2, the incorporation of these custom-designed modules leads to substantial performance improvements over the baseline model. The original YOLOv11n architecture, used here as the benchmark, attains a precision of 0.9627, recall of 0.9517, mAP@0.5 of 0.9812, and mAP@0.5:0.95 of 0.7743, with a total model size of 5.2 MB. These baseline metrics provide a foundation for assessing the effectiveness of each architectural enhancement introduced in this work.
After the introduction of the MLFD module alone, its precision is improved from 0.9627 to 0.9754, and the recall is also improved to a lesser extent, with mAP@50 and mAP@50:95 increasing to 0.9820 and 0.7806, respectively. The computational demand rises from 6.3 to 7.2 GFLOPs compared to the baseline model, and the number of covariates increases from 2.58 to 2.92. Meanwhile, the FPS drops from the original 330.35 to 247.02. The improvement in precision demonstrates the advantage of the multi-branch multi-path learning of the MLFD module.
When only the MDTA module is introduced, its number of parameters and computation increase by 12% and 19%, respectively, compared with the benchmark model. However, its mAP@50:95 improves by 0.98 percentage points. There are also improvements in precision, recall, and mAP@50, but this also results in an increase in the model size. The introduction of the MDTA module fully demonstrates the effective enhancement brought to the overall network by its multi-head attention mechanism.
The addition of the Lo-Head detection head makes the overall number of parameters, computation, and model size of the network more lightweight. Its FPS performance is improved by nearly 25 compared to the original benchmark network. Although there is a slight decrease in accuracy, it does not affect the overall detection performance of the network. This reflects that the detection head is more concise and efficient in structure, and can achieve better detection results with lower computational cost, which is a significant improvement and enhancement compared with the original Detect detection head.
The combined use of the MLFD module and the MDTA module allows the overall network to reach its peak detection performance. Compared to the benchmark model, there is a total improvement of 1.98 percentage points in the mAP@50:95 metric. This enhancement highlights the excellent ability of the fusion of deeply separable convolution and large convolutional kernels with multi-head attention to handle complex features. At the same time, considering its disadvantages in terms of computation, number of parameters, FPS, and model size, continued experimentation is needed.
The fusion of the MDTA module and Lo-Head detection head gives the model a more balanced performance in terms of accuracy and lightweight. The mAP@50 is improved by 1.4 percentage points compared to the baseline model, and the model size for the fused network model of MDTA and Lo-Head is only 6MB, compared to 7.1MB for the MDTA module only. This result effectively demonstrates that the Lo-Detection Head can still perform lightweighting when fused with other modules. Similarly, the fusion of the MLFD module and the Lo-Head module also shows significant progress in terms of model lightweighting. Moreover, the FPS of the model is improved compared to when only the MLFD module is introduced.
Combining the above experiments, this paper carried out the final fusion of the MLFD module, MDTA module, and Lo-Head model, i.e., MML-YOLO. The experimental results show that the precision of the three-module fusion has been improved from 0.9627 to 0.9726, and the recall has been improved from 0.9517 to 0.9553. The mAP@50 increases from 0.9812 to 0.9872, and the mAP@50:95 improves from 0.7743 to 0.7927, resulting in a total improvement of 1.98 percentage points. The model size is only 0.4 MB larger than the baseline model size, which is acceptable when considering its improvement in detection accuracy and the level of hardware deployed in practical applications. The integrated network shows significant improvement in the detection accuracy, robustness, and lightweighting for rice leaf diseases.
3.3. Comparison Experiment
In order to further validate the effectiveness of the MML-YOLO model for rice leaf disease detection, a comparison experiment was conducted in this section following the steps. These include FasterRCNN, YOLOv5n, YOLOv8n, YOLOv10n, and YOLOv11n. All of these experiments are trained in the same hardware and software environment and all use the same dataset. The experimental results are shown in Table 3.
The proposed MML-YOLO model demonstrates superior performance compared to the classical two-stage detector Faster R-CNN. Specifically, Faster R-CNN achieves a precision of 0.842, recall of 0.827, mAP@0.5 of 0.9576, and mAP@0.5:0.95 of 0.676. In contrast, MML-YOLO attains substantially improved results across all key metrics, including a precision of 0.9726, recall of 0.9540, mAP@0.5 of 0.9872, and mAP@0.5:0.95 of 0.7927.In terms of inference speed, MML-YOLO achieves a frame rate of 248.67 FPS, significantly surpassing the 88.9 FPS reported for Faster R-CNN, thereby confirming its suitability for real-time applications. Moreover, the MML-YOLO model also excels in lightweight deployment aspects, including lower computational cost, reduced parameter count, and smaller model size. When compared to state-of-the-art lightweight detectors such as YOLOv5n (mAP@0.5:0.95 = 0.7396), YOLOv8n (0.7693), YOLOv10n (0.733), and the baseline YOLOv11n (0.7743), MML-YOLO consistently outperforms them in detection accuracy. These results collectively underscore the model’s comprehensive advantages in accuracy, speed, and deployment efficiency, making it a compelling choice for practical agricultural use cases.Furthermore, comparative analysis of visual outputs—particularly heatmaps derived from the input image, YOLOv11n, and MML-YOLO predictions—highlights the enhanced detection sensitivity of MML-YOLO in identifying lesion regions on rice leaves. As illustrated in Figure 7, MML-YOLO provides more accurate localization and stronger activation responses than the baseline, reinforcing its effectiveness for field deployment.
3.4. Generalization Experiment
To further substantiate the superior performance of the MML-YOLO model in detecting leaf diseases across a broad spectrum of plant species, an additional generalization experiment was conducted. Beyond the rice leaf disease detection dataset introduced earlier in this study, we expanded our evaluation to include three more diverse datasets sourced from the Roboflow platform: Rice Leaf-3G, which comprises 54,970 images covering four distinct disease categories—Bacterial Blight, Brownspot, Sheath Blight, and Rice Blast; Pomato Leaf Diseases, featuring 7,172 images across two disease types, namely Early-Blight and Late-Blight; and Tomato Leaf Diseases, consisting of 4,128 images with eight disease classifications, including Early Blight, Late Blight, Leaf Miner, Leaf Mold, Mosaic Virus, Septoria, Spider Mites, and Yellow Leaf Curl Virus. The results of these generalization experiments are presented in Figre Figure 8. Notably, MML-YOLO demonstrates superior mAP performance at @50:95 compared to other lightweight YOLO variants. This evidence underscores the model’s efficacy and adaptability in detecting diseases on a wide range of plant leaves. We posit that MML-YOLO’s deployment on appropriate hardware platforms has the potential to significantly enhance its utility in agricultural production, enabling faster and more accurate disease detection in real-world applications.
4. Discussion
In this study, we present a new method for rice leaf disease detection based on an improved version of the YOLOv11 architecture, called MML-YOLO. the method introduces three key modules: multibranching large convolutional kernel fusion with deep convolution (MLFD), multiscale expanding Transformer Attention (MDTA), and lightweight Lo-Head detection head. Together, these modules address multiple challenges faced by traditional approaches, such as dealing with complex backgrounds, detecting small targets, and ensuring model efficiency in resource-constrained environments.The MLFD module, through its multi-branching structure, enables the model to learn diverse feature representations, specifically enhancing its ability to capture features at different spatial scales. By using a large convolutional kernel, MLFD significantly improves context extraction, which is crucial for detecting disease features under various conditions. In addition, the MDTA module enables the model to better adapt to the complex variations of disease manifestations at different scales by combining the channel and spatial attention mechanisms to effectively detect fine-grained features.The Lo-Head module, on the other hand, reduces the computational burden of the model and ensures fast inference speeds through its lightweight design, making the scheme suitable for real-time applications. Experimental results show that the MML-YOLO network exhibits superior performance in terms of precision, recall, and mAP, and achieves significant improvement over existing methods. Especially in the mAP@50:95 metric, as shown in Figure 9.The model improves from 0.7743 to 0.7927, which shows the effectiveness of the proposed module.The fusion of MLFD, MDTA, and Lo-Head not only improves the detection accuracy, but also leads to a significant increase in computational efficiency, and the size of the model only increases by 0.4MB compared to the baseline.These advances are crucial for realistic agricultural scenarios where computational resources are usually limited and the need for real-time, accurate disease detection is critical. In addition, after extensive generalization experiments, MML-YOLO shows good adaptability in a wide range of plant disease detection, further demonstrating its robustness and scalability. This suggests that precision agriculture integrating such advanced deep learning models has a promising future, and real-time disease monitoring can significantly enhance crop management and disease prevention strategies.
However, despite the remarkable results achieved by MML-YOLO in experiments, there is still some room for research and improvement. One of the main challenges is the ability of the model to generalize across a wider range of environmental conditions and plant species. Currently, the model performs well in controlled experimental environments, but deploying it to diverse real-world agricultural environments with varying light conditions, leaf shading, and complex backgrounds remains challenging. In addition, model training has focused on rice leaf diseases, and expansion to other crops (e.g., coffee, chili peppers, or maize) will require additional data support as well as further optimization of the detection module. Future work will involve extending the dataset to include a wider variety of crop diseases and improving the model’s ability to handle this diversity without sacrificing detection performance. Additionally, when deploying this network to edge devices (e.g., agricultural robots or drones), hardware limitations will need to be addressed to ensure that inference time is minimized while maintaining high detection accuracy.
5. Conclusions
This study addresses the core challenges associated with rice leaf disease detection in complex natural environments, including high computational demands, limited adaptability to diverse backgrounds, and insufficient performance in identifying small-scale lesions. Additionally, through generalization experiments, the proposed approach demonstrates promising applicability to broader plant leaf disease detection tasks.To this end, we introduce a lightweight detection framework named MML-YOLO, built upon the YOLOv11n architecture and augmented with three novel modules: MLFD, MDTA, and Lo-Head. The MLFD module enhances multi-scale feature extraction through a multi-branch architecture and large kernel designs, enabling more robust representation under variable conditions. The MDTA module incorporates both spatial and channel attention mechanisms, improving the model’s capacity to capture fine-grained and hierarchical features. Meanwhile, the Lo-Head detection head is streamlined for efficiency, removing redundant convolutional operations to reduce computational load while maintaining competitive accuracy.
Thanks to its lightweight architecture and targeted enhancements, MML-YOLO exhibits a favorable trade-off between performance and efficiency, making it particularly suitable for deployment on resource-constrained edge devices. Experimental results confirm that MML-YOLO outperforms several baseline and contemporary detection models, particularly in the mAP@0.5:0.95 metric, where it achieves a substantial performance boost. These findings validate the proposed architecture’s effectiveness across both accuracy and deployment readiness.While the results in rice leaf disease detection are highly promising, the generalization experiments also suggest MML-YOLO’s potential for broader agricultural applications. Nevertheless, certain limitations remain—especially regarding the diversity and availability of annotated plant disease datasets. Many crop disease types are caused by a wide range of environmental and biological factors, and acquiring balanced datasets for various species remains a challenge.
Future research will aim to expand the dataset across multiple growth stages and disease types of rice and other crops. By incorporating samples from crops such as coffee, pepper, peanuts, and corn, we intend to further enhance the model’s generalization capability. Moreover, future efforts will involve deploying MML-YOLO onto agricultural robots in real-world scenarios. Such deployment would allow for real-time detection and early intervention in field conditions, thereby maximizing the network’s practical value in intelligent agricultural systems and contributing to more efficient crop management and disease control.
References
- Liu, X.; Li, Q.; Yin, B.; Yan, H.; Wang, Y. Assessment of macro, trace and toxic element intake from rice: differences between cultivars, pigmented and non-pigmented rice. Scientific Reports 2024, 14, 10398. [Google Scholar] [CrossRef] [PubMed]
- Mukherjee, R.; Ghosh, A.; Chakraborty, C.; De, J.N.; Mishra, D.P. Rice leaf disease identification and classification using machine learning techniques: A comprehensive review. Engineering Applications of Artificial Intelligence 2025, 139, 109639. [Google Scholar] [CrossRef]
- Zhou, H.; Cai, D.; Lin, L.; Huang, D.; Wu, B.-M. Recognition of multi-symptomatic rice leaf blast in dual scenarios by using convolutional neural networks. Smart Agricultural Technology 2025, 11, 100867. [Google Scholar] [CrossRef]
- Simhadri, C.G.; Kondaveeti, H.K.; Vatsavayi, V.K.; Mitra, A.; Ananthachari, P. Deep learning for rice leaf disease detection: A systematic literature review on emerging trends, methodologies and techniques. Information Processing in Agriculture 2024. [Google Scholar] [CrossRef]
- Wengler, M.R.; Talbot, N.J. Mechanisms of regulated cell death during plant infection by the rice blast fungus *Magnaporthe oryzae*. Cell Death & Differentiation 2025, 1–9.
- Lee, H.; Park, Y.; Kim, G.; Lee, J.H. Pre-symptomatic diagnosis of rice blast and brown spot diseases using chlorophyll fluorescence imaging. Plant Phenomics 2025, 100012. [Google Scholar] [CrossRef]
- Wu, B.; Zhang, X.; Zhao, J.; Zeng, B.; Cao, Z. Identification and analysis of miRNA-mRNA regulatory modules associated with resistance to bacterial leaf streak in rice. BMC Genomics 2025, 26. [Google Scholar] [CrossRef]
- Prakasam, V.; Savani, A.K.; Sukesh, P. Unveiling the potential antifungal role of essential oils in the management of *Rhizoctonia solani* causing sheath blight of rice. European Journal of Plant Pathology 2025, 171, 245–256. [Google Scholar] [CrossRef]
- Kumar, B.N.; Sakthivel, S. Rice leaf disease classification using a fusion vision approach. Scientific Reports 2025, 15, 8692. [Google Scholar] [CrossRef]
- Sangaiah, A.K.; Yu, F.-N.; Lin, Y.-B.; Shen, W.-C.; Sharma, A. UAV T-YOLO-rice: An enhanced tiny YOLO networks for rice leaves diseases detection in paddy agronomy. IEEE Transactions on Network Science and Engineering 2024, 11, 5201–5216. [Google Scholar] [CrossRef]
- Chakrabarty, A.; Ahmed, S.T.; Islam, M.F.U.; Aziz, S.M.; Maidin, S.S. An interpretable fusion model integrating lightweight CNN and transformer architectures for rice leaf disease identification. Ecological Informatics 2024, 82, 102718. [Google Scholar] [CrossRef]
- Ren, S.; He, K.; Girshick, R.; Sun, J. Faster R-CNN: Towards real-time object detection with region proposal networks. IEEE Transactions on Pattern Analysis and Machine Intelligence 2016, 39, 1137–1149. [Google Scholar] [CrossRef]
- He, K.; Gkioxari, G.; Dollár, P.; Girshick, R. Mask R-CNN. In Proceedings of the IEEE International Conference on Computer Vision; 2017; pp. 2961–2969. [Google Scholar]
- Vijayakumar, A.; Vairavasundaram, S. YOLO-based object detection models: A review and its applications. Multimedia Tools and Applications 2024, 83, 83535–83574. [Google Scholar] [CrossRef]
- Liu, W.; Anguelov, D.; Erhan, D.; Szegedy, C.; Reed, S.; Fu, C.-Y.; Berg, A.C. SSD: Single shot multibox detector. Proceedings of ECCV 2016: 14th European Conference, Amsterdam, The Netherlands, 11–14 October 2016; Part I; pp. 21–37. [Google Scholar]
- Gao, W.; Zong, C.; Wang, M.; Zhang, H.; Fang, Y. Intelligent identification of rice leaf disease based on YOLO V5-EFFICIENT. Crop Protection 2024, 183, 106758. [Google Scholar] [CrossRef]
- Ramadan, S.T.Y.; Islam, M.S.; Sakib, T.; Sharmin, N.; Rahman, M.M.; Rahman, M.M. Image-based rice leaf disease detection using CNN and generative adversarial network. Neural Computing and Applications 2025, 37, 439–456. [Google Scholar] [CrossRef]
- Tao, J.; Li, X.; He, Y.; Islam, M.A. CEFW-YOLO: A High-Precision Model for Plant Leaf Disease Detection in Natural Environments. Agriculture 2025, 15, 833. [Google Scholar] [CrossRef]
- Wang, C.; Li, H.; Deng, X.; Liu, Y.; Wu, T.; Liu, W.; Xiao, R.; Wang, Z.; Wang, B. Improved You Only Look Once v. 8 Model Based on Deep Learning: Precision Detection and Recognition of Fresh Leaves from Yunnan Large-Leaf Tea Tree. Agriculture 2024, 14, 2324. [Google Scholar] [CrossRef]
- Xu, K.; Hou, Y.; Sun, W.; Chen, D.; Lv, D.; Xing, J.; Yang, R. A Detection Method for Sweet Potato Leaf Spot Disease and Leaf-Eating Pests. Agriculture 2025, 15, 503. [Google Scholar] [CrossRef]
- Zhou, S.; Yin, W.; He, Y.; Kan, X.; Li, X. Detection of Apple Leaf Gray Spot Disease Based on Improved YOLOv8 Network. Mathematics 2025, 13, 840. [Google Scholar] [CrossRef]
- Shi, H.; Liu, C.; Wu, M.; Zhang, H.; Song, H.; Sun, H.; Li, Y.; Hu, J. Real-time detection of Chinese cabbage seedlings in the field based on YOLO11-CGB. Frontiers in Plant Science 2025, 16, 1558378. [Google Scholar] [CrossRef] [PubMed]
- Woo, S.; Park, J.; Lee, J.-Y.; Kweon, I.S. CBAM: Convolutional Block Attention Module. In Proceedings of the European Conference on Computer Vision (ECCV); 2018; pp. 3–19. [Google Scholar]
- Tan, M.; Pang, R.; Le, Q.V. EfficientDet: Scalable and Efficient Object Detection. In Proceedings of the IEEE/CVF Conference on Computer Vision and Pattern Recognition; 2020; pp. 10781–10790. [Google Scholar]
- Abulizi, A.; Ye, J.; Abudukelimu, H.; Guo, W. DM-YOLO: Improved YOLOv9 model for tomato leaf disease detection. Frontiers in Plant Science 2025, 15, 1473928. [Google Scholar] [CrossRef] [PubMed]
- Liu, W.; Lu, H.; Fu, H.; Cao, Z. Learning to Upsample by Learning to Sample. In Proceedings of the IEEE/CVF International Conference on Computer Vision; 2023; pp. 6027–6037. [Google Scholar]
- Ma, S.; Xu, Y. MPDIoU: A Loss for Efficient and Accurate Bounding Box Regression. arXiv preprint arXiv:2307.07662, arXiv:2307.07662.
- Zhou, H.; Hu, Y.; Liu, S.; Zhou, G.; Xu, J.; Chen, A.; Wang, Y.; Li, L.; Hu, Y. A Precise Framework for Rice Leaf Disease Image–Text Retrieval Using FHTW-Net. Plant Phenomics 2024, 6, 0168. [Google Scholar] [CrossRef] [PubMed]
- Dosovitskiy, A.; Beyer, L.; Kolesnikov, A.; Weissenborn, D.; Zhai, X.; Unterthiner, T.; Dehghani, M.; Minderer, M.; Heigold, G.; Gelly, S.; et al. An Image is Worth 16×16 Words: Transformers for Image Recognition at Scale. arXiv preprint arXiv:2010.11929, arXiv:2010.11929.
- Devlin, J.; Chang, M.-W.; Lee, K.; Toutanova, K. BERT: Pre-training of Deep Bidirectional Transformers for Language Understanding. In Proceedings of the 2019 Conference of the North American Chapter of the Association for Computational Linguistics: Human Language Technologies, Volume 1 (Long and Short Papers); 2019; pp. 4171–4186. [Google Scholar]
- Yu, X.-H.; Chen, G.-A.; Cheng, S.-X. Dynamic Learning Rate Optimization of the Backpropagation Algorithm. IEEE Transactions on Neural Networks 1995, 6, 669–677. [Google Scholar]
- Deari, S.; Ulukaya, S. A Hybrid Multistage Model Based on YOLO and Modified Inception Network for Rice Leaf Disease Analysis. Arabian Journal for Science and Engineering 2024, 49, 6715–6723. [Google Scholar] [CrossRef]
- Li, P.; Zhou, J.; Sun, H.; Zeng, J. RDRM-YOLO: A High-Accuracy and Lightweight Rice Disease Detection Model for Complex Field Environments Based on Improved YOLOv5. Agriculture 2025, 15, 479. [Google Scholar] [CrossRef]
- Li, Z.; Wu, W.; Wei, B.; Li, H.; Zhan, J.; Deng, S.; Wang, J. Rice Disease Detection: TLI-YOLO Innovative Approach for Enhanced Detection and Mobile Compatibility. Sensors 2025, 25, 2494. [Google Scholar] [CrossRef]
- Fang, K.; Zhou, R.; Deng, N.; Li, C.; Zhu, X. RLDD-YOLOv11n: Research on Rice Leaf Disease Detection Based on YOLOv11. Agronomy 2025, 15, 1266. [Google Scholar] [CrossRef]
- Zhang, H.; Jung, C.; Liu, X. Frequency-Aware Learned Image Compression Using Channel-Wise Attention and Restormer. IEEE Access 2025. [Google Scholar] [CrossRef]
- Kumar, A.; Yadav, S.P.; Kumar, A. An Improved Feature Extraction Algorithm for Robust Swin Transformer Model in High-Dimensional Medical Image Analysis. Computers in Biology and Medicine 2025, 188, 109822. [Google Scholar] [CrossRef]
Figure 1.
Disease sample map.
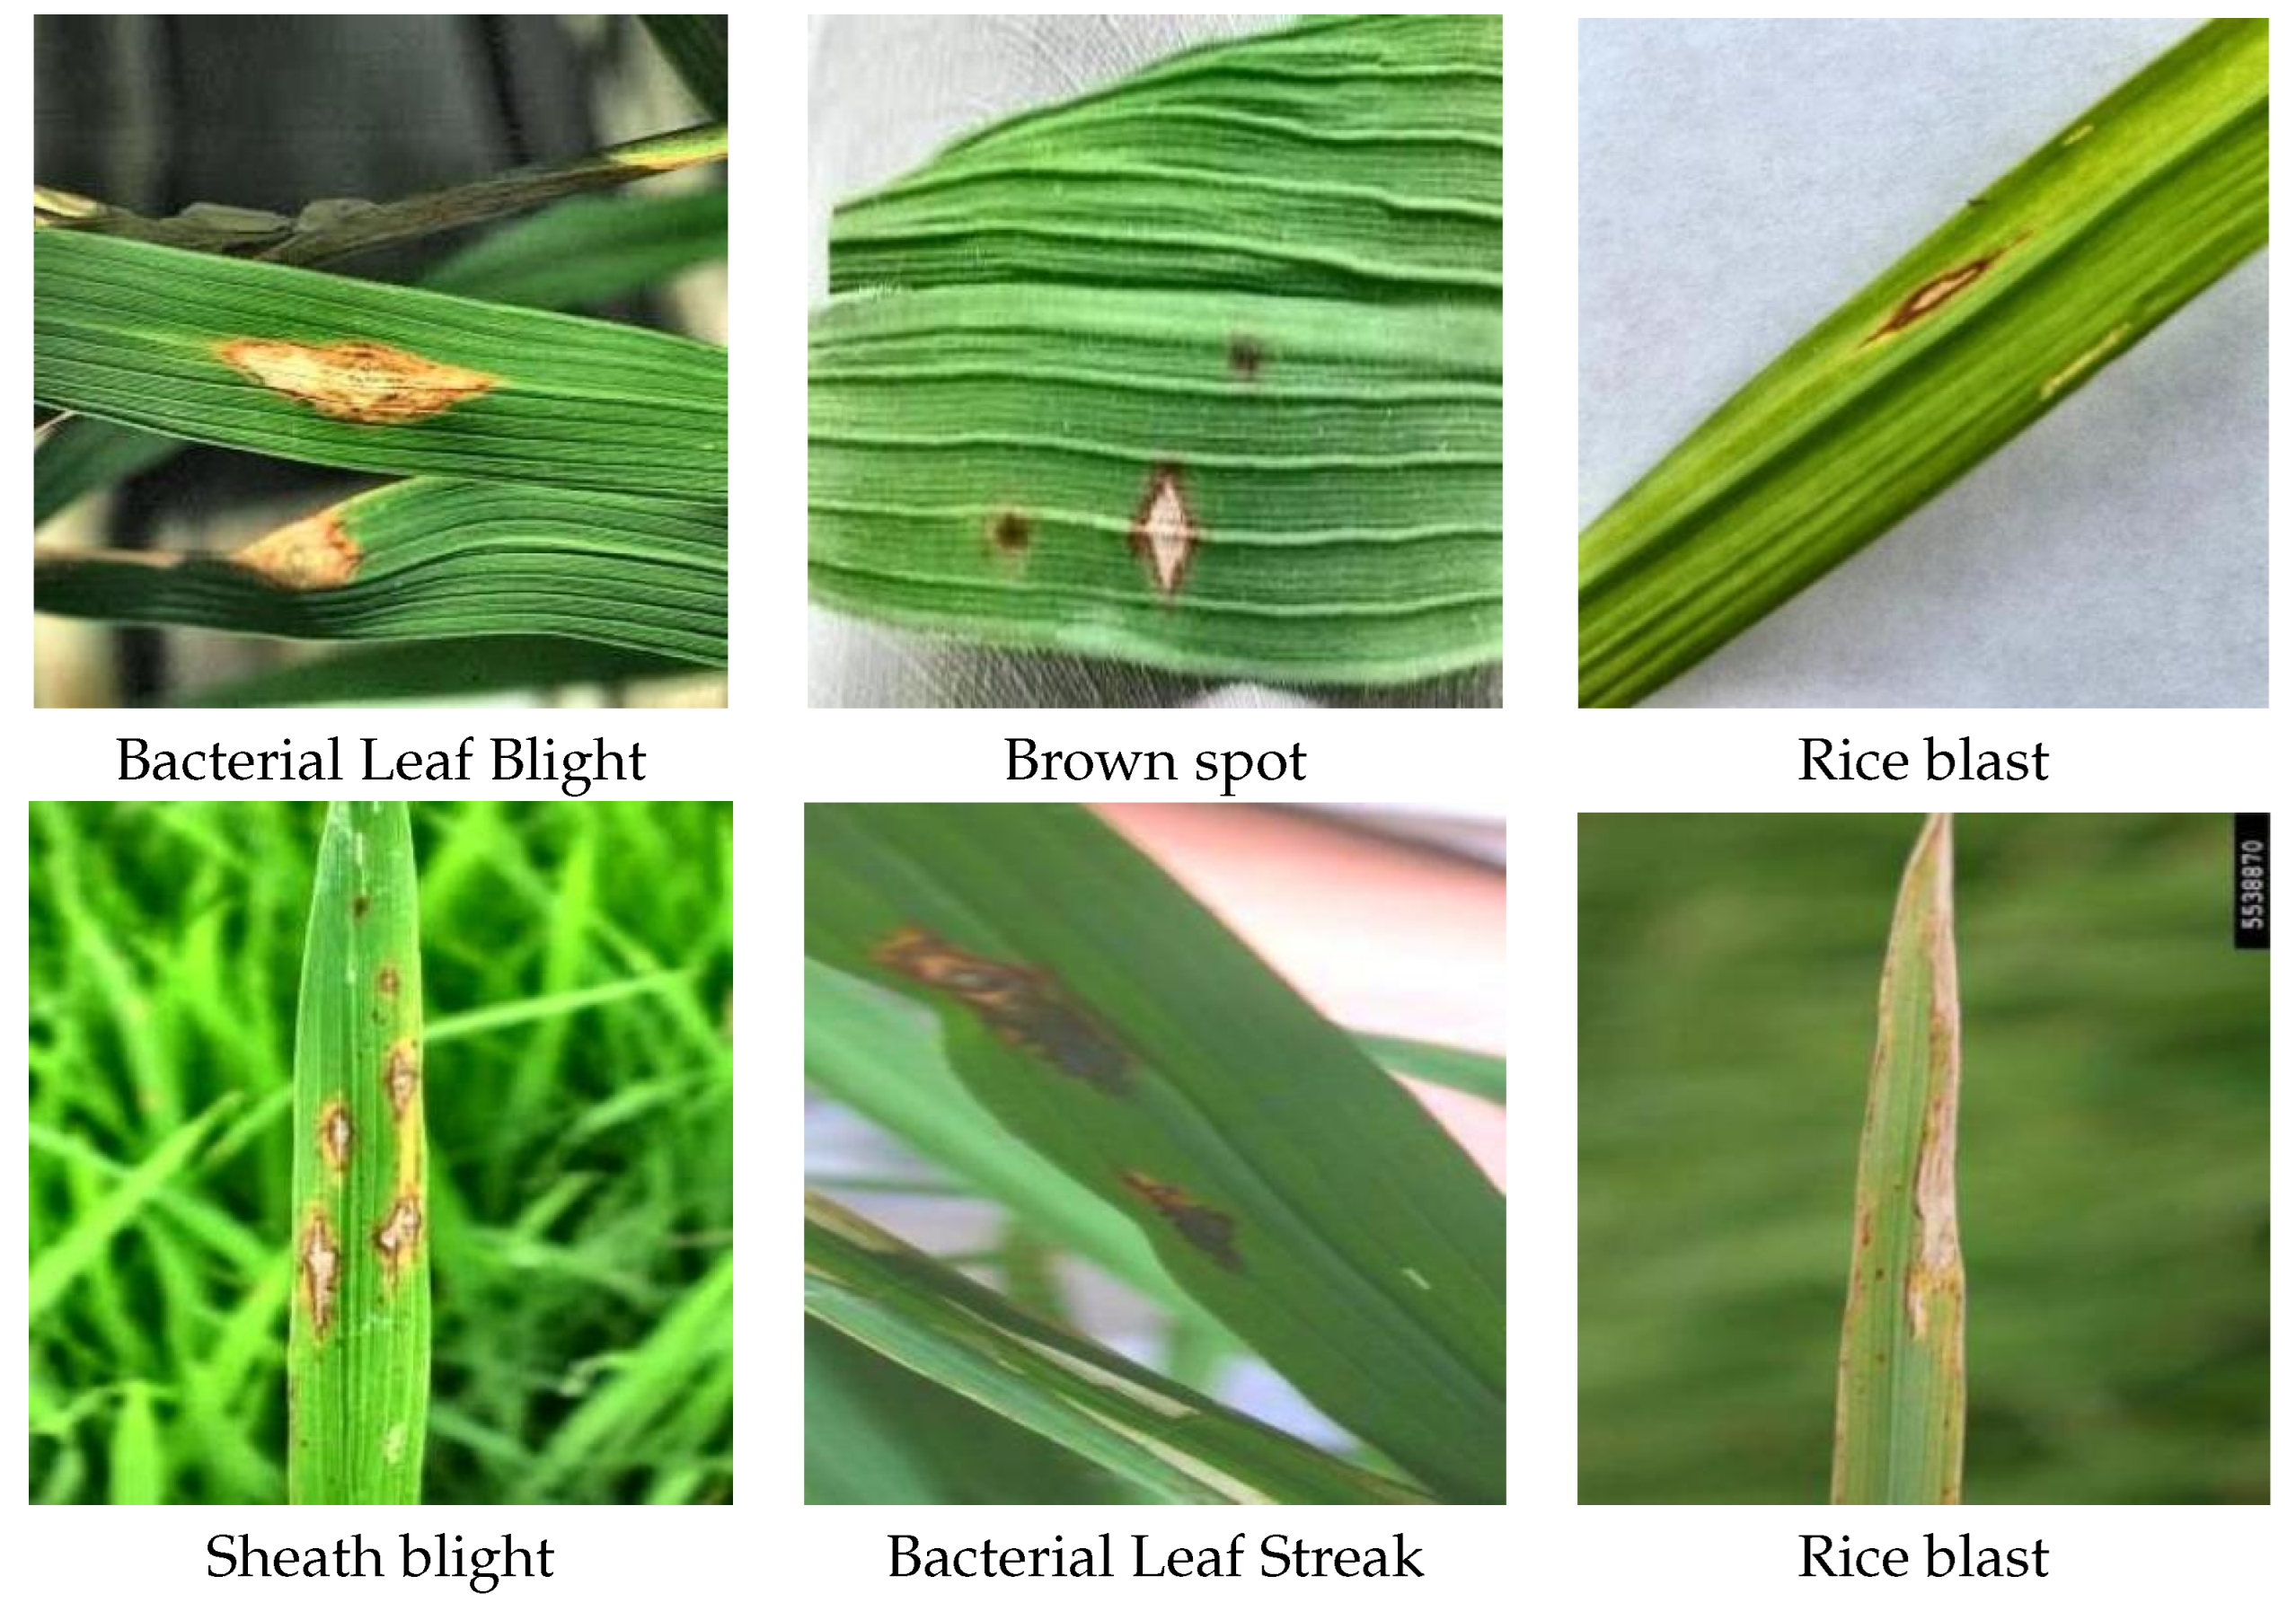
| Bacterial Leaf Blight | Brown spot | Rice blast |
| Sheath blight | Bacterial Leaf Streak | Rice blast |
Figure 2.
Overall technology roadmap.
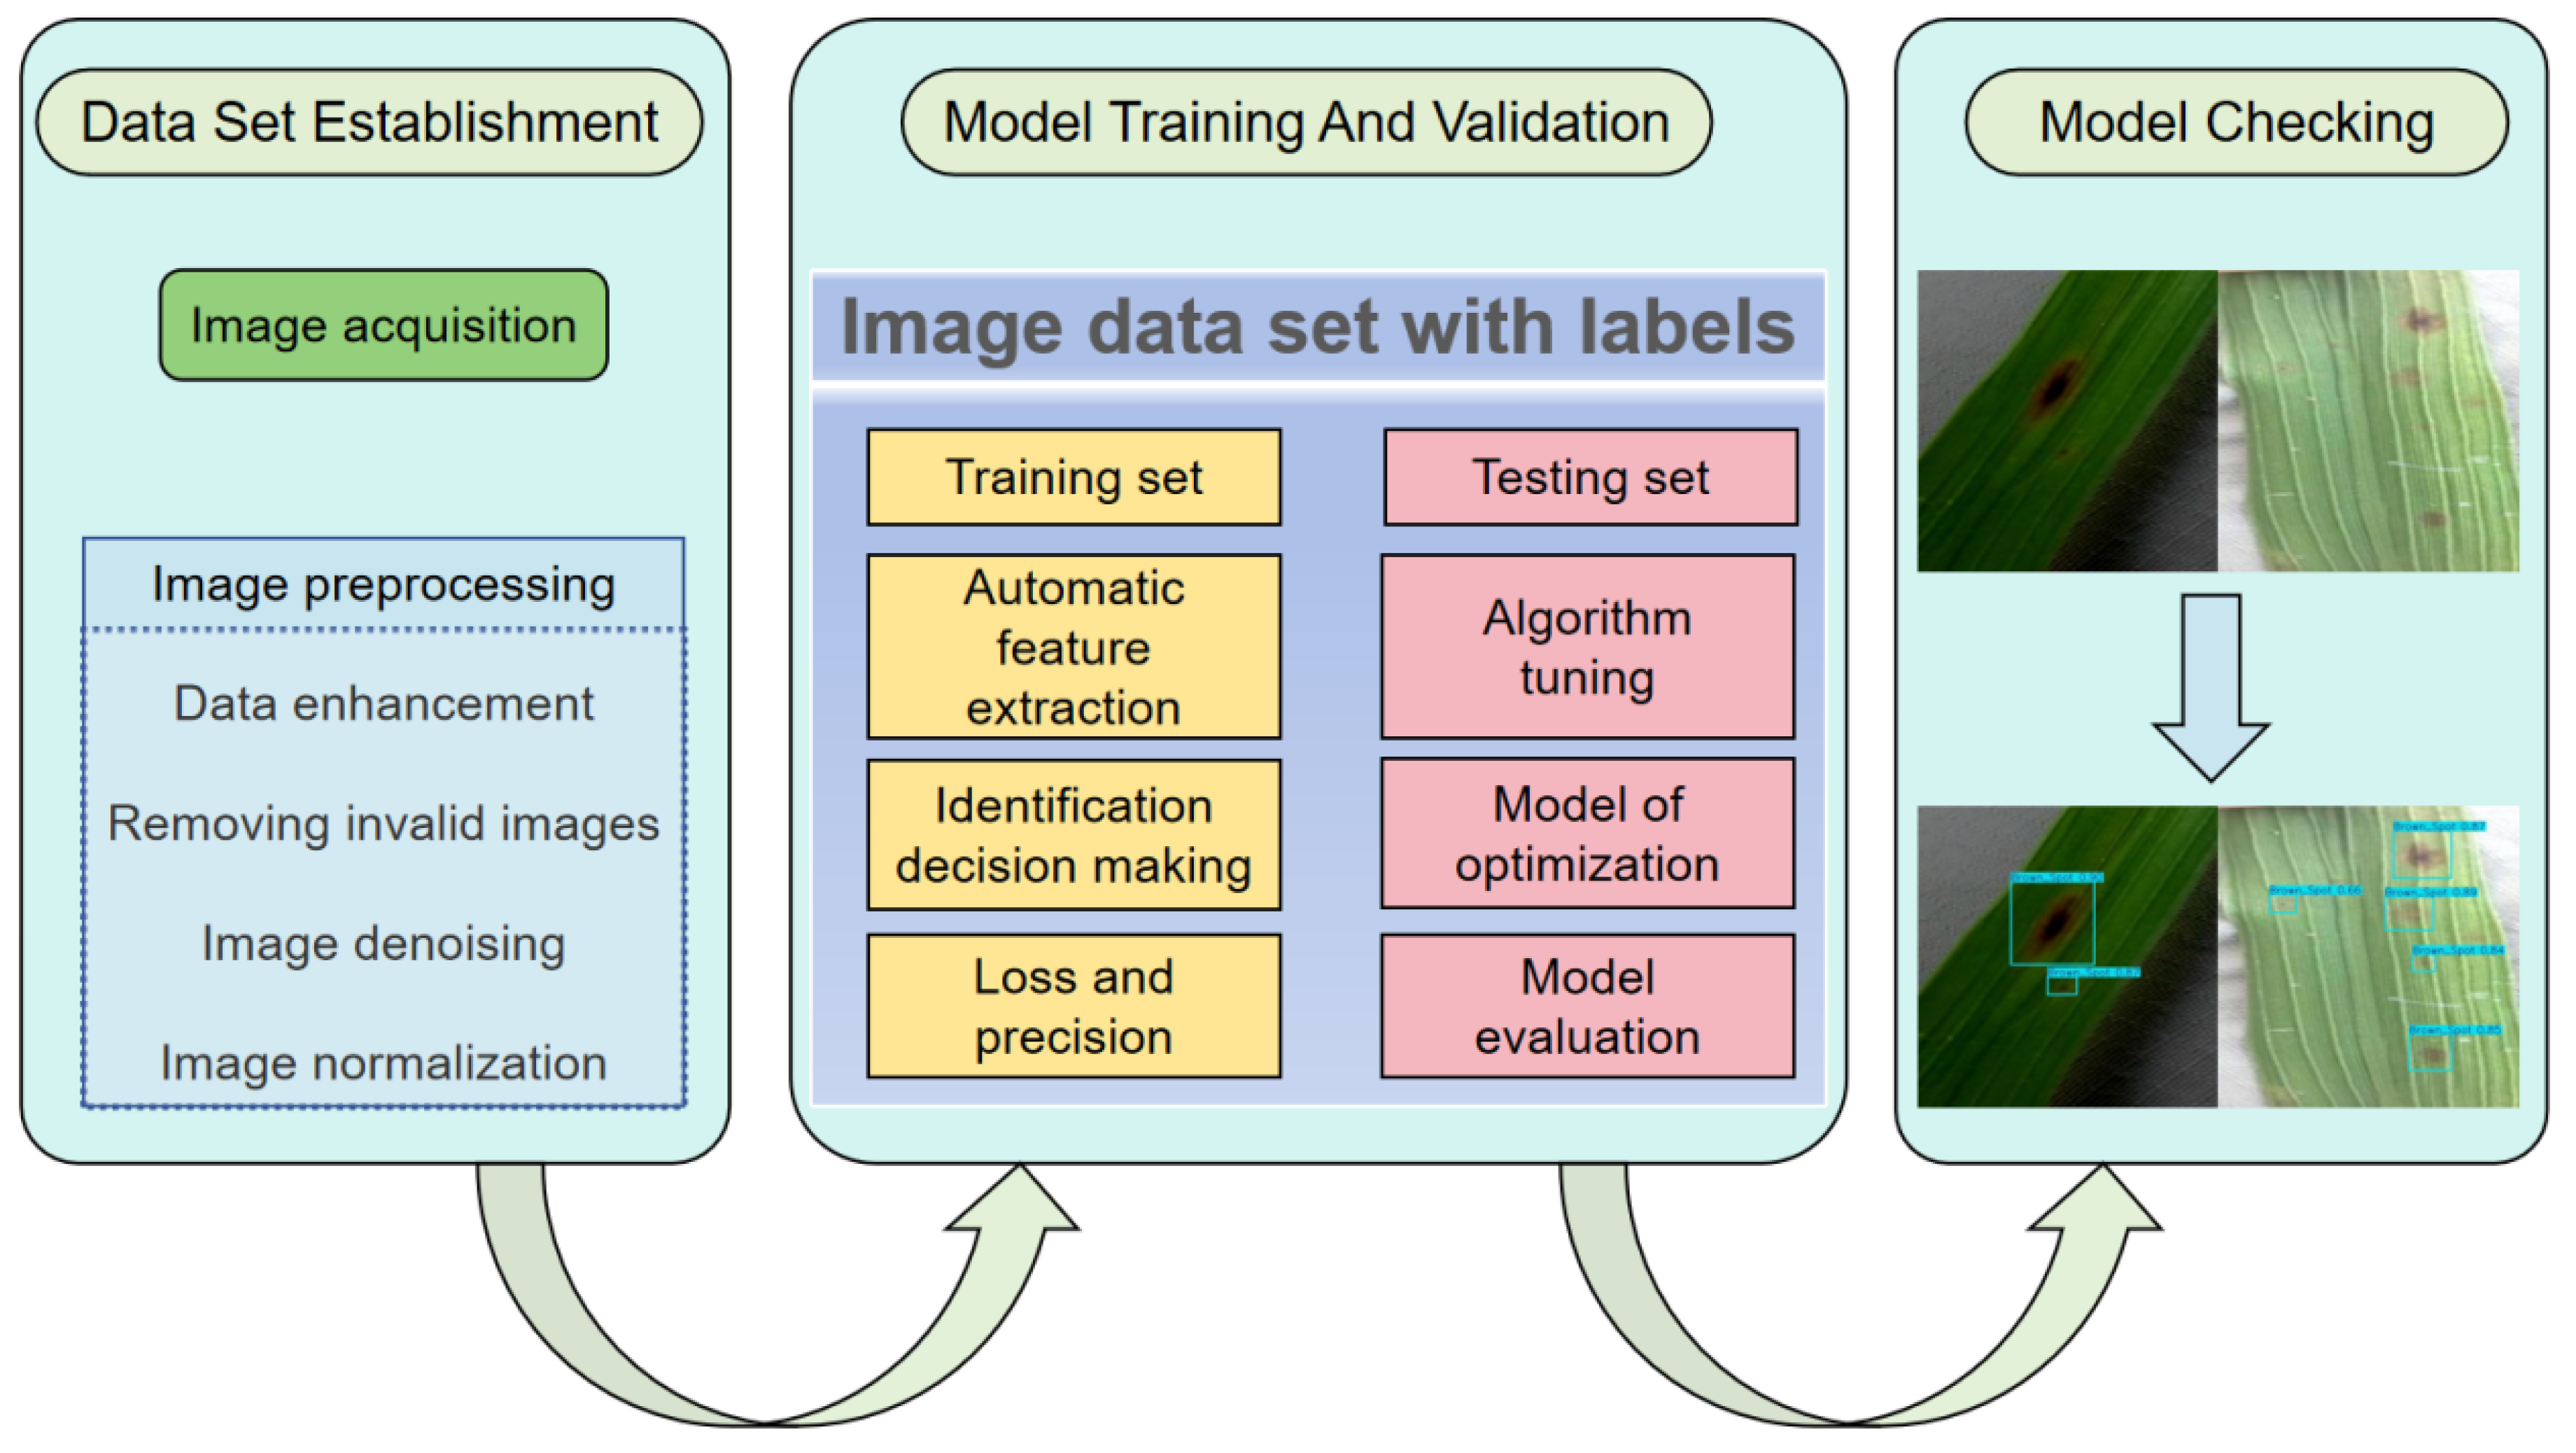
Figure 3.
Entire structure of MML-YOLO.
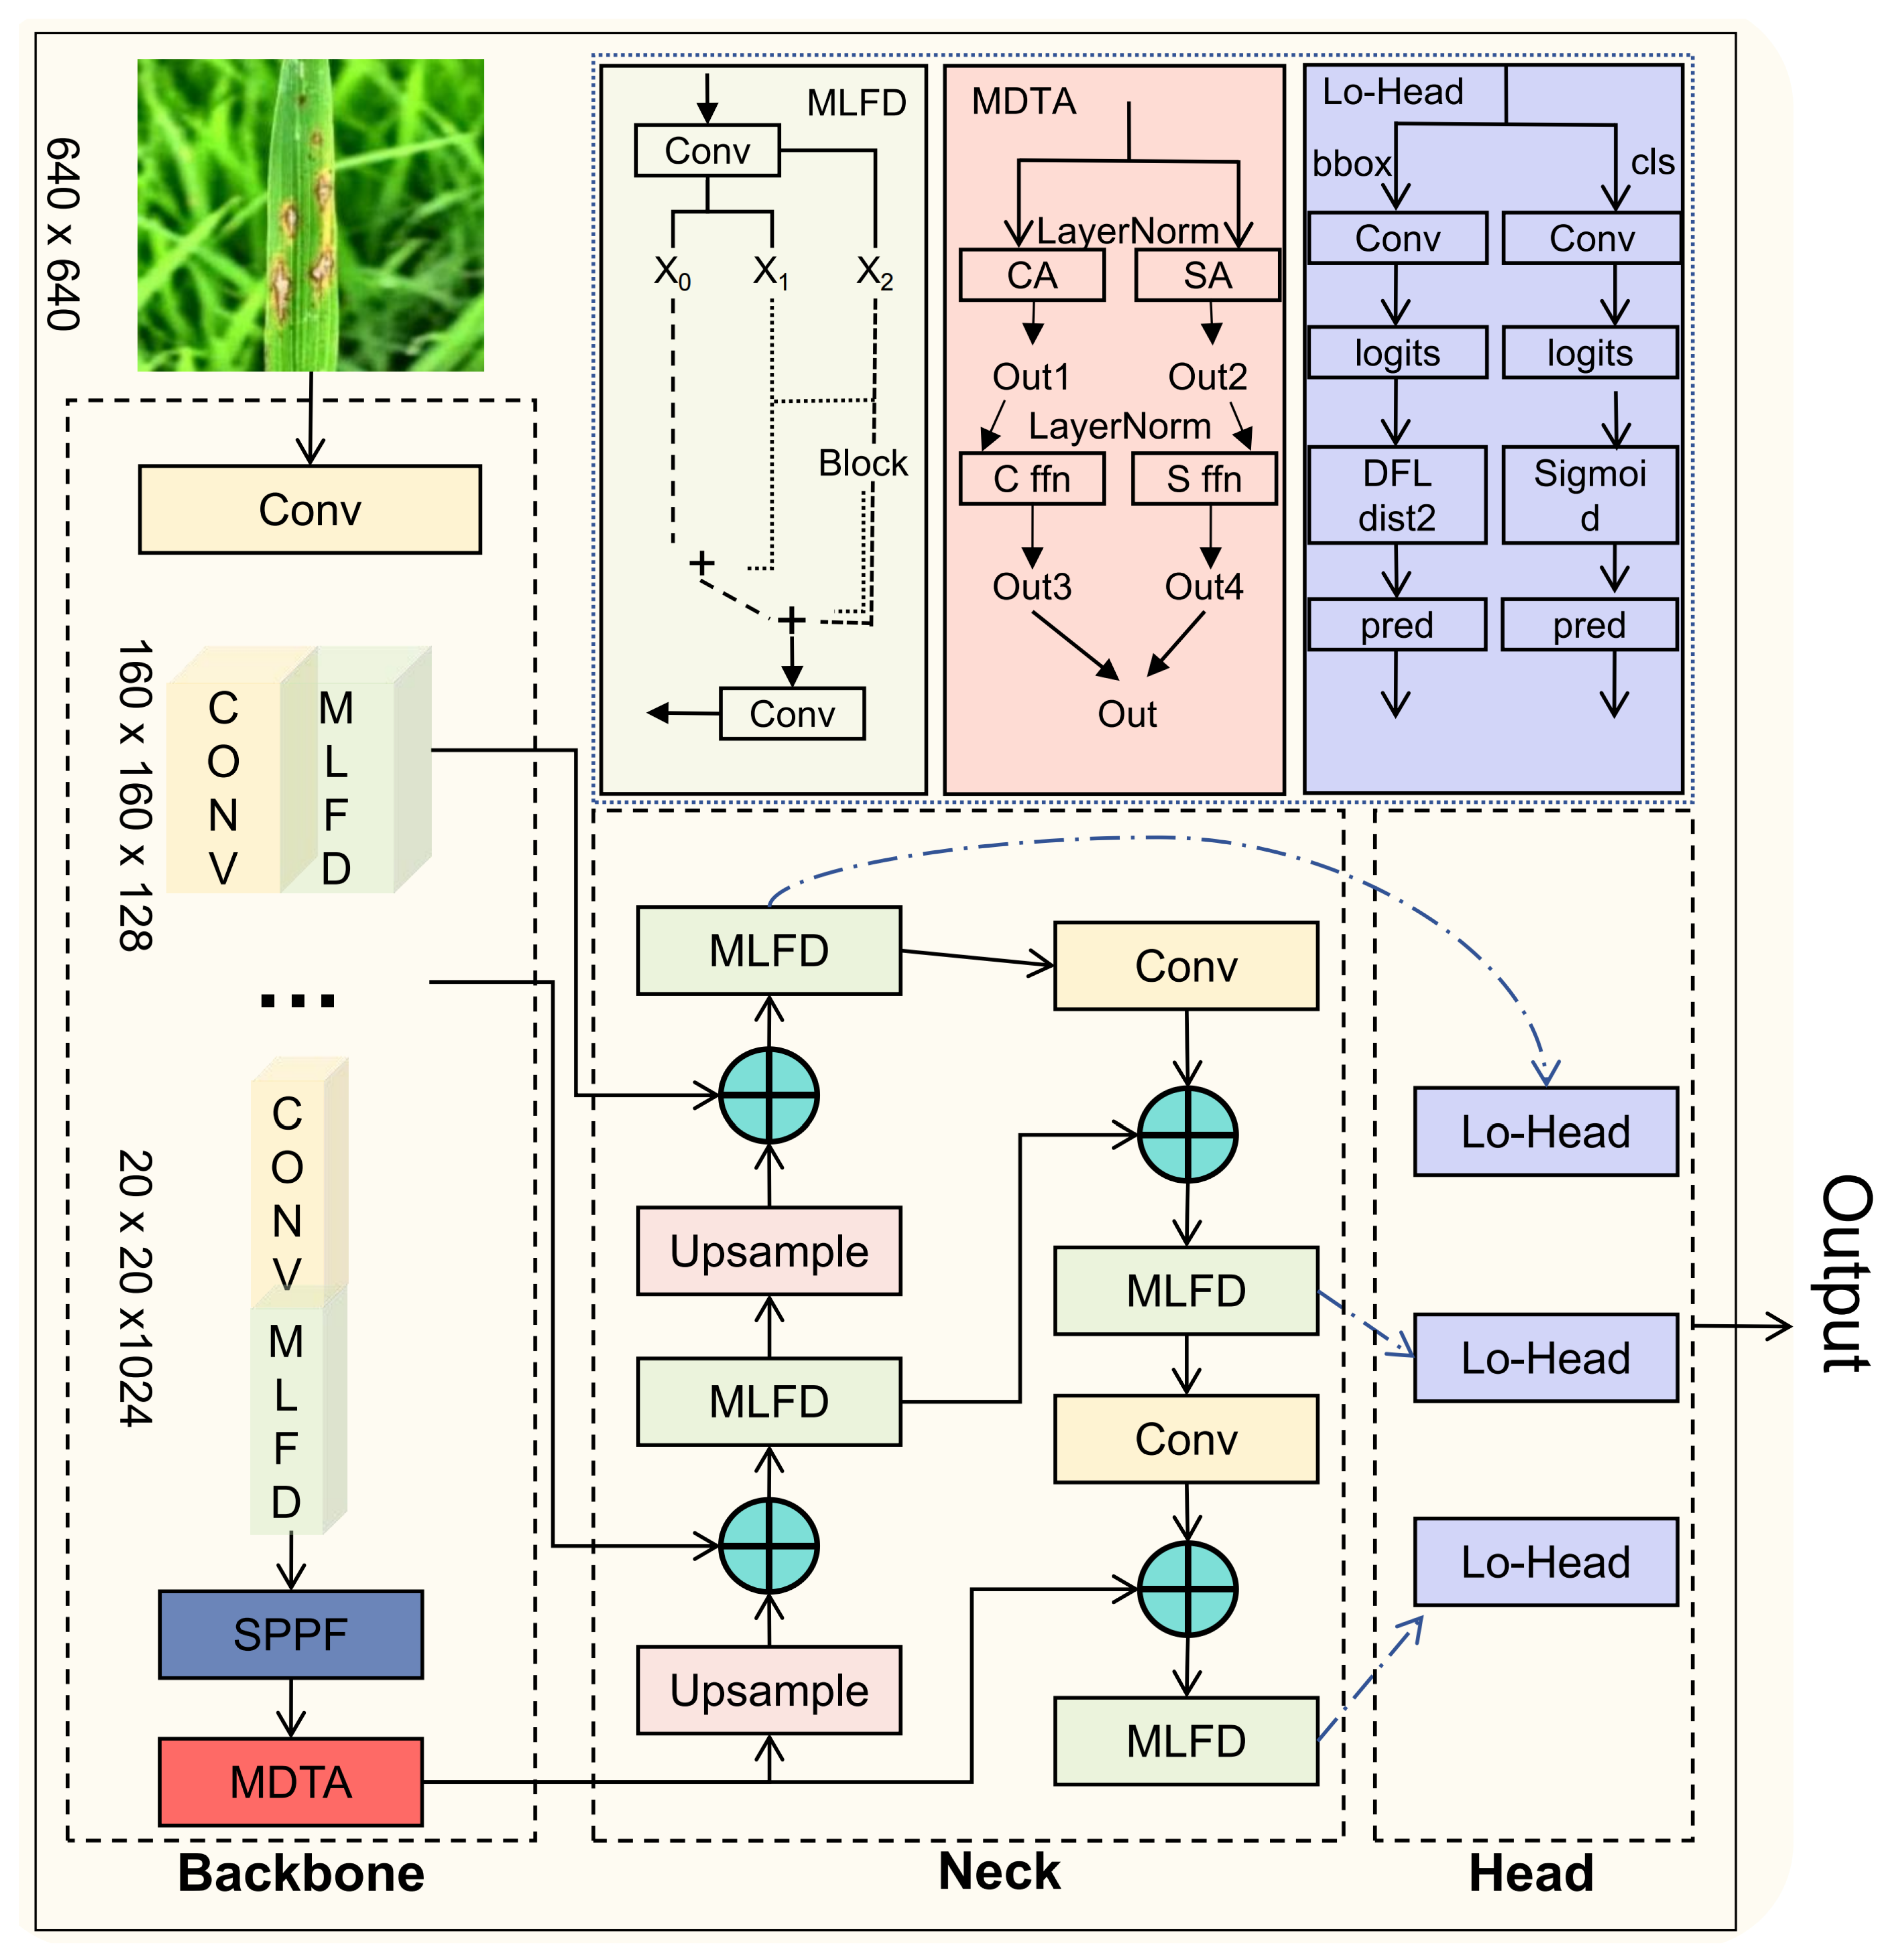
Figure 4.
Network Structure of MLFD.
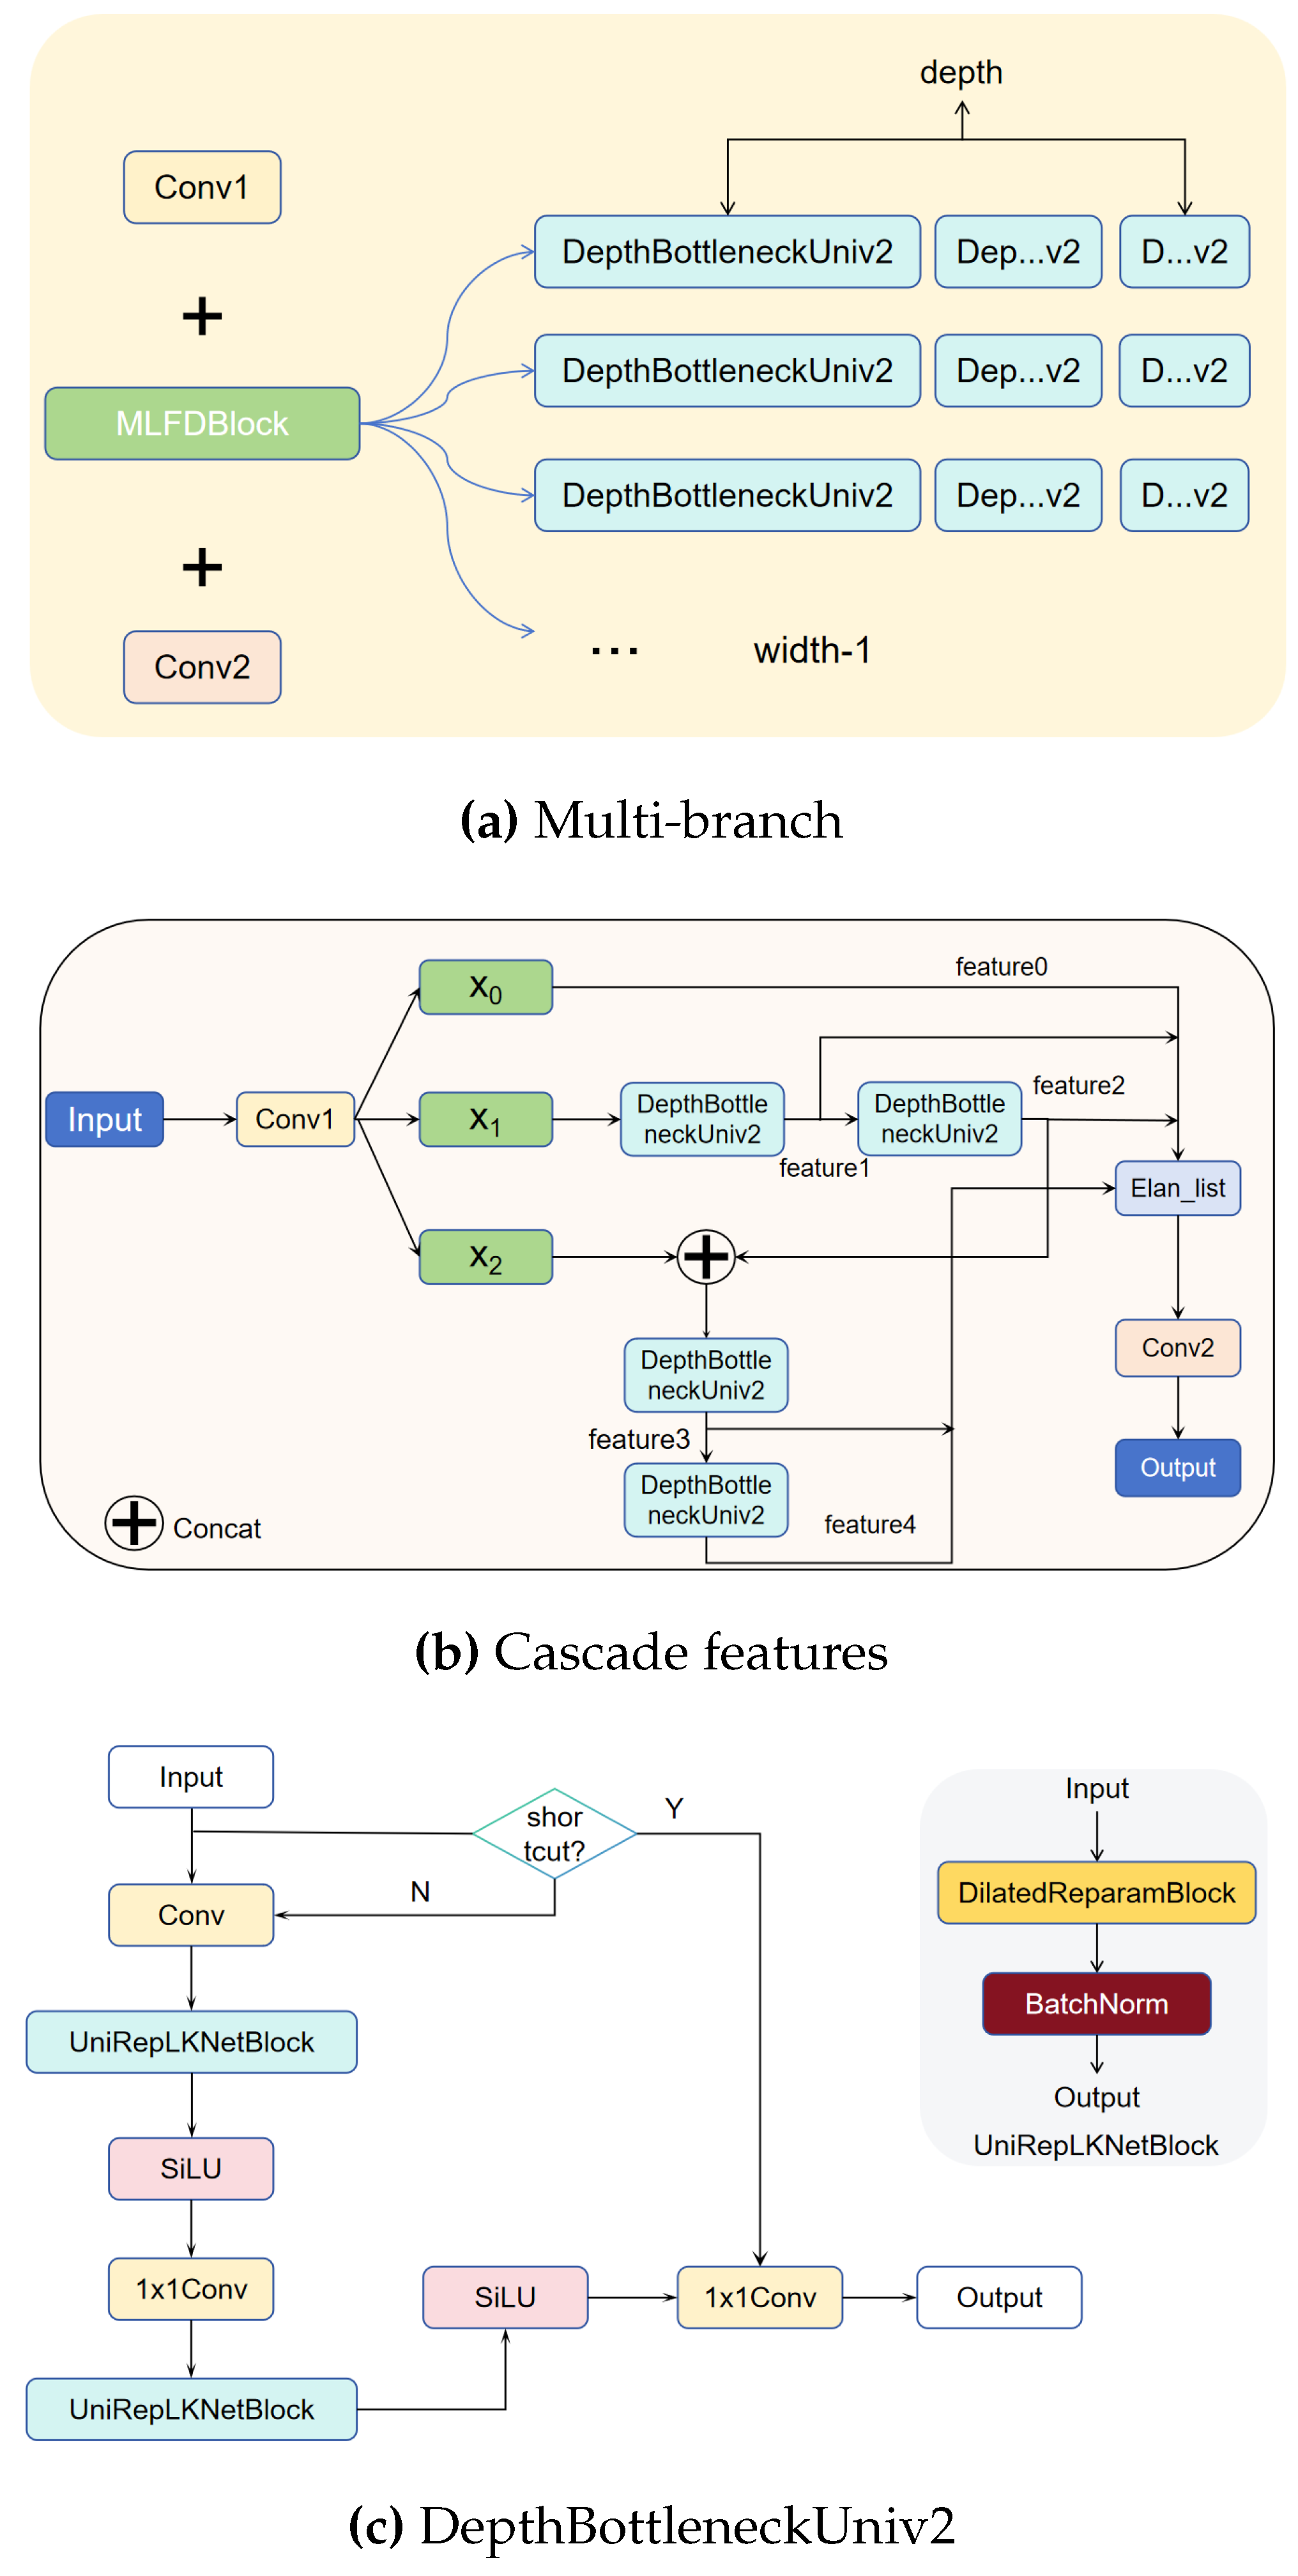
Figure 5.
Network Structure of MDTA.
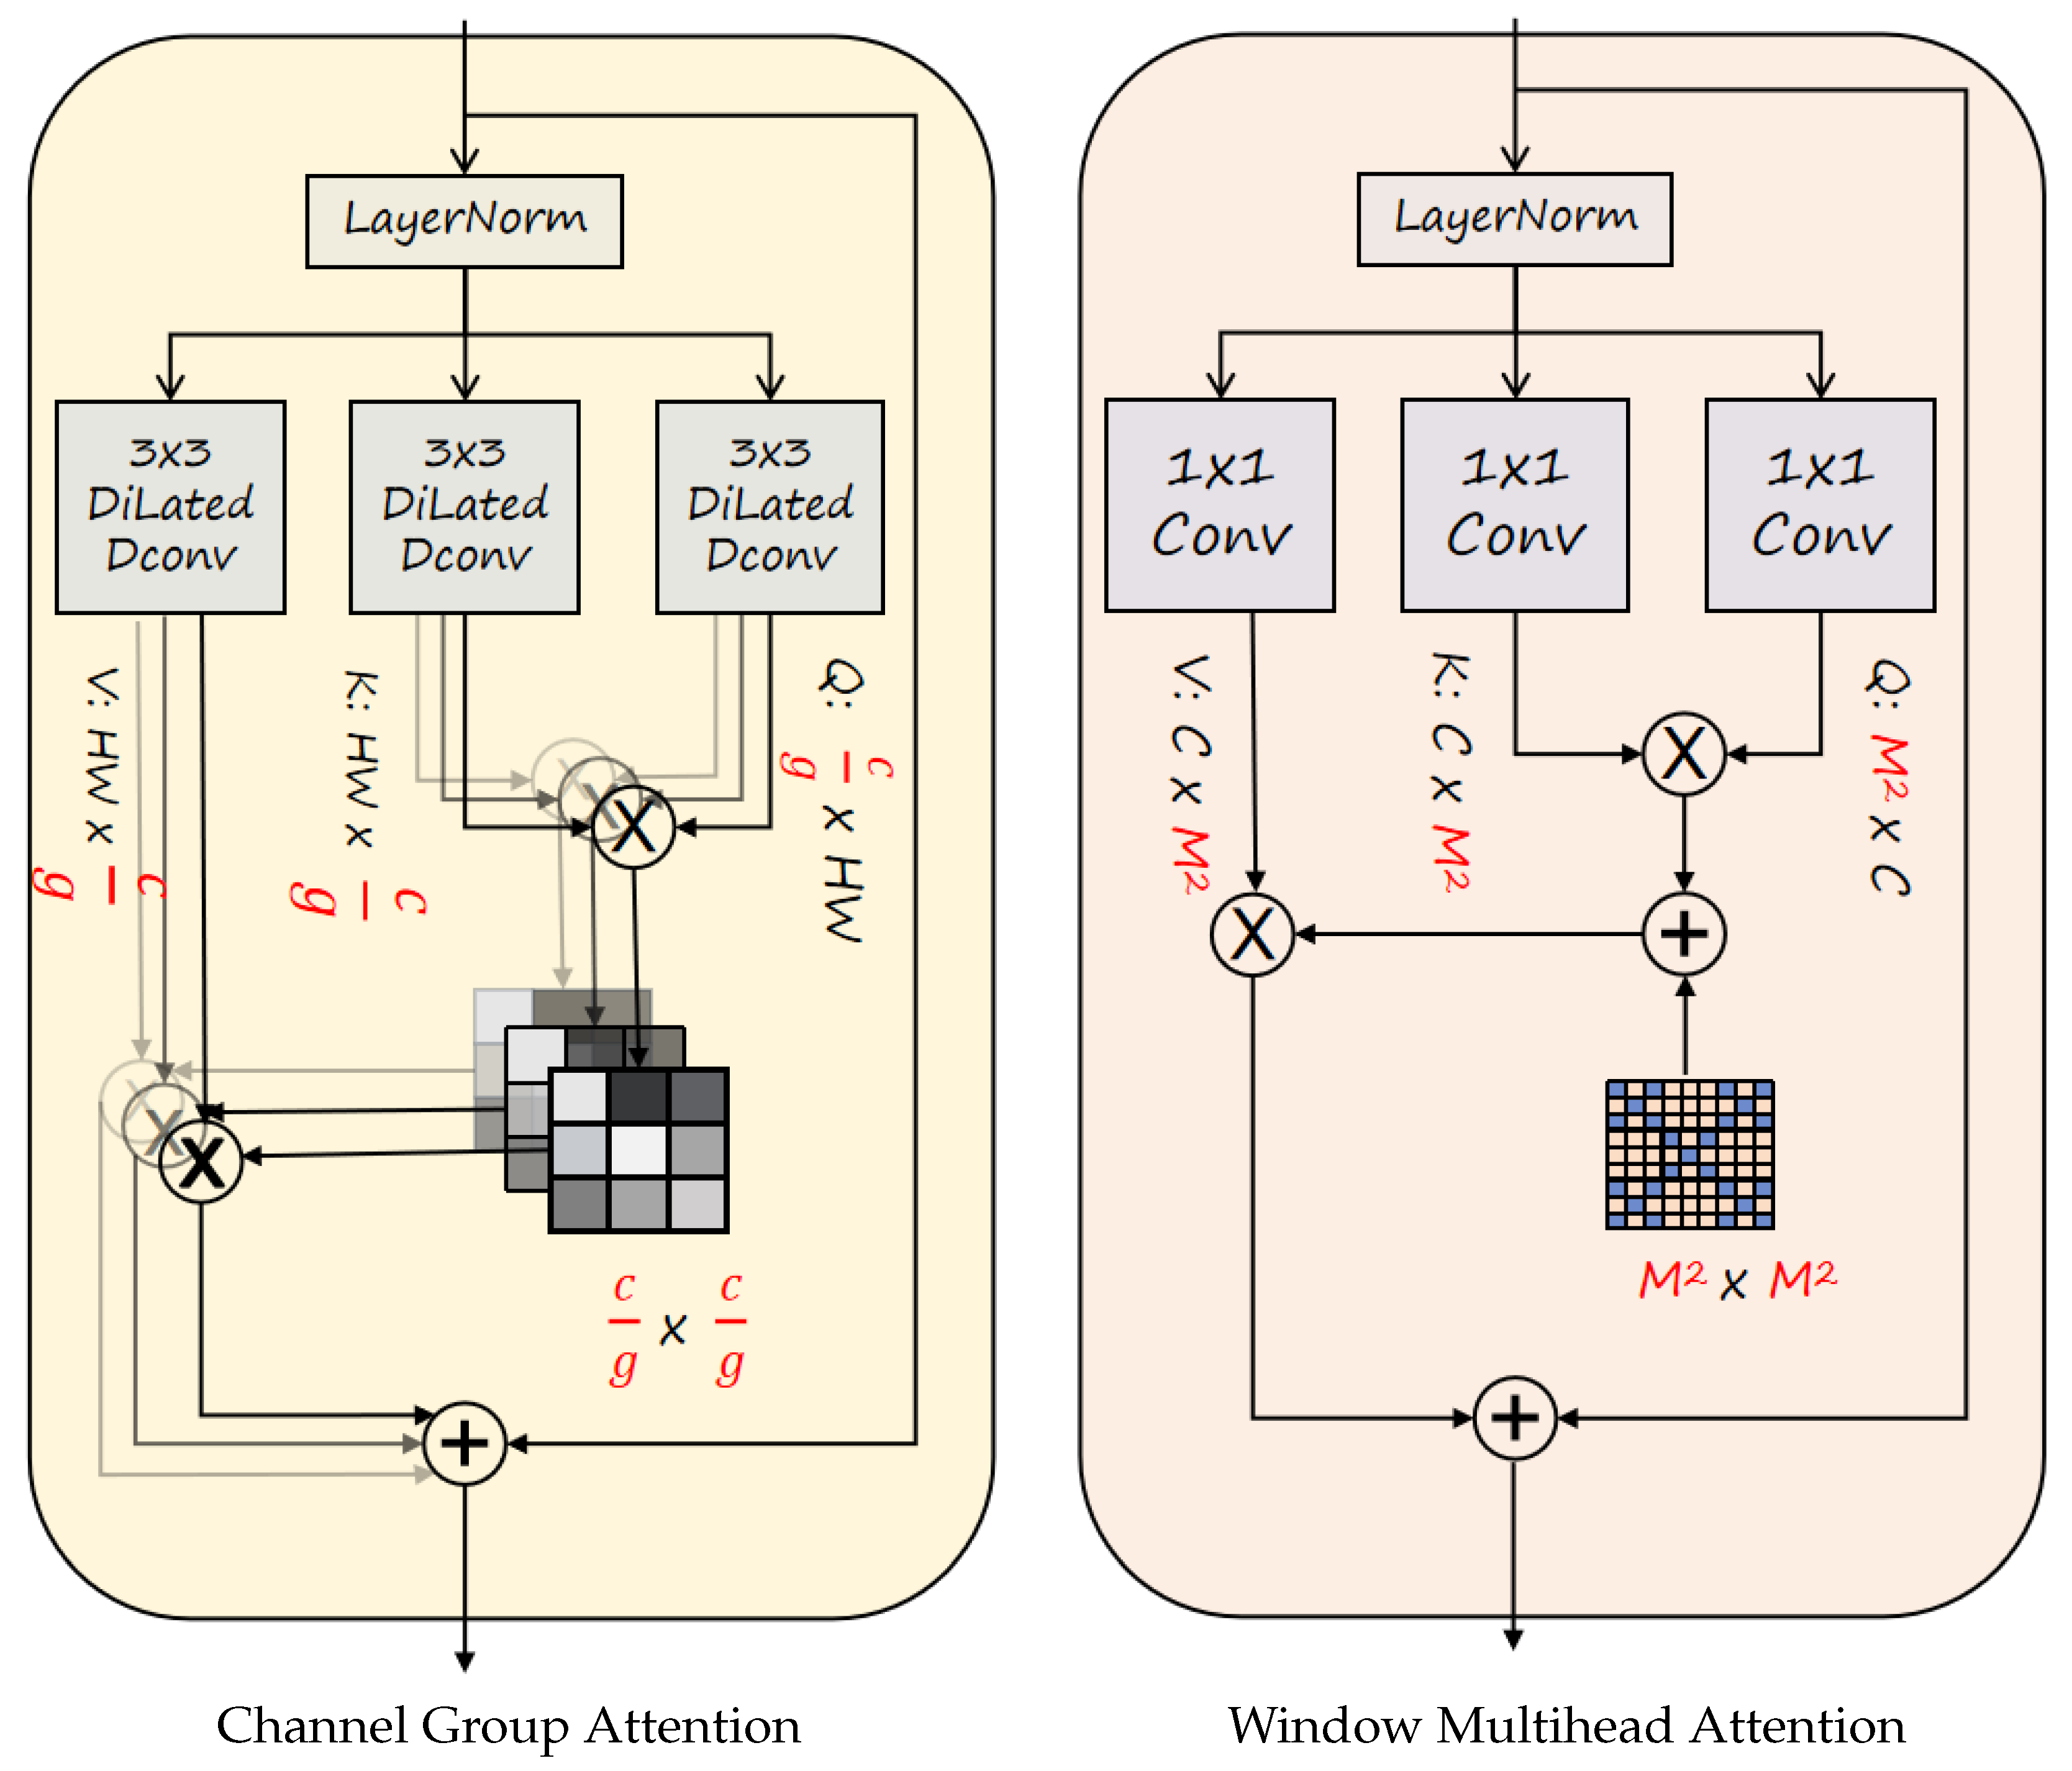
| Channel Group Attention | Window Multihead Attention |
Figure 6.
Structure of Lo-Head.
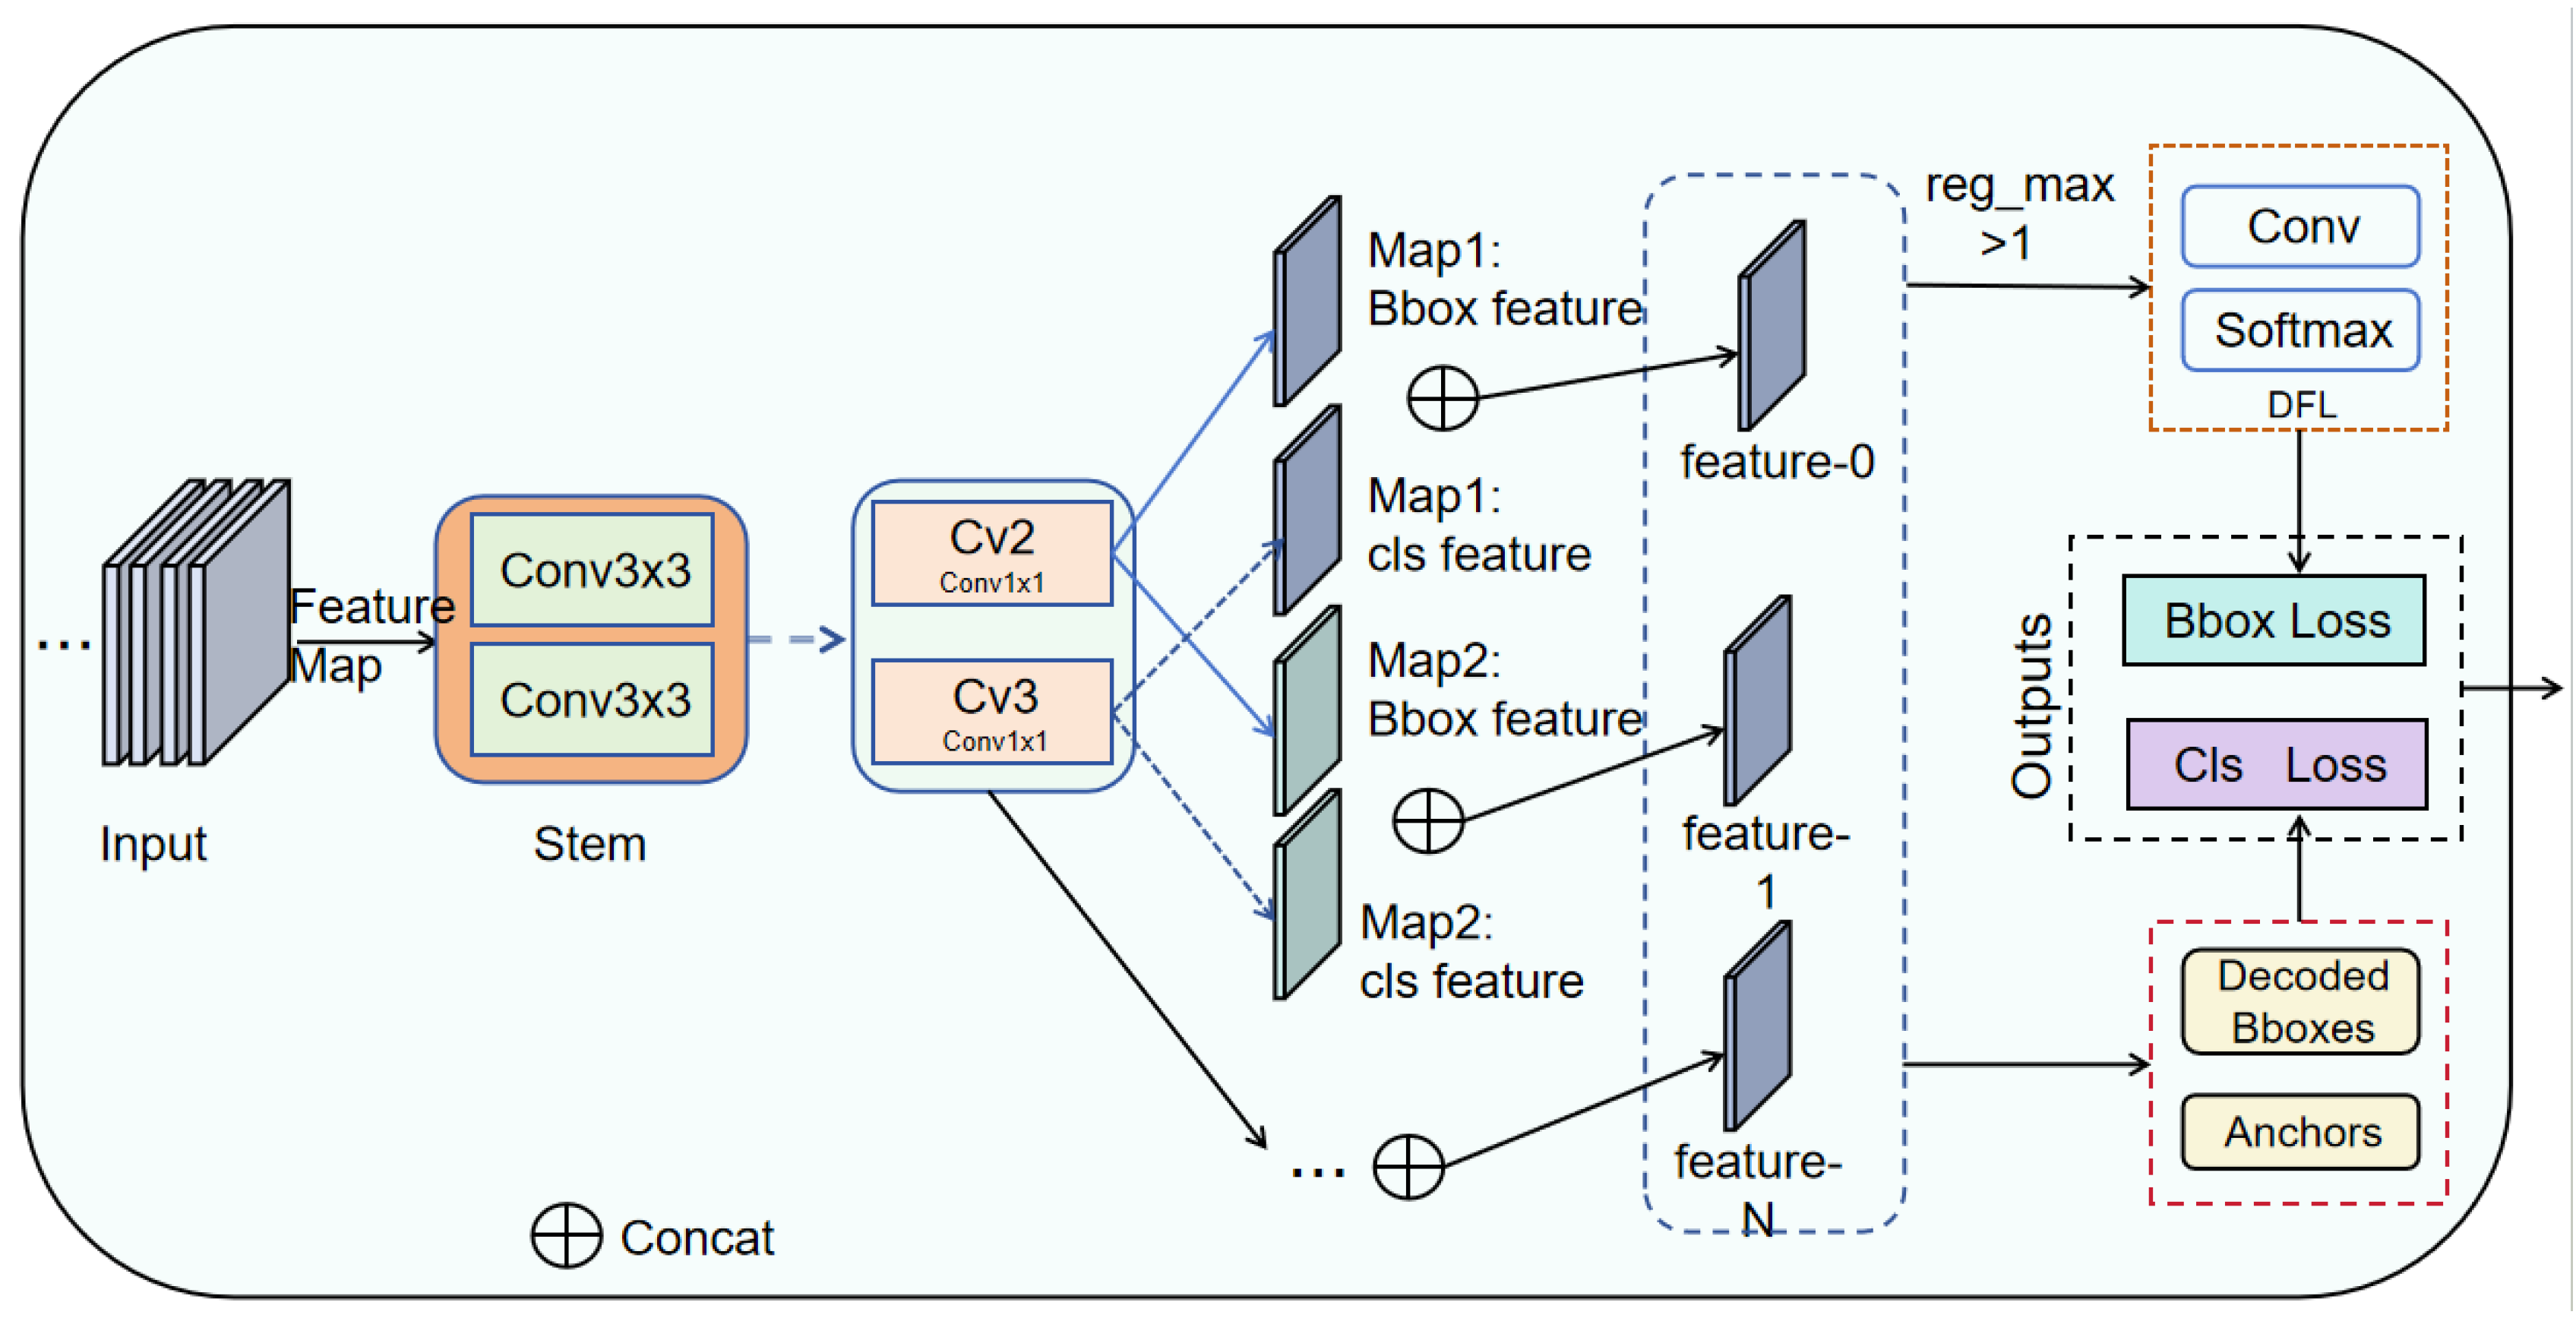
Figure 7.
Comparison of heatmap images
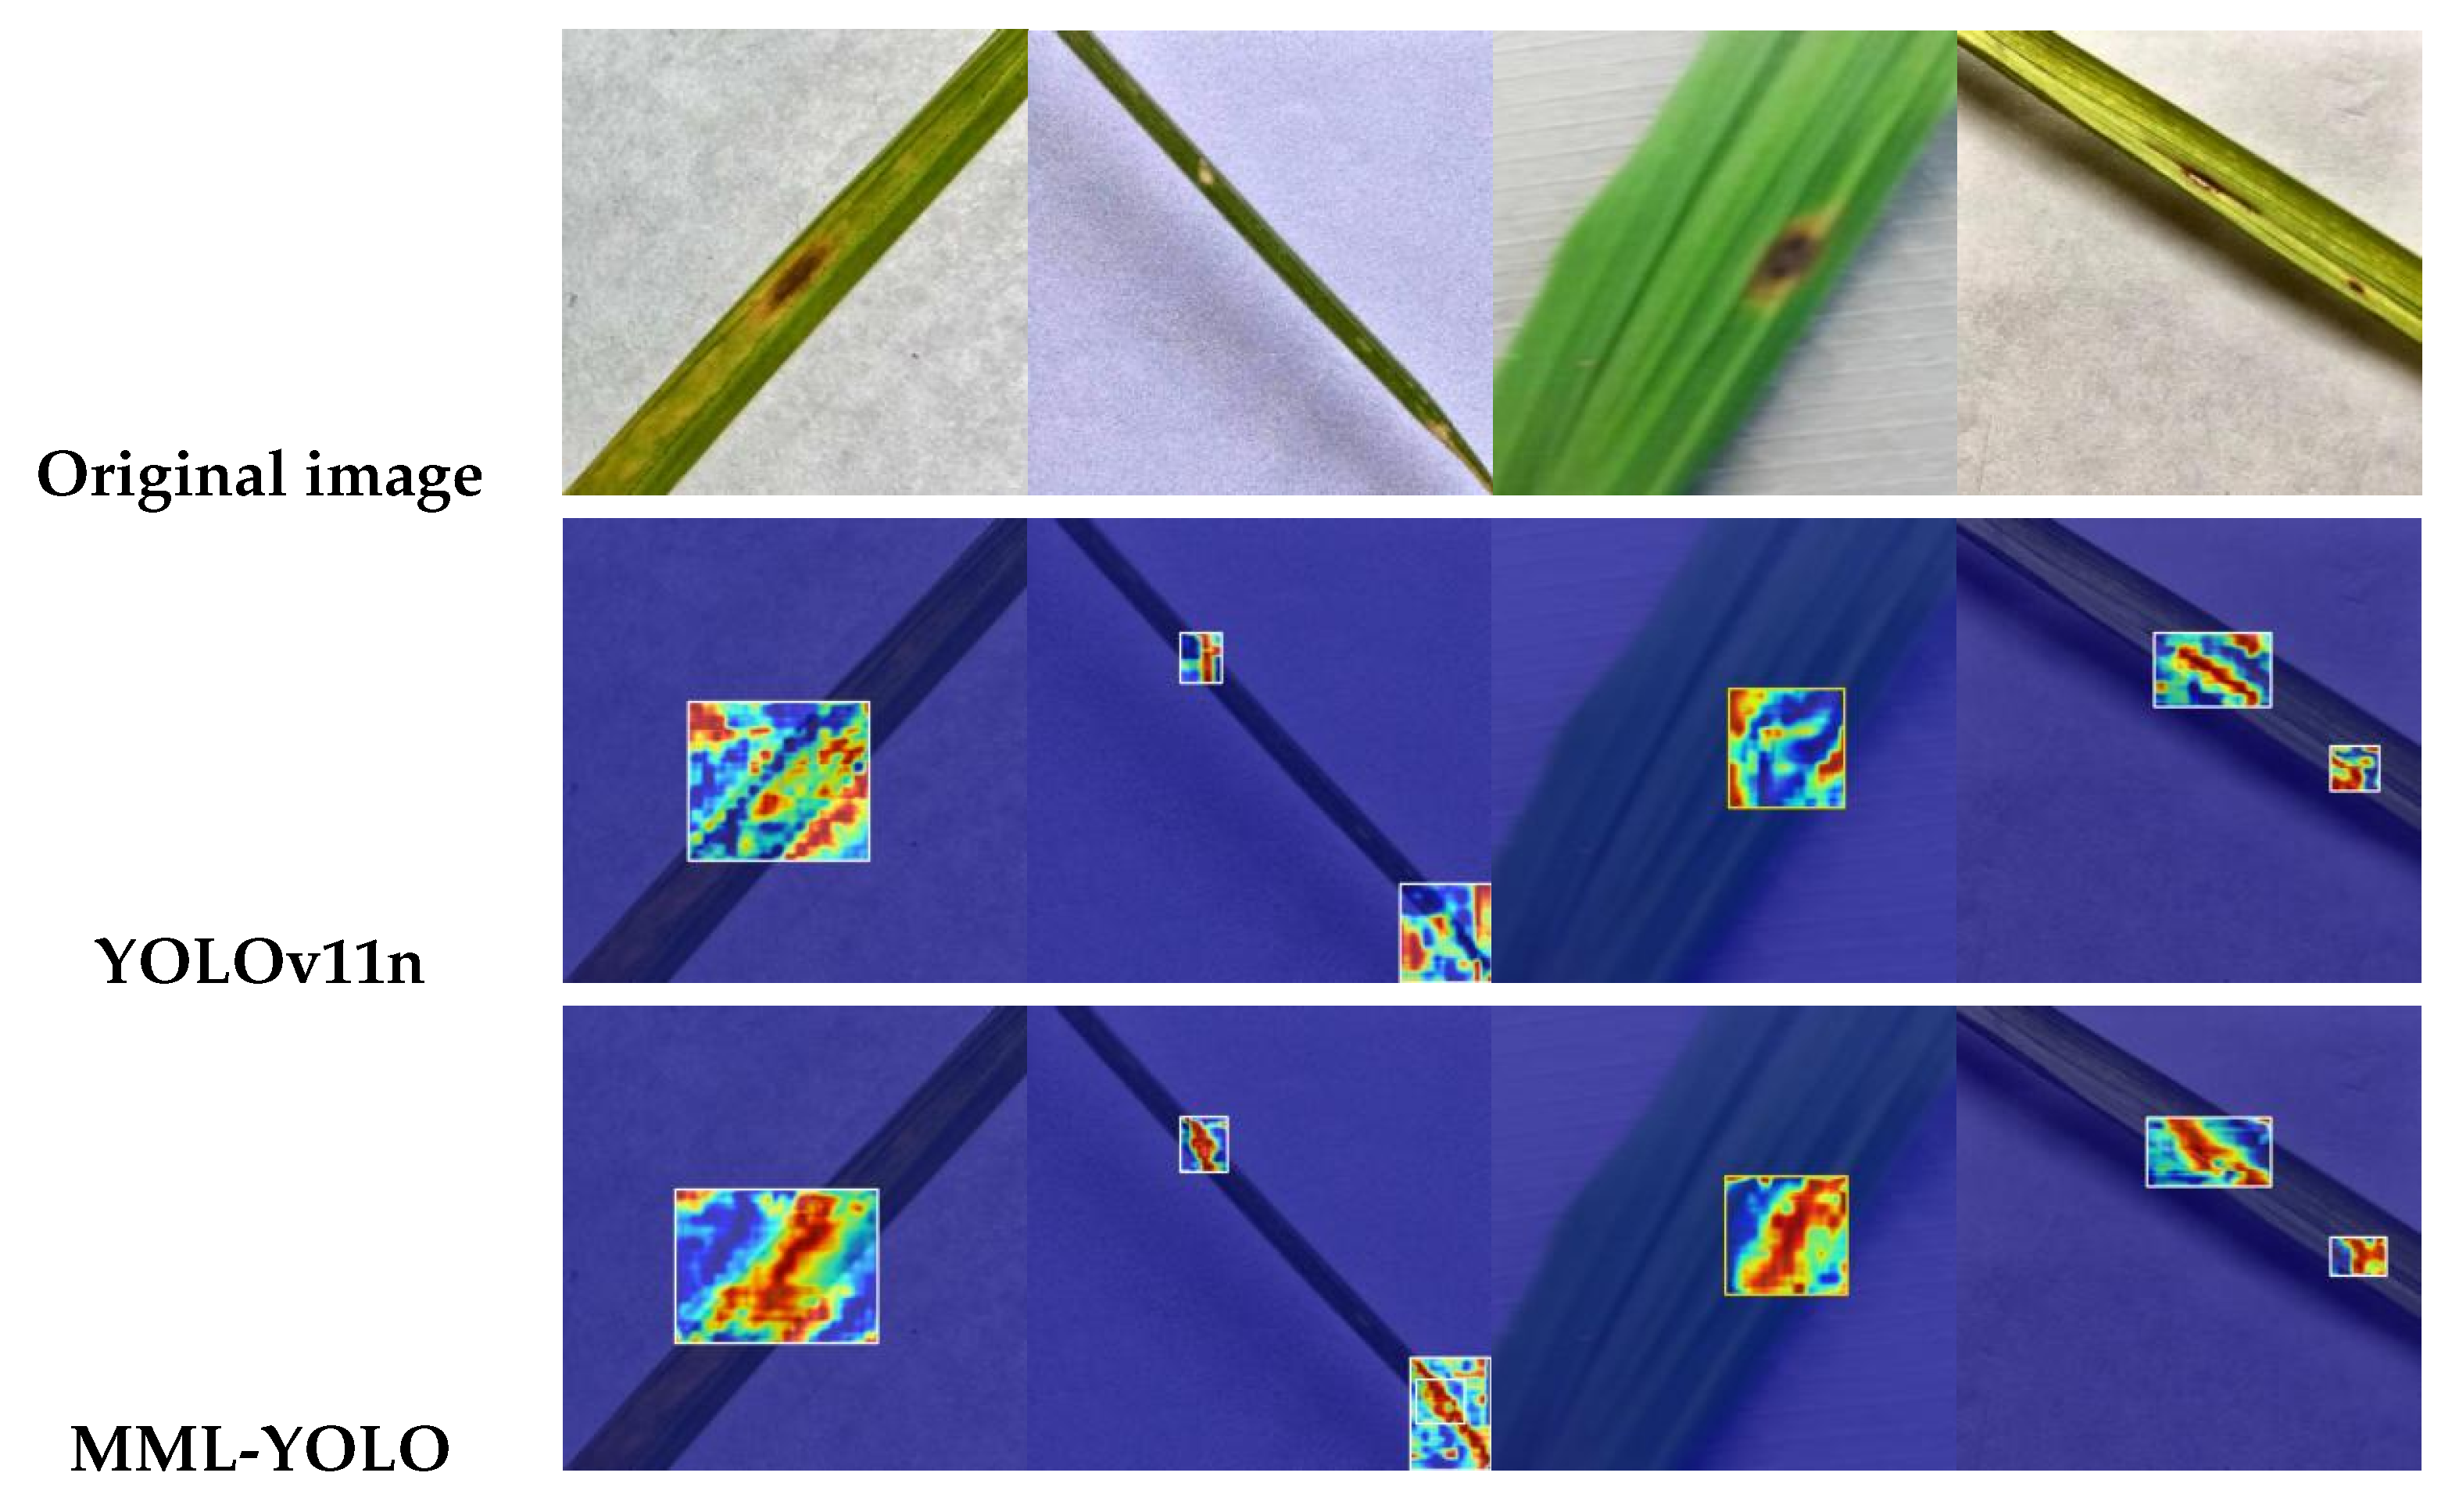
| Original image | |
| YOLOv11n | |
| MML-YOLO |
Figure 8.
Performance comparison of different models on various datasets (mAP50-95).
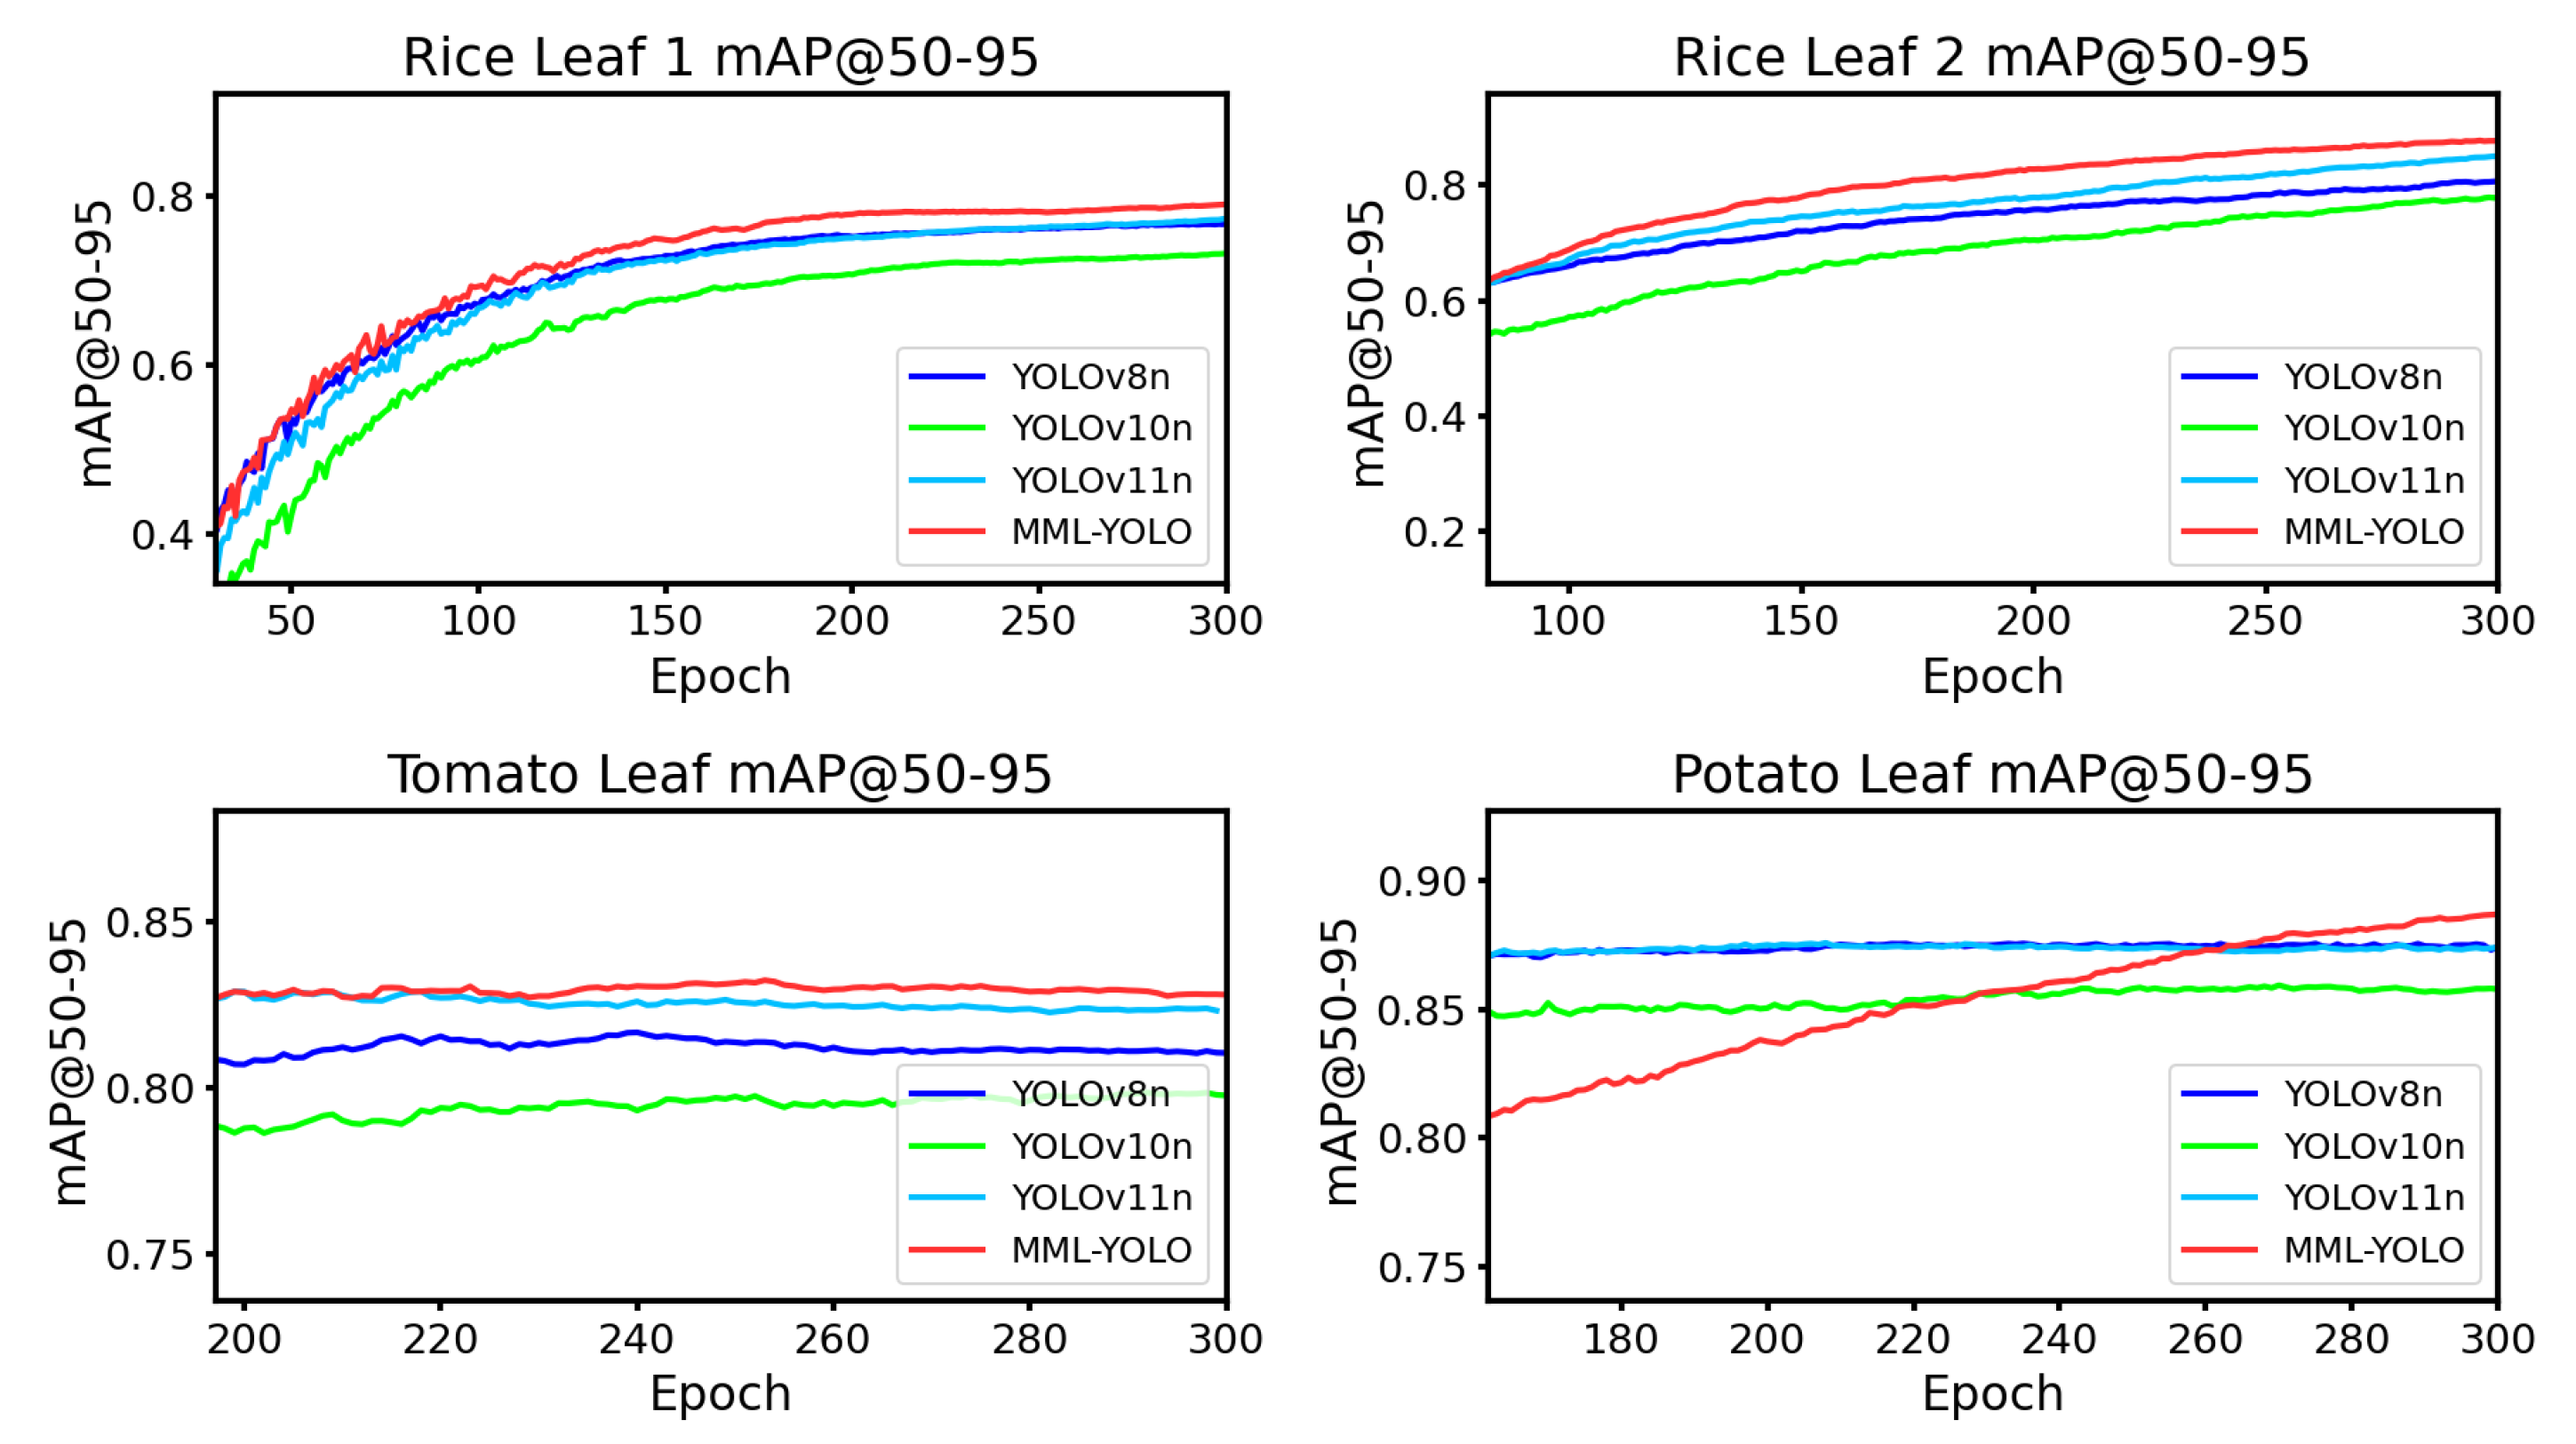
Figure 9.
Comparison of mAP.
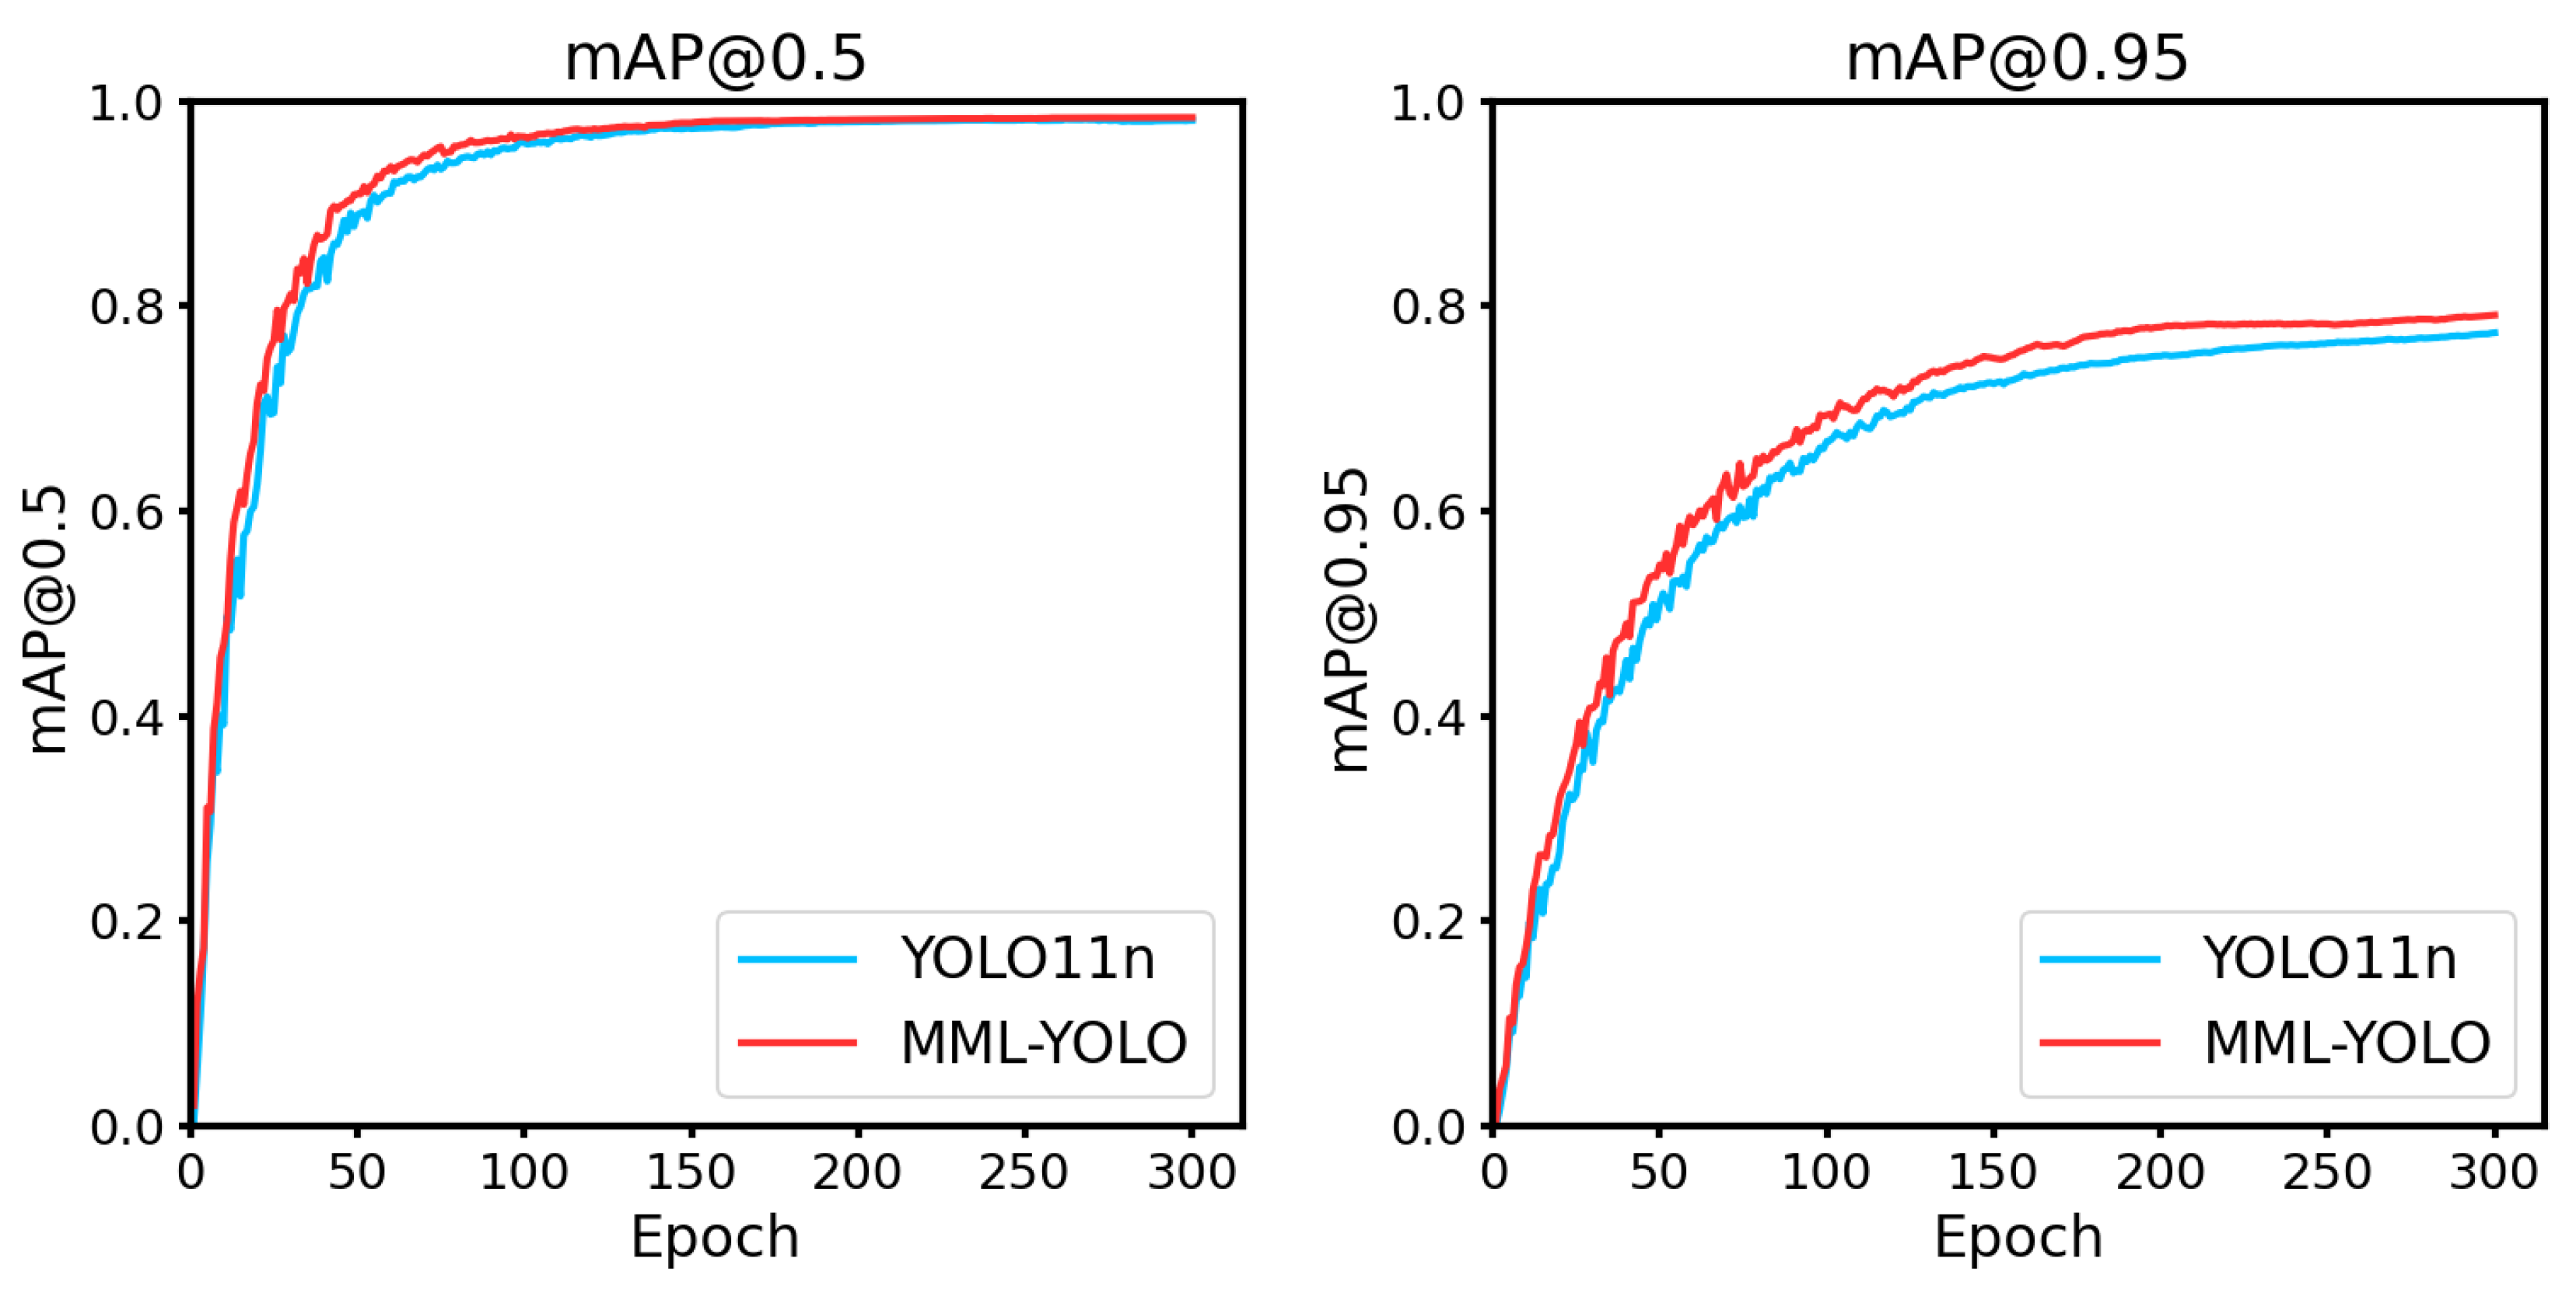

Table 1.
Performance comparison of different YOLOv11 model variants.
| Model | FLOPs (G) | Params (M) | Precision | Recall | mAP50 | Model Size (MB) |
|---|---|---|---|---|---|---|
| yolov11-n | 6.3 | 2.58 | 0.9627 | 0.9517 | 0.9812 | 5.2 |
| yolov11-s | 21.3 | 9.41 | 0.9814 | 0.9757 | 0.9863 | 18.3 |
| yolov11-m | 67.7 | 20.03 | 0.9912 | 0.9827 | 0.9884 | 38.7 |
| yolov11-l | 86.6 | 25.28 | 0.9853 | 0.9849 | 0.9897 | 48.9 |
| yolov11-x | 194.4 | 56.83 | 0.9926 | 0.9806 | 0.9908 | 109.1 |
Table 2.
Performance comparison of different model variants.
| MLFD | MDTA | Lo-Detect | Params(m) | FLOPs(G) | FPS | Precision | Recall | mAP50 | mAP50-95 | ModelSize(MB) |
|---|---|---|---|---|---|---|---|---|---|---|
| × | × | × | 2.58 | 6.3 | 330.35 | 0.9627 | 0.9517 | 0.9812 | 0.7743 | 5.2MB |
| ✓ | × | × | 2.92 | 7.2 | 247.02 | 0.9754 | 0.9623 | 0.9820 | 0.7806 | 6.5MB |
| × | ✓ | × | 2.89 | 7.5 | 208.76 | 0.9632 | 0.9589 | 0.9821 | 0.7841 | 7.1MB |
| × | × | ✓ | 2.31 | 5.1 | 355.00 | 0.9581 | 0.9543 | 0.9802 | 0.7719 | 4.7MB |
| ✓ | ✓ | × | 2.93 | 7.2 | 202.83 | 0.9763 | 0.9559 | 0.9881 | 0.7941 | 7.4MB |
| × | ✓ | ✓ | 2.65 | 6 | 261.11 | 0.9729 | 0.9555 | 0.9836 | 0.7883 | 6MB |
| ✓ | × | ✓ | 2.43 | 5.1 | 252.95 | 0.9634 | 0.9521 | 0.9834 | 0.7747 | 5.5MB |
| ✓ | ✓ | ✓ | 2.66 | 6.2 | 248.67 | 0.9726 | 0.9553 | 0.9872 | 0.7927 | 5.6MB |
Table 3.
Performance comparison of different models.
| Model | Params(m) | FLOPs(G) | FPS | Precision | Recall | F1-Score | mAP50 | mAP50-95 | Model Size(MB) |
|---|---|---|---|---|---|---|---|---|---|
| YOLOv5n | 2.18 | 5.8 | 279.86 | 0.9629 | 0.9204 | 0.9406 | 0.9731 | 0.7396 | 4.5MB |
| YOLOv8n | 2.69 | 6.8 | 310.07 | 0.9614 | 0.9499 | 0.9555 | 0.9792 | 0.7693 | 5.4MB |
| YOLOv10n | 2.27 | 6.5 | 300.33 | 0.9506 | 0.9418 | 0.946 | 0.9786 | 0.7733 | 5.5MB |
| YOLOv11n | 2.58 | 6.3 | 330.35 | 0.9627 | 0.9517 | 0.9569 | 0.9812 | 0.7743 | 5.2MB |
| Faster-RCNN | 41.36 | 137 | 88.9 | 0.842 | 0.827 | — | 0.9576 | 0.676 | 31.6MB |
| MML-YOLO | 2.66 | 6 | 248.67 | 0.9726 | 0.9553 | 0.9639 | 0.9872 | 0.7927 | 5.6MB |
Disclaimer/Publisher’s Note: The statements, opinions and data contained in all publications are solely those of the individual author(s) and contributor(s) and not of MDPI and/or the editor(s). MDPI and/or the editor(s) disclaim responsibility for any injury to people or property resulting from any ideas, methods, instructions or products referred to in the content. |
© 2025 by the authors. Licensee MDPI, Basel, Switzerland. This article is an open access article distributed under the terms and conditions of the Creative Commons Attribution (CC BY) license (http://creativecommons.org/licenses/by/4.0/).
Copyright: This open access article is published under a Creative Commons CC BY 4.0 license, which permit the free download, distribution, and reuse, provided that the author and preprint are cited in any reuse.


