Submitted:
12 November 2025
Posted:
17 November 2025
You are already at the latest version
Abstract
The arsenic sandstone region constitutes one of the most severe soil erosion hotspots in the middle reaches of the Yellow River, China, where the soil and water conservation capacity is continuously deteriorating and landscape fragmentation is intensifying. Green infrastructure (GI), as a network system of green spaces, can effectively mitigate soil erosion and optimize regional landscape patterns. Based on land-use change data from 2003 to 2023, this study integrated Morphological Spatial Pattern Analysis (MSPA), landscape index method, and Minimum Cumulative Resistance (MCR) model to identify and analyze GI in the pisha sandstone region. The results revealed that: 1) The characteristics of land use type conversion exhibited distinct phased differences between 2003 and 2023. Prior to 2013, farmland was the primary outflow type, accompanied by a reduction in unused land and an expansion of forest land, water bodies, impervious surface, and grassland. After 2013, grassland became the dominant outflow type, with a decrease in water bodies and an increase in farmland, forest land, impervious surface, and unused land. 2) From 2003 to 2023, the total area of GI in the study region showed a trend of initial increase followed by decrease, maintaining a proportion between 84.66% and 87.70%. Spatially, it presented a pattern of aggregation in the northwest and sparseness in the southeast. 3) During the study period, the number of ecological source sites decreased from 20 to 14, the number of general ecological corridors reduced from 152 to 75, and the number of important ecological corridors declined from 38 to 16. 4) The network closure index (α index) decreased from 0.54 to 0.13, the line-point ratio (β index) dropped from 1.90 to 1.14, and the network connectivity index (γ index) fell from 0.70 to 0.44. The GI network structure exhibited a fragmented pattern characterized by local concentration and overall sparseness. This study focuses on the spatiotemporal evolution and pattern characteristics of GI in the special landform of pisha sandstone, providing a theoretical basis for territorial spatial planning, soil erosion control, and human habitat improvement in this region. It also offers new insights for research on ecological security and human habitat quality in special landform areas globally.
Keywords:
green infrastructure
; ecological source areas
; landscape patterns
; ecological networks
; Pisha Sandstone Region in the Middle Reaches of the Yellow River
; China
1. Introduction
As a distinctive lithological type, pisha sandstone is characterized by high porosity, loose structure, and weak cementation [1]. This inherent property causes it to disintegrate into mud when wetted and disperse as sand when exposed to wind [2]. resulting in a typical landscape of fragmented terrain and longitudinal gullies in its distribution area, with extremely low stability of the ecosystem substrate [3]. From a global perspective, pisha sandstone resources are scarce and concentrated, mainly distributed continuously in the middle reaches of the Yellow River, China, covering an area of approximately 16,700 km2 across the junction of Shaanxi, Shanxi, and Inner Mongolia provinces [4]. It is the world’s largest and most intensely eroded concentrated pisha sandstone area, with an erosion modulus as high as 30,000–40,000 t/(km2·a) [5]. Although accounting for only 2% of the Yellow River Basin area, it contributes 1/4 of the coarse sediment (particle size >0.05 mm) deposited in the lower reaches of the Yellow River [6]. Consequently, it has become the core source area of coarse sediment in the Yellow River and the most challenging area for soil erosion control in the basin [7]. Previous studies and management practices in the pisha sandstone area have primarily focused on micro-scale processes such as erosion mechanisms [8,9], action principles [10], and the effects of vegetation and water systems on soil and water conservation [11,12,13,14]. While these efforts have deepened the understanding of local ecological processes and achieved certain management results, they lack systematic attention to regional patterns, spatial configurations, and macro-quantitative and qualitative issues. The traditional management model mainly adopts fragmented approaches such as point, line, and surface-based governance, making it difficult to achieve the overall optimization of the ecosystem. As a spatial ecological system integrating “patch-corridor-network”, Regional Green Infrastructure (RGI) can identify priority conservation areas, systematically connect fragmented ecological units, and construct a complete ecological protection network [15,16],providing a novel solution for soil erosion control in pisha sandstone areas. Relevant studies have also demonstrated that the optimization of RGI can weaken soil erosion intensity, reduce terrain fragmentation, and mitigate soil erosion [17,18].
GI was first proposed by the GI Task Force jointly organized by the U.S. Conservation Foundation and the U.S. Department of Agriculture Forest Service [19,20]. It constitutes an interconnected green space network composed of various functional landscape types, including natural and artificial ecological areas such as greenways, wetlands, forests, and native vegetation [21,22]. It emphasizes the connectivity and systematic integration of ecological elements[23], enabling the construction of comprehensive ecological networks at the regional scale[24] to achieve the holistic enhancement of ecological functions. GI can specifically connect fragmented grassland and woodland ecological patches formed by gully cutting and human development in the pisha sandstone area, restore soil and water conservation function corridors interrupted by mining activities and urban expansion, and enhance landscape connectivity. Through the protection of core patches, it can improve soil erosion resistance and water conservation capacity, strengthen the soil and water conservation service function of the ecosystem, and provide systematic support for regional ecological security. Therefore, in-depth research on the spatiotemporal evolution of GI in the pisha sandstone area and analysis of its pattern characteristics can not only make up for the deficiencies of existing studies in terms of systematic ecological patterns, spatial configurations, and macro-quantitative and qualitative issues in the pisha sandstone area but also provide a theoretical basis for territorial spatial planning, soil erosion control, and human habitat improvement in the pisha sandstone area. Meanwhile, it facilitates targeted and phased ecological space management, ensuring regional ecological security and overall ecosystem optimization, and providing scientific support for exploring sustainable development paths.
The development of patch-corridor-network frameworks is becoming increasingly comprehensive, with research primarily focusing on the spatiotemporal evolution and prediction of GI [25,26,27], the construction and optimization of ecological networks [28,29,30,31,32], and the evaluation of ecosystem services and ecological security patterns [33,34,35,36,37,38,39].For instance, scholars such as Ran Yue[40], Ana Medeiros[41], Wang Jiening[42], Duan Pengting[43] have examined land use changes under various scenarios to forecast future trends. Their analyses of GI’s spatiotemporal evolution reveal its characteristics over different periods, the development of core areas, and its ecological impact. Researchers like Gu Kangkang[44], Dimas Danar Dewa[45], Guan Huiyuan[46], Zhang Haoxiang[47], Lu Yujia[48] have identified ecological sources, resistance surfaces, and corridors to construct and optimize ecological networks. Meanwhile, Duy X. Tran[49], Matthew G.E.[50], Gao Yaling[51], Zerong Li[52] explored the spatiotemporal evolution of ecosystem services in different geographical environments and their interactions with ecological risks and landscape structures, emphasizing the importance of optimizing land use and landscape patterns to enhance ecosystem services.Based on the above studies, the research framework of “ecological source identification-resistance surface construction-ecological corridor extraction” has become a paradigm for GI research, and related research methods have shown a diversified trend. Its technical path can be summarized as follows: taking land use change as the research basis, identifying the laws of land use type conversion by analyzing its dynamic change characteristics; using Guidos software with an 8-neighborhood setting to identify GI types through MSPA and analyze their spatiotemporal evolution. Among them, the identification of ecological source areas—key patches supporting regional ecological processes and functions—has been realized through methods such as Morphological Spatial Pattern Analysis (MSPA)[53], Landscape Connectivity Analysis (LCA) [54], Ecosystem Service Value (ESV) assessment [55], Ecological Sensitivity Assessment (ESA) [56], and the Integrated Valuation of Ecosystem and Land use Tradeoffs (InVEST) model[57]. Studies have shown that combining landscape connectivity as a source screening index with the MSPA method [58,59,60] can improve the accuracy and rationality of ecological source selection, making it suitable for areas with severe landscape fragmentation. On this basis, landscape pattern indices such as the number of patches, patch density, largest patch index, landscape shape index, and aggregation degree [61] ,can be further introduced for quantitative analysis to comprehensively evaluate the distribution characteristics and spatial patterns of ecological sources.The construction of ecological resistance surfaces aims to form an evaluation carrier that comprehensively reflects the impact of spatial landscape heterogeneity on ecological flows [62,63,64]. It is common to use a combination of natural and anthropogenic factors to determine the resistance levels and corresponding resistance values of different influencing factors. The construction of ecological corridors mainly adopts methods such as the Least Cost Path (LCP) model [65], Minimum Cumulative Resistance (MCR) model [66], Gravity model [67], and circuit theory [68]. Among them, the MCR model has significant advantages in calculating the coupling of natural and human disturbances and can be paired with the Gravity model to identify important corridors [69,70], enabling in-depth analysis of network structural characteristics.
Therefore, this study selected the pisha sandstone area in the middle reaches of the Yellow River as the research area, based on land use data from 2003, 2013, and 2023 to provide objective data support for the identification and analysis of GI. Combined with MSPA and landscape connectivity analysis, ecological sources in the three periods were identified; the landscape index method was used to analyze changes in the landscape pattern of GI; the MCR model and Gravity model were employed to screen ecological corridors in the three periods, thereby constructing the GI network in the study area and evaluating its connectivity. Ultimately, the spatiotemporal evolution laws and pattern characteristics of GI in the study area over the past two decades were revealed (Figure 1). At the theoretical level, based on the special geomorphological and ecological vulnerability characteristics of the pisha sandstone area, this study systematically identifies and analyzes the regional GI, contributing to research on macro-ecological patterns, spatial configurations, and quantity-quality synergy in the pisha sandstone area. At the practical level, closely aligned with the strategy of ecological protection and high-quality development of the Yellow River Basin, this study clarifies the spatiotemporal evolution of GI, identifies key ecological sources and important ecological corridors, and determines spatial conservation priorities. It not only promotes the transformation from traditional fragmented governance to network-coordinated ecological restoration but also effectively addresses prominent regional issues such as soil erosion control and landscape fragmentation restoration, realizing the precise allocation of ecological protection resources.
2. Materials and Methods
2.1. Study Area
The pisha sandstone area in the middle reaches of the Yellow River is located at the junction of Shaanxi, Shanxi, and Inner Mongolia, between 38°10’-40°10’N latitude and 108°45’-111°31’E longitude, covering a total area of 16,700 km2 (Figure 2).The terrain slopes from northwest to southeast, with an altitude ranging from 1000 to 1800 m. The topography and landscape are fragmented with longitudinal gullies. The area belongs to a typical semi-arid temperate continental climate, with an average annual temperature of 6-9°C and annual precipitation of approximately 280-400 mm, concentrated in July-September, accounting for 71.2% of the total annual precipitation, mostly in the form of short-duration heavy rains. This precipitation characteristic makes summer a high-risk period for soil erosion in the area. The rugged terrain and exposed bedrock pose significant challenges to soil and water conservation and management.
2.2. Data Sources
Land use data for the study area in 2003, 2013, and 2023 were obtained from the Chinese Land Cover Dataset (CLCD) developed by the research team of Professors Yang Jie and Huang Xin from Wuhan University using Google Earth Engine (https://zenodo.org/records/5816591), with a spatial resolution of 30 m. Landsat series remote sensing images with a 30 m resolution from the U.S. Geological Survey (USGS; http://espa.cr.usgs.gov) in the same periods were used as the primary data source to verify the accuracy of land use classification in the CLCD data through visual interpretation sampling. After verification, the data met the accuracy requirements for land use data in this study, ensuring the reliability of subsequent analysis results. Using ArcGIS software, combined with the shapefile of the pisha sandstone area, mask extraction was performed to obtain land use data within the pisha sandstone region (Figure 3). Monthly Normalized Difference Vegetation Index (NDVI) data were sourced from the MOD13A3 dataset regularly released by NASA (https://www.earthdata.nasa.gov/). Annual average values were calculated to generate the required annual NDVI raster data, with a spatial resolution of 1 km and coordinates in WGS1984. Digital Elevation Model (DEM) data were obtained from GEBCO’s 2024 global dataset covering land elevation and ocean depth (https://www.gebco.net/data_and_products/gridded_bathymetry_data/). Slope data were derived from elevation data using the Surface Analysis tool in the Spatial Analyst module of ArcGIS. Due to the lack of 2003 road network data, 2000 road network data from the National Basic Geographic Information Center of Tianditu were used as a substitute. Road data for 2013 and 2023 were sourced from OpenStreetMap.
2.3. Research Methods
2.3.1. Land Use Change Analysis Methods
The single land use dynamic degree refers to the magnitude of change in a specific land use type per unit time, which can reflect the rate of quantitative change in a particular land-use type at the micro-scale and compare regional differences in land-use change [71]. The formulas for calculation are as follows:
In the formula, is the single land use dynamic degree ; and denote the land area of a particular land category at the beginning and end of the study period, respectively; and represent the first and last years of the study period, respectively.
To comprehensively understand the conversion between land use types, the land use transfer matrix was adopted. The land use transfer matrix is mainly used to analyze the mutual conversion of different land use types in different periods, revealing the direction and quantity of conversion between different land use types [72]. The formulas for calculation are as follows:
In the formula: indicates the land area converted from land use type to land use type during the study period; = represents the area where land use type remained unchanged throughout the study; refers to the total number of land use types considered.
2.3.2. Identification of Ecological Sources Based on MSPA
Using the reclassification tool in ArcMap, grassland, forest land, and water bodies in the study area were assigned a value of 2 as the foreground, and other land use types were assigned a value of 1 as the background. After a series of preprocessing steps, raster data of the study area were obtained [73]. Using Guidos software with an 8-neighborhood setting, MSPA analysis was performed to classify the foreground into 7 landscape types (Table 1). The edge effect width needs to consider factors such as the study area’s conditions and target species. Existing studies have shown that corridors with a width of 30-60 m can basically meet the migration and diffusion needs of plants and animals [74,75,76,77], and corridors within this width range can maintain river ecosystems and prevent soil erosion [78,79]. By comparing the current scale of the study area with edge widths of 10 m, 30 m, 60 m, 90 m, and 120 m, it was found that the 30 m precision achieved relatively comprehensive landscape type identification, and the core area patch size met the research requirements. Therefore, 30 m was determined as the edge effect width.
Based on the ecological significance of MSPA elements, core areas in the study region were identified as the basic ecological source areas. To further ensure the connectivity function of these source areas, landscape connectivity index analysis was introduced [80]. The Integral Index of Connectivity (IIC) and Probability of Connectivity (PC) were selected as core metrics. Conefor Sensinode software was used to calculate the IIC and PC values of each core area patch,use equal weights to calculate the two types of indexes. Finally, ecological patches with a synthesized index value greater than 1 were selected as core ecological sources, identifying those with significant impacts on landscape connectivity [81]. The formulas are as follows:
In this context, signifies the number of patches, while and represent the areas of Patch and Patch , respectively; is the total landscape area; indicates the maximum potential for diffusion between Patch and Patch ; and the values of and are proportional to landscape connectivity.
2.3.3. Spatiotemporal Analysis of GI Landscape Patterns Using Landscape Pattern Index Methods
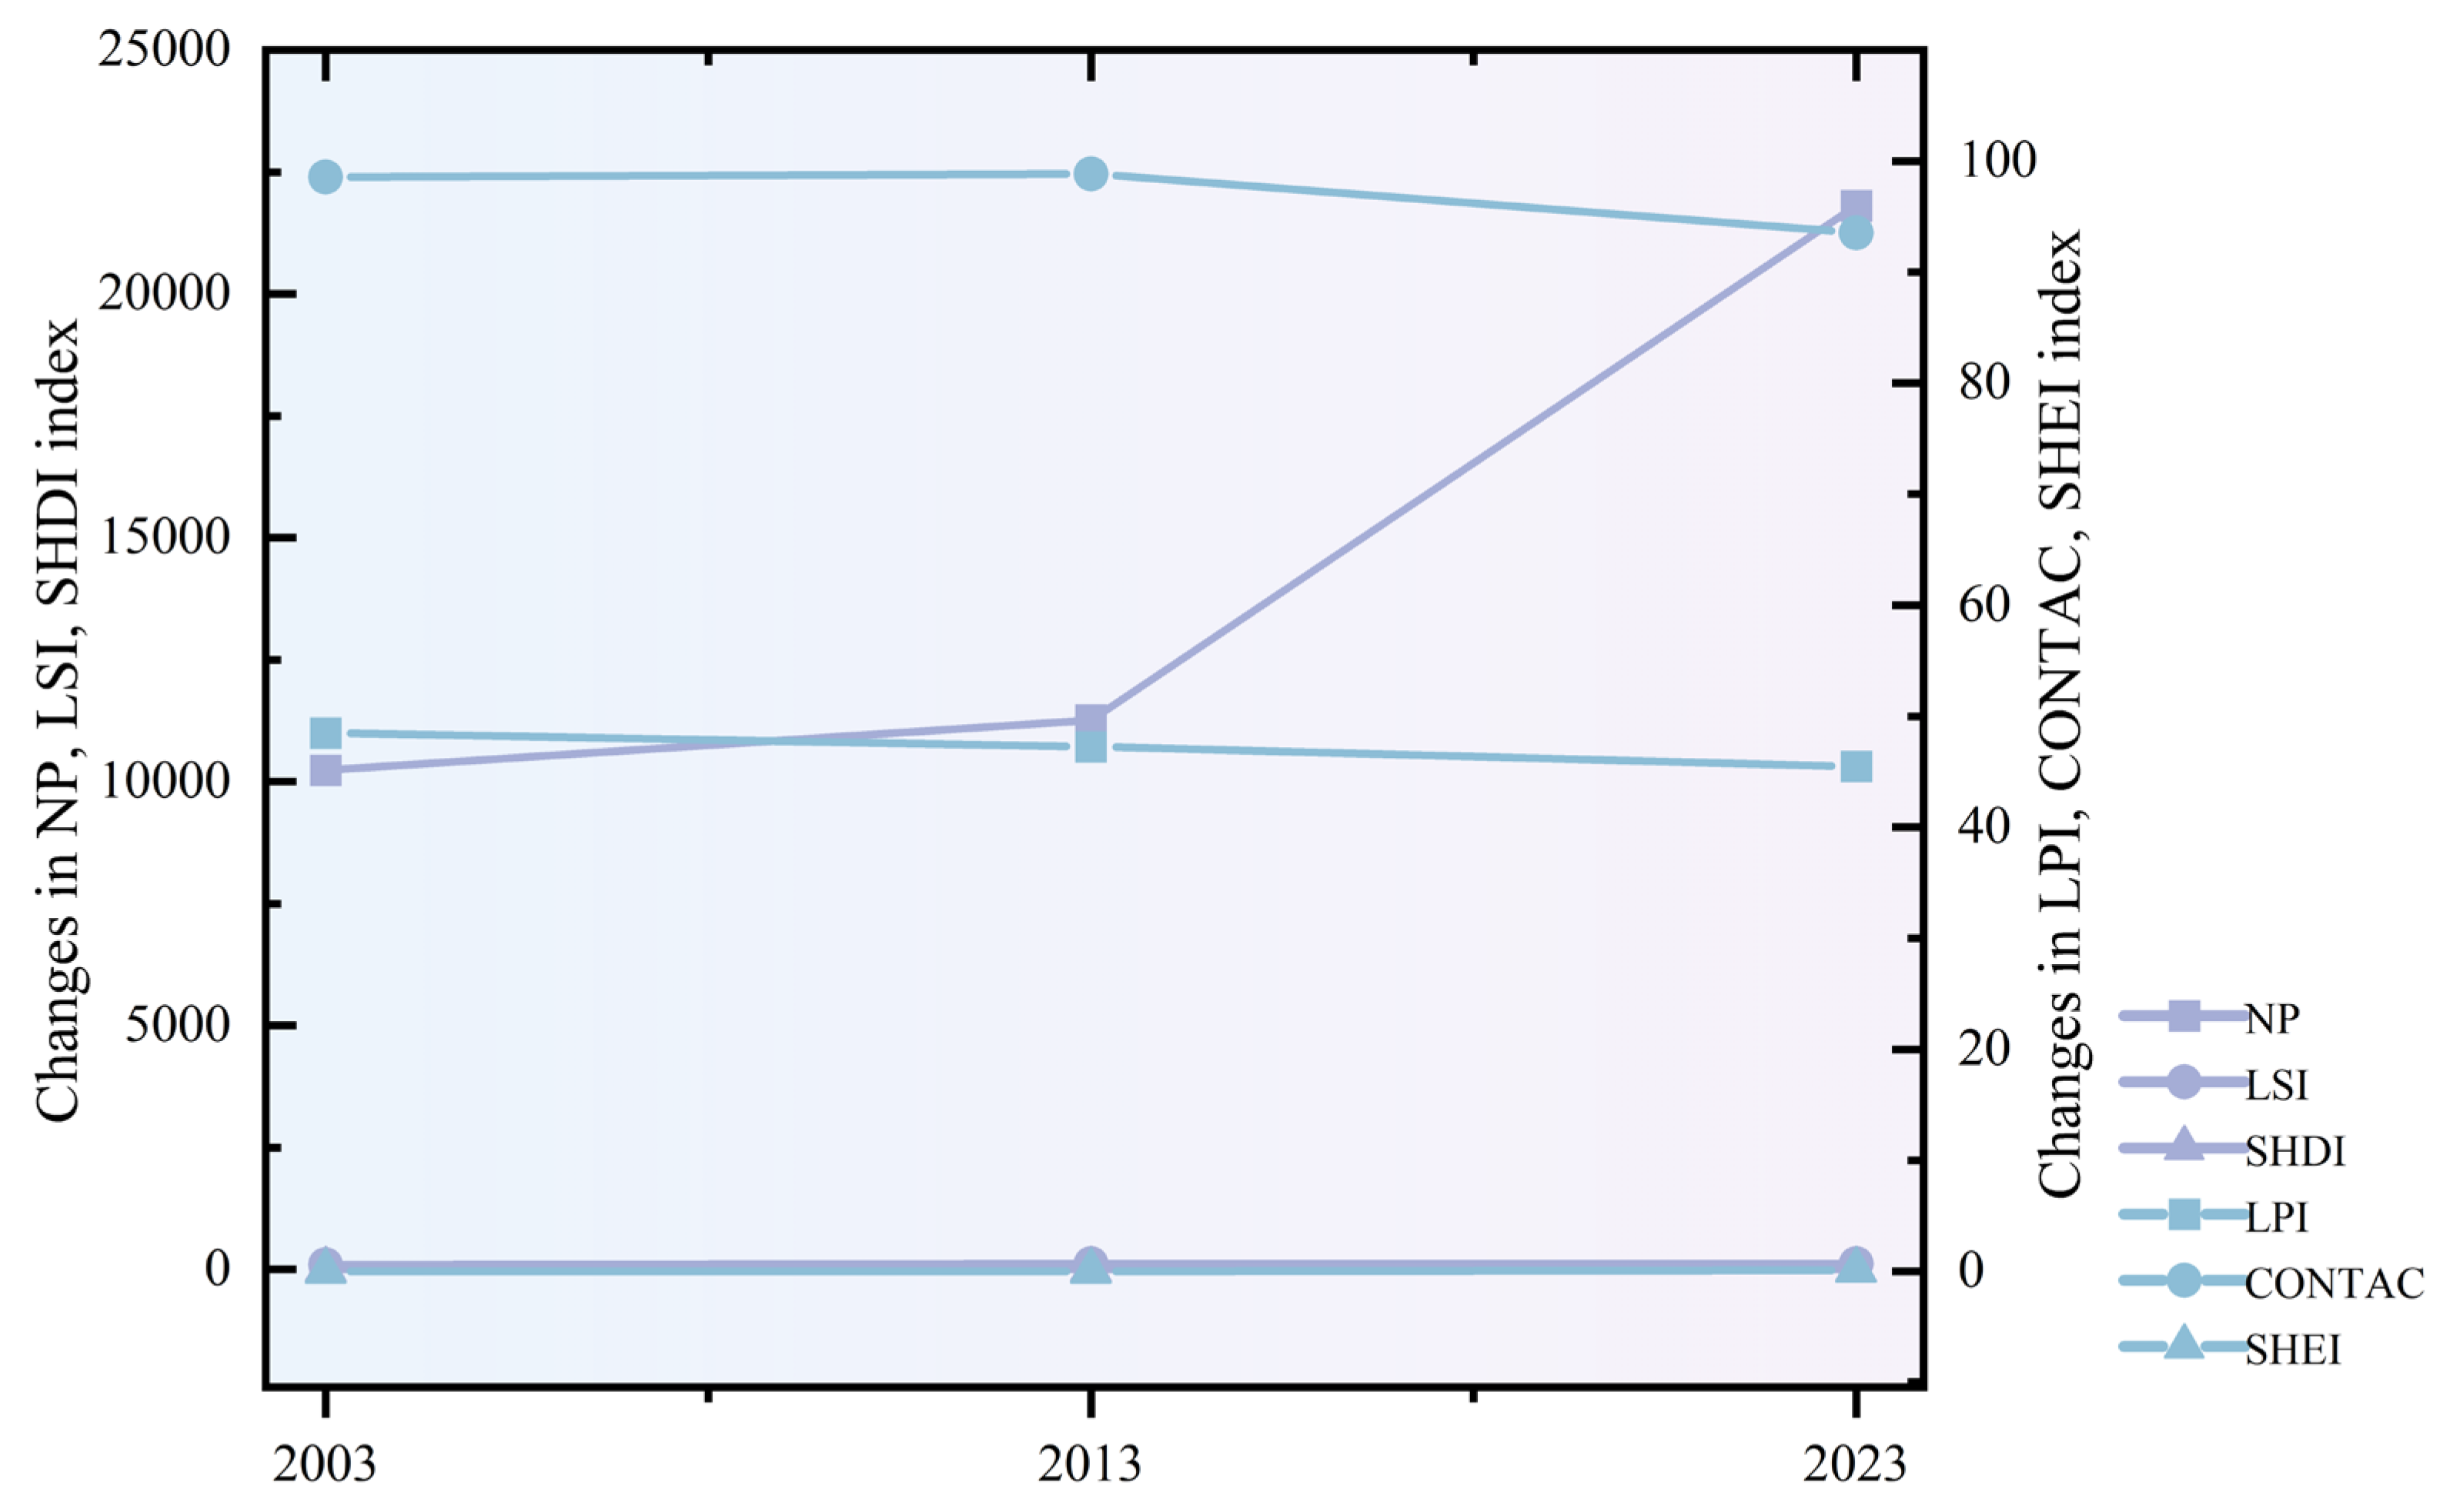
Fragstats software was used to calculate landscape pattern indices. Combining the ecological significance of landscape pattern indices, six indices were selected: Number of Patches (NP), Largest Patch Index (LPI), Landscape Shape Index (LSI), Contagion Index (CONTAG), Shannon’s Diversity Index (SHDI), and Shannon’s Evenness Index (SHEI) to quantitatively analyze the spatiotemporal changes in the GI landscape pattern in the study area from 2003 to 2023.
2.3.4. Potential Corridor Simulation Based on the MCR Model
The MCR model combines quantitative analysis with spatial visualization capabilities. It identifies optimal pathways for species migration and energy exchange by calculating resistance values between ecological source areas and target areas. Currently, it is the most widely used, convenient, and rapid landscape connectivity assessment model [82,83]. As illustrated in Equation:
In the equation, is the minimum cumulative resistance value; is a function indicating that the MCR is positively correlated with ecological processes; is the distance from ecological source to landscape unit ; is the resistance coefficient of landscape unit to the expansion of ecological sources.
The identification of source areas and the construction of ecological resistance surfaces are key to simulating minimum resistance corridors using the MCR model, and the selection of appropriate resistance factors is crucial for constructing resistance surfaces. Combining the general situation of the pisha sandstone area in the middle reaches of the Yellow River and existing research foundations, five resistance factors were selected: land use type, elevation, slope, distance to roads, and vegetation coverage [84] to construct a comprehensive resistance surface (Table 2). Discrete data such as land use types were standardized (assigned values 1-5, followed by positive standardization)[85].Continuous data such as slope, elevation, vegetation cover, roads, and rivers underwent positive and inverse range standardization. Both approaches employed dimensionless data transformation. For instance, steeper slopes indicate greater migration difficulty, thus receiving positive standardization values. Conversely, higher vegetation cover facilitates migration, resulting in negative standardization values [86].The formulas are as follows:
For positive indicators:
For negative indicators:
Among these: is the normalised indicator value, is the original indicator data, and are the maximum and minimum values of the indicator, respectively.
Finally, the weights of resistance factors were determined using the Analytic Hierarchy Process (AHP), and the comprehensive resistance surface was obtained using the raster calculator in ArcGIS 10.8 software to provide cost data for the MCR model.
2.3.5. Identification and Evaluation of Key Corridors Based on Gravity Models
The Gravity model quantitatively evaluates the interaction intensity between source areas by calculating the mutual gravitational force between patches. Higher interaction intensity indicates lower resistance to the exchange of materials, energy, and information between source areas, and the corridors connecting these source areas are more important [87], based on which important ecological corridors can be extracted. The formula is as follows:
In the equation, denotes the interaction force between patches and , and are the weight values of the two patches, is the standardized value of the potential corridor resistance between patches and , and are the resistance values of patches and , and are the areas of patches and j, and is the cumulative resistance value of the corridor between patches and . is the maximum value among all corridor resistances.
Based on the important ecological corridors identified by the Gravity model, three indices were used to quantitatively characterize the ecological network characteristics of the study area: network closure index (α), line-point ratio (β), and network connectivity index (γ) [88]. The formulas are as follows:
In the formula, represents the number of corridors and nodes. higher index value signifies more closed loops within the network, suggesting smoother internal material and energy flow. the larger the index value, the more corridors connected to each node within the network, indicating a more complex corridor network structure; the larger the index value, the closer the actual number of corridors connecting nodes is to the possible number of corridors, indicating higher network connectivity [89].
3. Results
3.1. Analysis of Land Use Structure and Transfer Changes
In the pisha sandstone area in the middle reaches of the Yellow River, the grassland area was 13,872.73 km2, 14,449.10 km2, and 14,185.06 km2 in 2003, 2013, and 2023, accounting for 82.70%, 86.14%, and 84.57% of the total land area, respectively. The proportion of impervious Surface increased steadily from 1.41% to 3.02%. The total area of farmland decreased by 433.75 km2, with its proportion declining from 13.80% to 11.22%. The proportion of unused land decreased from 1.86% to 0.82%. The forest land area increased by 22 km2. The water body area first increased and then decreased, with an overall increase of 2.65 km2 and its proportion rising from 0.22% to 0.24% (Table 3 and Table 4). Summarizing the above data, the conversion between various land use types was frequent and significantly different from 2003 to 2023. Grassland dominated the land use in the pisha sandstone area, while the areas of farmland and unused land decreased, and the areas of forest land and impervious surface continued to increase.
The chronological map of land use conversion in the pisha sandstone region (Figure 4),reveals significant changes from 2003 to 2013. During this period, farmland was predominantly converted out of the region, with a total converted-out area of 2,315.26 km2 compared to a converted-in area of 427.02 km2, leading to a net loss of 1,888.24 km2. Specifically, 934.35 km2 of farmland transitioned to grassland, 39.95 km2 to impervious surface, 1.73 km2 to water bodies, and 0.81 km2 to forest.In the subsequent decade, from 2013 to 2023, grassland experienced the most significant outflow, totaling 868.68 km2. Of this, 661.91 km2 was converted to farmland, 99.46 km2 to impervious surface, and 13.17 km2 to forest land.The main land types converted to grassland, from highest to lowest, are farmland 526.93km2, unused land 75.90km2, impervious surface 6.09km2, water body 1.67km2, impervious surface 0.11km2, forest 0.02km2. The overall amount of grassland conversion outflow is greater than the amount of grassland conversion inflow, and the amount of grassland decreases.
In general, before 2013, farmland had the largest outflow area and showed a decreasing trend, which was directly related to the national “Grain for Green” policy launched in 2002. As a typical erosion-sensitive area, the pisha sandstone area in the middle reaches of the Yellow River became a key implementation area for this project, resulting in the large-scale conversion of farmland to forest land and grassland. After 2013, grassland had the largest outflow area, and impervious surface expanded significantly, with other land use types also undergoing corresponding adjustments. This was mainly driven by the advancement of urbanization and regional economic development.
3.2. Spatio-Temporal Analysis of GI Based on MSPA
From a temporal perspective, the GI area accounted for 84.66% to 87.70% of the study area between 2003 and 2023 (Figure 5). While the total GI area initially increased before declining, it maintained an overall upward trend. The proportion rose from 84.66% in 2003 to 89.21% in 2013, representing a 4.55% increase. From 2013 to 2023, it decreased slightly by approximately 1.5%, reaching 87.70% in 2023.From the perspective of GI types, the core area was the largest, accounting for approximately 40%-54% of the total GI area. Based on the ecological significance of the core area, it can be inferred that the study area has contiguous large-scale green spaces. Secondly, the areas of bridges, edges, perforations, and loops accounted for relatively large proportions of the total study area, at 20%, 7%, 10%, and 7%, respectively. The existence of bridges and other elements enhances the connectivity of the GI ecological network and ensures the integrity of the green spaces in the study area. In addition, the proportions of islets and branches were relatively small, at 0.40% and 1.50%, respectively.
From a spatial perspective (Figure 6), the core areas were mainly distributed in the northern, northwestern, and southern boundaries of the study area from 2003 to 2023. Among these, the core areas in Dongsheng, Dalate Banner, Hangjin Banner, Kangbashi, and Yijinhuoluo Banner were widely distributed. Types such as bridges, branches, and islets were mainly distributed in the southern, eastern, and southeastern parts of the study area, including Shenmu City, Fugu County, and the eastern part of Jungar Banner. The topography of the study area slopes from northwest to southeast. The southeastern part consists of high hills with steep slopes, which are less suitable for plant growth. The eastern part of the Pisha Sandstone Formation along the west bank of the Yellow River features low mountain terrain with severe soil erosion and a relatively small core area. It is prone to forming types such as connecting bridges, loops, and isolated islands.(Figure 6: C, D).The northwest region consists of low hills with higher elevations, featuring larger areas of green patches and a widespread core distribution.A distinct boundary line appears between the core and other types. As shown in Figure 2, this boundary line aligns closely with the contour lines. From the perspective of background areas, the background areas of urban centers such as Dongsheng, Shenmu City, Baode County, and Jungar Banner showed an expanding trend (Figure 6: A, B). All the above factors result in the wide distribution of core areas in the northwest.
Overall, the changes in GI types and their distribution are mainly attributed to two factors. On the one hand, the fragmented topography and gully development in the pisha sandstone area are not conducive to the integrity and connectivity of the ecosystem. On the other hand, frequent human activities and energy development, especially coal mining, have hindered vegetation restoration and intensified landscape fragmentation. Despite the decrease in the area of some GI types, the gradual expansion of the core area reflects its important role in the GI ecological network. This indicates that with the promotion of ecological protection and governance measures, the ecological space in the study area is developing in a positive direction despite the dual pressures of human activities and natural conditions, but there is still room for improvement in the systematicity of the entire ecological space.
3.3. GI Landscape Pattern Analysis Based on Landscape Indices
Using Fragstats software to calculate landscape pattern indices, we screened indicators based on their ecological significance. Six key metrics were selected: NP, LPI, LSI, CONTAG, SHDI, and SHEI to analyze landscape patterns in the study area from 2003 to 2023.
From 2003 to 2013, the NP increased from 10,242 to 11,259, showing a relatively stable growth trend. The LPI decreased from 48.5126 to 47.2493, indicating a downward trend. The LSI increased from 100.5386 to 112.8338, indicating an upward trend. The CONTAG slightly increased from 98.5602 to 98.8147. SHDI decreased from 0.0329 to 0.0282, and SHEI decreased from 0.0183 to 0.0158. The special geomorphology of the study area has led to unstable surface conditions. Small-scale land development and early mineral resource utilization by humans have intensified soil erosion to a certain extent, resulting in a certain degree of landscape fragmentation. The core patch area has been reduced under the combined influence of human activities and soil erosion, and the complexity of the landscape shape has increased. However, the overall continuity of the landscape remains high, and the diversity and evenness have slightly decreased. This reflects that the interference between human activities, natural geomorphology, and soil erosion factors is in the initial stage and has not yet caused drastic impacts on the landscape pattern.
From 2013 to 2023, the NP increased sharply from 11,259 to 21,811. The LPI continued to decline to 45.4556. The LSI further increased to 119.7655. The CONTAG significantly decreased to 93.5171. SHDI significantly increased to 0.2062, and SHEI also increased to 0.1059. During this period, the intensity of human activities increased significantly. Large-scale mineral resource development led to drastic changes in land use, further damaging the protective layer of surface vegetation and aggravating soil erosion. Under the dual effects of human activities and soil erosion, the contiguous landscape was severely fragmented, the degree of fragmentation increased sharply, the core patch area was further eroded, and the landscape shape became increasingly complex.
Figure 7.
Area and proportion of landscape types in 2003, 2013, and 2023.
3.4. GI Network Construction
3.4.1. Ecological Resistance Surface Analysis
A comprehensive resistance surface system for the study area was constructed by integrating resistance factors such as land use type, elevation, slope, distance to roads, and NDVI, resulting in resistance surfaces for 2003, 2013, and 2023 (Figure 8).Over the past 20 years, the high-resistance area has shown an expanding trend, with an overall spatial distribution characterized by higher resistance in the northwest and lower resistance in the southeast. Although the northwestern part of the pisha sandstone area is dominated by low hills with high elevations and relatively gentle terrain, its low vegetation coverage directly increases the resistance to ecological flows, leading to overall high resistance values in the northwest.
Meanwhile, urban centers and energy bases such as Dongsheng, Shenmu City, Baode County, and Jungar Banner characterized by high urbanization levels, dominated by impervious surface and farmland, intensive human activities, dense road networks, and large-scale mineral extraction and urban expansion that encroach on ecological space,have restricted biological migration and ecological process diffusion, becoming concentrated areas of high resistance values. Low-resistance areas are distributed across all counties and cities, with widespread distribution in the southeastern region. Despite the lower elevation in the southeast, the ecological background of steep slopes and discontinuous vegetation still restricts local resistance values, making it difficult to form low-resistance connectivity zones. The spatiotemporal evolution and pattern characteristics of GI analyzed in this study can effectively reduce soil erosion, avoid environmental damage caused by human activities, protect forest resources, and provide a theoretical basis for the coordination of economic development and environmental protection.
3.4.2. Simulation of Potential GI Corridors
Based on the resistance surface of the study area, the minimum cost distance method was used to calculate the minimum cumulative cost paths between GI source areas and construct potential species migration corridors. As shown in Table 5 and Figure 9, there were 190 GI corridors in the study area in 2003, densely distributed in the central and northwestern regions where the terrain is relatively flat and patch connectivity is high. In 2013, the number of GI corridors decreased by 36.8% to 120 compared with 2003, but the phenomenon of corridor intersection slightly increased. This is mainly due to the merging of some ecological source areas into patches and the increase in ecological source areas in the northeast and south, leading to more corridor intersections. This phenomenon indicates that despite the decrease in the number of corridors for species exchange, local ecological connectivity has become more complex. In 2023, the number of GI corridors further decreased by 24.2% to 91 compared with 2013. The area of ecological green spaces in the study area increased, and the distribution of corridors tended to be simplified.
Over the past 20 years, the number of GI corridors in the study area has shown a decreasing trend, which is mainly attributed to the fragile characteristics of the regional ecosystem and human interference: 1) The pisha sandstone area is characterized by severe soil erosion, leading to the fragmentation and damage of ecological corridors and a continuous decrease in their area. The loose soil texture is susceptible to wind and water erosion, making it difficult for vegetation to grow stably, further destroying the connectivity of ecological corridors and exacerbating soil erosion in the pisha sandstone area. 2) With the socio-economic development of cities, the continuous expansion of human activities and impervious surface has continuously encroached on GI source areas in the study area, reducing the connection starting points of corridors and leading to a decrease in the number of GI corridors. 3) The GI source areas in the southeast have fragmented into small patches, leading to a temporary increase in corridor intersections.However, this connection does not indicate improved connectivity but rather a sign of weakened corridor functions. Eventually, the continuous reduction of source areas leads to a decrease in corridor intersections and an overall decline in connectivity.
3.4.3. Construction of GI Networks Based on Gravity Model Analysis
The Gravity model was used to calculate the interaction force between GI source areas, construct a gravity matrix of GI source areas, and distinguish the importance of corridors. Based on the results of the gravity matrix analysis, GI corridors with an interaction force ≥20,000 were classified as important corridors, and those with an interaction force <20,000 were classified as general corridors. In 2003, there were 190 GI corridors in the study area, including 38 important corridors and 152 general corridors. In 2013, the total number of GI corridors in the study area was 120, including 21 important corridors and 99 general corridors. In 2023, the number of GI corridors in the study area continued to decrease to 91, including 16 important corridors and 75 general corridors(Figure 10).
Important corridors are usually located in areas with stable ecological environments, gentle terrain, and good connectivity, with weak impacts of water and wind erosion, relatively slight soil erosion, less external interference, favorable connectivity backgrounds of ecological sources, and low resistance values. They are mainly distributed in the northwest of the pisha sandstone area. In contrast, general GI corridors are numerous and widely distributed, limited by natural conditions and disturbed by human activities, making them unsuitable for large-scale species exchange activities. Based on the identified GI source areas and important corridors, a potential GI network was constructed.
3.4.4. Evaluation of GI Network Structure
From 2003 to 2023, the number of ecological source sites decreased from 20 to 14, and the number of important ecological corridors decreased from 38 to 16 (Table 6). The α value decreased from 0.54 to 0.13, indicating a reduction in closed loops within the network. The β value remained above 1, suggesting a mesh-like structure of the regional network. However, the connectivity level of this ecological network is generally moderate, with limited resilience to external pressures. The γ value decreased from 0.70 in 2003 to 0.44 in 2023, indicating that there is room for improvement in network connectivity. Based on this series of network structure indices and comparative analysis with relevant literature [90,91,92], it is evident that the overall spatial structure of the regional network is relatively underdeveloped. Its layout is biased toward the northwest, presenting a fragmented pattern characterized by local concentration and overall sparseness.
The evaluation of network connectivity shows that the overall connection tightness and connectivity of the GI network have decreased. The evolution of the GI network in the study area from 2003 to 2023 indicates that the main driver of changes in the GI network pattern is the change in GI source areas. Therefore, changes in the number and area of GI source areas have important impacts on network nodes and corridors, ultimately altering the original network structure.
4. Discussion
4.1. Necessity of GI Identification and Analysis in the Middle Reaches of the Yellow River
As a key ecologically fragile area in the Yellow River Basin, the pisha sandstone area in the middle reaches of the Yellow River requires the identification and systematic analysis of GI, which is an essential requirement for addressing core regional ecological challenges and overcoming the limitations of traditional governance models. Its necessity is reflected in three aspects: 1) From the perspective of regional ecological characteristics, this area is the largest concentrated pisha sandstone area in China with the highest erosion intensity. Its high porosity and weak cementation cause it to disintegrate into mud when wetted and disperse as sand when exposed to wind, with an erosion modulus of 30,000–40,000 t/(km2·a). Although accounting for only 2% of the Yellow River Basin area, it contributes 1/4 of the coarse sediment deposition in the lower reaches. This area is a key challenge for soil erosion control in the basin, with extremely poor inherent ecosystem stability, urgently requiring GI as a systematic carrier to establish targeted protection systems. 2) Analysis of the limitations of traditional governance models shows that past research has mainly focused on micro-scale erosion processes and the soil and water conservation effects of individual vegetation types. Governance has primarily adopted fragmented approaches such as point, line, and surface-based measures, making it difficult to achieve overall ecosystem optimization. Such fragmented approaches fail to connect ecological patches fragmented by gully erosion and mining activities or restore soil and water conservation corridors interrupted by urban expansion, thus being ineffective in curbing landscape fragmentation and ecological degradation. The integrated “patch-corridor-network” structure of GI precisely addresses this deficiency. 3) From a practical perspective, this region faces dual pressures of ecological protection and economic development. Urbanization and energy extraction have led to frequent land use conversions, increasing ecological uncertainty. Through GI identification and analysis, priority ecological spaces and management focuses can be clarified, providing a scientific basis for territorial spatial planning and preventing the escalation of ecological and economic conflicts. In summary, conducting GI research in this area is not only an inevitable choice for addressing unique ecological challenges but also a key support for the ecological protection and high-quality development strategy of the Yellow River Basin.
4.2. Driving Mechanism and Ecological Significance of GI Spatiotemporal Evolution in the Pisha Sandstone Area
The spatiotemporal evolution of GI in the pisha sandstone area in the middle reaches of the Yellow River is the result of the combined effects of natural constraints and human activities, and its change process is directly related to the stability of regional ecological functions. From the perspective of driving mechanisms, the proportion of the total GI area increased from 84.66% to 89.21% between 2003 and 2013, with a simultaneous expansion of core areas. This trend is directly attributable to the “Grain for Green” policy implemented in 2002, which promoted the large-scale conversion of farmland to grassland and forest land, directly improving vegetation coverage and laying the foundation for the initial establishment of the GI network. From 2013 to 2023, the GI area decreased to 87.70%, with grassland becoming the primary outflow land use type. This trend is closely linked to urban expansion and energy development, as human activities encroach on ecological space, leading to the fragmentation of GI patches. Furthermore, natural terrain imposes rigid constraints: the gently sloping low hills in the northwest with slight erosion form the core concentration area of GI, while the steep high hills in the southeast with severe erosion have fragmented GI patches, resulting in a pattern of “concentration in the northwest and sparseness in the southeast”.Ecologically, these structural changes in GI directly affect soil and water conservation and ecological connectivity. From 2003 to 2023, the expansion of core areas enhanced resistance to soil erosion, potentially reducing the amount of coarse sediment entering the Yellow River. However, landscape fragmentation intensified, with ecological source sites decreasing from 20 to 14 and important corridors shrinking from 38 to 16. The connectivity of the GI network declined, weakening the capabilities of species migration and material cycling and increasing the risk of soil erosion during extreme precipitation events. Meanwhile, the spatial differentiation of GI indicates that the southeastern region with severe erosion coincides with GI vulnerable zones, which require prioritized ecological patch supplementation and corridor restoration, providing a scientific basis for determining restoration priorities. The findings of this study are largely consistent with existing research conclusions. For example, Liu et al. [93] found that the ecological environment quality in the pisha sandstone area has generally improved over the past two decades but is highly sensitive to human activities. Yao et al. [94] observed that although the ecological environment quality in the pisha sandstone area was generally poor between 2000 and 2010, it showed significant improvement by 2010. These findings all indicate that the ecological environment in the pisha sandstone area faces severe challenges.
4.3. Limitations and Future Research Directions
Compared with traditional GI identification and analysis methods, the combination of MSPA and the MCR model enables more efficient and accurate core area selection, source site extraction, and corridor screening. Incorporating a resistance model to evaluate corridor importance enhances the scientific rigor and rationality of ecological network construction. The edge width setting in MSPA analysis affects the total area of core zones. Multiple tests were conducted by adjusting the edge width threshold, with the raster pixel size set to 30 m × 30 m (edge width value of 3), ensuring sufficient resolution while adequately representing landscape types.The identification of ecological source areas based on MSPA and landscape connectivity methods shows that the distance threshold setting in Conefor 2.6 software affects the IIC and PC values. In this study, the threshold was set to 20,000 with a connectivity probability of 0.5. By comparing the effects of different IIC and PC values on the total area and number of ecological source patches, use equal weights method, and values greater than 1 were ultimately selected as the screening threshold for ecological sources, enabling landscape connectivity analysis and ecological function evaluation.Although this study determined distance thresholds, connectivity probabilities, and ecological source screening thresholds through comprehensive comparative analysis, the pisha sandstone area exhibits diverse topography and severe soil erosion. Therefore, future research should integrate the spatial variation characteristics of topographic differentiation and soil erosion in the pisha sandstone area to develop more precise threshold determination methods. Regarding the construction of ecological resistance surfaces, there is no unified standard in domestic and international ecological network research. Most current studies assign baseline resistance values to landscapes based on expert scoring methods. This research selected resistance factors including land use, elevation, slope, distance to roads, and vegetation coverage, with the selection of resistance factors and weight settings relying on previous studies, which may introduce a certain degree of subjectivity. Future research should adopt more scientific and standardized quantitative methods.For the construction of ecological corridors, this study used the MCR model to extract ecological corridors and the Gravity model to identify important ecological corridors. Previous research on the Gravity model has shown that threshold selection tends to be somewhat subjective. While the theoretically derived data are scientific and objective, practical construction processes must consider various factors, including human-induced elements. Further research is needed to determine how to establish distance thresholds that effectively integrate real-world conditions. Future research may propose optimized GI schemes tailored to specific sub-regions based on the topographic variations and soil erosion patterns in the pisha sandstone area of the middle reaches of the Yellow River.
5. Conclusions
Based on land use data from 2003, 2013, and 2023, this study integrated MSPA, landscape index method, and MCR model to identify and analyze GI in the pisha sandstone area in the middle reaches of the Yellow River in three periods. The main conclusions are as follows:
- (1)
- From 2003 to 2023, grassland remained the dominant land use type in the study area, accounting for 82.70% to 84.57% of the total land area. Impervious surface increased by 270.48 km2, while farmland and bare land decreased by 433.35 km2 and 174.11 km2, respectively. Forest land and water bodies expanded by 22 km2 and 2.65 km2, respectively. Before 2013, farmland was the primary outflow land use type, with bare land decreasing and forest land, water bodies, impervious surface, and grassland increasing,driven by the “Grain for Green” policy. After 2013, grassland became the primary outflow land use type, with water bodies decreasing and farmland, forest land, impervious surface, and bare land increasing,characterized by significant impervious surface expansion influenced by urbanization and economic development.
- (2)
- From 2003 to 2023, the total area of GI in the study area showed a trend of initial increase followed by decrease, maintaining a proportion between 84.66% and 87.70%. Spatially, it exhibited a pattern of concentration in the northwest and sparseness in the southeast. As the primary component of GI, core areas showed an annual increase in area, accounting for 47.07% to 54.42% of the total GI area, with a spatial distribution concentrated in the northwest of the study area. Other GI types, such as bridges, edges, and loops, accounted for smaller proportions and were scattered between core areas. Despite certain achievements in ecological restoration, the GI landscape has become increasingly fragmented and heterogeneous due to inherent low erosion resistance, development activities, and energy extraction.
- (3)
- From 2003 to 2023, the study area exhibited a spatial distribution pattern of higher resistance values in the northwest and lower values in the southeast, with high-resistance areas continuously expanding. The number of ecological source sites decreased from 20 to 14, the number of general ecological corridors reduced from 152 to 75, and the number of important ecological corridors declined from 38 to 16. This reduction in the number of corridors is directly related to soil erosion fragmentation and source area fragmentation.
- (4)
- From 2003 to 2023, the network closure index (α index) decreased from 0.54 to 0.13, the line-point ratio (β index) dropped from 1.90 to 1.14, and the network connectivity index (γ index) fell from 0.70 to 0.44. This indicates that the overall spatial structure of the regional GI network is relatively underdeveloped, presenting a fragmented pattern characterized by local concentration and overall sparseness. Changes in the number and area of GI source areas are the primary drivers of network pattern evolution.
Author Contributions
Conceptualization, Z.C.; Methodology, Z.C.; Software, C.Z.; Data curation, C.Z.; Writing—original draft, C.Z.; Writing—review & editing, Z.C.; Supervision, Z.C.; Funding acquisition, Z.C. All authors have read and agreed to the published version of the manuscript.
Funding
This work was funded by the Natural Science Foundation of Inner Mongolia Autonomous Region (No. 2023LHMS05025) 、 The Construction system and key technologies for grassland living environment (No. YLXKZX-NGD-004) and National Natural Science Foundation of China (No. 52568012).
Data Availability Statement
Data are available on request.
Conflicts of Interest
The authors declare no conflicts of interest.
References
- Yi, W.; Hua, Y. Research and application of mechanical properties of red arsenic sandstone cement mixed soil. Building Science 2024, 40, 189.
- Zhao, J.; Yang, Z.; Guo, J.; Lü, Z.; Duan, P.; Zhou, X. Research Progress on Soil Erosion Patterns and the Applicability of Erosion Models in the Pisha Sandstone Area. Inner Mongolia Forestry Survey and Design 2025, 48, 92–97.
- Sheng, Y.; Qin, F.; Liu, L.; An, L.; Li, J. Evolution and Driving Mechanisms of Soil Conservation Function in Pisha Sandstone Area of the Yellow River Basin Based on the InVEST Mode. Journal of Northwest Forestry University 2024, 39, 144–152.
- Liang, Z.; Wu, Z.; Yao, W.; Noori, M.; Yang, C.; Xiao, P.; Leng, Y.; Deng, L. Pisha sandstone: Causes, processes and erosion options for its control and Prospects. International Soil and Water Conservation Research 2019, 7, 1–8. [CrossRef]
- Chen, D.; Wang, Y.; Zhang, X.; Qi, Z.; Zhang, G.; Yan, X. Influence of bedding structure on shear characteristics of pisha sandstone. Journal of Soil and Water Conservation 2025, 40, 1–11.
- Fu, J.; Wang, J.; Zhang, B.; Wu, J.; Yang, Y.; Xiao, P.; Yao, W. Research on the contribution of compound erosion dynamics of arsenic sandstone slope in different seasons. Transactions of the CSAE 2020, 36, 66–73.
- Luo, Q.; Yang, Z.; Lü, Z.; Duan, P.; Zhou, X.; Liu, Q. Research Progress on Spatial Distribution and Optimal Allocation of Forest-Grass Vegetation in Pisha Sandstone Areas. Inner Mongolia Forestry Investigation and Design 2025, 48, 87–91.
- Liu, H.; Shi, P.; Wang, Y. The impact of open-pit mining on soil erosion in the mining area of ordos plateau in China. Journal of Soil and Water Conservation 2025, 39.
- Li, H.; Zhang, M.; Feng, L.; Zheng, S.; Du, Z. Research Status and Prospect of Soil and Water Loss Mechanism and Prevention Measures in Pisha Sandstone Area. Northwest Geology 2023, 56, 109-120.
- Li, C.; Fu, Y.; Di, L.; Jin, Y.; Qu, F.; Jia, D.; Tian, X. Progress in the physicochemical properties and harness and utilization of Pisha sandstone in the middle reaches of the Yellow River. Journal of North China University of Water Resources and Electric Power (Natural Science Edition) 2023, 44, 41-50.
- Zhang, P.; Li, L.; Li, Y.; Zhang, S.; Zhu, Z.; Song, X.; Wang, L. Effect of Vegetation Patch Pattern on Soil Erosion Intensity on Pisha Sandstone Slope. Journal of Soil and Water Conservation 2022, 36, 58-65.
- Gao, L.; Gao, F.; Zhang, H.; Zhang, B.; Feng, J.; Li, W.; Ren, H. Research on the construction of a natural ecological restoration system based on zoning erosion control in the Ten Tributaries. Journal of Basic Science and Engineering 2025, 1-15.
- Duan, J. Discussion on Vegetation Construction Model in Pisha Sandstone Area of Middle Yellow River. Heilongjiang Hydraulic Science and Technology 2025, 53, 43-45+57.
- Fan, D.; Yang, Z.; Qin, F.; Zhang, T.; Wang, X. Influence of Afforestation Density on Plant Diversity and Soil Physicochemical Properties of Pinus tabulaeformis in Pisha Sandstone Area. Bulletin of Soil and Water Conservation 2024, 44, 68-76.
- Shi, X.; Qin, M. Research on the Optimization of Regional Green Infrastructure Network. Sustainability 2018, 10, 4649. [CrossRef]
- Liu, W.; Xu, H.; Zhang, X.; Jiang, W. Green Infrastructure Network Identification at a Regional Scale: The Case of Nanjing Metropolitan Area, China. Forests 2022, 13, 735. [CrossRef]
- Yang, Z.; Guo, J.; Qin, F.; Li, Y.; Wang, X.; Li, L.; Liu, X. Spatiotemporal Variability of Soil Erosion in the Pisha Sandstone Region: Influences of Precipitation and Vegetation. Sustainability 2024, 16, 9313. [CrossRef]
- Zhu, Z.; Li, L.; Zhang, S.; Zhang, P.; Ren, Y.; Zhang, Y. Dynamic simulation study of soil erosion intensity on slopes with different vegetation patterns in pisha sandstone area. Ecological Modelling 2024, 491, 110665. [CrossRef]
- Matsler, M.; Grabowski, Z.; Elder, A. The Multifaceted Geographies of Green Infrastructure Policy and Planning: Socio-Environmental Dreams, Nightmares, and Amnesia. Journal of Environmental Policy & Planning 2021, 23, 559–564. [CrossRef]
- Ma, Y.; Zheng, M.; Zheng, X.; Guo, W.; Liu, M.; Li, J.; Zhu, B. Prediction and Spatiotemporal Evolution Analysis of Green Infrastructure Based on CA-Markov and MSPA: A Case Study of Beijing-Tianjin-Hebei Urban Agglomeration. Acta Ecologica Sinica 2023, 43, 6785–6797. [CrossRef]
- Zhang, L. Towards Integrated and Symbiotic Green Infrastructure Development. Landscape Architecture Academic Journal 2025, 42, 2–3.
- Huang, Y.; Feng, P.; Ma, Z.; Xiao, L. The Rise, Development and Thinking of China’s Green Infrastructure System Construction. Chinese Garden 2023, 39, 40–46.
- Zhang, J. Study on Green Infrastructure Functional Assessment and Its Network Planning in Zhengzhou City. Henan University 2023.
- Yang, B. Research on the Bottleneck and Strategy of Building Regional Ecological Network System in the Yangtze River Delta Integrated Demonstration Area. In Proceedings of the 2019 Annual Meeting of the Chinese Society of Landscape Architecture (Volume I) Shanghai Academy of Landscape Architecture and Planning. 2019,775-780.
- Wang, J.; Wang, W.; Zhang, S.; Wang, Y.; Sun, Z.; Wu, B. Spatial and Temporal Changes and Development Predictions of Urban Green Spaces in Jinan City, Shandong, China. Ecological Indicators 2023, 152, 110373. [CrossRef]
- Lyu, L.; Sho, K.; Zhao, H.; Song, Y.; Uchiyama, Y.; Kim, J.; Sakai, T. Construction, Assessment, and Protection of Green Infrastructure Networks from a Dynamic Perspective: A Case Study of Dalian City, Liaoning Province, China. Urban Forestry & Urban Greening 2024, 101, 128545. [CrossRef]
- Zhang, X.; Wang, X.; Zhang, C.; Zhai, J. Development of a Cross-Scale Landscape Infrastructure Network Guided by the New Jiangnan Watertown Urbanism: A Case Study of the Ecological Green Integration Demonstration Zone in the Yangtze River Delta, China. Ecological Indicators 2022, 143, 109317. [CrossRef]
- Zhao, Y.; Liu, S.; Liu, H.; Wang, F.; Dong, Y.; Wu, G.; Li, Y.; Wang, W.; Tran, L.; Li, W. Multi-objective Ecological Restoration Priority in China: Cost-Benefit Optimization in Different Ecological Performance Regimes Based on Planetary Boundaries. Journal of Environmental Management 2024, 356, 120701. [CrossRef]
- Jato-Espino, D.; Capra-Ribeiro, F.; Moscardó, V.; Bartolomé del Pino, L.; Mayor-Vitoria, F.; Gallardo, L.; Carracedo, P.; Dietrich, K. A Systematic Review on the Ecosystem Services Provided by Green Infrastructure. Urban Forestry & Urban Greening 2023, 86, 127998. [CrossRef]
- Cao, X.; Liu, Z.; Li, S.; Gao, Z.; Sun, B.; Li, Y. Identification of Key Areas of Ecological Protection and Restoration Based on the Pattern of Ecological Security: A Case of Songyuan City, Jilin Province. China Environmental Science 2022, 42, 2779–2787.
- Li, H.; Wu, M.; Li, H.; Zhan, F.; Liu, Z. Evolution Characteristics and Optimization of Urban Ecological Network in Chaoyang District, Beijing. Landscape Architecture 2023, 30, 33–38. [CrossRef]
- Guo, Z.; Zhu, C.; Fan, X.; Li, M.; Xu, N.; Yuan, Y.; Guan, Y.; Lyu, C.; Bai, Z. Analysis of Ecological Network Evolution in an Ecological Restoration Area with the MSPA-MCR Model: A Case Study from Ningwu County, China. Ecological Indicators 2025, 170, 113067. [CrossRef]
- Li, B.; He, M.; Li, X. Research Progress on Ecological Network Construction Based on Source-Corridor Method. Chinese Urban For 2023, 21, 145–151.
- Wang, Y.; Liu, L. Telecoupling: Spatial Ecological Wisdom for Performance Evaluation of Green Infrastructure. Chinese Landscape Architecture 2023, 39, 51–55.
- Liu, S.; Wang, Q.; Miao, C.; Dong Y.; Sun, Y.; Yu, L. Ecological Security Patterns of Water Conservation in the Upper Reaches of the Yellow River Basin (Sichuan Section) with Ecological Network Approach. Journal of Beijing Normal University(Natural Science) 2024, 60, 418–426.
- Wang, K.; Li, Z.; Zhang, J.; Wu, X.; Jia, M.; Wu, L. Built-up Land Expansion and Its Impacts on Optimizing Green Infrastructure Networks in a Resource-Dependent City. Sustainable Cities and Society 2020, 55, 102026. [CrossRef]
- Staccione, A.; Candiago, S.; Mysiak, J. Mapping a Green Infrastructure Network: A Framework for Spatial Connectivity Applied in Northern Italy. Environmental Science & Policy 2022, 131, 57–67. [CrossRef]
- Sun, B.; Zhong, C.; Cui, D.; Han, Q.; Tang, J.; Chen, Y. Constructing Ecological Security Patterns through Regional Cooperation in the Yellow River Basin. Acta Ecologica Sinica 2024, 44, 4624–4636.
- Fu, W.; Huang, Y.; Zhou, H.; Ma, J.; Ma, R.; Li, J. Construction of GI Network in Gulf Village Area Based on MSPA and Circuit Theory: A Case Study of the Xieqian Harbor Area in Xiangshan. Journal of Ningbo University (Natural Science & Engineering Edition) 2024, 1-9.
- Gu, K.; Cui, Y.; Zhao, X. Research on Ecological Network Construction and Optimization Based on Spatial Classification System: Taking Chaohu Basin as an Example. Journal of Shenyang Jianzhu University (Social Science) 2024, 26, 384-392.
- Ana, M.; Cláudia, F.; João, F.; Paulo, F. A diagnostic framework for assessing land-use change impacts on landscape pattern and character – A case-study from the Douro region, Portugal. Landscape and Urban Planning 2022, 228, 104580.
- Jiening, W.; Wenchao, W.; Shasha, Z.; Yuanyuan, W.; Zehong, S.; Binglu, W. Spatial and temporal changes and development predictions of urban green spaces in Jinan City, Shandong, China. Ecological Indicators 2023, 152, 110373. [CrossRef]
- Pengting, D.; Peng, D.; Ziyun, R. Spatio-temporal pattern evolution of green development efficiency in Northeastern China and its driving factors. Heliyon 2024, 10, e32119. [CrossRef]
- Chen, C.; Xu, W.; Zhang, Y.; Zhou, B.; Chai, M.; Liu, H.; Feng, Y. Scale Effect of the Spatial Pattern and Connectivity Analysis for the Green Infrastructure in Duliujian River Basin. Research of Environmental Sciences 2019, 32, 1464–1474.
- Dewa, D.; Buchori, I.; Sejati, A.; Liu, Y. Integrating Google Earth Engine and regional ecological corridor modeling for remote sensing-based urban heat island mitigation in Java, Indonesia. Remote Sensing Applications: Society and Environment 2025, 38, 101573. [CrossRef]
- Guan, H.; Bai, Y.; Tang, Y.; Zhang, C.; Zou, J. Spatial identification and optimization of ecological network in desert-oasis area of Yellow River Basin, China. Ecological Indicators 2023, 147, 109999. [CrossRef]
- Zhang, H.; Song, Q.; Wang, S.; Zhao, J.; Gao, W. Ecological network construction and land degradation risk identification in the Yellow River source area. iScience 2025, 112775. [CrossRef]
- Lu, Y.; Cheng, Q.; Wang, M. Construction and evaluation of the Panjin wetland ecological network based on the minimum cumulative resistance model. Ecological Modelling 2025, 505, 111118. [CrossRef]
- Tran, D.; Pearson, D.; Palmer, A.; Lowry, J.; Gray, D.; Dominati, E. Quantifying spatial non-stationarity in the relationship between landscape structure and the provision of ecosystem services: An example in the New Zealand hill country. Science of The Total Environment 2022, 808, 152126. [CrossRef]
- Mitchell, M.; Devisscher, T. Strong relationships between urbanization, landscape structure, and ecosystem service multifunctionality in urban forest fragments. Landscape and Urban Planning 2022, 228, 104548. [CrossRef]
- Gao, Y.; Fu, D.; Huang, H.; Jiang, J.; Liu, Q.;Zhu, L.;Ding, G. Spatio-Temporal evolution and scenario-based optimization of urban ecosystem services supply and Demand: A block-scale study in Xiamen, China. Ecological Indicators 2025, 172, 113289. [CrossRef]
- Ma, Z.; Gong, J.; Hu, C.; Lei, J. An integrated approach to assess spatial and temporal changes in the contribution of the ecosystem to sustainable development goals over 20 years in China. Science of the Total Environment.2023 ,903,166237. [CrossRef]
- Zhou, Q.; Ji, G.; Wang, F.; Ji, X. Analysis of spatiotemporal evolution characteristics of ecological networks based on complex network–spatial syntax. Journal of Xinyang Normal University (Natural Science Edition) 2025, 1-9. [CrossRef]
- Huang, J.; Deng, X.; Qi, Y.; Wang, P. Construction of Ecological Security Pattern in Henan Province Based on MSPA, Circuit Theory, and Space Syntax. Environmental Science 2025, 1-22. [CrossRef]
- Yang, Q.; Yang, M.; Fang, K. The Construction of Ecological Corridors in Wuqing District Based on Ecosystem Service Value and Ecological Sensitivity. Urban Architecture 2025, 22, 111–114.
- Liao, Y.; Xu, W.; Lin, X.; Shao, R. Ecological security pattern construction of Fuzhou based on source-resistance-corridor. Natural Science of Hainan University 2025, 43, 342–354. [CrossRef]
- Li, Z.; Zhang, G.; Xing, J.; Yang, L.; Wang, W.; Cao, J. Spatiotemporal evolution of the ecological security pattern in Longnan City based on the MSPA-InVEST model. Arid Zone Research 2025, 42, 1103–1113. [CrossRef]
- Liu, K.; Sun, H.; Zhang, P. Research on the Ecologic Spatial Pattern and Eco-Network Planning of Xi’an Metropolitan Area. Landscape Architecture Academic Journal 2025, 42, 23–32.
- Xinlei, X.; Siyuan, W.; Wenzhuo, R. Construction of ecological network in Suzhou based on the PLUS and MSPA models. Ecological Indicators 2023, 154, 110740. [CrossRef]
- Hu, T.; Wu, J. Shaping the general resilience of Green Infrastructure through integrating structures, functions, and connections. Journal of Environmental Management 2024, 369, 122294. [CrossRef]
- Zhong, J.; Li, X.; Liu, W.; Zhang, F.; Huang, F.; Xu, S.; Xiao, S.; Wang, Q. Effects of urbanization intensity on forest vegetation characteristics and landscape pattern indices in Nanchang. Chinese Journal of Ecology 2024, 43, 2285–2294.
- Jin, Z.; Yu, X.; Li, Z.; Tan, L.; Li, J. Scientific Investigation on the Entire Yellow River Basin: Understanding and Reflections. China Water Resources 2024, (23), 7-11+6.
- Wu, H.; Wei, L.; Liu, H.; Liu, S.; Di, W. Identification and Strategy of Key Areas of Land and Space Ecological Restoration Based on the Ecological Safety Pattern: Take Henan Province as an Example. Environmental Science 2024, 1-17.
- Wu, W.; Li, X.; Yang, P.; Xue, J.; Dou, X.; Xu, J.; Wu, G. Spatio-temporal Changes and Driving Forces of Land Use in Jinghe River Basin from 1992 to 2022. Journal of University of Jinan(Science and Technology) 2025, 1-10.
- Zou, C.; Li, W.; Li, B.; Chen, J. Construction and Optimization of Ecological Security Patterns in the Nyang River Basin based on Source-Corridor-Pinch Point . Science of Soil and Water Conservation. 2025,1-12.
- Huo, H.; Hou, Z.; Peng, K.; Wang, Q. Evaluation and optimization of ecological resilience of resource-based cities under the perspective of landscape pattern. Coal Engineering 2025, 57, 203–211.
- Zhang, X.; Liu, C.; Wang, Z. Identification, construction and optimization of Ma’anshan city urban green space ecological network. Journal of Anhui Agricultural University 2025,1-12.
- Guo, J.; Li, C.; Zhao, J.; Luo, C.; Mei, Z. Identification of Key Areas for Territorial Ecological Restoration Based on Ecological Security Patterns: A Case Study of the Huaihe River Basin. China Environmental Science, 2025,1-17.
- Chen, Y.; Chen, C.; Bi, Y. Research on Construction and Optimization of Green Infrastructure Network Based on MSPA: Taking the Central Urban Area of Lu’an City, Anhui Province as an Example. Landscape Architecture Academic Journal 2025, 42, 4–13+61.
- Gou, R.; Su, W. Construction of Ecological Security Pattern in Guizhou Province based on Multi Scenario Ecosystem Services Trade-offs. Environmental Science 2025, 1-19.
- Qi, C.; Yan, F.; Xi, L.; Cao, X.; Zou, J.; Feng, Y. A Study on the Potential for Vegetation Restoration in the Soft Rock Area of the Ordos Plateau. Arid Zone Research 2024, 41, 1583–1592. [CrossRef]
- Sheng, Y.; Liu, L.; Yuan, Y.; Wang, S.; Li, J.; An, L. Effects of Climate Change and Human Activities on Vegetation Coverage in Pisha Sandstone Area of Yellow River Basin. Bulletin of Soil and Water Conservation 2023, 43, 412–420. [CrossRef]
- Liu, Y.; Lin, J.; Zhang, D.; Han, Y.; Fu, H.; Liu, Q. Analysis of Pisha Sandstone Erosion Characteristics in the Fragile Geological Area of Ordos. China Soil and Water Conservation 2024, (10), 67-70.
- Da, L.; Yu, Q.; Cai, B. Concepts and Key Techniques for Construction of Ecological Corridors in Urban Area. Journal of Chinese Urban Forestry 2010, 8, 11–14.
- Han, M.; Zhang, S.; Xu, Q.; Dai, J.; Huang, G. Construction of Cross-basin Ecological Security Patterns Based on Carbon Sinks and Landscape Connectivity. Environmental Science 2024, 45, 5844–5852. [CrossRef]
- Zhou, Y.; Feng, Z.; Lin, Q.; Wang, J.; Zhang, K.; Wu, K. Research progress on the width of ecological corridors in ecological security pattern. Chinese Journal of Applied Ecology 2025, 36, 918–926. [CrossRef]
- Yan, Y. Research on the construction of ecological security pattern in Xiaochang County. Central China Normal University. 2023.
- Meng, Q. Study on Urban Ecological Corridor Based on Biodiversity Conservation. Beijing Forestry University. 2016.
- Tang, J.; Wang, G.; Xu, S. Spatiotemporal Changes and Protection Countermeasures of the Ecological Corridor of the Tarim River. Water Conservancy Planning and Design 2020, (08), 49-53.
- Liu, Y.; He, Z.; Chen, J.; Xie, C.; Xie, T.; Mu, C. Ecological network construction method based on MSPA and MCR model: taking Nanchong as example. Southwest Agricultural Journal 2021, 34, 354–363.
- Yan, M.; Liu, M.; Yao, X.; Guo, L.; Tang, Y.;Tian, G. Landscape connectivity based on the forest birds daily activities range in Jinshui district of Zhengzhou. Journal of Southwest Forestry University (Natural Sciences) 2020, 40, 107–117.
- Chen, G.; Wu, M.; Wang, Q.; Zheng, X.; Xue, M.; Liu, L.; Tang, Y. Construction of Ecological Security Pattern Based on MSPA and Circuit Theory: A Case Study of Fushan District, Yantai City. Journal of Ludong University(Natural Science Edition) 2025, 41, 145–155.
- Han, S.; Mei, Y.; Ye, Z.; Zhang, K.; Yin, X. Construction of Ecological Security Pattern in Yanping District of Nanping City, Fujian Province Based on Minimum Cumulative Resistance Model. Bulletin of Soil and Water Conservation 2019, 39, 192–198+205.
- Wu, H.; Wei, L.; Liu, H.; Liu, S.; Di, W. Identification and Strategy of Key Areas of Land and Space Ecological Restoration Based on the Ecological Safety Pattern: Take Henan Province as an Example. Environmental Science 2024, 1-17.
- Fu, W.; Huang, Y.; Zhou, H.; Ma, J.; Ma, R.; Li, J. Construction of GI Network in Gulf Village Area Based on MSPA and Circuit Theory: A Case Study of the Xieqian Harbor Area in Xiangshan. Journal of Ningbo University (Natural Science & Engineering Edition) 2024, 1-9.
- Gu, K.; Cui, Y.; Zhao, X. Research on Ecological Network Construction and Optimization Based on Spatial Classification System: Taking Chaohu Basin as an Example. Journal of Shenyang Jianzhu University (Social Science) 2024, 26, 384–392.
- Ana, M.; Cláudia, F.; João, F.; Paulo, F. A diagnostic framework for assessing land-use change impacts on landscape pattern and character – A case-study from the Douro region, Portugal. Landscape and Urban Planning 2022, 228, 104580. [CrossRef]
- Chen, J.; Zhao, C.; Zhao, Q.; Xu, C.; Lin, S.; Qiu, R.; Hu, X. Construction of ecological network in Fujian Province based on Morphological Spatial Pattern Analysis. Acta Ecologica Sinica 2023, 43, 603–614. [CrossRef]
- Han, S.; Mei, Y.; Ye, Z.; Zhang, K.; Yin, X. Construction of Ecological Security Pattern in Yanping District of Nanping City, Fujian Province Based on Minimum Cumulative Resistance Model. Bulletin of Soil and Water Conservation 2019, 39, 192–198+205.
- Zhu, J. Research on the Construction of Green Infrastructure Network in Xinning County Based on MSPA and InVEST Model. Master’s Thesis, Central South University of Forestry and Technology, Changsha, China, 2024.
- Tian, Y. The Study on Green Infrastructure Network in Chongqing Central based on MSPA and MCR model. Master’s Thesis, Southwest University, Chongqing, China, 2022.
- Yao, X.; Hu, Y.; Li, J.; Jiang,D. Construction of ecological security pattern based on ‘Pressure-state-response model’ in Linquan county of Anhui Province. Journal of Anhui Agricultural University 2020, 47, 538–546.
- Liu, L.; Sheng, Y.; Qin, F.; Li, L.; Li, Y. Evolution of Ecological Environmental Quality in Feldspathic Sandstone Area Based on RSEI Model. Bulletin of Soil and Water Conservation 2022, 42, 233–239+334.
- Yao, J.; Qin, F. Comprehensive Assessment on Eco-environmental Quality of the Sandstone Area Based on RS and GIS. Research of Soil and Water Conservation 2014, 21, 193–197+345.
Figure 1.
Technology Roadmap.
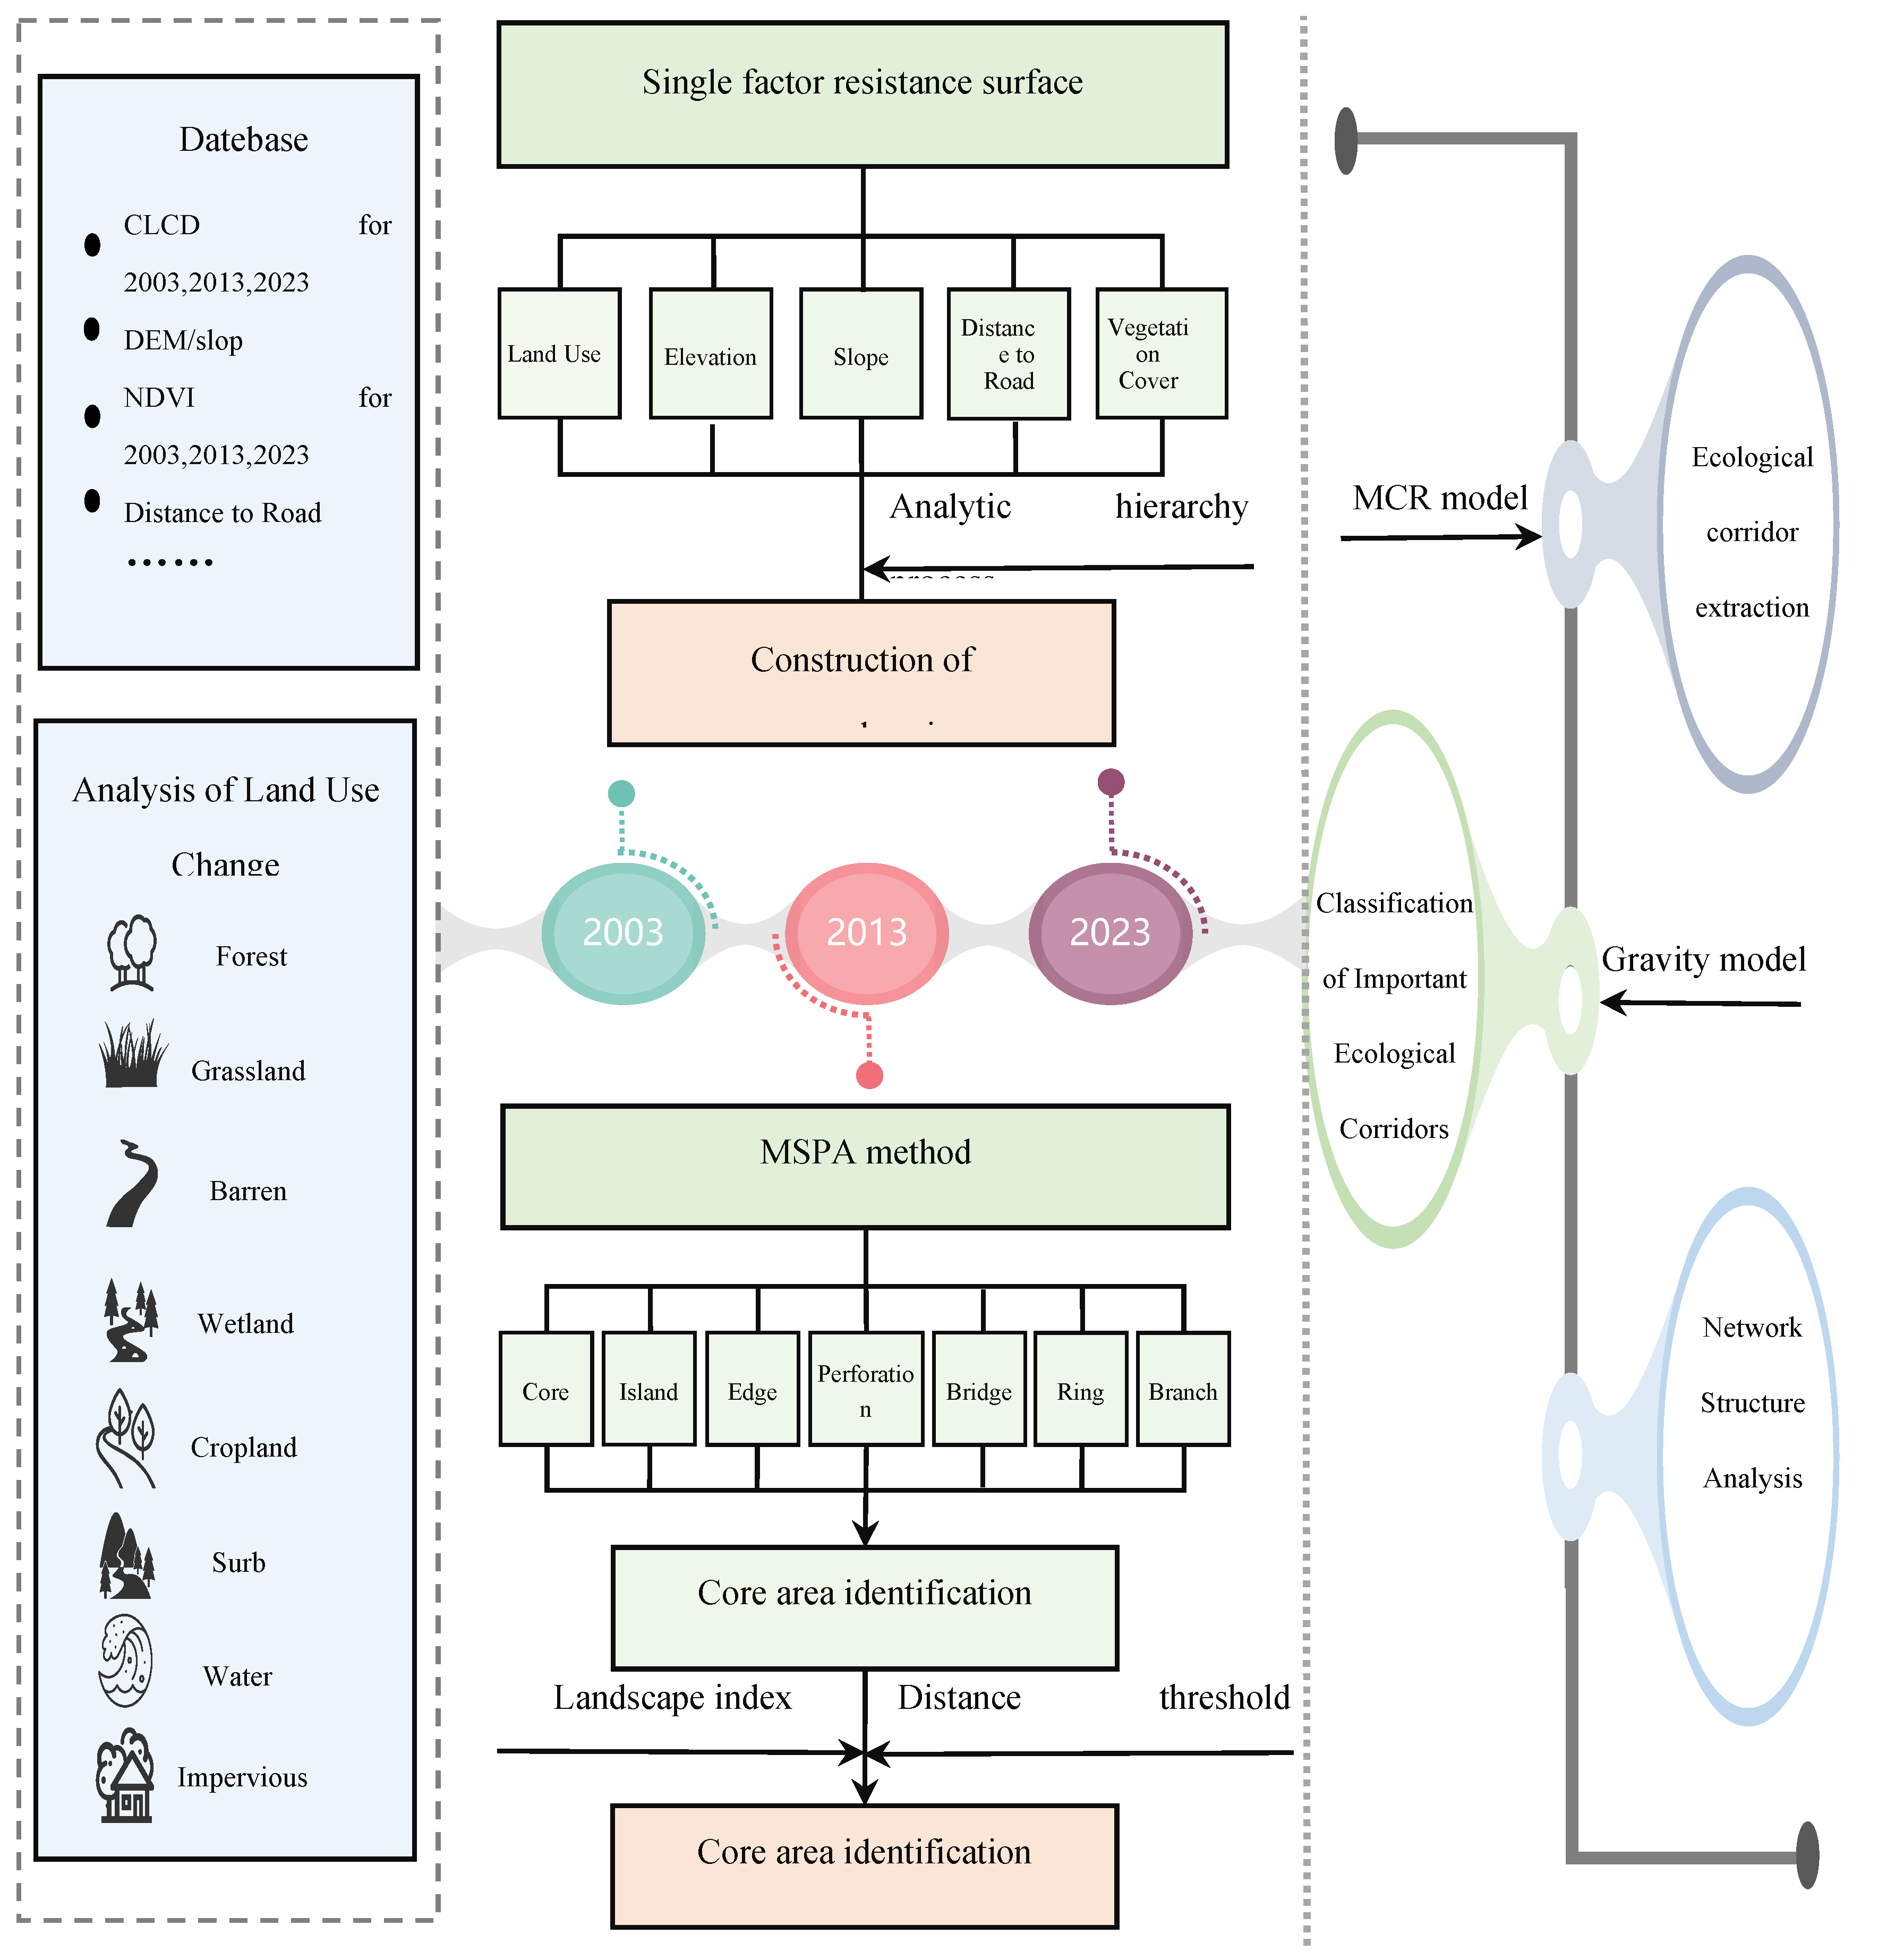
Figure 2.
Study area.
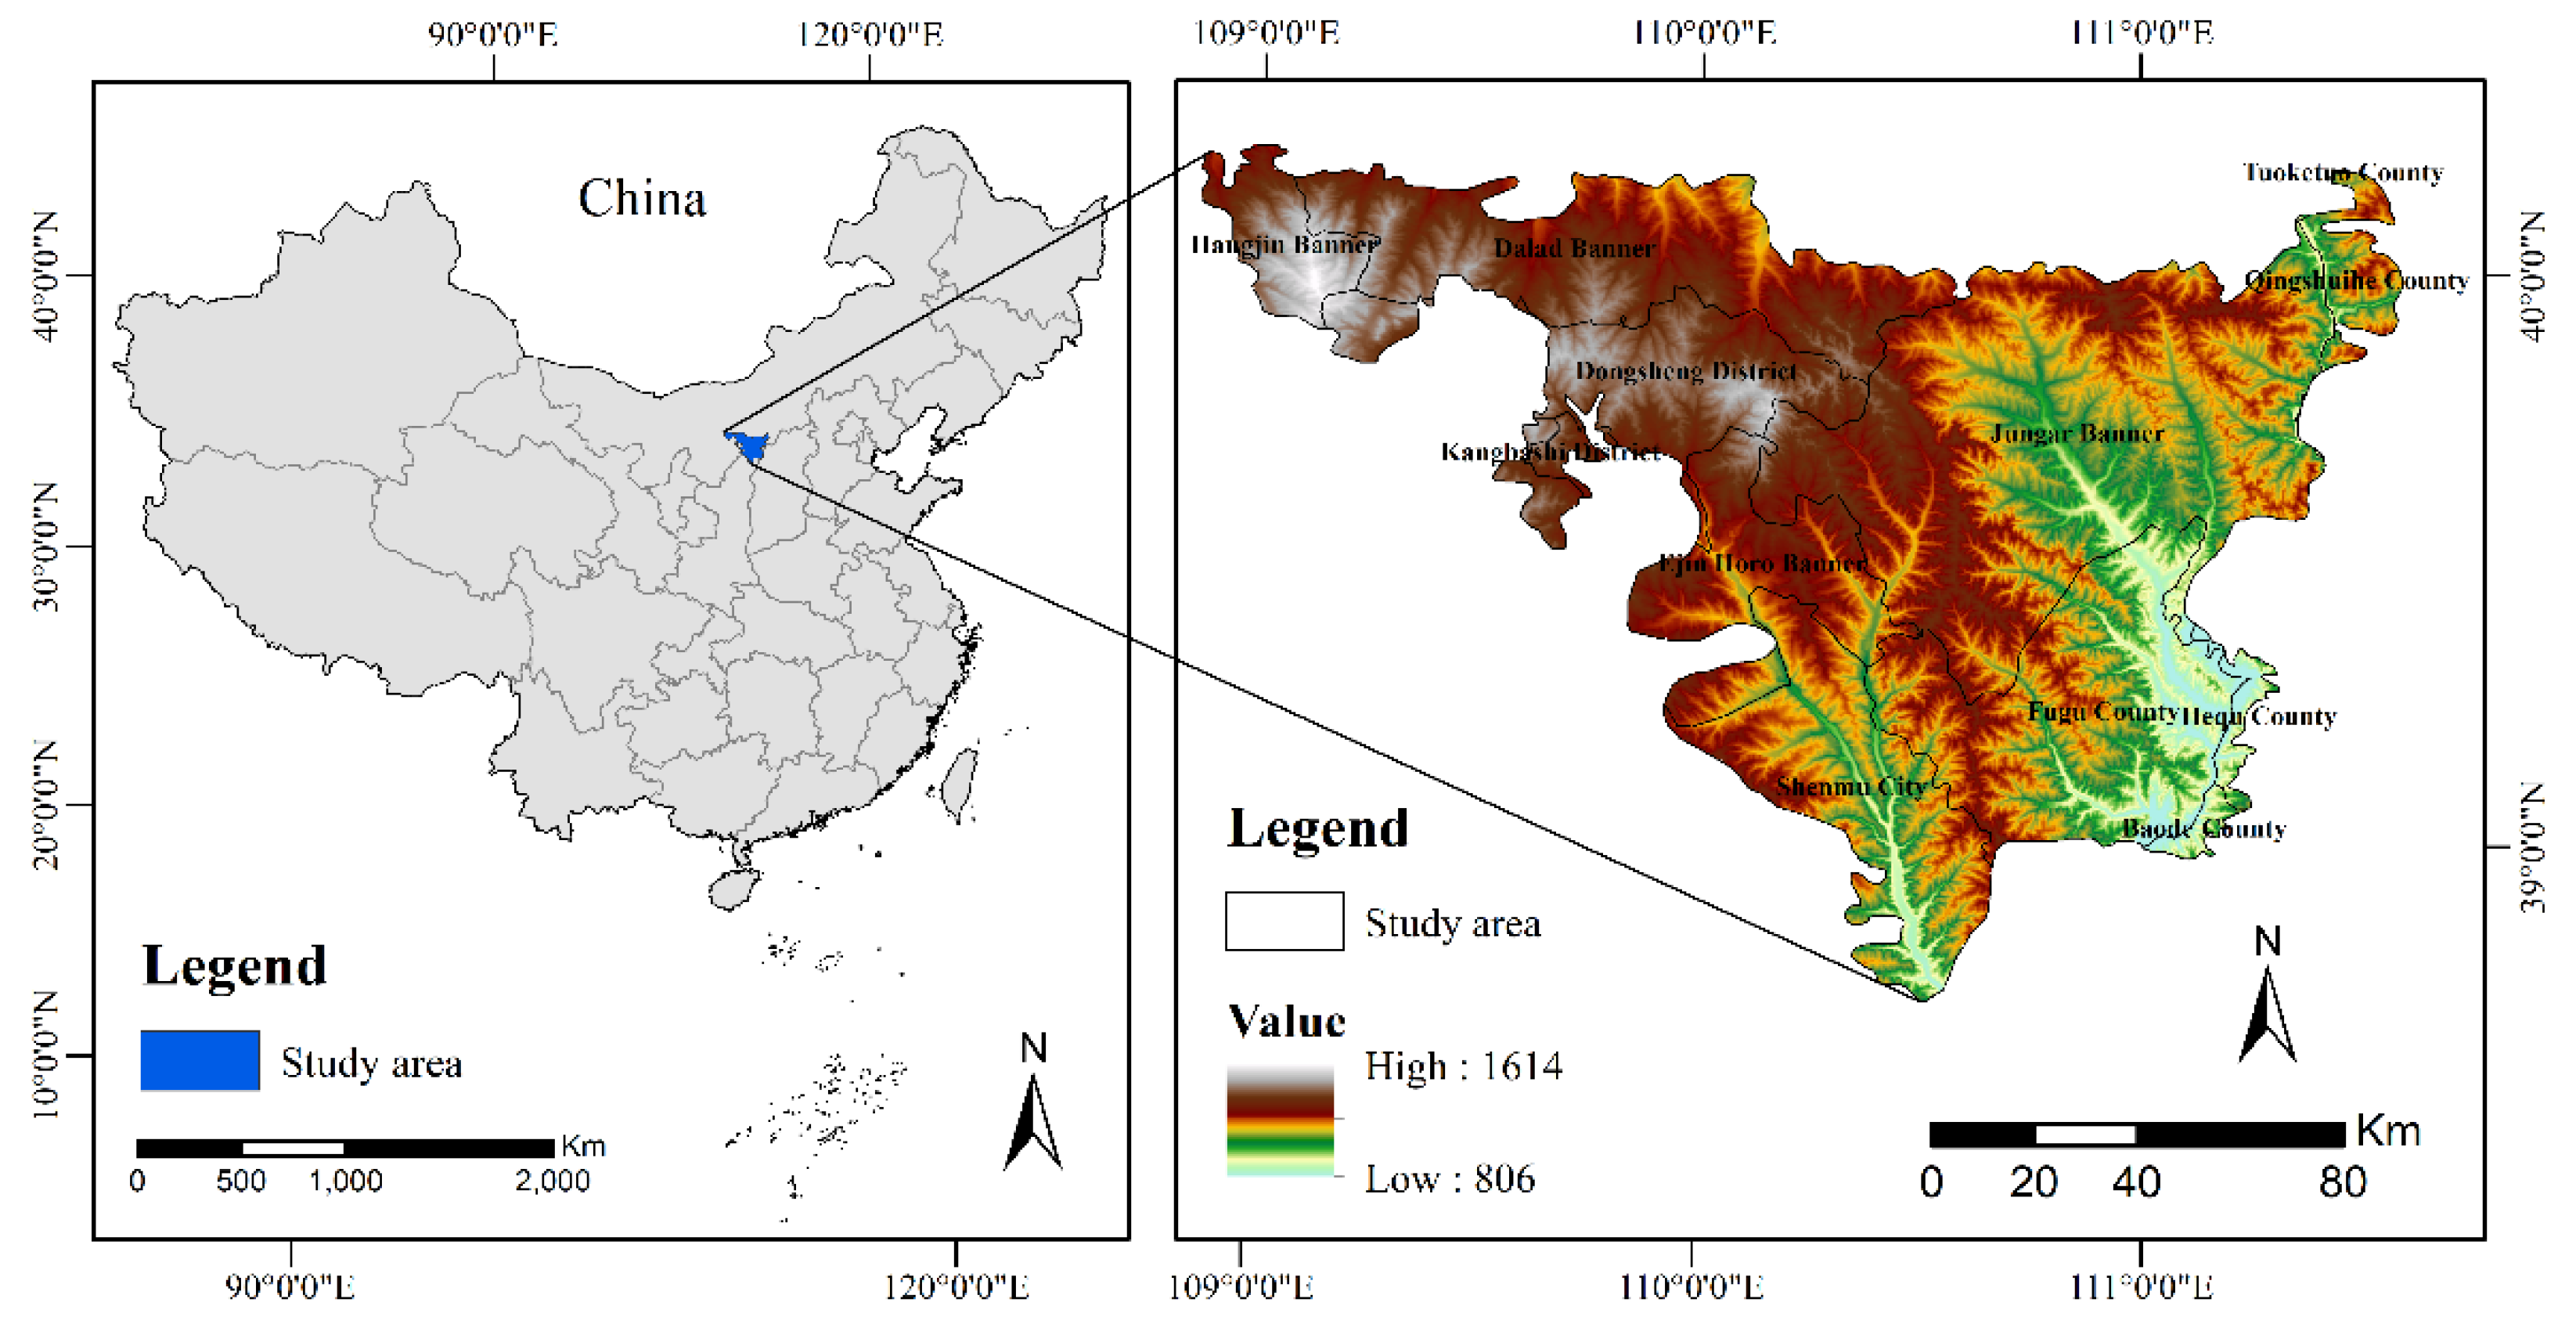
Figure 3.
Land use in the study area in 2003, 2013, and 2023.
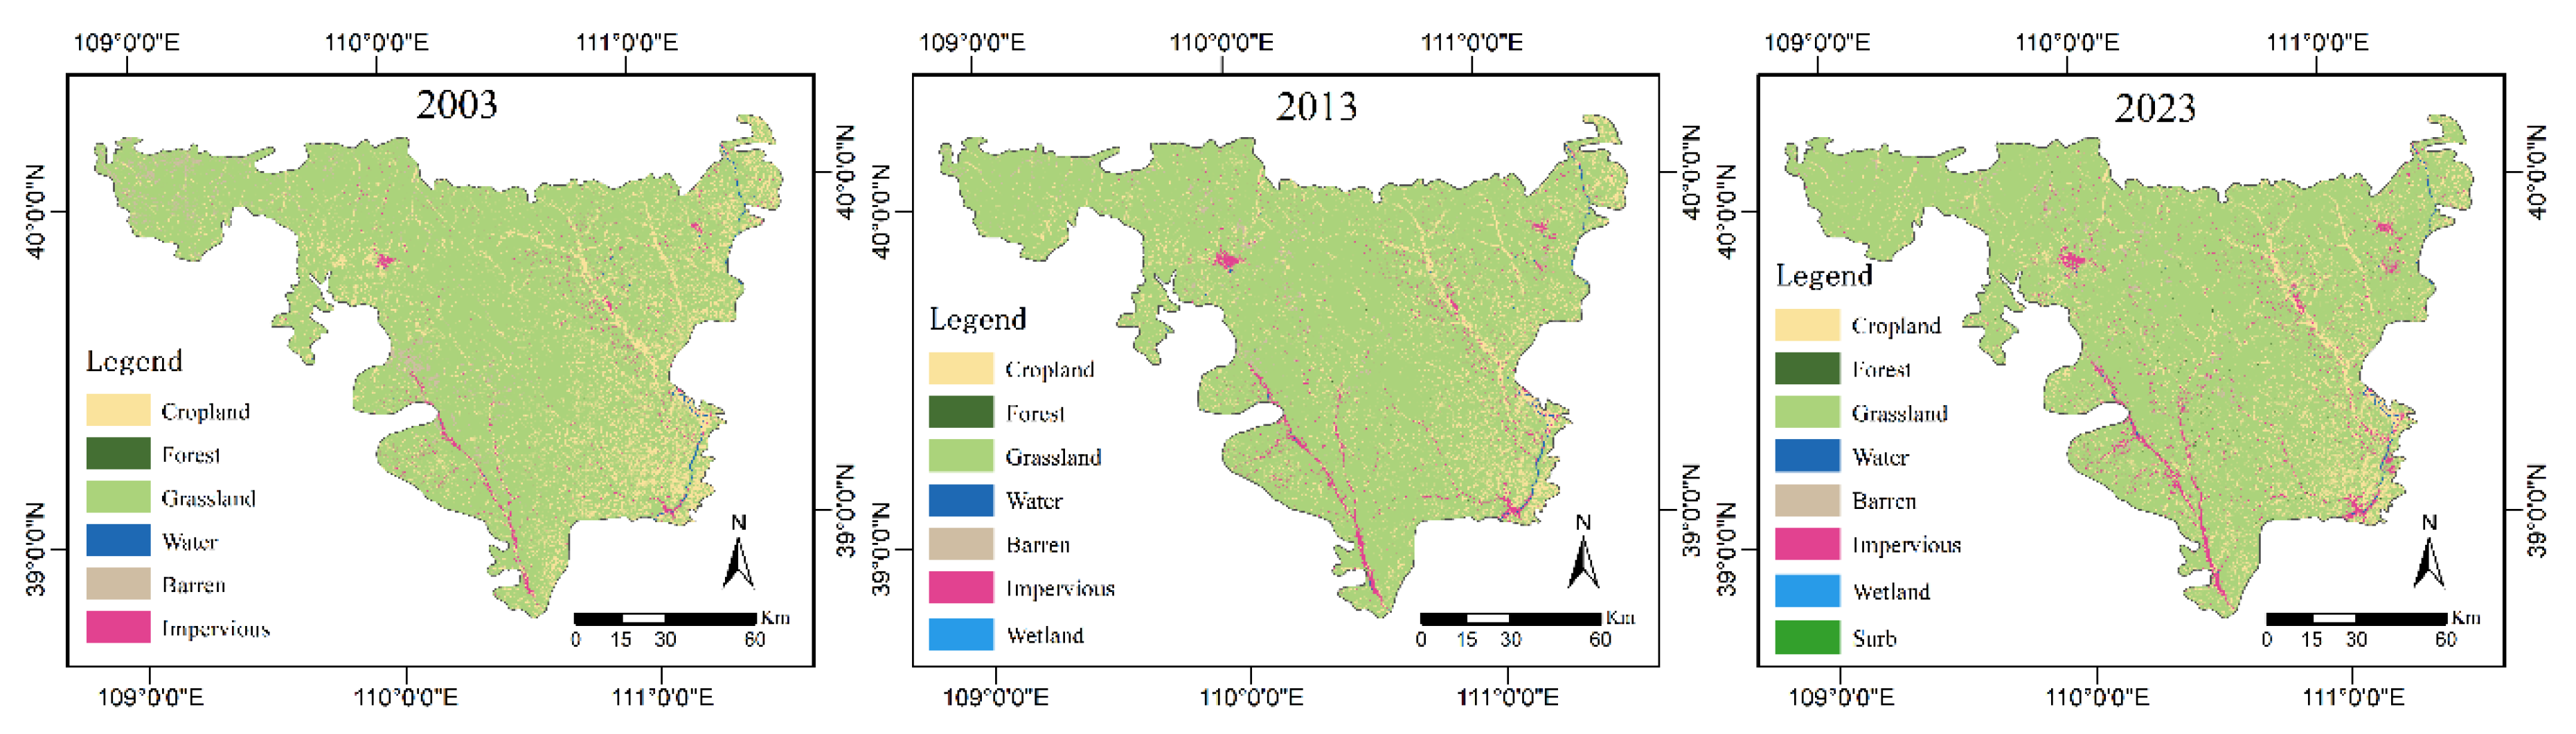
Figure 4.
String diagram of land use transfers in the pisha sandstone region in 2003, 2013, and 2023.
Figure 4.
String diagram of land use transfers in the pisha sandstone region in 2003, 2013, and 2023.
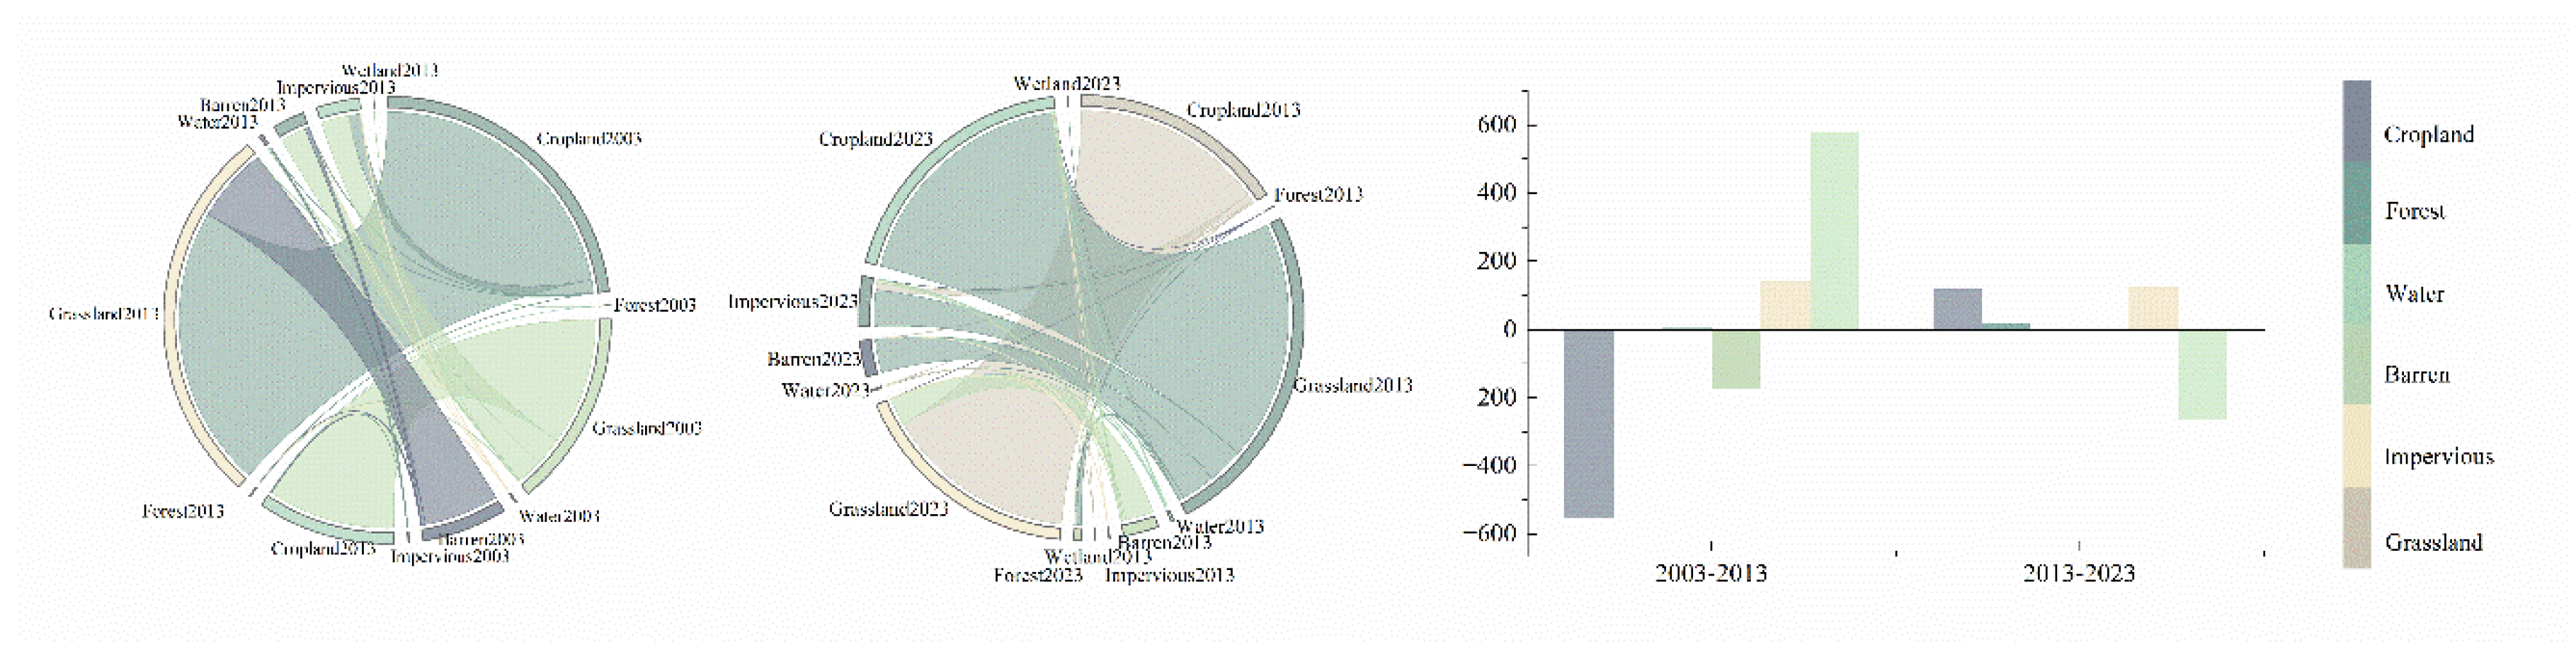
Figure 5.
Area and Proportion of Landscape Types, 2003–2023.
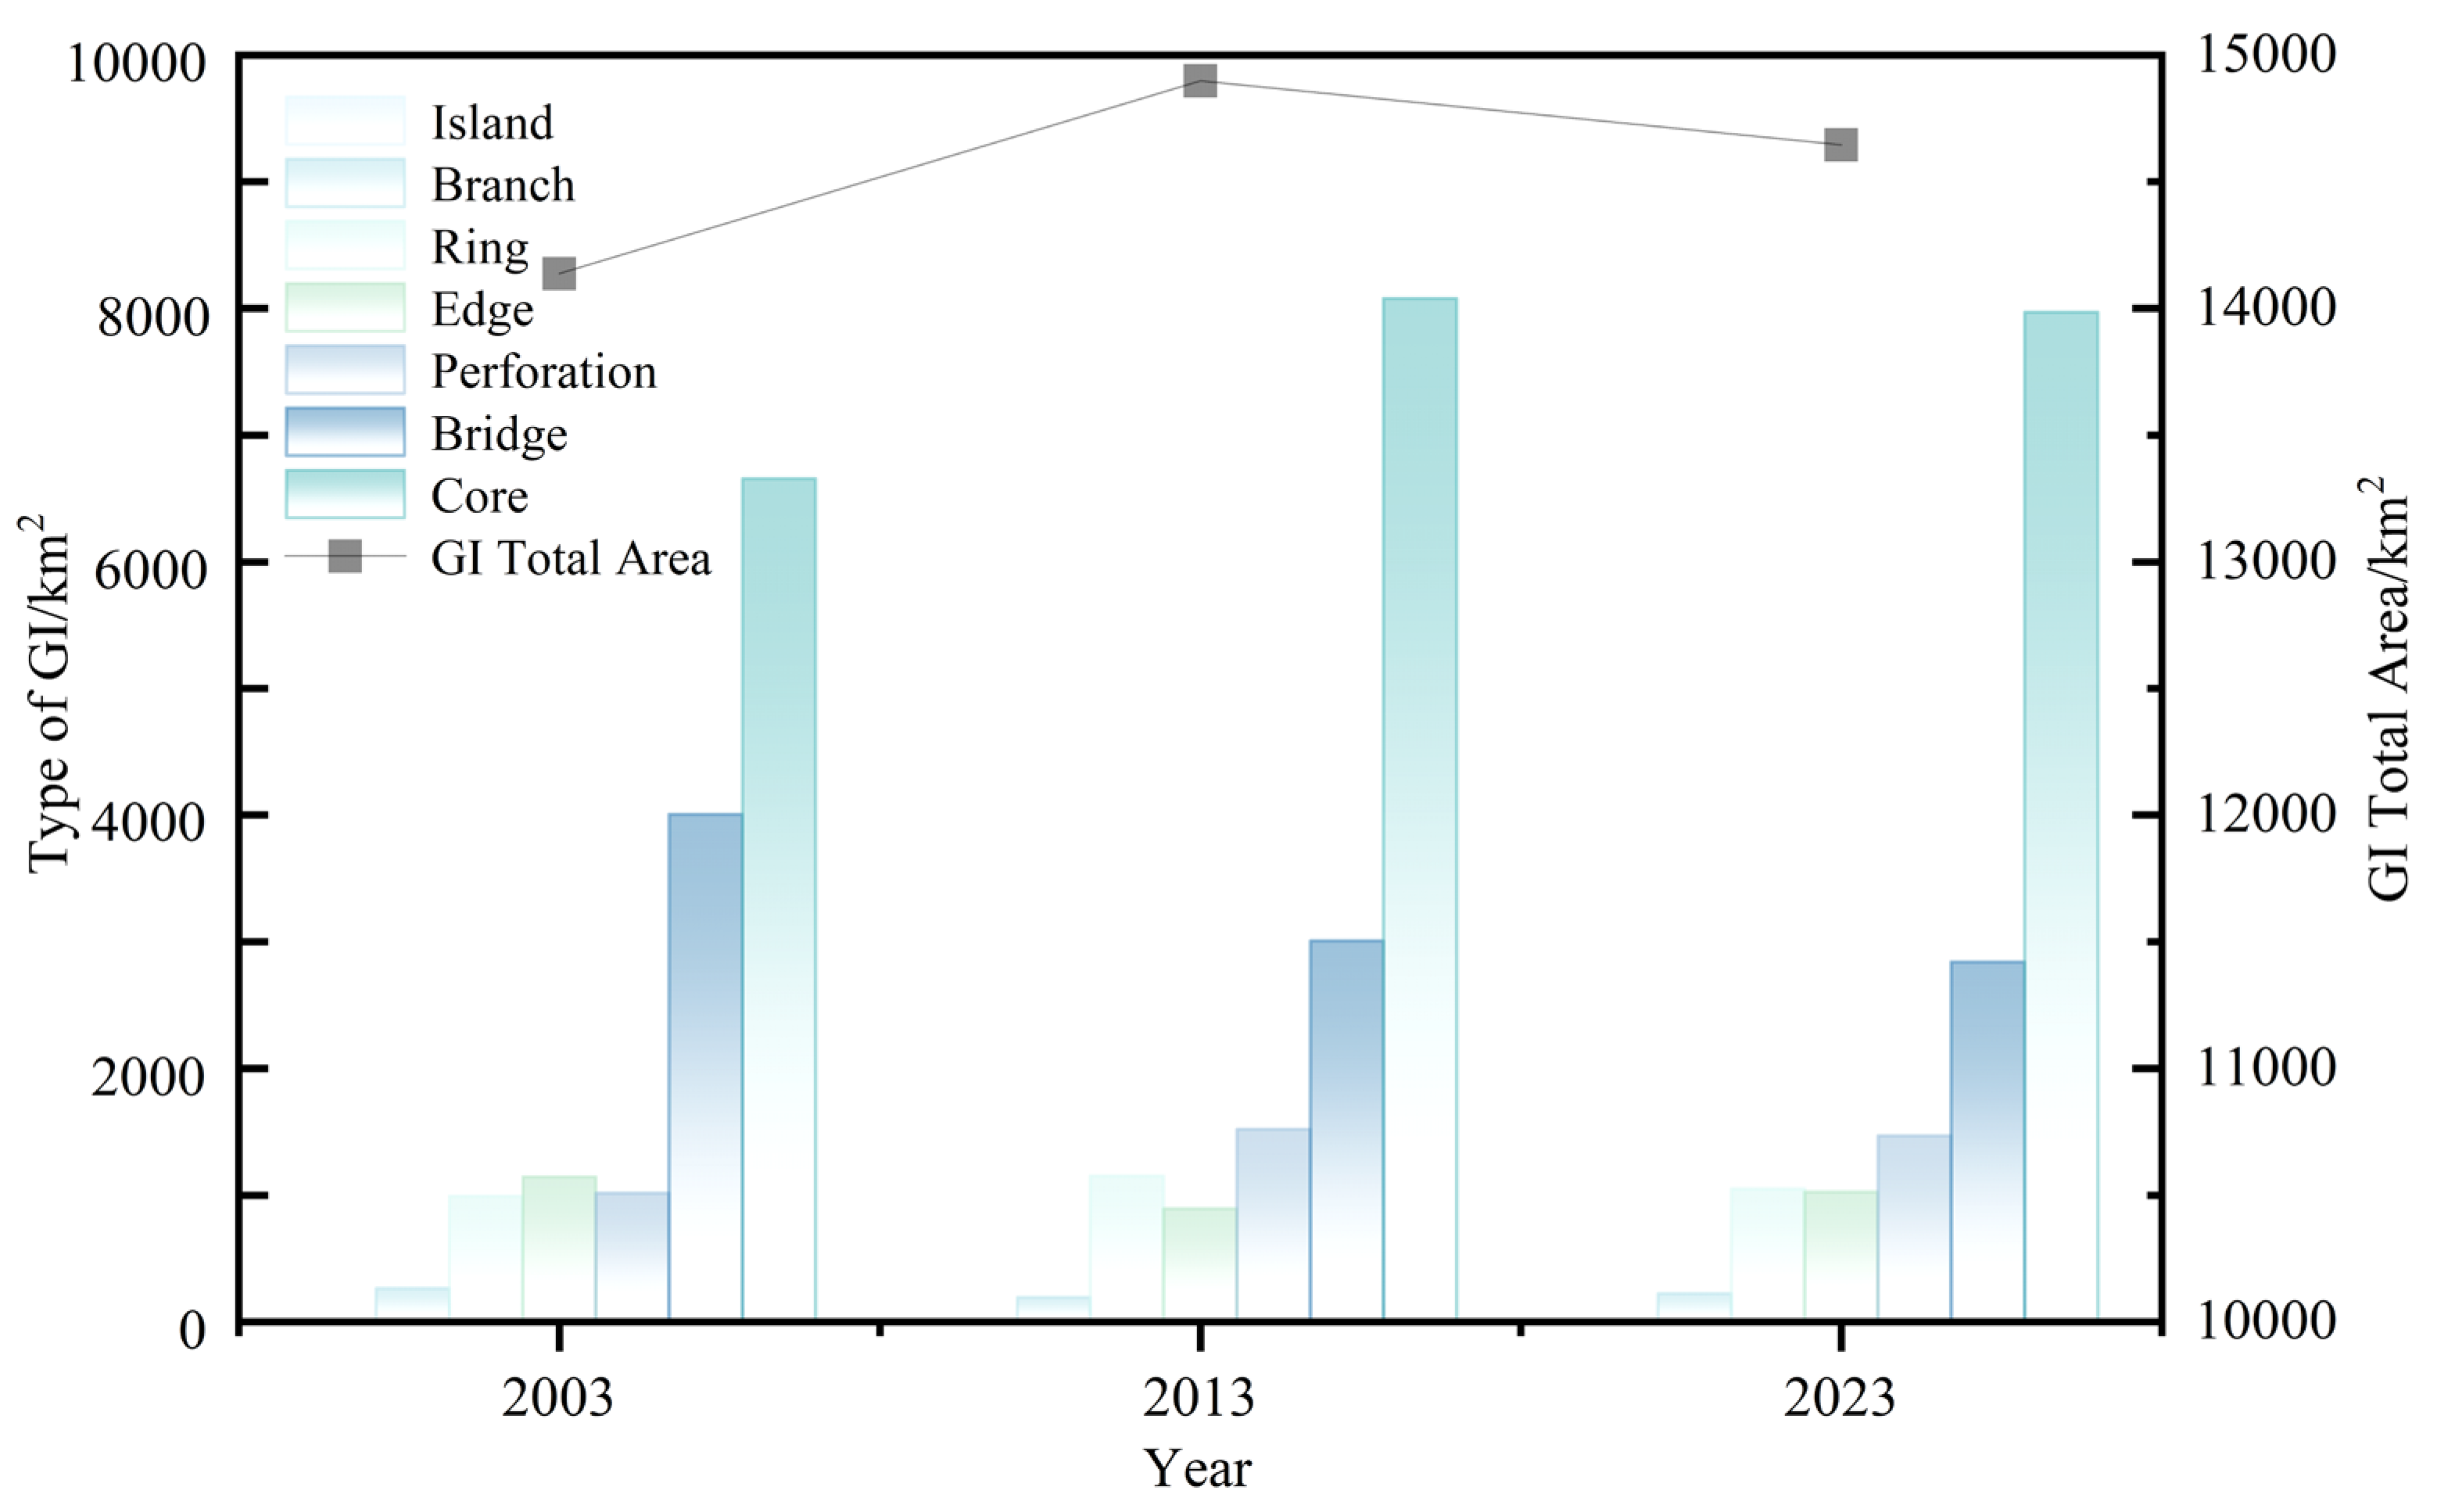
Figure 6.
MSPA landscape types in the study area in 2003, 2013, and 2023.
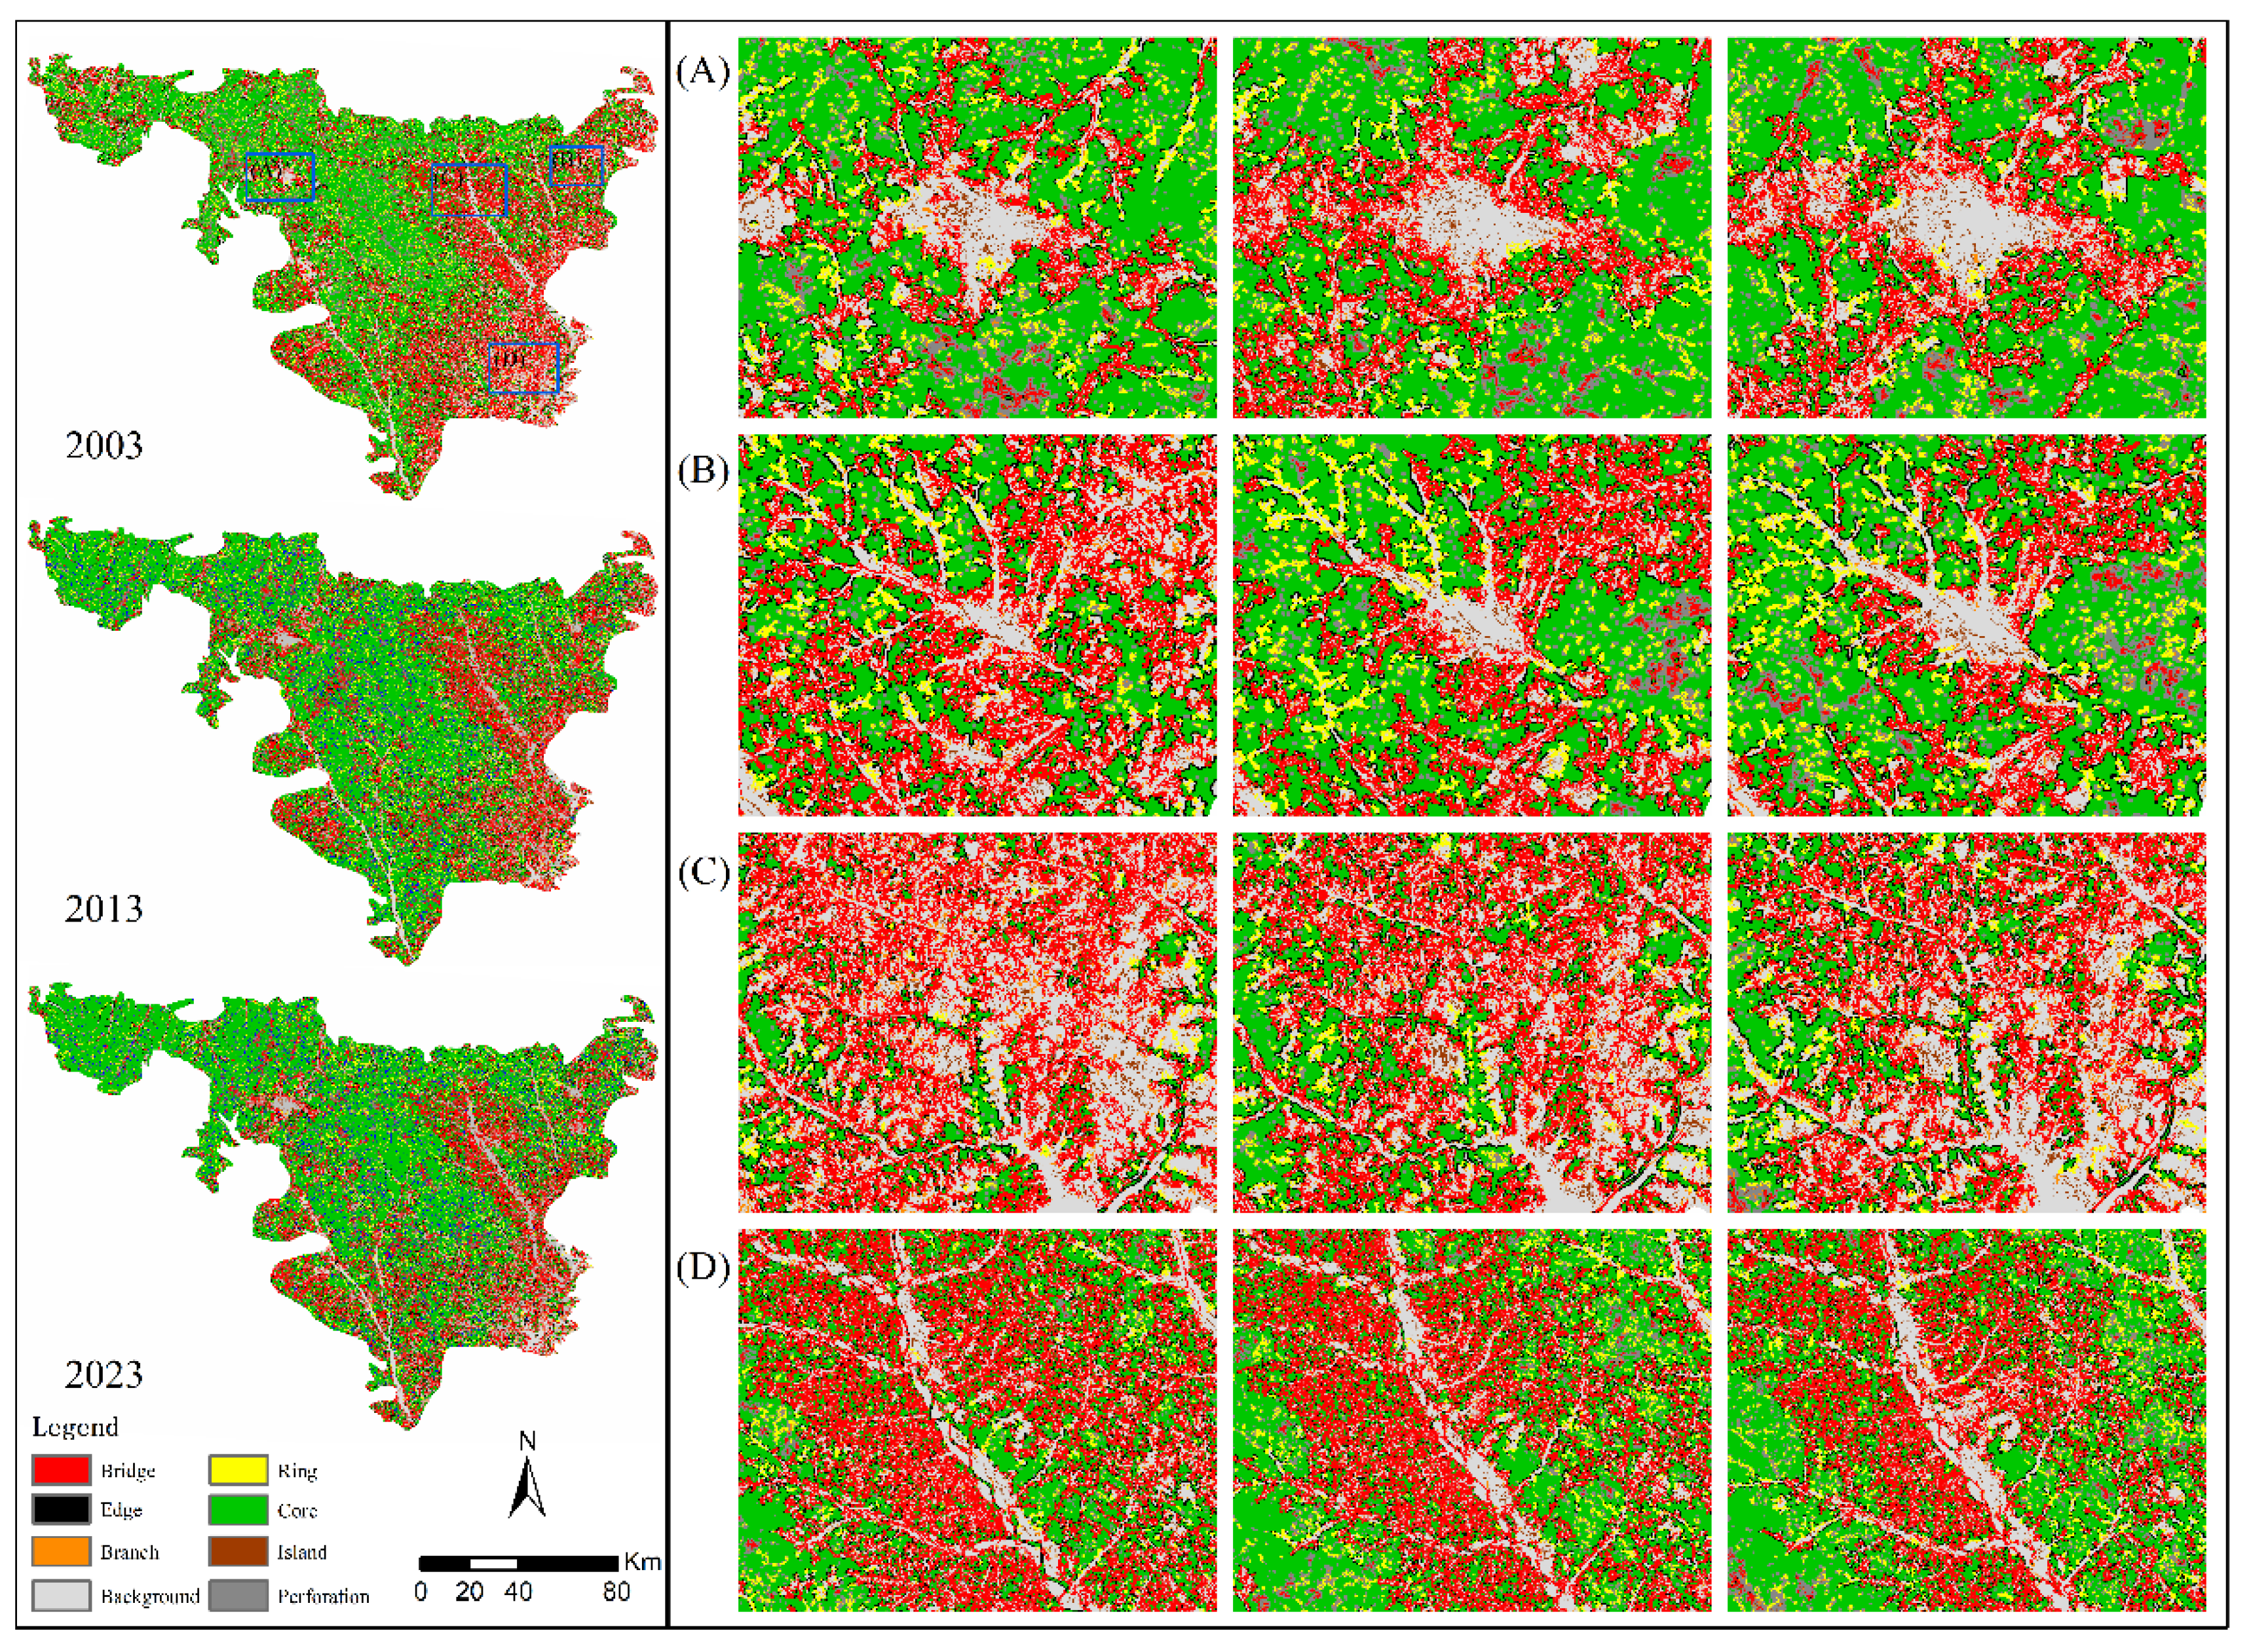
Figure 8.
Comprehensive resistance surface in 2003, 2013, and 2023.
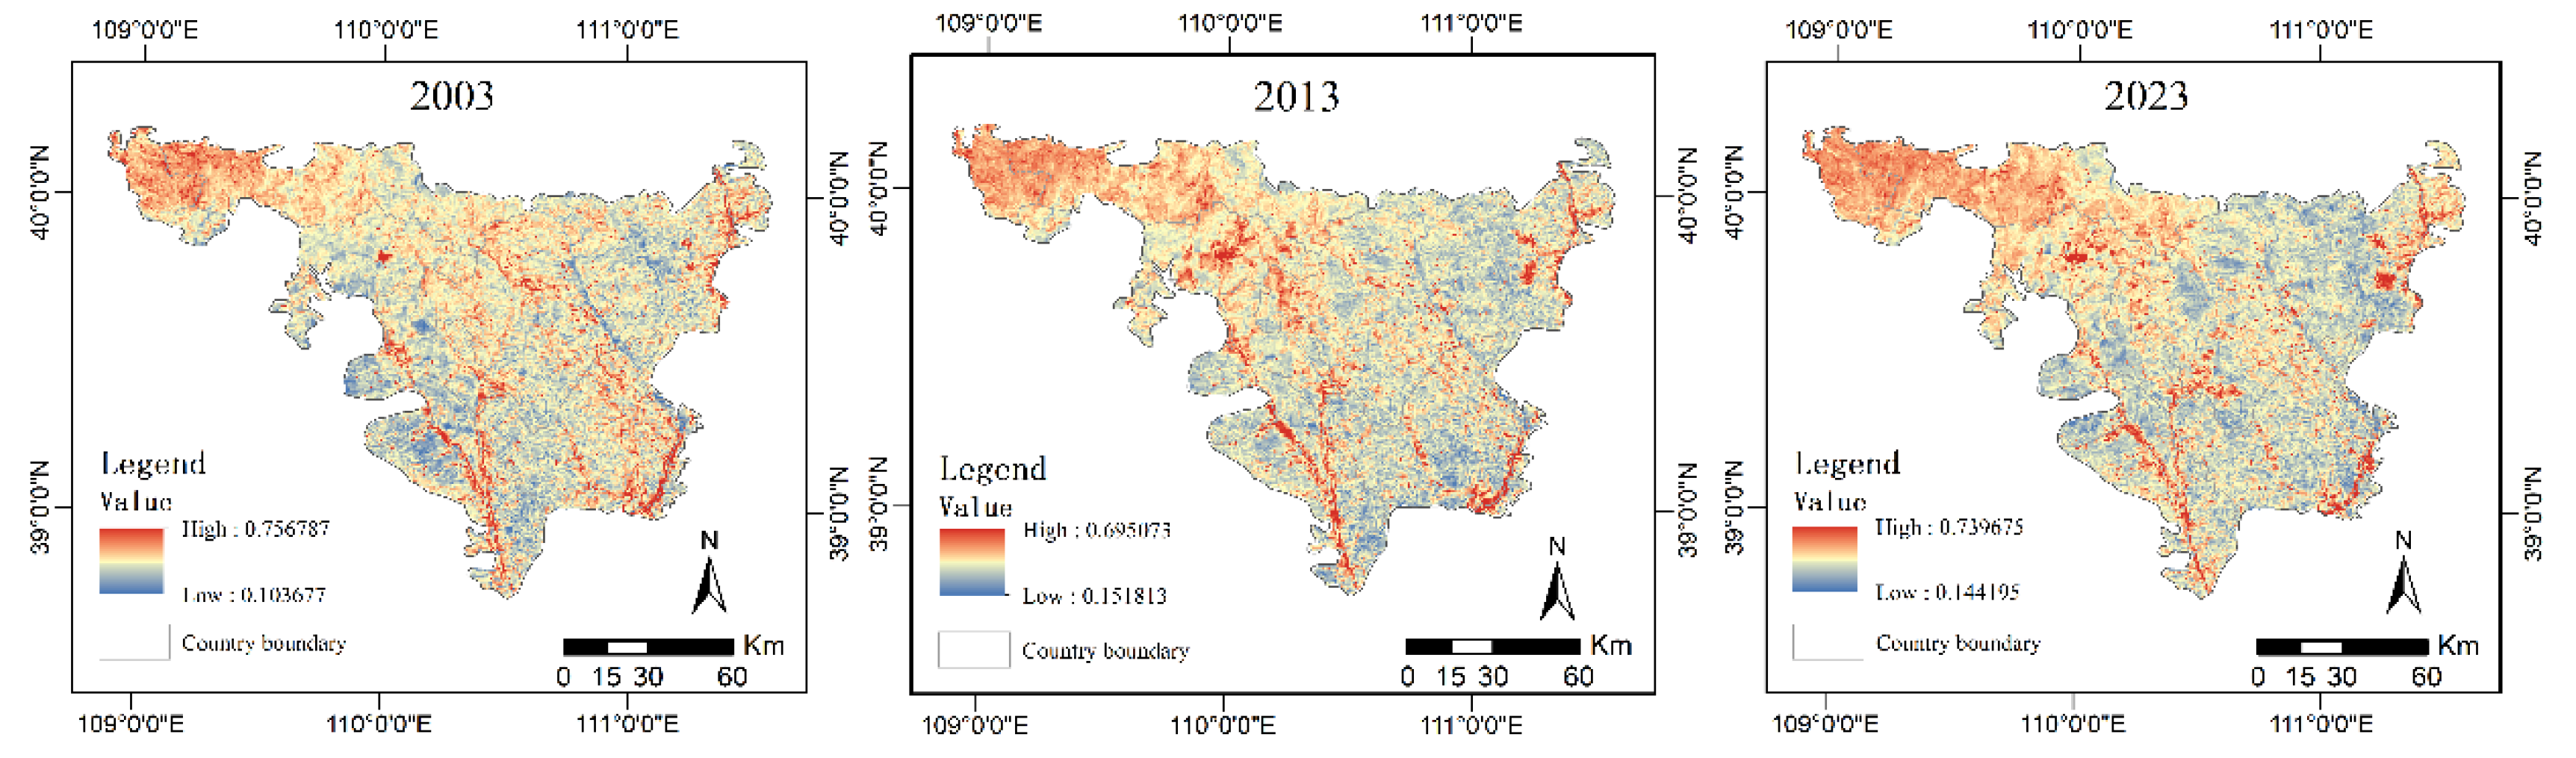
Figure 9.
Ecological corridor construction in 2003, 2013, and 2023.
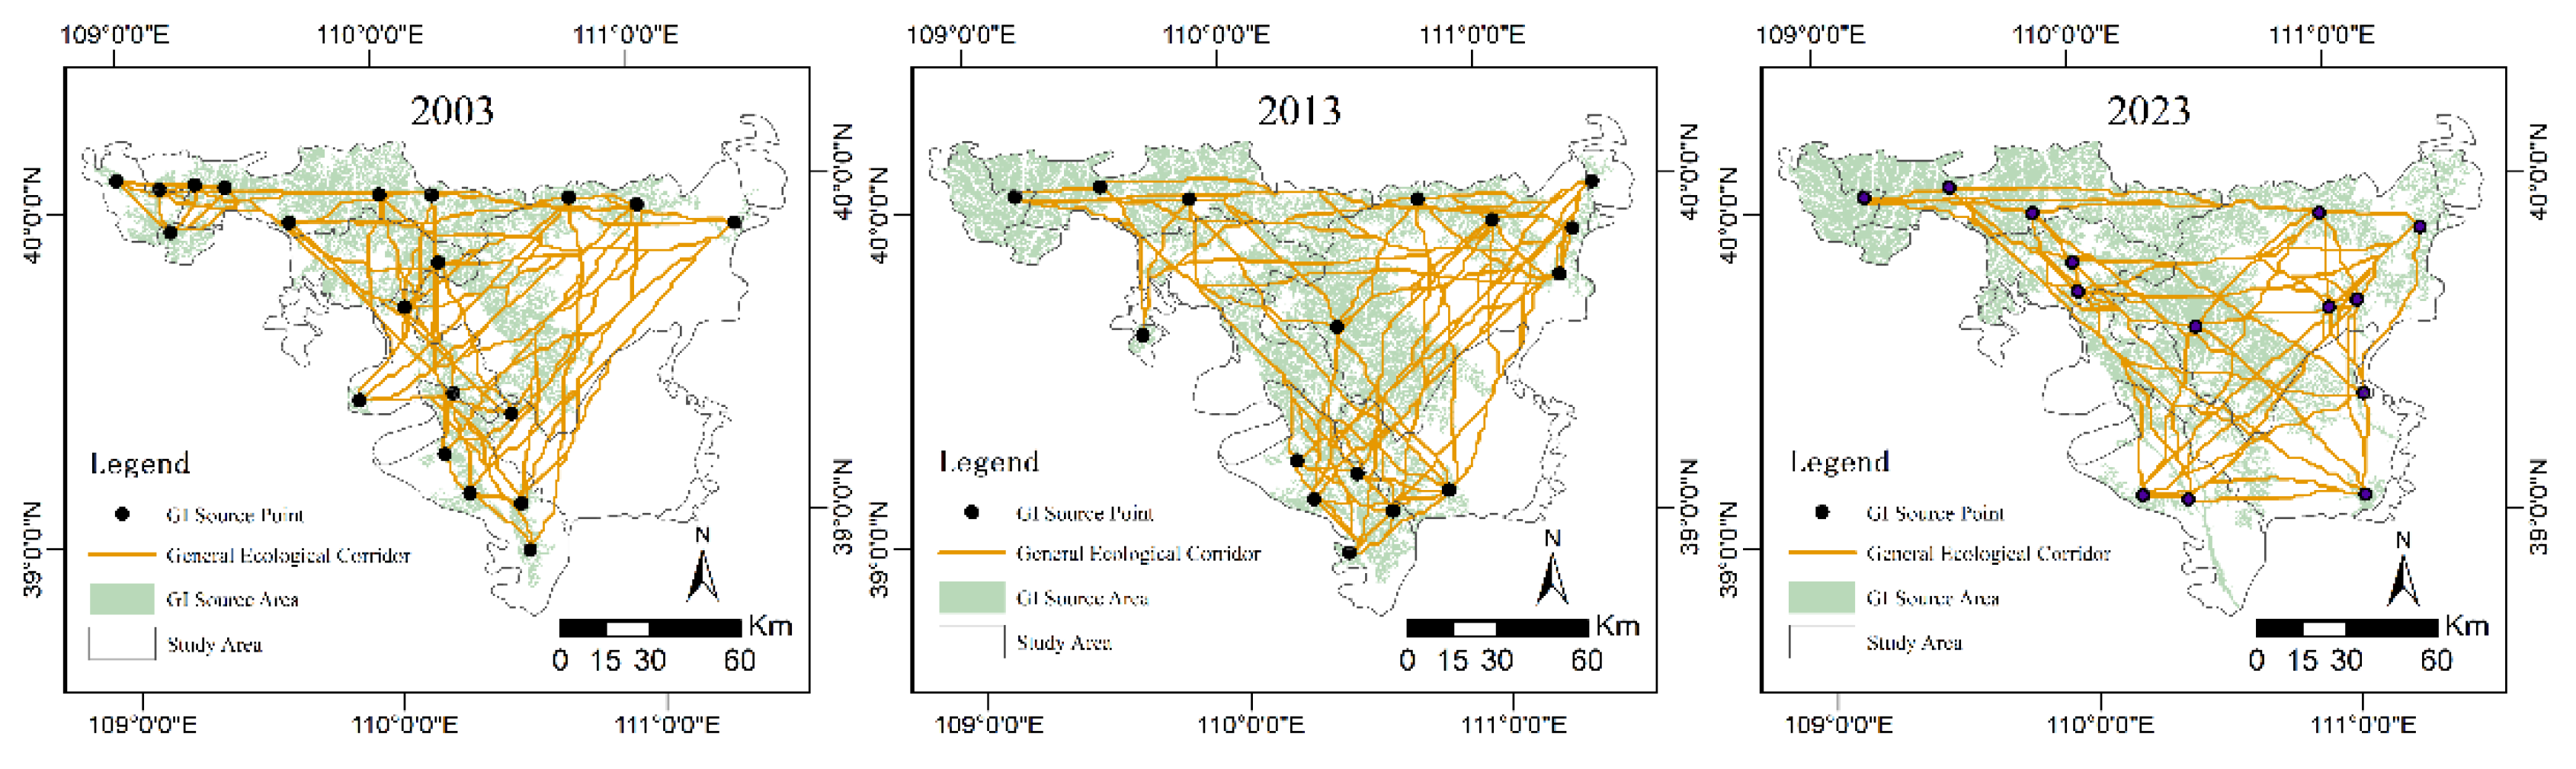
Figure 10.
Construction of important ecological corridors in 2003, 2013, and 2023.
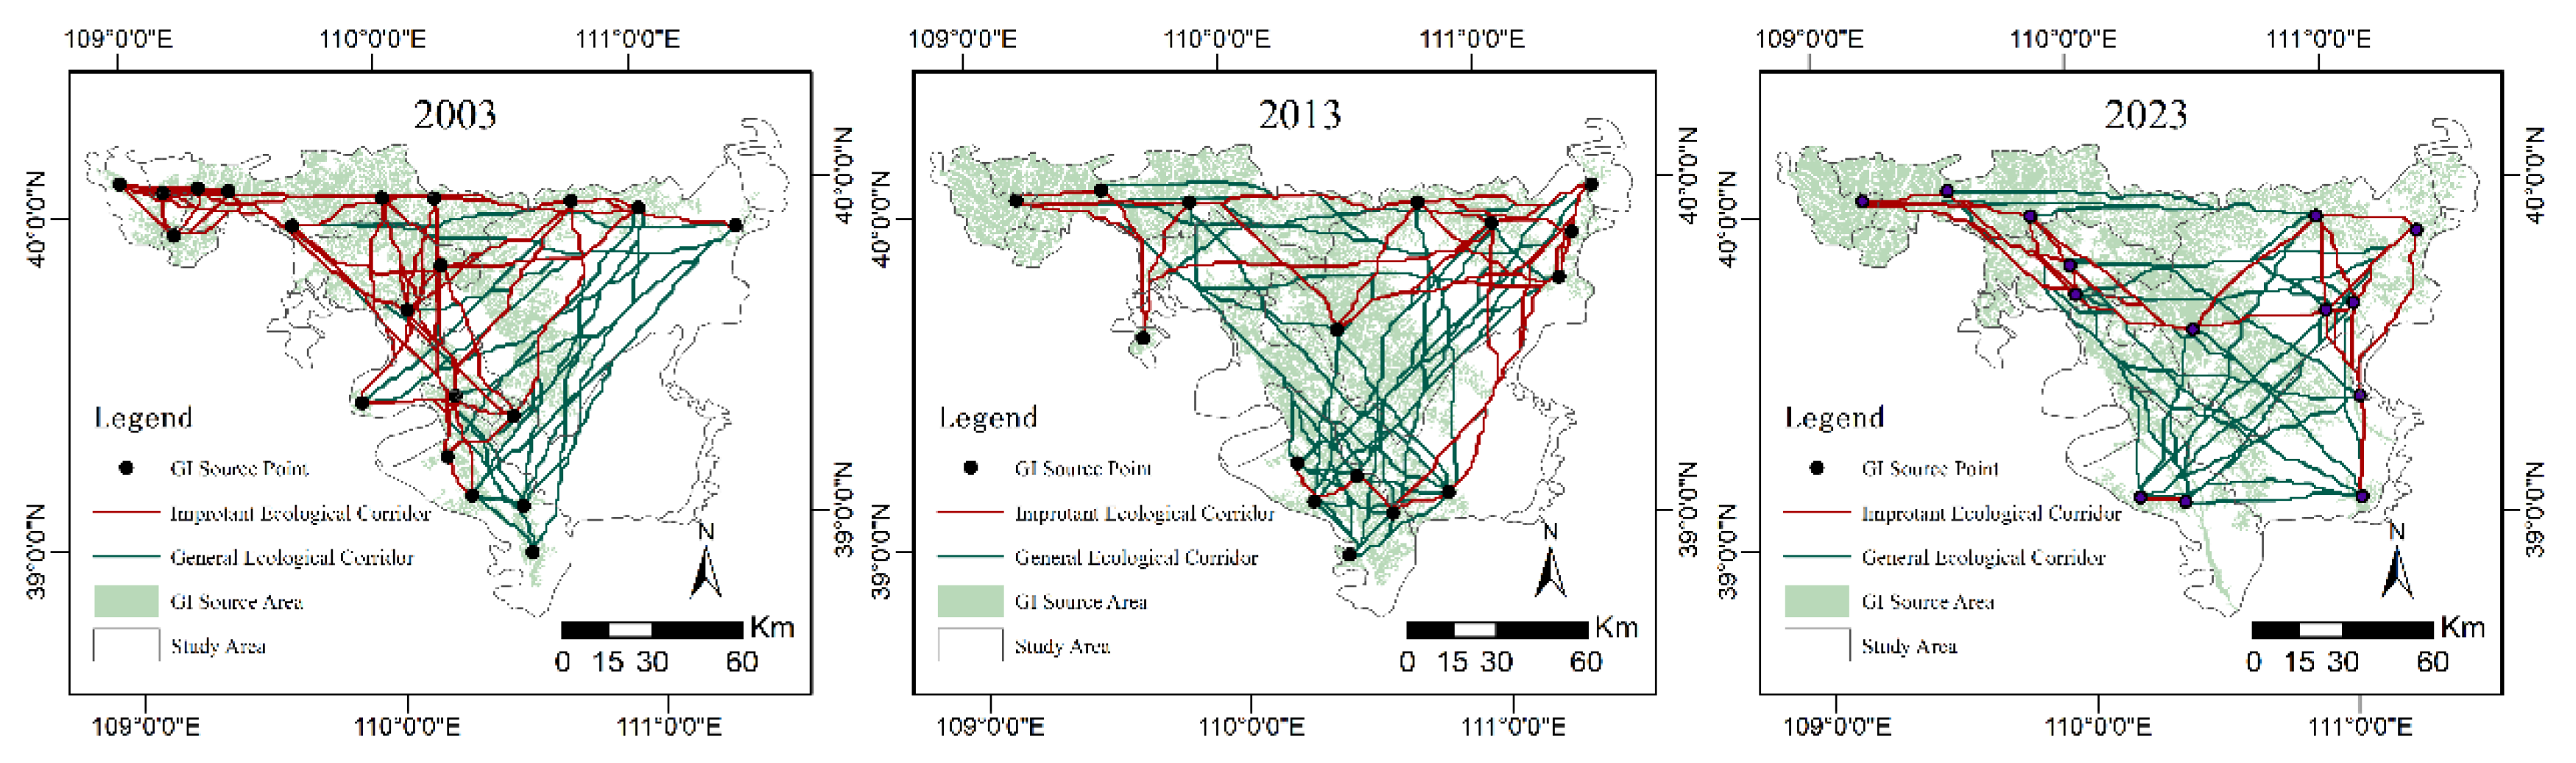

Table 1.
MSPA Landscape Types.
| MSPA Elements | Ecological Significance |
|---|---|
| Core | Large natural patches, wildlife habitats, and forest reserves that provide large habitats for species. |
| Island | fragmented small patches with low connectivity between patches and limited potential for internal material and energy exchange. |
| Edge | The transition zone between core areas and developed land, exhibiting edge effects. |
| Perforation | Non-ecological areas within core areas that typically lack ecological benefits. |
| Bridge | Corridors within ecological networks that facilitate species migration, energy flow, and network formation within a region. |
| Ring | Ecological corridors connecting the same core area, serving as shortcuts for species migration within the core area. Branches |
| Branch | Connecting core areas and surrounding landscapes, acting as channels for species dispersal and energy exchange between core area patches and their surrounding landscapes. |
Table 2.
Standardized resistance factors.
| Resistance Factor | secondary category | resistance value | Standardization Direction | Standardized Data Range |
Weight |
|---|---|---|---|---|---|
| Land Use | Forest Land | 1 | Positive Direction | [0,1] | 0.1960 |
| Farmland Grassland |
2 | ||||
| Unused Land | 3 | ||||
| Water Areas | 4 | ||||
| Impervious Surface | 5 | ||||
| Elevation | / | / | Positive Direction | [0,1] | 0.0770 |
| Slope | / | / | Positive Direction | [0-1] | 0.3877 |
| Distance to Road | / | / | Negative Direction | [0-1] | 0.0386 |
| Vegetation Cover | / | / | Negative Direction | [0-1] | 0.3008 |
Table 3.
Land Use Structure Land.
| Land Use | 2003 | 2013 | 2023 | |||
|---|---|---|---|---|---|---|
| Area (km2) | Proportion (%) | Area (km2) | Proportion (%) | Area (km2) | Proportion (%) | |
| Farmland | 2315.2572 | 13.8030 | 1762.8786 | 10.5098 | 1881.9036 | 11.2194 |
| Forest | 0.3087 | 0.0018 | 3.7260 | 0.0222 | 22.3101 | 0.1330 |
| Wetland | 37.5228 | 0.2237 | 43.9092 | 0.2618 | 40.1760 | 0.2395 |
| Unused Land | 311.1633 | 1.8551 | 134.2710 | 0.8005 | 137.0574 | 0.8171 |
| Impervious Surface | 236.6325 | 1.4107 | 379.7271 | 2.2638 | 507.1122 | 3.0233 |
| Grassland | 13872.7341 | 82.7057 | 14449.1040 | 86.1418 | 14185.0584 | 84.5677 |
Table 4.
Degree of change in single dynamics of land use/%.
| Land Use | 2003-2013 | 2013-2023 | 2003-2023 | |||
|---|---|---|---|---|---|---|
| Change in Area (km2) | Annual Growth Rate (%) | Change in Area (km2) | Annual Growth Rate (%) | Change in Area (km2) | Annual Growth Rate (%) | |
| Farmland | -552.3786 | -0.0239 | 119.025 | 0.0068 | -433.3536 | -0.0094 |
| Forest | 3.4173 | 1.107 | 18.5841 | 0.4988 | 22.0014 | 3.5636 |
| Wetland | 6.3864 | 0.017 | -3.7332 | -0.0085 | 2.6532 | 0.0035 |
| Unused Land | -176.8923 | -0.0568 | 2.7864 | 0.0021 | -174.1059 | -0.028 |
| Impervious Surface | 143.0946 | 0.0605 | 127.3851 | 0.0335 | 270.4797 | 0.0572 |
| Grassland | 576.3699 | 0.0042 | -264.0456 | -0.0018 | 312.3243 | 0.0011 |
Table 5.
Statistical Information on GI Corridors in 2003, 2013, and 2023.
| Year | GI Corridor | GI Source Point | Corridor Intersection |
|---|---|---|---|
| 2003 | 190 | 20 | 334 |
| 2013 | 120 | 16 | 394 |
| 2023 | 91 | 14 | 263 |
Table 6.
GI Network Connectivity Assessment for 2003, 2013, and 2023.
| Year | Source Point | Number of Connections | α | β | γ |
|---|---|---|---|---|---|
| 2003 | 20 | 73 | 0.54 | 1.90 | 0.70 |
| 2013 | 16 | 33 | 0.22 | 1.31 | 0.50 |
| 2023 | 14 | 29 | 0.13 | 1.14 | 0.44 |
Disclaimer/Publisher’s Note: The statements, opinions and data contained in all publications are solely those of the individual author(s) and contributor(s) and not of MDPI and/or the editor(s). MDPI and/or the editor(s) disclaim responsibility for any injury to people or property resulting from any ideas, methods, instructions or products referred to in the content. |
© 2025 by the authors. Licensee MDPI, Basel, Switzerland. This article is an open access article distributed under the terms and conditions of the Creative Commons Attribution (CC BY) license (http://creativecommons.org/licenses/by/4.0/).
Copyright: This open access article is published under a Creative Commons CC BY 4.0 license, which permit the free download, distribution, and reuse, provided that the author and preprint are cited in any reuse.


