Submitted:
13 November 2025
Posted:
14 November 2025
You are already at the latest version
Abstract
Aeration is one of the most energy-intensive operations in wastewater treatment plants, with its efficiency strongly affected by the presence of surfactants. This study investigates the impact of surfactants on oxygen mass transfer using a commercial fine bubble diffuser. Oxygen transfer experiments were performed under varying air flow rates and surfactant concentrations. Key parameters, including the volumetric mass transfer coefficient (kLa), gas holdup, bubble size, and interfacial area, were experimentally measured and analysed. Results show that kLa increases with air flow rate due to larger interfacial area, while the Standard Oxygen Transfer Efficiency (SOTE) decreases, particularly at higher surfactant concentrations. Surfactants promote smaller bubble sizes and higher gas holdup, thus increasing the interfacial area. However, they significantly reduce the liquid-side mass transfer coefficient (kL) by suppressing interfacial turbulence. Despite the increased interfacial area, the reduction in kL leads to lower overall oxygen transfer efficiency. These findings highlight the importance of accounting for surfactant effects in the design and operation of industrial aeration systems.
Keywords:
oxygen transfer
; surfactants
; aeration
; fine-bubble diffuser
; bubbles
; mass transfer
; interfacial area
; bubble size
; liquid-side mass transfer coefficient
; volumetric mass transfer coefficient
1. Introduction
Wastewater treatment plants (WWTPs) play a strategic role in protecting the environment, safeguarding public health, and promoting the sustainable use of water resources [1]. Among the various unit operations in WWTPs, aeration is one of the most energy-intensive processes, accounting for up to 70% of the total energy consumption in a typical plant [2]. Over the past three decades, fine bubble aeration has become widely adopted in activated sludge systems due to its high oxygen transfer efficiency in clean water. However, a major limitation of this system is the significant reduction in oxygen transfer efficiency when operating in wastewater, which can decrease by 40% to 70% compared to clean water [3].
One of the main factors contributing to this reduction is the presence of surfactants. Surfactants are surface-active agents commonly used in soaps and cleaning products. These amphiphilic molecules tend to accumulate at gas-liquid interfaces, where they significantly reduce interfacial tension as their concentration increases [4]. However, this reduction continues only up to a point, known as the Critical Micelle Concentration (CMC), beyond which additional surfactant does not further decrease the interfacial tension. Surfactants accumulate at the bubble interface, influencing mass transfer through two opposing mechanisms: (i) increasing the interfacial area by promoting the formation of smaller bubbles, and (ii) reducing the liquid-side mass transfer coefficient by decreasing bulk fluid disturbance through resistance to interfacial motion [5,6,7].
Numerous experimental studies have investigated the effects of surfactants on single-bubble behaviour, with some focusing specifically on the kinetics of surfactant adsorption at the bubble interface and the transient nature of this process [5,8]. In such systems, several key phenomena have been observed: (i) a reduction in terminal velocity due to increased interfacial rigidity [9] ; (ii) a decrease in bubble size resulting from changes in bubble formation dynamics [10,11]; and (iii) a reduction in the liquid-side mass transfer coefficient [6,12]. Local-scale measurements obtained in these studies are crucial, as they provide direct insight into the underlying physicochemical mechanisms that govern bubble motion and mass transfer. These detailed observations form the basis for developing predictive models that estimate parameters such as the mass transfer coefficient [13,14,15], bubble drag coefficient [16,17], and bubble generation size [18] in the presence of surfactants under single-bubble conditions.
While single-bubble investigations offer valuable fundamental understanding, they inherently simplify the complex hydrodynamics of practical systems. To overcome these limitations, several researchers have investigated the behaviour of surfactants in multi-bubble systems [19,20,21], where bubble interactions and coalescence inhibition become more significant [22,23,24,25,26]. Some research has specifically focused on the impact of surfactants on fine-bubble diffusers used in aeration systems for WWTP, showing that mass transfer efficiency can decrease by more than 50% [3,4,27]. Chen et al. [27] developed a correlation to predict the in a commercial fine-bubble diffuser operating with surfactants; however, their study was limited to a single airflow rate and did not include bubble size measurements, which are essential for accurately characterizing mass transfer behaviour [13,20,28,29]. A promising approach is the general model proposed by Sardeing et al. [13] for single bubbles, which predicts the in the presence of any surfactant, based on models developed for bubbles with rigid [30] and free interfaces [31]. Although this model has been tested in multi-bubble systems, such as bubble columns [19], it has not yet been validated for use in commercial diffusers.
In this study, we aim to build on previous work by experimentally investigating the effect of surfactants on oxygen mass transfer using a commercial fine-bubble diffuser under conditions representative of water treatment applications. A comprehensive database was compiled, including measurements of , gas holdup, bubble size distribution, interfacial area concentration and , all of which govern the overall mass transfer process and were systematically analysed. In addition, a correlation was developed to describe gas holdup as a function of airflow rate and surfactant concentration. Finally, the experimental results were compared with the different models to evaluate their ability to predict the behaviour of a commercial diffuser operating in the presence of surfactants.
2. Materials and Methods
2.1. Materials
For the experiments, deionized water with a conductivity of 40 μS/cm was used to minimize the natural hardness of the local water supply. The surfactant used is Sodium Dodecyl Sulphate (SDS) [CAS NO:151-21-3], which were supplied by Thermo Fisher Scientific with a purity of 85%. To prepare the dissolution a balance is used with a precision of kg, measuring the water volume with the height of the column. In this study, surfactant concentrations of 2, 4, 6, and 8 mg/L were used, which are commonly applied in similar research [3,27,32]. These concentrations cover the typical range of surfactants found in raw municipal wastewater [33], with the highest tested concentration (8 mg/L) approaching the saturation level of SDS [27].
2.2. Experimental Setup
Figure 1a shows a schematic of the experimental setup, which consists of a square column with dimensions of 0.4 m × 0.4 m × 0.8 m. At the base of the column, a fine-pore rubber diffuser (D-Rex model with a Flexnorm membrane from OTT Group) is installed. The airflow rate is controlled using a mass flow controller. An image of the column in operation can be seen in Figure 1b.
Oxygen transfer tests were conducted using an OXYPro PSt7 sensor from PreSens. To remove dissolved oxygen from the water, nitrogen gas was supplied through the diffuser. The gas holdup was determined by recording the increase in the liquid-gas interface height () with a camera.
Bubble characteristics, including size and aspect ratio, were analysed using a high-speed CCD camera (NR4-S2, IDT Vision). Inside the reactor, the camera system was focused on the central region of the column, as bubbles rising near the walls are not representative of the bulk flow. To isolate this central zone, a cylindrical barrier was installed along the inner wall, extending halfway across the column (0.2 m). This barrier prevented peripheral bubbles from entering the observation area, ensuring that only bubbles from the central flow region were recorded. Once the barrier ended, a translucent panel was placed on the opposite side of the column and illuminated from behind with a spotlight, providing uniform backlighting for clear visualization of the bubbles.
2.3. Method
Oxygen transfer and bubble characteristics were characterized for five different surfactant concentrations (0, 2, 4, 6, and 8 mg/L) and five gas flow rates (20, 40, 60, 80, and 100 L/min). For each combination of surfactant concentration and flow rate, several key parameters were determined: the volumetric mass transfer coefficient, bubble diameter and shape, gas holdup, interfacial area, and the liquid-side mass transfer coefficient. All experiments were conducted at a water temperature of 13±1 °C, which is typical of wastewater conditions during winter [34], when contaminant loads are generally higher.
The methodology applied to obtain each of these parameters €s described €n detail €n the following subsections.
2.3.1. Volumetric Mass Transfer Coefficient
Oxygen transfer experiments were performed in accordance with the ASCE standard method [35]. Prior to aeration, the dissolved oxygen concentration was decreased to below 0.5 mg/L. Air was then introduced, and the temporal evolution of oxygen concentration was measured. The volumetric mass transfer coefficient () and the equilibrium oxygen concentration () were obtained by fitting Equation (1) to the oxygenation curve.
The adjusted parameters are corrected to standard conditions, and with these, the SOTE is calculated (2).
where is the volumetric mass transfer coefficient corrected to standard conditions, is the equilibrium oxygen concentration corrected to standard conditions, is the aerated liquid volume, and is the mass flow rate of oxygen supplied per unit time.
2.3.2. Bubble Equivalent Diameter
A high-speed CCD camera was used to determine the average bubble equivalent diameter. To ensure that only bubbles from the centre of the plume were recorded, the cylindrical barrier described in the experimental setup was employed. Images were acquired at 20 cm and 70 cm above the diffuser membrane to evaluate bubble size evolution caused by coalescence and breakup. Example images of the bubbles captured with the high-speed camera are shown in Figure 2. Bubble dimensions were obtained through manual image analysis. Four points were selected along the bubble contour to fit the major € and minor € axes of each bubble.
From the major and minor axes of each bubble, the bubble diameter can be determined. In mass transfer studies, there are several ways to define a global equivalent bubble diameter, and one of the most used is the Sauter diameter, which corresponds to the diameter of a sphere with the same volume-to-surface ratio as the total population of bubbles. The method described by Vasconcelos et al. [20] was applied to obtain this diameter. First, an equivalent diameter for each bubble was determined by fitting its shape according to Equation (3).
where and represent the major and minor axes, respectively, of the ellipsoidal bubble in a two-dimensional projection. Subsequently, the Sauter mean diameter was determined using Equation (4), as defined by Shah et al. [36], based on the number of bubbles with equivalent diameters .
2.3.3. Gas Holdup
Gas holdup plays an important role in mass transfer processes, as it is required to estimate the interfacial area between the gas and liquid phase, a key parameter governing oxygen transfer efficiency. In this study, gas holdup was determined from the variation in liquid column height, according to Equation (5).
To measure the variation in column height, recordings were captured using a camera, as surface oscillations required analysis of multiple frames. For each experimental condition, a total of 20 images were analysed. The interface was manually traced by selecting several equally spaced points along it in each image, and a straight line was fitted to these points to determine the column height in that frame. Figure 3a shows the manually selected points at the interface, along with the fitted line (solid red) and the 3σ limit (dashed red).
Figure 3b shows the relationship between flow rate and the increase in interface level for clean water, along with the standard deviation of the interface position at each flow rate. Despite the relatively high variability, the mean values follow a clear trend. From these data, it is possible to estimate the gas holdup.
2.3.4. Interfacial Area
The is estimated from the gas holdup and the average Sauter diameter using Equation (6) [37].
This expression is derived under the assumption that the bubbles are spherical and uniformly distributed within the liquid phase. In this context, the Sauter diameter provides an equivalent measure that preserves the interfacial area per unit volume. Gómez-Díaz et al. [28] reported good agreement between this approach and the chemical method for determining interfacial area.
2.3.5. Mass Transfer Coefficient
The mass transfer coefficient () is determined using Equation (7), by dividing the volumetric mass transfer coefficient () by the interfacial area ().
3. Results
This section presents experimental results on the effects of SDS surfactant concentration and airflow rate on the key parameters governing oxygen transfer in a bubble column equipped with a membrane diffuser. By analysing these parameters both individually and in combination, a comprehensive understanding of the mechanisms controlling oxygen transfer efficiency in the presence of surfactants can be achieved. The analysis focuses on the volumetric mass transfer coefficient, bubble size and shape, gas holdup, interfacial area, and the liquid-side mass transfer coefficient.
3.1. Effect on Volumetric Mass Transfer Coefficient
Figure 4a shows how the varies with airflow rate for different SDS concentrations. As expected, increases with increasing airflow rate, mainly due to the enlargement of the gas-liquid interfacial area. Conversely, higher surfactant concentrations result in a decrease in . A significant reduction is observed when comparing clean water with solutions containing 2 mg/L and 4 mg/L of surfactant. However, beyond 4 mg/L, further increases in surfactant concentration have a minimal additional effect on , suggesting a saturation effect at the interface. This trend was also reported by Chen et al. [27], who found that the most significant decline in occurred within the 0–5 mg/L range of SDS concentration.
The increase of with air flow rate means a decrease of the efficiency of oxygen transfer. This trend clearly appears by plotting the SOTE as a function of flow rate (Figure 4b). These indicate that although more oxygen is transferred at higher flow rates, the process becomes less efficient. A decrease in SOTE is also observed with increasing surfactant concentration.
3.2. Effect on Bubble Size and Shape
Figure 5a shows the variation in the mean Sauter diameter within the reactor, calculated as the average value between 20 cm and 70 cm from the diffuser membrane, across different flow rates and SDS concentrations. The data reveal two main trends. First, the bubble Sauter diameter decreases as the surfactant concentration increases, until it reaches a nearly constant value near the CMC, where further increases have little effect. Second, higher flow rates result in larger bubble diameters. Both effects directly influence the interfacial area concentration and, consequently, the mass transfer dynamics.
According to Liu et al. [32], the reduction in bubble size due to surfactant addition can be attributed to two primary mechanisms: bubble generation and coalescence inhibition. To observe that, we plot in Figure 6 the BSD variation for different flow rates and surfactant concentrations, measured at 20 cm and 70 cm from the diffuser membrane. For the first mechanism, it is particularly evident at 20 cm that the BSD decreases with increasing surfactant concentration, primarily due to the reduction in surface tension, which controls bubble growth and detachment [10,12,13,14]. This occurs because the presence of surfactant reduces surface tension, promoting the formation of smaller bubbles, as the detachment size is governed by the balance between buoyancy and surface tension forces [12]. Loubière and Hébrard [10], suggest that at low flow rates, bubble size is controlled by dynamic surface tension through surfactant adsorption-diffusion, whereas at high flow rates static surface tension dominates.
The second mechanism is related to bubble coalescence, as surfactants accumulate at the gas–liquid interface, generating repulsive forces between adjacent bubbles and thereby preventing coalescence [24,38]. However, this effect is not clearly observed in the BSD distribution shown in Figure 6, as the variation between the two heights is minimal. This could be due to coalescence primarily occurring during the early stages of bubble formation, particularly near the diffuser. Despite this, a slight increase in bubble size can still be observed between 20 cm and 70 cm in the clean water cases.
In addition to the effect of surfactants on bubble size, increasing the gas flow rate also leads to larger bubbles, as shown in Figure 5a, due to changes in bubble formation dynamics and enhanced coalescence. At high flow rates, surfactant has a lower effect on bubble size. The BSD data in Figure 6 highlight the influence of flow rate on bubble size, with larger bubbles becoming more prevalent at higher flow rates.
Finally, the Marangoni effect induced by surfactants reduces bubble surface mobility, driving the aspect ratio toward unity and resulting in more spherical bubbles [39], as illustrated in Figure 5b. Additionally, the reduction in bubble size, as previously discussed, also contributes to this change in aspect ratio.
3.3. Effect on Gas Holdup
As illustrated in Figure 7a, an increase in flow rate results in higher gas holdup. Another observed effect is that increasing the surfactant concentration also leads to an increase in holdup, a trend consistent with previous reports in the literature [40,41,42]. For clarity, the cases corresponding to 2, 4, and 6 mg/L of surfactant were omitted from Figure 7a to better highlight this variation. The observed increase in holdup is attributed to a reduction in bubble rise velocity, which prolongs bubble residence time within the liquid phase. According to Li et al. [43], the decrease in bubble rise velocity arises from two main factors: (i) the reduction in bubble size, and (ii) the asymmetric accumulation of surfactants on the bubble surface, which induces surface tension gradients and enhances drag force, a phenomenon known as the Marangoni effect. Consequently, bubbles remain suspended in the liquid for a longer period, leading to an overall increase in gas holdup.
Inspired by Moraveji et al. [40], who correlated gas holdup with superficial gas velocity and surfactant concentration in an airlift reactor, we fitted our experimental data using these two parameters, modifying the original equation to account for the effect of zero surfactant concentration. The experimental data were used to fit the Equation (8).
where is expressed in cm/s, in mg/L, and is dimensionless. Note that the coefficient of determination (R2 = 0.97) indicates an excellent agreement between the experimental and predicted values. Most of the experimental data fall within ±10% of the fitted correlation. According to this equation, the gas holdup increases by approximately 2% for each additional milligram per litre of SDS within the studied range.
3.4. Effect on Interfacial Area
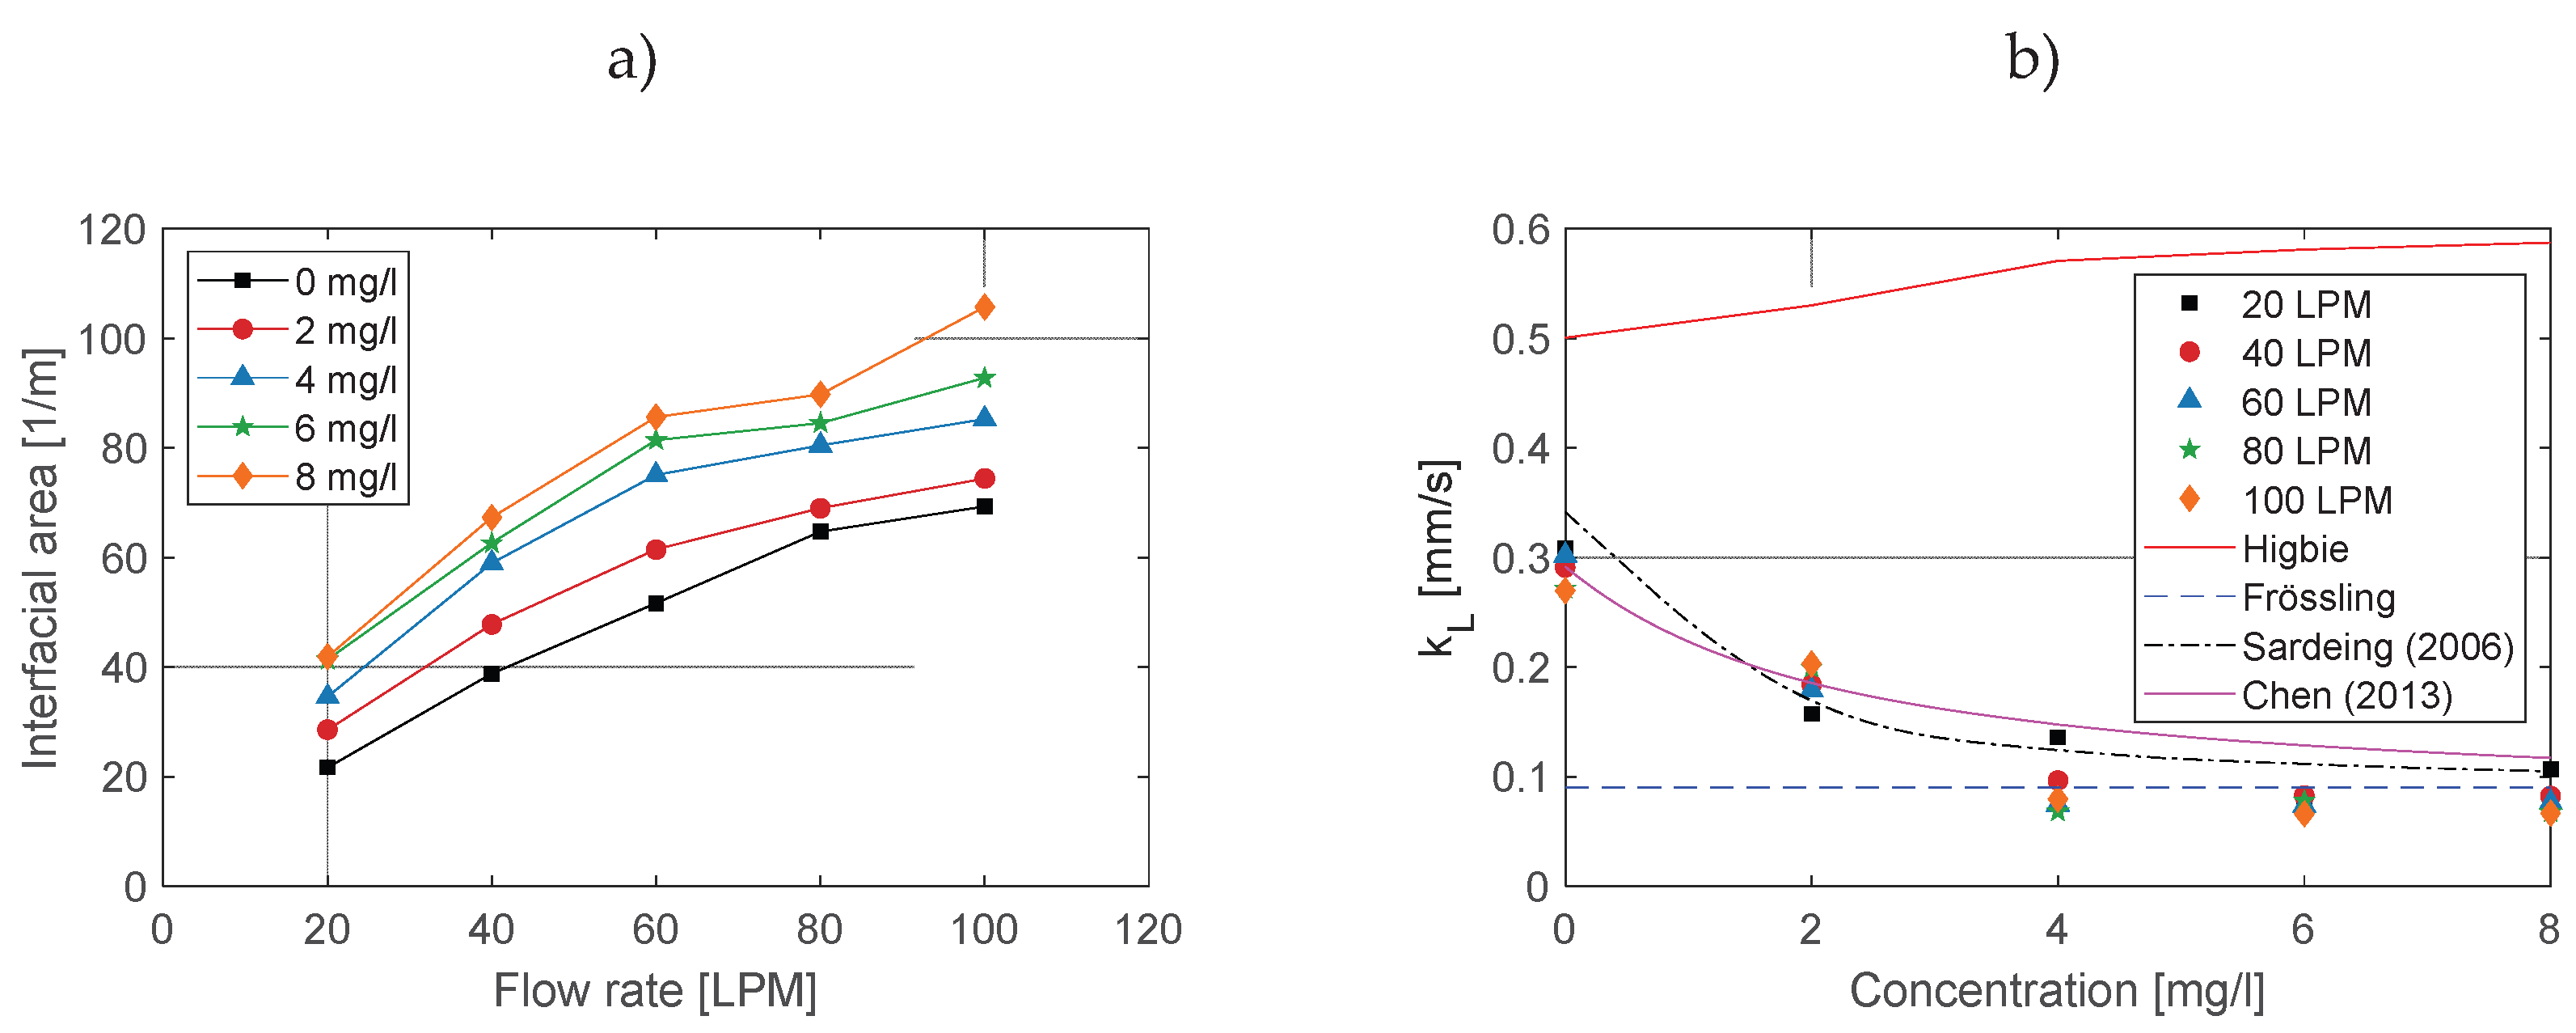
In Figure 8a, shows how the interfacial area varies with gas flow rate and surfactant concentration. To minimize uncertainty in the calculation of interfacial area, gas holdup was obtained from the correlation in Equation (8). As expressed in Equation (6), the interfacial area reflects the competition between bubble size and gas holdup. Increasing the gas flow rate tends to produce larger bubbles, which reduces interfacial area; at the same time, it increases gas holdup, which enhances interfacial area. The observed trend results from the balance of these opposing effects. In our conditions, the increase in gas holdup generally dominates, yielding a net rise of interfacial area with flow rate.
Surfactants also have a marked impact. In their presence, the gas holdup increases slightly while bubble size decreases significantly; both effects contribute to a clear increase in interfacial area. As the surfactant concentration approaches the CMC, the increase in interfacial area becomes less pronounced and eventually exhibits a saturation tendency. Because overall oxygen transfer depends on the product , the increase in interfacial area discussed above must be interpreted together with possible changes in the liquid-side mass transfer coefficient . The analysis of is presented next.
3.5. Effect on Mass Transfer Coefficient
Although Figure 8a indicates that surfactants enlarge the interfacial area, Figure 8b reveals that the liquid-side mass transfer coefficient remains nearly constant with flow rate (with a slight deviation at 20 LPM) and decreases systematically with surfactant addition. This decrease is attributed to the adsorption of surface-active molecules at the gas–liquid interface, which suppresses surface renewal and interfacial turbulence [5,6,7], thereby hindering molecular diffusion. Consequently, despite the growth in interfacial area, the drop in dominates and leads to a net reduction in oxygen transfer.
To interpret these trends, we compared several models with the data obtained here. Predictions used the mean Sauter bubble diameter evaluated for the five gas flow rates at each surfactant concentration; the bubble slip velocity was estimated with Tomiyama’s correlation [44] for partially contaminated water.
We first analyse the limiting cases of interfacial mobility, which provide upper and lower bounds for the . The clean, fully mobile limit is represented by the penetration-theory result of Higbie [31], which assumes rapid surface renewal and negligible interfacial shear resistance. In that idealised scenario, scales with the square root of the contact (or renewal) time and depends on the bubble slip velocity and size as
where D is the diffusion coefficient of oxygen in water (), is the bubble slip velocity () and is the bubble diameter (). In this study, the Sauter diameter was used. The opposite extreme corresponds to a rigid, fully contaminated interface that suppresses motion at the surface and eliminates internal circulation; the classical Frössling correlation [30] captures this behaviour:
with and the Reynolds and Schmidt numbers, respectively, evaluated from , , and the fluid properties. As shown in Figure 8b, our measurements lie well below Higbie even for deionized water, which is consistent with partial interfacial contamination by trace impurities that produce Marangoni stresses and reduce surface mobility. At high surfactant concentrations, the data approach the rigid limit, and the Frössling correlation aligns more closely. Nevertheless, Frössling correlation slightly overpredicts , as observed in previous studies, which has been attributed to a decrease in the diffusion coefficient and oxygen saturation [42].
The models developed by Higbie and Frössling do not account for the effect of surfactant concentration; rather, they represent the limiting cases of mass transfer for a clean (free) and a fully contaminated (rigid) bubble interface, corresponding to the maximum and minimum values, respectively. To better describe the intermediate conditions that occur in the presence of surfactants, several models have been proposed that express as a function of surfactant concentration. In this work, two of these correlations are analysed. The first one, proposed by Chen et al. [27], describes the decrease in for SDS solutions using a ceramic diffuser. The second, developed by Sardeing et al. [13], is a more general model for single bubbles that incorporates the effects of surfactant type and concentration, and is based on the limiting cases represented by the Higbie and Frössling models.
The model presented by Chen et al. [27] is useful for comparing our results with other experimental data obtained using the same surfactant (SDS) and a porous diffuser. Equation (11) shows the correlation proposed by Chen et al. for SDS, which relates the mass transfer coefficient in the presence of surfactants () to that obtained with tap water ().
The correlation is expressed as a function of , the dimensionless interfacial coverage ratio, which is defined by Equation (12).
where K is the adsorption constant at equilibrium, which is obtained from the data presented by Chen et al. [27], and C is the surfactant concentration. In this framework, condenses the chemistry (adsorption strength and concentration) into a single mobility parameter that attenuates relative to the water baseline. When applied to our data (Figure 8), the 20 LPM condition exhibits the closest agreement with Chen’s correlation, which is plausible because Chen’s superficial gas velocity (∼0.06cm/s) is nearest to our lowest-velocity case (20 LPM, ∼0.21cm/s). A clear similarity in trend is observed between Chen’s correlation and the experimental data presented, with the remaining deviations likely arising from differences in diffuser type and experimental conditions, particularly the superficial gas velocity. Two practical notes arise when transporting Chen’s correlation to another industrial diffusers. First, the baseline should be defined consistently with the reference water quality and bubble dynamics, and in our study, we used the experimentally determined value for clean water. Second, since the model was developed for a specific surfactant (SDS), it may not be directly applicable to other surfactant types.
In contrast, Sardeing et al. [13] developed a model for those accounts for the effects of surfactant type, surfactant concentration, bubble size, slip velocity, and other parameters. They structured the influence of surfactants on the liquid-side mass transfer coefficient, , around the bubble diameter , which serves as a reference parameter describing how interfacial mobility, wake structure, and internal circulation contribute to mass transfer.
- For bubble diameters smaller than 1.5 mm. In this range, is independent of surfactant concentration and corresponds to the mass transfer coefficient for rigid bubbles. In this regime, can be described using the Calderbank and Moo-Young’s correlation [45] or the Frössling correlation (Equation (11)).
- For bubble diameters between 1.5 mm and 3.5 mm. In this range, increases with bubble diameter, but in the presence of surfactants, this increase is significantly reduced. Consequently, varies approximately linearly between the limits corresponding to bubbles smaller than 1.5 mm and larger than 3.5 mm. In this study, we are within this range, which is the most critical due to the variability of with the bubble diameter. For this reason, it is essential to accurately measure the bubble diameter.
- For bubble diameters larger than 3.5 mm. For this range, does not depend on bubble diameter. The constant is determined by the interfacial coverage (), the mass transfer coefficient for a clean (surfactant-free) interface (, given by Higbie’s correlation, Eq. (9)), and the mass transfer coefficient for a fully surfactant-saturated interface (, given by Eq. (13)).
As shown in Figure 8b, the single-bubble model proposed by Sardeing et al. [13] can predict for a membrane diffuser in a bubble column within ±15% of the experimental values. The best agreement is obtained for the 20 LPM case, which corresponds to the lowest flow rate and therefore most closely resembles single-bubble conditions. The model presented by Sardeing et al. [13] shows great promise, demonstrating its potential as a practical tool for estimating oxygen mass transfer in fine-bubble diffusers.
4. Conclusions
In this work, the influence of surfactants on mass transfer in a fine-bubble diffuser was investigated at different air flow rates, analysing the parameters that govern this transfer. While surfactants promote the formation of smaller bubbles and increase the gas holdup—thus enhancing the —they also suppress interfacial turbulence, leading to a reduction in the . As a result, surfactants significantly decrease the overall oxygen transfer efficiency, despite the larger interfacial area. In fact, can be reduced by up to 70%, revealing the strong impact of surfactants on aeration systems.
Regarding the , the two main contributing factors—bubble size and gas holdup—were analysed separately. Surfactants were observed to reduce the average bubble diameter by up to 50%; however, beyond the CMC, bubble size remains nearly constant. Another interesting observation is that at higher airflow rates, the influence of surfactants on bubble size becomes less pronounced. Concerning gas holdup, it was found that each additional milligram per litre of SDS increases the holdup by approximately 2%. Based on these results, a new empirical correlation was proposed to predict gas holdup as a function of airflow rate and surfactant concentration, showing excellent agreement with experimental data () and deviations below 10%.
For the , it was observed that airflow rate had little effect, whereas the presence of SDS reduced by up to 70%. To predict this behaviour, two existing models were evaluated. The first, proposed by Chen et al. [27], is an empirical correlation developed for a ceramic diffuser under specific conditions; when applied here, it reproduced the general trend but with some discrepancies. In contrast, the model by Sardeing et al. [13], originally developed for a single bubble, incorporates key parameters such as surfactant type, bubble diameter, and interfacial coverage, making it a more versatile approach. This model predicted within ±15% of the experimental values, demonstrating its strong potential as a practical tool for estimating oxygen mass transfer in aeration systems.
In conclusion, this study highlights the significant impact that surfactants can have on oxygen transfer in fine-bubble diffusers, emphasizing the need to account for their effects when designing and operating aeration systems. The strong predictive capability of the Sardeing model, despite its single-bubble origin, suggests that such models could serve as valuable tools for industrial-scale applications, enabling more accurate performance predictions and optimization of diffuser-based aeration systems in wastewater treatment and related processes.
Funding
This research was funded by MICIU/AEI/10.13039/501100011033 and by ERDF, EU; with the grant number PID2021-128405OB-I00.
Data Availability Statement
The data supporting the findings of this study are openly available in Zenodo at the following DOI: https://doi.org/10.5281/zenodo.17582506
Acknowledgments
The authors express their gratitude to the grant PID2021-128405OB-I00 funded by MICIU/AEI/10.13039/501100011033 and by ERDF, EU.
Conflicts of Interest
The authors declare no conflicts of interest.
References
- Obaideen, K.; Shehata, N.; Sayed, E.T.; Abdelkareem, M.A.; Mahmoud, M.S.; Olabi, A.G. The Role of Wastewater Treatment in Achieving Sustainable Development Goals (SDGs) and Sustainability Guideline. Energy Nexus 2022, 7. [Google Scholar] [CrossRef]
- Fayolle, Y.; Cockx, A.; Gillot, S.; Roustan, M.; Héduit, A. Oxygen Transfer Prediction in Aeration Tanks Using CFD. Chem Eng Sci 2007, 62, 7163–7171. [Google Scholar] [CrossRef]
- Wagner, M.; Pöpel, J. Surface Active Agents and Their Influence on Oxygen Transfer. Wat. Sci. Tech. 1996, 34, 249–256. [Google Scholar] [CrossRef]
- Rosso, D.; Stenstrom, M.K. Surfactant Effects on α-Factors in Aeration Systems. Water Res 2006, 40, 1397–1404. [Google Scholar] [CrossRef]
- Alves, S.S.; Orvalho, S.P.; Vasconcelos, J.M.T. Effect of Bubble Contamination on Rise Velocity and Mass Transfer. Chem Eng Sci 2005, 60, 1–9. [Google Scholar] [CrossRef]
- Jamnongwong, M.; Loubiere, K.; Dietrich, N.; Hébrard, G. Experimental Study of Oxygen Diffusion Coefficients in Clean Water Containing Salt, Glucose or Surfactant: Consequences on the Liquid-Side Mass Transfer Coefficients. Chemical Engineering Journal 2010, 165, 758–768. [Google Scholar] [CrossRef]
- Nekoeian, S.; Aghajani, M.; Alavi, S.M.; Sotoudeh, F. Effect of Surfactants on Mass Transfer Coefficients in Bubble Column Contactors: An Interpretative Critical Review Study. Reviews in Chemical Engineering 2021, 37, 585–617. [Google Scholar] [CrossRef]
- Rosso, D.; Huo, D.L.; Stenstrom, M.K. Effects of Interfacial Surfactant Contamination on Bubble Gas Transfer. Chem Eng Sci 2006, 61, 5500–5514. [Google Scholar] [CrossRef]
- Tagawa, Y.; Takagi, S.; Matsumoto, Y. Surfactant Effect on Path Instability of a Rising Bubble. J Fluid Mech 2014, 738, 124–142. [Google Scholar] [CrossRef]
- Loubière, K.; Hébrard, G. Influence of Liquid Surface Tension (Surfactants) on Bubble Formation at Rigid and Flexible Orifices. Chemical Engineering and Processing 2004, 43, 1361–1369. [Google Scholar] [CrossRef]
- Li, Y.; Zhu, T.; Liu, Y.; Tian, Y.; Wang, H. Effects of Surfactant on Bubble Hydrodynamic Behavior under Flotation-Related Conditions in Wastewater. Water Science and Technology 2012, 65, 1060–1066. [Google Scholar] [CrossRef] [PubMed]
- Painmanakul, P.; Loubière, K.; Hébrard, G.; Mietton-Peuchot, M.; Roustan, M. Effect of Surfactants on Liquid-Side Mass Transfer Coefficients. Chem Eng Sci 2005, 60, 6480–6491. [Google Scholar] [CrossRef]
- Sardeing, R.; Painmanakul, P.; Hébrard, G. Effect of Surfactants on Liquid-Side Mass Transfer Coefficients in Gas-Liquid Systems: A First Step to Modeling. Chem Eng Sci 2006, 61, 6249–6260. [Google Scholar] [CrossRef]
- Zhang, B.; Wang, Z.; Luo, Y.; Guo, K.; Zheng, L.; Liu, C. A Mathematical Model for Single CO2 Bubble Motion with Mass Transfer and Surfactant Adsorption/Desorption in Stagnant Surfactant Solutions. Sep Purif Technol 2023, 308. [Google Scholar] [CrossRef]
- Lebrun, G.; Clergerie, N.; Hébrard, G.; Dietrich, N. Modeling Oxygen Mass Transfer in Surfactant Solutions Considering Hydrodynamics and Physico-Chemical Phenomena. Chem Eng Sci 2025, 304. [Google Scholar] [CrossRef]
- Luo, Y.; Wang, Z.; Zhang, B.; Guo, K.; Zheng, L.; Xiang, W.; Liu, H.; Liu, C. Experimental Study of the Effect of the Surfactant on the Single Bubble Rising in Stagnant Surfactant Solutions and a Mathematical Model for the Bubble Motion. Ind Eng Chem Res 2022, 61, 9514–9527. [Google Scholar] [CrossRef]
- Zheng, K.; Li, C.; Yan, X.; Zhang, H.; Wang, L. Prediction of Bubble Terminal Velocity in Surfactant Aqueous Solutions. Canadian Journal of Chemical Engineering 2020, 98, 607–615. [Google Scholar] [CrossRef]
- Babu, R.; Das, M.K. Effects of Surface-Active Agents on Bubble Growth and Detachment from Submerged Orifice. Chem Eng Sci 2018, 179, 172–184. [Google Scholar] [CrossRef]
- García-Abuín, A.; Gómez-Díaz, D.; Navaza, J.M.; Sanjurjo, B. Effect of Surfactant Nature upon Absorption in a Bubble Column. Chem Eng Sci 2010, 65, 4484–4490. [Google Scholar] [CrossRef]
- Vasconcelos, J.M.T.; Rodrigues, J.M.L.; Orvalho, S.C.P.; Alves, S.S.; Mendes, R.L.; Reis, A. Effect of Contaminants on Mass Transfer Coefficients in Bubble Column and Airlift Contactors. Chem Eng Sci 2003, 58, 1431–1440. [Google Scholar] [CrossRef]
- Ahmia, A.C.; Idouhar, M.; Wongwailikit, K.; Dietrich, N.; Hébrard, G. Impact of Cellulose and Surfactants on Mass Transfer of Bubble Columns. Chem Eng Technol 2019, 42, 2465–2475. [Google Scholar] [CrossRef]
- Mcclure, D.D.; Lee, A.C.; Kavanagh, J.M.; Fletcher, D.F.; Barton, G.W. Impact of Surfactant Addition on Oxygen Mass Transfer in a Bubble Column. Chem Eng Technol 2015, 38, 44–52. [Google Scholar] [CrossRef]
- Jia, X.; Hu, W.; Yuan, X.; Yu, K. Effect of Surfactant Type on Interfacial Area and Liquid Mass Transfer for CO2 Absorption in a Bubble Column. Chin J Chem Eng 2015, 23, 476–481. [Google Scholar] [CrossRef]
- Lu, J.; Corvalan, C.M.; Chew, Y.M.J.; Huang, J.Y. Coalescence of Small Bubbles with Surfactants. Chem Eng Sci 2019, 196, 493–500. [Google Scholar] [CrossRef]
- Asgharpour, M.; Mehrnia, M.R.; Mostoufi, N. Effect of Surface Contaminants on Oxygen Transfer in Bubble Column Reactors. Biochem Eng J 2010, 49, 351–360. [Google Scholar] [CrossRef]
- Abadie, T.; al Ma Awali, S.M.; Brennan, B.; Briciu-Burghina, C.; Tajparast, M.; Passos, T.M.; Durkan, J.; Holland, L.; Lawler, J.; Nolan, K.; et al. Oxygen Transfer of Microbubble Clouds in Aqueous Solutions – Application to Wastewater. Chem Eng Sci 2022, 257. [Google Scholar] [CrossRef]
- Chen, X.; Liu, G. hua; Fan, H.; Li, M.; Luo, T.; Qi, L.; Wang, H. Effects of Surfactant Contamination on Oxygen Mass Transfer in Fine Bubble Aeration Process. Korean Journal of Chemical Engineering 2013, 30, 1741–1746. [Google Scholar] [CrossRef]
- Gómez-Díaz, D.; Navaza, J.M.; Sanjurjo, B. Interfacial Area Evaluation in a Bubble Column in the Presence of a Surface-Active Substance. Comparison of Methods. Chemical Engineering Journal 2008, 144, 379–385. [Google Scholar] [CrossRef]
- Herrmann-Heber, R.; Oleshova, M.; Reinecke, S.F.; Meier, M.; Taş, S.; Hampel, U.; Lerch, A. Population Balance Modeling-Assisted Prediction of Oxygen Mass Transfer Coefficients with Optical Measurements. Journal of Water Process Engineering 2024, 64. [Google Scholar] [CrossRef]
- Frössling, N. The Evaporation of Falling Drops. Gerlands Beitr. Geophys. 1938, 52, 170–216. [Google Scholar]
- Higbie, R. The Rate of Absorption of a Pure Gas into a Still Liquid during Short Periods of Exposure. Transactions of the AIChE, 1935, 31, 365–389. [Google Scholar]
- Liu, Y.; Wang, B.; Zhao, D.; Jin, W.; Xu, F.; Gao, Y.; Shi, W.; Ren, H. Investigation of Surfactant Effect on Ozone Bubble Motion and Mass Transfer Characteristics. J Environ Chem Eng 2023, 11. [Google Scholar] [CrossRef]
- Campbell, K.; Wang, J. New Insights into the Effect of Surfactants on Oxygen Mass Transfer in Activated Sludge Process. J Environ Chem Eng 2020, 8. [Google Scholar] [CrossRef]
- Machado, V.C.; Lafuente, J.; Baeza, J.A. Activated Sludge Model 2d Calibration with Full-Scale WWTP Data: Comparing Model Parameter Identifiability with Influent and Operational Uncertainty. Bioprocess Biosyst Eng 2014, 37, 1271–1287. [Google Scholar] [CrossRef] [PubMed]
- American Society of Civil Engineers. Measurement of Oxygen Transfer in Clean Water; The Society, 1993; ISBN 087262885X.
- Shah, Y.T.; Kelkar, B.G.; Godbole, S.P.; Deckwer, W.-D. Design Parameters Column Reactors Estimations for Bubble Column Reactors; 1982; Vol. 28.
- van’t Riet, K.; Tramper, J. Basic Bioreactor Design; 1st ed.; CRC Press: New York, 1991.
- Watcharasing, S.; Kongkowit, W.; Chavadej, S. Motor Oil Removal from Water by Continuous Froth Flotation Using Extended Surfactant: Effects of Air Bubble Parameters and Surfactant Concentration. Sep Purif Technol 2009, 70, 179–189. [Google Scholar] [CrossRef]
- Li, X.; Gao, Y.; Li, M.; Jiang, H.; Xie, J.; Xiang, G. Comparison and Mechanism Analysis of Three-Phase Contact Formation onto Hydrophilic/Hydrophobic Mineral Surfaces in the Presence of Cationic/Anionic Surfactants during Flotation Process. Minerals 2022, 12. [Google Scholar] [CrossRef]
- Moraveji, M.K.; Pasand, M.M.; Davarnejad, R.; Chisti, Y. Effects of Surfactants on Hydrodynamics and Mass Transfer in a Split-Cylinder Airlift Reactor. Canadian Journal of Chemical Engineering 2012, 90, 93–99. [Google Scholar] [CrossRef]
- Mcclure, D.D.; Deligny, J.; Kavanagh, J.M.; Fletcher, D.F.; Barton, G.W. Impact of Surfactant Chemistry on Bubble Column Systems. Chem Eng Technol 2014, 37, 652–658. [Google Scholar] [CrossRef]
- Lebrun, G.; Xu, F.; Le Men, C.; Hébrard, G.; Dietrich, N. Gas-Liquid Mass Transfer around a Rising Bubble: Combined Effect of Rheology and Surfactant. Fluids 2021, 6. [Google Scholar] [CrossRef]
- Li, S.; Huang, S.; Fan, J. Effect of Surfactants on Gas Holdup in Shear-Thinning Fluids. International Journal of Chemical Engineering 2017, 2017. [Google Scholar] [CrossRef]
- Tomiyama, A.; Kataoka, I.; Zun, I.; Sakaguchi, T. Drag Coefficients of Single Bubbles under Normal and Micro Gravity Conditions. JSME International Journal, Series B: Fluids and Thermal Engineering 1998, 41, 472–479. [Google Scholar] [CrossRef]
- Calderbank, P.H.; Moo-Young, M.B. THE CONTINUOUS PHASE HEAT AND MASS TRANSFER PROPERTIES OF DISPERSIONS. Chem Eng Sci 1961, 16, 36–54. [Google Scholar] [CrossRef]
Figure 1.
(a) Schematic of experimental setup. (b) Image of the bubble column.
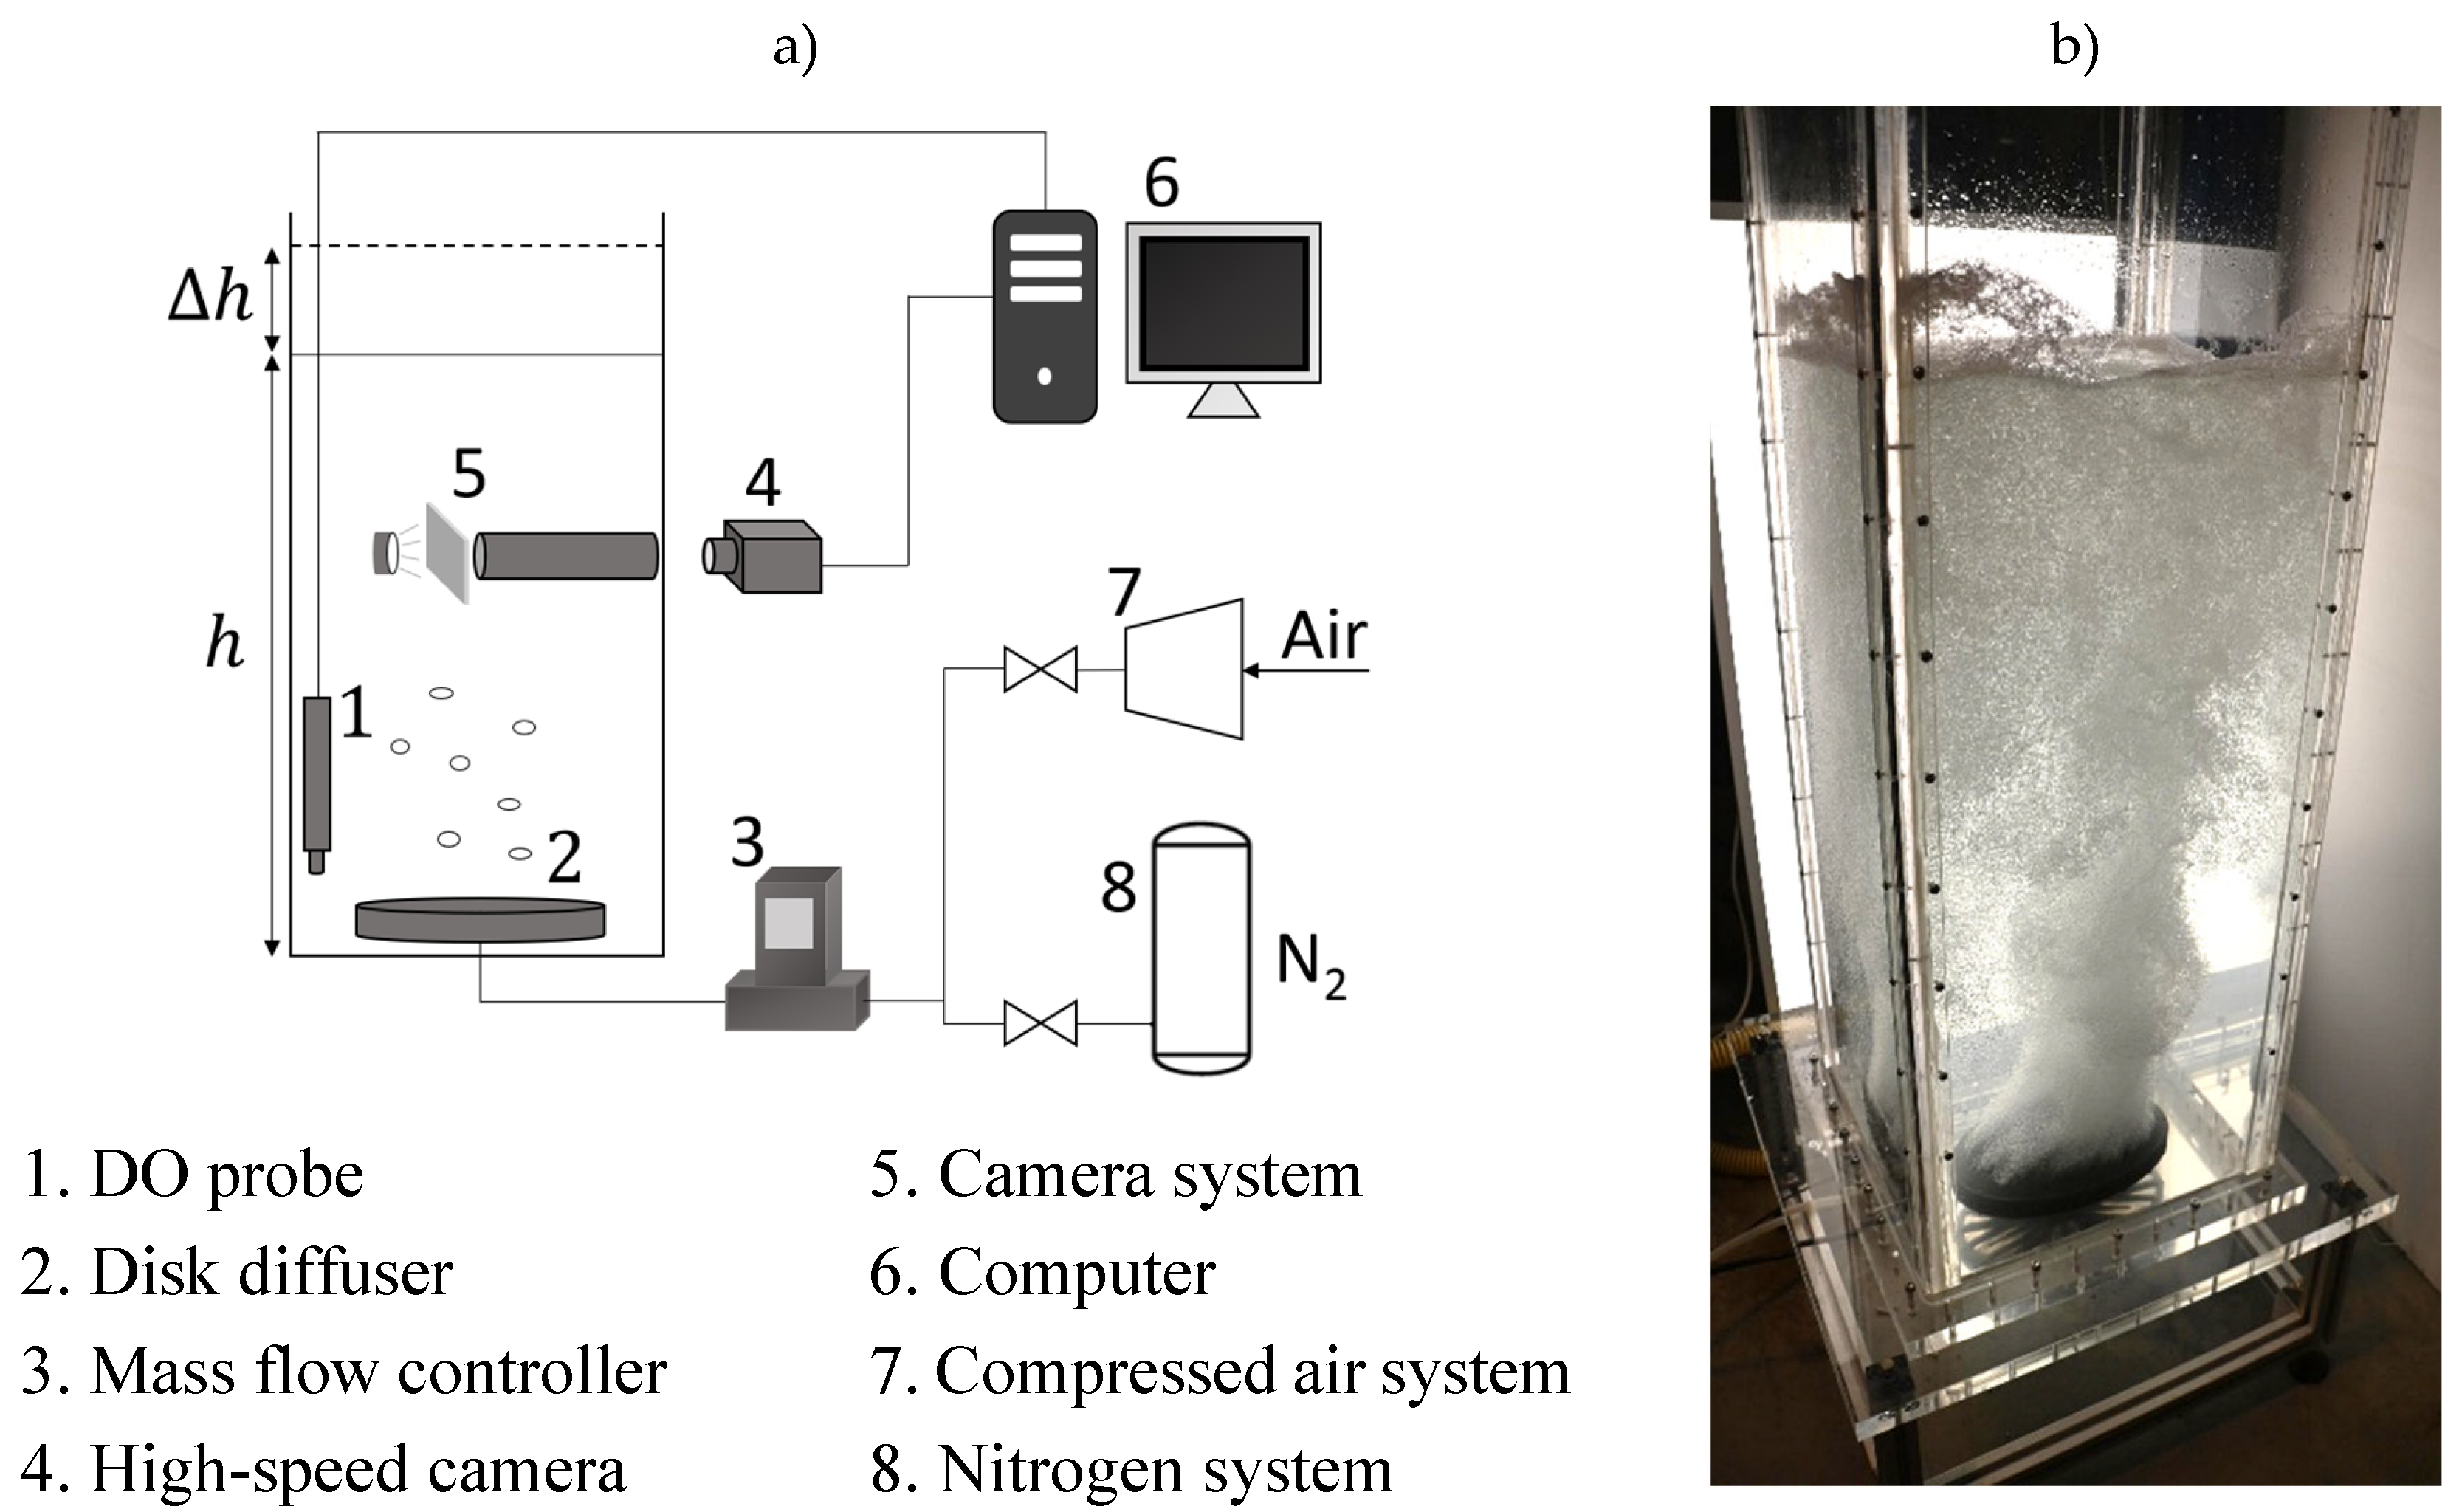
Figure 2.
Example images showing fitted bubbles at 40 LPM and 70 cm above the diffuser membrane for: (a) 8 mg/L SDS and (b) 0 mg/L (clean water).
Figure 2.
Example images showing fitted bubbles at 40 LPM and 70 cm above the diffuser membrane for: (a) 8 mg/L SDS and (b) 0 mg/L (clean water).
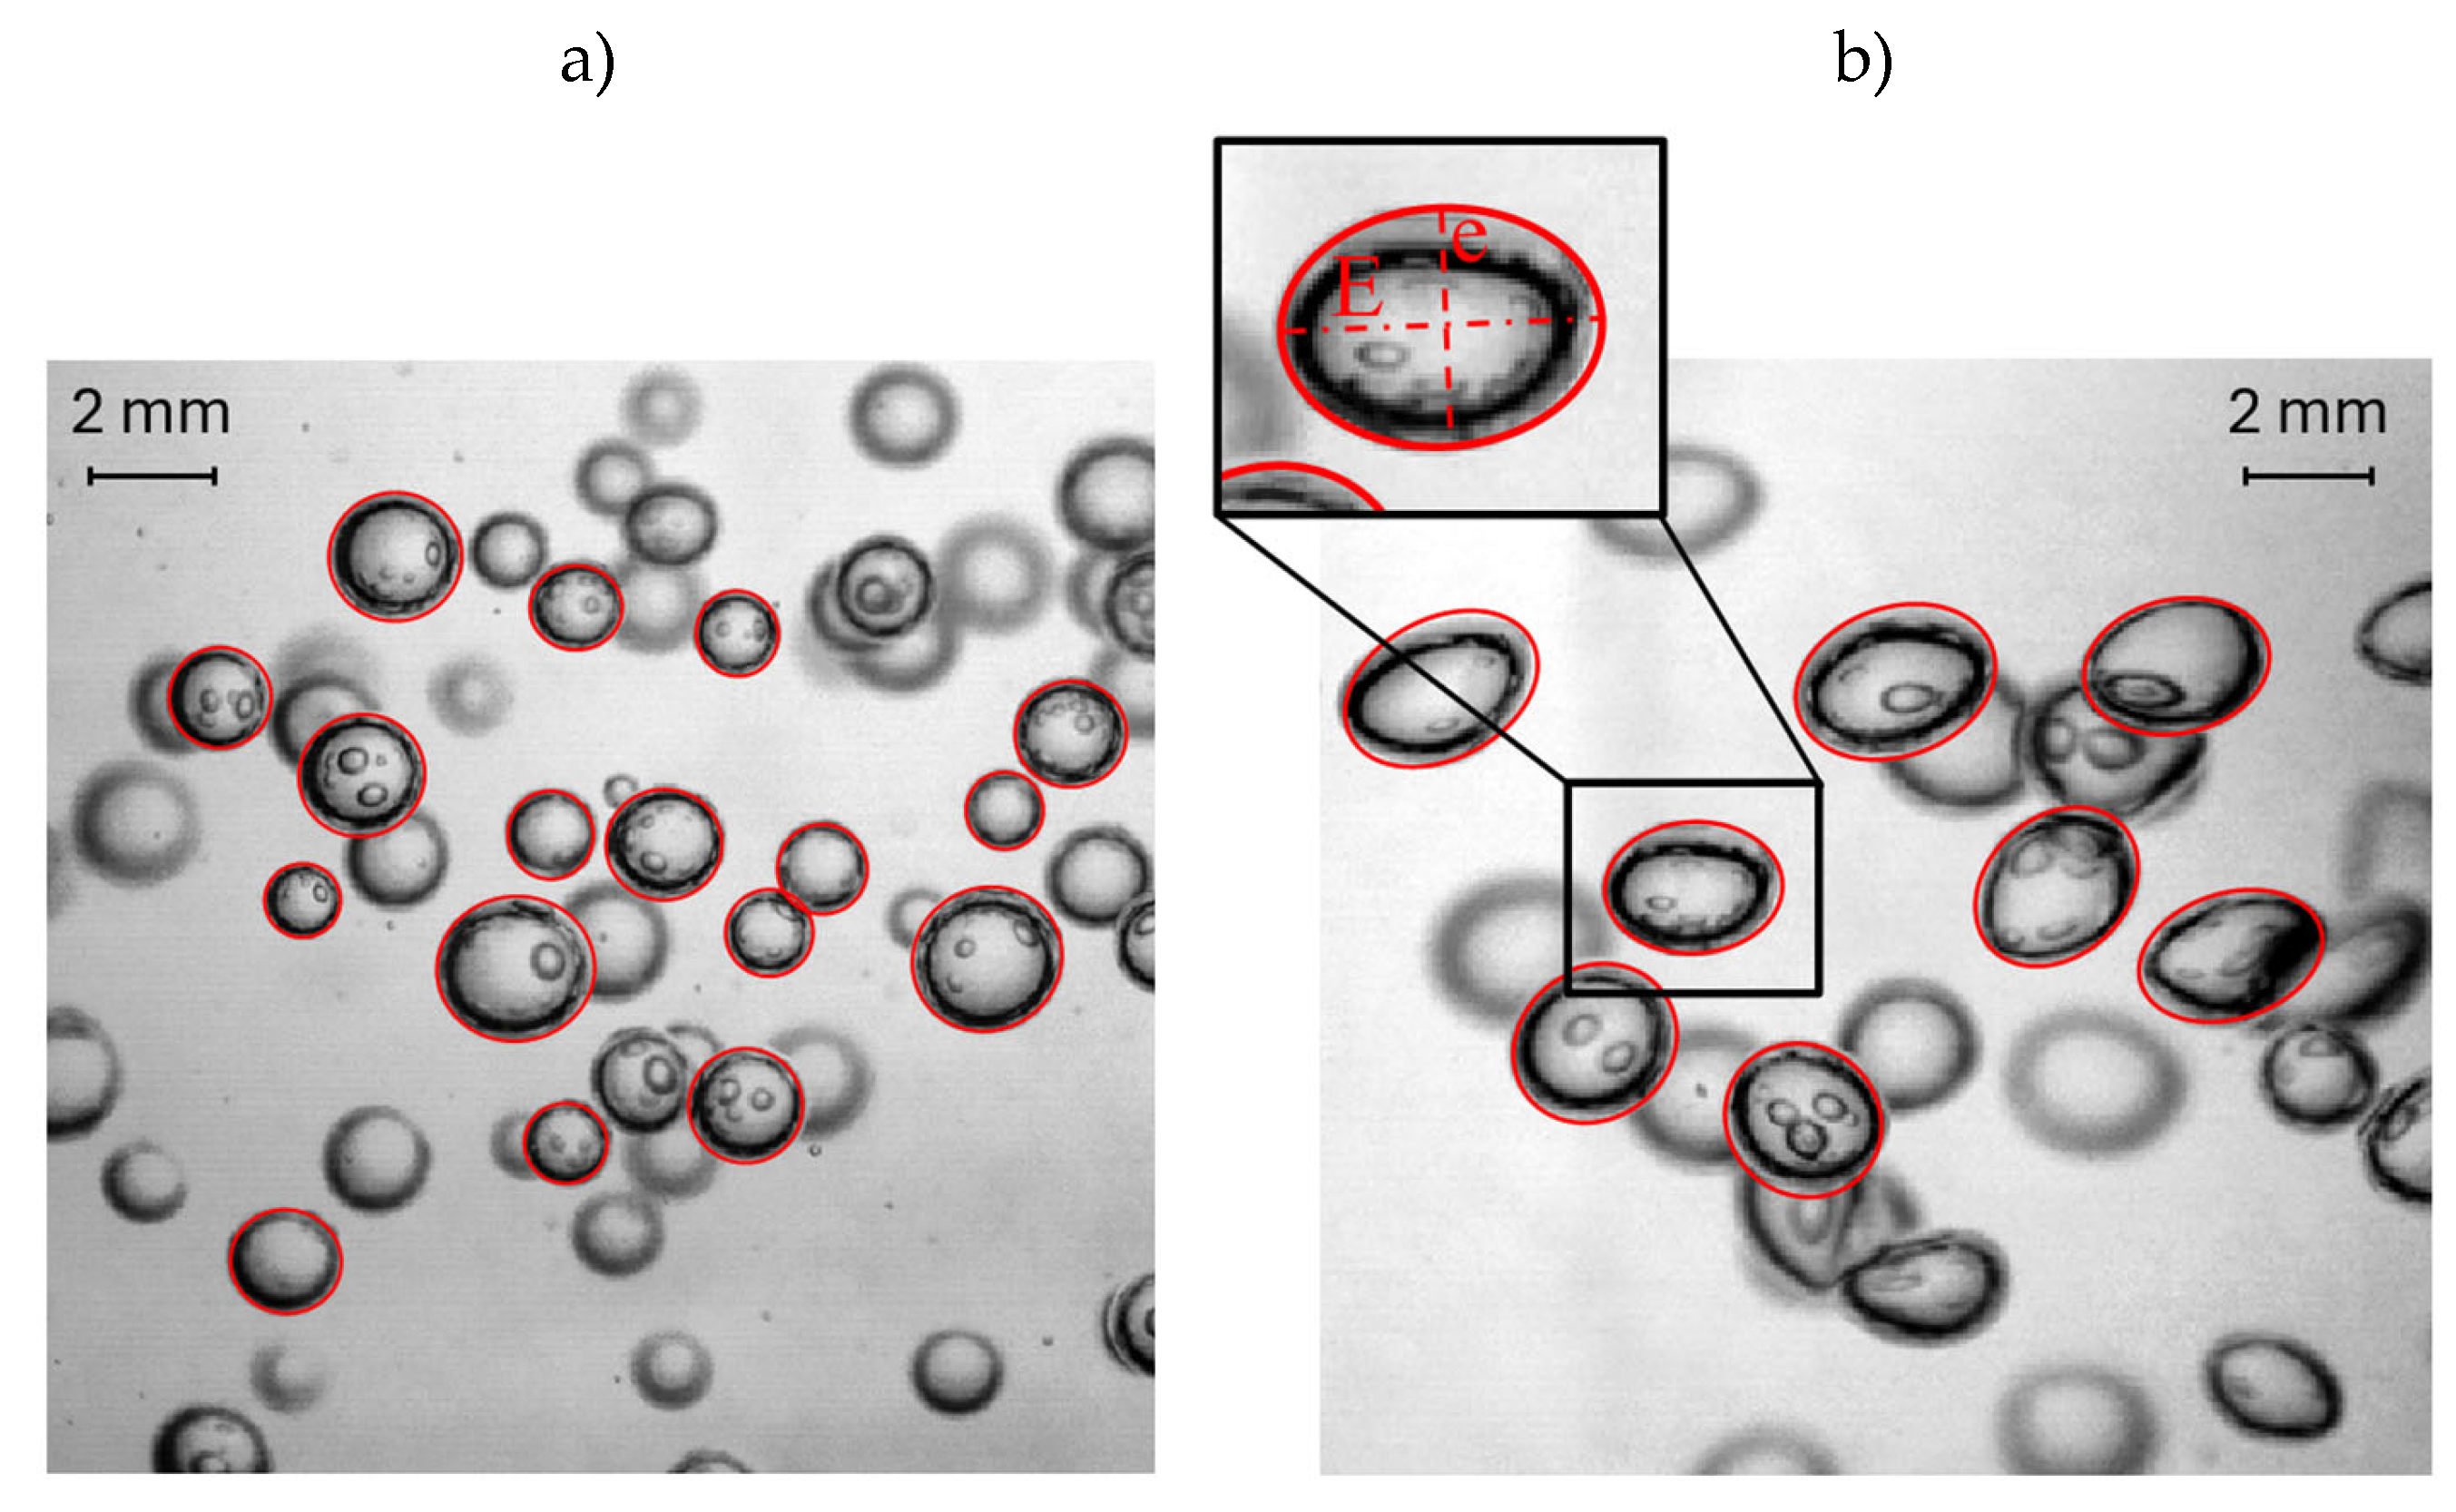
Figure 3.
(a) Example image of interfacial detection using a camera. (b) Variation of interface level with flow rate for clean water.
Figure 3.
(a) Example image of interfacial detection using a camera. (b) Variation of interface level with flow rate for clean water.
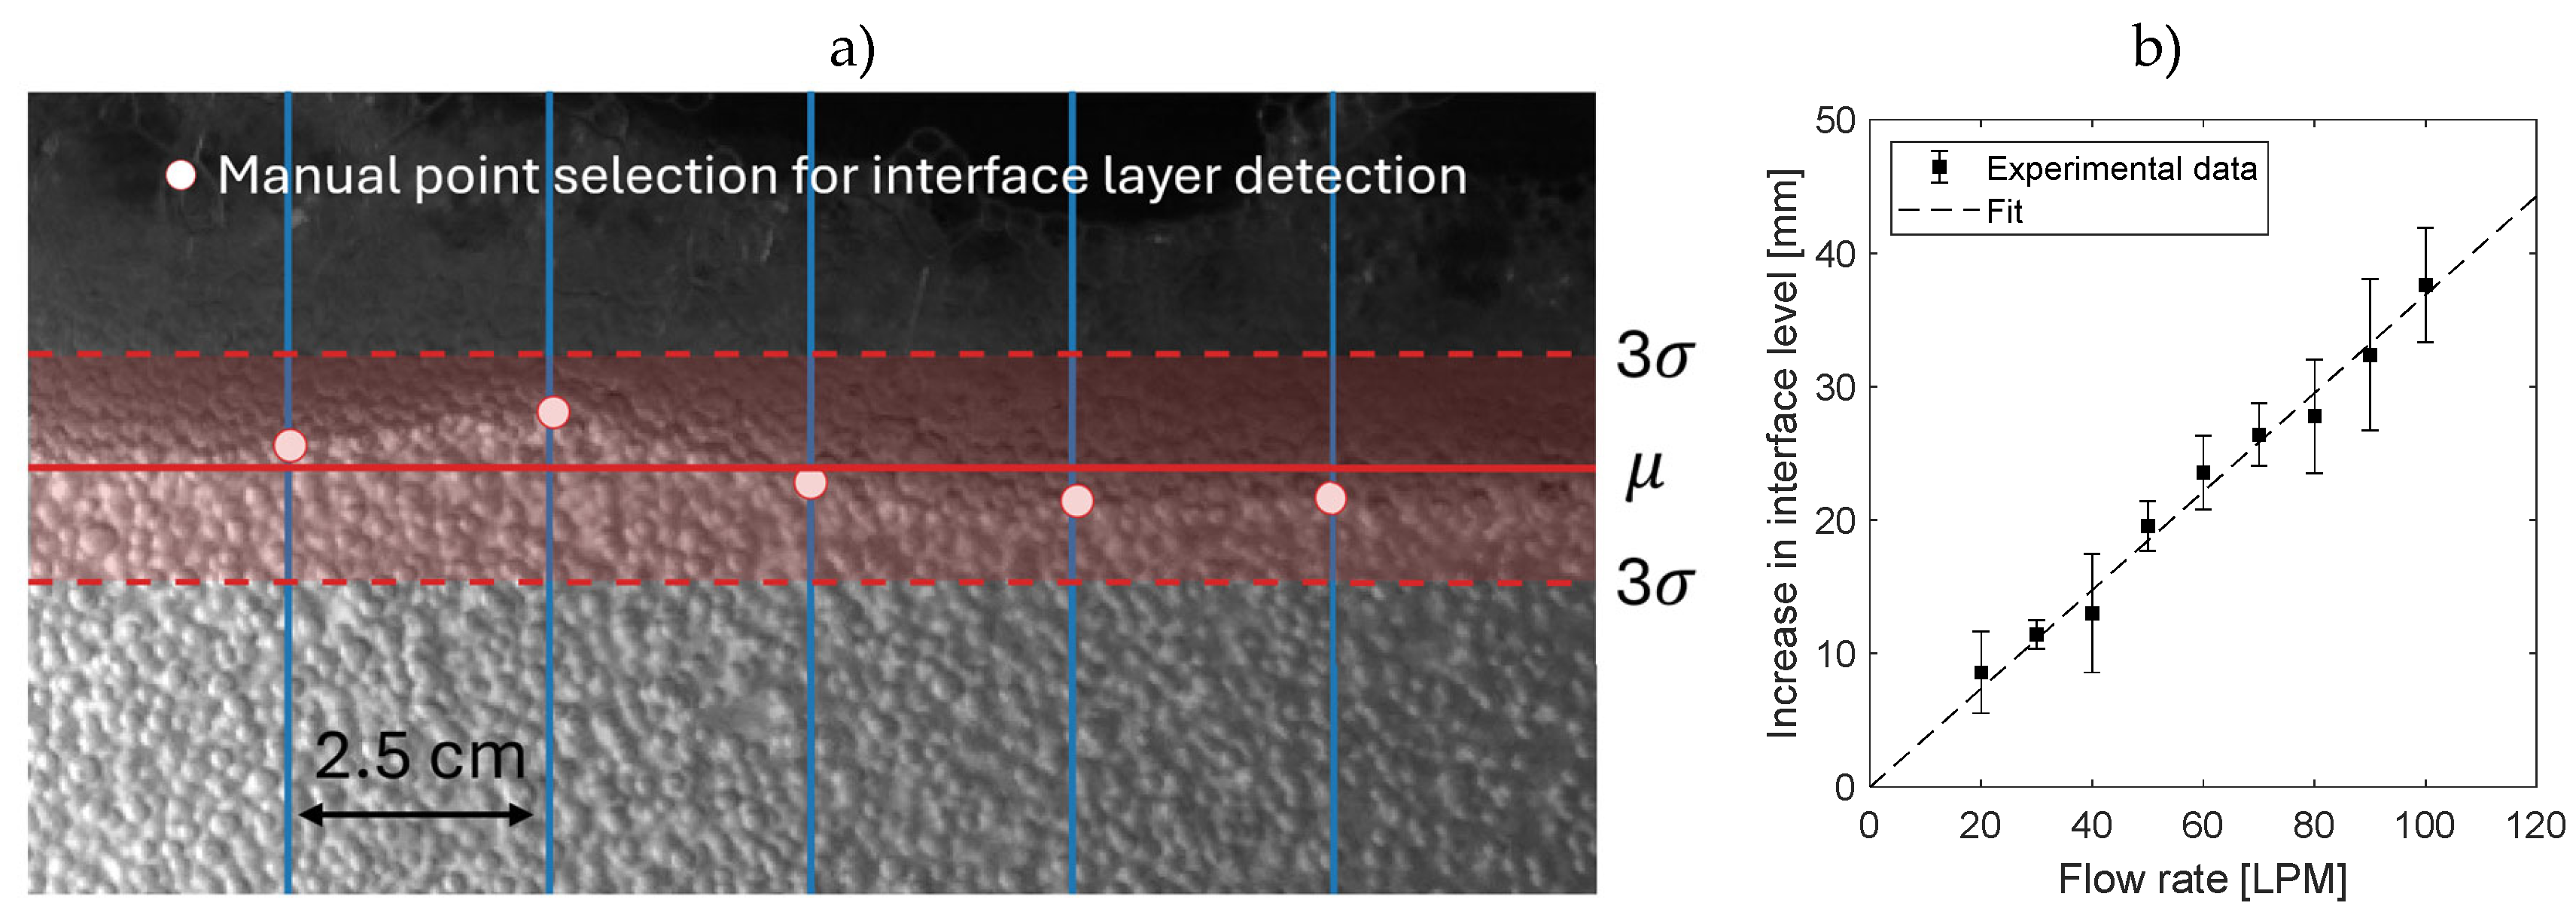
Figure 4.
(a) Volumetric mass transfer coefficient versus flow rate for several SDS concentrations. (b) SOTE versus flow rate for several SDS concentrations.
Figure 4.
(a) Volumetric mass transfer coefficient versus flow rate for several SDS concentrations. (b) SOTE versus flow rate for several SDS concentrations.
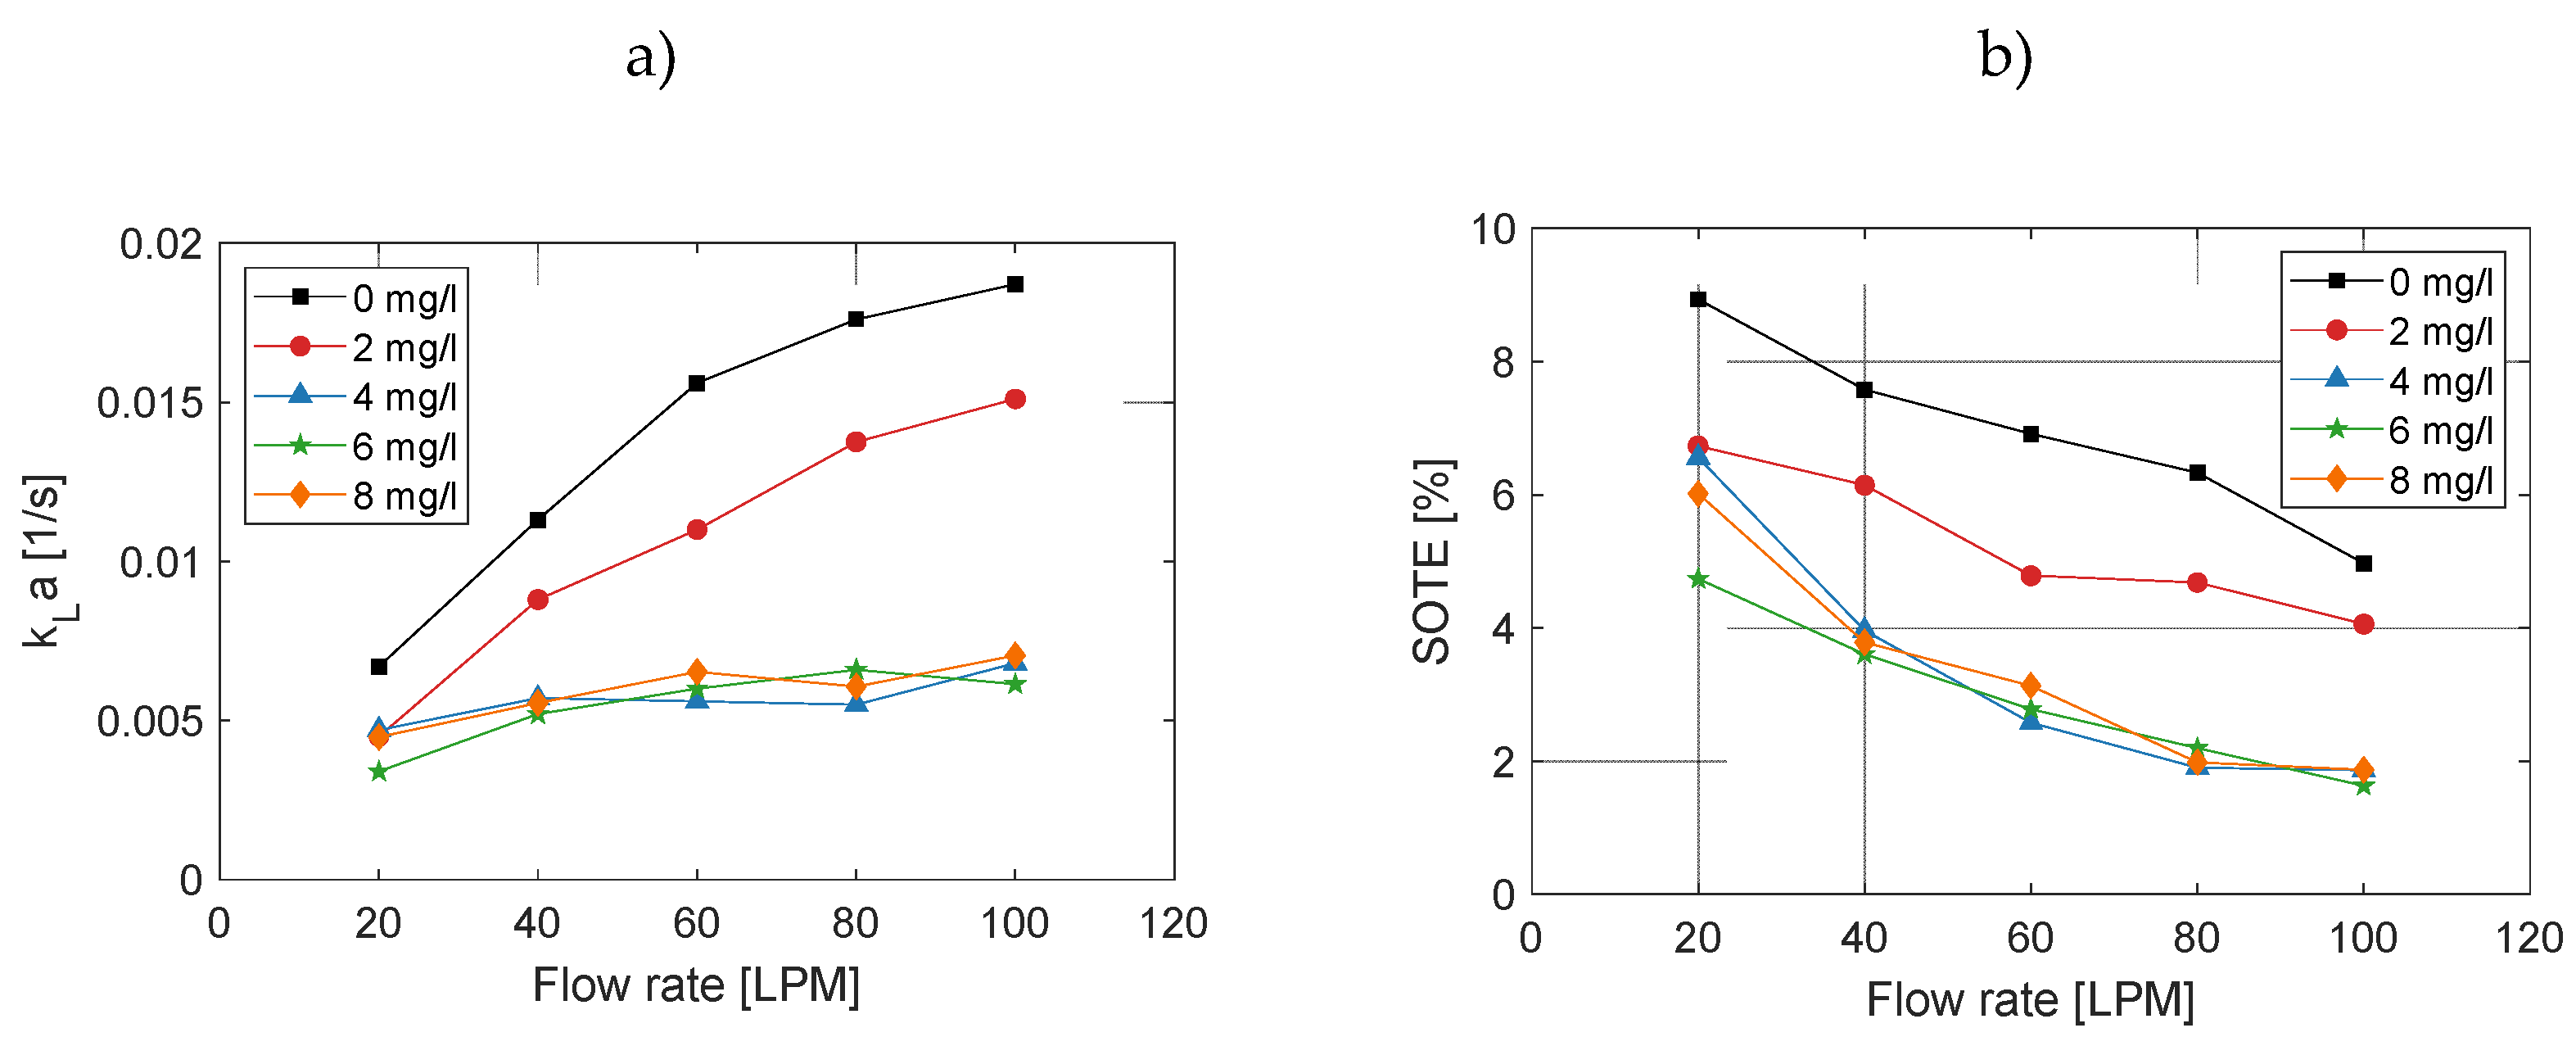
Figure 5.
(a) Average Sauter diameter between 20 cm and 70 cm as a function of flow rate for various SDS concentrations. (b) Average aspect ratio between 20 cm and 70 cm as a function of flow rate for various SDS concentrations.
Figure 5.
(a) Average Sauter diameter between 20 cm and 70 cm as a function of flow rate for various SDS concentrations. (b) Average aspect ratio between 20 cm and 70 cm as a function of flow rate for various SDS concentrations.
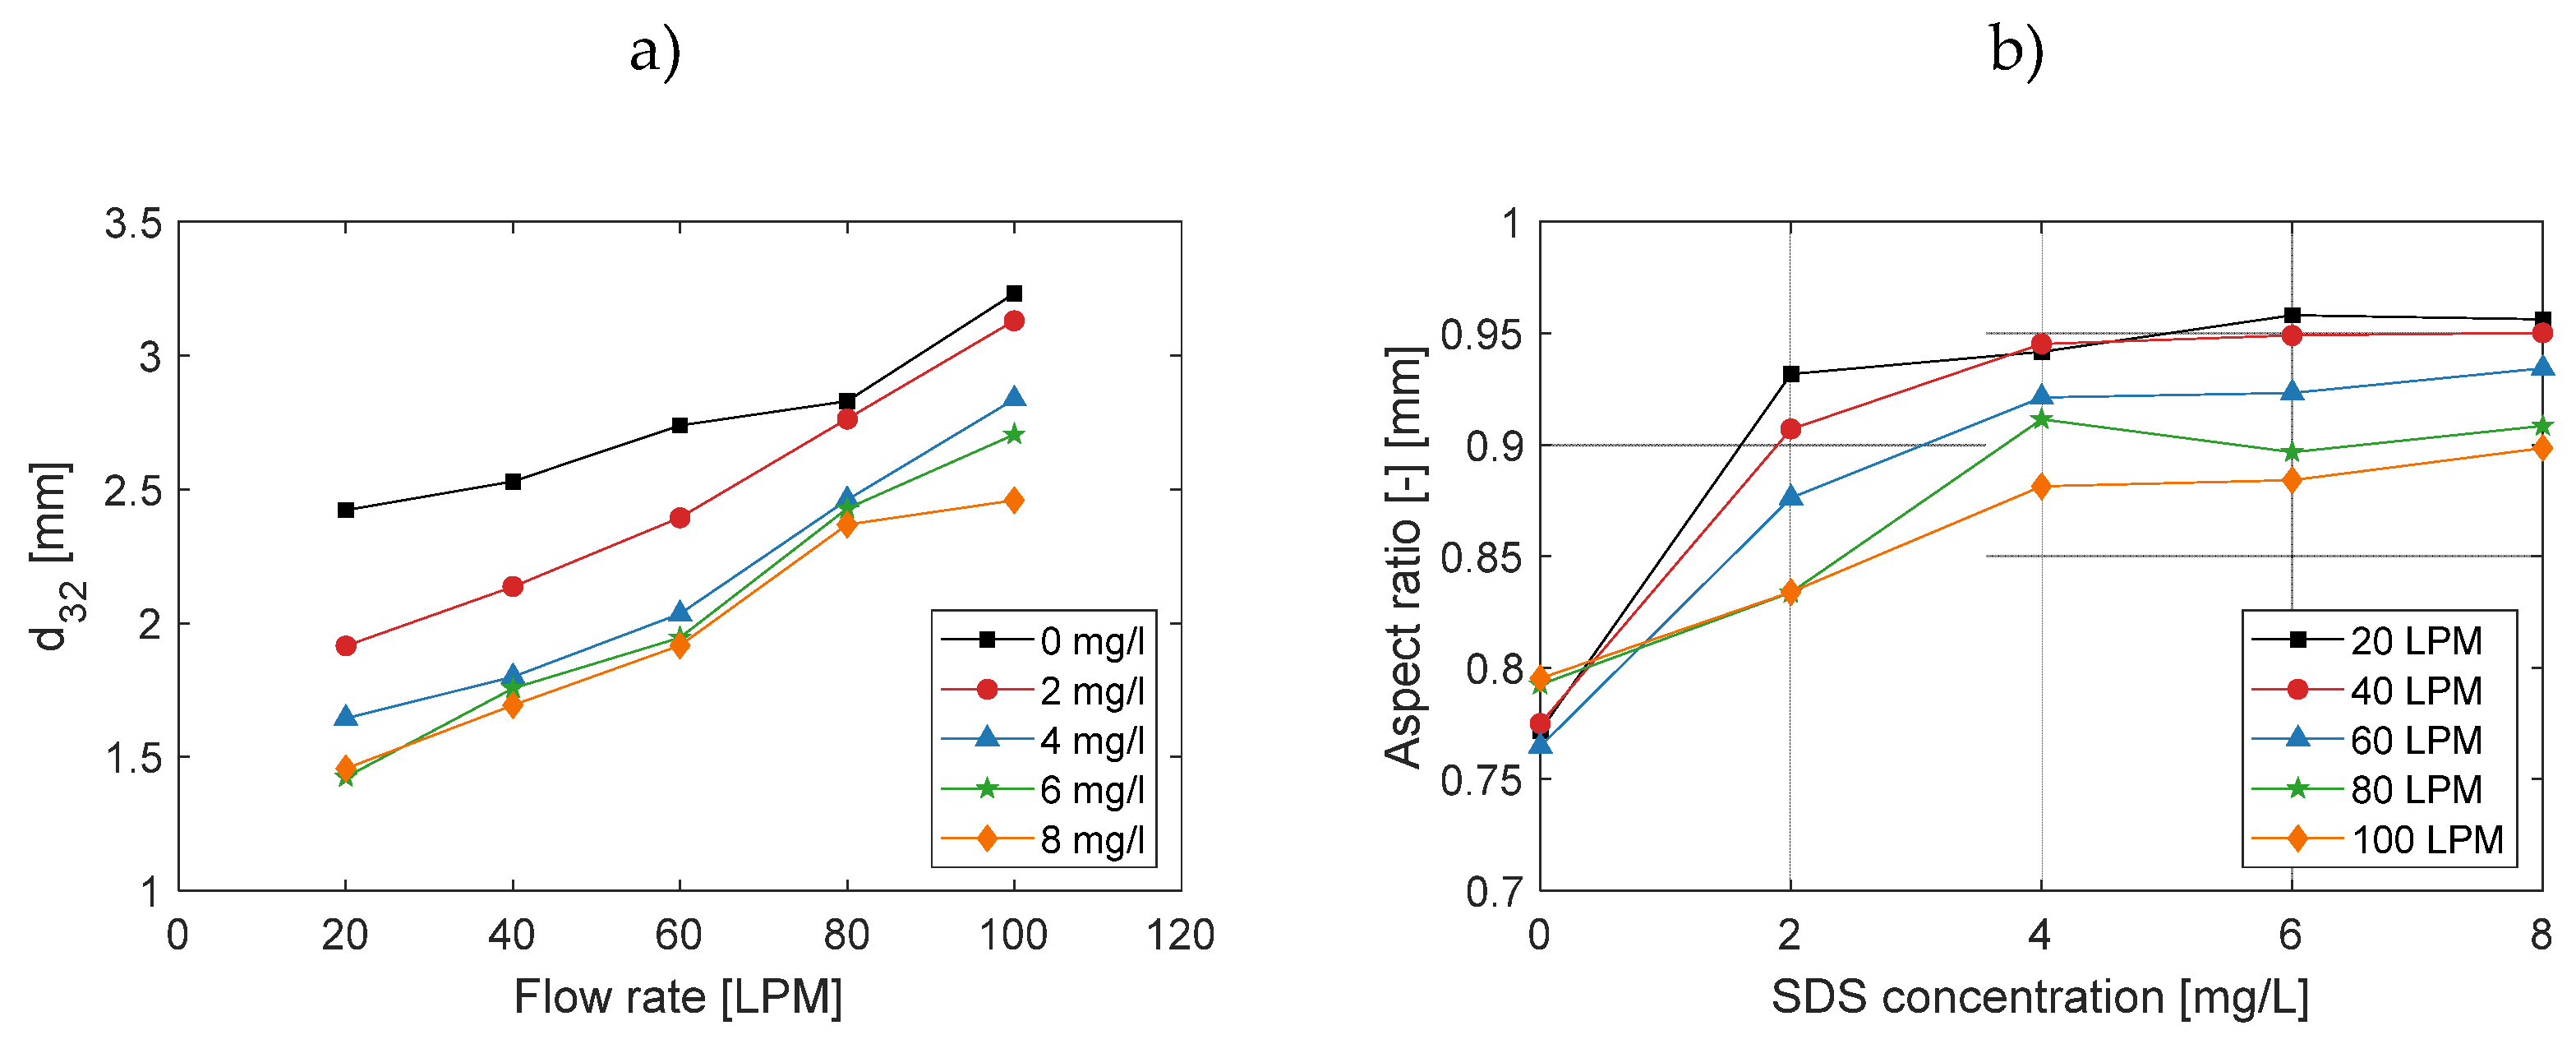
Figure 6.
Bubble size distribution (BDS) for different flow rates and SDS concentrations for two different distances from the diffuser membrane (20 and 70 cm).
Figure 6.
Bubble size distribution (BDS) for different flow rates and SDS concentrations for two different distances from the diffuser membrane (20 and 70 cm).
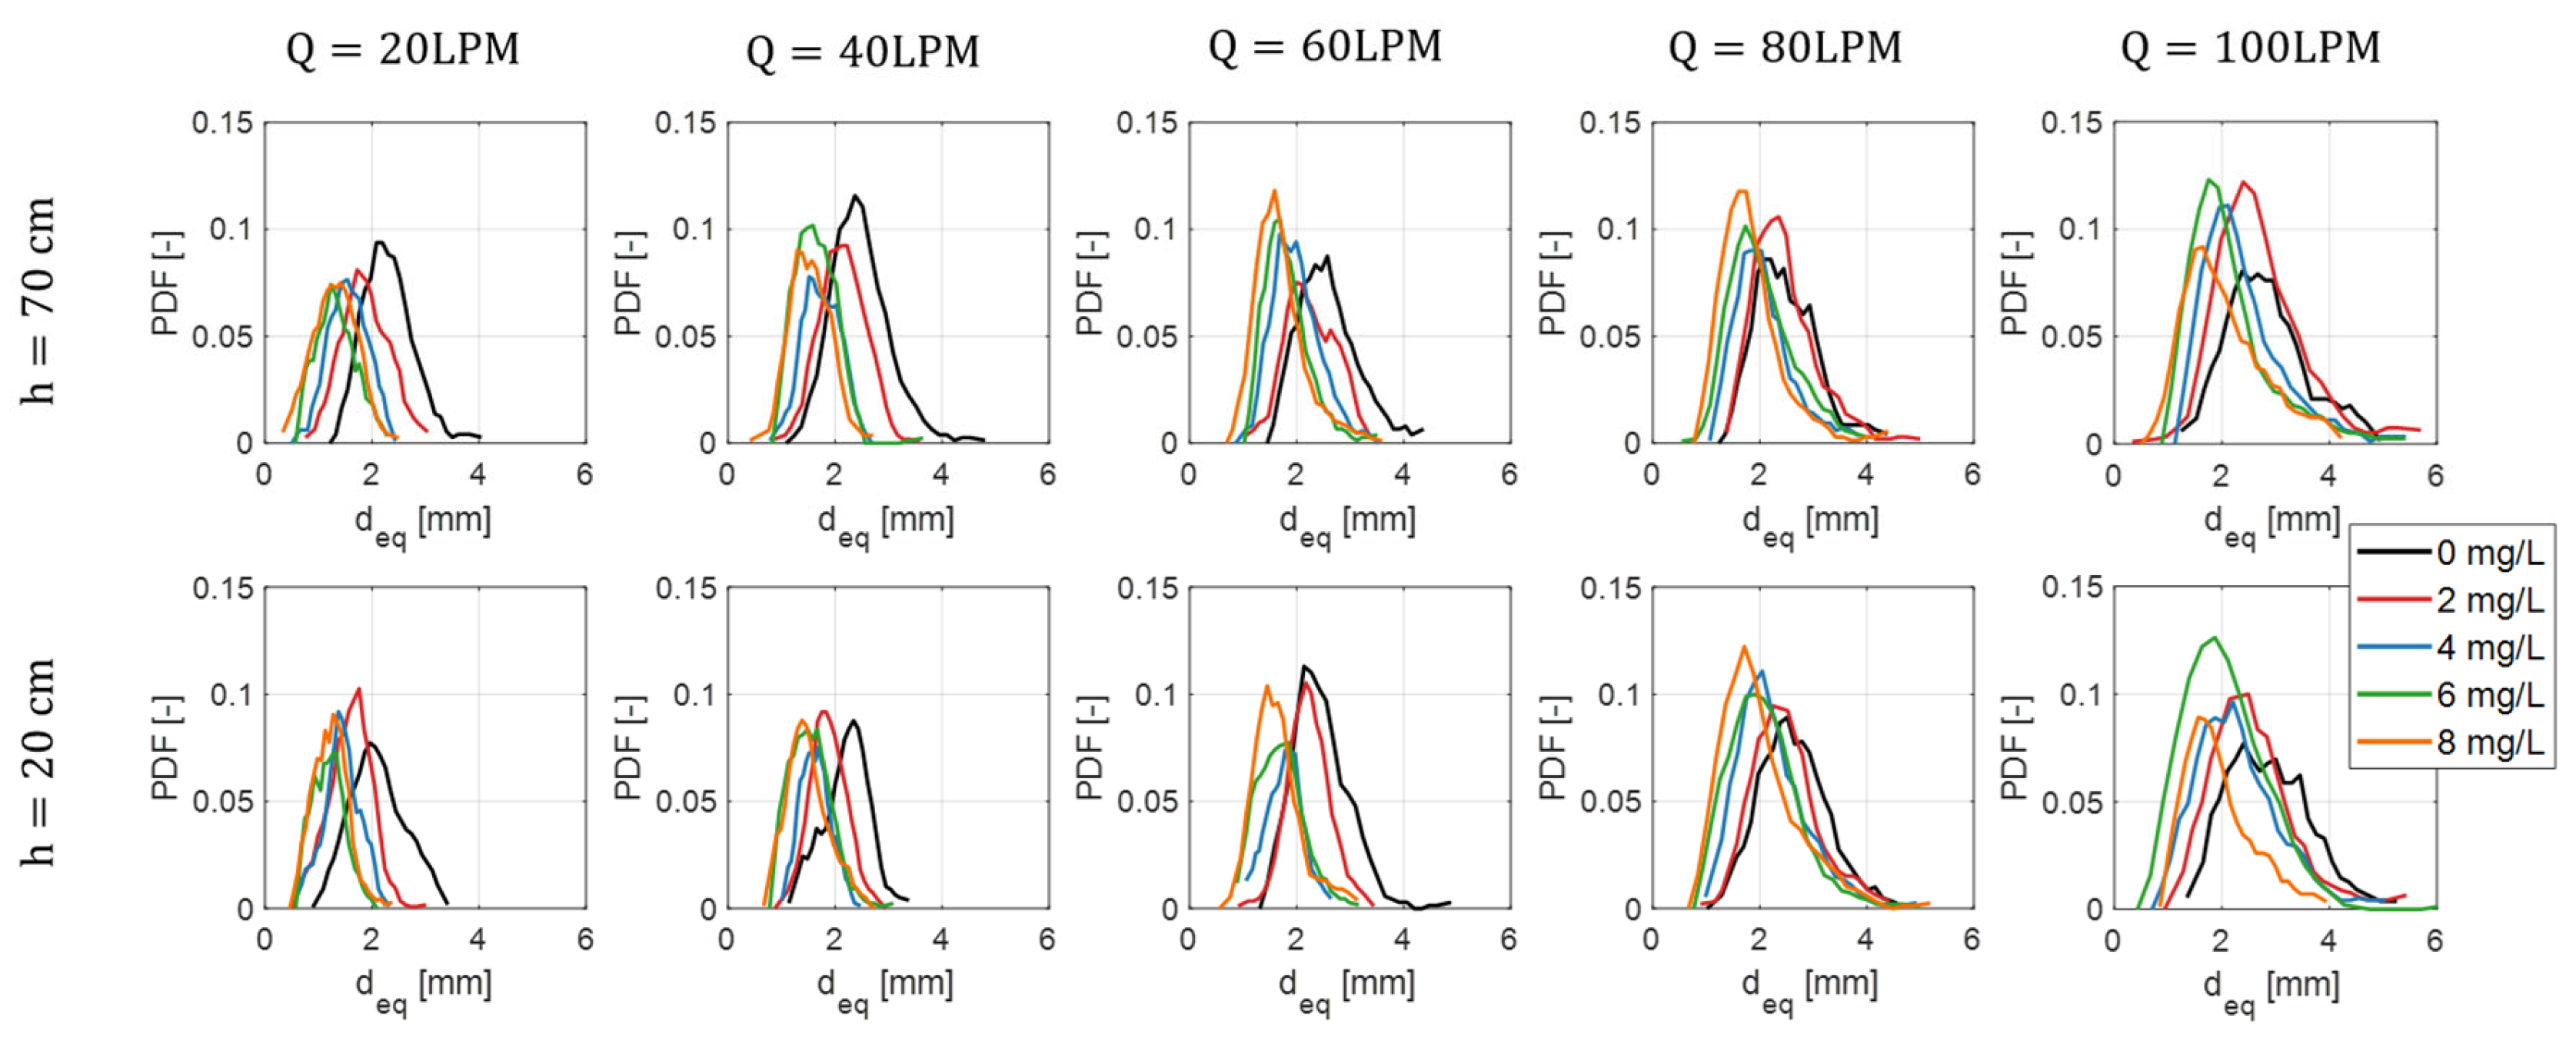
Figure 7.
(a) Variation of gas holdup with flow rate for 0 and 8 mg/L of surfactant. (b) Predicted and experimental gas holdup for all flow rates and surfactant concentrations using Equation (8).
Figure 7.
(a) Variation of gas holdup with flow rate for 0 and 8 mg/L of surfactant. (b) Predicted and experimental gas holdup for all flow rates and surfactant concentrations using Equation (8).
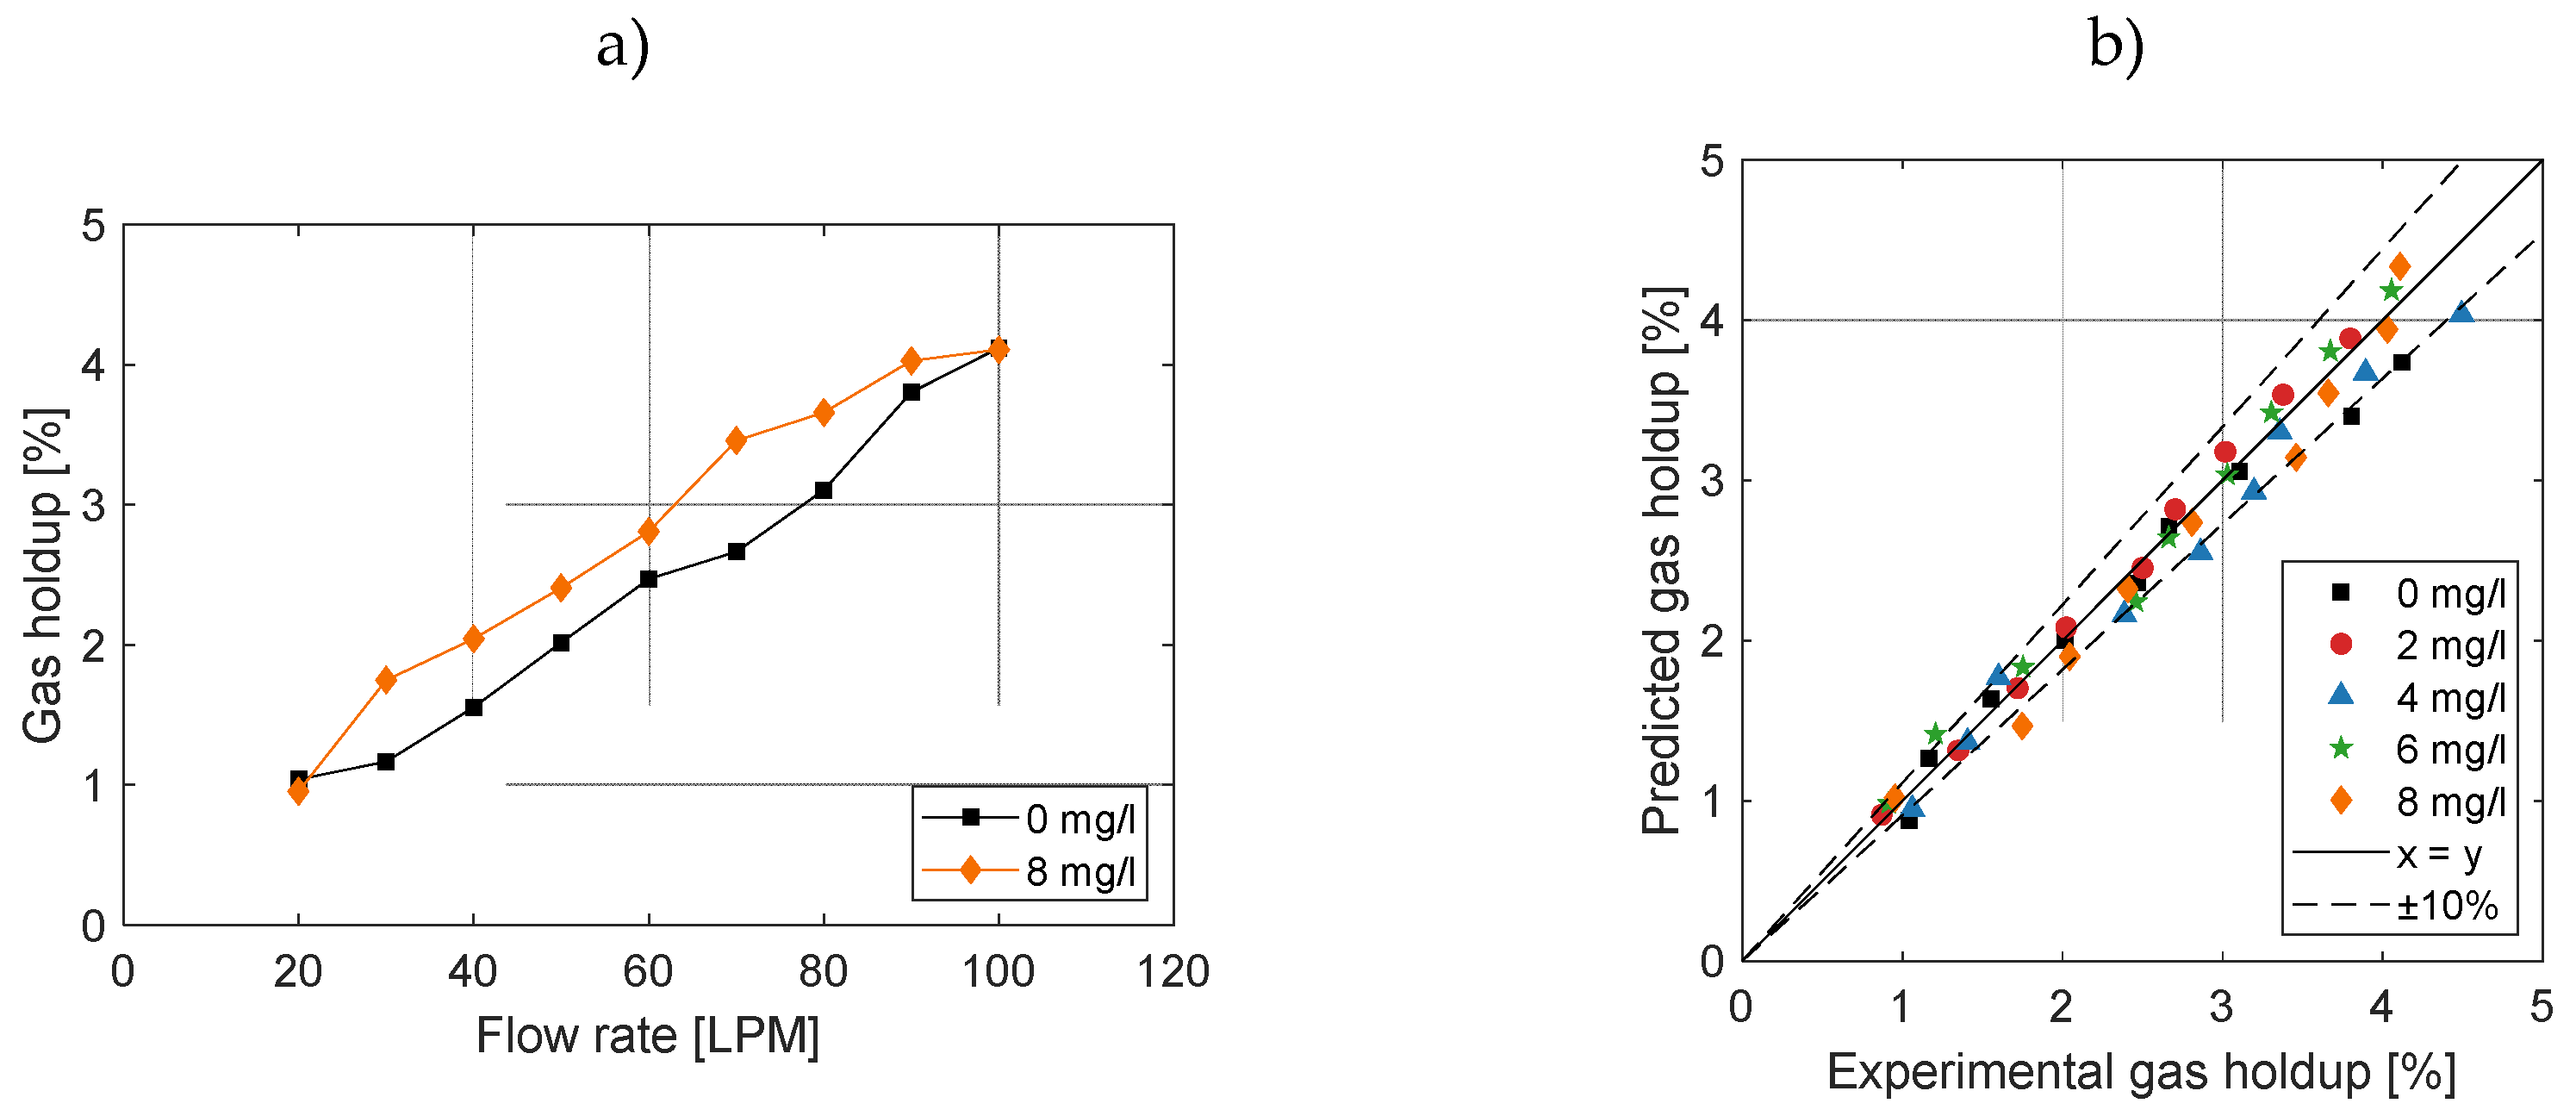
Figure 8.
(a) Interfacial area concentration versus flow rate for several SDS concentration; (b) Mass transfer coefficient versus SDS concentrations for several flow rates.
Figure 8.
(a) Interfacial area concentration versus flow rate for several SDS concentration; (b) Mass transfer coefficient versus SDS concentrations for several flow rates.
Disclaimer/Publisher’s Note: The statements, opinions and data contained in all publications are solely those of the individual author(s) and contributor(s) and not of MDPI and/or the editor(s). MDPI and/or the editor(s) disclaim responsibility for any injury to people or property resulting from any ideas, methods, instructions or products referred to in the content. |
© 2025 by the authors. Licensee MDPI, Basel, Switzerland. This article is an open access article distributed under the terms and conditions of the Creative Commons Attribution (CC BY) license (http://creativecommons.org/licenses/by/4.0/).
Copyright: This open access article is published under a Creative Commons CC BY 4.0 license, which permit the free download, distribution, and reuse, provided that the author and preprint are cited in any reuse.


