

Submitted:
13 November 2025
Posted:
13 November 2025
You are already at the latest version
Abstract
The governance of digital platforms is a key factor in the sustainable business development. Nevertheless, the specific governance mechanisms through which platforms reconfigure virtual (e-commerce) and physical (logistics) systems, and whether these outcomes are equitable or sustainable, remain insufficiently examined. This research proposes a novel theoretical framework, Systemic Functional Dependency, to elucidate how platform governance shapes the co-evolution of digital and physical activities in the platform economy. In our analysis of China’s platform economy from 2013 to 2022, we identify a governance-induced bifurcation: Core regions build sustainable, synergistic business models (local e-com coef. =0.204, p< 0.05). In contrast, peripheral regions face structural decoupling; where digital-led growth (22.63% CAGR) vastly outpaces the expansion of physical business capacity (6.46% CAGR). This imbalance, caused by a functional transition (32.21% CAGR in network-serving logistics vs. 2.44% in local-serving logistics), led to a structural breakpoint in 2017-2018. The findings advance digital business theory by linking platform governance to asymmetric outcomes. We conclude this creates a functional lock-in for peripheral regions, presenting a substantial sustainability challenge and underscoring the immediate necessity for innovative governance frameworks.
Keywords:
digital platform governance
; systemic functional dependency
; digital sustainability
; E-Commerce
1. Introduction
Digital platforms, as powerful technological architectures, inherently promote spatial homogenization. By lowering the costs of information and transactions [1,2], they are theoretically designed to facilitate the emergence of a spatial flatness [3]. This is thought of as a symmetric force because it tries to make the market fair and reduce differences in space. People think that this symmetric force will help regions' economies come together. In theory, platforms can help people in remote areas connect with more customers and suppliers by breaking down traditional geographic barriers. This should cause more trade and investment between different areas [4].
This theoretical promise, however, is very different from what actually happens, where spatial asymmetry is still present. This is because of historical path dependency, which has shaped and solidified the structure. The layout of the global economy, especially in continental economies like China, is not the same everywhere. Instead, it has a very different core-periphery structure, with most of the core regions on the east coast [5]. This creates a fundamental paradox: Why does a symmetric force, designed to foster uniformity, lead to two notably strengthened asymmetric evolutionary trajectories instead of systemic convergence when implemented in a distinctly asymmetric economic system [6,7]? This paradox exemplifies the persistent academic discourse concerning the platform economy's role in either fostering regional equilibrium or intensifying spatial polarization.
To systematically examine this macro-level paradox, our research concentrates its analytical focus on a fundamental system that clearly illustrates these underlying mechanisms. The most obvious example of this paradox is how e-commerce, a virtual system that works with almost no spatial friction, and logistics, a physical system that is very limited by geography, have both changed over time. This is the point where the virtual logic of the platform economy meets, interacts with, and changes the real world the most. The literature has conclusively demonstrated a substantial positive correlation between e-commerce and logistics [8].
Nevertheless, the existing literature primarily functions at the national level, frequently employing a reductive presumption of regional uniformity. This viewpoint predominantly neglects two essential components. The first is spatial heterogeneity, which looks at whether this coupling relationship shows systemic differences between core and peripheral regions based on their starting conditions. The second is the dynamic evolutionary perspective: whether peripheral regions, after being connected to the national digital network, follow a complicated, multi-stage, nonlinear path of evolution.
This leads to a more detailed and complicated scientific question: how does platform governance affect the spatial bifurcation of this core virtual-physical coupled system that is always changing? Recent scholarly investigations have characterized platforms as entities of algorithmic governance that can alter economic activities [9]. We contend that the primary mechanism driving this spatial reconfiguration is the emergence of asymmetric frictions, characterized by the substantial tension between the nearly frictionless nature of virtual transactions and the consistently high-friction attributes of physical logistics. It is still unclear how this specific mechanism interacts with regional initial conditions (i.e., path dependency) to bring about this evolutionary path bifurcation. Our preliminary observations indicate a notable divergence: the e-commerce-logistics system in core regions appears to evolve into a self-reinforcing, synergistic regional network, whereas peripheral regions undergo a more complex decoupling-transition process. The apparent bifurcation directs us to the principal research question that this study aims to investigate.
This research presents several significant contributions:
(1) We develop and validate systemic functional dependency, an innovative theoretical framework to characterize a contemporary core-periphery relationship in the digital age, mediated by algorithms and data flows. To clarify its formation process, we propose and evaluate a decoupling-recoupling dynamic analytical framework. Moreover, we contend that platform-endogenous asymmetric frictions constitute the primary mechanism instigating symmetry breaking and resulting in path bifurcation.
(2) We devise and employ a new triangulation empirical strategy that gives us a logically sound way to find the nonlinear evolutionary paths of complex systems. This strategy empirically elucidates two distinctly divergent evolutionary end-states: the endogenous synergistic regional network in the eastern core regions and the exogenous functional service node in the central and western peripheral regions.
(3) The results of this study provide significant insights for mitigating regional developmental disparities in the digital era. The study highlights the risk of functional lock-in in peripheral areas. We therefore propose that policy priorities should shift from solely pursuing connectivity to enabling value capture, thereby creating new strategic avenues for sustainable regional development.
The rest of this paper is organized as follows: Section 2 reviews the relevant literature and delineates the essential theoretical framework of the study. Section 3 details the research design and methods. Section 4 presents the empirical results and analysis. Section 5 discusses the theoretical implications of our empirical findings. The paper ends with a summary and a look ahead to future research in Section 6.
2. Literature Review and Theoretical Framework
2.1. Literature Review
2.1.1. Core-Periphery Structure Pattern
Classical economic geography, especially the New Economic Geography (NEG) framework proposed by Krugman, provides a solid basis for comprehending the causes of regional economic inequality. The main way this works is through positive feedback: a region (the core) that gets even a small initial advantage attracts more and more capital, labor, and businesses because of economies of scale and agglomeration. This concentration, in turn, makes it easier for knowledge and technology to spread, which encourages new ideas and makes the area even more competitive [10]. This virtuous cycle, in which investments in infrastructure, labor, and technology lead to better industrial structures, more innovation, and lower operational costs, leads to higher productivity [10]. This makes a self-reinforcing cycle of cumulative advantage. This is how the eastern coastal areas of China, which are the country's core, have been able to stay rich for a long time.
Path Dependency theory explains why this arrangement is so stable. This theory posits that once a system embarks on a particular developmental trajectory, it often becomes entrenched due to substantial investments, established industrial ecosystems, and institutional inertia. For instance, it was very hard to make Chile's infrastructure sector more sustainable because of path dependency and institutional entrenchment [11]. Because of this, high switching costs can keep the system on its original path, even if better options come along later [12].
The core-periphery structure can be found in more than one place. Instead, it is a very stable system that is first driven by positive feedback loops and then made stronger by the way institutions work. This established order can withstand shocks from outside. [13]. This information sets the stage for our next analysis, which looks at the platform economy as a new outside force that can change this long-standing system.
2.1.2. Spatial Effect of Platform Economy
Recent academic studies have recognized digital platforms as pivotal space-shaping actors [9]. This perspective characterizes them not as neutral technical conduits, but as dynamic entities that organize and transform economic geography. There is still a debate about what their final spatial effects will be: Do platforms help make things fairer, or do they make things worse by making new inequalities and spatial polarization worse? Some studies show that platforms make it easier and cheaper to get information and do business. This opens up new market opportunities for places that are on the edge of the market. [1,2]. On the other hand, some studies say that platforms tend to give value and power to a small number of important nodes, which could make the gap between regions even bigger [14]. There are some things about the platform economy that make it easier for big platform companies to grow quickly and take over the market. These include economies of scale and network effects [9].
To clarify this discussion, this study contends that the role of platforms transcends mere shapers. From a systems perspective, they are more precisely characterized as external coordinators capable of altering a system's internal rules of connection and cost structures. Their main way of working is to add asymmetric frictions to the system:
For e-commerce (the online system): Platforms use their technological architecture (like unified online marketplaces and seamless mobile payments) to make it almost free for people to connect with goods all over the country [1,2].
In the physical realm of logistics, Smart logistics systems that run on platforms have made things more efficient and improved supply chain management [15]. However, physical distance [16], transport infrastructure [17], and network density [18] still make it very hard to move, store, and deliver packages. Because of this, their spatial friction (i.e., transport costs) stays very high.
The most important thing about this platform-based external intervention is the big difference between the near-frictionless virtual layer and the persistently high-friction physical layer. It is the main reason why the whole regional economy is changing.
2.1.3. The Relationship Between E-Commerce and Logistics
It is necessary for the platform economy to change its spatial layout that e-commerce and logistics work together. The literature predominantly confirms a significant positive correlation, suggesting that the advancement of e-commerce stimulates the growth of logistics [8]. Nonetheless, contemporary research has primarily perceived this relationship as a concept with unexamined internal mechanisms, leading to three notable research gaps:
A lack of spatial heterogeneity: The current literature predominantly operates at the national level, treating the regional economy as a monolithic entity. This approach does not consider the deeply entrenched core-periphery structure previously analyzed [19]. Consequently, the investigation into whether this coupling relationship exhibits systematically distinct characteristics in core versus peripheral regions—dependent on their specific initial conditions—remains a substantial empirical gap.
A lack of dynamic evolutionary perspective: Most analyses use static or linear frameworks [20,21]. It is unlikely that adding peripheral areas to the national digital network will be a simple, one-step process. It is probably a complicated, multi-step, non-linear process of evolution. The existing literature has infrequently investigated whether the system undergoes a dynamic process, potentially shifting from disequilibrium to reorganization. [22].
An absence of mechanistic elucidation: Present research frequently remains limited to econometric causality tests [23]. It typically does not possess a holistic perspective that can elucidate the fundamental mechanisms underlying this spatial differentiation and dynamic evolution.
This paper delineates its research objective by establishing an analytical framework aimed at investigating the internal dynamics of the e-commerce-logistics relationship and systematically addressing the aforementioned three gaps. This endeavor establishes the foundation for the subsequent creation of a dynamic theoretical framework designed to clarify path bifurcation.
2.2. Theoretical Framework and Research Hypotheses
In response to the aforementioned research gaps, this section formulates a dynamic theoretical framework (depicted in Figure 1) to clarify the reasons and mechanisms behind path bifurcation in regional systems. From this framework, we formulate the relevant research hypotheses.
2.2.1. Asymmetric Frictions and Symmetry Breaking
We contend that the solution to the aforementioned inquiries resides in discerning the essential mechanism introduced by the platform economy. We define platform governance as the core mechanism, operating as an algorithmic governance entity that uses algorithmic rules and data-driven feedback loops to exert system-wide control. This control is widely used in advertising, search ranking, product recommendations, and price optimization [23]. The introduction of asymmetric frictions into the system is what makes it unique. The platform's technological architecture makes it almost impossible for transactions and information searches to have spatial friction. At the physical level, though, the cost of moving things around physically (i.e., spatial friction) is still very high. There are many steps in physical transportation, such as warehousing, line-haul, and distribution. Each step has its own costs. Last-mile delivery is the hardest and most expensive part of the logistics chain [24]. Also, returns of products, which are common in e-commerce, add to the costs. Reverse logistics is the process of sending goods back from the customer to the merchant or warehouse. This requires extra transportation and handling costs [25].
When this uniform external intervention, characterized by asymmetric frictions, is applied to an already spatially heterogeneous system, a symmetric equilibrium—in which all regions evolve identically—is inherently unstable. The dynamics of this process can be comprehended through the analytical framework of symmetry breaking. The system's existing core-periphery heterogeneity and the asymmetric frictions that drive it interact in such a way that they push the system toward a new, less symmetric stable state. This is what we call path bifurcation.
2.2.2. The Nonlinear Path of Decoupling-Recoupling
Our theoretical framework posits that regions characterized by disparate initial conditions will become locked-in to two distinctly divergent evolutionary trajectories:
For the central areas (Eastern China): These regions are better able to absorb and benefit from platform-based interventions [26] because they already have a lot of resources, such as a strong economy, advanced infrastructure, and a large pool of talented people. In this case, the platform is more of a catalyst than a disruptor. More merchants are drawn in by the higher number of transactions, which leads to a wider range of products and better service. This ultimately attracts more customers, initiating a virtuous cycle of cumulative advantage [27]. We call this dynamic an endogenous synergistic regional network [28] because it pushes the system towards a higher level of coupling and network synergy.
For the less developed parts of China (Central and Western China), on the other hand, these areas have fewer resources to start with, such as not enough internet access [29], logistics distribution systems that aren't fully developed [30], and rural e-commerce development that is not keeping up [31]. Thus, they cannot handle the sudden increase in demand that the virtual layer's frictionless quality causes. In these places, the friction on the physical layer and the smooth user experience that e-commerce sites want to create are at their highest. This is what we mean by asymmetrical friction [32]. This friction eventually breaks the existing coupling relationship, putting the system in an unstable, transitional state known as structural decoupling. But this state cannot last. The system is changing and adapting because of two things: national strategic initiatives and the growth of the platform network. It eventually becomes a functional service node [33], focusing on certain services and building strong new connections with the higher-tier national network. We call this process network recoupling because it creates a new systemic equilibrium. This final, stable relationship is what this research conceptualizes and validates as systemic functional dependency.
2.2.3. Research Hypotheses
Based on the theoretical deductions above, we translate these predictions into the following three core hypotheses to be empirically tested in this study:
Hypothesis 1a (Eastern Regions: Coupling and Synergy). Based on the ideas of positive feedback and path dependency, we hypothesize that the virtual-physical subsystem in core areas will show strong coupling and intra-regional synergy when the platform intervenes. We anticipate that (i) the advancement of local e-commerce will substantially and favorably propel the expansion of the local logistics sector, and (ii) this trend will be bolstered by significant, positive spatial spillover effects within these core regions.
Hypothesis 1b (Central & Western Regions: Structural Decoupling). Based on the ideas of asymmetric frictions and symmetry breaking, we hypothesize that the virtual-physical subsystem in peripheral areas will show structural decoupling in its early stages of evolution. This will show up as a statistically insignificant or weak positive link between the growth of the local e-commerce scale and the growth of the local logistics industry.
Hypothesis 2 (Central and Western Regions: Functional Transition and Network Re-coupling). Based on the principles of system adaptation and reorganization, we further hypothesize that the decoupled subsystems in peripheral regions will experience a functional transition. This change will turn them into specialized functional service nodes, which will let them network recouple with the higher-level national system. This will be empirically observable in two ways: (i) a functional shift in their logistics operations from servicing local scale to servicing network throughput; and (ii) the emergence of a significant positive correlation between their network function and the overall development of the national e-commerce system in subsequent evolutionary stages.
3. Research Design
3.1. Data Sources and Variable Descriptions
The empirical analysis for this study employs a balanced panel dataset encompassing 30 of mainland China's provinces, autonomous regions, and municipalities, covering the period from 2013 to 2022. (Tibet, Hong Kong, Macau, and Taiwan are not included in the sample due to data unavailability.) This time frame fully captures how China's platform economy has changed over time, from its rapid rise to its deep market penetration. We got most of the data we needed for the macroeconomic, logistics, e-commerce, and control variables from the China Statistical Yearbook, the China Tertiary Industry Statistical Yearbook, and individual provincial statistical yearbooks. We also used public data from the State Post Bureau and the National Bureau of Statistics. To account for inflation, all variables that were measured in nominal monetary values were changed to real values using provincial-level GDP deflators (Base year = 2013).
We built a complete variable system so that we could systematically test the hypotheses put forward in this study. Table 1 gives a full list of the specific definitions, measurement methods, and data sources. The level of digitalization is assessed through a composite evaluation index derived from four dimensions: digital infrastructure, digital innovation, industrial digitalization, and digital industrialization. This indexing method is based on well-known research [34]. Table 2 shows what this index is made up of and what it means.
3.2. Delimitation of System Boundaries
This study divides mainland China into two main subsystems, Eastern and Central/Western, to see if path bifurcation happens with different initial conditions. The Northeast region is part of the Central/Western subsystem. This difference is because it works better as a stand-in for China's long-lasting core-periphery economic structure, which was shaped by historical path dependency. This structure is not only based on geography; it also shows that different systems have different levels of technology, market size, and infrastructure. This is directly connected to the different starting points we talked about in our theoretical framework. The descriptive statistics in Section 4 will empirically validate this partitioning, demonstrating significant statistical differences between the two groups across all key economic variables and confirming their effectiveness as separate subsystems.
Our theoretical framework focusses on macro-regional path bifurcation, a phenomenon most effectively examined and substantiated at the provincial level. As a result, using panel data at the provincial level is the most important analytical framework needed to explain this systemic evolutionary logic. The objective of this research is not to clarify the success or failure of specific urban nodes, but to reveal the inherent disparities in the systemic behavioral patterns of these entire regional systems in response to platform intervention.
3.3. Measurement of Functional Service Transition
This study formulates a measurement strategy to empirically evaluate the principal hypothesis of a functional node transition (H2), focusing on the structural divergence of logistics indicators. This approach aims to ascertain whether peripheral regions (Central and Western China) have experienced a functional role transition—from supporting the local economy to servicing the national network—through a comparative analysis of the growth dynamics of two distinct sets of logistics metrics. These two indicators stand in for two different ways the logistics industry can grow:
(1) Measurement of Network Function: For this dimension, we use Express Delivery Volume as a stand-in variable. This metric was chosen because it accurately measures only the number of packages being sent by e-commerce. So, it is a very accurate measure of how well a region is connected to the national consumption network and how much traffic it can handle [35]. The growth rate of this variable indicates the growth intensity of the network function in the region.
(2) Measurement of Local Function: The local function is represented by freight volume. This metric primarily quantifies the aggregate physical transport of bulk commodities (e.g., coal, steel, agricultural products) utilized in local industrial and agricultural production. Our other proxy shows that the parcel economy driven by e-commerce is very different from this one. It is a strong and traditional sign of how big the local economy is. So, its growth rate shows how well the local function in the area works.
The main idea behind our measurement strategy is that a functional service transition will show up as a big and long-lasting difference between the growth rates of these network- and local-function indicators. In particular, the empirical analysis in Section 4 will examine the concurrent manifestation of two distinct trends in the Central and Western regions: a rapid increase in express delivery volume, contrasted with a relative stagnation in the growth of freight volume. If this structural divergence is confirmed, it would be strong proof that the primary driver of growth of the regional logistics industry has changed from an endogenous, locally-focused model to an exogenous, network-serving one.
3.4. Model Design
To empirically validate the research hypotheses posited in this study, we develop a series of econometric models. Initially, we utilize the Panel Fixed-Effects (FE) Model as our foundational analytical framework. This model is chosen for its ability to efficiently manage time-invariant, province-level individual heterogeneity, including fixed geographical factors or cultural traditions. The fixed-effects approach enables a more accurate identification of the relationships among our core variables by neutralizing these unobserved confounding factors.
The baseline model is specified as follows:
Where and represent province and year, respectively. The dependent variable, , is the natural logarithm of the logistics industry's value-added. The core explanatory variable, , is the natural logarithm of e-commerce transaction value. represents a vector of control variables, including GDP per capita, industrial structure, and the level of digitalization. denotes province-level fixed effects, represents year-level fixed effects, and is the stochastic error term.
Nevertheless, as demonstrated in Section 4.1, the outcomes from the spatial auto-correlation test (Moran's I) concerning the development of China's logistics industry indicate a significant positive spatial clustering effect. This finding suggests that the logistics development of a province is affected by its neighboring provinces; they do not operate in isolation. In this situation, a standard panel model that doesn't take into account spatial dependencies is likely to give wrong estimates.
This study utilizes the Spatial Lag of X (SLX) model as its primary analytical instrument to accurately capture inter-regional interactions and evaluate our hypotheses regarding different development models. The SLX model can directly measure the spillover effects of economic activities from neighboring regions onto the local region by adding spatially lagged terms of the explanatory variables. The SLX specification is methodologically superior for this study as it avoids the known endogeneity problems that come with Spatial Autoregressive (SAR) or Spatial Durbin (SDM) models, which have a spatial lag of the dependent variable (). This guarantees that the test results for our two separate development models are impartial, resilient, and easily comprehensible. It is essential to recognize that the aim of this research is not to accurately quantify the causal elasticity of e-commerce on logistics growth, given that macro-variables may demonstrate bidirectional causality. The primary objective of utilizing the SLX model is to evaluate our theoretical hypothesis of path bifurcation by analyzing the structural variations in relational patterns across distinct regional subsystems. So, the model's validation depends on the coefficients' significance and sign, which show these systemic patterns, not on the coefficients' exact size.
Our empirical strategy aims to systematically evaluate the two divergent evolutionary trajectories through the framework of exclusionary inference. The main goal of this strategy is to give strong but indirect support for our main theory, which says that the Central and Western regions have recoupled to the national core network. This is done by using econometrics to reject the most common alternative hypothesis: that their growth is driven by local and neighborhood markets.
In this strategy, the spatial weight matrix (W) constructed using the first-order Queen contiguity criterion, serves two purposes. For the Eastern region, it directly tests the intra-regional synergy hypothesis (H1a). It serves as an important falsifier for the Central and Western regions. Our fundamental hypothesis (H2) posits that the growth dynamic for the Central and Western regions is exogenous. Consequently, if the SLX model indicates that both local and neighborhood spillover effects are statistically insignificant, this would represent a robust refutation of the local and neighborhood dependency hypothesis. This econometric finding, along with the descriptive evidence of functional transition and network recoupling from Section 4.3, creates a clear logical framework. It shows that the exogenous functional service node is the best theory to explain all the empirical phenomena that have been seen.
The final SLX model we use to test our main ideas is set up like this:
Here, represents a standardized spatial weights matrix. The term constitutes the spatial lag of our core explanatory variable, quantifying the average level of e-commerce development in all geographically contiguous provinces. Consequently, the coefficient quantifies the local effect, while assesses the associated spatial spillover effect from this core variable.
We will estimate this model separately for the Eastern and Central/Western sub-samples. This stratified methodology aims to empirically validate our hypotheses concerning the two fundamentally divergent systemic pathways.
4. Empirical Results and Analysis
The empirical demonstration in this chapter adheres to a logical triangulation evidentiary framework (illustrated in Figure 2). This framework seeks to elucidate the two distinct development models through a progressive, three-dimensional, and mutually reinforcing methodology, advancing from phenomenon discovery to process explanation and ultimately culminating in mechanism pinpointing.
In Section 4.2, we identify the primary empirical conundrum—the local decoupling in the Central and Western regions—by analyzing the significant growth gap disparity in critical growth rates. Second (Section 4.3), we validate the dynamic process of functional service transition and network recoupling by analyzing the divergence of functional indicators, performing structural break tests, and scrutinizing the sudden changes in systemic correlations. Finally (Section 4.4), we utilize the SLX spatial econometric model to provide the conclusive and most robust econometric evidence, thereby securing the distinct underlying mechanisms that regulate these two divergent trajectories.
4.1. Descriptive Statistics and Spatial Pattern Analysis
Before we rigorously test our main ideas, we need to first describe the basic spatial layout of China's e-commerce-logistics coupled system on a large scale. This first step also helps to prove the reasoning behind using the Eastern-Central/Western divide as the study's systemic boundary, which was explained in Section 3.2.
To start, we made maps of the national spatial distribution of and (Figure 3 and Figure 4). These maps show that China's logistics and e-commerce sectors are growing in very different ways in different parts of the country. This heterogeneity manifests as a clear core-periphery structure, with a lot of activity in the Eastern core and less activity in the Central and Western periphery.
To statistically substantiate this spatial clustering phenomenon, we performed a spatial autocorrelation test on the provincial-level development of the logistics industry. Figure 5 shows that the scatter points represent the actual annual values of Moran's I, and the red line shows its linear fitting trend. The national Moran's I for logistics development stayed significantly positive throughout the entire 2013–2022 sample period, with an annual average value of 0.21. The expected value is E(I) = -1/(N-1) based on the null hypothesis that there is no spatial autocorrelation. For our sample of N=30, this anticipated value is roughly -0.034. Our findings indicate that the development of China's logistics industry is not a series of spatially random, isolated events. Instead, it shows a strong spatial clustering effect, where the logistics development of one area is clearly affected by that of its neighbors. Notably, the Moran's I statistic has been going up since 2018. This indicates that inter-regional connections and synergies might be strengthening as the platform economy matures. This finding gives us the methodological reason we need to use spatial econometric models (Section 4.4), which are made to show these kinds of spillover effects.
Next, we show the descriptive statistics for the main variables, divided into the Eastern and Central/Western subsystems. Table 3 shows the results, which show that there are systemic and, in some cases, substantial differences between the two blocs on almost all key dimensions. The Eastern region has significantly higher average levels of economic development (), virtual system scale (), and physical system scale (). Also, the p-values for these two-sample t-tests with equal variances are all very close to zero (Table 4), which is much lower than the 0.05 level of significance. This shows that the means of the Eastern and Central/Western regions are very different from each other for every variable being looked at.
The substantial spatial dependence revealed by the Moran's I analysis, along with the pronounced regional heterogeneity illustrated in the descriptive statistics, furnish compelling empirical justification for the systemic boundary delineation (Eastern vs. Central/Western) established in Section 3.2. This body of evidence substantiates that our analysis is examining two distinct subsystems, each characterized by unique initial conditions and consequently governed by different evolutionary principles.
4.2. Analysis of Growth Rate Differences Among Core Variables
This section seeks to elucidate and empirically substantiate the principal inquiry of this research: the structural decoupling encountered by the Central and Western regions due to the platform economy, as anticipated by Hypothesis H1b. To quantify and visualize this phenomenon, we perform a comparative analysis of the Compound Annual Growth Rates (CAGR) of core variables between the Eastern and Central/Western subsystems for the period 2013–2022.
Figure 6 provides a compelling visualization of this central puzzle. The four main pieces of information shown there form a logically sound chain of evidence that provides a strong descriptive basis for the systematic testing of our main hypotheses.
The figure shows that the CAGR for e-commerce () and logistics value-added () in the Eastern region were 19.58% and 5.83%, respectively. The numbers for the Central and Western regions were 22.63% and 6.46%, respectively.
First, on a larger scale, the data backs up the idea that asymmetric frictions have an effect everywhere. The theoretical foundation of this study asserts that, although the platform economy significantly mitigates virtual transaction friction, physical logistics friction continues to be markedly elevated. Figure 6 makes this very clear: the e-commerce CAGR (19.58% and 22.63%, respectively) is much higher than the local logistics CAGR (5.83% and 6.46%) in both the Eastern and the Central/Western regions. This finding confirms that asymmetric friction is not a regional anomaly but a universal force that the platform economy exerts on the entire national economic system. The direct result is that the virtual economy grows faster than the real economy.
Second, the data shows how much structural tension each regional system has to deal with. The most obvious way this tension shows up is in the difference in growth rates, or growth gap, between the virtual and physical economies. We calculate this gap as follows:
Eastern region growth gap = 19.58% - 5.83% = 13.75%
Central/Western region growth gap = 22.63% - 6.46% = 16.17%
The primary finding of this section: the Central and Western regions (16.17%) have a much bigger internal growth imbalance—the structural tension—than the Eastern regions (13.75%).
In the end, the interaction between this structural tension and the system's initial endowments causes path bifurcation. Systems theory and path dependency say that how a system reacts to an outside shock depends on its initial conditions and internal structure. The initial conditions of a system, encompassing its developmental inception, resource distribution, and preliminary technological choices, are pivotal in shaping its future trajectory [36]. In turn, the internal structure decides how the system can deal with and process these shocks [37]. The Eastern core is a high-endowment system that has been built up over time through path dependency. It has mature market networks, a lot of logistics infrastructure, and a high level of industrial integration. As a result, this system is more resilient and can take in more information [38]. Even though the 13.75-percentage-point of structural tension is high for this Eastern subsystem, it is still within its structural carrying capacity. The system can handle this stress by making changes to its internal parts, which keeps the connection between its virtual and physical parts strong.
The Central and Western peripheral zone, on the other hand, has a logistics infrastructure and industrial support system that is not very strong at first, so it can only carry a limited amount of goods. When a higher structural tension (16.17%) is applied to this system, the stress surpasses its internal threshold for adjustment and absorption. The inevitable result is the breakdown of the system's original stable state. In other words, the rapid growth of local e-commerce can no longer effectively and proportionately drive the growth of the local logistics industry. The coupling relationship that connects them disintegrates. In systems science, this is known as a phase transition, which is a qualitative change brought about by an outside force.
Consequently, the substantial growth gap illustrated in Figure 6 serves as a principal and persuasive piece of evidence for the disintegration of the e-commerce-logistics linkage in the Central and Western regions. We conclude that the peripheral regions (Central/West), with their weaker endowments, could not handle this structural pressure because of the asymmetric frictions of the platform economy. As a result, their internal systems went through a structural decoupling of the virtual and physical subsystems in the early stages of their development.
4.3. Analysis of Functional Transformation and Network Recoupling
The local decoupling phenomenon discussed in Section 4.2 prompts a more profound inquiry: If local e-commerce is not driving the growth of the logistics industry in the Central and Western regions, what is? This section methodically evaluates Hypothesis H2, which asserts that these regions are experiencing a functional service transition—shifting from serving the local economy to servicing the national network—and ultimately attaining a network recoupling with the higher-tier system. Accordingly, we use a triangulated chain of evidence.
4.3.1. Analysis of Growth Rates of Functional Logistics Indicators
To pinpoint this functional service transition, we follow the operationalization strategy described in Section 3.3, analyzing the growth dynamics of three distinct categories of logistics indicators:
(1) Freight Volume: This is a traditional way to measure the size of the local and regional real economy by looking at the total physical movement of bulk goods. (2) Freight Turnover: This number is the product of freight volume and transport distance. It better shows the logistics network's long-haul transport and throughput functions. (3) Express Delivery Volume: This number accurately reflects the parcel economy that e-commerce has created. It is also a good way to tell how well a region is connected to the national consumption network.
Table 5 shows that the Compound Annual Growth Rates (CAGR) of these three indicator categories are very different in the Central and Western regions. This divergence provides twofold evidence for the proposed functional transition.
Table 5 clearly reveals a dual signal:
(1) The traditional logistics system is not growing. From 2013 to 2022, the CAGR for freight volume and freight turnover in the Central and Western regions was only 2.44% and 2.30%, respectively. The 22.63% e-commerce CAGR seen in Section 4.2 is very different from this very slow growth, which is even negative in some provinces. This strongly suggests that the rise in local e-commerce consumption did not lead to an increase in traditional logistics demand, which serves local industrial and agricultural production. This is a direct example of local decoupling at the level of physical circulation.
(2) The parcel economy system is growing very quickly. The CAGR for express delivery volume in the Central and Western regions was an amazing 32.21%, which is very different from the stagnation of traditional logistics. This big difference in order of magnitude shows that a new, independent growth driver has appeared that operates independently of the traditional freight system.
The significant disparity illustrated in Table 5 empirically substantiates the dual signal hypothesis posited in Section 3.3. The first sign is that the parcel economy system is growing very quickly (the CAGR for express delivery is 32.21%). This shows that the Central and Western regions are now fully connected to the national e-commerce network and that new growth is happening. The second signal is that the traditional logistics system is not growing either (CAGR for freight volume and freight turnover is only 2.44% and 2.30%, respectively). This clearly shows that the growth of this traditional system is no longer linked to the local economy.
These two signals together provide the strongest proof of the functional service transition. The logistics industry in the Central and Western regions has seen a major change in the way it grows. Its growth is no longer dependent on the internal growth of the local real economy. Instead, it stems from the huge amount of data that these areas now send and receive as functional service nodes in the national e-commerce parcel network. This constitutes the initial substantial evidence corroborating our primary hypothesis, H2.
4.3.2. Structural Break Test
If the systemic functional transition mentioned above did happen, we should be able to find a big structural break in the time-series data. This break would mark a pivotal juncture at which the system's evolutionary logic underwent a fundamental transformation.
To examine this corollary, we utilize a theory-driven validation approach. We first choose 2018 as the proposed break-point based on a broad look at China's platform economy and logistics sector. This decision wasn't based on any previous data. Instead, it was based on the overlap of a few big changes at the macro level: 1) Market Maturation: The years around 2018 were a key turning point for China's e-commerce market. It went from a time of rapid growth to a time of slower, steadier growth. 2) Changes to infrastructure: This is when most of the work on the smart logistics backbone was done, thanks to networks like Cainiao. 3) How well policies work: Around 2018, important national policies like bringing e-commerce to rural areas and fast delivery to the countryside started to have a big and measurable effect.
This choice of 2018 as a structural turning point is not random; it fits perfectly with the time frame for fully implementing national-level logistics plans like the China-Europe Railway Express and the New Western Land-Sea Corridor. This alignment reveals a more profound mechanism of systemic transformation. Our theory does not assert that platforms are the exclusive catalyst. We contend that state-level strategy constituted the fundamental infrastructure framework and institutional assurances for the peripheral regions' functional service transition, thereby facilitating the potential for transformation. The platform's internal market network and algorithmic logic took advantage of this chance by leveraging this framework with real commercial and data flows. This activation, which was driven by the platform, ultimately determined the specific functional form of the transition, which was serving the national network (i.e., it determined the direction of the change). Consequently, the structural break we observe is the outcome of a phase transition, a synergistic convergence of top-down state design and market-driven platform forces at a particular temporal moment.
After this theory-driven identification, we use a Chow Test to formally test the 2018 structural break hypothesis. This test is implemented by developing a panel fixed-effects model that includes a break-point dummy variable (post2018, coded as 1 for 2018 and all subsequent years) and, importantly, its interaction terms with all explanatory variables. We subsequently conduct a joint significance F-test on the complete array of interaction terms. Table 6 shows that the F-statistic is 2.15 and the p-value is 0.0763. This finding enables us to dismiss the null hypothesis of no structural change in model coefficients before and after 2018 at the 10% significance level. This offers strong statistical proof that 2018 was an important structural break-point.
The regression coefficients in Table 6 give a more detailed explanation of this structural change, giving two different types of micro-level evidence for the functional transition.
First, it's clear that the main factors that drive growth have changed. The coefficient for before 2018 is 0.974 and very important (p < 0.01). This means that the traditional, local economy was mostly responsible for the growth of the logistics sector in the Central and Western regions at that time. After 2018, though, the interaction term has a very negative coefficient (-0.296, p < 0.1). This shows that the traditional local economic growth had a much weaker effect on the logistics sector after the break.
Second, the connection with local e-commerce changed in a big way. Before 2018, the coefficient for the local e-commerce scale () was -0.076, which was statistically significant (p < 0.05). This negative correlation is very telling because it shows how complicated the local decoupling phenomenon is. It indicates that during the initial phase of evolution, the rapid expansion of local e-commerce may have had a resource-competitive or substitutive impact on the local logistics sector (assessed at the value-added level). The interaction term is significantly positive at 0.067 (p < 0.1) after 2018. This indicates a structural moderation of the pre-existing negative correlation. The total post-break effect (a combined coefficient of -0.009) shows that the relationship is no longer significantly negative. This change sends a clear message: after 2018, the Central and Western logistics industry began to break free from this complicated and possibly hostile early relationship with local e-commerce. Its growth logic started to follow a path that was functionally independent.
In short, the results of the structural break analysis show that the logistics industry in the Central and Western regions went through a major, systemic change in how it worked around 2018. Its growth drivers are no longer primarily dependent on the scale of the local economy, and its relationship with local e-commerce has been structurally altered. This finding provides the second line of strong econometric evidence for the main point of this study: that the Central and Western regions are becoming functional service nodes that help the national network.
4.3.3. Correlation Analysis Before and After the Breakpoint
The evidence from the previous sections has demonstrated that the Central and Western regions have experienced both local decoupling and a functional transition. This section's correlation analysis is meant to back up the last step in this evolutionary path, which is network recoupling.
Correlation does not inherently prove causation; however, it can indicate a significant systemic transformation: specifically, whether the operational patterns of the Central and Western logistics system, having separated from its local economic foundation, has begun to align with the overarching dynamics of the national digital economy. The occurrence of such synchronicity would provide an essential connection in the logical framework underpinning our recoupling hypothesis.
To evaluate this hypothesis, we analyze the progression of the Pearson correlation coefficient between the logistics function indicators of the Central and Western regions and the aggregate national e-commerce transaction value, contrasting the intervals preceding and succeeding the structural break. We prioritize the use of Express Delivery Volume as our indicator. This is because it is the most direct and sensitive physical sign of e-commerce activity, making it the best way to measure how well the parcel economy network is connected.
As shown in Table 7, our analysis shows a marked increase from a weak statistical correlation to a state of high synchronicity. This change happens around 2017.
This discovery provides substantial, threefold evidence for network recoupling: First, there was already a positive link between the two groups from 2013 to 2016 (r = 0.9164, p = 0.0836). This means that the parcel flow in the Central and Western regions was, as expected, affected by the larger national e-commerce scene because it is an important part of the national market.
Second, there was a big change in quality after 2017. The correlation coefficient not only increased to 0.9466, but more importantly, its statistical significance rose from a low level (p = 0.0836) to a high level (p = 0.0042). This sudden change—from a weak link to a strong link—gives a clear quantitative sign that network recoupling has begun. It shows that after the decoupling and functional transition, the logistics system in the Central and Western regions was able to successfully integrate itself into the national digital economy. Its developmental dynamics started to align with the national virtual economic system.
Third, this data-driven identification of the 2017 break point gives us a better understanding of our theory. We understand this timing as follows: Express delivery volume was the first to show the structural change in 2017. This is because it is the most sensitive leading indicator in the logistics sector to changes in the e-commerce market and smart logistics networks. That year, the smart logistics backbone's most important nodes, like Cainiao Network, started to have a big effect on operations. This was like an advanced deployment that got the system ready for the big changes in the market and policies that would happen in the following year (2018). Because of this, 2017 can be thought of as the start year of this change in function. The 2018 break-point we talked about in Section 4.3.2 is best understood as the confirmation year. This is when the full effects of the transition became clear in broader, slower-moving macroeconomic indicators like .
To further validate this finding, we replicate the analysis utilizing the broader freight turnover indicator. Table 8 shows that the results follow a similar pattern. After its own break-point in 2019, the correlation also shows a strong upward trend, with the coefficient jumping from 0.6540 to 0.9016, which is significant at the 10% level. This analysis offers supplementary validation for our principal conclusion concerning network recoupling.
In summary, the evidence presented in Section 4.3—the divergence of functional indicators, the identification of a structural break, and the marked shift in systemic correlation—together constitute a complete evidentiary triangle. This triangulation clearly shows and backs up Hypothesis H2: that the Central and Western regions have gone through a full, nonlinear evolution of decoupling—functional transition—network recoupling.
4.4. Spatial Econometric Model Results
We use the Spatial Lag of X (SLX) spatial econometric model to do a more in-depth study of the inter-regional synergies and dependencies and to find the underlying mechanisms of the two different development models. This model is beneficial because it enables the concurrent estimation of the direct impact of local e-commerce development () and the spatial spillover effects () arising from nearby regions.
4.4.1. Eastern Model: Collaborative Development-Oriented Regional Network
Column (1) of Table 9 presents the SLX model regression results for the Eastern region sub-sample.
The results are clear: Local Effect (): At the 5% level (p=0.022), the coefficient for the local e-commerce variable is 0.204, which is very important. This coefficient shows that there is a strong local coupling in economic terms. This finding demonstrates that in the Eastern regions, the expansion of the virtual economy (e-commerce) is effectively integrated and transformed by the efficient local physical economy (logistics). This creates a strong positive synergy between the two systems, which strongly supports the recoupling feature of this path.
Spatial Spillover Effect (): The coefficient for the spatially lagged e-commerce variable, which shows how neighboring areas affect the outcome, is also positive and statistically significant (coefficient = 0.152, p=0.048). This is arguably a more significant finding. This result indicates a robust regional synergy effect, signifying that the Eastern provinces are not experiencing independent growth. Instead, they have built a network that helps each other. E-commerce's success in one province drives the growth of the logistics industry in nearby provinces, probably through shared supply chains and integrated logistics networks.
This statistically significant dual-positive finding, which includes both local coupling and regional spillovers, is a perfect confirmation of Hypothesis H1a. It shows that the Eastern core region has really become an endogenous synergistic regional network, which is one with strong internal connections and important, positive connections between regions.
4.4.2. Central and Western Model: Formation of Exogenous Functional Service Nodes
The developmental logic of the Central and Western regions necessitates a multi-dimensional evidentiary framework for comprehensive understanding, in stark contrast to the Eastern region. We have already established two important pieces of evidence: First (Evidence A), the comparative growth rate analysis in Section 4.2 (Figure 6) visually illustrated the growth gap between the virtual economy and the growth of the local physical economy. This is the clearest macroeconomic proof of structural decoupling. Second (Evidence B), our examination of the functional transition in Section 4.3 (Table 5) demonstrated—via the pronounced divergence of freight volume, freight turnover, and express delivery volume—that the Central/Western logistics system is transitioning from a local-servicing to a national-servicing model.
The SLX model in this section is meant to add to this base by providing the third and most rigorous line of econometric evidence (Evidence C). Its main goal is to use statistics to test the local and neighborhood dependency hypothesis and then reject it. In Table 9, column (2) shows the regression results for the Central and Western sub-sample:
Local Effect (): The coefficient for the scale of local e-commerce is not statistically different from zero (coefficient = -0.064, p=0.402).
The coefficient for e-commerce scale in nearby areas is also not significant (coefficient = -0.016, p=0.807).
These strongly insignificant results fit perfectly with the macroeconomic growth trends and functional transition signals we saw in Section 4.2 and Section 4.3. They collectively form the multi-dimensional evidentiary framework that discredits the local dependency hypothesis. The insignificant coefficient on serves as an econometric reaffirmation of structural decoupling. The insignificant coefficient on simultaneously eliminates the possibility that their growth dynamic stems from geographically adjacent neighbors.
We must reiterate, as methodologically delineated in Section 3.4, that an SLX model based on a geographic contiguity matrix cannot directly assess long-distance functional connectivity. By systematically excluding the driving forces of both local and neighborhood markets, and by synthesizing this null finding with the substantial antecedent evidence (from Section 4.3.3) that suggests a functional recoupling to the national network, our theoretical hypothesis of the exogenous functional service node emerges as the most parsimonious—and indeed the only—logically coherent framework that can clarify all these empirical phenomena.
Consequently, the results from the SLX model constitute an essential, pivotal element in our comprehensive chain of evidence. They provide strong evidence that the growth dynamic driving the logistics industry in the Central and Western regions is both external and national.
4.5 Robustness Tests
To validate the dependability of our principal findings, we conducted a series of stringent robustness checks. The purpose of these tests was to make sure that the baseline regression results don't depend on how we measured our variables, how long the sample lasted, or any other possible explanations.
4.5.1. Replace the Core Explanatory Variable
We re-estimated the baseline SLX model because e-commerce transaction value () mostly measures a virtual information flow, while express delivery volume () is its most direct physical form. To do this, we replaced and its spatial lag term with the natural logarithm of express delivery volume () and its spatial lag term.
The results are very similar to the baseline model, as shown in Columns (1) and (2) of Table 10. The coefficients for local express volume (0.00784) and neighboring express volume (0.207) in the Eastern region confirm its internal synergistic development model, with the neighbor effect being significant at the 10% level. The coefficients for the Central/Western region are 0.358 and -0.458. The fact that the neighboring express volume is significant at the 10% level makes the local decoupling conclusion even stronger. This shows that our main results are strong even when we use this important proxy variable.
4.5.2. Reduce the Control Variables
To avoid possible redundancy or over-specification caused by having too many control variables, we left out the industrial structure variable and ran the analysis again. Columns (3) and (4) of Table 10 show the results. The local effect is still significant at the 1% level for the Eastern region, and the spatial spillover effect is significant at the 5% level. For the Central and Western regions, both the local and spatial spillover coefficients are negative and statistically insignificant. This shows that our findings about the Eastern region's internal synergy and the Central and Western region's local decoupling are strong.
4.5.3. Increase the Control Variables
To mitigate apprehensions regarding potential omitted variable bias, we enhanced the model by incorporating a control variable for highway infrastructure. The local effect coefficient (0.206) and the spatial spill-over coefficient (0.154) for the Eastern region are both still significant at the 5% level, as shown in Columns (1) and (2) of Table 11. On the other hand, the coefficients for both the local and spatial effects in the Central and Western regions are negative and not significant. This further supports the strength of our conclusions about the two different paths.
4.5.4. Exclude Some Provinces
Finally, we did an exclusionary test to make sure that our results weren't affected by the strange behavior of certain provinces. We took Hebei province out of the Eastern sample because it is close to Beijing and may be affected by capital circle effects that are unique to it. We took out the three Northeastern provinces (Heilongjiang, Liaoning, and Jilin) from the Central/Western sample because they have different economic structures. After that, the SLX model was re-evaluated using these new samples. The local effect (0.202) and spatial spillover effect (0.219) for the Eastern region are still significant at the 5% and 1% levels, respectively, as shown in Columns (3) and (4) of Table 11. The coefficients for the local and spatial effects in the Central and Western regions are still negative and not significant. This test once again shows that our findings are strong: the Eastern region is defined by internal synergy, while the Central and Western region is defined by local decoupling.
4.6. Competitive Hypothesis Test: Geographic Location or Digitalization Level?
So far, the main idea of this research is that the core-periphery geo-economic structure, which is based on historical path dependency, is what is causing the regional path bifurcation we see. A compelling alternative hypothesis suggests that this bifurcation may merely represent a direct expression of high versus low levels of digitalization, rather than being influenced by geographic location. This section aims to directly evaluate these two conflicting hypotheses through a series of subgroup analyses.
To perform this test, we categorize the provinces according to their average level of digitalization throughout the sample period. We make two groups: a high group and a low group, which are split by the median. The results are in Table 12, columns (1) and (2). The second group is a top-quartile group and a bottom-quartile group, which are shown in columns (3) and (4). We then do separate regression analyses for each of these subgroups to look at the relationship between e-commerce and logistics. If the level of digitalization were the determining factor, we would anticipate a substantial positive effect of e-commerce on logistics within the high-digitalization groups, and a negligible effect within the low-digitalization groups.
Table 12 shows the results, which clearly show that this other hypothesis is wrong. The data show that the effect of e-commerce () and its interaction terms with time on logistics development is not significant across all digitalization subgroups, whether they are in the higher or lower brackets.
This systematic series of null results represents a substantial body of evidence supporting our primary thesis. It demonstrates that merely altering the degree of digitalization cannot instigate the pronounced, robust, and systemic division observed between the Eastern and Central/Western blocs. By forcibly dismissing this primary alternative explanation, this finding conversely and significantly enhances the persuasiveness of our central argument: that the core-periphery geo-economic structure—and not merely a disparity in technological endowment—is the more fundamental structural force propelling the emergence of these two divergent evolutionary modes.
5. Discussion
5.1. Summary of Core Findings
The empirical findings of this study systematically demonstrate that, influenced by digital platforms—a significant external coordinating mechanism—China's pre-existing core-periphery regional economic system has experienced structural reconfiguration along two distinctly divergent trajectories.
In the Eastern core region, we discovered a developmental model known as the endogenous collaborative network. There was a strong and lasting positive link between the growth of local e-commerce and the growth of its logistics sector. The success of e-commerce in nearby areas also had a big, positive effect on the logistics industry in the area. This shows that the Eastern region was able to recouple the virtual and physical parts of the platform economy at both the local and regional levels because it had better initial resources. This made an economic network that strengthened itself and had strong internal synergies.
In stark contrast, the Central and Western peripheral regions developed an exogenous functional service node paradigm. This evolution followed a nonlinear dynamic trajectory. At first, there was a structural decoupling in the region between the rapid growth of its virtual economy (e-commerce consumption) and the growth of its local physical economy (logistics industry). The growth of the local e-commerce scale did not effectively spur the synergistic development of the local logistics sector.
But the system didn't stay that way. Later evidence showed that the region went through a big functional transition, in which the logistics system's job changed from serving the local market to serving national network throughput. The growth of express delivery volume far outpaced that of local freight volume, which showed this. After a structural break around 2018, the region's logistics function eventually formed a new, important positive link with the overall growth of the national e-commerce system. This led to a network recoupling to the higher-tier system.
These findings provide a significant insight into the new function of the Central and Western regions in the national digital economy. But they also bring up a more basic theoretical question: What are the specific intrinsic systemic characteristics of this newly recoupled relationship, and what does it mean for digital governance and long-term sustainability? This empirical conundrum, positioned at the intersection of digital commerce, governance, and sustainability, constitutes the foundational basis for our development of systemic functional dependency, a novel theoretical framework.
5.2. Systemic Functional Dependency
The principal theoretical contribution of this research, based on the comprehensive evidentiary framework outlined by the evidentiary triangle in Section 4, is the formulation and elucidation of a novel theoretical construct: systemic functional dependency, which we propose as a new framework for comprehending sociotechnical systems within the platform economy.
Figure 7.
Architecture of Systematic Functional Dependency.
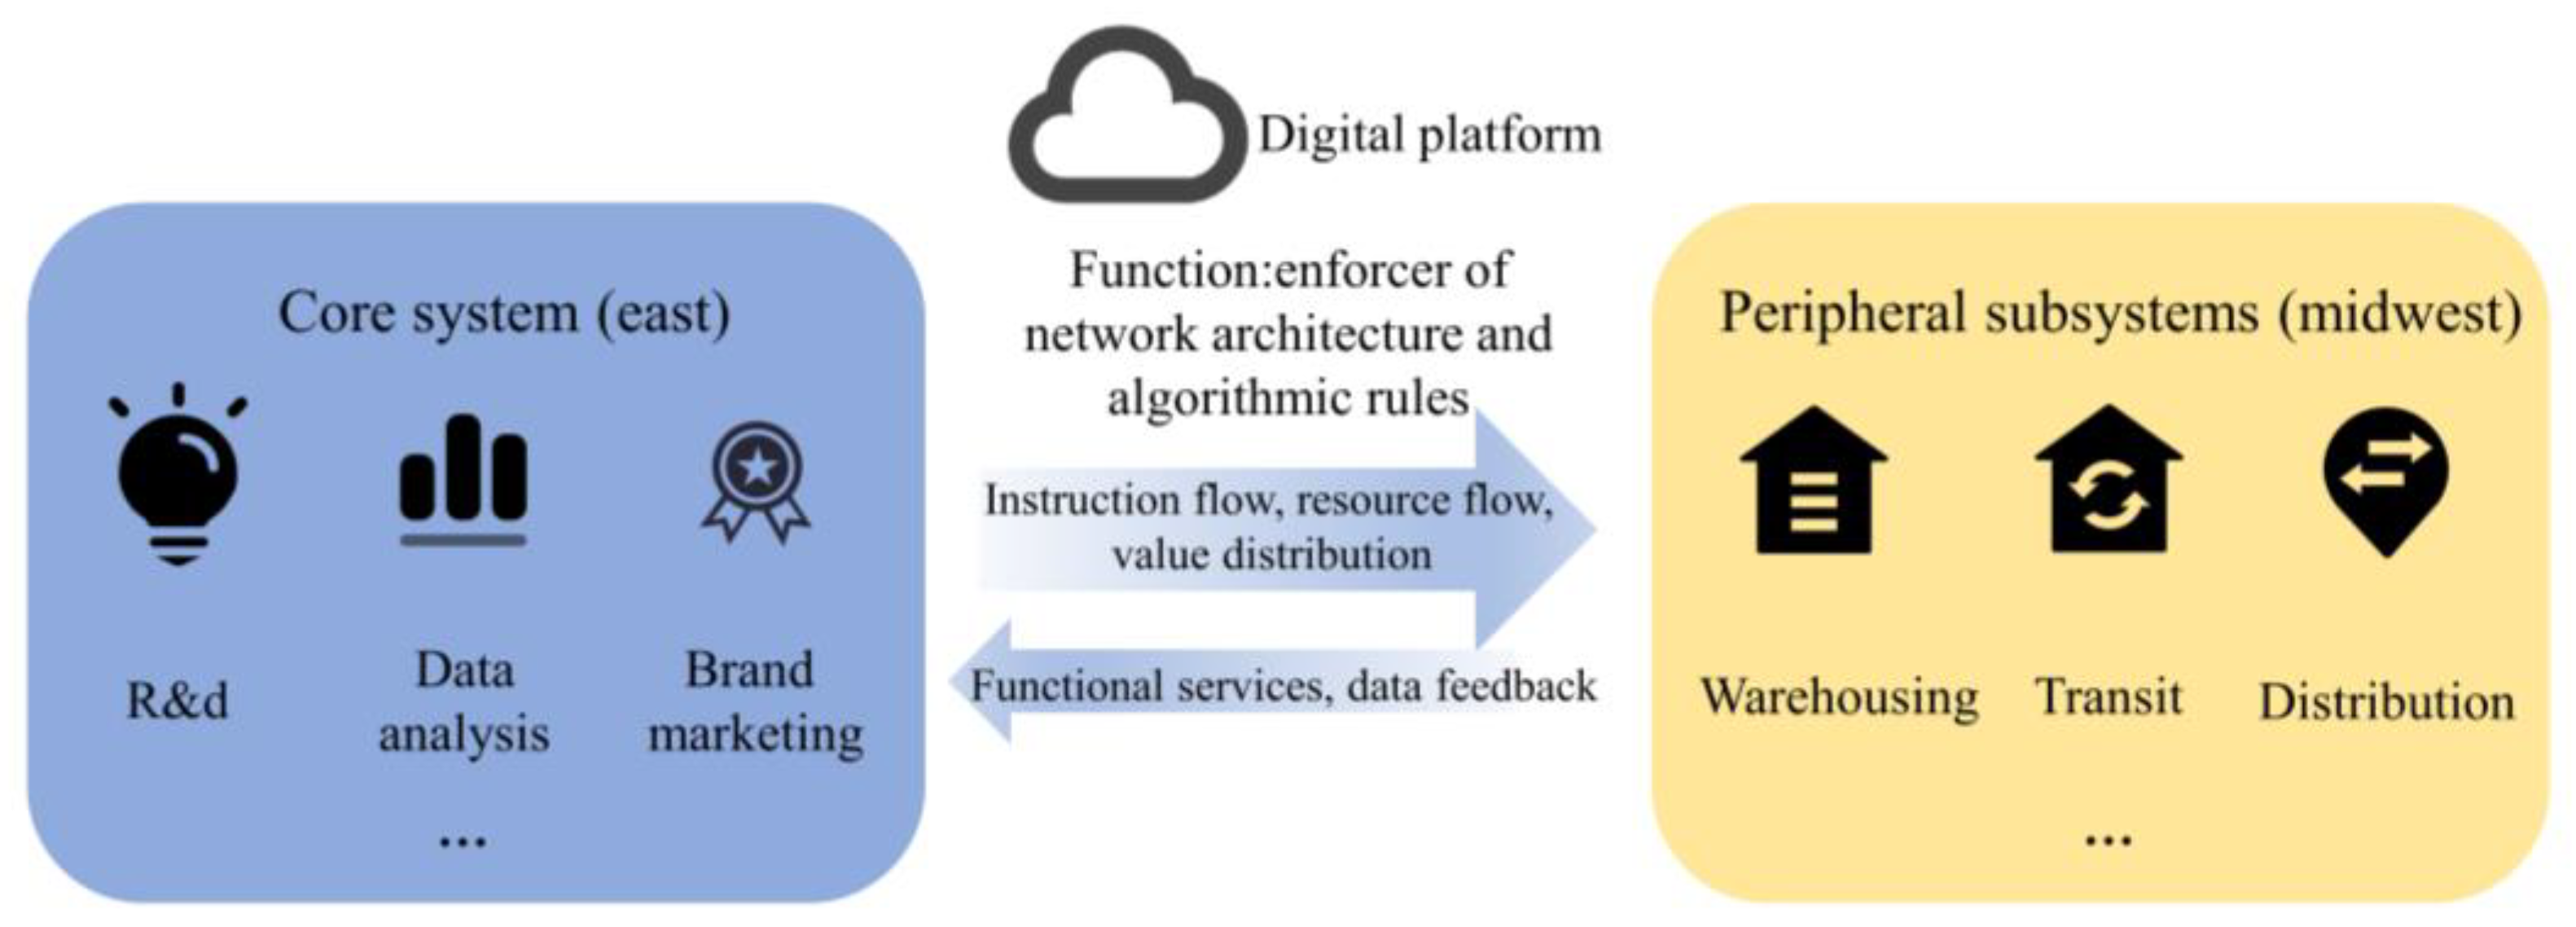
From a regional socio-economic perspective, systemic functional dependency denotes a condition wherein the primary state variables of a subsystem (e.g., the peripheral region)—encompassing its industrial upgrading trajectory and value capture capabilities—are functionally affected by a network function governed by a remote core system. The conventional definitions of capital or trade no longer predominantly dictate the operation of this function. The algorithms, data flows, and network protocols of the digital platform, on the other hand, decide and enforce it.
The formation of this dependency stems from two primary mechanisms:
Mechanism 1: Governance through Algorithms. The platform needs to do spatial functional rationalization to boost performance, cut costs, and make the user experience better. This is because it is an algorithmic governance entity that optimizes for network-wide efficiency [39]. It strongly tends to put high-value-added functions like headquarters, R&D, and data analytics in core areas that are rich in information, talent, and capital (usually where the platform itself is based). This agglomeration effect makes operations more efficient and increases the ability to come up with new ideas, which gives you a big edge in a competitive market [40]. At the same time, it strategically places standardized, easily replaceable functions like warehousing, transit, and distribution hubs in areas with lower land and labor costs [41,42] and better transportation options [43]. The platform's algorithmic rules and incentive structures make this division of labor in space necessary and enforce it.
Mechanism 2: Data Asymmetry. The platform serves as a central data hub and has almost perfect information about the whole network. It brings together data from suppliers to consumers to create a fully integrated flow of information [44]. On the other hand, peripheral actors, such as warehouse operators and truck drivers, only have bits and pieces of information that are relevant to their field. This big difference in data is a major source of power. It lets the platform make the best decisions for the whole world, set the rules for trade, and take most of the value that is created. This puts peripheral actors in the group of platform-dependent entrepreneurs, which means they have a big disadvantage in any negotiation or interaction with the platform.
Systemic functional dependency exemplifies a more intricate, technology-enabled variation of dependence in contrast to conventional dependency theory. The primary source of control has transitioned from capital to the platform's algorithmic regulations, its inconsistent management of data flows, and the standardization mandated by its network protocols. In this relationship, peripheral regions may show signs of modernization and growth in certain industries. However, their basic economic independence—such as their ability to set their own development path, their power to distribute value chains, and their ability to adapt to changes in external networks—will probably be greatly limited.
5.3. Universality of the Mechanism and China’s Role as a Natural Laboratory
Any research predicated on a specific national case must meticulously assess the generalizability of its findings. We readily acknowledge that the findings of this study emerged from China’s unique institutional and market context, a setting that possesses several key specificities. These encompass: strong state-led strategic direction and the ability for substantial infrastructure investment [45]; a highly concentrated platform market structure (dominated by a few major players) [46]; and a cohesive domestic market [47].
Nonetheless, we assert that these context-specific factors have primarily served as accelerating factors rather than as the fundamental drivers. The primary driving force identified in this study—the asymmetric friction between the near-frictionless virtual system (e-commerce) and the persistently high-friction physical system (logistics)—constitutes a systemic contradiction inherent to the platform economy as a business model, which we contend is universally applicable.
In any country with significant geographic disparities in geography and market imbalances, once the platform economy reaches a certain level of penetration, this built-in contradiction will always interact with existing core-periphery structures, causing a structural change in its regional systems. The effect of the platform economy on high-quality regional economic growth follows an inverted U-shaped curve. On the left side of this curve, the platform economy has a big effect on promoting high-quality economic growth. However, after the inflection point, this effect starts to fade [6].
We can perform a cross-contextual theoretical extrapolation: In a context such as the United States or the European Union, characterized by more fragmented market structures and varying governmental intervention strategies, this process would probably not be as swift or intense as it has been in China. The process of evolution may vary. It might look like a systemic functional dependency made by one main platform (like Amazon) along some busy logistics corridors, rather than a clear-cut, national-scale zonal bifurcation. Local governments and community groups may also have longer conflicts with platforms, which would cause a wider range of coupling patterns. Even with these possible differences, the main idea behind this systemic evolution—path bifurcation caused by uneven frictions—would still be the same.
The main goal of this study is to show that our results are a universal rule of systemic evolution. China's distinctive institutional and market landscape functioned as an exemplary natural laboratory for the observation of this principle, which developed with remarkable clarity, rapidity, and on a broad scale.
5.4. Policy Implications
The results of this study have significant ramifications for digital governance and regional sustainable development in the contemporary digital era. The functional lock-in we identify is a direct consequence of current platform governance models, posing a challenge to sustainability that policymakers in peripheral regions of Central and Western China must remain vigilant to avert the emergence of functional lock-in. A major change in policy is needed: moving from just connecting people to focusing on capturing value.
Here are some specific ideas: First, these places need to provide specialized logistics services that add a lot of value. This policy needs to be part of local land-use planning, connecting logistics development to the strengths of the local industry, like specialty agriculture, while still serving as a functional service node. Second, a strategy that should be used at the same time is to actively bring in and support related industries that can add value to the local economy. Third, a lot of money needs to be spent on the local workers, especially to teach them how to use digital tools and keep things running smoothly. Building infrastructure is not enough for making national policy. Policies for land governance need to be in line with this new economic reality, which goes beyond just building infrastructure. National policy should use advanced policies for industry, taxes, and land use to help these hubs grow into industrial ecosystems that are closely linked to the economy of the area.
6. Conclusions and Future Directions
6.1. Research Summary
This study has systematically clarified the phenomenon of regional systemic path bifurcation within the platform economy. To clarify this divergence, we formulated and empirically validated the novel theoretical construct of systemic functional dependency. Our findings indicate that, due to the asymmetric frictions inherent to the platform, China's established core-periphery structure has transformed into two distinctly divergent modes. The Eastern core region turned into an endogenous synergistic regional network, and its growth showed a lot of local coupling and good regional synergies. The Central and Western peripheral regions, conversely, transformed into exogenous functional service nodes via a nonlinear sequence of decoupling, transition, and recoupling. The empirical evidence clearly shows that their growth is no longer linked to local and neighborhood markets; instead, it is now based on a network that spans the whole country.
This research introduces a novel dynamic framework for analyzing the impact of platform governance on regional socio-economic inequality. It also helps us understand a new type of regional dependence that is based on data and algorithms. These results give policymakers an important perspective: they need to do more than just connect people; they need to start capturing value. This strategic change is necessary to mitigate the risks of functional lock-in that peripheral regions encounter in the digital era and to foster genuine digital sustainability and equitable socio-economic development in those areas.
6.2. Future Directions
This study offers innovative theoretical frameworks and empirical evidence concerning the transformation of regional socio-economic structures in the digital era, while concurrently generating extensive opportunities for subsequent research initiatives.
Based on these results, future research could be broadened in three primary domains of inquiry. First, by using Origin-Destination (OD) flow data at the city or hub level to create network analysis models that can directly measure the strength and growth of long-distance connections. Second, by employing qualitative case study methodologies, encompassing extensive fieldwork in representative Central and Western functional service node cities, to comprehensively clarify the micro-mechanisms of the decoupling-transition-recoupling process. Third, by applying the theoretical framework of this study in other national or regional settings. Cross-national comparative analyses would investigate the expressions of the fundamental asymmetric friction mechanism across diverse institutional contexts, thereby further evaluating the generalizability of our theoretical framework.
Author Contributions
Conceptualization, T.L.; methodology, T.L.; software, K.C.; validation, K.C.; formal analysis, K.C.; investigation, K.C.; resources, T.L.; data curation, K.C.; writing—original draft preparation, K.C.; writing—review and editing, K.C.; T.L.; project administration, T.L.; funding acquisition, T.L. All authors have read and agreed to the published version of the manuscript.
Funding
This research was funded by the “Innovation Yongjiang 2035” Key R&D Programme (Grant No. 2024H032), the Research Project of Logistics Teaching Reform in National Universities and Vocational Colleges (Grant No. JZW2025140).
Data Availability Statement
The data presented in this study are available on request from the corresponding author.
Conflicts of Interest
The authors declare no conflicts of interest.
References
- Zutshi, A.; Grilo, A. The Emergence of Digital Platforms: A Conceptual Platform Architecture and Impact on Industrial Engineering. Computers & Industrial Engineering 2019, 136, 546–555. [CrossRef]
- Deng, Z.; Zhu, Z.; Johanson, M.; Hilmersson, M. Rapid Internationalization and Exit of Exporters: The Role of Digital Platforms. International Business Review 2022, 31 (1), 101896. [CrossRef]
- Repenning, A.; Hardaker, S. The Platform Fix: Analyzing Mechanisms and Contradictions of How Digital Platforms Tackle Pending Urban-Economic Challenges. Journal of Economic Geography 2024, 24 (5), 615–636. [CrossRef]
- Li, K. Analysis of the Economic Effects of Digital Platforms. CHR 2025, 67 (1), 78–83. [CrossRef]
- Mao, Q.; Wang, F.; Li, J.; Dong, S. Evolving a Core-Periphery Pattern of Manufacturing Industries across Chinese Provinces. J. Geogr. Sci. 2014, 24 (5), 924–942. [CrossRef]
- Yang, G.; Deng, F.; Wang, Y.; Xiang, X. Digital Paradox: Platform Economy and High-Quality Economic Development—New Evidence from Provincial Panel Data in China. Sustainability 2022, 14 (4), 2225. [CrossRef]
- Hao, N.; Ji, M. Development of Platform Economy and Urban–Rural Income Gap: Theoretical Deductions and Empirical Analyses. Sustainability 2023, 15 (9), 7684. [CrossRef]
- Kayikci, Y. E-Commerce in Logistics and Supply Chain Management. In Advances in Logistics, Operations, and Management Science; IGI Global, 2019; pp 1015–1026. [CrossRef]
- Kenney, M.; Zysman, J. The Platform Economy: Restructuring the Space of Capitalist Accumulation. Cambridge Journal of Regions, Economy and Society 2020, 13 (1), 55–76. [CrossRef]
- Luo, K.; Lee, C.-C.; Zhuo, C. A Pathway to Coordinated Regional Development: Energy Utilization Efficiency and Green Development - Evidence from China’s Major National Strategic Zones. Energy Economics 2024, 131, 107402. [CrossRef]
- Misleh, D.; Dziumla, J.; Garza, M. D. L.; Guenther, E. Sustainability against the Logics of the State: Political and Institutional Barriers in the Chilean Infrastructure Sector. Environmental Innovation and Societal Transitions 2024, 51, 100842. [CrossRef]
- Goumagias, N.; Fernandes, K. J.; Nucciarelli, A.; Li, F. How to Overcome Path Dependency through Resource Reconfiguration. Journal of Business Research 2022, 145, 78–91. [CrossRef]
- Bănică, A.; Pascariu, G. C.; Kourtit, K.; Nijkamp, P. Unveiling Core-Periphery Disparities through Multidimensional Spatial Resilience Maps. Ann Reg Sci 2024, 73 (1), 1–29. [CrossRef]
- Smith, R.; Healey, D. Attacking Concentration: Market Power in the Digital Space. European Competition Journal 2023, 20 (2), 295–314. [CrossRef]
- Feng, B.; Ye, Q. Operations Management of Smart Logistics: A Literature Review and Future Research. Front. Eng. Manag. 2021, 8 (3), 344–355. [CrossRef]
- Majercak, P. Saving Logistics Transportation Costs in the Era of Globalization for Firms. SHS Web Conf. 2020, 74, 04014. [CrossRef]
- Cedillo-Campos, M. G.; Piña-Barcenas, J.; Pérez-González, C. M.; Mora-Vargas, J. How to Measure and Monitor the Transportation Infrastructure Contribution to Logistics Value of Supply Chains? Transport Policy 2022, 120, 120–129. [CrossRef]
- Kang, X.; Chen, L.; Wang, Y.; Liu, W. Analysis on the Spatial Correlation Network and Driving Factors of Carbon Emissions in China’s Logistics Industry. Journal of Environmental Management 2024, 366, 121916. [CrossRef]
- Tang, X.; Wang, G. Design and Analysis of E-Commerce and Modern Logistics for Regional Economic Integration in Wireless Networks. J Wireless Com Network 2020, 2020 (1). [CrossRef]
- Kawa, A.; Światowiec-Szczepańska, J. Logistics Value and Perceived Customer Loyalty in E-Commerce: Hierarchical Linear Modeling Analysis. In Lecture Notes in Computer Science; Springer International Publishing, 2020; pp 417–427. [CrossRef]
- Huang, L.; Xie, G.; Zhao, W.; Gu, Y.; Huang, Y. Regional Logistics Demand Forecasting: A BP Neural Network Approach. Complex Intell. Syst. 2021, 9 (3), 2297–2312. [CrossRef]
- He, Y.; Wu, R.; Choi, Y.-J. International Logistics and Cross-Border E-Commerce Trade: Who Matters Whom? Sustainability 2021, 13 (4), 1745. [CrossRef]
- Jin, Z.; Ye, F.; Nedjah, N.; Zhang, X. A Comparative Study of Various Recommendation Algorithms Based on E-Commerce Big Data. Electronic Commerce Research and Applications 2024, 68, 101461. [CrossRef]
- Zhang, L.; Wang, X.; Lin, H.; Piran, Md. J. A Crowdsourcing Logistics Solution Based on Digital Twin and Four-Party Evolutionary Game. Engineering Applications of Artificial Intelligence 2024, 130, 107797. [CrossRef]
- Rodríguez-García, M.; González-Romero, I.; Ortiz-Bas, Á.; Prado-Prado, J. C. E-Fulfillment Cost Management in Omnichannel Retailing: An Exploratory Study. Computers in Industry 2024, 159–160, 104094. [CrossRef]
- Shi, Y.; Wei, F. Comparative Analysis of Digital Economy-Driven Innovation Development in China: An International Perspective. J Knowl Econ 2024, 16 (1), 4422–4464. [CrossRef]
- Xu, X.; Fan, R.; Wang, D.; Wang, Y.; Wang, Y. The Role of Consumer Reviews in E-Commerce Platform Credit Supervision: A Signaling Game Model Based on Complex Network. Electronic Commerce Research and Applications 2024, 63, 101347. [CrossRef]
- Wu, A.; Song, D.; Liu, Y. Platform Synergy and Innovation Speed of SMEs: The Roles of Organizational Design and Regional Environment. Journal of Business Research 2022, 149, 38–53. [CrossRef]
- Gerlich, M.; Galoyan, D.; Litvin, I.; Salimova, S. The Effectiveness of Public Policy in the Field of Digitalization and Consumption: How Does Macroeconomics Influence Behavioral Patterns in Eastern Europe? J Knowl Econ 2024, 16 (2), 9197–9218. [CrossRef]
- Pahwa, A.; Jaller, M. Assessing Last-Mile Distribution Resilience under Demand Disruptions. Transportation Research Part E: Logistics and Transportation Review 2023, 172, 103066. [CrossRef]
- Kiviaho, A.; Einolander, J. Digital Transformation, Well-Being and Shrinking Communities: Narrowing the Divides between Urban and Rural. Heliyon 2023, 9 (8), e18801. [CrossRef]
- Lee, H. L.; Shen, Z.-J. (Max). Supply Chain and Logistics Innovations with the Belt and Road Initiative. Journal of Management Science and Engineering 2020, 5 (2), 77–86. [CrossRef]
- Zhang, X.; Pan, M. Emerging Rural Spatial Restructuring Regimes in China: A Tale of Three Transitional Villages in the Urban Fringe. Journal of Rural Studies 2022, 93, 287–300. [CrossRef]
- Li, P., Liu, J. Y., Lu, X. Y., Xie, Y., & Wang, Z. G. (2024). Digitalization as a Factor of Production in China and the Impact on Total Factor Productivity (TFP). Systems, 12(5), Article 164. [CrossRef]
- Ye, W. E-Commerce Logistics and Supply Chain Network Optimization for Cross-Border. J Grid Computing 2024, 22 (1). [CrossRef]
- Castaldi, C.; Dosi, G.; Paraskevopoulou, E. Path Dependence in Technologies and Organizations. In The Palgrave Encyclopedia of Strategic Management; Palgrave Macmillan UK, 2018; pp 1256–1259. [CrossRef]
- Vitkovskyi, Y. Adaptability of the economy to external and internal shocks in globalization. UJAET 2022, 7 (3), 148–154. [CrossRef]
- Karman, A.; Prokop, V.; Lopes de Sousa Jabbour, A. B. Circular Economy Practices as a Shield for the Long-Term Organisational and Network Resilience during Crisis: Insights from an Industrial Symbiosis. Journal of Cleaner Production 2024, 466, 142822. [CrossRef]
- Hu, X.; Chuang, Y.-F. E-Commerce Warehouse Layout Optimization: Systematic Layout Planning Using a Genetic Algorithm. Electron Commer Res 2022, 23 (1), 97–114. [CrossRef]
- Che, Z.; Wu, C.; Liu, X. A Four-Factor Model of Knowledge Agglomeration. Asia Pac J Manag 2024, 42 (3), 1411–1452. [CrossRef]
- Et al., Y. L. Study on Overseas Warehouse Location of Manufacturing Cross-Border E-Commerce Enterprises Based on Multi-Objective. converter 2021, 172–184. [CrossRef]
- Becerra-Fernandez, M.; Romero, O. R.; Trujillo-Diaz, J.; Herrera, M. M. Assignment-Simulation Model for Forklifts in a Distribution Center with Aisle Constraints. Simulation Modelling Practice and Theory 2024, 133, 102902. [CrossRef]
- Zhang, H.; Zhang, J.; Zheng, C.; Wang, B.; Chen, J. Node Location of Bi-Level Urban Metro-Based Ground-Underground Logistics Distribution. Multimodal Transportation 2024, 3 (1), 100119. [CrossRef]
- Rachana Harish, A.; Liu, X. L.; Li, M.; Zhong, R. Y.; Huang, G. Q. Blockchain-Enabled Digital Assets Tokenization for Cyber-Physical Traceability in E-Commerce Logistics Financing. Computers in Industry 2023, 150, 103956. [CrossRef]
- Dinlersoz, E. M.; Fu, Z. Infrastructure Investment and Growth in China: A Quantitative Assessment. Journal of Development Economics 2022, 158, 102916. [CrossRef]
- Sun, J.; Jia, K.; Kenney, M. Entrepreneurial Local Governments and the Development of the Decentralised Platform Economy in China. Regional Studies 2025, 59 (1). [CrossRef]
- Shi, J.; Qi, C.; Mu, X. Accelerating the Construction of a Unified Domestic Market to Promote Sustainable Economic Development: Mechanisms, Challenges and Countermeasures—A Perspective Based on the General Law of the Market Economy and Chinese Reality. Sustainability 2023, 15 (10), 8329. [CrossRef]
Figure 1.
Dynamic evolution framework of coupling and decoupling-recoupling.
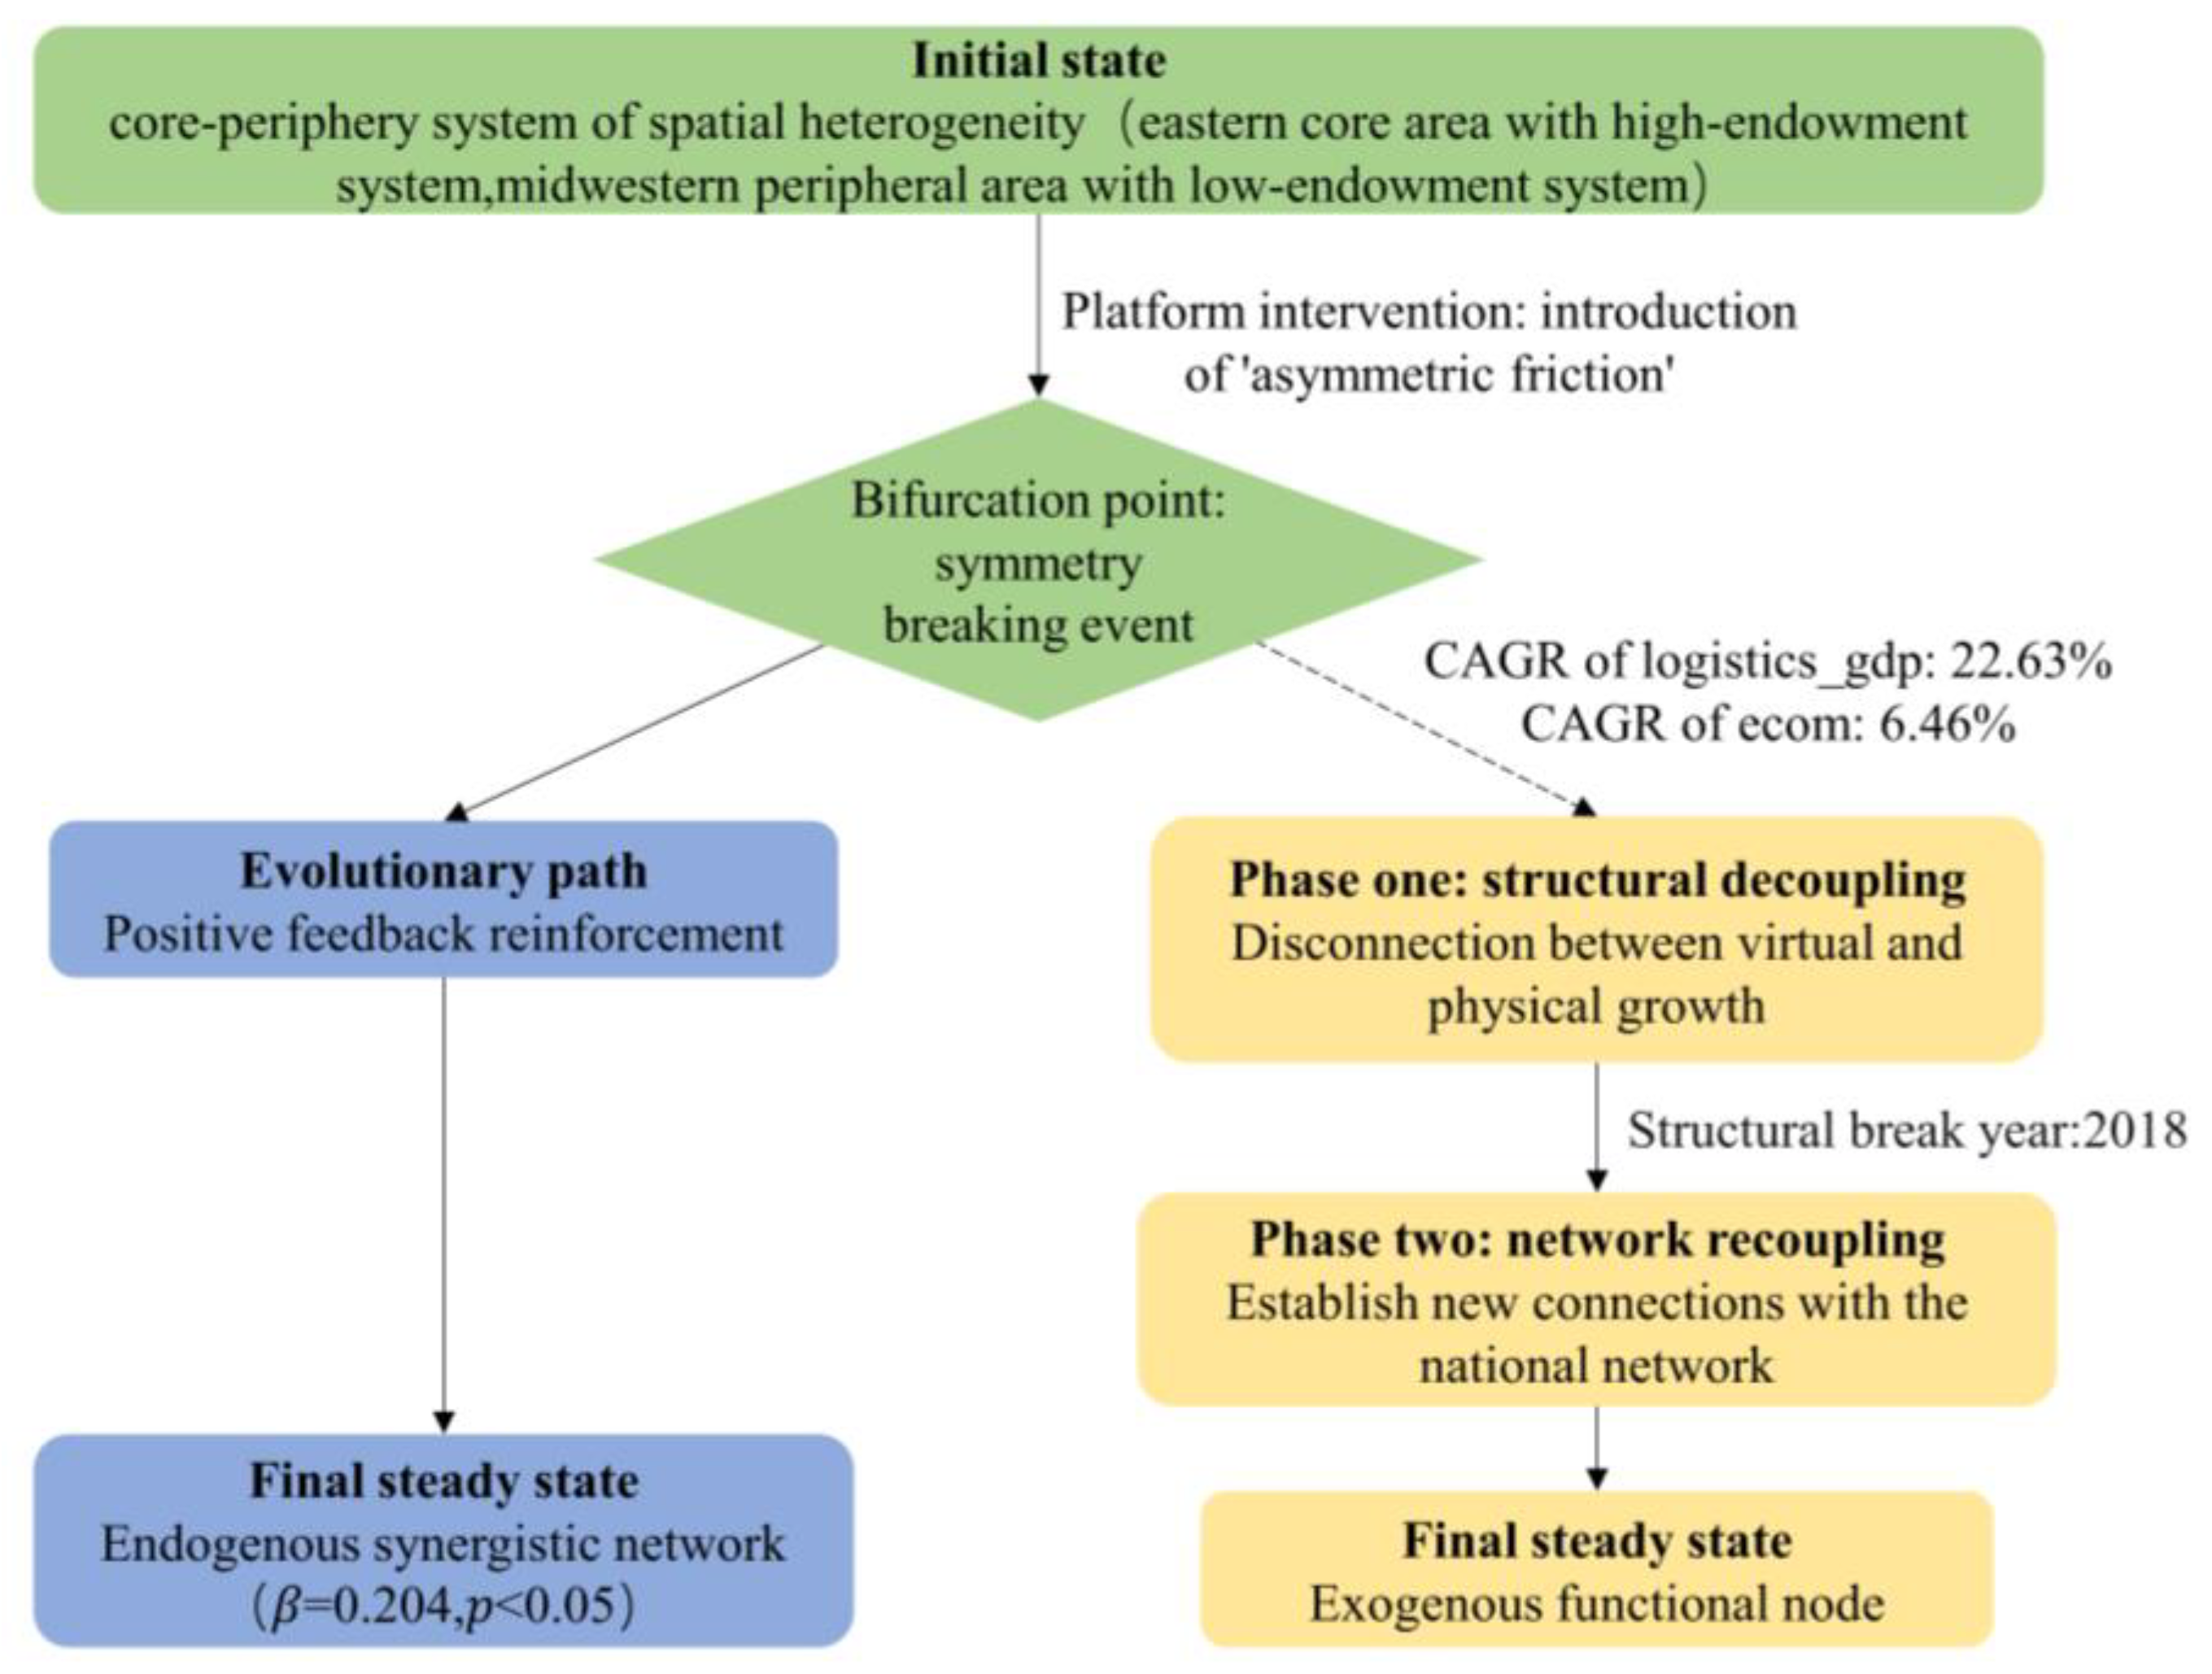
Figure 2.
Triangulation evidentiary framework.
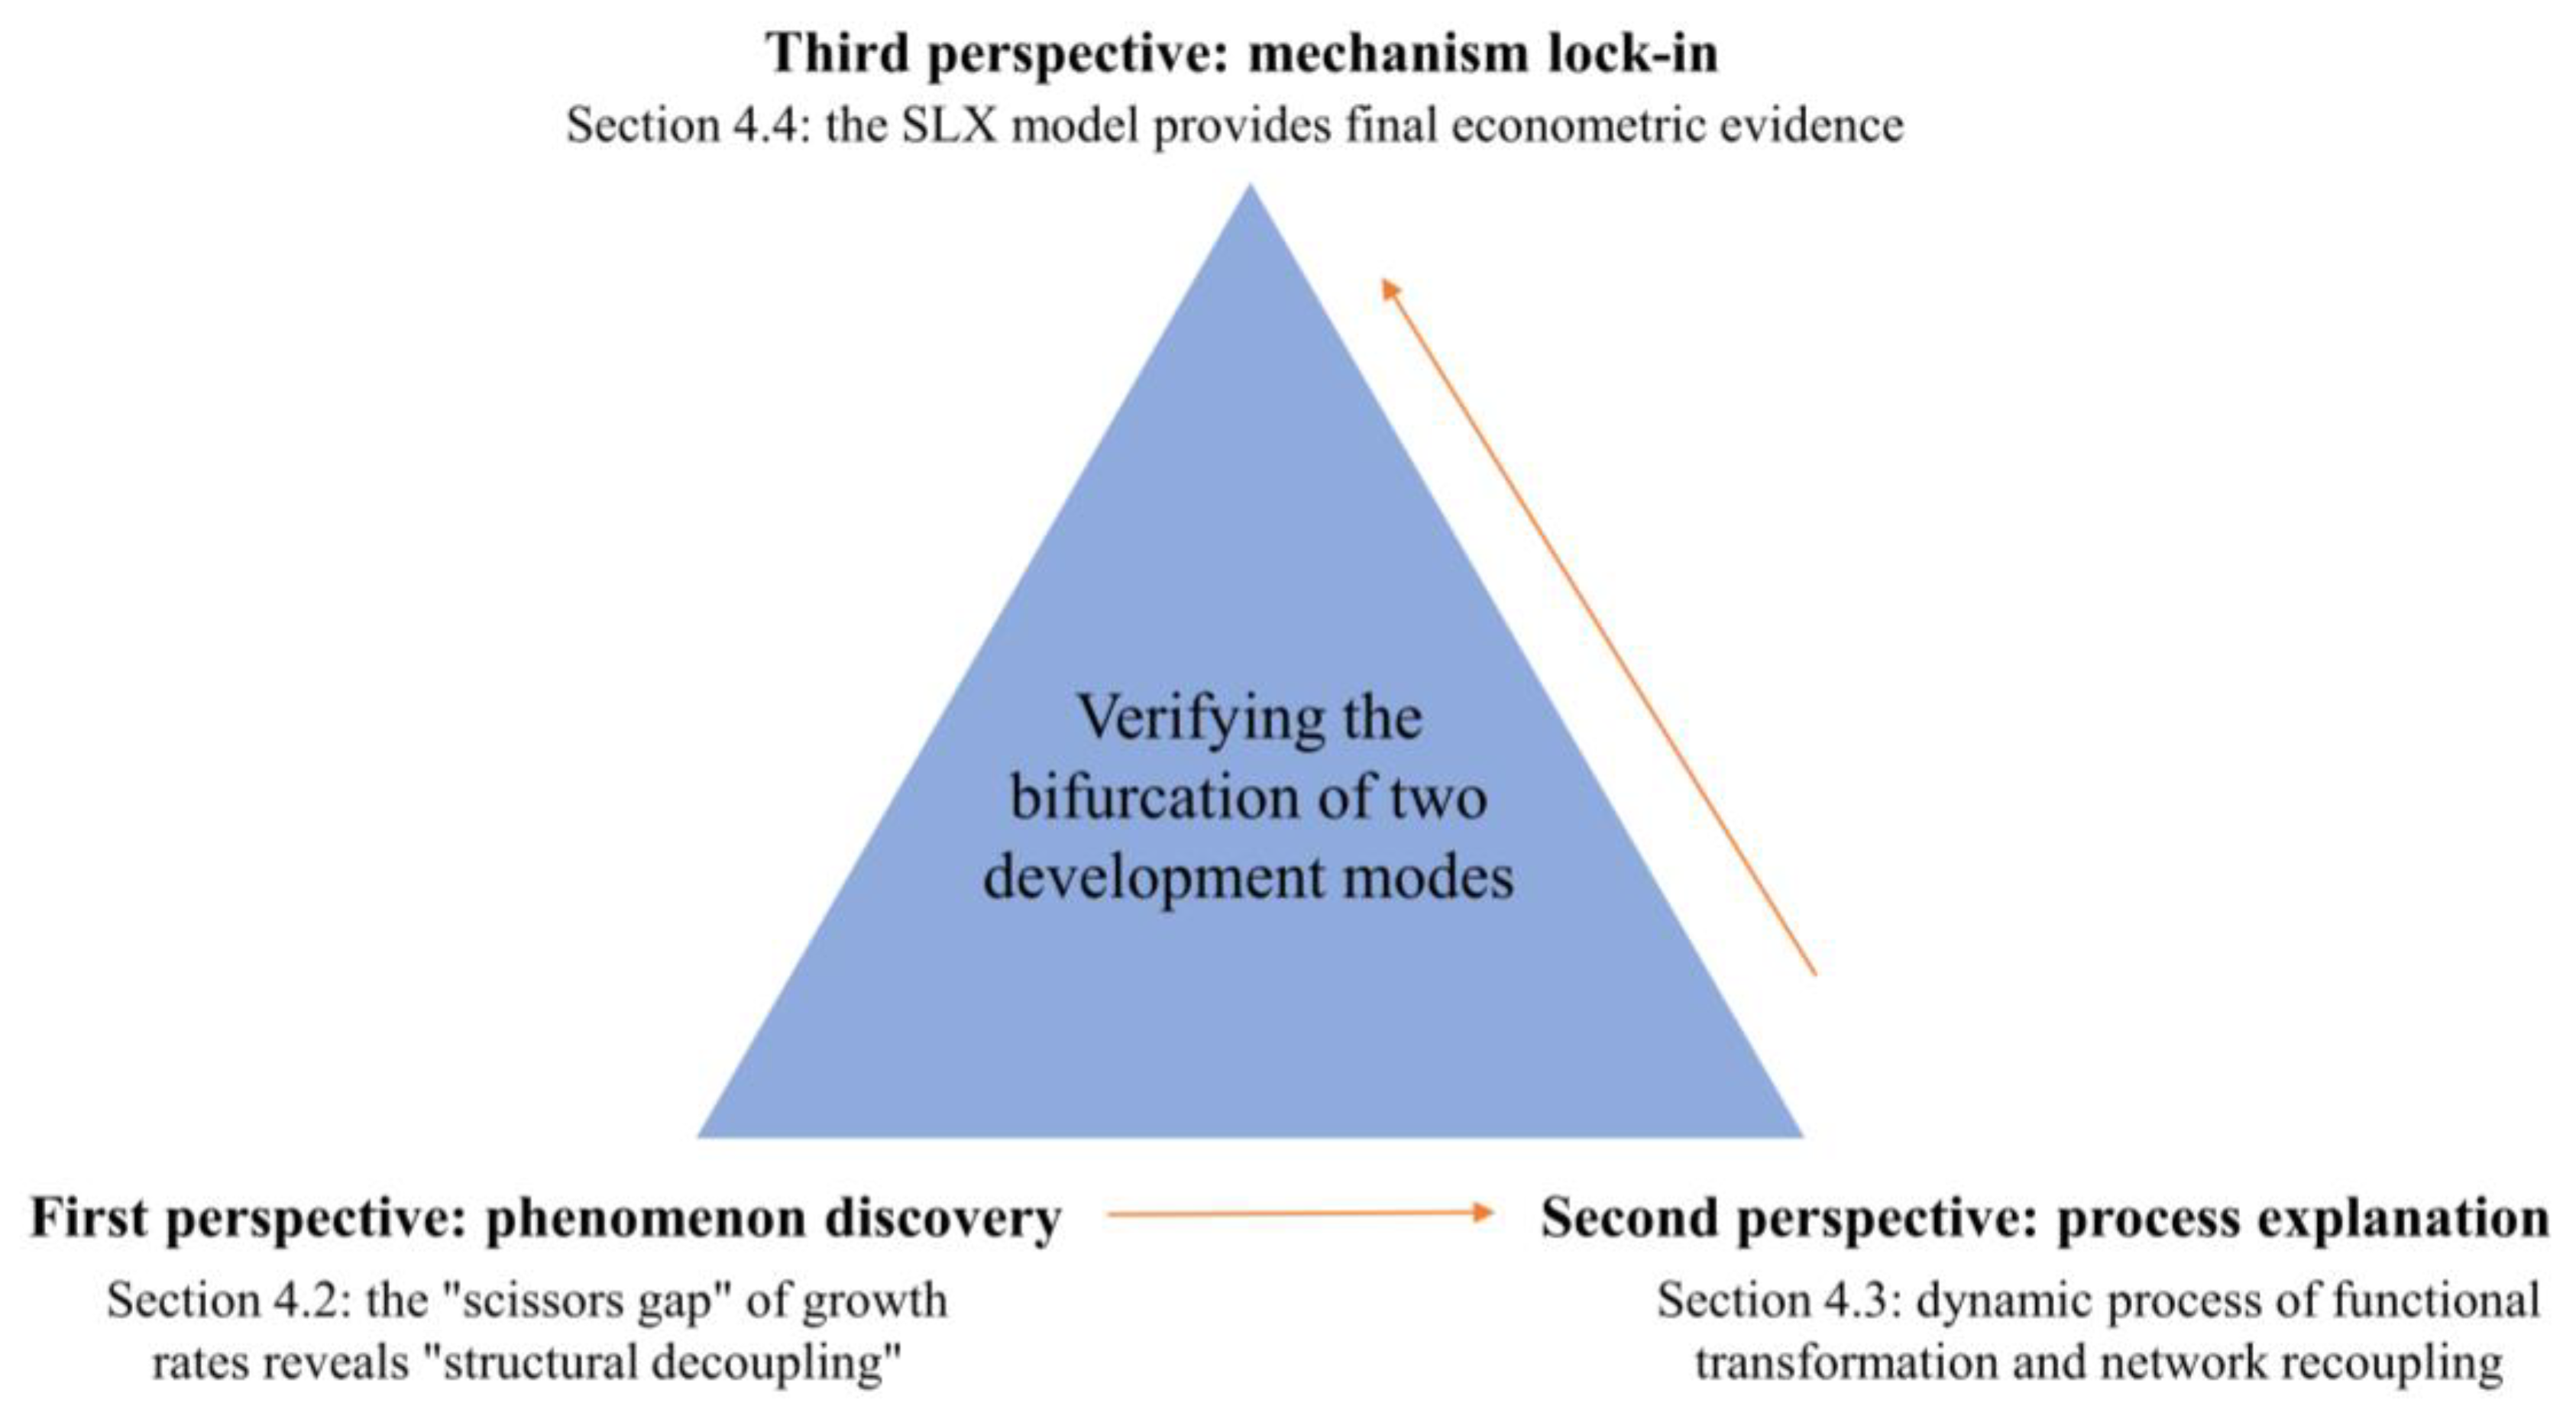
Figure 3.
Spatial pattern of average logistics industry value-added in Chinese provinces (2013-2022).
Figure 3.
Spatial pattern of average logistics industry value-added in Chinese provinces (2013-2022).
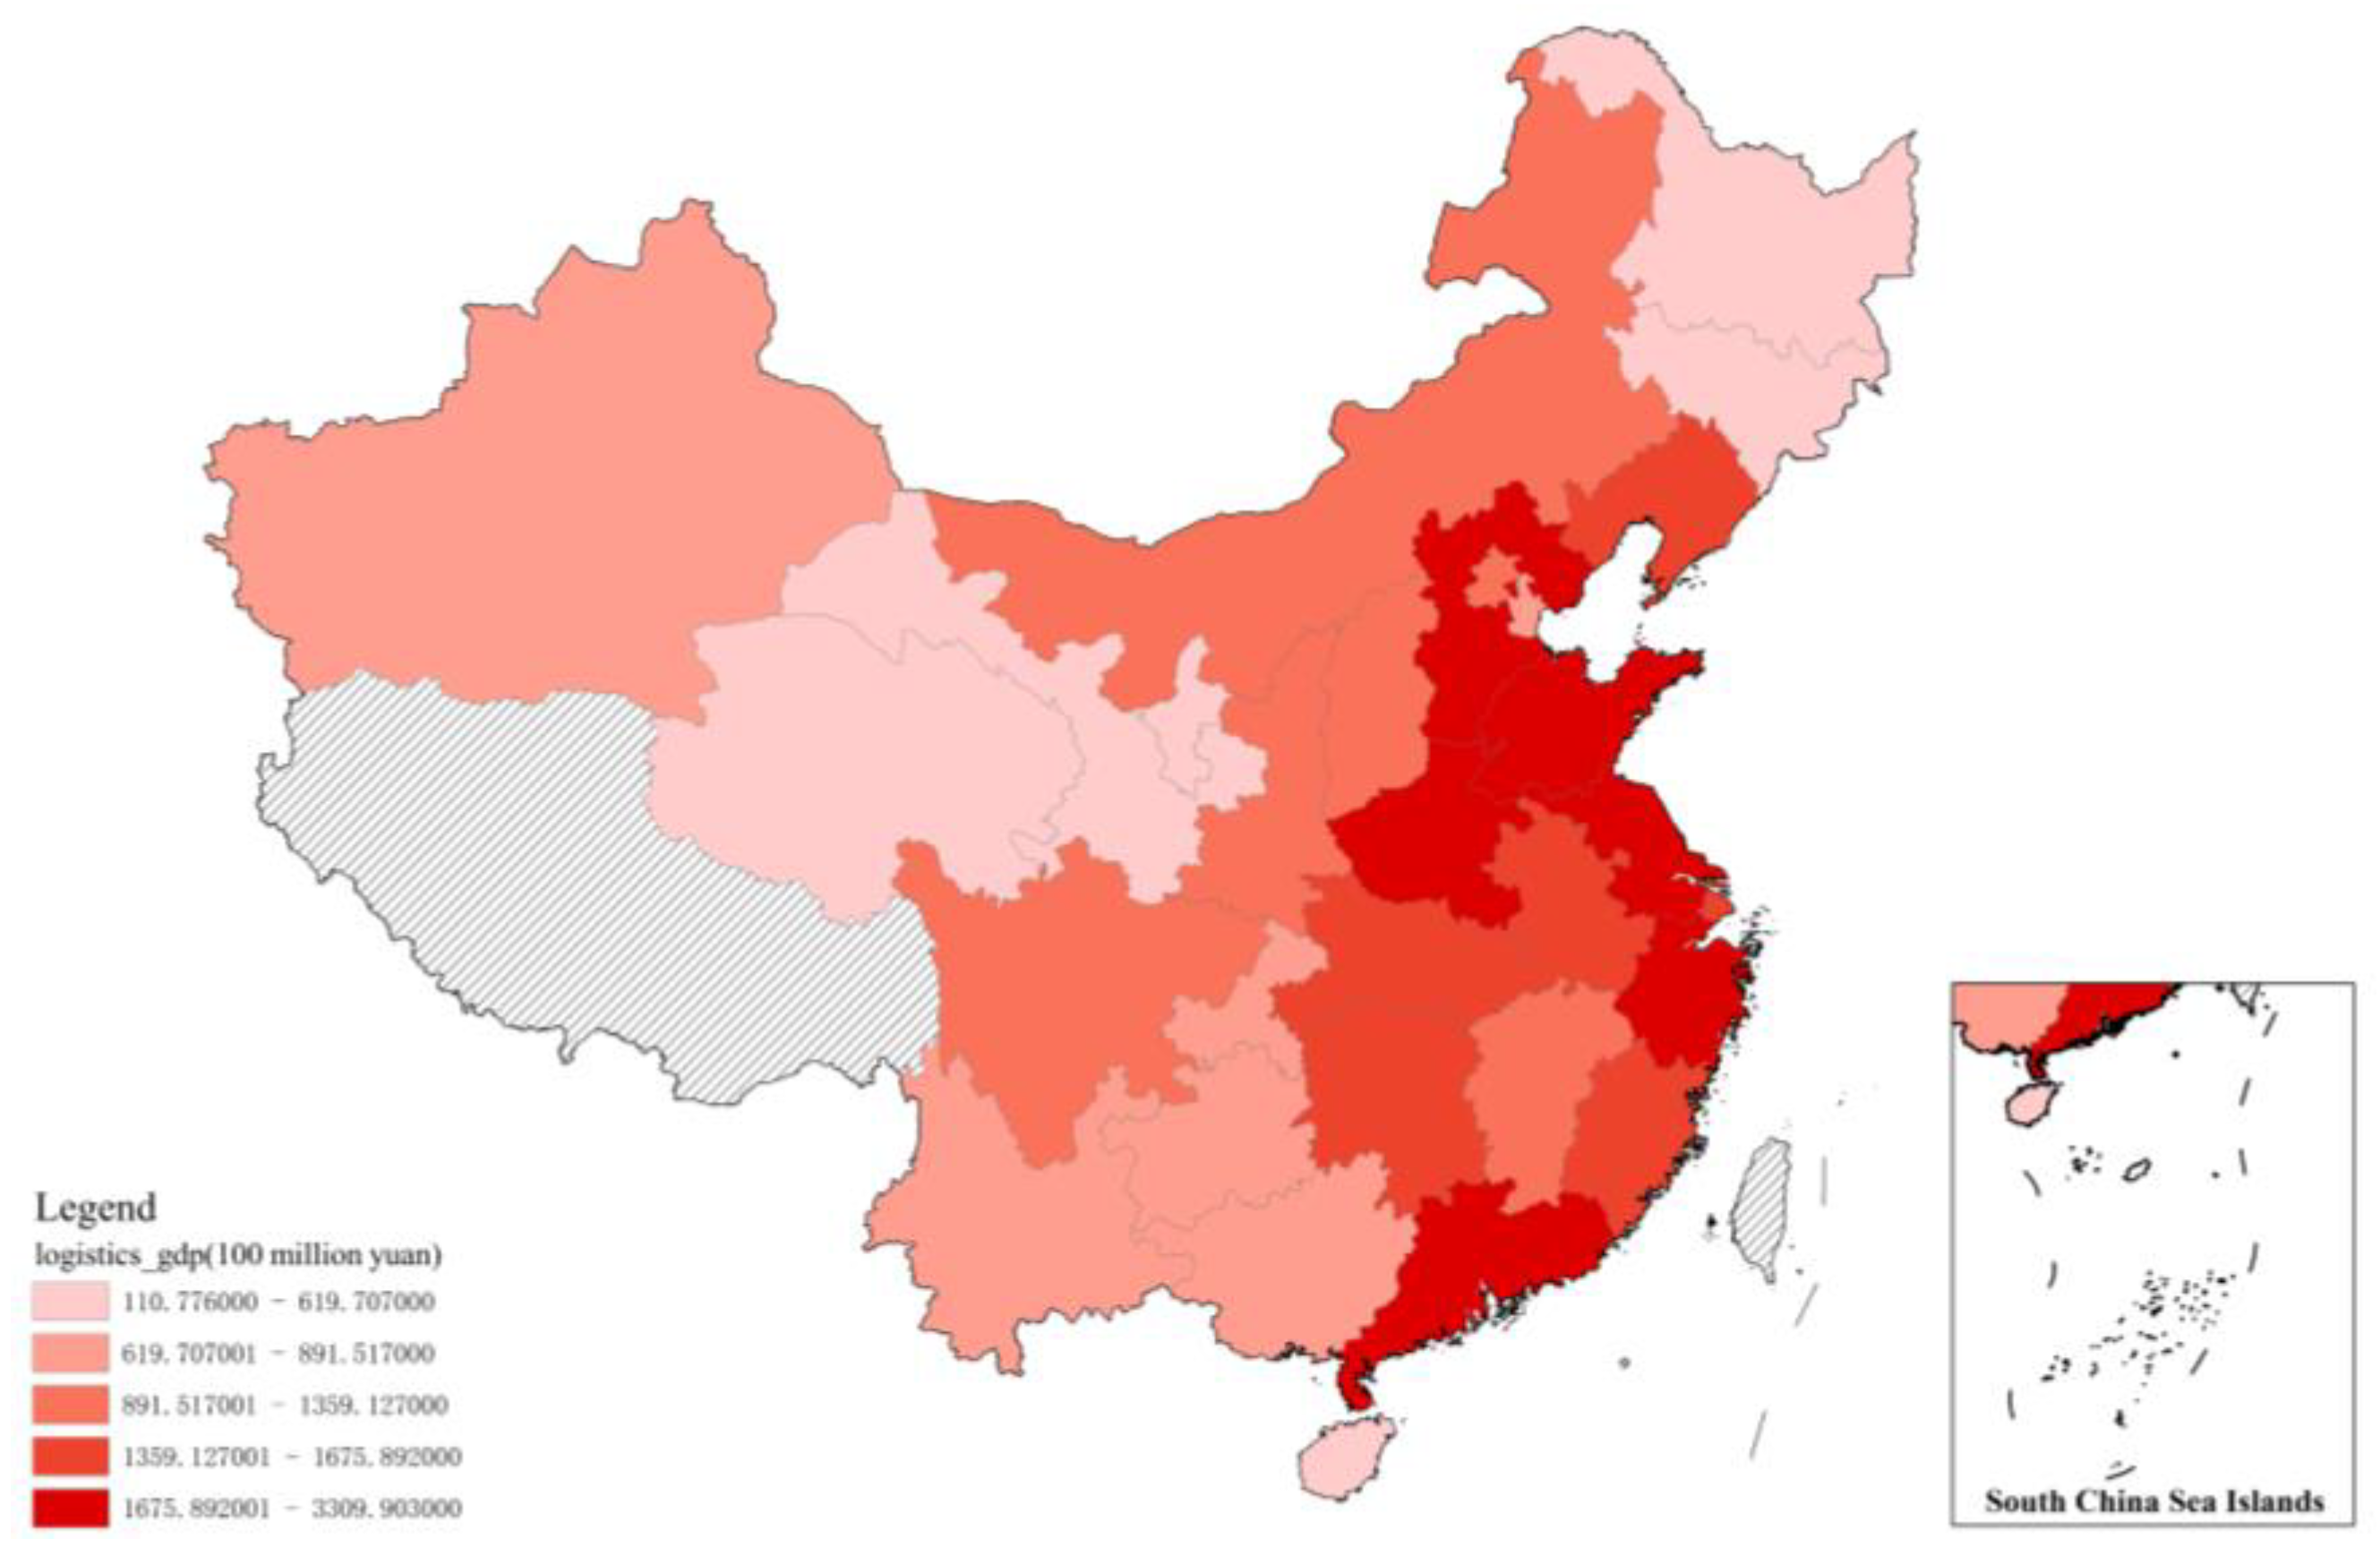
Figure 4.
Spatial pattern of average e-commerce transaction volume in Chinese provinces (2013-2022).
Figure 4.
Spatial pattern of average e-commerce transaction volume in Chinese provinces (2013-2022).
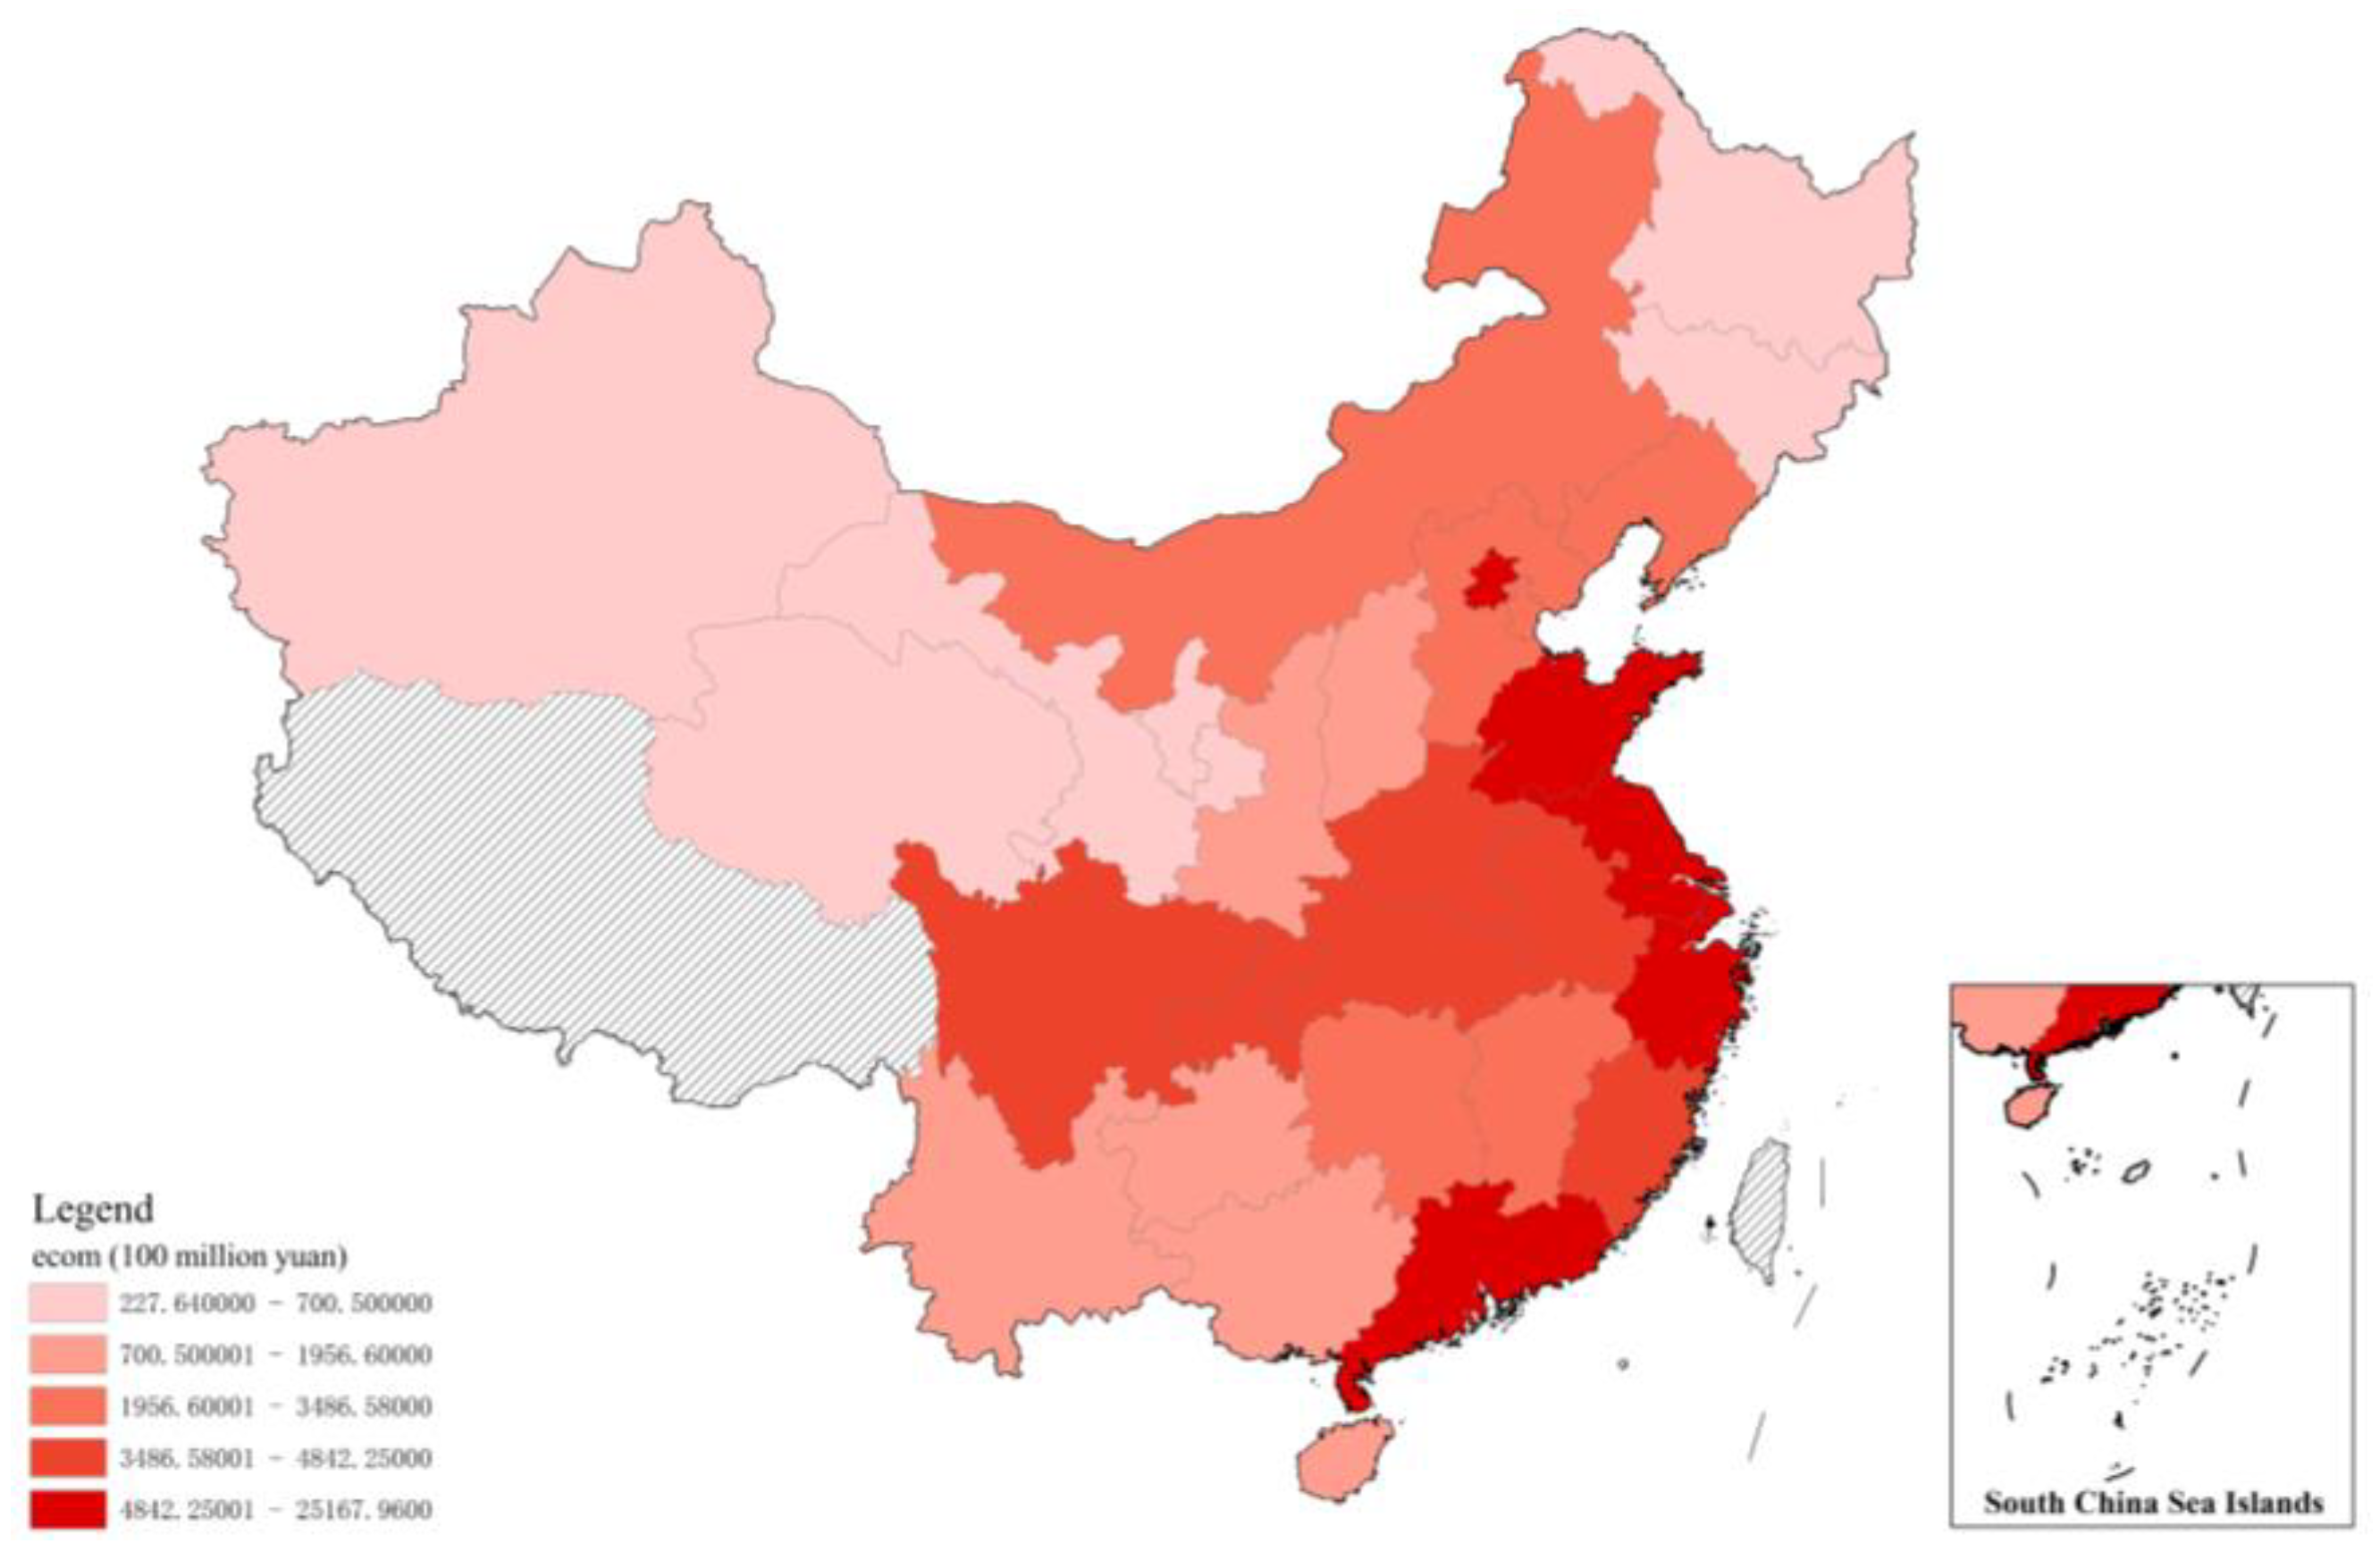
Figure 5.
Moran's I of logistics industry development level (2013-2022).
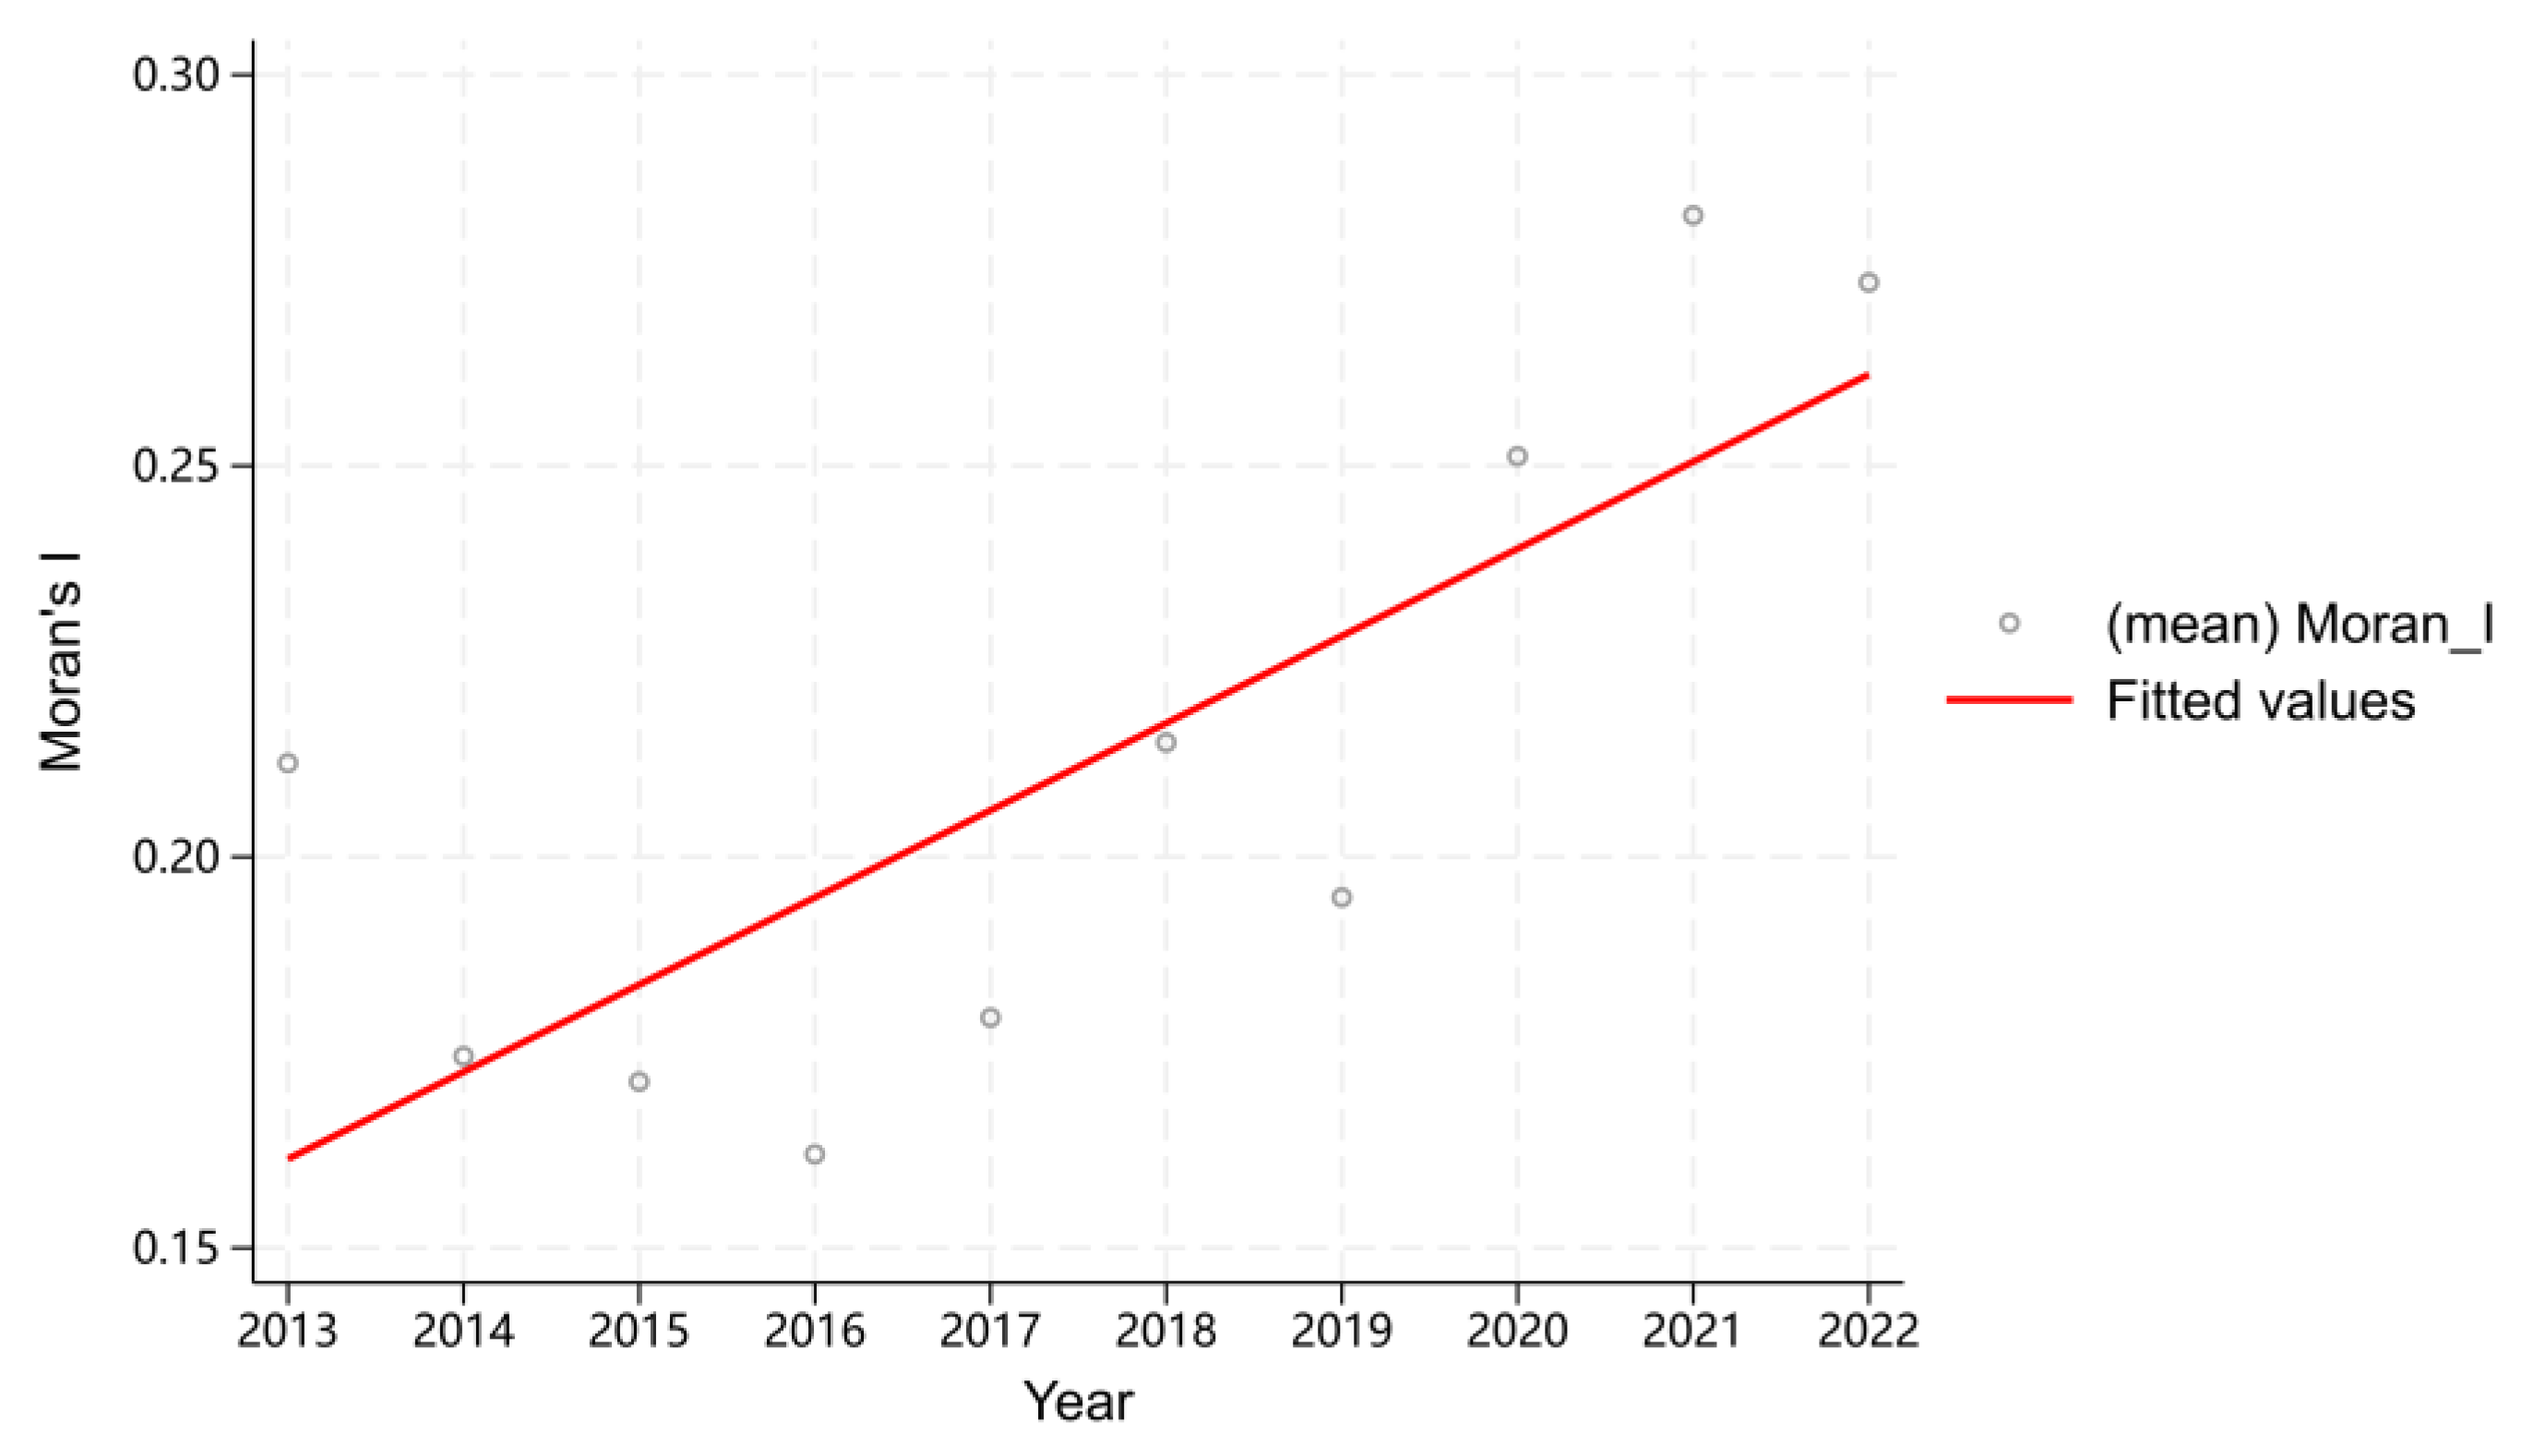
Figure 6.
Growth gap between virtual and real economic growth: eastern vs. central-western regions (CAGR, 2013-2022).
Figure 6.
Growth gap between virtual and real economic growth: eastern vs. central-western regions (CAGR, 2013-2022).
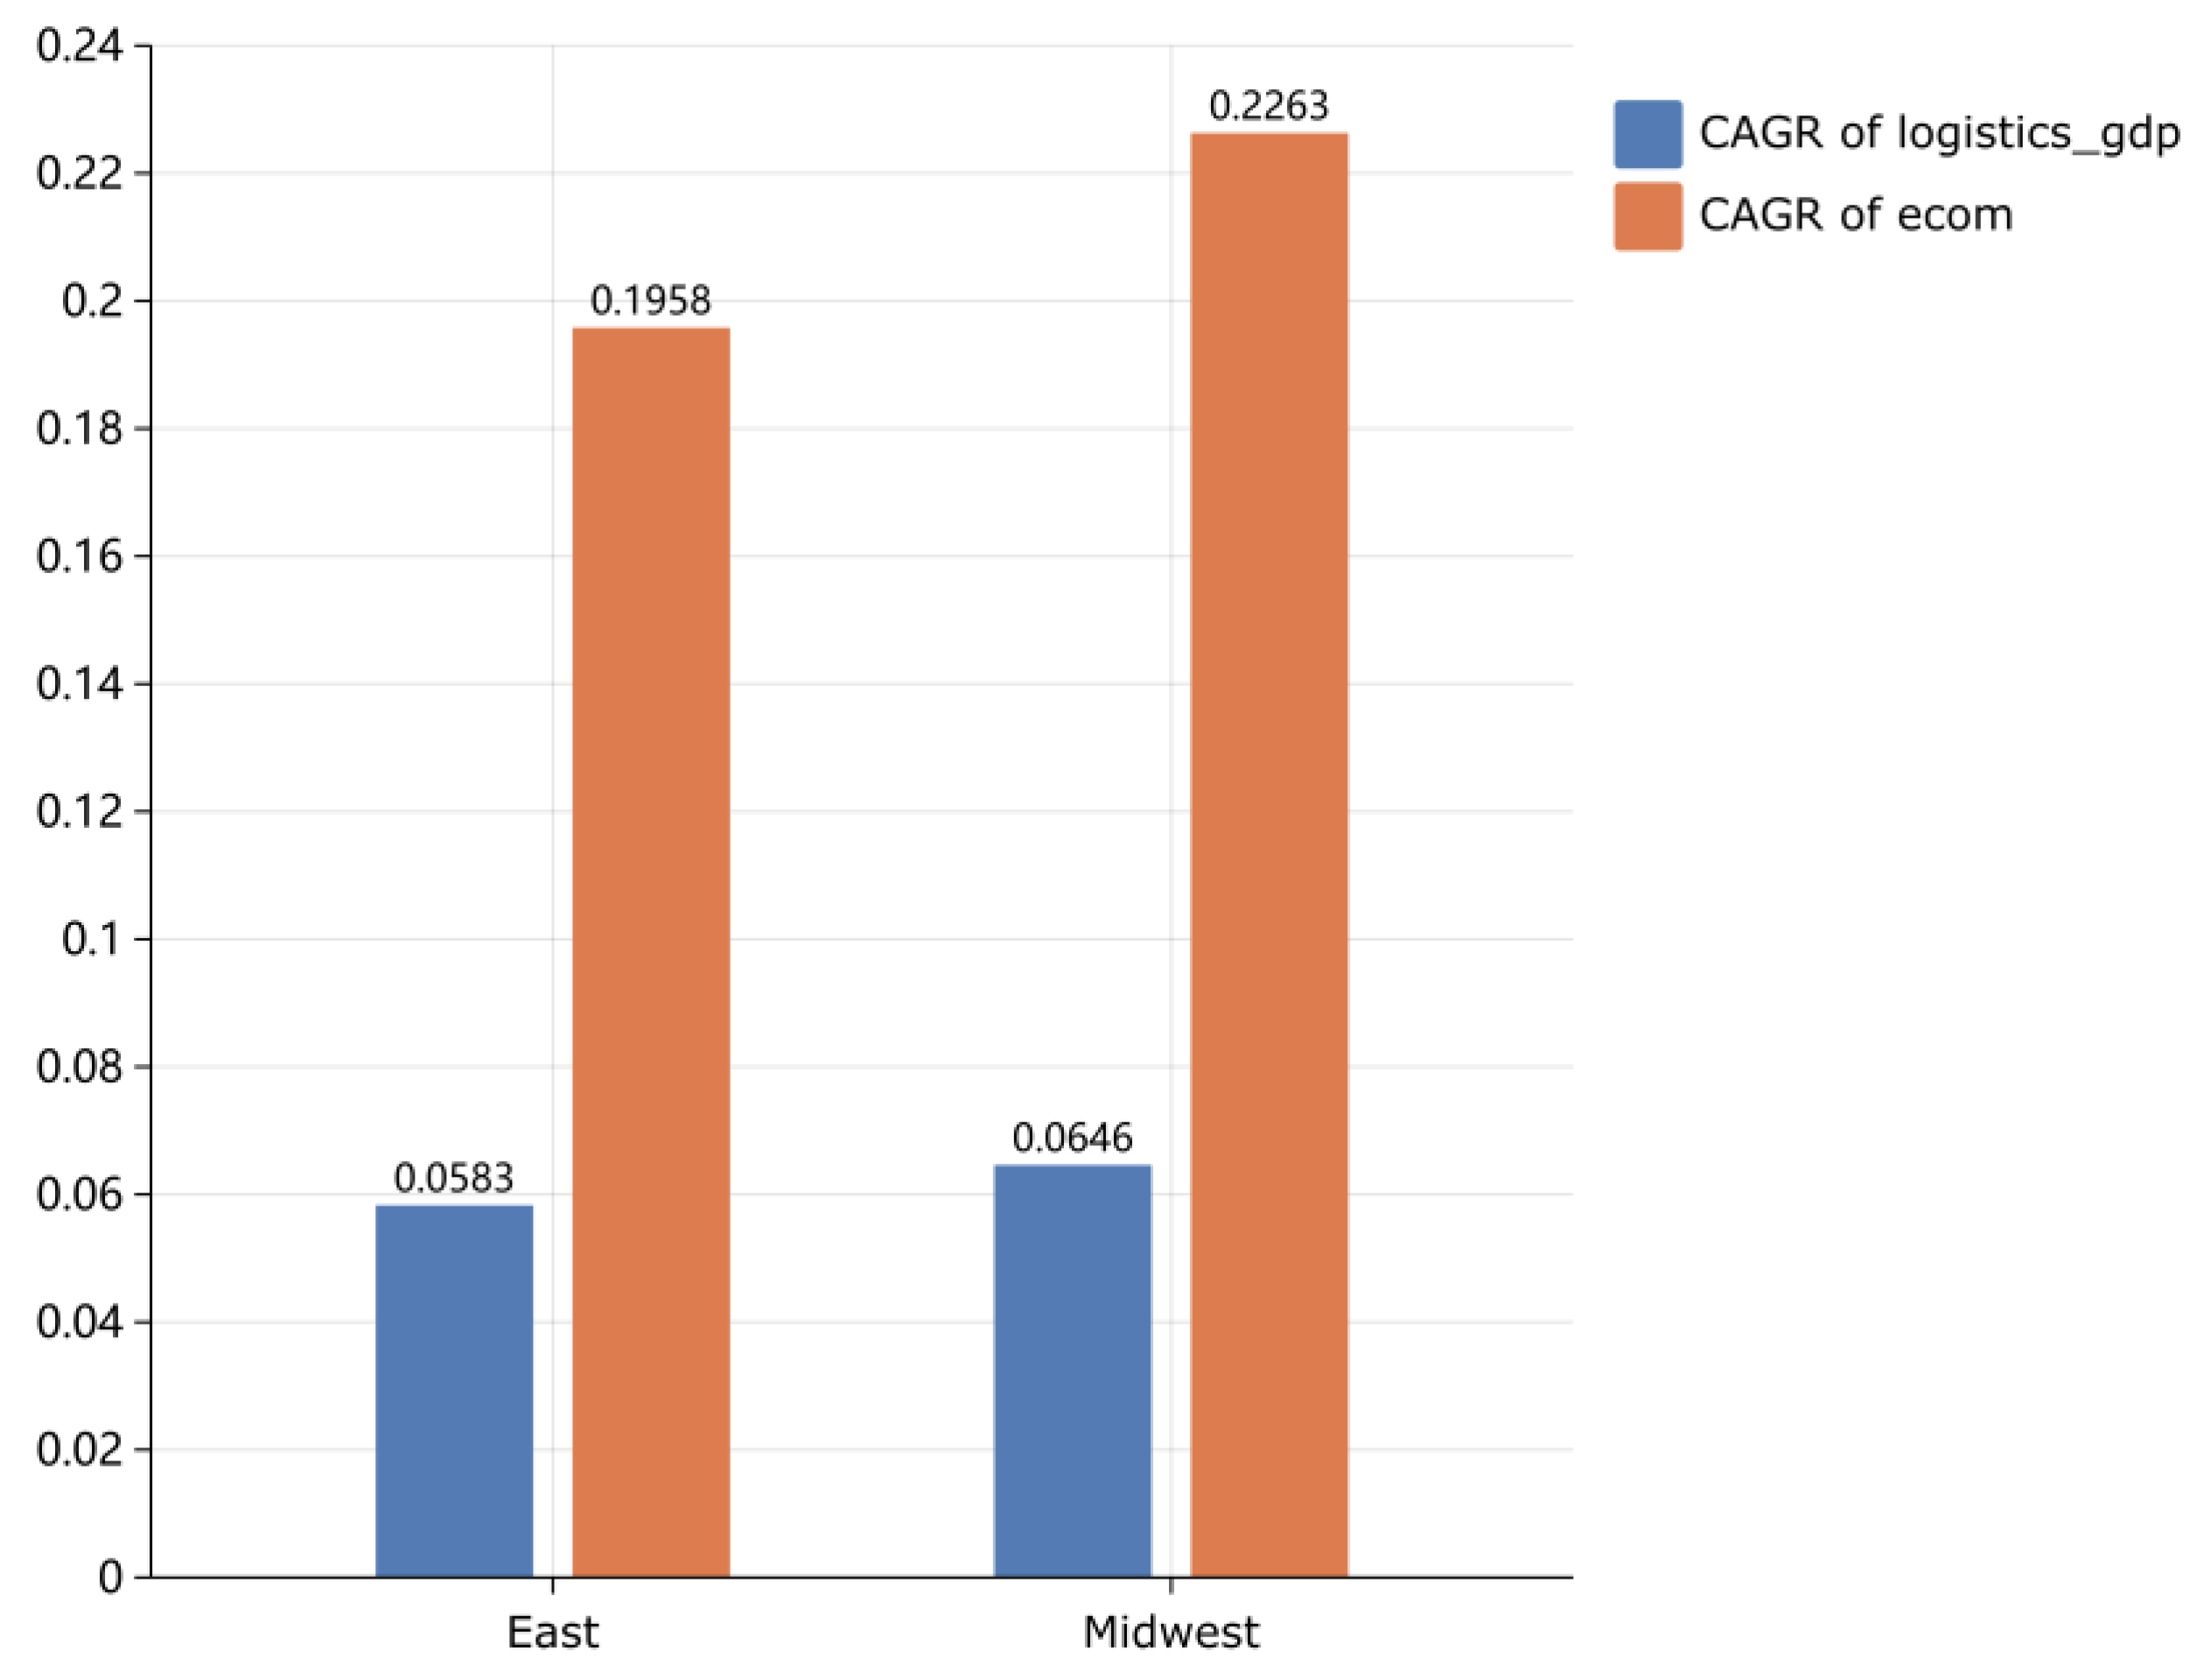

Table 1.
Variable definition and explanation.
| Variable Type | Variable Name | Symbol | Measurement Method | Data Source |
|---|---|---|---|---|
| Dependent Variable | Logistics Industry Value-Added | logistics_gdp | The logistics industry's overall economic output and scale in a region | China Statistical Yearbook of the Tertiary Industry |
| ln_logistics_gdp | Log of logistics_gdp | Author's Specifications | ||
| Independent Variable | Gross Merchandise Volume | ecom | The overall scale and activity level of e-commerce (virtual system) in a province | China Statistical Yearbook |
| ln_ecom | Log of ecom | Author's Specifications | ||
| Proxy Variable for Functional Nodes | Freight Volume | / | The total tonnage of goods actually transported in a region within one year | China Statistical Yearbook of the Tertiary Industry |
| Freight Turnover Volume | / | The product of freight volume (in tons) and average transportation distance (in kilometers) | ||
| Express Delivery Volume | ln_express_delivery_volume | The total number of express packages that a region handles in a year | ||
| Control Variables | per capita GDP | ln_per_capita_gdp | Log of the level of regional economic development | China Statistical Yearbook of the Tertiary Industry |
| Industry structure | IS | The proportion of the value added by the tertiary industry to the value added by the secondary industry | ||
| Digitalization Level | DL | The proportion of the tertiary industry's value-added to the secondary industry's value-added | Provincial Statistical Yearbooks of China | |
| Group/Time Variables | east | / | Dummy variable. It is 1 if the province is in the eastern region and 0 if it is not. | Author's Specifications |
| Central/Western | / | Dummy variable. It is 1 if the province is in the central, western, or northeastern regions, and 0 if it is not. | ||
| post_period | / | A dummy variable. If the year is between 2018 and 2022, it equals 1. If the year is between 2013 and 2017, it equals 0. |
Table 2.
Evaluation indicator system and weights for DL.
| Primary Indicator | Secondary Indicator | Meaning | Unit | Weight |
|---|---|---|---|---|
| Digital infrastructure | Mobile Phone Penetration Rate (MPPR) | Completeness of communication infrastructure | Department/100 people | 0.0662487 |
| Internet Broadband Access Subscribers (IBASN) | Degree of internet penetration | 10,000 households | 0.1711851 | |
| Digital innovation | R&D Intensity (RDI) | Emphasis on and investment in R&D | % | 0.330708 |
| Industrial digitalization | Proportion of E-Commerce Active Enterprises (EEPT) | Speed of transformation in e-commerce | % | 0.0615361 |
| Digital industrialization | Software Revenue to GDP Ratio (SRGDP) | Optimization of economic structure | % | 0.370322 |
Table 3.
Descriptive statistics.
| Variable | Obs | Mean | Std.Dev. | Min | Max |
| ln_logistics_gdp | 100 | 7.312 | 0.804 | 5 | 8.499 |
| ln_ecom | 100 | 8.733 | 1.172 | 5.17 | 10.767 |
| DL | 100 | 0.307 | 0.154 | 0.091 | 0.972 |
| IS | 100 | 1.822 | 1.169 | 0.754 | 5.283 |
| ln_per_capita_gdp | 100 | 11.356 | 0.402 | 10.482 | 12.156 |
| ln_logistics_gdp | 200 | 6.665 | 0.756 | 4.307 | 8.222 |
| ln_ecom | 200 | 7.213 | 1.125 | 3.564 | 9.561 |
| DL | 200 | 0.16 | 0.055 | 0.064 | 0.313 |
| IS | 200 | 1.215 | 0.242 | 0.665 | 1.953 |
| ln_per_capita_gdp | 200 | 10.791 | 0.291 | 10.05 | 11.477 |
Table 4.
Two-sample t test with equal variances.
| obs1 | obs2 | Mean1 | Mean2 | dif | St Err | t value | p value | |
| ln_logistics_gdp b~1 | 200 | 100 | 6.665 | 7.312 | -.647 | 0.095 | -6.85 | 0 |
| ln_ecom by east: 0 1 | 200 | 100 | 7.213 | 8.733 | -1.52 | 0.14 | -10.9 | 0 |
| DL by east: 0 1 | 200 | 100 | 0.161 | 0.307 | -.146 | 0.012 | -12 | 0 |
| IS by east: 0 1 | 200 | 100 | 1.215 | 1.822 | -.608 | 0.086 | -7.05 | 0 |
| ln_per_capita_gdp ~1 | 200 | 100 | 10.792 | 11.356 | -.565 | 0.041 | -13.9 | 0 |
Table 5.
CAGR comparison of logistics function-related indicators in central-western regions.
| Indicator Category | Indicator Name | 2013-2022 CAGR | Interpretation of Indicator Functions |
| Traditional Logistics System | Freight Volume | 2.44% | Slow growth of traditional logistics demand, which is caused by the size of the local real economy. |
| Freight Turnover Volume | 2.30% | Slow growth of traditional cargo network throughput | |
| Parcel Economy System | Express Delivery Volume | 32.21% | The number of parcels being processed is growing quickly because of the national e-commerce network. |
Table 6.
Results of structural break test.
| (1) | |
| ln_logistics_gdp | |
| ln_ecom | -0.0763** |
| (0.0338) | |
| 0.post2018 | 0 |
| (.) | |
| 1.post2018 | 3.129* |
| (1.697) | |
| 0.post2018#c.ln_ecom | 0 |
| (.) | |
| 1.post2018#c.ln_ecom | 0.0669* |
| (0.0348) | |
| IS | 0.0493 |
| (0.123) | |
| 0.post2018#c.IS | 0 |
| (.) | |
| 1.post2018#c.IS | -0.191 |
| (0.150) | |
| dl | 1.172 |
| (1.021) | |
| 0.post2018#c.DL | 0 |
| (.) | |
| 1.post2018#c.DL | -0.840 |
| (0.683) | |
| ln_per_capita_gdp | 0.974*** |
| (0.148) | |
| 0.post2018#c.ln_per_capita_gdp | 0 |
| (.) | |
| 1.post2018#c.ln_per_capita_gdp | -0.296* |
| (0.155) | |
| _cons | -3.542** |
| (1.509) | |
| N | 200 |
| R2 | 0.623 |
| adj. R2 | 0.562 |
Note: Standard errors in parentheses * p < 0.1, ** p < 0.05, *** p < 0.01.
Table 7.
Comparing the volume of express deliveries in the Central-Western regions to the volume of e-commerce transactions in the whole country before and after the breakpoint.
Table 7.
Comparing the volume of express deliveries in the Central-Western regions to the volume of e-commerce transactions in the whole country before and after the breakpoint.
| Variables | (1) | (2) | Variables | (1) | (2) |
| (1) ln_Central_Western_exp~e | 1.000 | (1) ln_Central_Western_exp~e | 1.000 | ||
| (2) ln_national_ec~l | 0.916 | 1.000 | (2) ln_national_ec~l | 0.947 | 1.000 |
| (0.084) | (0.004) | ||||
| (2013-2016) | (2017-2022) | ||||
Table 8.
Correlation analysis of freight turnover in the Central-Western regions and national e-commerce transaction volume: comparison before and after the breakpoint.
Table 8.
Correlation analysis of freight turnover in the Central-Western regions and national e-commerce transaction volume: comparison before and after the breakpoint.
| Variables | (1) | (2) | Variables | (1) | (2) |
| (1) ln_Central_Western_fre~r | 1.000 | (1) ln_Central_Western_fre~r | 1.000 | ||
| (2) ln_national_ec~l | 0.654 | 1.000 | (2) ln_national_ec~l | 0.902 | 1.000 |
| (0.159) | (0.098) | ||||
| (2013-2018) | (2019-2022) | ||||
Table 9.
SLX model regression results: eastern vs. central-western regions.
| (1) | (2) | |
| East | Central/Western | |
| ln_logistics_gdp | ln_logistics_gdp | |
| W_ln_ecom | 0.152** | -0.0155 |
| (0.0664) | (0.0629) | |
| ln_ecom | 0.204** | -0.0638 |
| (0.0736) | (0.0745) | |
| DL | -0.973** | 0.429 |
| (0.332) | (1.212) | |
| IS | 0.144 | 0.0815 |
| (0.0948) | (0.163) | |
| ln_per_capita_gdp | -0.0636 | 1.037*** |
| (0.201) | (0.348) | |
| _cons | 4.970** | -4.115 |
| (1.679) | (3.292) | |
| N | 100 | 200 |
| R2 | 0.736 | 0.605 |
| adj. R2 | 0.722 | 0.594 |
Note: Standard errors in parentheses * p < 0.1, ** p < 0.05, *** p < 0.01.
Table 10.
Robustness tests (replace the core explanatory variable & reduce the control variables).
| (1) | (2) | (3) | (4) | |
| East | Central/Western | East | Central/Western | |
| ln_logistics_gdp | ln_logistics_gdp | ln_logistics_gdp | ln_logistics_gdp | |
| W_ln_express_delivery_volume | 0.207* | -0.458* | ||
| (0.0986) | (0.230) | |||
| ln_express_delivery_volume | 0.00784 | 0.358 | ||
| (0.0609) | (0.234) | |||
| ln_ecom | 0.226*** | -0.0665 | ||
| (0.0655) | (0.0753) | |||
| W_ln_ecom | 0.161** | -0.00209 | ||
| (0.0688) | (0.0579) | |||
| DL | -1.004* | 0.740 | -0.877* | 0.710 |
| (0.482) | (1.090) | (0.412) | (0.959) | |
| IS | 0.0962 | 0.174 | ||
| (0.114) | (0.183) | |||
| ln_per_capita_gdp | -0.0594 | 1.128*** | -0.0148 | 1.012*** |
| (0.201) | (0.264) | (0.231) | (0.335) | |
| _cons | 5.524** | -4.702* | 4.385* | -3.874 |
| (1.800) | (2.522) | (2.023) | (3.162) | |
| N | 100 | 200 | 100 | 200 |
| R2 | 0.716 | 0.670 | 0.721 | 0.603 |
| adj. R2 | 0.701 | 0.662 | 0.710 | 0.595 |
Note: Standard errors in parentheses * p < 0.1, ** p < 0.05, *** p < 0.01.
Table 11.
Robustness tests (increase the control variables & exclude some provinces).
| (1) | (2) | (3) | (4) | |
| East | Central/Western | East | Central/Western | |
| ln_logistics_gdp | ln_logistics_gdp | ln_logistics_gdp | ln_logistics_gdp | |
| ln_ecom | 0.206** | -0.0665 | 0.202** | -0.0453 |
| (0.0752) | (0.0730) | (0.0722) | (0.0790) | |
| W_ln_ecom | 0.154** | -0.00811 | 0.219*** | -0.0213 |
| (0.0656) | (0.0623) | (0.0555) | (0.0903) | |
| IS | 0.137 | 0.0774 | 0.145 | 0.272* |
| (0.0972) | (0.157) | (0.105) | (0.155) | |
| ln_per_capita_gdp | -0.0642 | 1.031*** | -0.168 | 1.101** |
| (0.201) | (0.346) | (0.220) | (0.397) | |
| DL | -0.980** | 0.323 | -1.045*** | -0.774 |
| (0.332) | (1.225) | (0.274) | (1.366) | |
| classified highways | -0.000722 | -0.00197** | ||
| (0.00114) | (0.000868) | |||
| _cons | 4.972** | -4.040 | 5.548** | -4.918 |
| (1.681) | (3.273) | (1.886) | (3.620) | |
| N | 100 | 200 | 90 | 170 |
| R2 | 0.737 | 0.608 | 0.754 | 0.642 |
| adj. R2 | 0.720 | 0.596 | 0.739 | 0.631 |
Note: Standard errors in parentheses * p < 0.1, ** p < 0.05, *** p < 0.01.
Table 12.
Competitive hypothesis test regressions: grouped by digitalization level.
| (1) | (2) | (3) | (4) | |
| East | Central/Western | East | Central/Western | |
| ln_logistics_gdp | ln_logistics_gdp | ln_logistics_gdp | ln_logistics_gdp | |
| ln_ecom | 0.0989 | -0.0749 | 0.140 | 0.0921 |
| (0.0614) | (0.0970) | (0.116) | (0.0625) | |
| 2013.year#c.ln_ecom | 0 | 0 | 0 | 0 |
| (.) | (.) | (.) | (.) | |
| 2014.year#c.ln_ecom | -0.0200 | -0.0520 | -0.0500 | -0.0746 |
| (0.0196) | (0.0367) | (0.0667) | (0.0599) | |
| 2015.year#c.ln_ecom | -0.0172 | -0.112* | -0.0493 | -0.149** |
| (0.0270) | (0.0629) | (0.107) | (0.0602) | |
| 2016.year#c.ln_ecom | -0.0298 | -0.0812 | -0.0733 | -0.103 |
| (0.0262) | (0.0533) | (0.151) | (0.0807) | |
| 2017.year#c.ln_ecom | -0.0255 | -0.0464 | -0.0212 | -0.0696 |
| (0.0274) | (0.0504) | (0.137) | (0.0694) | |
| 2018.year#c.ln_ecom | -0.0322 | 0.00675 | 0.0259 | -0.0648 |
| (0.0317) | (0.0779) | (0.121) | (0.0954) | |
| 2019.year#c.ln_ecom | -0.0623 | -0.0228 | 0.0240 | -0.0768 |
| (0.0428) | (0.0851) | (0.128) | (0.0987) | |
| 2020.year#c.ln_ecom | -0.0721 | 0.0160 | -0.0462 | -0.0857 |
| (0.0433) | (0.0700) | (0.119) | (0.0708) | |
| 2021.year#c.ln_ecom | -0.0721 | -0.000881 | 0.0589 | -0.123 |
| (0.0422) | (0.0910) | (0.111) | (0.0906) | |
| 2022.year#c.ln_ecom | -0.0812 | -0.0344 | -0.00914 | -0.148 |
| (0.0472) | (0.115) | (0.0807) | (0.126) | |
| IS | 0.0507 | -0.119 | 0.0940 | 0.0403 |
| (0.112) | (0.242) | (0.119) | (0.251) | |
| DL | -0.527 | -3.199 | -1.185*** | 4.672 |
| (0.815) | (3.432) | (0.287) | (3.544) | |
| ln_per_capita_gdp | 0.615 | 1.084* | -0.307 | 1.153** |
| (0.382) | (0.534) | (0.255) | (0.365) | |
| _cons | -0.559 | -4.174 | 9.585*** | -7.045 |
| (4.281) | (5.290) | (2.685) | (3.825) | |
| N | 150 | 150 | 80 | 80 |
| R2 | 0.701 | 0.566 | 0.843 | 0.668 |
| adj. R2 | 0.649 | 0.491 | 0.783 | 0.540 |
Note: Standard errors in parentheses * p < 0.1, ** p < 0.05, *** p < 0.01.
Disclaimer/Publisher’s Note: The statements, opinions and data contained in all publications are solely those of the individual author(s) and contributor(s) and not of MDPI and/or the editor(s). MDPI and/or the editor(s) disclaim responsibility for any injury to people or property resulting from any ideas, methods, instructions or products referred to in the content. |
© 2025 by the authors. Licensee MDPI, Basel, Switzerland. This article is an open access article distributed under the terms and conditions of the Creative Commons Attribution (CC BY) license (http://creativecommons.org/licenses/by/4.0/).
Copyright: This open access article is published under a Creative Commons CC BY 4.0 license, which permit the free download, distribution, and reuse, provided that the author and preprint are cited in any reuse.


