
Submitted:
11 November 2025
Posted:
12 November 2025
You are already at the latest version
Abstract
T-2 mycotoxins are known to induce toxic effects in animals. Kidneys are highly susceptible to oxidative stress caused by toxins, leading to cellular injury, apoptosis, and altered cell cycle regulation. Critical regulators of these processes include tumor suppressor protein p53 and cyclin-dependent kinase inhibitor p21. As up to now knowledeges on immunolocalization of p53 and p21 during T-2 mycotoxicosis in avian kidney are limited, the study aims to investigate immunolocalization of two critical apoptosis regulatory proteins - p53 and p21 - in kidneys of broiler chickens exposed to T-2 mycotoxin. In the study ten 7-day-old female layer-type Ross chickens (Gallus gallus domesticus) were divided into control and T-2 toxin groups. For T-2 toxin group T-2 toxin was administered orally for three days. 24 hours after last dose, chickens were sacrificed, kidney tissues were collected and fixed for immunohistochemical staining. Immunohis-tochemical study using polyclonal primary antibodies p21 and p53 (Abcam, UK) revealed stronger expression of p53 and p21 in kidneys of T-2-treated chickens than in healthy chicken of control group. Both proteins localized mainly in renal proximal tubules’ epithelial cells. Increased expression of p53 and p21 highlights their role in T-2-induced renal toxicity and suggests potential biomarkers for early nephrotoxicity detection.
Keywords:
T-2 mycotoxicosis
; p53
; p21
; immunohistochemistry
; kidneys
1. Introduction
T-2 mycotoxin, produced by the genus Fusarium, is known for its toxic effects in various organs and organ systems posing serious hazards to humans and animals and causing severe economic impact to the cereal industry [1,2]. Among mycotoxins, T-2 toxin is the most toxic trichothecene [3,4]. Changes in metabolic pathways have been described in organs of the immune and gastrointestinal systems, such as thymus, spleen, liver, stomach, and duodenum [5,6,7,8]. Besides attacking the reproductive organs in mature organisms, it has been shown that T-2 can easily pass through the placental barrier of the pregnant mammals and cause toxicity to the embryo [9,10].
After administration of T-2 mycotoxin, damages occur in all vital organs – heart, brain, lungs, liver, kidneys. In cardiovascular system, cardiac toxicity induced by T-2 toxin is characterized by increased capillary permeability, hemorrhages, necrosis and death of cardiomyocytes, infiltration of inflammatory cells in the heart [11]. T-2 toxin exposure causing cardiac fibrosis and cardiac dysfunction has been described. T-2 toxin exposure-induced cardiac damage involves mitochondrial dysfunction, reactive oxygen species (ROS), peroxisome proliferator-activated receptor-gamma signaling pathway, endoplasmic reticulum, transforming growth factor beta 1 /smad family member 2/3 (Smad2/3) signaling pathway, and autophagy and inflammatory responses.
In brain tissue mycotoxins are able to penetrate by the blood-brain barrier, triggering oxidative stress and neuroinflammation, leading to oxidative damage and apoptosis of brain cells [11]. In neurotoxic mechanisms AFB1 and T-2 toxin causes neuronal damage in the cerebral cortex and hippocampus, leading to synaptic transmission dysfunction, ultimately impairing the nervous system function of the body. The toxic mechanism in brain tissue is related to excessive ROS, oxidative stress, mitochondrial dysfunction, apoptosis, autophagy, and an exaggerated inflammatory response.
In respiratory system T-2 mycotoxin causes nasal itching, pain, sneezing, rhinorrhea; the pulmonary and tracheobronchial toxicity can produce dyspnea, wheezing, cough, and bloodtinged sputum. The toxin inhibits protein synthesis by targeting the ribosome, impair mitochondrial function, activates MAPKs, elicits recruitment of alveolar macrophages and neutrophils, pulmonary hemorrhage, cytokine production, and damages organs [12]. In fact, it has been reported that toxicity following inhalation of a toxic dose of mycotoxin leads to systemic effects exclusive of lung injury. Even when mycotoxins are ingested, they can cause chronic inflammation of the lungs. Mycotoxins may also trigger chronic obstructive pulmonary disease in farm animals.
Histopathological analysis has shown that the T-2 mycotoxin causes pathological changes in liver tissue, including hepatocyte edema, increased volume, and more granules in the cytoplasm [13]. It suggests that the exposition to the T-2 leads to hepatocyte apoptosis. At the molecular level, T-2-induced mitochondria-mediated apoptosis was caused by producing ROS and promoting cytochrome c translocation between mitochondria and cytoplasm.
After the T-2 mycotoxin exposure on kidney tissue degeneration of mitochondria, apoptosis and necrosis of renal proximal and distal tubules, karyomegalia and binucleation of epithelial cells has been noted [4]. The patohistological findings has revealed dose and duration-dependent modifications. The investigations on juvenile goats after 30 days of T-2 toxin-contaminated diet revealed the renal tissue degeneration of the epithelial lining of proximal and distal convoluted tubules, renal tubular necrosis, degeneration of the mitochondria and nuclei with heterochromatin condensation and indistinct nuclear membrane [14]. Affected epithelial cells had a loss of cristae, leading to the creation of empty space and rendering the mitochondria to pleomorphic forms (variable sizes and shapes — rounded, dumb bell, curved). Biochemical analysis showed increased levels of blood urea nitrogen and serum creatinine. A significant increase in oxidative stress enzymes such as malondialdehyde and decrease in superoxide dismutase, catalase, and glutathione in kidneys enhanced the role of free radicals in causing kidney damage. The main renal histological changes were the swelling and diffuse vacuolar degeneration of the tubular epithelium. In the studies on Wistar rats after 12 weeks of toxin-contaminated diet, almost all animals showed severe degeneration of proximal convoluted tubule epithelial cells, obliterating the lumen with the presence of denuded cells and protein aceous material in their lumina [15]. The presence of karyomegaly and binucleation in epithelial cells and mononuclear cell infiltration around glomeruli and in the interstitium was also observed. In the study about the effect of the different dosage of mycotoxins on the occurrence of apoptosis in the swine kidney epithelial cells, trichothecene T2 toxin was used at a concentration of 2.5 µM and 25 µM [16]. T2 toxin at a concentration of 2.5 µM caused apoptosis in 6.9% of the cells, whereas at a concentration of 25 µM in 26.35% of the cells.
It is known that in kidneys toxins causes tubular necrosis and intracellular stress, which triggers various response mechanisms [17,18,19,20]. In the cellular response to DNA damage, the tumor suppressor protein p53 and a cyclin-dependent kinase (CDK) inhibitor p21 play a key role and the activation of p53, the major regulator of cell cycle arrest, apoptosis, and senescence, can lead to apoptosis in case of unrepaired DNA damage, or indirectly to the block of cell cycle progression by transactivating p21 [21,22,23]. Although the effects of T-2 mycotoxin are relatively well documented and it is well known that T-2 toxin induces apoptosis the research of molecular mechanism of this process is still unclear [16,24]. Up to now the research focused on the role of p53 and p21 in DNA damage response, cell cycle regulation and apoptosis, the specific studies investigating the immunolocalization and expression of these proteins in kidney tissue are less common. Studies investigating their expression in the context of kidney damage are more represented in scientific studies dealing with a wide range of toxins and chemicals, while the T-2 mycotoxin and its effects in kidney tissue have focused more on macroscopic and histological changes. As the knowledeges on the immunolocalization of p53 and p21 during T-2 mycotoxin-induced kidney damage in avian kidneys are limited, however studies on different affected organs affected by T-2 mycotoxins on molecular level are indicating to the p53-dependent apoptosis pathway, the study aims to investigate the immunolocalization of the two critical apoptosis regulatory proteins - p53 and p21- in the kidneys of broiler chickens exposed to T-2 mycotoxin. Understanding the expression patterns of these proteins can provide insight into the molecular mechanisms underlying renal toxicity.
2. Materials and Methods
In the study ten layer-type 7 days old Ross broilers (Gallus gallus domesticus) from a commercial Macedonian hatchery, divided equally into control (healthy chicken) and T-2 toxin groups, participated. Chickens were raised in a temperature-controlled brooders in standard conditions, with a day: night regime of 23h: 1h, feed and water were given ad libitum. For the T-2 toxin group, T-2 mycotoxin (Sigma, Germany; Cat. No. T4887) was dissolved in water and given per os (0.250 mg/chick/day) for three consecutive days, starting from the fourth day after hatching. 24 hours after the application of the last dose of toxin, chickens were sacrificed with an intracardiac overdose of 0.5 mL 20% sodium pentobarbital and kidney specimens, 0.5–1.0 cm in diameter, were fixed in 10% neutral buffered formalin solution, dehydrated in a series of alcohol, embedded into paraffin, and slices 7 μm in thickness were cut (microtome Leica 2135). Thereafter, the slices were deparaffinised with xylene and rehydrated in a graded series of ethanol. For the immunohistochemical staining (IHC) polyclonal primary antibodies p21 and p53 (Abcam, Cambridge, UK) and IHC kit which contained the corresponding secondary antibodies were used according to the manufacturer’s guidelines (IHC kit, Abcam, UK). After the endogenous peroxidase activity was blocked with 3% H2O2, the sections were pre-treated using heat mediated antigen retrieval with sodium citrate buffer (pH 6) for 20 min and thereafter incubated with primary antibodies in 1:1000 dilution for 30 min at 37 °C. Biotinylated secondary antibody and streptavidin-conjugated peroxidase which were contained in the IHC kit were used for detection using DAB as chromogen. Nuclei were counterstained with Harris Hematoxylin. The negative controls of T-2 mycotoxicated chicken kidneys contained antibody diluent (Dako, S0809, Glostrup, Denmark) instead of primary antibodies, and the examples of the antibody producer’s homepage (https://www.abcam.com/en-us/products/primary-antibodies/p21-antibody; https://www.abcam.com/en-us/products/primary-antibodies/p53-antibody) about the used antibodies’ reactions on kidney tissue were used as positive controls to identify p21 and p53.
The IHC study was performed twice to confirm the results of the first experiment. The immunolocalization of p21 and p53 was observed by two scientists using an eye visual control in a blind analysis, and the intensity of both protein expressions in the chicken renal tubules was categorized as weak (+), moderate (++), or strong (+++). The photos of the slides were taken using a PreciPoint M8 digital microscope (PreciPoint, München, Germany). The statistical analysis was performed using Python software (version 3.12.4, 2024). To compare the control and T-2 toxin groups, paired t-test was conducted.
The experimental protocol was approved by the Ethical Committee of Ss. Cyril & Methodius University in Skopje in conformity with the recommendation provided in the European Convention for the Protection of Vertebrate Animals used for Experimental and Other Scientific Purposes (ETS no. 123, Appendix A) (No. 03-7534 from 12.04.2013).
3. Results
3.1. Immunohistochemistry
Immunohistochemical analysis revealed the immunolocalization of p21 and p53 in the kidney tissue of broiler chickens. Strong expression of both of the studied proteins - p53 and p21 was noticed in the epithelial cells of the proximal convoluted tubeles (PCT) of the T-2 toxin group chicken. The proteins localized primarily in the PTC’s epithelial cells’s nuclei; however, a moderate staining of cytoplasm was observed. Besides the strong expression of p53 in PCT, it was immunolocalized in glomerular cells and in lesser extent also in the cells of distal tubules as well as in endotheliocytes of small blood vessels of the T-2 toxin group birds’ (Figure 1a).
Compared to the control group, strong expression of p21 was noted in the nuclei and cytoplasm of the epithelial cells of the PCT as well as in the nuclei of sinusoidal endothelial cells in T-2 toxin group’s chicken (Figure 2a). The expression of p21 was noted also in DCT-s and small blood vessel’s endothelial cells and lesser in glomerular cells. No strong expression of p21 and p53 were noted in the control group’s chicken kidneys (Figure 1b and Figure 2d).
The negative controls of T-2 mycotoxicated chicken kidneys containing antibody diluent instead of primary antibodies, showed no specific staining (Figure 3).
The descriptive (eye visual) analysis of the expression of p53 and p21 in chickens kidney tissue was repeated twice, observed at least by 2 scientists and the comparative results of the staining intensities of the T-2 toxin group and control group are shown in Table 1. Inside each group, the staining intensities occurred to be similar.
3.2. Statistical Analysis
The statistical analysis was performed using software Python (version 3.12.4, 2024) which enables to convert the qualitative data obtained from the IHC study to quantitative form. The numeric values (Table 1) were converted to the intensity of staining: + = 1 (weak), ++ = 2 (moderate), +++ = 3 (strong), and the statistics were calculated for both groups. During the analysis, the mean staining intensity for the studied groups as well as the variability of the staining intensity (standard deviation = SD within each group) was found (Table 2). Both proteins showed a significantly higher mean intensity in the T-2 mycotoxin group compared to the control. A paired t-test indicates a statistically significant difference (p < 0.05) for both proteins. The paired t-test confirmed that these differences were significant, with p-values less than 0.05. These findings suggest that T-2 mycotoxin exposure significantly increases the expression of both studied proteins.
4. Discussion
Mycotoxins are secondary metabolites produced by different molds including Aspergillus, Penicillium, Fusarium and Stachybotrys spp [16]. With the ability to enter the organism not only by ingestion, but also through inhalation of contaminated air, mycotoxins are a great threat to the health of animals and humans. Nephrotoxic, hepatotoxic, immunotoxic, dermotoxic, estrogenic, carcinogenic, mutagenic, terato-genic effects and toxic actions to the hematopoietic system have been described. Mycotoxins such as trichothecenes, alatoxins, ochratoxin A, fumonisins and zearalenone can lead to the apoptosis - a programmed cell death [25]. The initiation of apoptosis goes through one of two pathways: intrinsic or extrinsic pathways. In the inner pathway, or as it is more commonly known, the intrinsic or mitochondrial pathway, the cell sensing the cellular stress kills itself. In the outer or so-called extrinsic pathway, the tumor necrosis factor pathway, and the first apoptosis signal pathway caused by the signals from other cells. Programmed cell death is a physiological process occurring in the postnatal period and during embryogenesis. Disorders during its course can lead to the occurrence of various diseases [26].
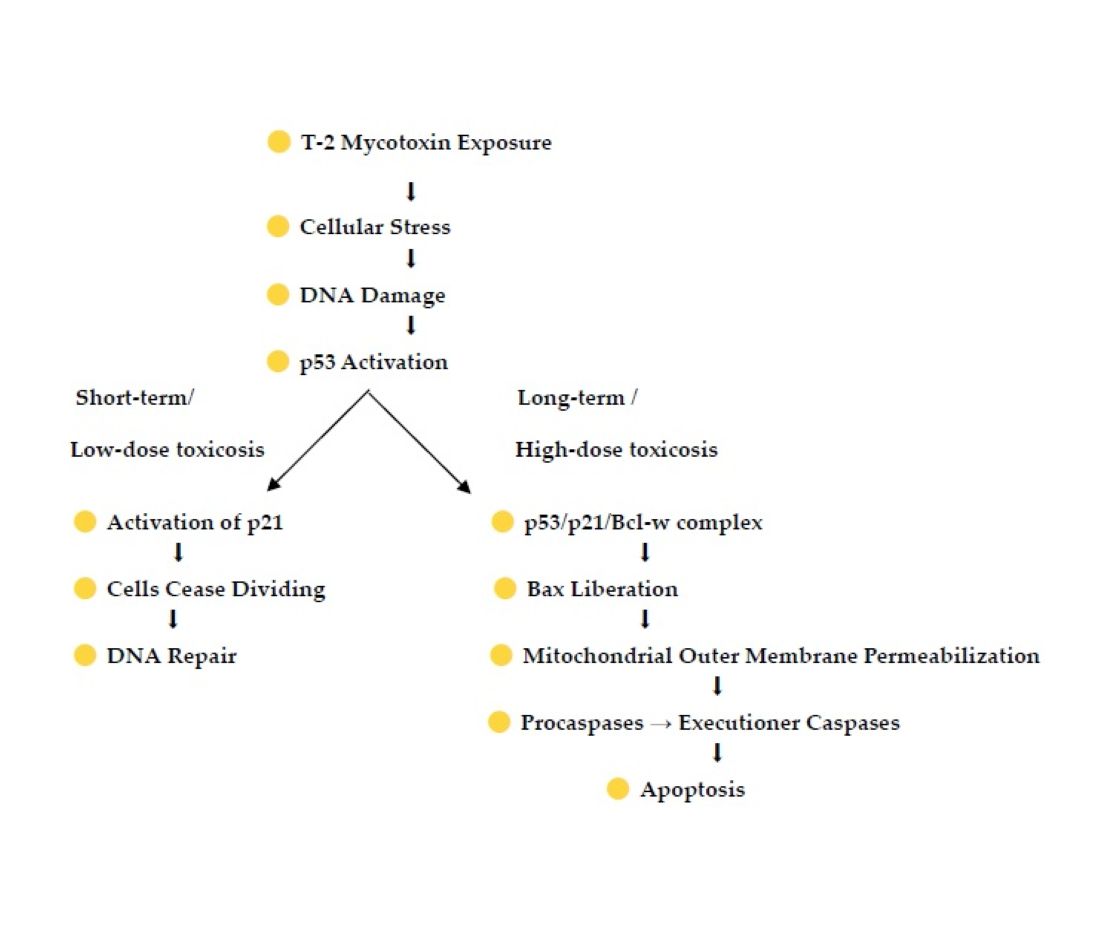
The investigations on kidney tissue after the T-2 mycotoxin exposure has revealed the apoptotic changes in the kidneys’ tubular epithelium causing tubular necrosis and intracellular stress, which triggers various response mechanisms, including the pathway of p53-mediated apoptosis [27]. p53, also known as tumor protein p53, TP53, cellular tumor antigen p53 (UniProt name), or transformation-related protein 53 (TRP53) is a regulatory transcription factor protein that regulates the expression of a wide variety of genes involved in apoptosis, growth arrest, or senescence in response to genotoxic or cellular stress [28,29]. The p53 proteins are crucial in vertebrates, where they prevent cancer formation [30]. The p53 mediated apoptosis pathway is one of the major apoptosis signaling pathways involving the stimulation of both the extrinsic and intrinsic pathways by the p53 protein [31]. The extrinsic pathway involves engagement of particular "death" receptors that belong to the Tumor Necrosis Factor Receptor family and through the formation of the Death-Inducing-Signaling-Complex leads to a cascade of activation of caspases, including Caspase8 and Caspase3, which in turn induce apoptosis. The intrinsic apoptotic pathway is dominated by the Bcl2 family of proteins, which governs the release of Cytochrome-C from the mitochondria. The Bcl2 family comprises anti-apoptotic (pro-survival) and pro-apoptotic members. In the intrinsic apoptosis pathway p53 participates by interacting with the multidomain members of the Bcl-2 family to induce mitochondrial outer membrane permeabilization [32]. The tumor suppressor p53 binds prosurvival Bcl-2 family proteins such as Bcl-w and Bcl-XL to liberate Bax, which in turn exerts proapoptotic or anti-invasive functions depending on stress context. Kim et al. 2017 showed that, although p53 can bind Bcl-w alone, it requires p21 to liberate Bax to suppress cell invasion and promote cell death. p21 bound Bcl-w, forming a p53/p21/Bcl-w complex in a manner that maintained all pairwise p53/p21, p21/Bcl-w, and p53/Bcl-w interactions. This allowed Bax liberation from the complex. Overall, the findings indicated that the p53/p21 complex rather than p53 itself regulates cell invasion and death by targeting Bcl-2 proteins. The cyclin-dependent kinase (CDK) inhibitor p21, also known as p21waf1/cip1 or P21/CDKN1A, is a small protein belonging to the CIP/Kip family of CDKs inhibitors [34]. CDK p21 is a cell cycle inhibitor, where the arrest of cell cycle in G1/S transition is a p53-dependent process with p53 being the main transcriptional regulator of p21. Persistent activation of cell p53 can lead to the expression of p21, an inhibitor of the cell cycle causing cells to cease dividing and leads to senescence, where cells can no longer increase. p21 is known to function as a tumor suppressor mainly by inhibiting cell cycle progression and allowing DNA repair. Under normal, unstressed conditions, p53 and p21 and are maintained in cell at low levels [35,36]. In accordance with the data in literature, our study showed low expression in the cytoplasm of renal tubular epithelial cells, with minimal nuclear localization in the control group chicken p53 exhibited [37]. However, 24 hours after exposure to T-2 mycotoxins, we observed a marked increase in p53 expression, with nuclear localization in many cells, particularly in the PCT. The nuclear accumulation of p53 was consistent with activation of its DNA damage response pathway, suggesting the initiation of cell cycle regulation and repair processes in response to oxidative stress. Similarily, in unexposed chickens, p21 was weakly expressed in the nuclei of renal tubular cells, with a small number of cells showing strong nuclear staining. In contrast, following T-2 mycotoxin exposure, p21 exhibited strong nuclear localization, particularly in the proximal tubular epithelial cells. The intense nuclear staining of p21 in these cells suggests that p21 was activated as a downstream target of p53, mediating cell cycle arrest and facilitating DNA repair mechanisms. In addition to nuclear staining, mild cytoplasmic staining of p21 was observed in some renal tubular cells, possibly indicating involvement in apoptotic or senescence pathways.
5. Conclusions
The experimental investigation showed that both studied proteins – p21 and p53 - are present in the renal tissue in greater amounts of the mycotoxin-treated group’s chicken compared to the control goup of healthy chickens. The strong expression of p53 and p21 in the kidney tissue of the toxicated broiler chickens indicates to the activation of the DNA damage response to cellular stress caused by T-2 exposure. p21 expression was observed in the nuclei of tubular cells and showed a strong correlation with p53 localization. These findings highlight the simultaneous involvement of p21 and p53 in the renal toxicity induced by T-2 mycotoxin and provide a potential biomarker for early detection of mycotoxin-induced nephrotoxicity. In future additional studies using different research methods, such as Western blot, or mRNA quantification, could be helpful to understand the cellular responses to mycotoxins in greater details.
Author Contributions
Conceptualization, Piret Hussar; Methodology, Piret Hussar, Katerina Blagoevska, Monika Dovenska, Lazo Pendovski and Florina Popovska-Percinic; Software, Piret Hussar and Florina Popovska-Percinic; Validation, Piret Hussar and Florina Popovska-Percinic; Formal analysis, Piret Hussar, Katerina Blagoevska, Monika Dovenska and Florina Popovska-Percinic; Investigation, Piret Hussar and Florina Popovska-Percinic; Resources, Katerina Blagoevska, Monika Dovenska, Lazo Pendovski and Florina Popovska-Percinic; Data curation, Piret Hussar and Florina Popovska-Percinic; Writing – original draft, Piret Hussar; Writing – review & editing, Piret Hussar, Katerina Blagoevska, Monika Dovenska, Lazo Pendovski and Florina Popovska-Percinic; Visualization, Piret Hussar and Florina Popovska-Percinic; Project administration, Piret Hussar and Florina Popovska-Percinic.
Funding
This research received no external funding.
Institutional Review Board Statement
The ethical committee of Ss. Cyril and Methodius University in Skopje, in conformity with the recommendation provided in the European Convention for the Protection of Vertebrate Animals used for Experimental and Other Scientific Purposes (ETS no.123, Approval No. 03-7534, 12 April 2013), approved the husbandry and experimental procedures of the study.
Informed Consent Statement
Not applicable.
Data Availability Statement
The original contributions presented in this study are included in the article. Further inquiries can be directed to the corresponding author(s).
Acknowledgments
The authors wish to thank Mare Tamm for her laboratory assistance and Kalle Pungas for the assistance in statistical analysis.
Conflicts of Interest
The authors declare no conflicts of interest.
Abbreviations
The following abbreviations are used in this manuscript:
| ROS | Reactive oxygen species |
| MAPK | Mitogen activated protein kinase |
| CDK inhibitor 21 | cyclin-dependent kinase inhibitor p21, also known as p21waf1/cip1 or P21/CDKN1A |
| CIP/Kip | CDK interacting protein/Kinase inhibitory protein |
| IHC | Immunohistochemistry |
| PCT | Proximal convoluted tubuls |
| DCT | Distal convoluted tubuls |
| SD | Standard deviation |
| TRP53 | transformation-related protein 53 |
| Bcl | B-cell lymphoma |
| Bcl Xl | B-cell lymphoma-extra large |
| Bcl-w | BCL-2-like protein 2 |
| Bax | Bcl-2-associated X protein |
References
- Meneely, J.; Greer, B.; Kolawole, O.; Elliott, C. T-2, and HT-2 Toxins: Toxicity, Occurrence and Analysis: A Review. Toxins (Basel) 2023, 15, 8, 481. [CrossRef]
- Zhang, J.; Liu, Z.; Su, Y.; Li, T. An update on T2-toxins: metabolism, immunotoxicity mechanism and human assessment exposure of intestinal microbiota. Heliyon 2022, 8, 8. [CrossRef]
- Adhikari, M.; Negi, B.; Kaushik, N.; Adhikari, A.; Al-Khedhairy, A.A.; Kaushik, N.K.; Choi, E.H. T-2 mycotoxin: toxicological effects and decontamination strategies. Oncotarget 2017, 8, 33933-33952. [CrossRef]
- Janik, E.; Niemcewicz, M.; Podogrocki, M.; Ceremuga, M.; Stela, M.; Bijak, M. T-2 Toxin—The Most Toxic Trichothecene Mycotoxin: Metabolism, Toxicity, and Decontamination Strategies. Molecules 2021, 26, 6868. [CrossRef]
- Ohta, M; Ishii, K.; Ueno, Y. Metabolism of Trichothecene Mycotoxins: I. Microsomal Deacetylation of T-2 Toxin in Animal Tissues. JB 1977, 82, 6, 1591–1598.
- Islam, Z.; Nagase, M.; Yoshizawa, T.; Yamauchi, K.; Sakato, N. T-2 toxin induces thymic apoptosis in vivo in mice. Toxicol Appl Pharmacol 1998, 148, 2, 205-214. [CrossRef]
- Wan, Q.; Wu, G.; He, Q.; Tang, H.; Wang Y. The toxicity of acute exposure to T-2 toxin evaluated by the metabonomics technique. Mol Biosyst 2015, 11, 882–891. [CrossRef]
- Williams, P.P. Effects of T-2 mycotoxin on gastrointestinal tissues: A Review of in vivo and in vitro models. Arch Environ Contam Toxicol 1989, 18, 374–387. [CrossRef]
- Lafarge-Frayssinet, C.; Chakor, K.; Lafont, P.; Frayssinet, C. Transplacental transfer of T2-toxin: pathological effect. J Environ Pathol Toxicol Oncol 1990, 10, 64– 68.
- Song, C.; Wang, Z.; Cao, J.; Dong, Y.; Chen, Y. Neurotoxic mechanisms of mycotoxins: Focus on aflatoxin B1 and T-2 toxin. Environ Pollut 2024, 356, 124359. [CrossRef]
- Dai, C.; Das Gupta, S.; Wang, Z.; Jiang, H.; Velkov, T.; Shen, J. T-2 toxin and its cardiotoxicity: New insights on the molecular mechanisms and therapeutic implications. FCT 2022, 167, 113262. [CrossRef]
- Wong, J.; Magun, B.; Wood, L. Lung inflammation caused by inhaled toxicants: a review. Int J Chron Obstruct Pulmon Dis. 2016, 11, 1, 1391-1401. [CrossRef]
- Yin, H.; Han, S.; Chen, Y.; Wang, Y.; Li, D.; Zhu, Q. T-2 Toxin Induces Oxidative Stress, Apoptosis and Cytoprotective Autophagy in Chicken Hepatocytes. Toxins 2020, 12, 90. [CrossRef]
- Nayakwad, S.; Ramu, R.; Sharma, A. K.; Gupta, V. K.; Rajukumar, K.; Kumar, V.; Shirahatti, P. S.; Rashmi L.; Basalingappa, K. M. Toxicopathological studies on the effects of T-2 mycotoxin and their interaction in juvenile goats. PLOS One 2020. [CrossRef]
- Rahman, S.; Sharma, A.K.; Singh, N.D.; Prawez, S. Immunopathological effects of experimental T-2 mycotoxicosis in Wistar rats. Hum Exp Toxicol 2020, 40, 772–790.
- Chrustek, A.; Twarużek, M.; Zastempowska, E.; GrajewskAnnales, J. Ann Univ Pedagog Crac Stud Naturae 2016, 1: 105–114. ISSN 2543-8832.
- Sancho-Martínez, S.M.; López-Novoa, J.M.; López-Hernández, F.J. Pathophysiological role of different tubular epithelial cell death modes in acute kidney injury. Clin Kidney J 2015, 8, 5, 548-559. [CrossRef]
- Molitoris, B. A. Therapeutic translation in acute kidney injury: the epithelial/endothelial axis. J Clin Invest 2014, 124, 6, 2355- 2363. doi.org/10.1172/JCI72269.
- Tang, C.; Ma, Z.; Zhu, J.; Liu, Z.; Liu, Y.; Liu, Y.; Cai, J.; Dong, Z. P53 in kidney injury and repair: Mechanism and therapeutic potentials. Pharmacol Ther 2019, 195, 5-12. [CrossRef]
- Volarevic, V.; Djokovic, B.; Jankovic, M.G.; Harrell, C. R.; Fellabaum, C.; Djonov, V.; Arsenijevic, N. Molecular mechanisms of cisplatin-induced nephrotoxicity: a balance on the knife edge between renoprotection and tumor toxicity. J Biomed Sci 2019, 26, 25. [CrossRef]
- Melchini, A.; Traka, M. Biological Profile of Erucin: A New Promising Anticancer Agent from Cruciferous Vegetables. Toxins 2010, 2, 593-612. [CrossRef]
- Overstreet, J.M.; Gifford, C.C.; Tang, J.; Higgins, P.J.; Samarakoon, R. Emerging role of tumor suppressor p53 in acute and chronic kidney diseases. Cell Mol Life Sci 2022, 9, 79, 9, 474. [CrossRef]
- Engeland, K. Cell cycle regulation: p53-p21-RB signaling. Cell Death Differ 2022, 29, 946–960. [CrossRef]
- Shinozuka, J.; Li, G.; Kiatipattanasakul, W.; Uetsuka, K.; Nakayama, H.; Doi, K. T-2 toxin-induced apoptosis in lymphoid organs of mice. Exp Toxicol Pathol 1997, 49, 5, 387–392. [CrossRef]
- Hussar, P. Apoptosis Regulators Bcl-2 and Caspase-3. Encyclopedia 2022, 2, 1624-1636. [CrossRef]
- Elmore, S. Apoptosis: a review of programmed cell death. Toxicol Pathol 2007, 35(4), 455–516. [CrossRef]
- Xie, J.; Shaikh, Z. A. Cadmium induces cell cycle arrest in rat kidney epithelial cells in G2/M phase. Toxicology 2006, 224, 1–2, 56-65. [CrossRef]
- Surget, S.; Khoury, M.P.; Bourdon, J.C. Uncovering the role of p53 splice variants in human malignancy: a clinical perspective. OncoTargets Ther 2013, 7, 57–68. [CrossRef]
- Hernández Borrero, L.J.; El-Deiry, W.S. Tumor suppressor p53: Biology, signaling pathways, and therapeutic targeting. Biochim Biophys Acta Rev Cancer 2021, 1876, 1, 188556. [CrossRef]
- Bykov, V.J.; Eriksson, S.E.; Bianchi, J.; Wiman, K.G. "Targeting mutant p53 for efficient cancer therapy". Nat Rev Cancer 2018, 2, 89–102. [CrossRef]
- Capuozzo, M.; Santorsola, M.; Bocchetti, M.; Perri, F.; Cascella, M.; Granata, V.; Celotto, V.; Gualillo, O.; Cossu, A.; Nasti, G.; Caraglia, M.; Ottaiano, A. p53: From Fundamental Biology to Clinical Applications in Cancer. Biology 2022. 11. 1325. [CrossRef]
- Vaseva, A. V.; Moll, U. M. The mitochondrial p53 pathway. BBA – Bioenergetics 2008, 1787, 5, 414-420. [CrossRef]
- Kim, E. M.; Jung, C.-H.; Kim, J.; Hwang, S.-G.; Jong, Park, K.; Um, H.-D. The p53/p21 Complex Regulates Cancer Cell Invasion and Apoptosis by Targeting Bcl-2 Family Proteins. Cancer Res I 2017, 77, 11, 3092–3100. [CrossRef]
- Karimian, A.; Ahmadi, Y.; Yousefi, B. Multiple functions of p21 in cell cycle, apoptosis and transcriptional regulation after DNA damage. DNA Repair 2016, 42, 63-71. [CrossRef]
- O’Brate, A.; Giannakakou, P. The importance of p53 location: nuclear or cytoplasmic zip code? Drug Resist Updat 2003, 6, 6, 313-322. [CrossRef]
- Abella, N.; Brun, S.; Calvo, M.; Tapia, O.; Weber, J.D.; Berciano, M.T.; Lafarga, M., Bachs, O.; Agell, N. Nucleolar disruption ensures nuclear accumulation of p21 upon DNA damage. Traffic 2010, 11, 6, 743-55. [CrossRef]
- Hussar, P.; Blagoevska, K.; Dovenska, M.; Pendovski, L.; Popovska-Percinic, F. Apoptosis in Kidneys Exposed to T-2 Mycotoxin: Immunolocalization of p53 and p21. In Sciendo, 16, 1-2. Proceedings of the Latvian Academy of Sciences. Section B. Natural, Exact, and Applied Sciences, 79: The International Scientific Conference on Medicine, University of Latvia (UL), UL House of Science, Riga, 25.04.2025.
Figure 1.
Immunolocalization of p53 in 7 days old chicken: (a) Strong expression of p53 in proximal (arrowheads) and distal (asterisks) renal tubules as well as glomeruli (arrows) in T-2 toxin group’s chicken kidneys. Scale bar: 100 µm; (b) Weak expression of p53 in control group’s chicken renal tissue. Scale bar: 200 µm.
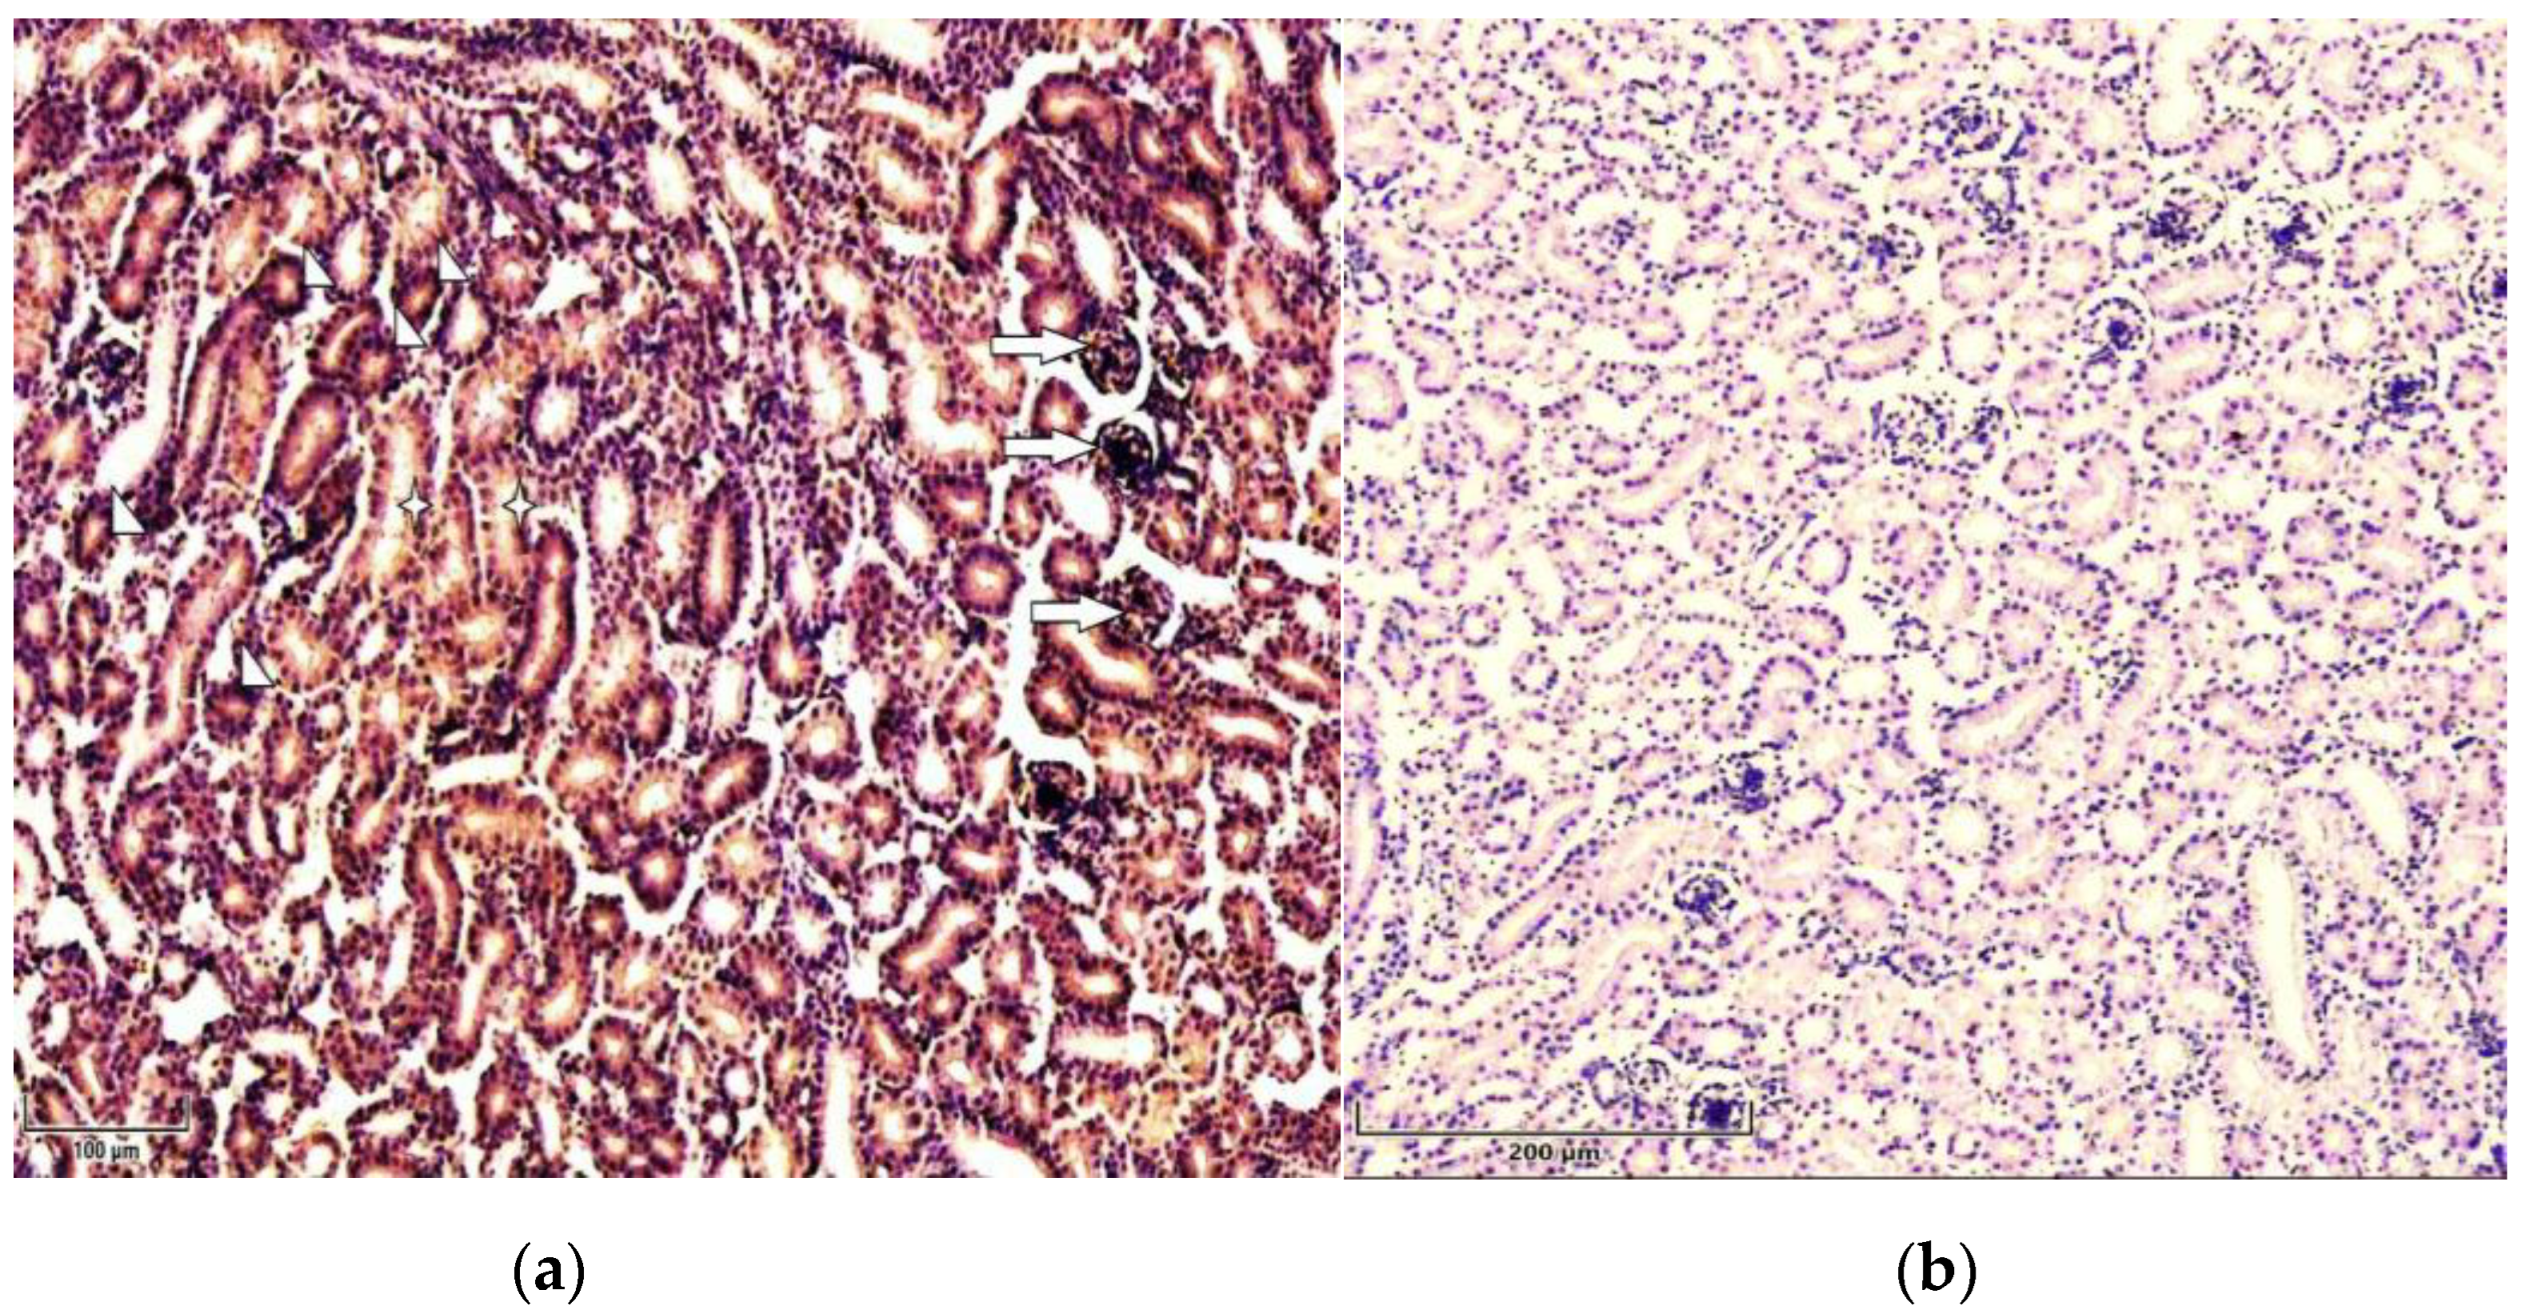
Figure 2.
Immunolocalization of p21 in 7 days old chicken: (a) The cytoplasm (asterisks) and nuclei (arrows) of renal tubular epithelial cells and in vessels` endothelial cells (arrowheads) strongly stained for p21 inT-2 toxin group’s chicken kidney. Scale bar: 100 µm; (b) Weak expression of p51 in control group’s chicken renal tissue. Scale bar: 200 µm.
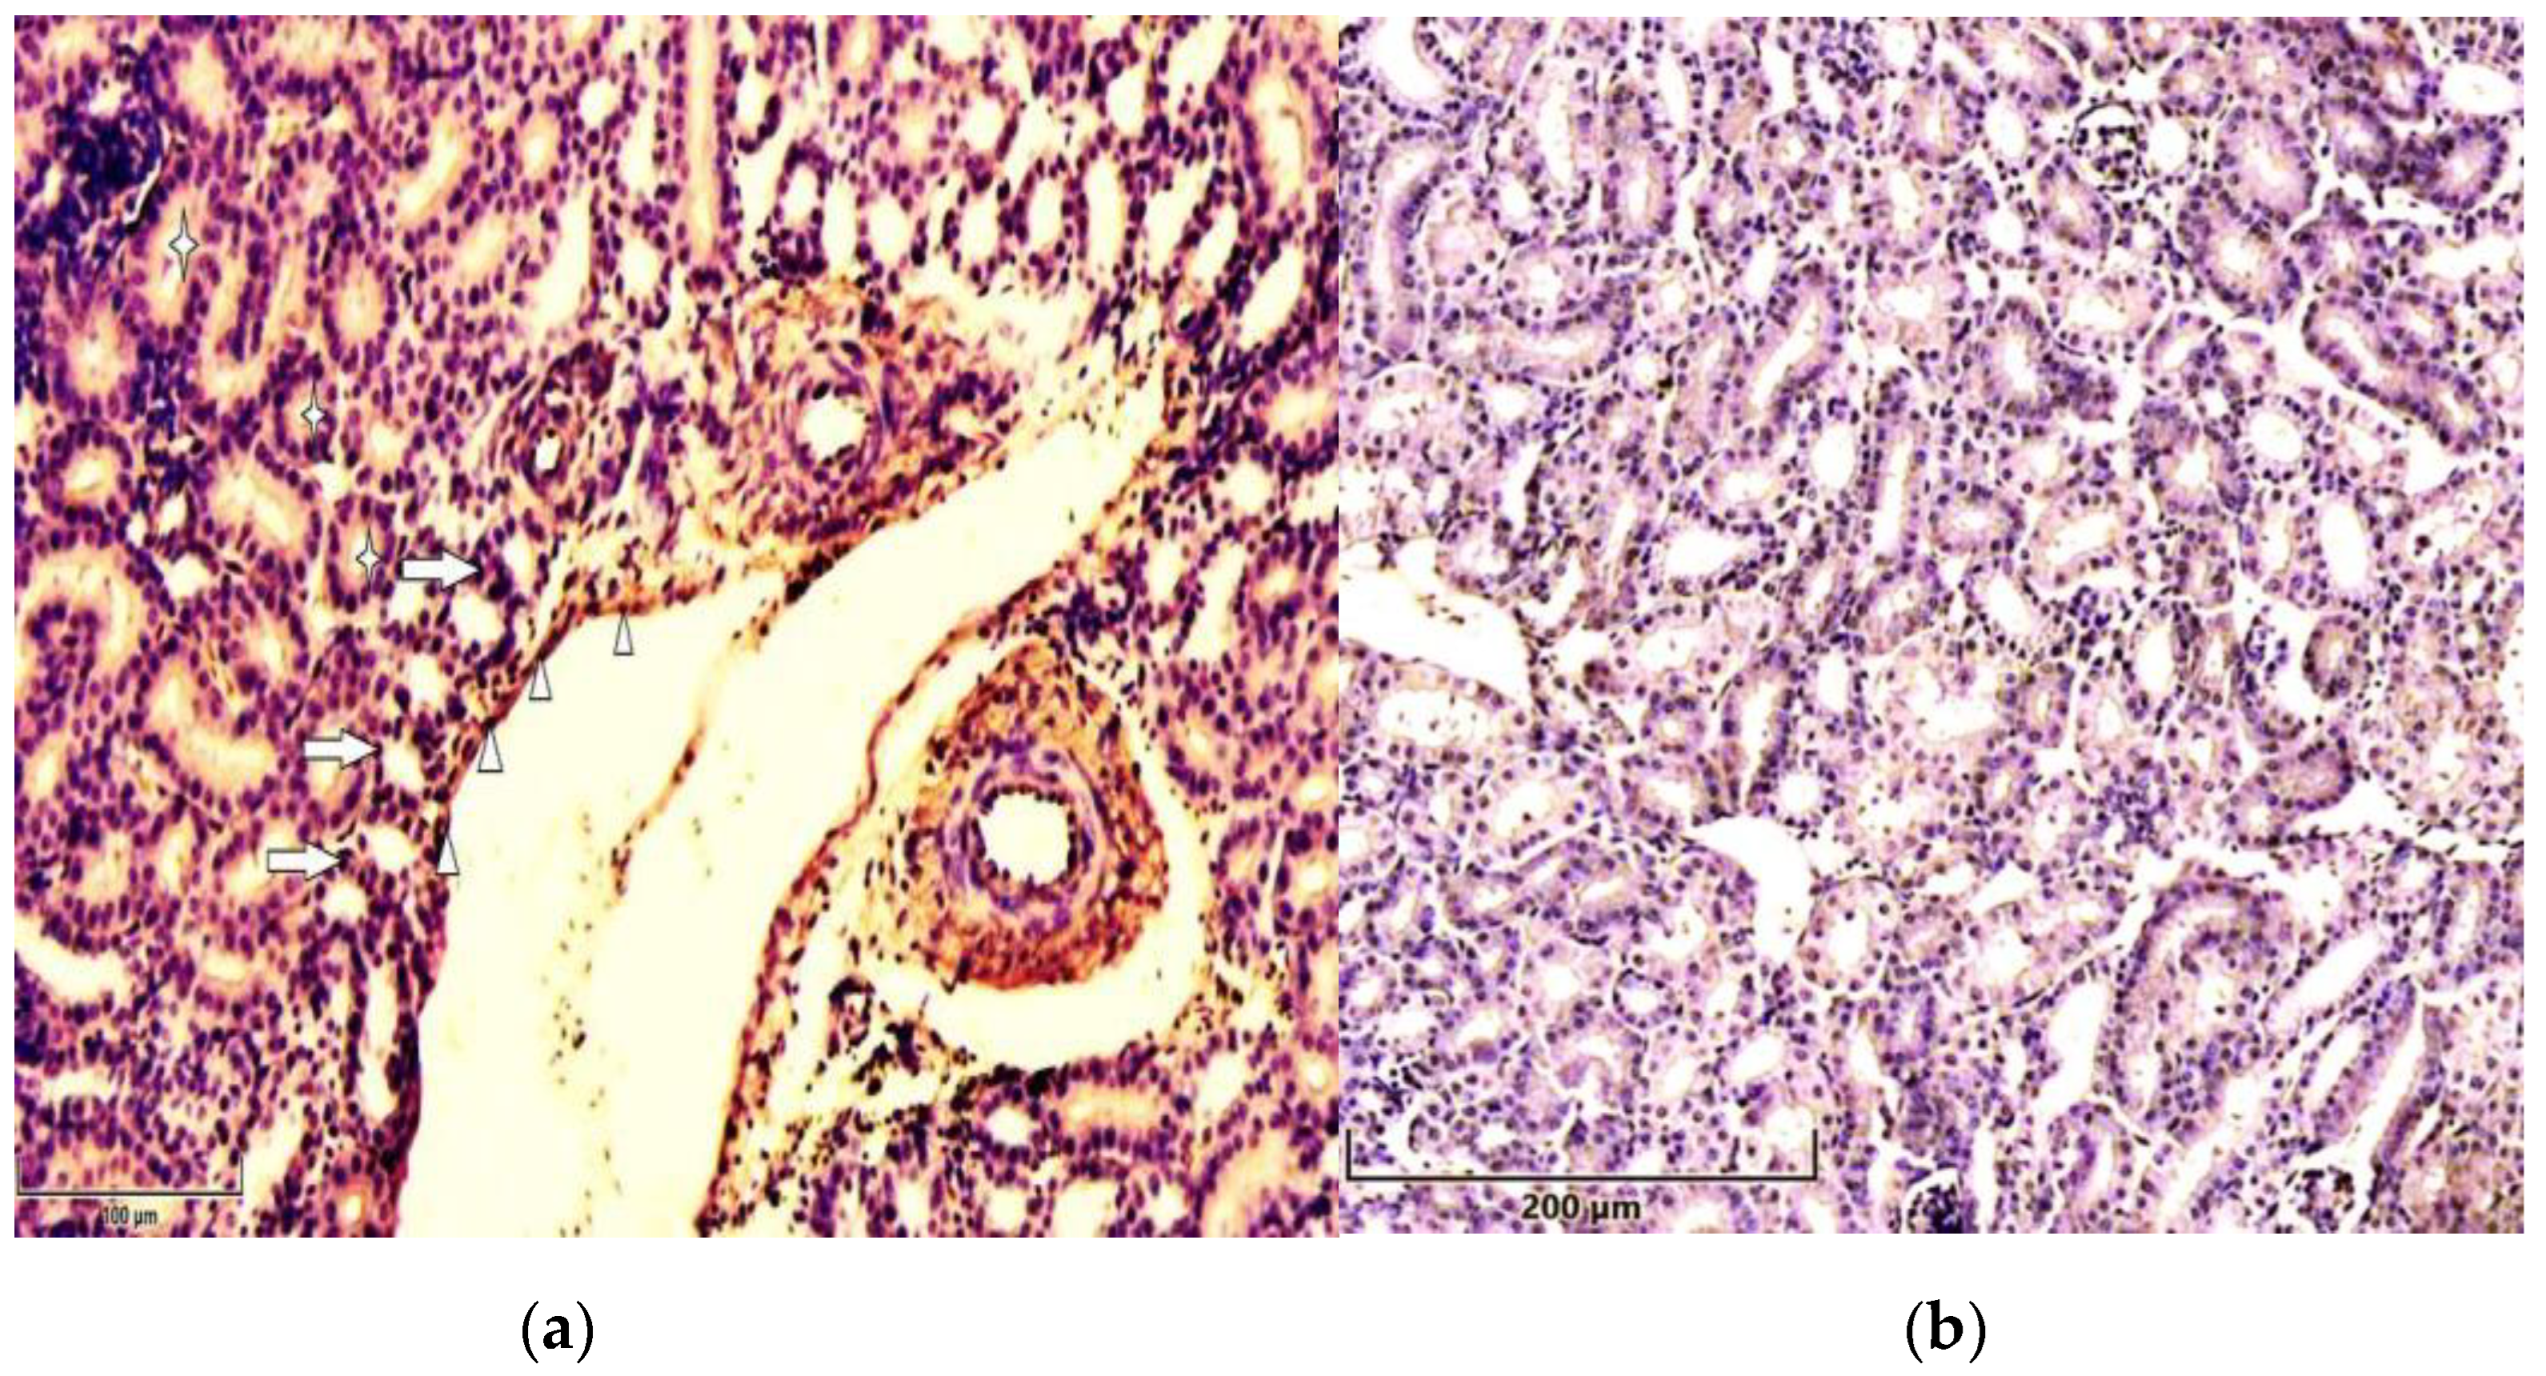
Figure 3.
Seven days old intoxicated chicken kidney tissue, negative control (without primary antibodies). Hematoxylin, scale bar: 200 µm.
Figure 3.
Seven days old intoxicated chicken kidney tissue, negative control (without primary antibodies). Hematoxylin, scale bar: 200 µm.
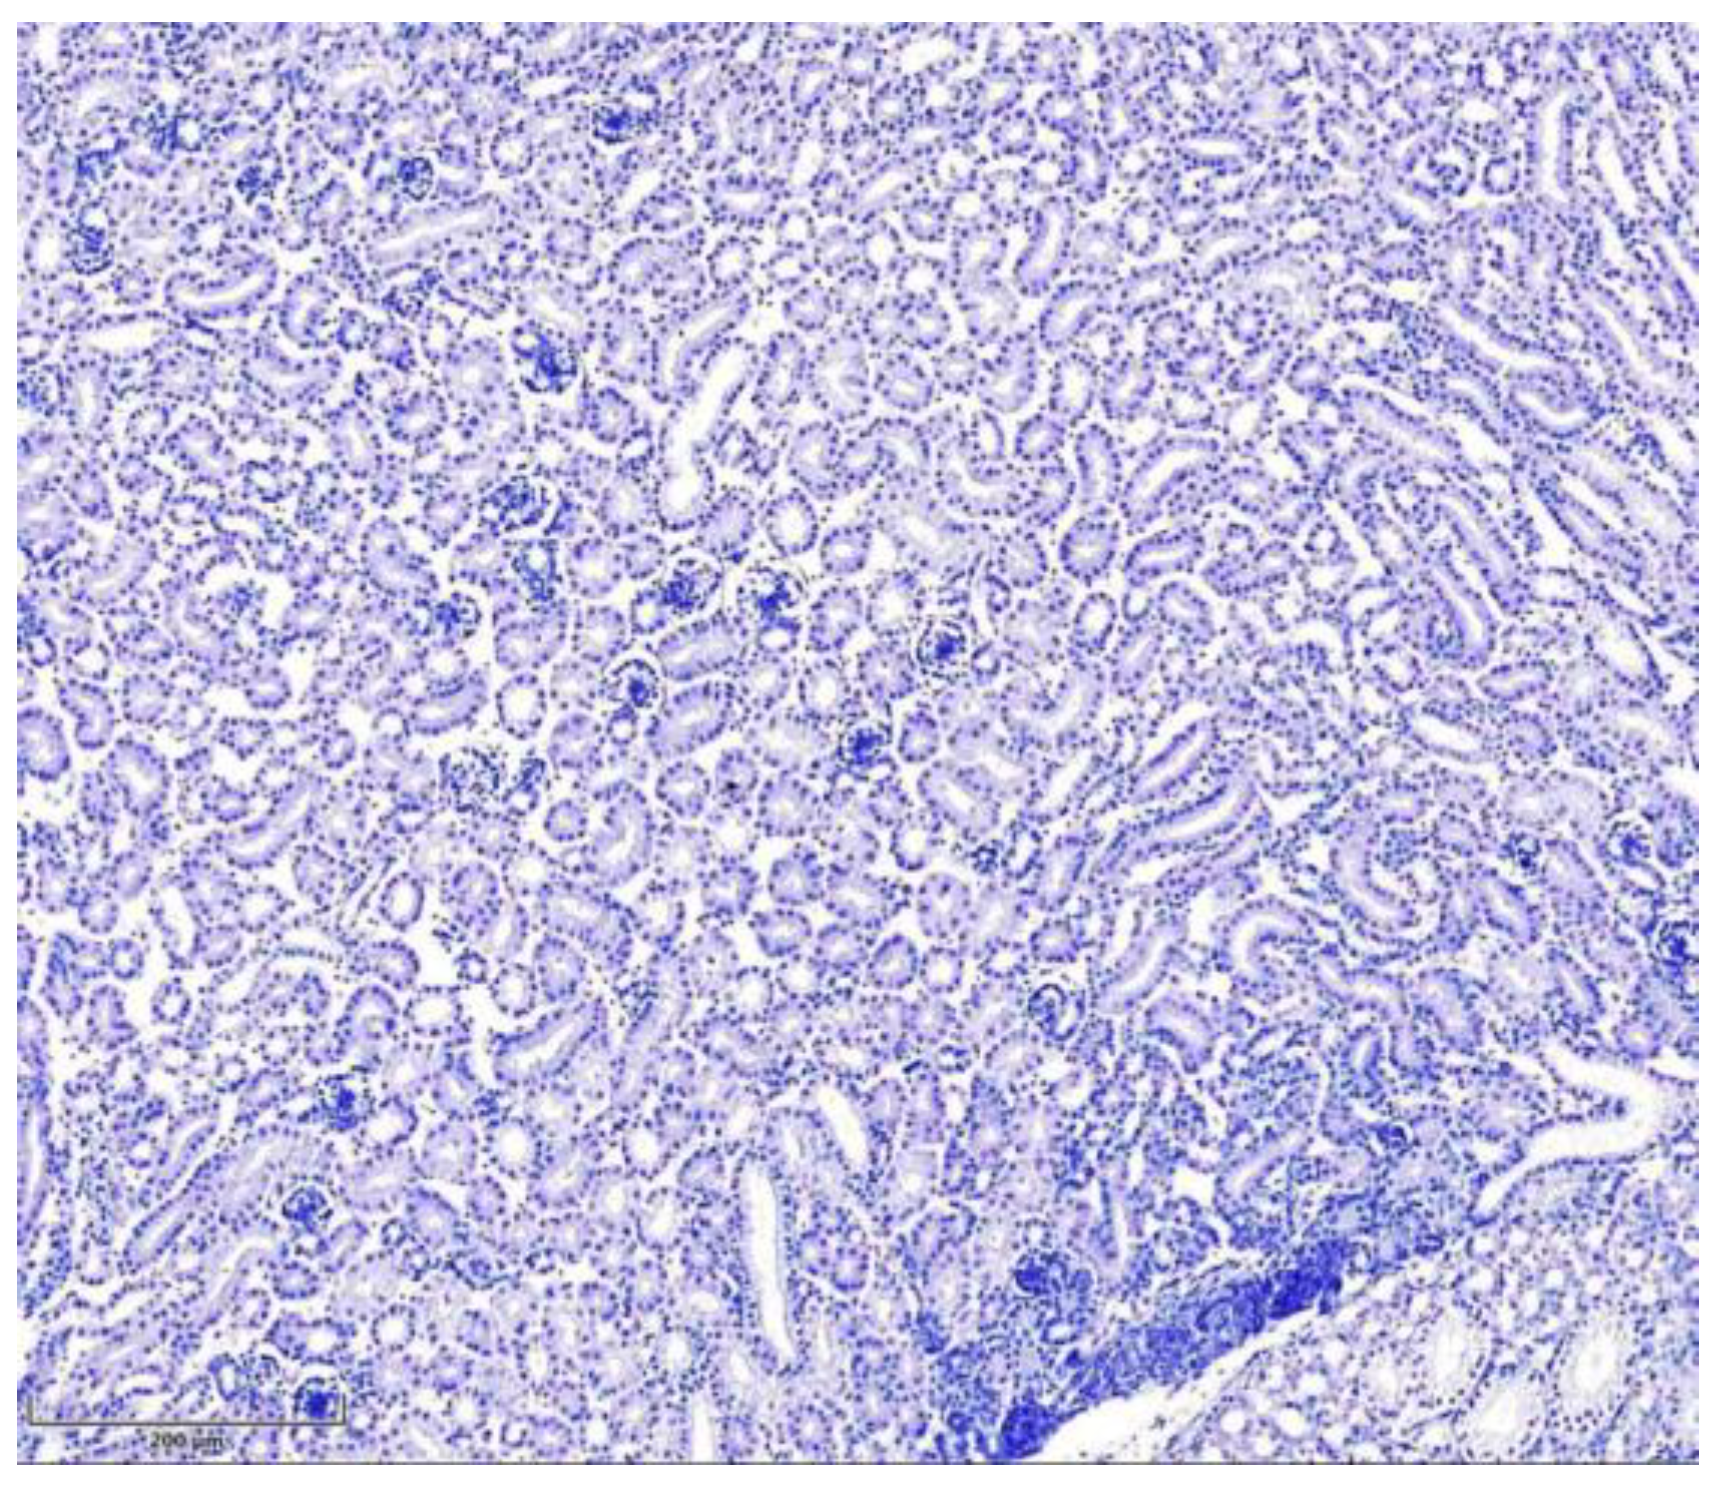

Table 1.
p53 and p21 expression analysis of 7 days old chicken kidneys.
| Antibody | p53* | p21* | ||
| Chicken’s group | T-2 toxin group | Control group | T-2 toxin group | Control group |
|
Proximal convoluted tubules |
+++ | + | ++ | + |
|
Distal convoluted tubules |
++ | + | ++ | + |
| Endothelium | ++ | + | ++ | + |
| Glomerulus | ++ | + | +/++ | + |
* The intensity of staining using eye visual control is shown as: + weak; ++ moderate; +++ strong.
Table 2.
Mean intensity and statistical significance (SD) of p53 and p21 expression in healthy (Control group) and in T-2 toxin-treated (T-2 toxin group) chicken renal tissue.
Table 2.
Mean intensity and statistical significance (SD) of p53 and p21 expression in healthy (Control group) and in T-2 toxin-treated (T-2 toxin group) chicken renal tissue.
| Protein |
Mean intensity T-2 toxin group |
SD T-2 toxin group |
Mean intensity Control group |
SD Control group |
Paired t-test p-value 1 |
| p53 | 2.25 | 0.50 | 1.00 | 0.00 | 0.0154 |
| p21 | 1.88 | 0.25 | 1.00 | 0.00 2 | 0.0060 |
1 p < 0.05.
Disclaimer/Publisher’s Note: The statements, opinions and data contained in all publications are solely those of the individual author(s) and contributor(s) and not of MDPI and/or the editor(s). MDPI and/or the editor(s) disclaim responsibility for any injury to people or property resulting from any ideas, methods, instructions or products referred to in the content. |
© 2025 by the authors. Licensee MDPI, Basel, Switzerland. This article is an open access article distributed under the terms and conditions of the Creative Commons Attribution (CC BY) license (http://creativecommons.org/licenses/by/4.0/).
Copyright: This open access article is published under a Creative Commons CC BY 4.0 license, which permit the free download, distribution, and reuse, provided that the author and preprint are cited in any reuse.


