Submitted:
10 November 2025
Posted:
12 November 2025
You are already at the latest version
Abstract
Dry climate regions face heightened risks of flooding and infrastructure damage even with minimal rainfall. Climate change is intensifying this vulnerability by increasing the duration, frequency, and intensity of precipitation events in areas that have historically experienced arid conditions. As a result, accurate precipitation estimation in these regions is critical for effective planning, risk mitigation, and infrastructure resilience. This study evaluates the performance of five satellite- and model-based precipitation products by comparing them against in-situ rain gauge observations in a dry-climate region: The fifth generation European Centre for Medium-Range Weather Forecasts Reanalysis (ERA5) (analyzing maximum and minimum precipitation rates separately), the Modern-Era Retrospective analysis for Research and Applications version 2 (MERRA2), the Western Land Data Assimilation System (WLDAS), and the Integrated Multi-satellitE Retrievals for Global Precipitation Measurement (IMERG). The analysis focuses on both average daily rainfall and extreme precipitation events, with particular attention to precipitation magnitude and the accuracy of event detection, using a combination of statistical met-rics—including bias ratio, mean error, and correlation coefficient—as well as contingency statistics such as probability of detection, false alarm rate, missed precipitation fraction, and false precipitation fraction. The study area is Palm Desert, a mountainous, arid, and urban region in Southern California, which exemplifies the challenges faced by dry re-gions under changing climate conditions. Among the products assessed, WLDAS ranked highest in measuring total precipitation and extreme rainfall amounts but performed the worst in detecting the occurrence of both average and extreme rainfall events. In contrast, IMERG and ERA5-MIN demonstrated the strongest ability to detect the timing of pre-cipitation, though they were less accurate in estimating the magnitude of rainfall per event. Overall, this study provides valuable insights into the reliability and limitations of different precipitation estimation products in dry regions, where even small amounts of rainfall can have disproportionately large impacts on infrastructure and public safety.
Keywords:
precipitation
; dry climate
; remote sensing
; error analysis
1. Introduction
Evidence of climate change is present globally [1]. Increases in surface temperature are greatly affecting the hydrological cycle from the local to the regional and global scale, ultimately leading to increased intensity and frequency of precipitation [2]. This increases the risk of flooding, which is the most frequent type of natural disaster and can substantially damage the affected areas [3]. The best way to mitigate damages from flooding is through adaptive measures that increase the resilience of current infrastructure to extreme events [4]. Gaining a solid understanding of how different volumes of precipitation will affect different areas together with a reliable method of predicting floods is crucial to increase community resilience to extreme hydroclimatic events. Climate change has rendered stationarity moot, so traditional prediction models may no longer be reliable or valid, meaning suddenly, infrastructure may no longer be resilient to current and future storm events [1].
Some areas with typically arid climate, such as Central Asia, are getting larger volumes of rain more frequently [5]. Compared to more temperate areas, the amount of increased rainfall may seem low or insignificant. However, even a small increase in precipitation, (especially if received during a limited amount of time, can have catastrophic effects on such regions [5,6]. As these areas receive increased precipitation or a higher frequency of extreme precipitation events, there are adverse effects on resource management, infrastructure, and livelihood. Such effects may include destruction (and/or disruption) of housing, roads, and resource management equipment. Other consequences of these changing precipitation patterns include too much water during some parts of the year and too little during others, which can affect the availability of water year-round. In Central Asia, there is a limited rainy season that serves as the primary source of water for the region. So, any changes to the volume and frequency of rainfall will significantly affect those who live there [5]. This area of Asia relies on a consistent wet season for their water supply, and if precipitation occurs outside of that time window, it causes runoff from snowy mountains to occur sooner than usual, which then shortens the wet season. Shortening the wet season ultimately shortens the growing and harvesting seasons for crops by decreasing the amount and availability of water, thereby limiting the crop yield in the region and impacting food availability for consumption or commerce [5].
Another arid area that is experiencing increased rainfall is Southern California in the United States. In August 2023, Hurricane Hilary devastated Southern California, which received around 90 mm of rain within three days. This may not seem significant compared to what is typically observed in other, temperate areas of the country, but it exceeded the daily and monthly records for the area, and caused significant damages to infrastructure including buildings, houses, and roads [7]. This area is not acclimated to receiving such large quantities of precipitation in such a short period of time, therefore meaning their infrastructure is not built to withstand these localized extreme events. This will only get worse as these types of events become more common.
Since so little difference in rainfall can have such a large impact in dry areas, it is even more important to minimize errors in precipitation estimates used in flood forecasting models in such regions. Accurate flood prediction models are fundamental for engineers and planners when building new infrastructure and planning management actions and the most critical input to such models is precipitation. Furthermore, precipitation measurements are used for an array of applications, including reservoir operations, land development, prevention of extreme hydroclimatic events (e.g., floods, landslides), weather and climate forecasting, and disease control [8,9]. However, an accurate measure of precipitation is crucial to effectively use such products in the applications listed above [10].
Precipitation is commonly measured by in-situ gauges, weather radars, satellites, and re-analysis models. Ground-based instruments, including rain gauges and weather radars, are widely used for measuring precipitation [11]. Rain gauges provide high temporal frequency but are prone to errors from wind effects and evaporation [12]. Radar networks provide continuous coverage with high spatial and temporal resolution at regional scales. However, radar-based measurements are affected by errors due to various issues such as surface backscatter contamination, attenuation of the signal, and uncertainty of the reflectivity–rain-rate relationship [13,14,15].
Continuous and near-real-time coverage of the Earth can only be recorded with satellite precipitation sensors. The most accurate satellite precipitation estimates are from a combination of infrared (IR) sensors on geostationary satellites, characterized by high sampling frequency, and passive microwave (PMW) sensors on low-Earth-orbiting satellites with less-frequent sampling [16]. Unlike PMW sensors that collect data of emissions and scattering signals of raindrops, snow, and ice contents, IR data measure cloud-top temperatures and cloud heights [17].
Reanalysis precipitation products are obtained by combining observational data, satellite measurements, and numerical weather prediction models, which are then processed to create a continuous and consistent time series. Reanalysis products typically cover the entire globe or large regional areas and span several decades, often from the mid-20th century to the present, making them particularly valuable for understanding long-term trends, variability, and extremes in precipitation patterns [18,19,20].
Past efforts have evaluated and utilized satellite-based observations and re-analysis in a suite of hydrologic applications [2,3,4,21,22]. A few focused on dry climate areas. For example, Morin et al. (2020) analyzed precipitation climatology from satellite observations in dry regions of the world and concluded that these areas are characterized not only by lower annual precipitation and higher variability, but also by fewer rainy days, a more pronounced extreme tail in the precipitation distribution, a smaller proportion of the area experiencing rainfall, and shorter spatial correlation distances. The study by Serrat-Capdevila et al. (2016) assessed three satellite precipitation products over Africa and found that their performance in dry regions was generally weaker due to infrequent and localized rainfall. However, after applying a bias correction, their accuracy improved significantly. [25] performed an assessment of satellite precipitation estimation products over Iran, i.e., Integrated Multi-satellite Retrievals for GPM (IMERG-V6), Multi-Source Weighted-Ensemble Precipitation (MSWEP), Tropical Rainfall Measuring Mission (TRMM) Multi-Satellite Precipitation Analysis (TMPA-3B43V7), and Precipitation Estimation from Remotely Sensed Information using Artificial Neural Networks—Climate Data Record (PERSIANN-CDR). Their study found that all products consistently had fewer errors in regions of Iran with lower precipitation rates. Another study validated remote sensing precipitation products in southern Spain by comparing them to measurements from ground stations [26]. They also developed a methodology to identify extreme rainfall and drought events over the past 30 years using satellite-derived data. Furthermore, Vernimmen et al. (2012) found that satellite rainfall products underestimate dry season rainfall in Indonesia, with TMPA-3B42 (near real time version) performing better than others.
This study investigates the performance of a suite of precipitation products from both satellite retrievals and models in a dry-climate region, where rain events that are more intense than usual may cause significant damage. Specifically, this study analyses four datasets (one satellite and three re-analysis products) and compares them to ground-recorded observations to determine which sources are more accurate and where improvements should be directed. Palm Desert in Southern California, a historically dry climate region, is chosen as the study area from 2000 through 2019. The methodological framework is presented in Chapter 2 and includes a description of the study area, the five datasets adopted in this work, and the statistical analysis. Results are illustrated and discussed in Chapter 3, whereas conclusions are drawn in Chapter 5.
2. Materials and Methods
2.1. Objective and Research Questions
The objective of this study is to estimate errors and uncertainties of a suite of precipitation products in Palm Desert, a dry-climate region in Southern California. This study answers the following overall research question: What is the performance of different precipitation products in a dry-climate region? More specifically, what is their ability to estimate (1) the magnitude of average precipitation; (2) the magnitude of extreme precipitation events; (3) the occurrence of precipitation overall; and (4) the occurrence of extreme events?
2.2. Study Area
This study focuses on the area surrounding Palm Desert, California, United States, specifically within the following geographical coordinates: -117.20; -115.94 longitude and 33.25; 34.25 latitude (Figure 1). The climate in this area is historically dry, with warm winters and hot summers, receiving an average of less than 400 mm/year of precipitation [28]. The study area is primarily urban, surrounded by mountains and desert. The average high temperature in the warmest month in this area ranges from 68.1°F to 84.2°F, and the lowest temperature in the coolest month ranges from 39.2°F to 58°F [29].
This area became of particular interest due to Hurricane Hilary, which devastated the region in August 2023. There were wind gusts up to 46 miles per hour, and a total rainfall estimate of 102 mm within three days [30]. The storm exceeded daily and monthly records for the area, and resulted in significant damage to roads, bridges, and infrastructure, and power loss [7].
2.2. Datasets
The ground data were collected from the National Oceanic and Atmospheric Administration (NOAA) Physical Sciences Laboratory “CPC Global Unified Gauge-Based Analysis of Daily Precipitation” product [31]. This dataset consists of daily precipitation values obtained from a network of gauges and uses the optimal interpolation objective analysis technique. The spatial resolution is 0.5 degrees latitude by 0.5 degrees longitude. Four gauges were identified within the spatial boundary of this project, one each at (-116.75, 33.75), (-116.25, 33.75), (-116.75, 34.25), and (-116.25, 34.25), longitude and latitude. Daily precipitation values from each gauge were averaged to create the reference dataset.
Four datasets were analyzed against the reference ground data and are described next: ERA5, MERRA2, WLDAS, and IMERG.
The European Centre for Medium-Range Weather Forecasts (ECMWF) atmospheric reanalysis of global climate data is produced by the Copernicus Climate Change Service (C3S). The fifth generation ECMWF Reanalysis (ERA5) produces data using 4D-Variational data assimilation and modeling in the ECMWF Integrated Forecast System (IFS) [32]. This includes data at 137 model pressure levels, which are all interpolated to different pressure, temperature, and vorticity levels [32]. Two variables were analyzed from this dataset: maximum total precipitation rate (MXTPR) and minimum total precipitation rate (MNTPR). For reference in this study, the MXTPR dataset will be noted as ERA5-MAX, and the MNTPR dataset will be noted as ERA5-MIN. The temporal range is January 1, 1940 to present. 20 ERA5 pixels are available across the study area (Figures 2a and 2b).
The MERRA2, WLDAS, and IMERG datasets were obtained from the NASA Goddard Earth Sciences (GES) Data and Information Services Center (DISC) database.
The Modern-Era Retrospective analysis for Research and Applications, version 2, (MERRA2) uses a combination of observations, microwave sounders, and hyperspectral infrared radiance instruments to provide hourly data [33]. It provides a reanalysis of precipitation data collected from Goddard Earth Observing System Model, Version 5 (GEOS-5) and a data assimilation system [33]. All fields are computed on a cubed grid, and the precipitation is then either provided on all 72 model layers or interpolated to 42 pressure levels [33]. This dataset is available from January 9, 1980 to present. Figure 2c shows the four MERRA2 pixels that cover the study area.
The Western Land Data Assimilation System (WLDAS) utilizes the NASA Land Information System (LIS) and meteorological observations to simulate precipitation. This product is catered to the Western United States, and produces daily high-resolution data [34]. The available time series is January 6, 1979 through December 31, 2023. There are 12,522 WLDAS pixels across the study area, as shown in the map in Figure 2d.
The Integrated Multi-satellitE Retrievals for GPM (IMERG) dataset uses the GPM (Global Precipitation Measurement) Core Observatory satellite to combine infrared and microwave sensor readings and precipitation observations from the Tropical Rainfall Measuring Mission (TRMM) and Global Precipitation Measurement (GPM) satellite missions [35]. The dataset used for this project is product version 7 [16]. IMERG is available from June 5, 2000 to present. Figure 2e presents a map of average precipitation measured by IMERG during 14 February 2019.
A summary of each product’s characteristics is provided in Table 1. WLDAS is available at the finest spatial resolution, whereas ERA5 (both -MAX and -MIN), and MERRA2 have the highest temporal resolution.
This study focuses on an almost 20 year-long time series, from June 5, 2000 through December 31, 2019. The time series of precipitation events recorded by each dataset is illustrated in Figure 3. The standard deviation of each dataset was calculated using the usual Equation 1, as follows:
where hat is the estimated precipitation value, µ is the average of the estimated precipitation dataset, and n is the total number of data points. The standard deviations of ERA5-MAX, ERA5-MIN, MERRA2, WLDAS, IMERG, and the reference ground data are 7.69 mm/day, 5.47 mm/day, 6.05 mm/day, 5.85 mm/day, 6.36 mm/day, and 5.54 mm/day, respectively. ERA5-MIN and WLDAS have standard deviations that are close to that of the reference dataset, meaning they are able to capture the rainfall variability as measured by the rain gauges.
The peaks observed in the time series correspond to extreme precipitation events, which are clearly identifiable across all datasets. These events exhibit strong temporal alignment, indicating consistent detection of rainfall occurrences across the observational and estimation products. However, discrepancies in peak magnitudes are evident, reflecting systematic biases wherein certain estimation products either overestimate or underestimate the actual precipitation intensities associated with these events.
A more detailed investigation of these discrepancies is conducted through quantitative analyses aimed at characterizing the deviations in reported precipitation across datasets. These analyses facilitate a rigorous evaluation of each product’s performance, enabling identification of the temporal and contextual conditions under which discrepancies are most pronounced. The resulting insights are instrumental in guiding the selection of appropriate estimation products for application in arid and semi-arid regions, with consideration given to both accuracy and reliability under varying climatic conditions.
An initial step in diagnosing the discrepancies among estimation products involved isolating extreme precipitation events within the time series and studying their evolution in time. Figure 7 shows time series for three specific events: December 29, 2004, January 21, 2010, and February 14, 2019.
In the first event (Figure 4a), the rain gauges reported the rainfall event starting on December 28, 2004, continuing to the next day at a lower rate, and having concluded by December 30, 2004. IMERG, MERRA2, and WLDAS capture the event timing, although WLDAS underestimates the amount of rainfall on both days of the event. ERA5-MAX and ERA5-MIN show a delay in the event detection, with the peak occurring on the second day rather than the first. ERA5-MAX overestimates the precipitation rate, whereas ERA5-MIN appears to report values much closer to the reference rainfall. In summary, if IMERG, MERRA2, and WLDAS are better at estimating the timing of this event, IMERG, MERRA2, and ERA5-MIN are better at estimating its peak magnitude.
The peak of the second event (Figure 4b) occurred on January 21, 2010 (as detected by the in-situ stations), with the storm overall lasting the course of many days building up to the peak and slowly ramping down after. For this event, the timing across all products seemed more in accordance with the reference dataset, except for WLDAS that anticipates the peak of the precipitation event to the previous day. The estimated magnitude, however, was most precise amongst WLDAS, MERRA2, and ERA5-MIN, while IMERG and ERA5-MAX overestimated the rainfall rate. ERA5-MAX, ERA5-MIN, MERRA2, and IMERG were therefore better at estimating the timing of the event peak, while ERA5-MIN, MERRA2, and WLDAS were better at estimating its magnitude.
Finally, the third event (Figure 4c) seems to have perfect timing across all estimation products with a peak on February 14, 2019. However, the magnitude of such peak varies across datasets. Specifically, ERA5-MIN and MERRA2 underestimated the peak magnitude, while ERA5-MAX, WLDAS, and IMERG overestimated it.
Across all three events (Figure 4), IMERG and MERRA2 consistently correctly reported the timing of precipitation, and ERA5-MIN and MERRA2 consistently reported similar magnitudes of precipitation to the reference. This could indicate a good performance of MERRA2 relative to other re-analysis and satellite-based products at both estimating the timing and magnitude of extreme events across the study area, although further investigation is required.
2.3. Data Analysis
The first set of analyses to assess the performance of the four precipitation products in Palm Desert is based on scatterplots and cumulative distribution functions (CDFs).
The percentage of days with no precipitation (dry days) and days with precipitation (wet days) was then investigated for each product. The threshold for wet days included any precipitation detected over 0.1 mm/day.
Next, three common statistical metrics were used to further investigate the products’ performance: bias ratio, mean error, and Pearson’s correlation coefficient [36]. The bias ratio compares each evaluation dataset to the reference dataset, as shown in Equation 2. Ideally, there would not be any bias in the datasets, meaning the bias ratio would be one.
where is the estimated precipitation value, x is the reference precipitation value, and n is the total number of data points.
The mean error measures the average difference between two datasets. The closer to zero this metric is, the smaller the difference between the two, as shown in Equation 3.
Pearson’s correlation coefficient looks at the linear association between the datasets. Ideally, the datasets would have a linear relationship, which corresponds to value of 1 for this metric. This coefficient is represented by the variable and the formula is shown in Equation 4:
Contingency tables were then created to calculate the number of hit cases (H), missed events (M), false alarms (F), and correct no precipitation presence (Z). H represents the number of times the estimate correctly detected the presence of precipitation [36]. M refers to times in which precipitation was not detected, but the reference did observe rain. F represents the number of times the estimate did detect precipitation when in fact it had not rained. Z refers to the number of times both estimate and reference detected no precipitation.
This study used contingency tables to calculate error statistics as a function of precipitation threshold. The probability of detection (POD) measures the likelihood of a product to correctly detect the presence of precipitation by comparing the number of times the evaluation dataset correctly detected precipitation and the number of times it incorrectly detected precipitation:
POD can be computed as a function of a threshold defined based on reference precipitation, as shown in Table 2 [37]. The missed precipitation represents the ratio of the volume of precipitation not captured by the estimation product to the total volume of precipitation captured by the reference product, with respect to the reference rain threshold [37].
Missed precipitation is computed as a function of the POD contingency values, where the number of missed events is divided by the sum of the number of missed events and hit cases. This is represented by Equation 6 below:
The false alarm rate (FAR) quantifies the number of times the remote dataset incorrectly detected the presence of precipitation by comparing the number of times the remote equipment incorrectly and correctly detected the presence of precipitation:
FAR, or the likelihood of an evaluation product incorrectly detecting precipitation when in fact it does not rain, can be calculated as a function of threshold defined based on the evaluation product, as presented in Table 3 [37].
The falsely detected precipitation represents the ratio of the volume of precipitation incorrectly captured by the estimation product to the total volume of precipitation detected by the estimation product, with respect to the reference rain threshold.
Falsely detected precipitation is computed as a function of the FAR contingency values, where the number of false detections is divided by the sum of the number of false detections and hit cases. This is represented by Equation 8 below:
3. Results
The scatterplots for each estimation product versus the reference dataset are presented in Figure 5. The linear relationship between each product and the reference product is positive, although not very strong, indicating there may be room for improvement in each product.
The 10th, 50th, 75th, 90th, 95th, and 99th percentiles were computed for each product for precipitation rates greater than 0.1 mm/day (Table 4). Percentiles of each estimation product were generally similar to those of the reference dataset. ERA5-MAX values are higher than the reference ones, which is expected given that this dataset provides maximum daily precipitation. WLDAS was consistently the closest in value at each percentile, with values that almost matched those of the reference dataset. The CDF plots in Figure 6 provide a visualization of these percentile values and how that compare to one another.
The CDF of the reference dataset illustrates that 90% of the daily precipitation values recorded were 7.17 mm/day or less. IMERG reported only 4.27 mm/day at the 90th percentile. However, it was almost the same value as the reference dataset in the 99th percentile with 27.41 mm/day or less reported (Table 4). This indicates that the average amount of precipitation being reported by IMERG is less than the actual occurrence, but the amount of precipitation being reported for extreme events is more likely to be accurate. Something similar could be stated for ERA5-MIN and MERRA2, although these percentile values are much closer to the reference data at the 90th percentile, and ERA5-MIN is much closer to the reference dataset value at the 99th percentile than MERRA2. WLDAS is very close to the reference at both the 90th and 99th percentiles, indicating that this estimation product may be accurately reporting precipitation values during both typical and extreme events. ERA5-MAX seems to be overestimating precipitation at all percentiles, which is expected given the nature of this product to estimate higher rainfall.
The overall ratio of “wet” days, defined as any day that received more than 0.1 mm of rain in one day, is analyzed in Figure 7.
Across all products, the proportion of wet days—defined as days with measurable precipitation—remained within the 10% to 40% range of total annual days. It is difficult to compare the proportion of wet days between each product based on the trend alone, but the reference product reported a ratio of 19.5% wet days over the entire study period. ERA5-MAX reported 37.0% of the total time series as wet days, ERA5-MIN reported 17.3%, MERRA2 reported 26.2%, WLDAS reported 17.7%, and IMERG reported 31.8% of the total days reported as wet days. Among these, ERA5-MIN and WLDAS exhibited the highest concordance with the reference dataset, with the closest wet day percentages. The remaining products were still close, all less than 20% higher. However, given the high sensitivity of the study region to precipitation, even minor deviations in the frequency or detection of wet days among the products may carry significant implications, warranting close scrutiny in comparative evaluations.
3.1. Continuous Statistics
The overall bias ratio was first computed for each estimated dataset with respect to the reference. Then, a relative bias ratio was computed at three different thresholds, where the estimation rain rate was higher than the 75th, 90th, and 95th percentiles (refer to Table 5 for percentile values). The results are shown in Figure 8a.
The bias ratio exhibits a consistent trend across all datasets, deteriorating progressively as the threshold increases. Among the datasets analyzed, ERA5-MAX exhibits the highest bias (greatest deviation from unity), whereas WLDAS and ERA5-MIN show the most favorable bias ratios. MERRA2 and IMERG present similar biases with a nearly linear increase with increasing threshold. They are similar in value overall to the biases of WLDAS and ERA5-MIN, although they deviate further from unity as the threshold increases. Insights gained could potentially inform enhancements to bias correction strategies that are rain rate dependent.
The behavior of the mean error closely mirrors that of the bias ratio, reflecting their inherent similarity (Figure 8b). However, unlike the bias ratio, the mean error quantifies the magnitude of rainfall misestimation, providing a more direct measure of the error in precipitation amounts. The overall mean error remains near zero across all datasets except for ERA5-MAX, which, once again, is expected given the nature of this dataset. However, as the percentile threshold increases, the ability of the products in capturing rainfall magnitudes observed by the gauges declines notably. For extreme precipitation events (e.g., the 95th percentile), ERA5-MAX exhibits mean errors reaching up to 20 mm/day. MERRA2 and IMERG show errors between 7 mm/day and 14 mm/day for the higher thresholds (90th and 95th percentiles). These error magnitudes are substantial, particularly in the context of the arid climate region examined in this study.
Figure 9 presents Pearson’s correlation coefficient for each dataset. A general decline in correlation is observed as the percentile threshold increases. Notably, ERA5-MAX consistently exhibits the highest correlation values. This indicates that, despite the discrepancies in rainfall amounts discussed above, ERA5-MAX aligns most closely with the temporal pattern of rainfall observed in the reference dataset. In contrast, MERRA2 exhibits the weakest correlation with ground-based observations, which may be attributed to its relatively coarse spatial resolution.
3.2. Contingency Metrics
Figure 10a illustrates the probability of detection relative to the estimated precipitation threshold, computed based on Table 2. ERA5-MAX exhibits the highest POD, with a probability of detection of 95% or higher when the threshold is 2 mm/day or greater, indicating strong performance in identifying rainfall events. While MERRA2 records a relatively low POD of 70% at the minimal threshold of 0.1 mm/day, it exhibits improved detection capabilities at higher thresholds, supporting its effectiveness in capturing extreme precipitation events in arid regions. In contrast, WLDAS consistently yields lower POD values across all thresholds. Despite its ability to closely replicate the overall distribution of rainfall, WLDAS appears limited in accurately detecting the timing of rainfall events, suggesting a deficiency in temporal precision.
Figure 10b illustrates false alarm ratios calculated based on the contingency matrix shown in Table 3 as a function of different reference precipitation thresholds. All datasets exhibit a similar decreasing trend in FAR, with ERA5-MIN consistently achieving the lowest values. Conversely, ERA5-MAX shows the highest FAR, indicating a greater tendency to report rainfall when none occurred. These results are expected given that the two products offer a minimum and maximum rainfall estimate during the day.
This is particularly important for the reliability of early warning systems, which depend heavily on accurate rainfall detection to issue timely alerts for potential flooding or other hydrometeorological hazards. A low FAR minimizes the risk of false alarms, which can erode public trust and lead to reduced responsiveness over time. Thus, the consistently low FAR across these datasets enhances their suitability for operational use in early warning and disaster preparedness frameworks, particularly in regions where rainfall is infrequent but can have significant impacts.
The analysis of missed precipitation presented in Figure 11a reveals that all estimation products exhibit a similar decreasing trend as the threshold increases, as expected. WLDAS consistently shows a higher proportion of missed precipitation compared to the other datasets, which are much closer to one another. While previous findings indicated that WLDAS was among the most precise in replicating the overall rainfall distribution, it was also noted that its temporal accuracy—specifically, the correct timing of rainfall events—was likely the poorest. The elevated missed precipitation ratios observed for WLDAS in Figure 11a corroborate this finding, indicating a consistent under detection of rainfall events.
Missed precipitation can be particularly problematic in arid and semi-arid regions, even at low rainfall intensities, due to the critical role that every precipitation event plays in these water-scarce environments. In such regions, rainfall events are infrequent and highly variable, and even small amounts can have significant ecological, agricultural, and hydrological impacts. Missing these events can lead to underestimation of available water resources, misinformed drought assessments, and inadequate planning for water supply and agricultural management. Furthermore, missed precipitation can compromise the effectiveness of hydrological models and early warning systems, which rely on accurate detection of rainfall to forecast runoff, soil moisture, and potential flood or drought conditions. Inaccurate representation of precipitation events can thus exacerbate the vulnerability of communities and ecosystems already under stress from limited water availability.
Similarly, the falsely detected precipitation graph in Figure 11b shows an overall decreasing trend, with WLDAS seemingly set apart from the others. The missed and false precipitation ratio values illustrate that ultimately, WLDAS was missing the highest volume of precipitation and also reported more precipitation than what was detected by the reference product. As the reference rain threshold increases to represent more extreme rain events, the volume of rain missed or falsely detected decreases.
3.3. Dataset Ranking
To provide a high-level glance at how each estimation product performed and compared to one another, a ranking system was used to assist in answering each research question. The rankings are listed in Tables 5 through 8. A simple system of assigning each product a number, 1 through 5, based on which product had the best (one) and worst (five) results compared to the other products.

Table 5.
Performance ranking when measuring average precipitation (research question 1).
| ERA5-MAX | ERA5-MIN | MERRA2 | WLDAS | IMERG | |
|---|---|---|---|---|---|
| CDF | 1 | 4 | 3 | 2 | 5 |
| Bias Ratio | 5 | 4 | 3 | 1 | 2 |
| Mean Error | 5 | 4 | 3 | 2 | 1 |
| Corr. Coeff. | 1 | 2 | 4 | 2 | 3 |
| SUM | 12 | 14 | 13 | 7 | 11 |
To answer the first research question, i.e., how well different products estimate average precipitation in a dry-climate region, the following metrics were considered: CDF, overall bias ratio, overall mean error, and overall correlation coefficient. For the CDF, the product that presented the closest 50th quantile to the one of the reference dataset was ranked first. Table 5 illustrates how the estimation products ranked compared to one another when estimating average precipitation measurements. Results show that, overall, WLDAS performs better (and ERA5-MIN worse) than all the other products when estimating the average amount of precipitation received during a day of rainfall.
Although WLDAS and ERA5-MAX rank high for CDF, ERA5-MAX ranks worst in terms of bias (i.e., strong overestimation as shown in previous results). The difference between the reference and estimated average precipitation rates was much larger for ERA5-MIN, MERRA2, and IMERG than it was for ERA5-MAX and WLDAS. While ERA5-MAX and WLDAS differed from the reference average by 0.10 mm/day or less (about 10% of the reference dataset average), the remaining three estimation products differed by at least 0.30 mm/day (about 30% of the reference dataset average). This is just to emphasize that the difference in statistical results between products is not necessarily clearly illustrated by the rankings, and the actual results were still taken into consideration while evaluating estimation product performance. Another significant difference which is not clear from the rankings is that all bias ratios (and mean errors) were very close to one another, except for ERA5-MAX, which was significantly higher. The correlation coefficient has larger variability and is generally well represented by the ranking.
To answer the second question, i.e., the performance of precipitation products during extreme precipitation events, the same metrics as overall performance were used, but at the 95th percentile instead (Table 6). As with the findings for average precipitation, WLDAS once again ranks the highest among the five products, exhibiting the lowest bias ratio and mean error, as well as the second-best 95th percentile (i.e., closest to the one of the ground reference) and correlation coefficient. Nevertheless, in this case, ERA5-MAX comes last, followed by MERRA2, and IMERG. This is surprising given that ERA5-MAX, by definition, should be capturing the largest rates during the day.
Table 6.
Performance ranking when measuring extreme precipitation (research question 2).
| ERA5-MAX | ERA5-MIN | MERRA2 | WLDAS | IMERG | |
|---|---|---|---|---|---|
| CDF | 5 | 1 | 3 | 2 | 4 |
| Bias Ratio | 5 | 2 | 4 | 1 | 3 |
| Mean Error | 5 | 2 | 3 | 1 | 4 |
| Corr. Coeff. | 1 | 4 | 5 | 2 | 3 |
| SUM | 16 | 9 | 15 | 6 | 14 |
At the 95th percentile, cumulative precipitation rates were comparable among the reference dataset, WLDAS, and ERA5-MIN (as shown in Table 4). In contrast, MERRA2 and IMERG tended to underestimate high rainfall rates, while ERA5-MAX significantly overestimated them. The bias ratio for events at or above the 95th percentile was closest to the ideal value of 1 for both WLDAS and ERA5-MIN. The next closest were IMERG and MERRA2, both with bias ratios exceeding 2, while ERA5-MAX had a bias ratio approaching 3. A similar pattern emerged for mean error, with WLDAS and ERA5-MIN nearly tied for the most accurate estimates. These were followed—at a considerable distance—by MERRA2 and IMERG, and finally ERA5-MAX, which had the largest deviation from the ideal. Interestingly, the correlation coefficient told a different story: ERA5-MAX had the highest correlation with the reference data, followed—though more distantly—by WLDAS and IMERG, then ERA5-MIN, and lastly MERRA2. This marked a shift from the rankings observed at the 50th percentile, largely due to a notable drop in ERA5-MIN’s correlation for extreme precipitation events. Overall, these results suggest that ERA5-MIN may be more reliable for estimating average precipitation than for capturing extreme rainfall events, a conclusion supported by its performance across both average and high-intensity precipitation metrics.
The third research question focused on the capabilities of the different products to detect overall precipitation. The ranking of the datasets utilized the probability of detection, the false alarm rate, the missed precipitation fraction, and the falsely detected precipitation fraction (Table 7). Similar to research objective 1, the values of these metrics were taken for the overall precipitation (larger than 0.1 mm/day).
Table 7.
Performance ranking when detecting overall precipitation (research question 3).
| ERA5-MAX | ERA5-MIN | MERRA2 | WLDAS | IMERG | |
|---|---|---|---|---|---|
| Wet days % | 5 | 2 | 3 | 1 | 4 |
| POD | 1 | 4 | 3 | 5 | 2 |
| FAR | 5 | 1 | 3 | 2 | 4 |
| Missed Precip. | 1 | 4 | 2 | 5 | 3 |
| False Precip. | 3 | 1 | 2 | 5 | 4 |
| SUM | 15 | 12 | 13 | 18 | 17 |
For the percentage of wet days—defined as days receiving at least 0.1 mm of rainfall—the ranking was determined based on the overall proportion of such days throughout the study period. WLDAS and ERA5-MIN aligned most closely with the reference dataset, followed—though less closely—by MERRA2, IMERG, and ERA5-MAX. ERA5-MAX recorded the highest average probability of detection, outperforming IMERG and MERRA2 by over 10%. In contrast, ERA5-MIN and WLDAS trailed those two products by an additional 10%. Missed precipitation rates were comparable among ERA5-MIN, IMERG, and MERRA2, with ERA5-MAX performing slightly better and WLDAS showing a higher rate than all others. When it came to false precipitation, IMERG, ERA5-MAX, and MERRA2 exhibited very similar values. ERA5-MIN had a noticeably lower rate, though not to the extent of WLDAS, which again stood out with a substantially higher rate than the rest. Taken together, these findings suggest that ERA5-MIN, MERRA2, and IMERG demonstrate comparable performance in detecting rainfall presence on an average day.
The analysis of the capability of the various products to detect extreme precipitation rates is based on the same metrics shown in Table 7, but using values computed for the 95th percentile (Table 8). In response to objective 4, ERA5-MIN ranks first, followed by IMERG, whereas WLDAS presents the lowest ranking.
Table 8.
Performance ranking when detecting extreme precipitation (research question 4)
| ERA5-MAX | ERA5-MIN | MERRA2 | WLDAS | IMERG | |
|---|---|---|---|---|---|
| POD | 2 | 3 | 1 | 5 | 4 |
| FAR | 5 | 1 | 3 | 4 | 2 |
| Missed Precip. | 2 | 3 | 4 | 5 | 1 |
| False Precip. | 3 | 1 | 4 | 5 | 2 |
| SUM | 12 | 8 | 12 | 19 | 9 |
The probability of detection for extreme precipitation events increases significantly across all estimation products—except for WLDAS, which remains below 90% even at thresholds as high as 20 mm/day. This suggests that, although WLDAS performs reasonably well in estimating daily rainfall amounts, it is unreliable in detecting the timing or occurrence of rainfall, particularly during extreme events. The false alarm rate for extreme events was consistently similar across all products, showing no major outliers. However, both missed precipitation and false precipitation followed a pattern similar to POD: values were comparable among all products except WLDAS, which exhibited significantly higher errors in both categories. These findings highlight a notable weakness in WLDAS—its limited ability to accurately detect the presence of rainfall, especially during high-intensity events.
4. Conclusions
Climate change is driving increasingly dramatic shifts in weather patterns across the globe. One notable example is the rising frequency, intensity, and duration of precipitation events in the southwestern United States, a region traditionally characterized by arid and semi-arid conditions. These extreme rainfall events, which historically occurred less than once in a century, are now becoming more common. As a result, existing infrastructure—designed for much drier conditions—is often overwhelmed and prone to failure, highlighting the urgent need for climate-resilient planning and adaptation strategies.
This study answered four research questions posed in Chapter 2:
- What is the ability of different precipitation products to estimate the magnitude of average precipitation locally in a dry climate region?
Based on the statistical analysis of average precipitation during the study period in the area surrounding Palm Desert, California, the performance analysis places WLDAS at the top, followed by IMERG, ERA5-MAX, MERRA2, and ERA5-MIN. A closer examination of the relative differences between these rankings reveals that WLDAS significantly outperforms the other products in estimating the amount of precipitation received during a typical day of rainfall.
- 2.
- What is the ability of different precipitation products to estimate the magnitude of extreme precipitation events in a dry area?
When evaluating the ability of satellite and re-analysis products to capture the magnitude of precipitation during extreme events, the performance ranking shows WLDAS as the most accurate, followed by ERA5-MIN, IMERG, MERRA2, and finally ERA5-MAX as the least accurate. While WLDAS once again demonstrates strong performance in estimating rainfall amounts, it is also noteworthy that ERA5-MIN, which performs well for average daily precipitation, appears to be less reliable when estimating extreme rainfall events.
- 3.
- What is the ability of different precipitation products to estimate the occurrence of overall precipitation in a dry climate region?
The overall ability of the five products to accurately detect the presence of rainfall was assessed using contingency metrics, including probability of detection, false alarm rate, missed precipitation fraction, and false precipitation fraction. Based on these metrics, the performance ranking places ERA5-MIN as the most accurate, followed by MERRA2, ERA5-MAX, IMERG, and WLDAS. Taking both the overall rankings and a more detailed analysis into account, the results suggest that ERA5-MIN, MERRA2, and IMERG perform similarly and are the most reliable in detecting precipitation on an average rainy day.
- 4.
- What is the ability of different precipitation products to estimate the occurrence of extreme precipitation in a dry climate region?
ERA5-MIN performed best when detecting extreme precipitation, followed by IMERG, with MERRA2 and ERA5-MAX tied, and with WLDAS performing the worst. An analysis of these rankings, in conjunction with the detailed contingency metrics, highlights WLDAS’s limited ability to reliably detect rainfall, particularly during high-intensity events. In contrast, ERA5-MIN consistently demonstrates the highest capability for accurately identifying the presence of precipitation across both average and extreme rainfall conditions, making it the most robust performer overall.
In summary, WLDAS ranked highest in measuring total precipitation and extreme rainfall amounts, yet performed the worst in detecting the occurrence of both average and extreme precipitation events. In contrast, IMERG and ERA5-MIN appear to be the most capable at detecting the timing of precipitation, though they are less accurate in estimating the actual amount of rainfall per event.
Future work should investigate the conclusions drawn above in different regions characterized by a similar climate to generalize the results presented in this study. Additional satellite-based products and re-analysis data should also be assessed together with ground radar observations, if available. Time series should also be extended to a longer temporal range.
The impact of bias correction techniques applied to each estimation product could also be considered, as they can significantly influence overall performance. Bias corrections are often implemented to align modeled or satellite-derived precipitation estimates with observed data, improving accuracy in magnitude and distribution. However, these adjustments can also introduce new uncertainties or mask underlying deficiencies in the original datasets. Evaluating how each product's performance changes before and after bias correction can provide valuable insight into the true capabilities of the raw estimation models versus the effectiveness of the correction methods themselves. This distinction is especially important when comparing products across different climate regimes or event intensities, such as average versus extreme precipitation. In future analyses, incorporating a systematic comparison of bias-corrected versus uncorrected outputs could help clarify whether observed improvements are due to the model's inherent skill or the strength of the correction algorithm applied.
Data Availability Statement
We encourage all authors of articles published in MDPI journals to share their research data. In this section, please provide details regarding where data supporting reported results can be found, including links to publicly archived datasets analyzed or generated during the study. Where no new data were created, or where data is unavailable due to privacy or ethical restrictions, a statement is still required. Suggested Data Availability Statements are available in section “MDPI Research Data Policies” at https://www.mdpi.com/ethics.
Acknowledgments
In this section, you can acknowledge any support given which is not covered by the author contribution or funding sections. This may include administrative and technical support, or donations in kind (e.g., materials used for experiments). Where GenAI has been used for purposes such as generating text, data, or graphics, or for study design, data collection, analysis, or interpretation of data, please add “During the preparation of this manuscript/study, the author(s) used [tool name, version information] for the purposes of [description of use]. The authors have reviewed and edited the output and take full responsibility for the content of this publication.”
Conflicts of Interest
Declare conflicts of interest or state “The authors declare no conflicts of interest.” Authors must identify and declare any personal circumstances or interest that may be perceived as inappropriately influencing the representation or interpretation of reported research results. Any role of the funders in the design of the study; in the collection, analyses or interpretation of data; in the writing of the manuscript; or in the decision to publish the results must be declared in this section. If there is no role, please state “The funders had no role in the design of the study; in the collection, analyses, or interpretation of data; in the writing of the manuscript; or in the decision to publish the results”.
References
- Milly PCD, Betancourt J, Falkenmark M, Hirsch RM, Kundzewicz ZW, Lettenmaier DP, Stouffer RJ. Stationarity Is Dead: Whither Water Management? Science. 2008;319(5863):573–574. [CrossRef]
- Ragno E, AghaKouchak A, Love CA, Cheng L, Vahedifard F, Lima CHR. Quantifying Changes in Future Intensity-Duration-Frequency Curves Using Multimodel Ensemble Simulations. Water Resources Research. 2018;54(3):1751–1764. [CrossRef]
- Mishra A, Mukherjee S, Merz B, Singh VP, Wright DB, Villarini G, Paul S, Kumar DN, Khedun CP, Niyogi D, et al. An Overview of Flood Concepts, Challenges, and Future Directions. Journal of Hydrologic Engineering. 2022;27(6):03122001. [CrossRef]
- Wang L, Cui S, Li Y, Huang H, Manandhar B, Nitivattananon V, Fang X, Huang W. A review of the flood management: from flood control to flood resilience. Heliyon. 2022;8(11):e11763. [CrossRef]
- Yao J-Q, Chen J, Zhang T-W, Dilinuer T, Mao W-Y. Stationarity in the variability of arid precipitation: A case study of arid Central Asia. Advances in Climate Change Research. 2021;12(2):172–186. [CrossRef]
- Sun F, Roderick ML, Farquhar GD. Rainfall statistics, stationarity, and climate change. Proceedings of the National Academy of Sciences of the United States of America. 2018;115(10):2305–2310. [CrossRef]
- Reinhart BJ. Hurricane Hilary. 2024 Feb 12. https://www.nhc.noaa.gov/data/tcr/EP092023_Hilary.pdf.
- Mousam A, Maggioni V, Delamater PL, Quispe AM. Using remote sensing and modeling techniques to investigate the annual parasite incidence of malaria in Loreto, Peru. Advances in Water Resources. 2017;108:423–438. [CrossRef]
- Serrat-Capdevila A, Valdes JB, Stakhiv EZ. Water Management Applications for Satellite Precipitation Products: Synthesis and Recommendations. JAWRA Journal of the American Water Resources Association. 2014;50(2):509–525. [CrossRef]
- Maggioni V, Meyers PC, Robinson MD. A Review of Merged High-Resolution Satellite Precipitation Product Accuracy during the Tropical Rainfall Measuring Mission (TRMM) Era. 2016 [accessed 2025 Apr 22]. https://repository.library.noaa.gov/view/noaa/69325.
- Michaelides S, Levizzani V, Anagnostou E, Bauer P, Kasparis T, Lane JE. Precipitation: Measurement, remote sensing, climatology and modeling. Atmospheric Research. 2009;94(4):512–533. (Precipitation science: measurement, remote sensing, climatology and modelling). [CrossRef]
- Guo J, Liu H, Li Z, Rosenfeld D, Jiang M, Xu W, Jiang JH, He J, Chen D, Min M, et al. Aerosol-induced changes in the vertical structure of precipitation: a perspective of TRMM precipitation radar. Atmospheric Chemistry and Physics. 2018;18(18):13329–13343. [CrossRef]
- Iguchi T, Kozu T, Meneghini R, Awaka J, Okamoto K. Rain-Profiling Algorithm for the TRMM Precipitation Radar. 2000 Dec 1 [accessed 2025 Apr 24]. https://journals.ametsoc.org/view/journals/apme/39/12/1520-0450_2001_040_2038_rpaftt_2.0.co_2.xml.
- Yang S, Smith EA. Convective-Stratiform Precipitation Variability at Seasonal Scale from Eight Years of TRMM Observations: Implications for Multiple Modes of Diurnal Variability. 2007 [accessed 2025 Apr 24]. https://ntrs.nasa.gov/citations/20080023283.
- Kidd C, Bauer P, Turk J, Huffman GJ, Joyce R, Hsu K-L, Braithwaite D. Intercomparison of High-Resolution Precipitation Products over Northwest Europe. 2012 Feb 1 [accessed 2025 Apr 24]. https://journals.ametsoc.org/view/journals/hydr/13/1/jhm-d-11-042_1.xml. [CrossRef]
- Huffman GJ, Bolvin DT, Nelkin EJ, Wolff DB, Adler RF, Gu G, Hong Y, Bowman KP, Stocker EF. The TRMM Multisatellite Precipitation Analysis (TMPA): Quasi-Global, Multiyear, Combined-Sensor Precipitation Estimates at Fine Scales. 2007 Feb 1 [accessed 2025 Apr 24]. https://journals.ametsoc.org/view/journals/hydr/8/1/jhm560_1.xml. [CrossRef]
- Sapiano MRP, Arkin PA. An Intercomparison and Validation of High-Resolution Satellite Precipitation Estimates with 3-Hourly Gauge Data. 2009 Feb 1 [accessed 2025 Apr 24]. https://journals.ametsoc.org/view/journals/hydr/10/1/2008jhm1052_1.xml. [CrossRef]
- Golian S, Javadian M, Behrangi A. On the use of satellite, gauge, and reanalysis precipitation products for drought studies. Environmental Research Letters. 2019;14(7):075005. [CrossRef]
- Manzanas R, Amekudzi LK, Preko K, Herrera S, Gutiérrez JM. Precipitation variability and trends in Ghana: An intercomparison of observational and reanalysis products. Climatic Change. 2014;124(4):805–819. [CrossRef]
- Zolina O, Kapala A, Simmer C, Gulev SK. Analysis of extreme precipitation over Europe from different reanalyses: a comparative assessment. Global and Planetary Change. 2004;44(1):129–161. (Extreme climatic events). [CrossRef]
- Hinge G, Hamouda MA, Long D, Mohamed MM. Hydrologic utility of satellite precipitation products in flood prediction: A meta-data analysis and lessons learnt. Journal of Hydrology. 2022;612:128103. [CrossRef]
- Belabid N, Zhao F, Brocca L, Huang Y, Tan Y. Near-Real-Time Flood Forecasting Based on Satellite Precipitation Products. Remote Sensing. 2019;11(3):252. [CrossRef]
- Morin E, Marra F, Armon M. Dryland Precipitation Climatology from Satellite Observations. In: Levizzani V, Kidd C, Kirschbaum DB, Kummerow CD, Nakamura K, Turk FJ, editors. Satellite Precipitation Measurement: Volume 2. Cham: Springer International Publishing; 2020. p. 843–859. [CrossRef]
- Serrat-Capdevila A, Merino M, Valdes JB, Durcik M. Evaluation of the Performance of Three Satellite Precipitation Products over Africa. Remote Sensing. 2016;8(10):836. [CrossRef]
- Nozarpour N, Mahjoobi E, Golian S. Assessment of Satellite-based Precipitation Products in Monthly, Seasonal, and Annual Time-Scale over Iran. International Journal of Environmental Research. 2024;18(5):76. [CrossRef]
- Moreno M, Bertolín C, Ortiz P, Ortiz R. Satellite product to map drought and extreme precipitation trend in Andalusia, Spain: A novel method to assess heritage landscapes at risk. International Journal of Applied Earth Observation and Geoinformation. 2022;110:102810. [CrossRef]
- Vernimmen RRE, Hooijer A, Mamenun, Aldrian E, van Dijk AIJM. Evaluation and bias correction of satellite rainfall data for drought monitoring in Indonesia. Hydrology and Earth System Sciences. 2012;16(1):133–146. [CrossRef]
- US Department of Commerce N. Climate. [accessed 2025 Mar 26]. https://www.weather.gov/wrh/climate?wfo=sgx.
- Atlas of the Biodiversity of California. [accessed 2025 Mar 31]. https://wildlife.ca.gov/Data/Atlas.
- Storm Events Database | National Centers for Environmental Information. [accessed 2025 May 14]. https://www.ncdc.noaa.gov/stormevents/.
- Chen M, Shi W, Xie P, Silva VBS, Kousky VE, Wayne Higgins R, Janowiak JE. Assessing objective techniques for gauge-based analyses of global daily precipitation. Journal of Geophysical Research: Atmospheres. 2008;113(D4):2007JD009132. [CrossRef]
- Soci C, Hersbach H, Simmons A, Poli P, Bell B, Berrisford P, Horányi A, Muñoz-Sabater J, Nicolas J, Radu R, et al. The ERA5 global reanalysis from 1940 to 2022. Quarterly Journal of the Royal Meteorological Society. 2024;150(764):4014–4048. [CrossRef]
- Global Modeling And Assimilation Office, Pawson S. MERRA-2 tavg1_2d_flx_Nx: 2d,1-Hourly,Time-Averaged,Single-Level,Assimilation,Surface Flux Diagnostics V5.12.4. 2015 [accessed 2024 Oct 1]. https://disc.gsfc.nasa.gov/datacollection/M2T1NXFLX_5.12.4.html. [CrossRef]
- Erlingis J, Li B, Rodell M. WLDAS Noah-MP 3.6 Land Surface Model L4 Daily 0.01 degree x 0.01 degree, Version D1.0. 2023 [accessed 2024 Oct 1]. https://disc.gsfc.nasa.gov/datasets/WLDAS_NOAHMP001_DA1_D1.0/summary. [CrossRef]
- Huffman GJ, Stocker EF, Bolvin DT, Nelkin EJ, Tan J. GPM IMERG Final Precipitation L3 1 day 0.1 degree x 0.1 degree V07. 2023 [accessed 2024 Oct 1]. https://disc.gsfc.nasa.gov/datacollection/GPM_3IMERGDF_07.html. [CrossRef]
- Massari C, Maggioni V. Error and Uncertainty Characterization. In: Levizzani V, Kidd C, Kirschbaum DB, Kummerow CD, Nakamura K, Turk FJ, editors. Satellite Precipitation Measurement: Volume 2. Cham: Springer International Publishing; 2020. p. 515–532. [CrossRef]
- Anagnostou EN, Maggioni V, Nikolopoulos EI, Meskele T, Hossain F, Papadopoulos A. Benchmarking High-Resolution Global Satellite Rainfall Products to Radar and Rain-Gauge Rainfall Estimates. IEEE Transactions on Geoscience and Remote Sensing. 2010;48(4):1667–1683. [CrossRef]
Figure 1.
Study area map, measuring about 1.2° by 1°, surrounding Palm Desert, California, United States.
Figure 1.
Study area map, measuring about 1.2° by 1°, surrounding Palm Desert, California, United States.
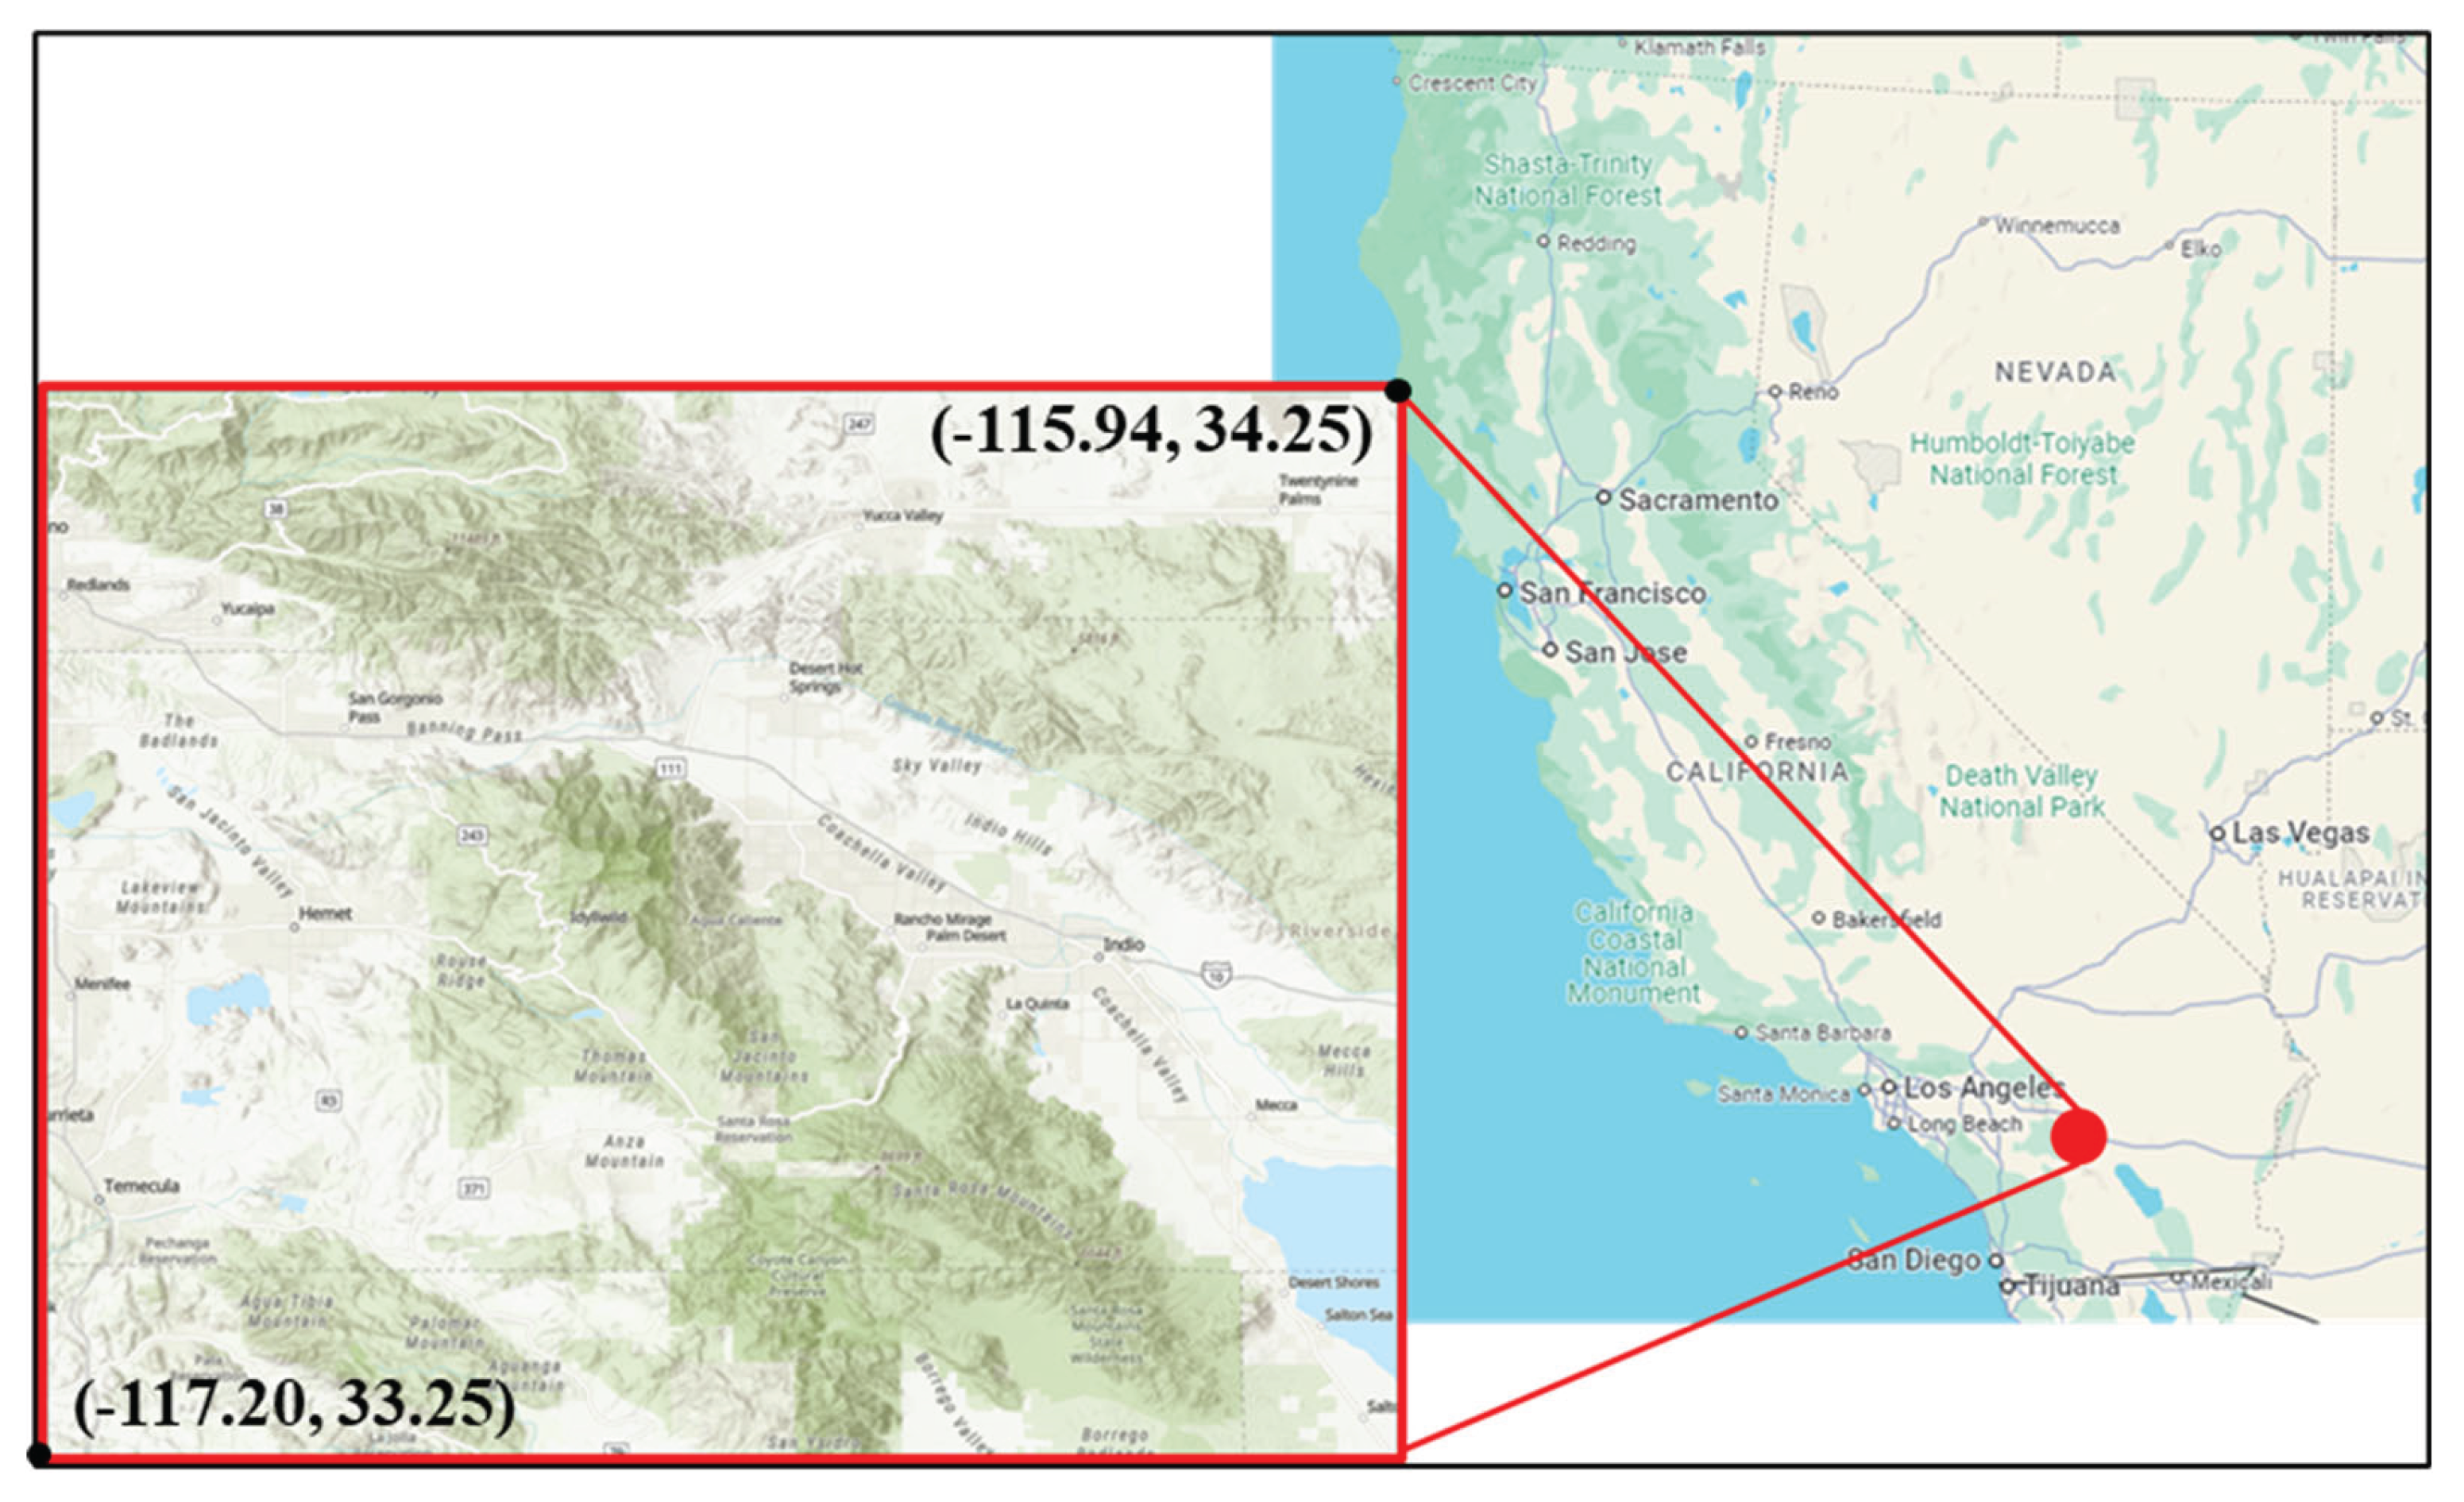
Figure 2.
Map of the study area with overlays of (a) ERA5-MIN, (b) ERA5-MAX, (c) MERRA2, (d) WLDAS, and (e) IMERG average rainfall rates over the study temporal period. The location of four rain gauges is shown with black dots.
Figure 2.
Map of the study area with overlays of (a) ERA5-MIN, (b) ERA5-MAX, (c) MERRA2, (d) WLDAS, and (e) IMERG average rainfall rates over the study temporal period. The location of four rain gauges is shown with black dots.
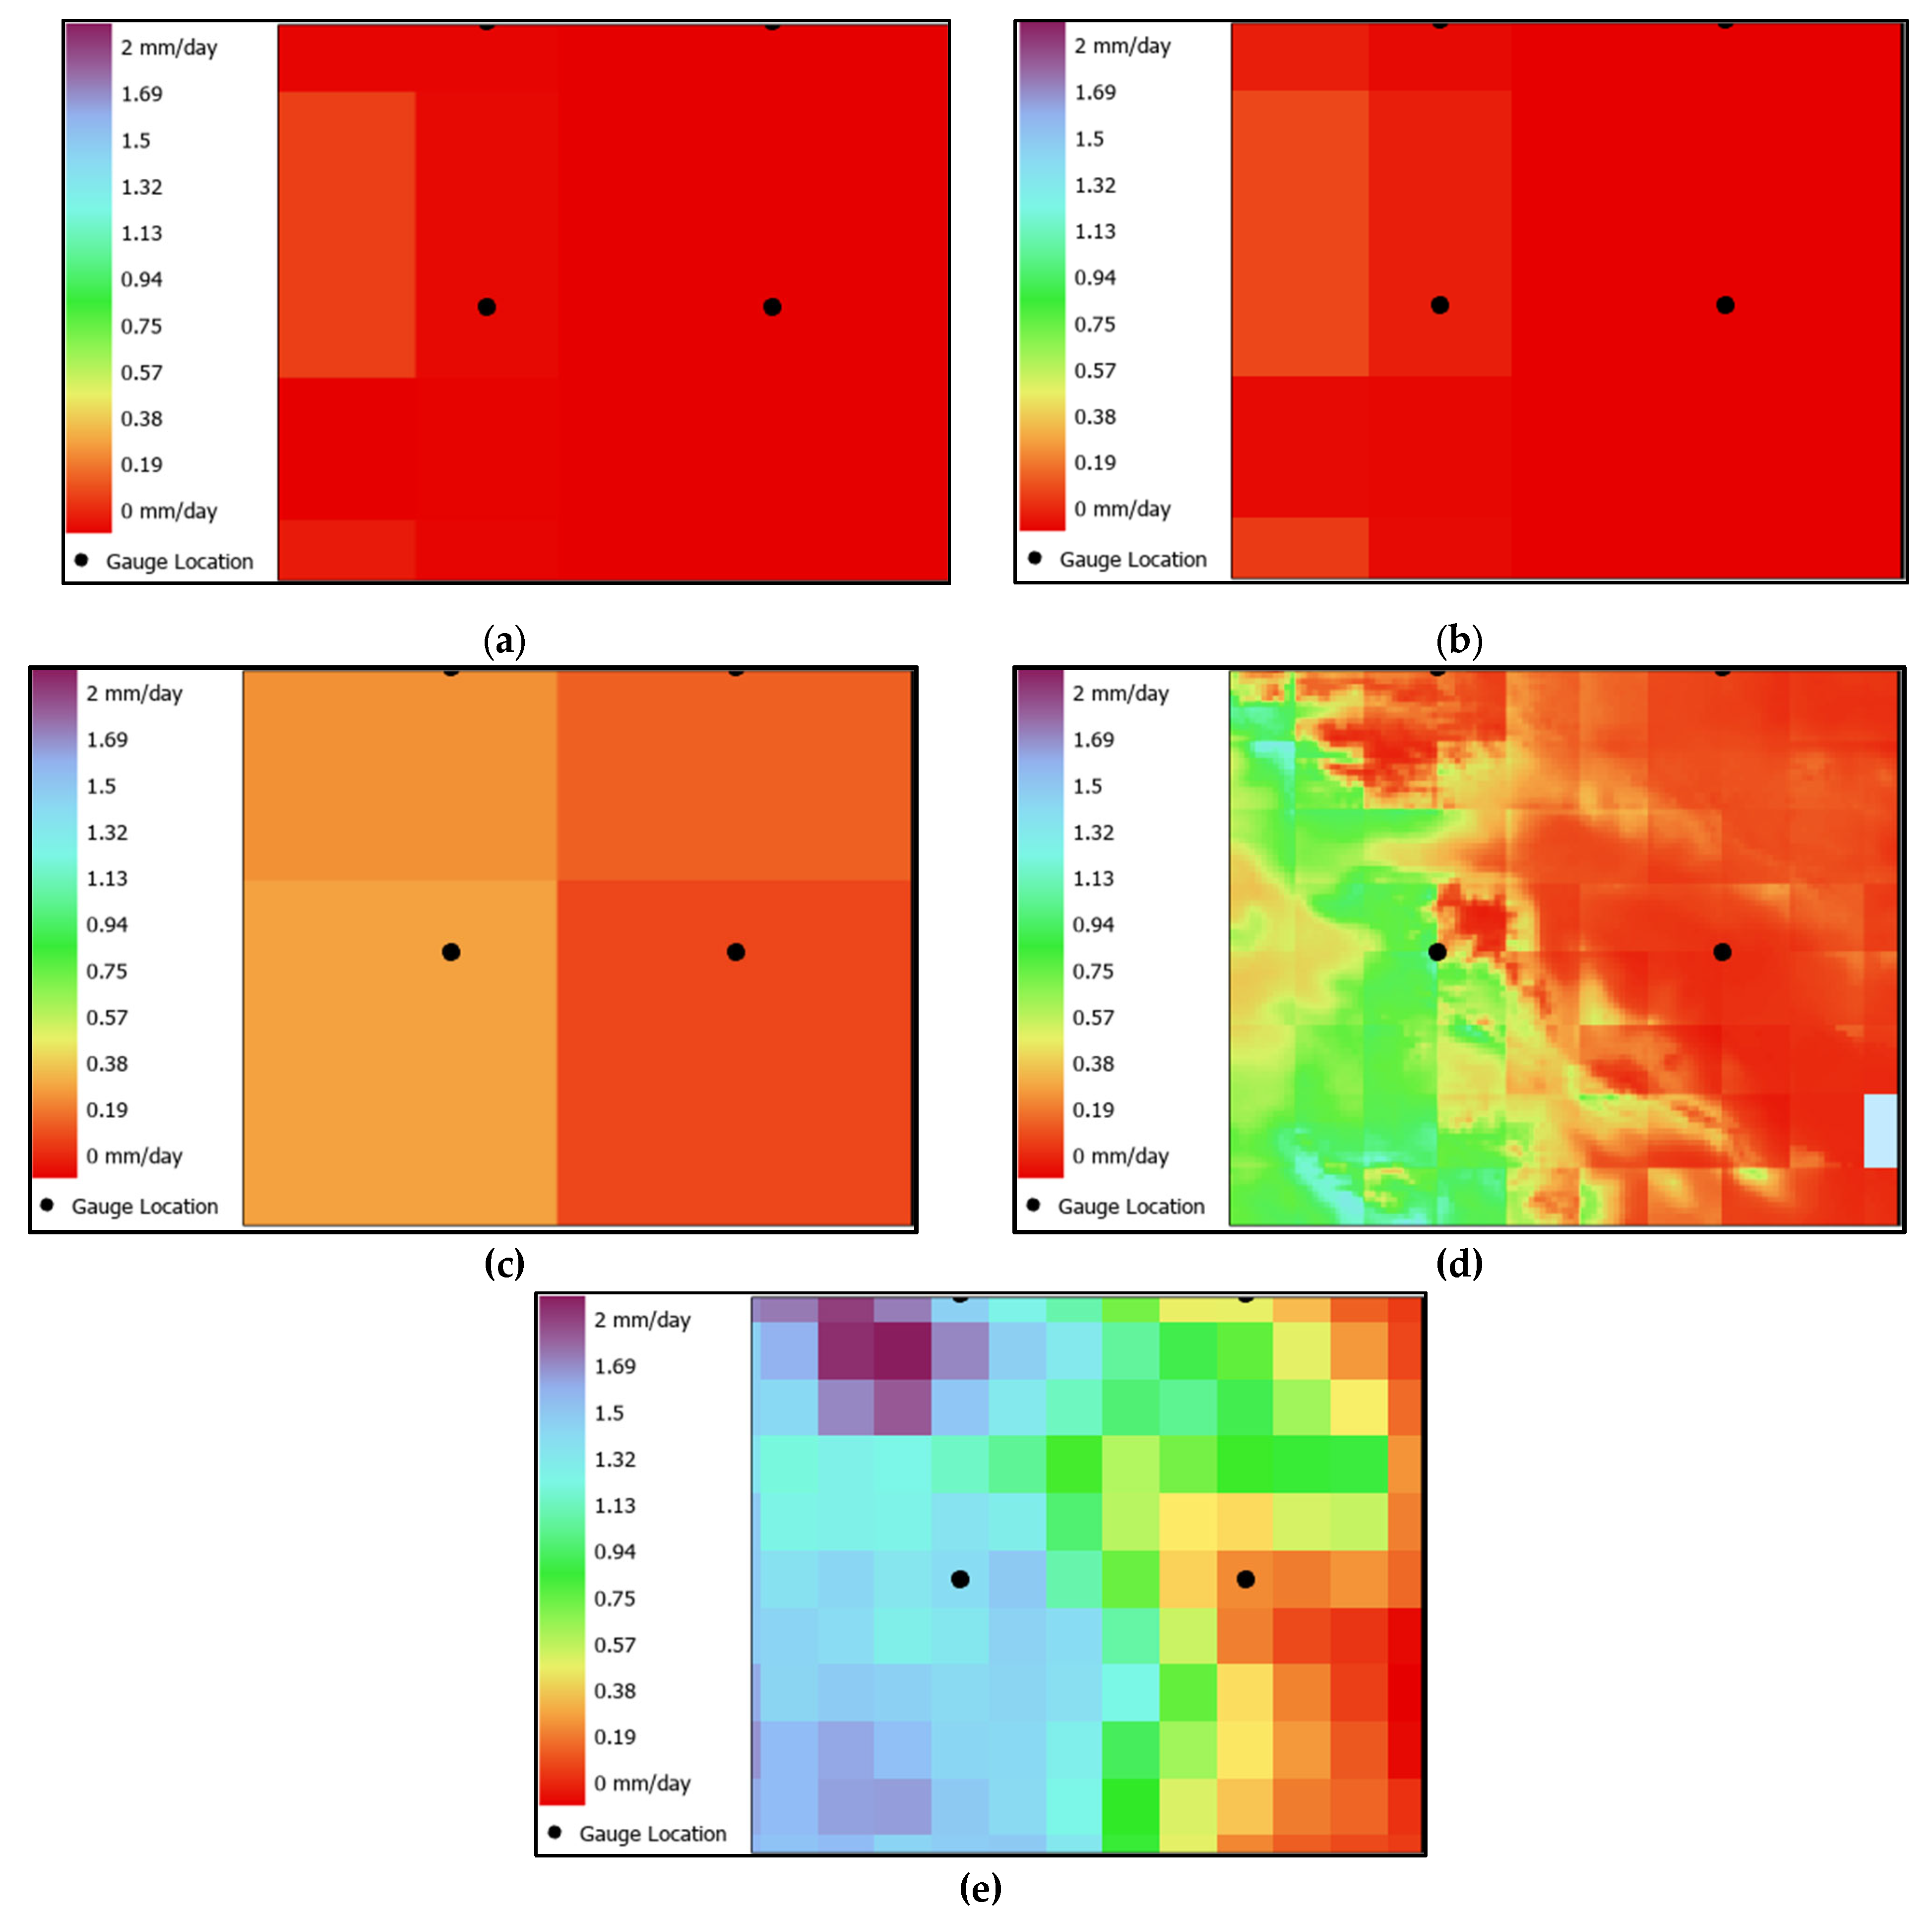
Figure 3.
Time series of all data displayed to illustrate the daily precipitation from four different remote sources and one ground source (gauges).
Figure 3.
Time series of all data displayed to illustrate the daily precipitation from four different remote sources and one ground source (gauges).

Figure 4.
Time series of the different precipitation products during three events recorded around a) December 29, 2004, b) January 21, 2010, and c) February 14, 2019.
Figure 4.
Time series of the different precipitation products during three events recorded around a) December 29, 2004, b) January 21, 2010, and c) February 14, 2019.
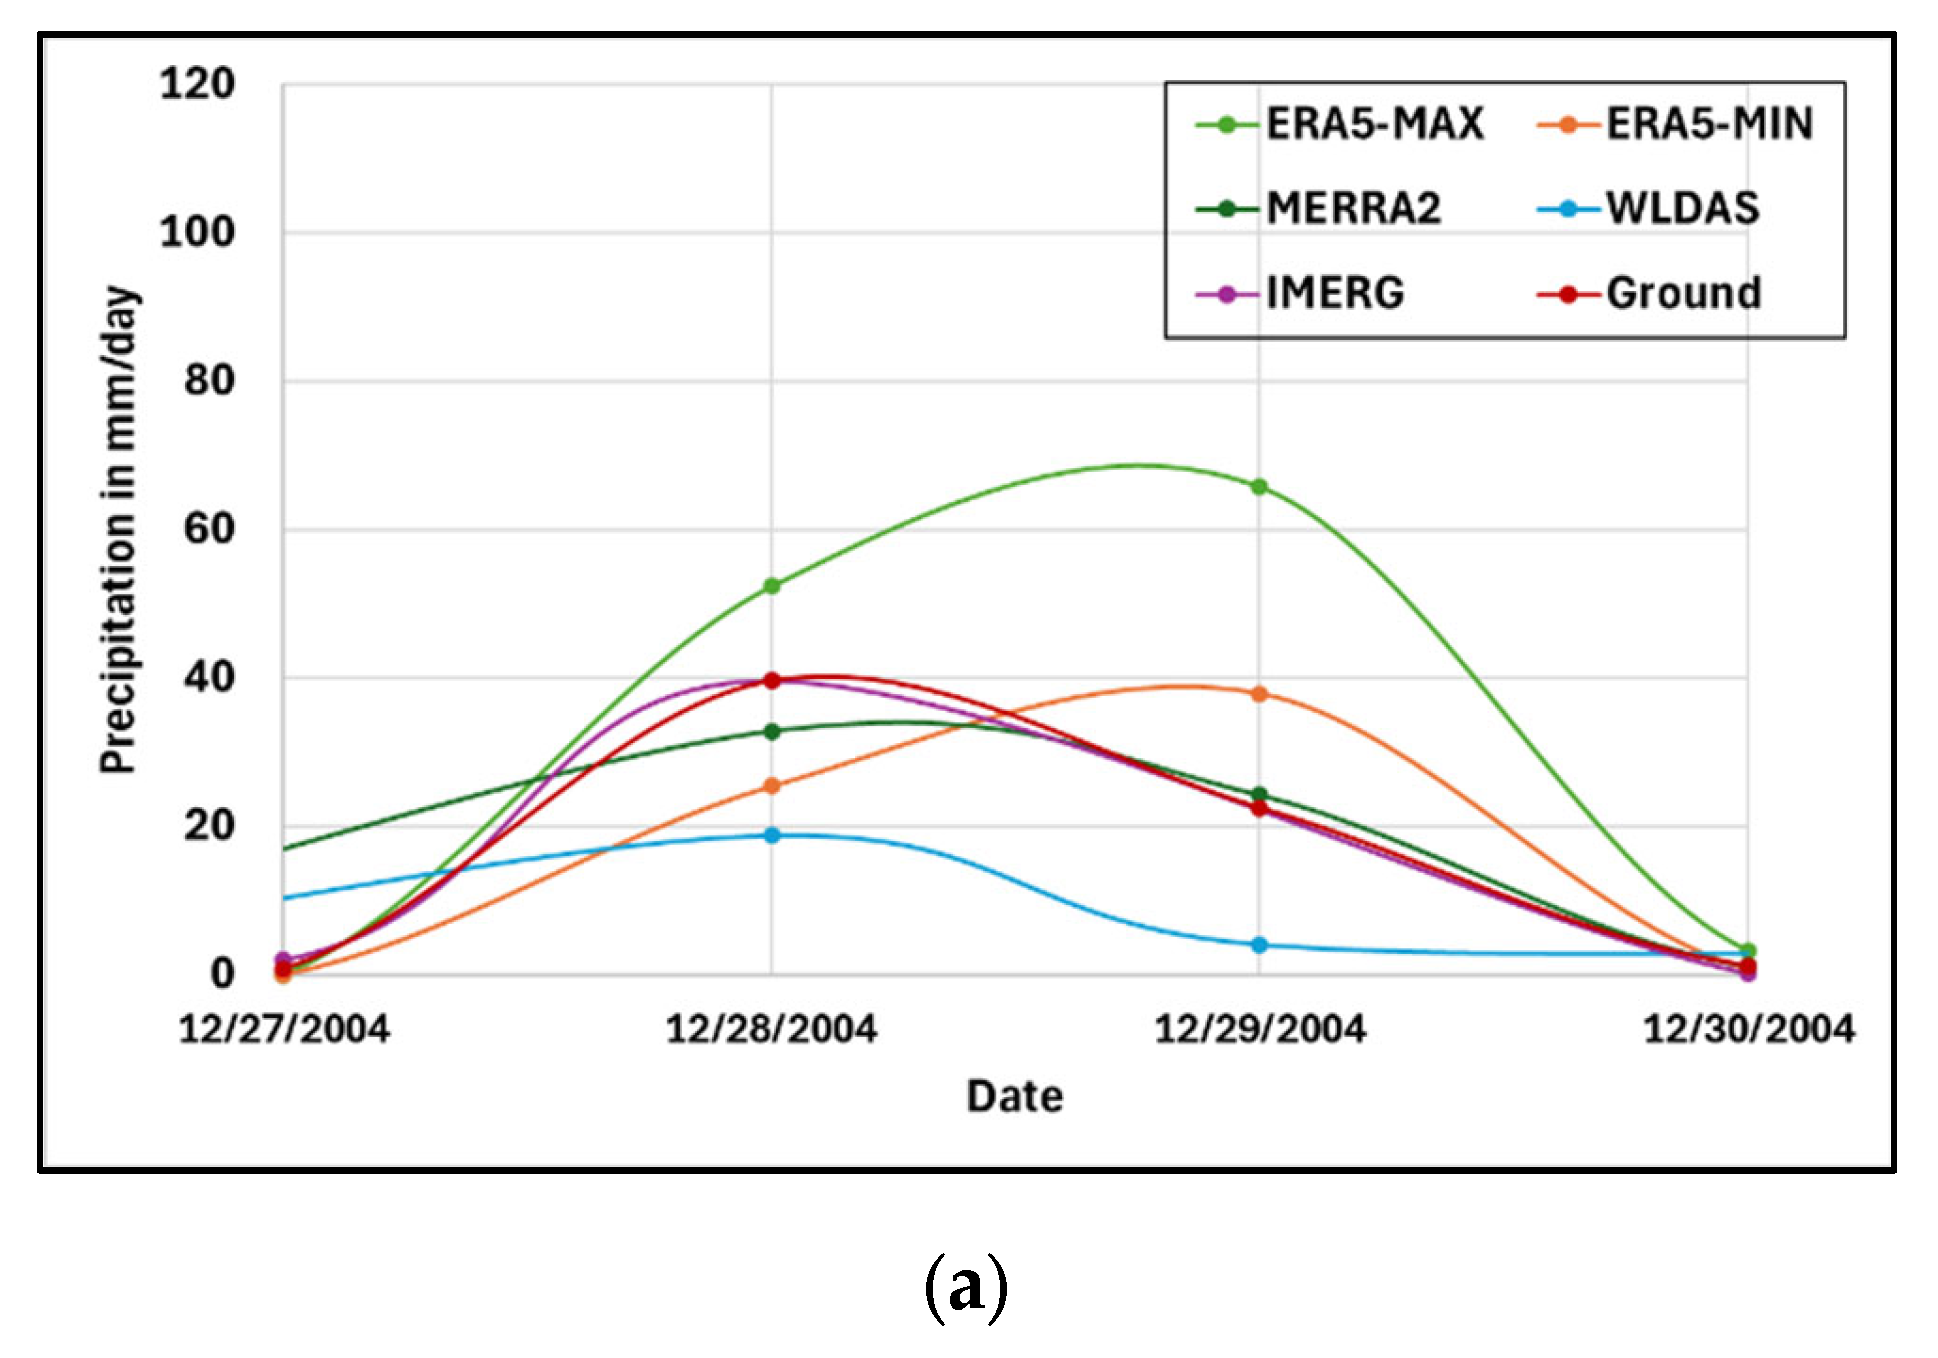
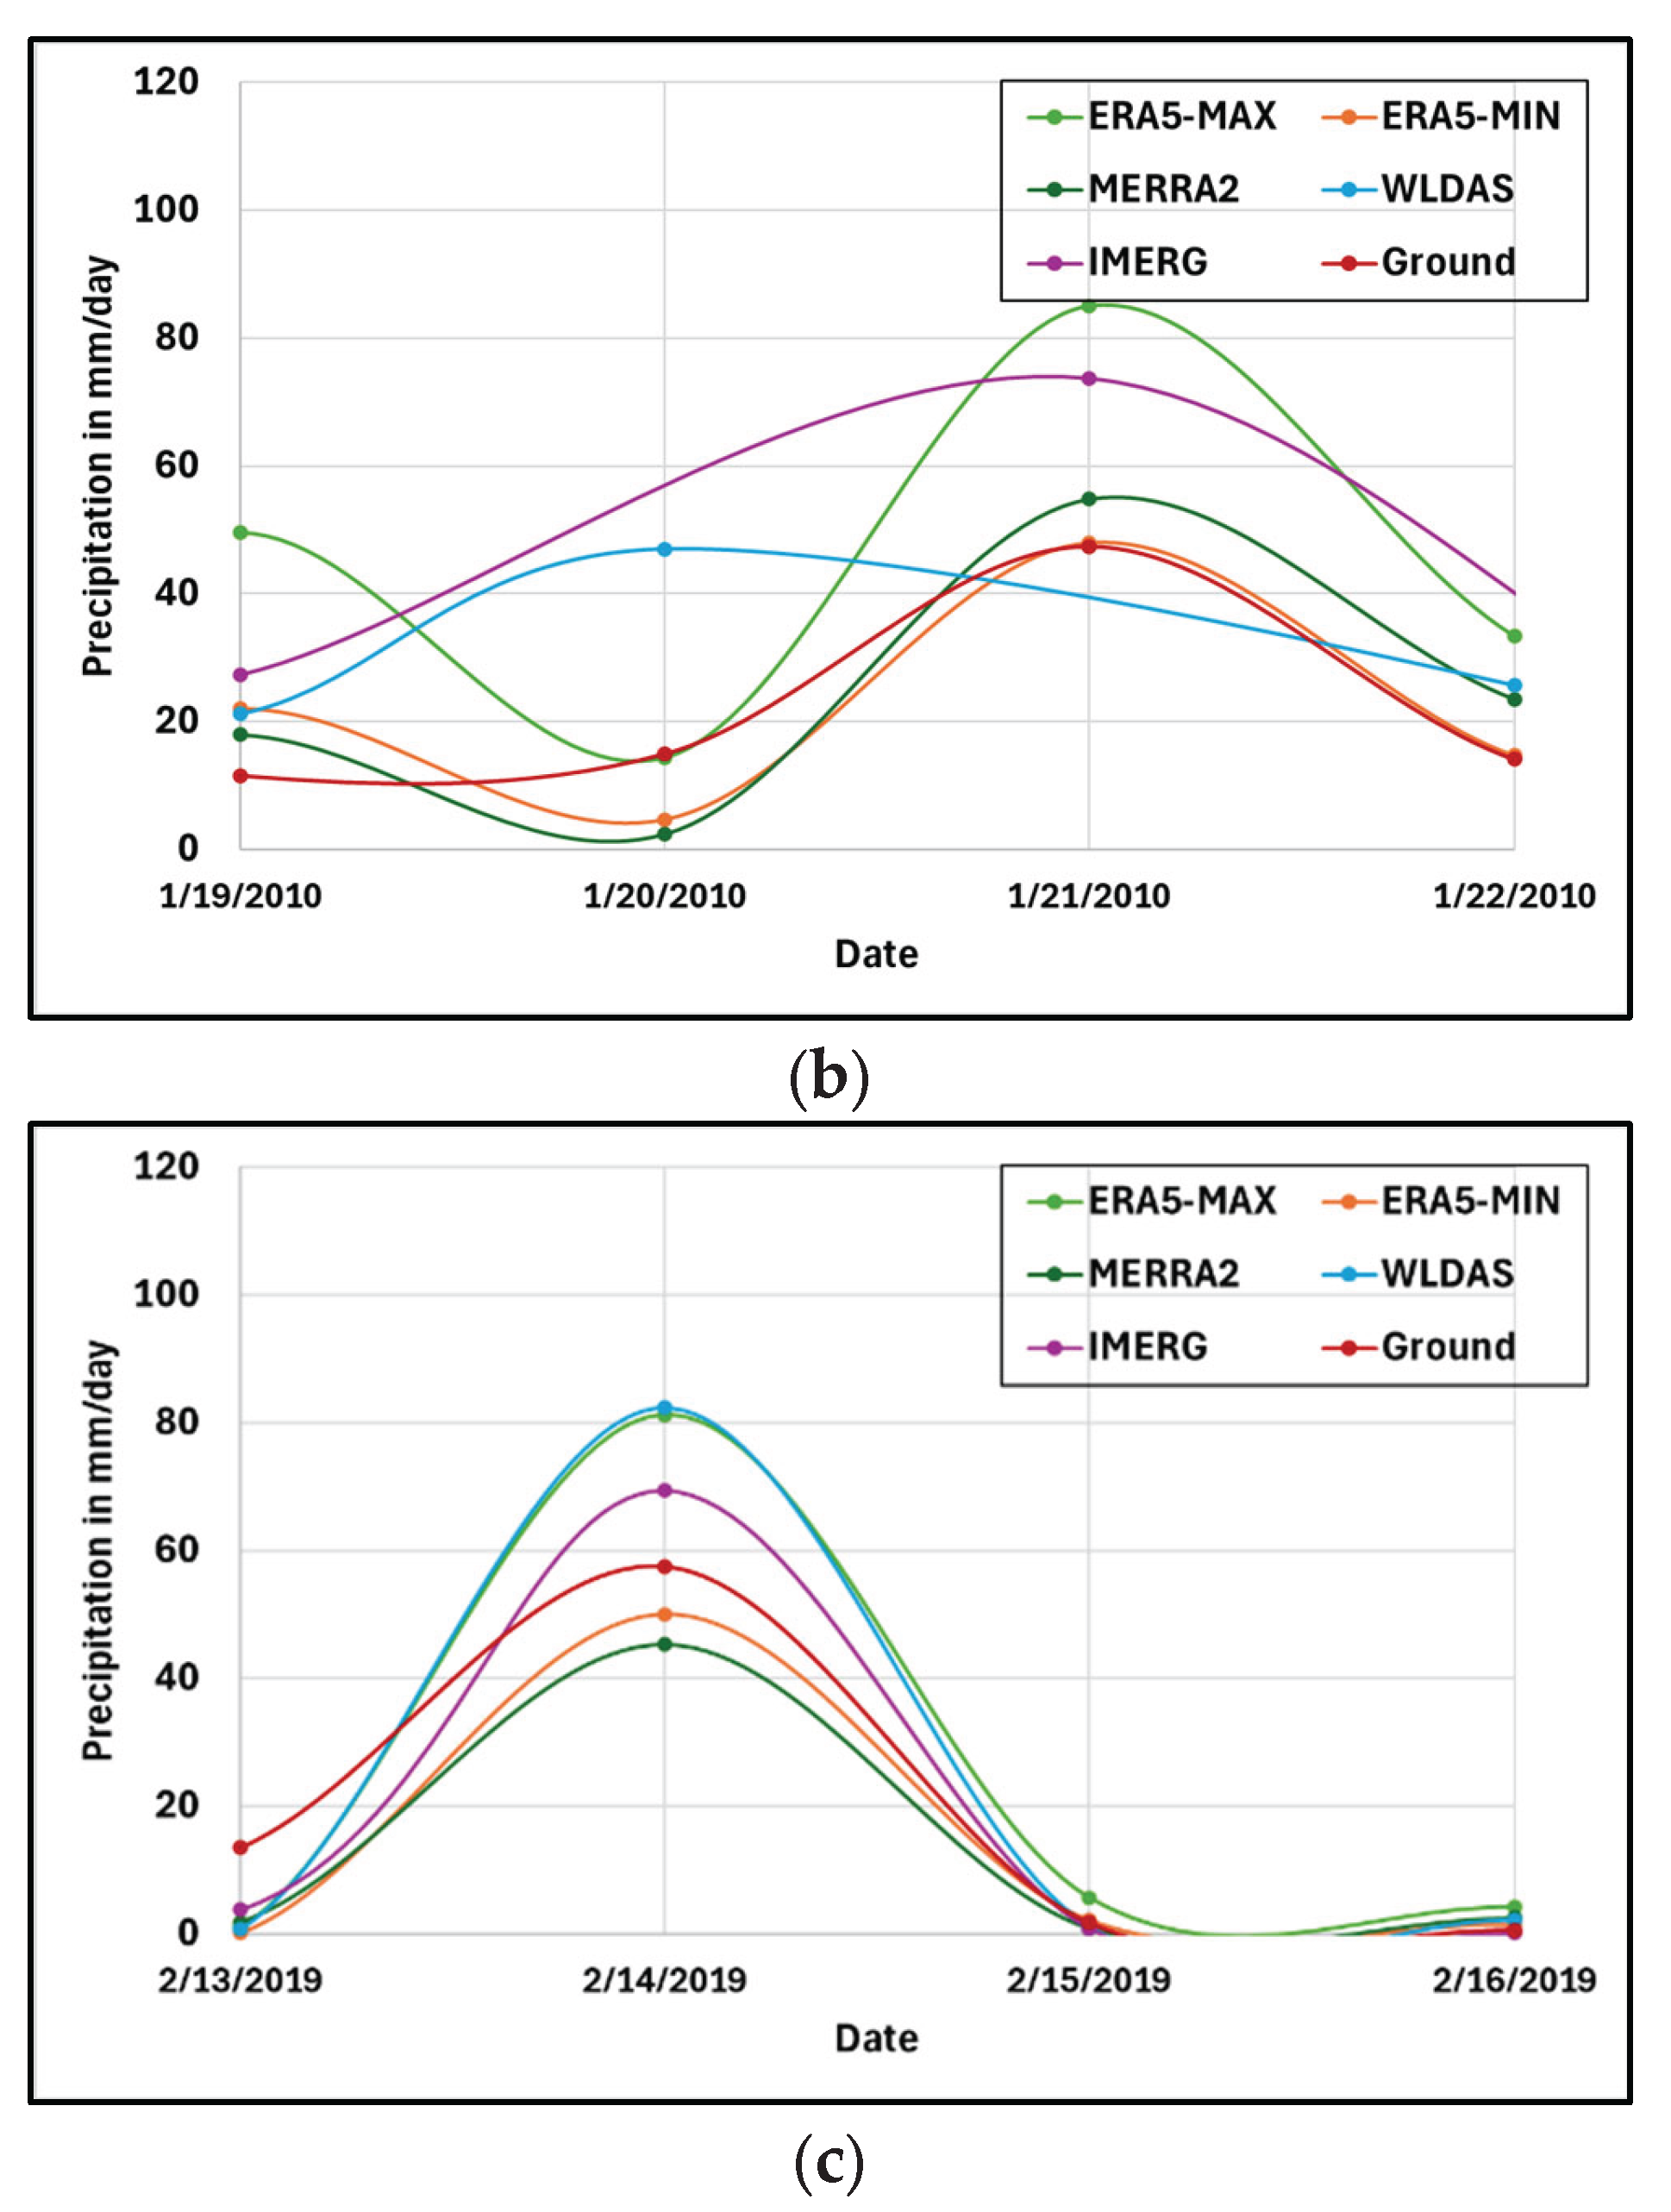
Figure 5.
Scatter plots of the estimated datasets and the reference dataset over the 20-year period, on a logarithmic scale.
Figure 5.
Scatter plots of the estimated datasets and the reference dataset over the 20-year period, on a logarithmic scale.
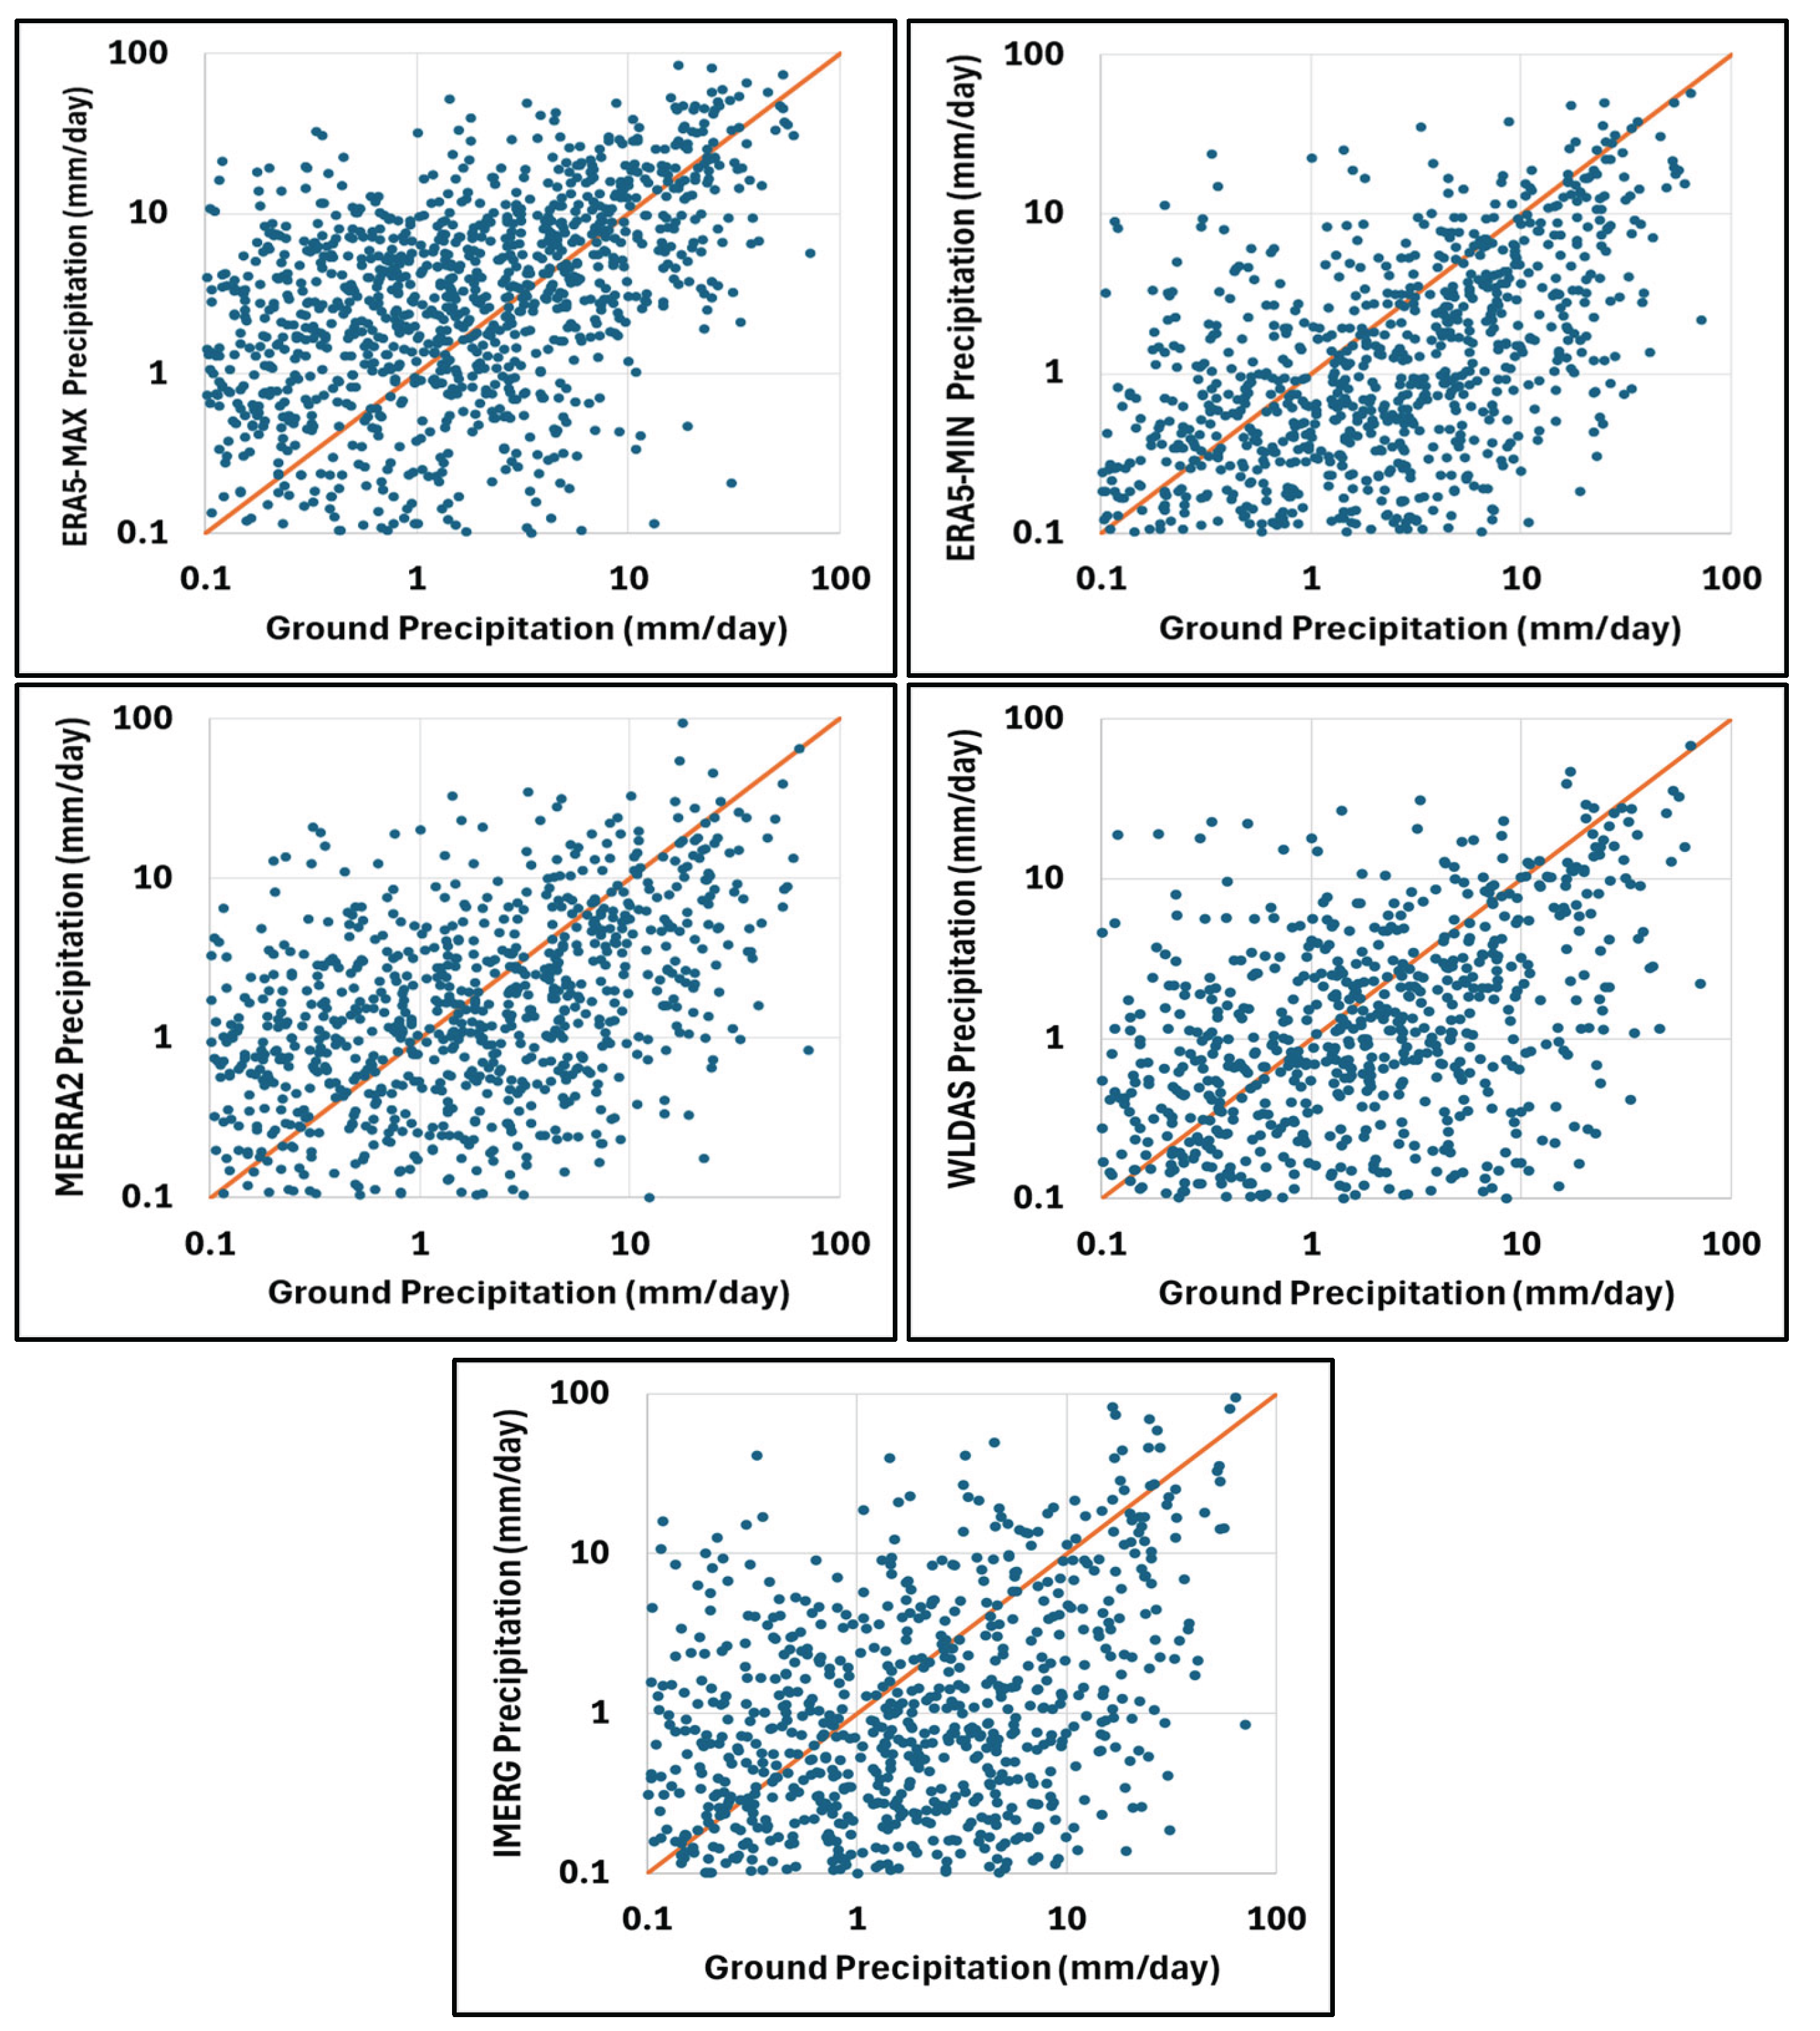
Figure 6.
Cumulative distribution functions (CDFs) of the estimate product datasets and the reference dataset.
Figure 6.
Cumulative distribution functions (CDFs) of the estimate product datasets and the reference dataset.
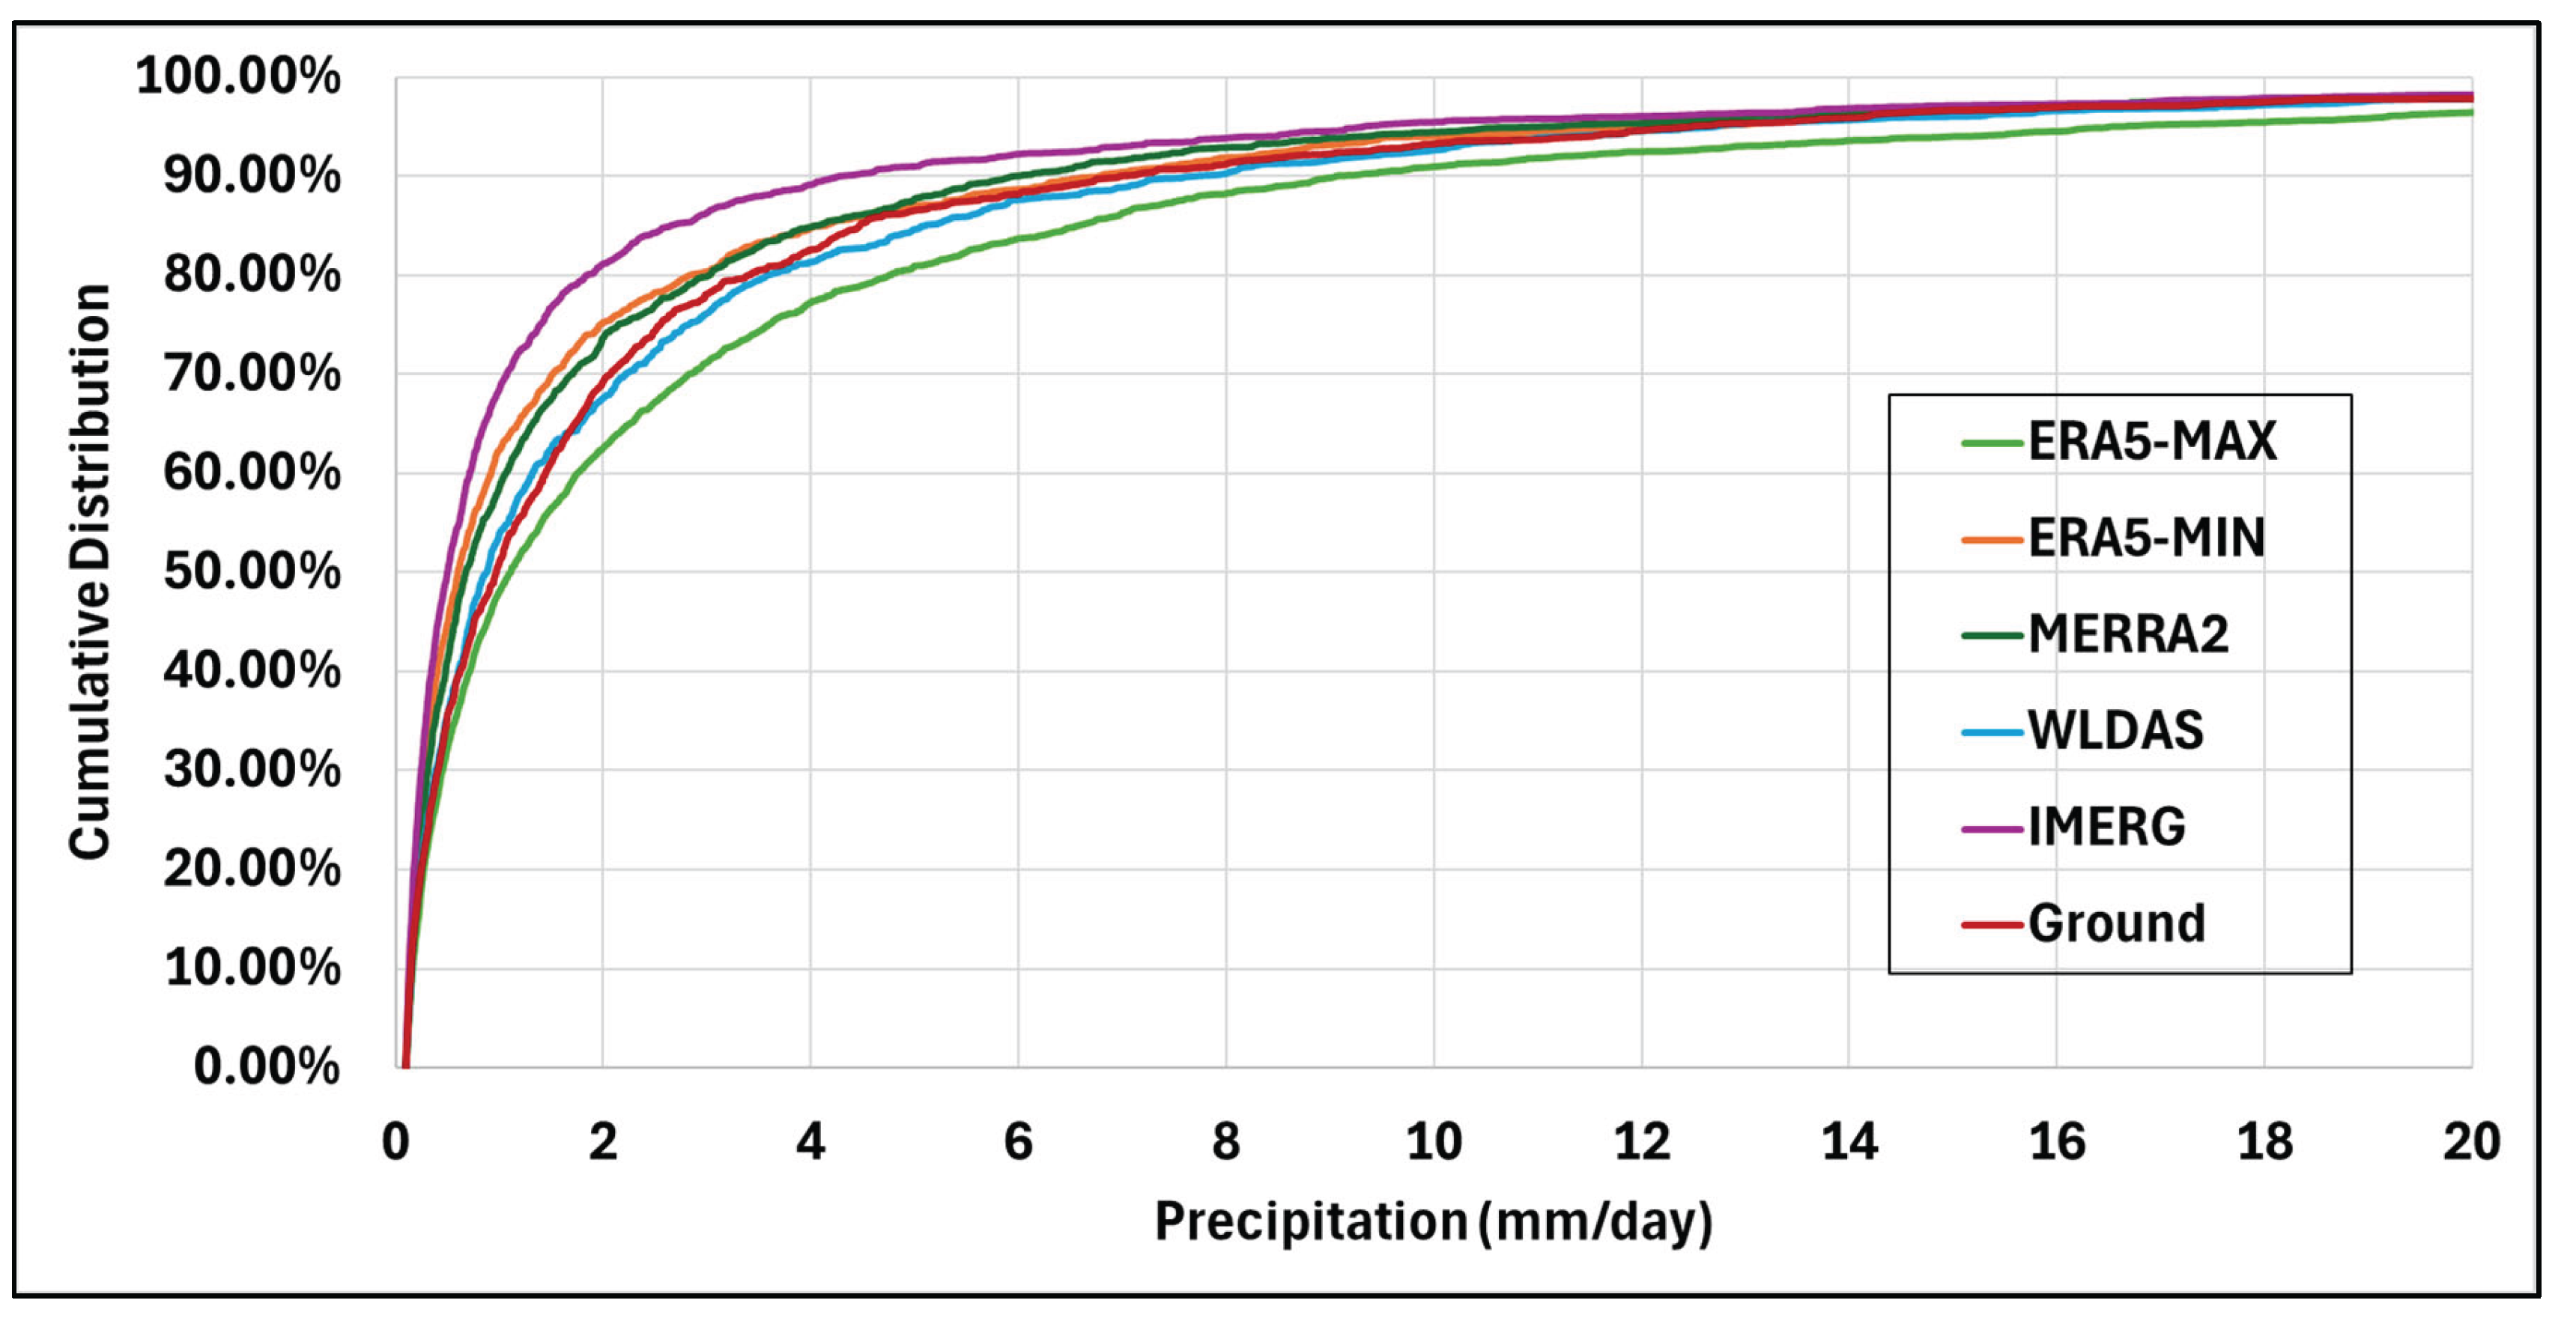
Figure 7.
Percentages of wet days per year, defined as days during which more than 0.1mm of precipitation was observed.
Figure 7.
Percentages of wet days per year, defined as days during which more than 0.1mm of precipitation was observed.
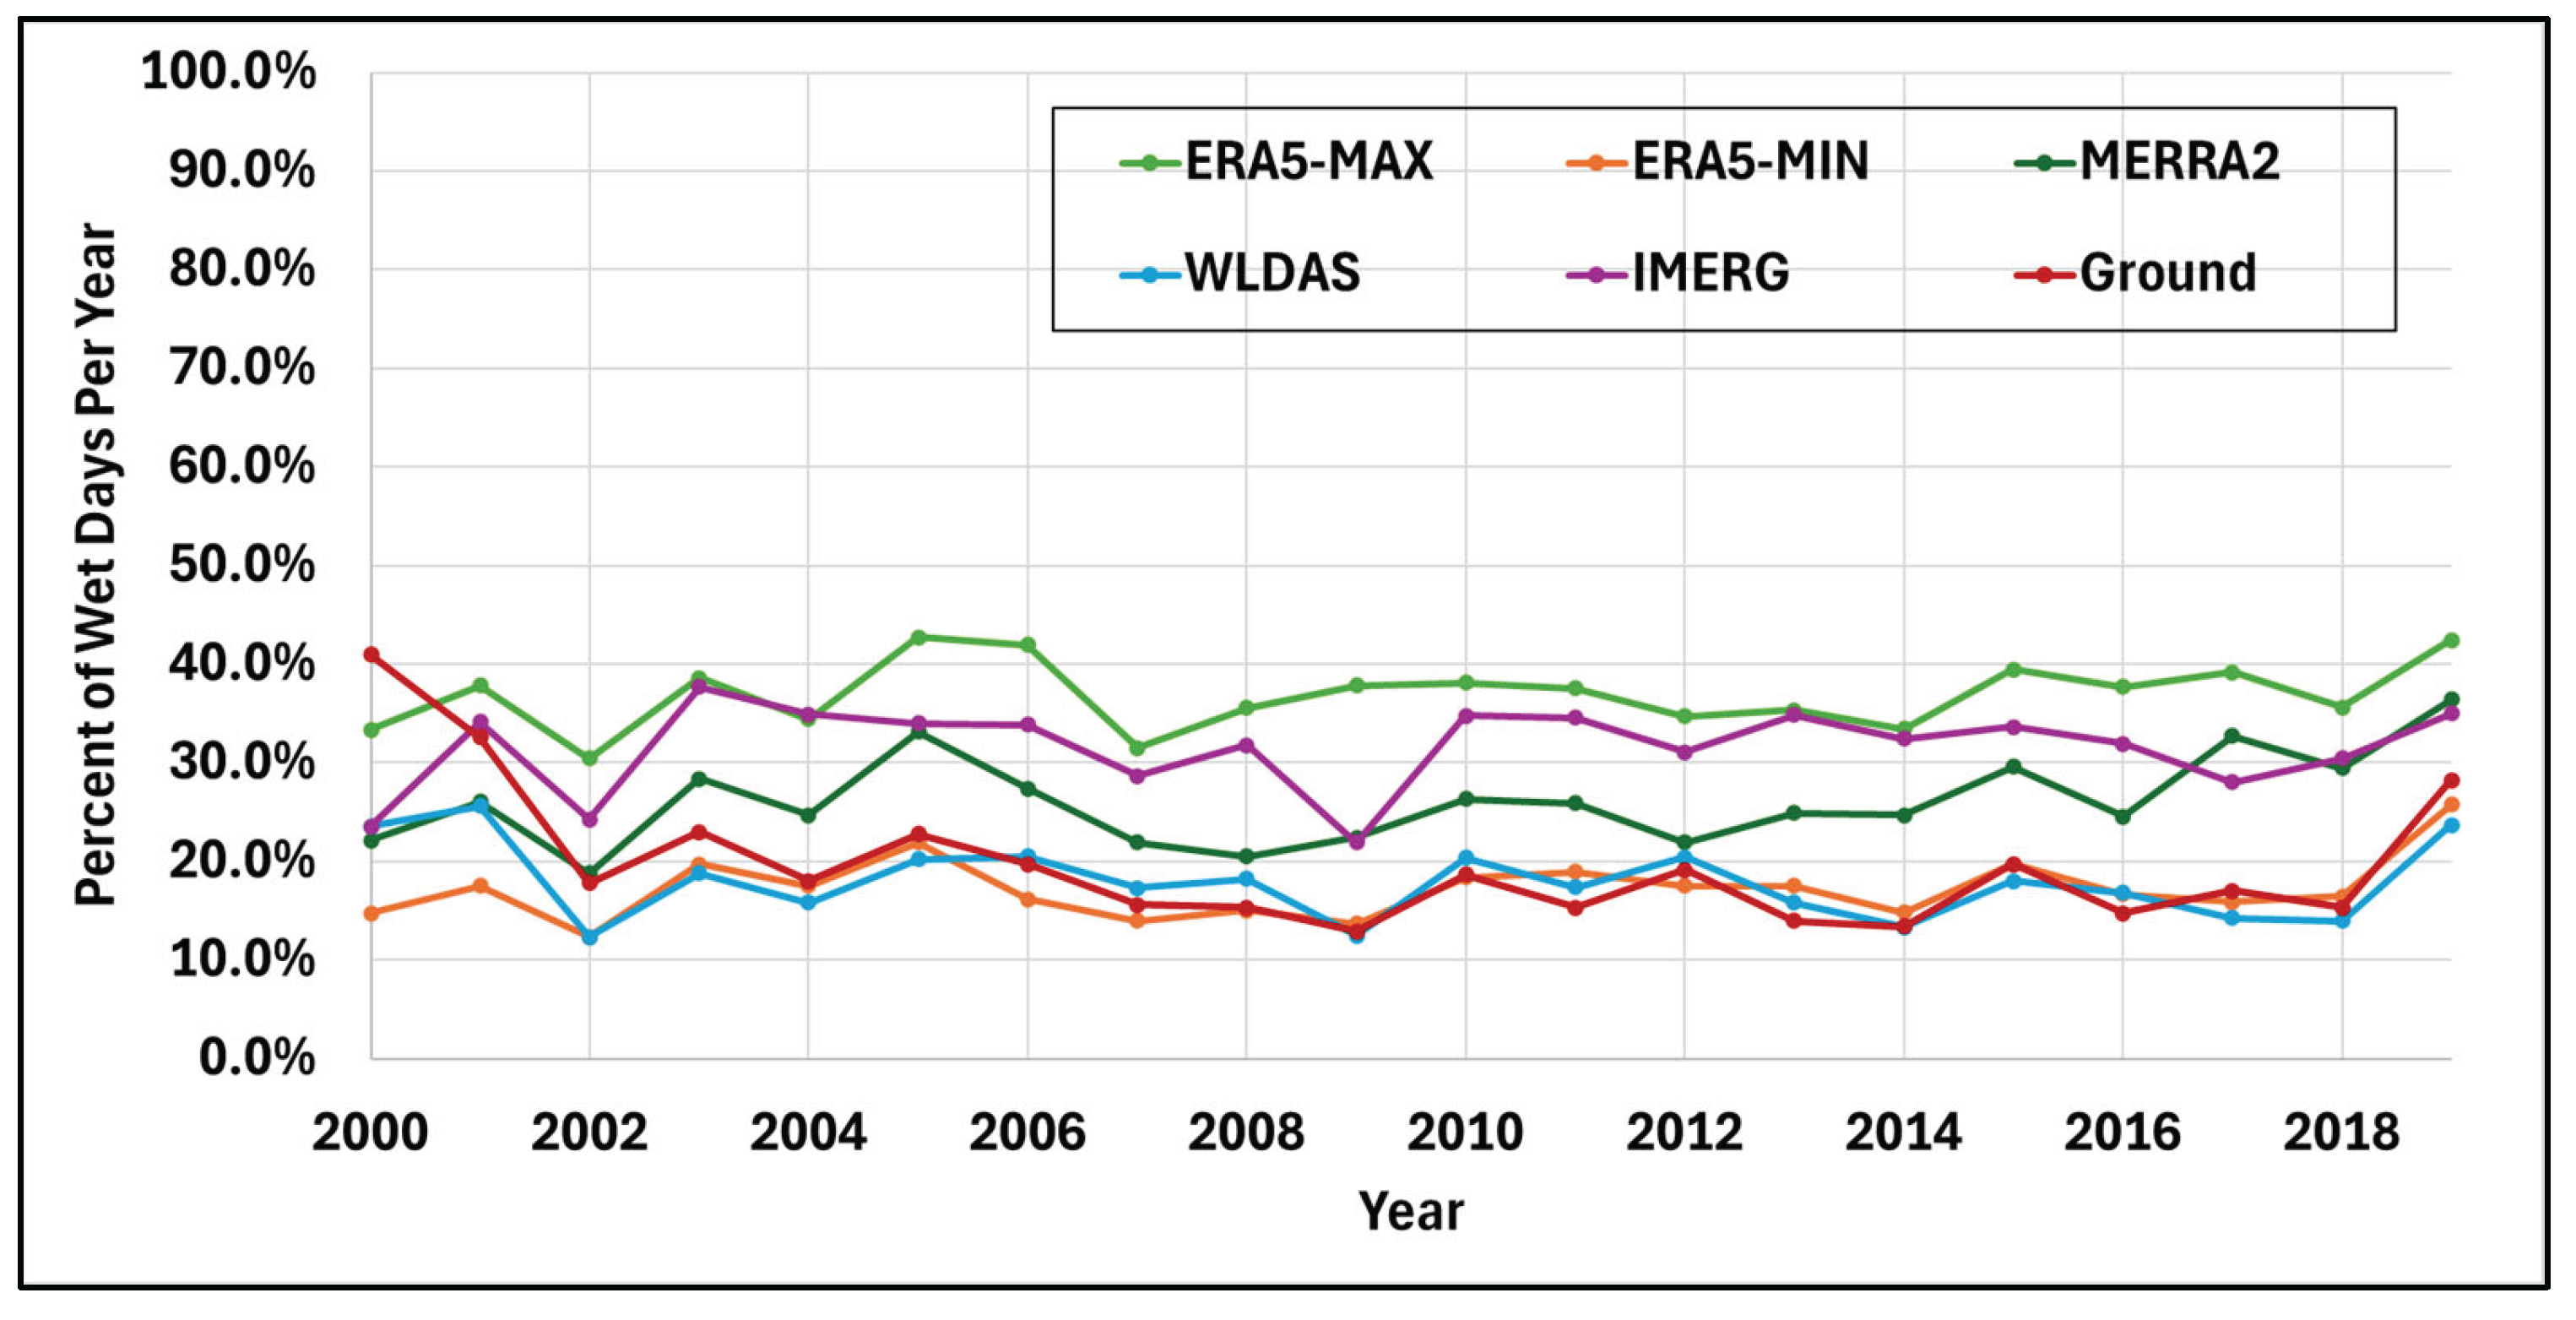
Figure 8.
(a) Bias ratio (unitless) and (b) mean error (mm/day) of all precipitation products with respect to the ground measurements for rates higher than the 75th, 90th, and 95th percentiles.
Figure 8.
(a) Bias ratio (unitless) and (b) mean error (mm/day) of all precipitation products with respect to the ground measurements for rates higher than the 75th, 90th, and 95th percentiles.
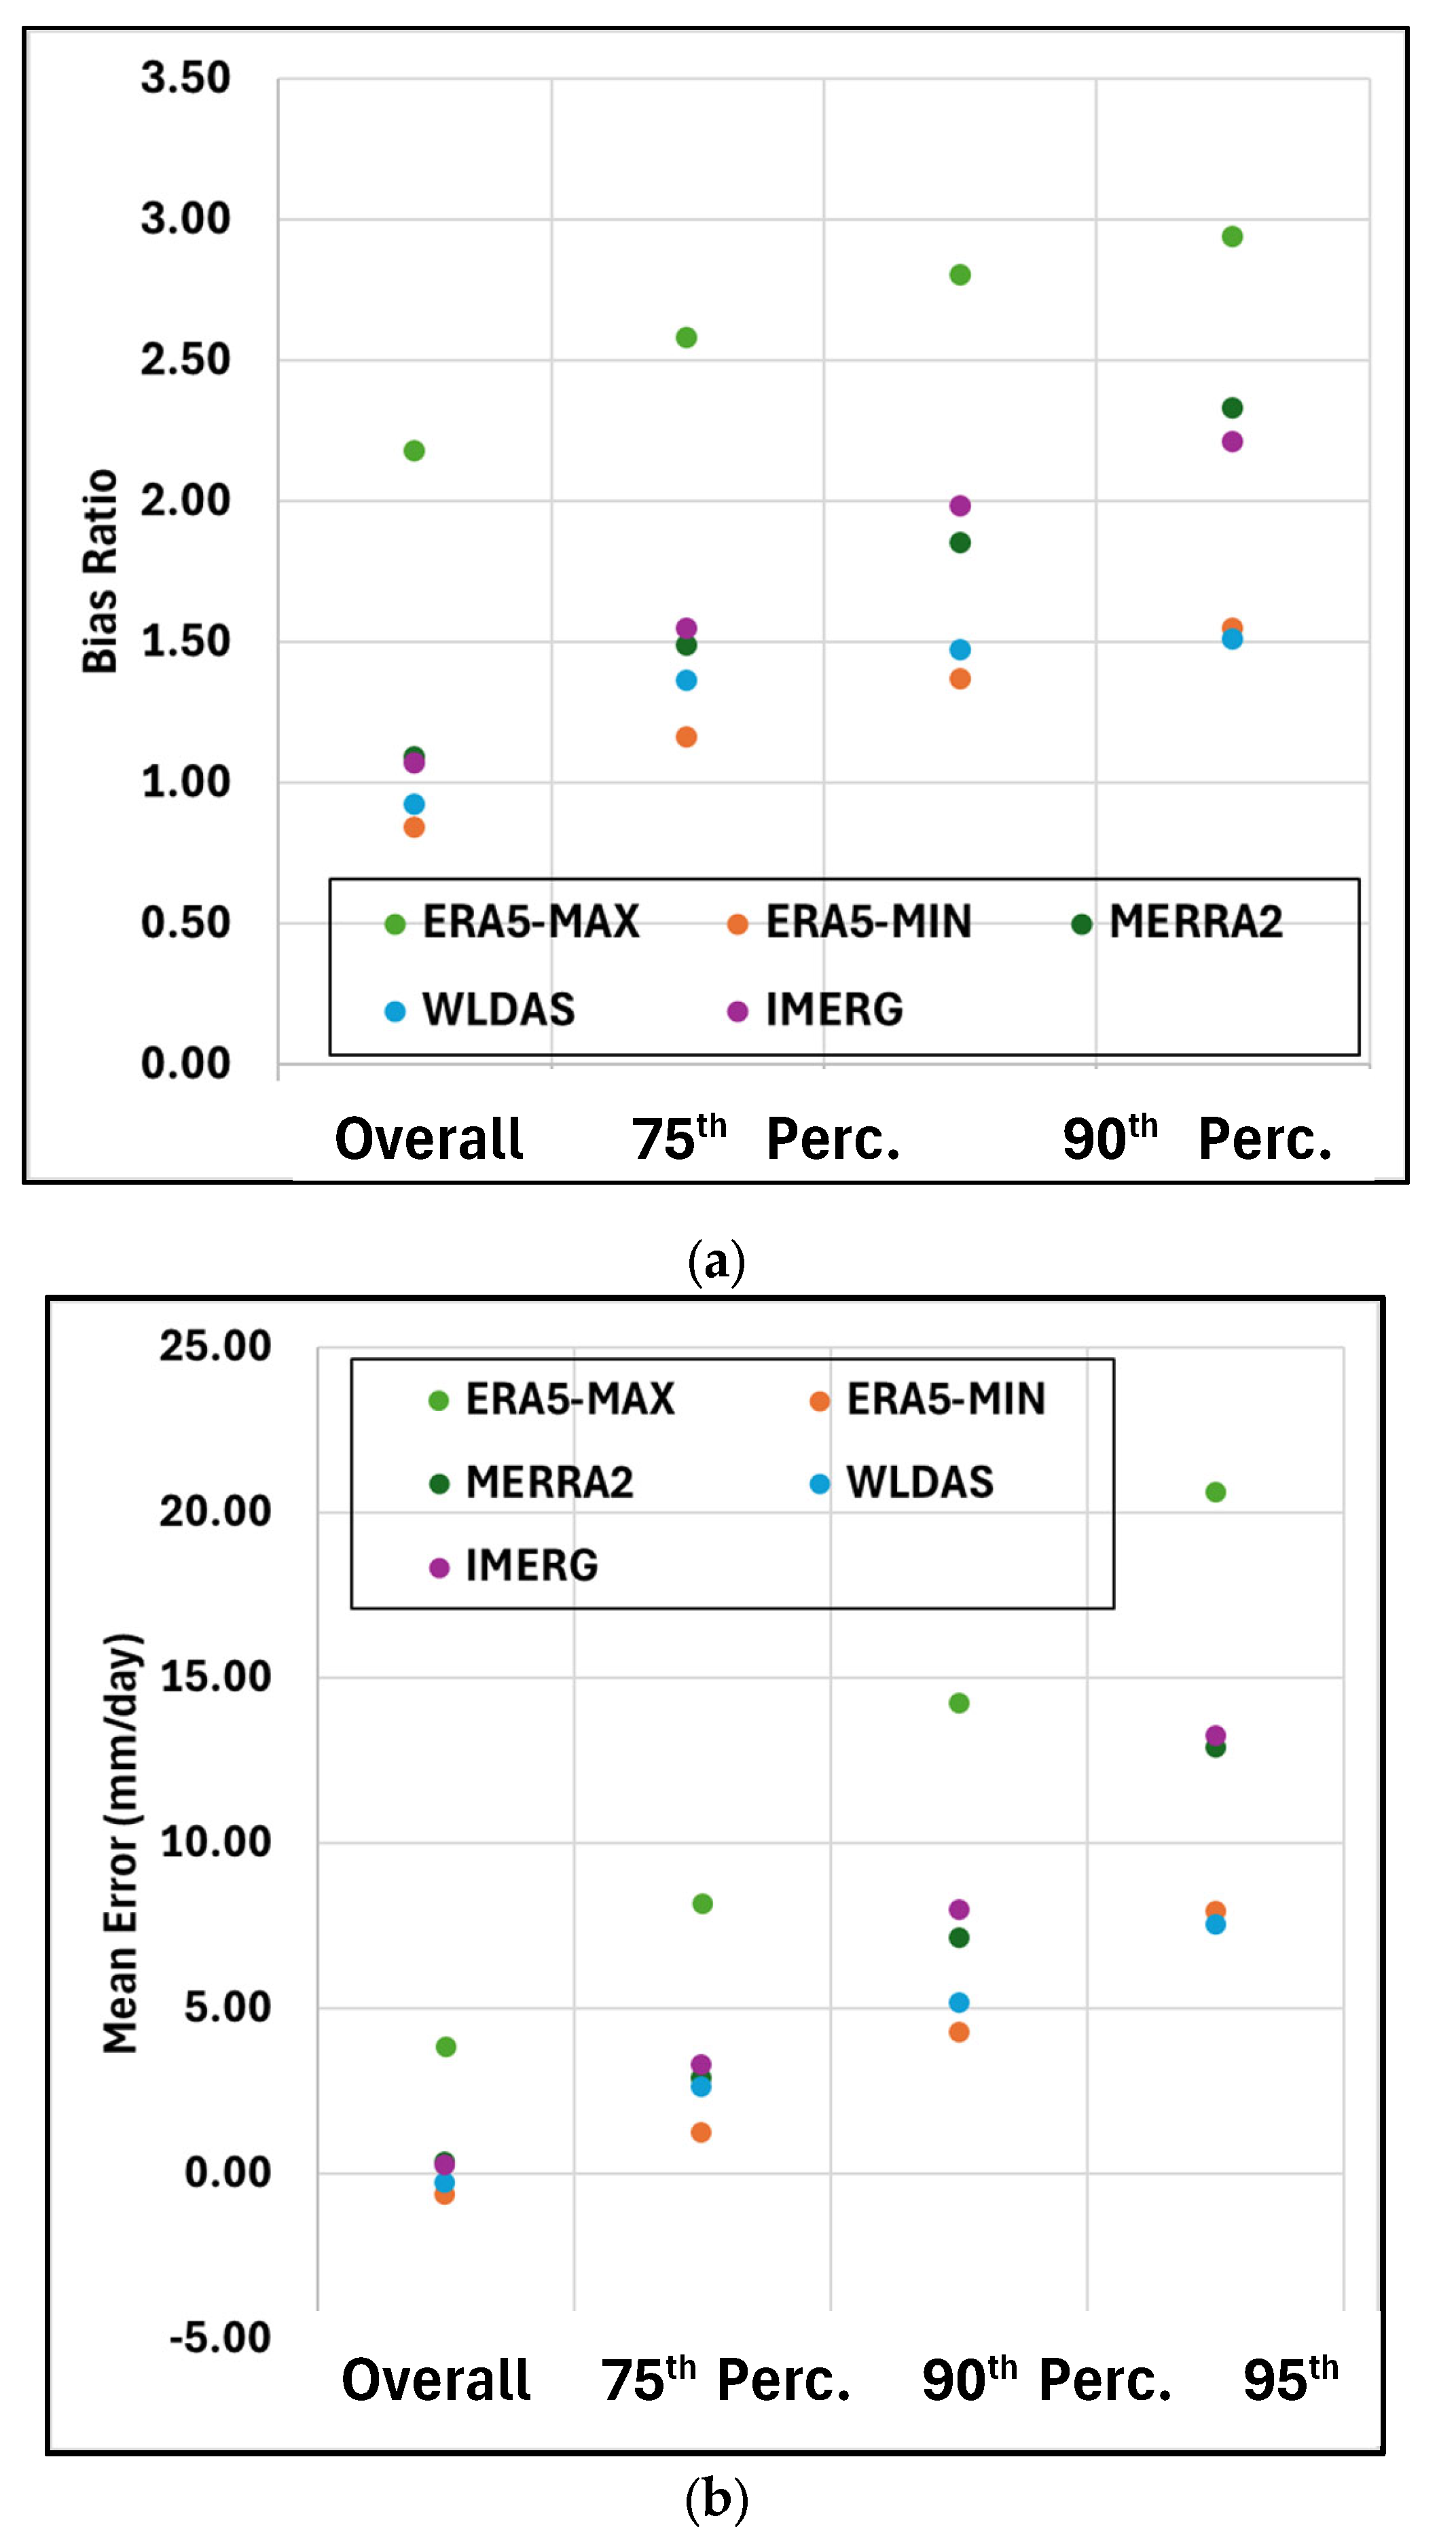
Figure 9.
Correlation Coefficient (unitless) for all products with respect to the reference dataset for precipitation rates higher than the 75th, 90th, and 95th percentiles.
Figure 9.
Correlation Coefficient (unitless) for all products with respect to the reference dataset for precipitation rates higher than the 75th, 90th, and 95th percentiles.
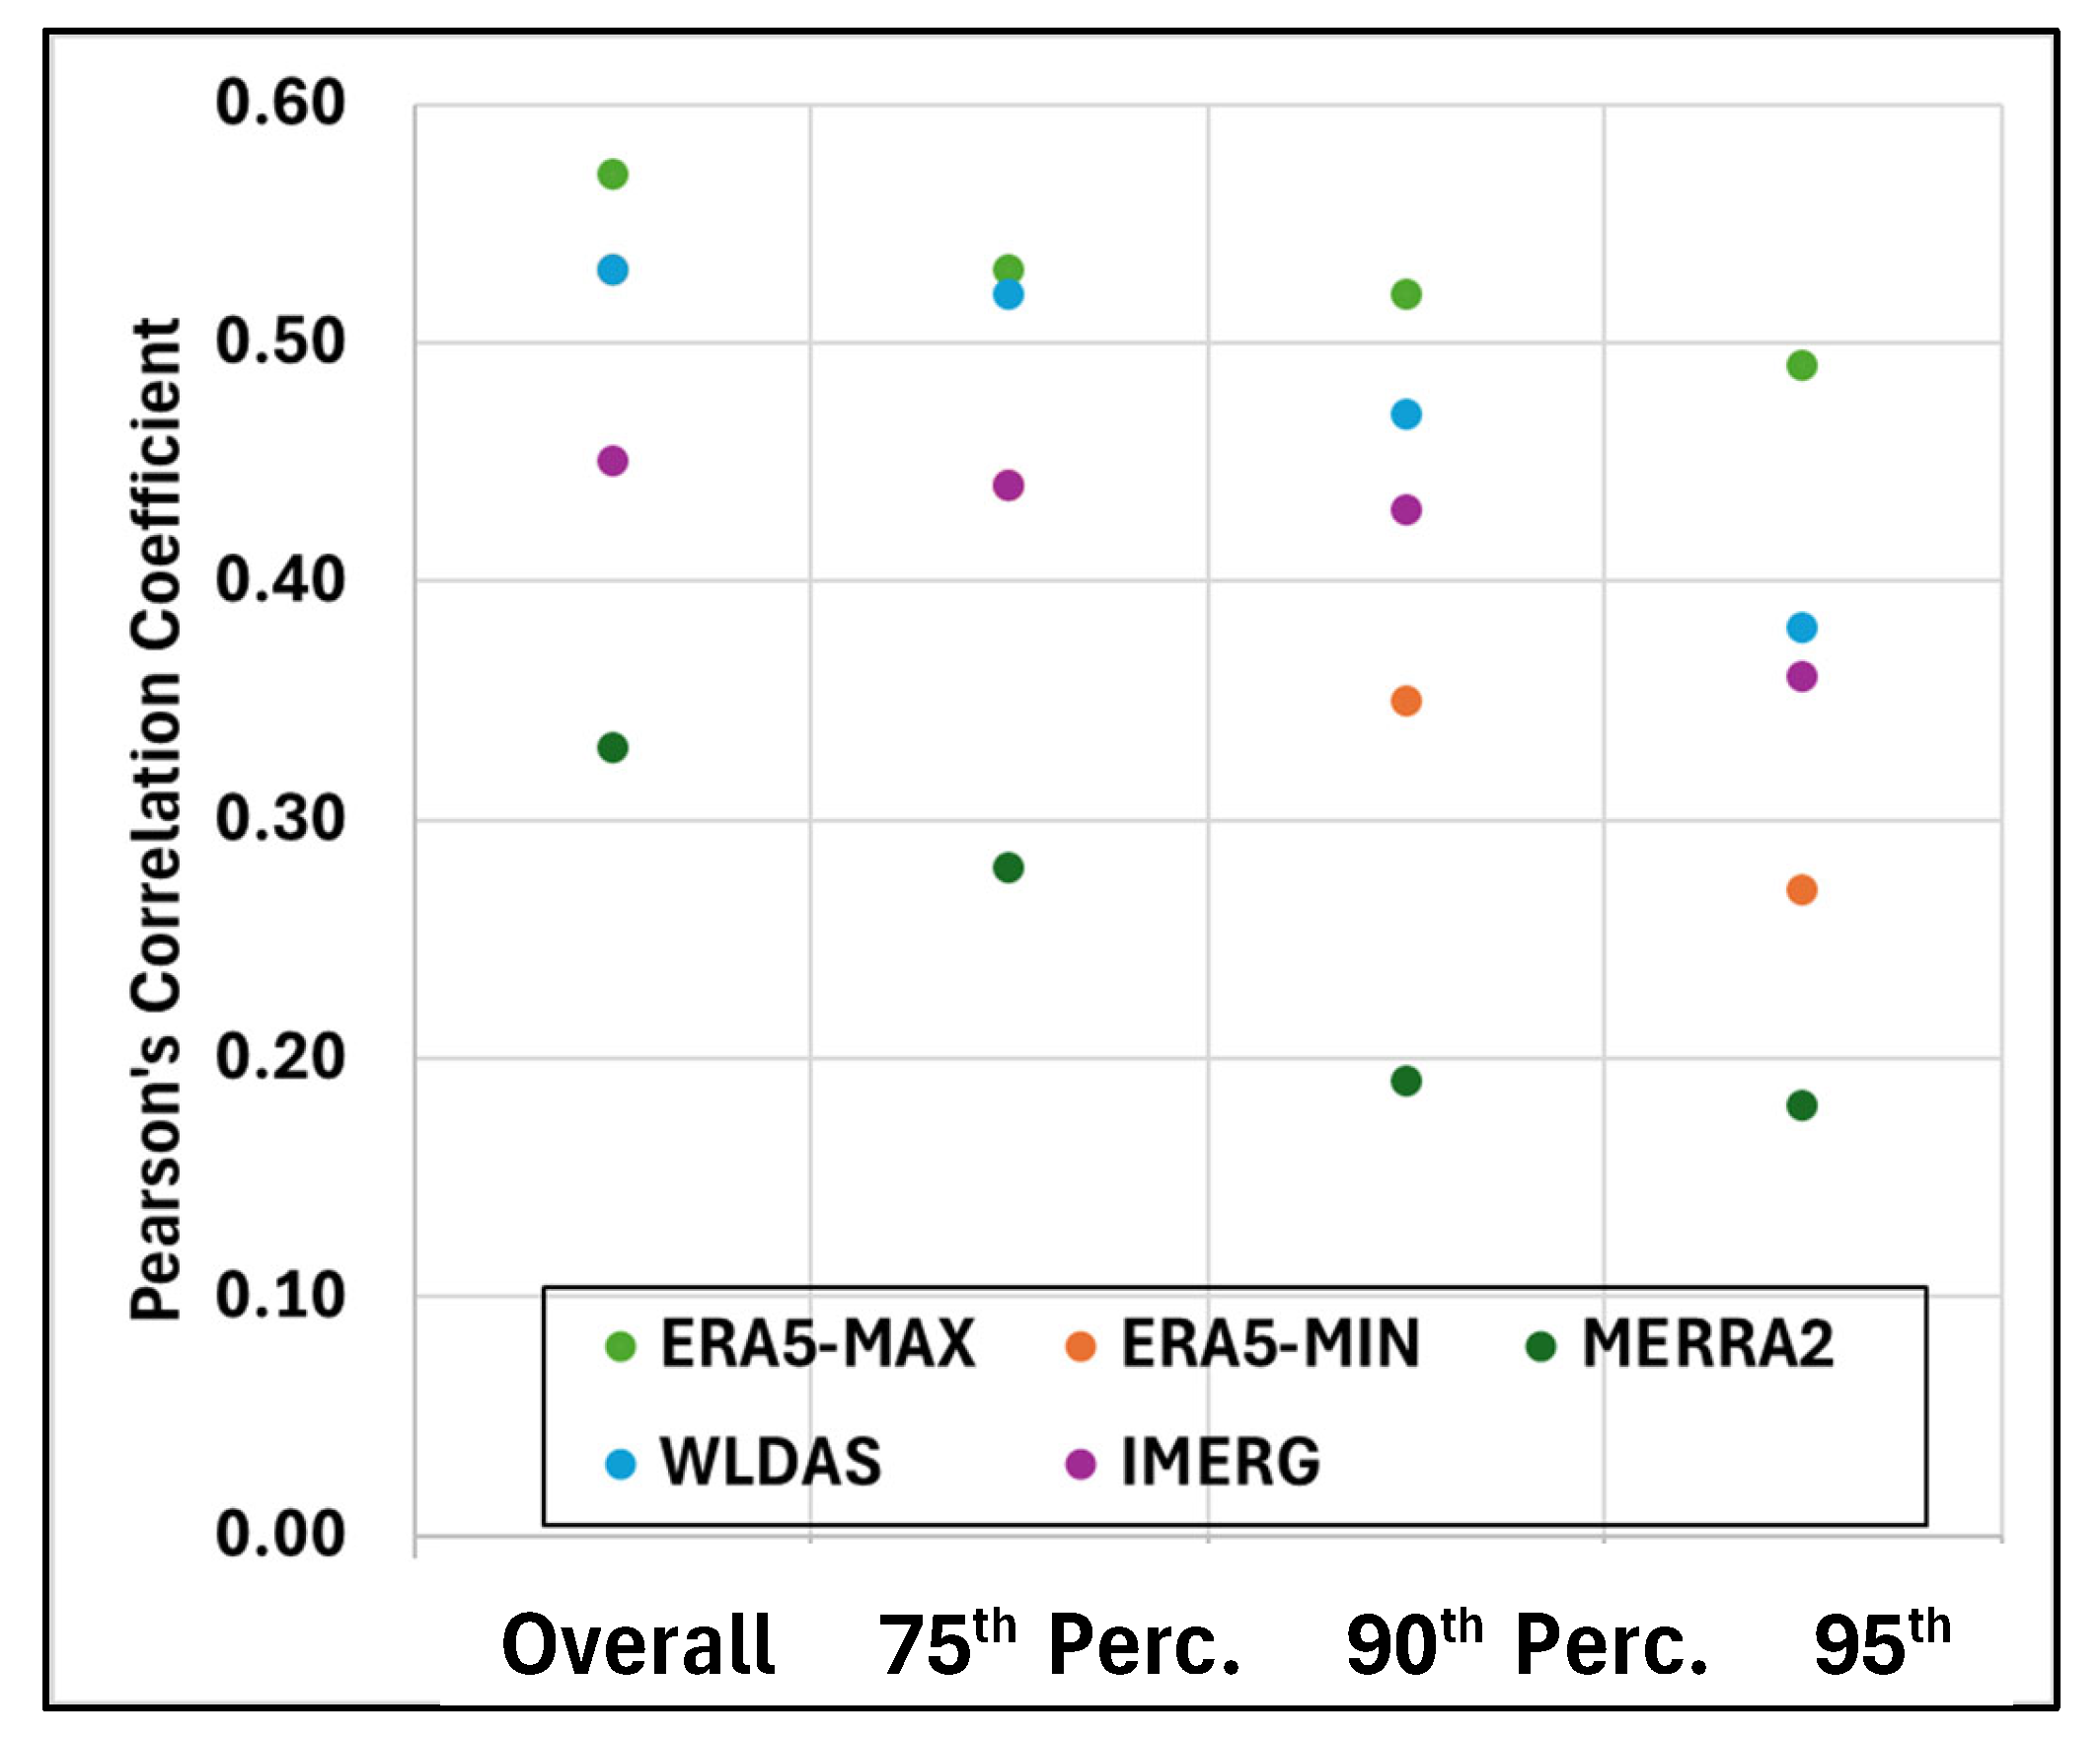
Figure 10.
(a) Probability of Detection (POD) as a function of precipitation threshold of all products, and (b) False Alarm Ratio (FAR) as a function of reference precipitation threshold.
Figure 10.
(a) Probability of Detection (POD) as a function of precipitation threshold of all products, and (b) False Alarm Ratio (FAR) as a function of reference precipitation threshold.
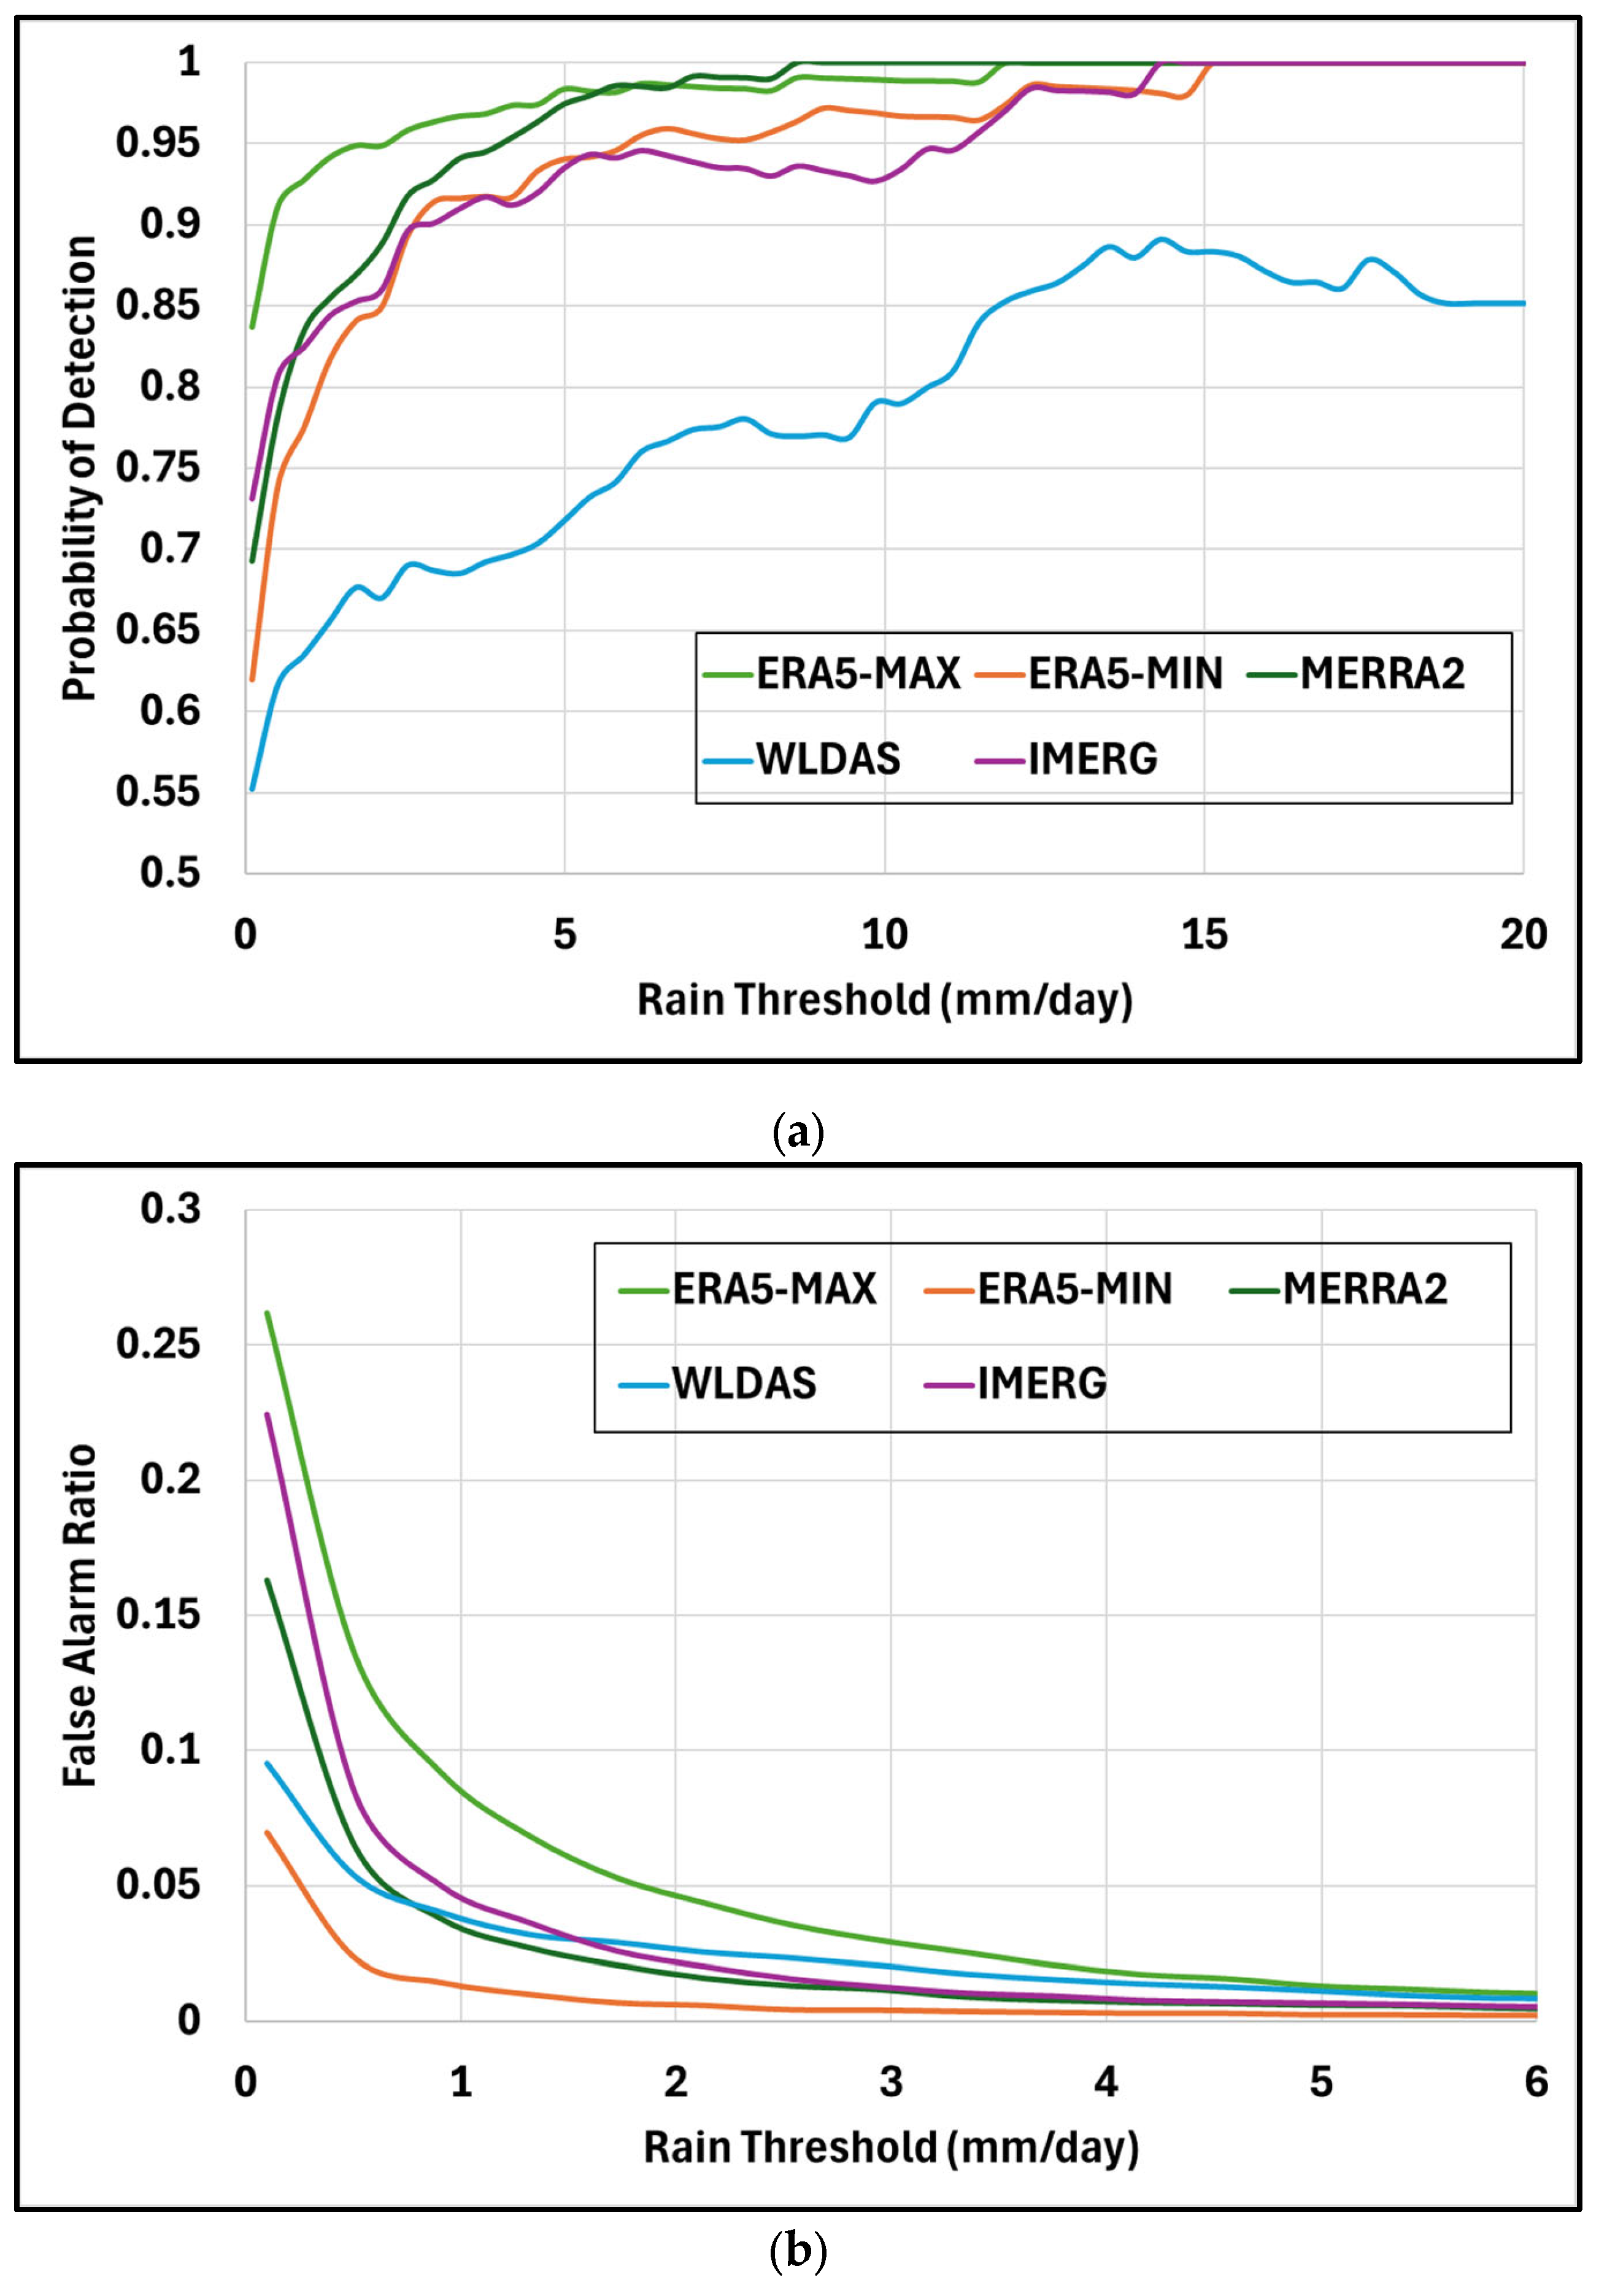
Figure 11.
(a) Missed precipitation as a function of reference precipitation for each product, and (b) falsely detected precipitation as a function of reference precipitation for each product.
Figure 11.
(a) Missed precipitation as a function of reference precipitation for each product, and (b) falsely detected precipitation as a function of reference precipitation for each product.
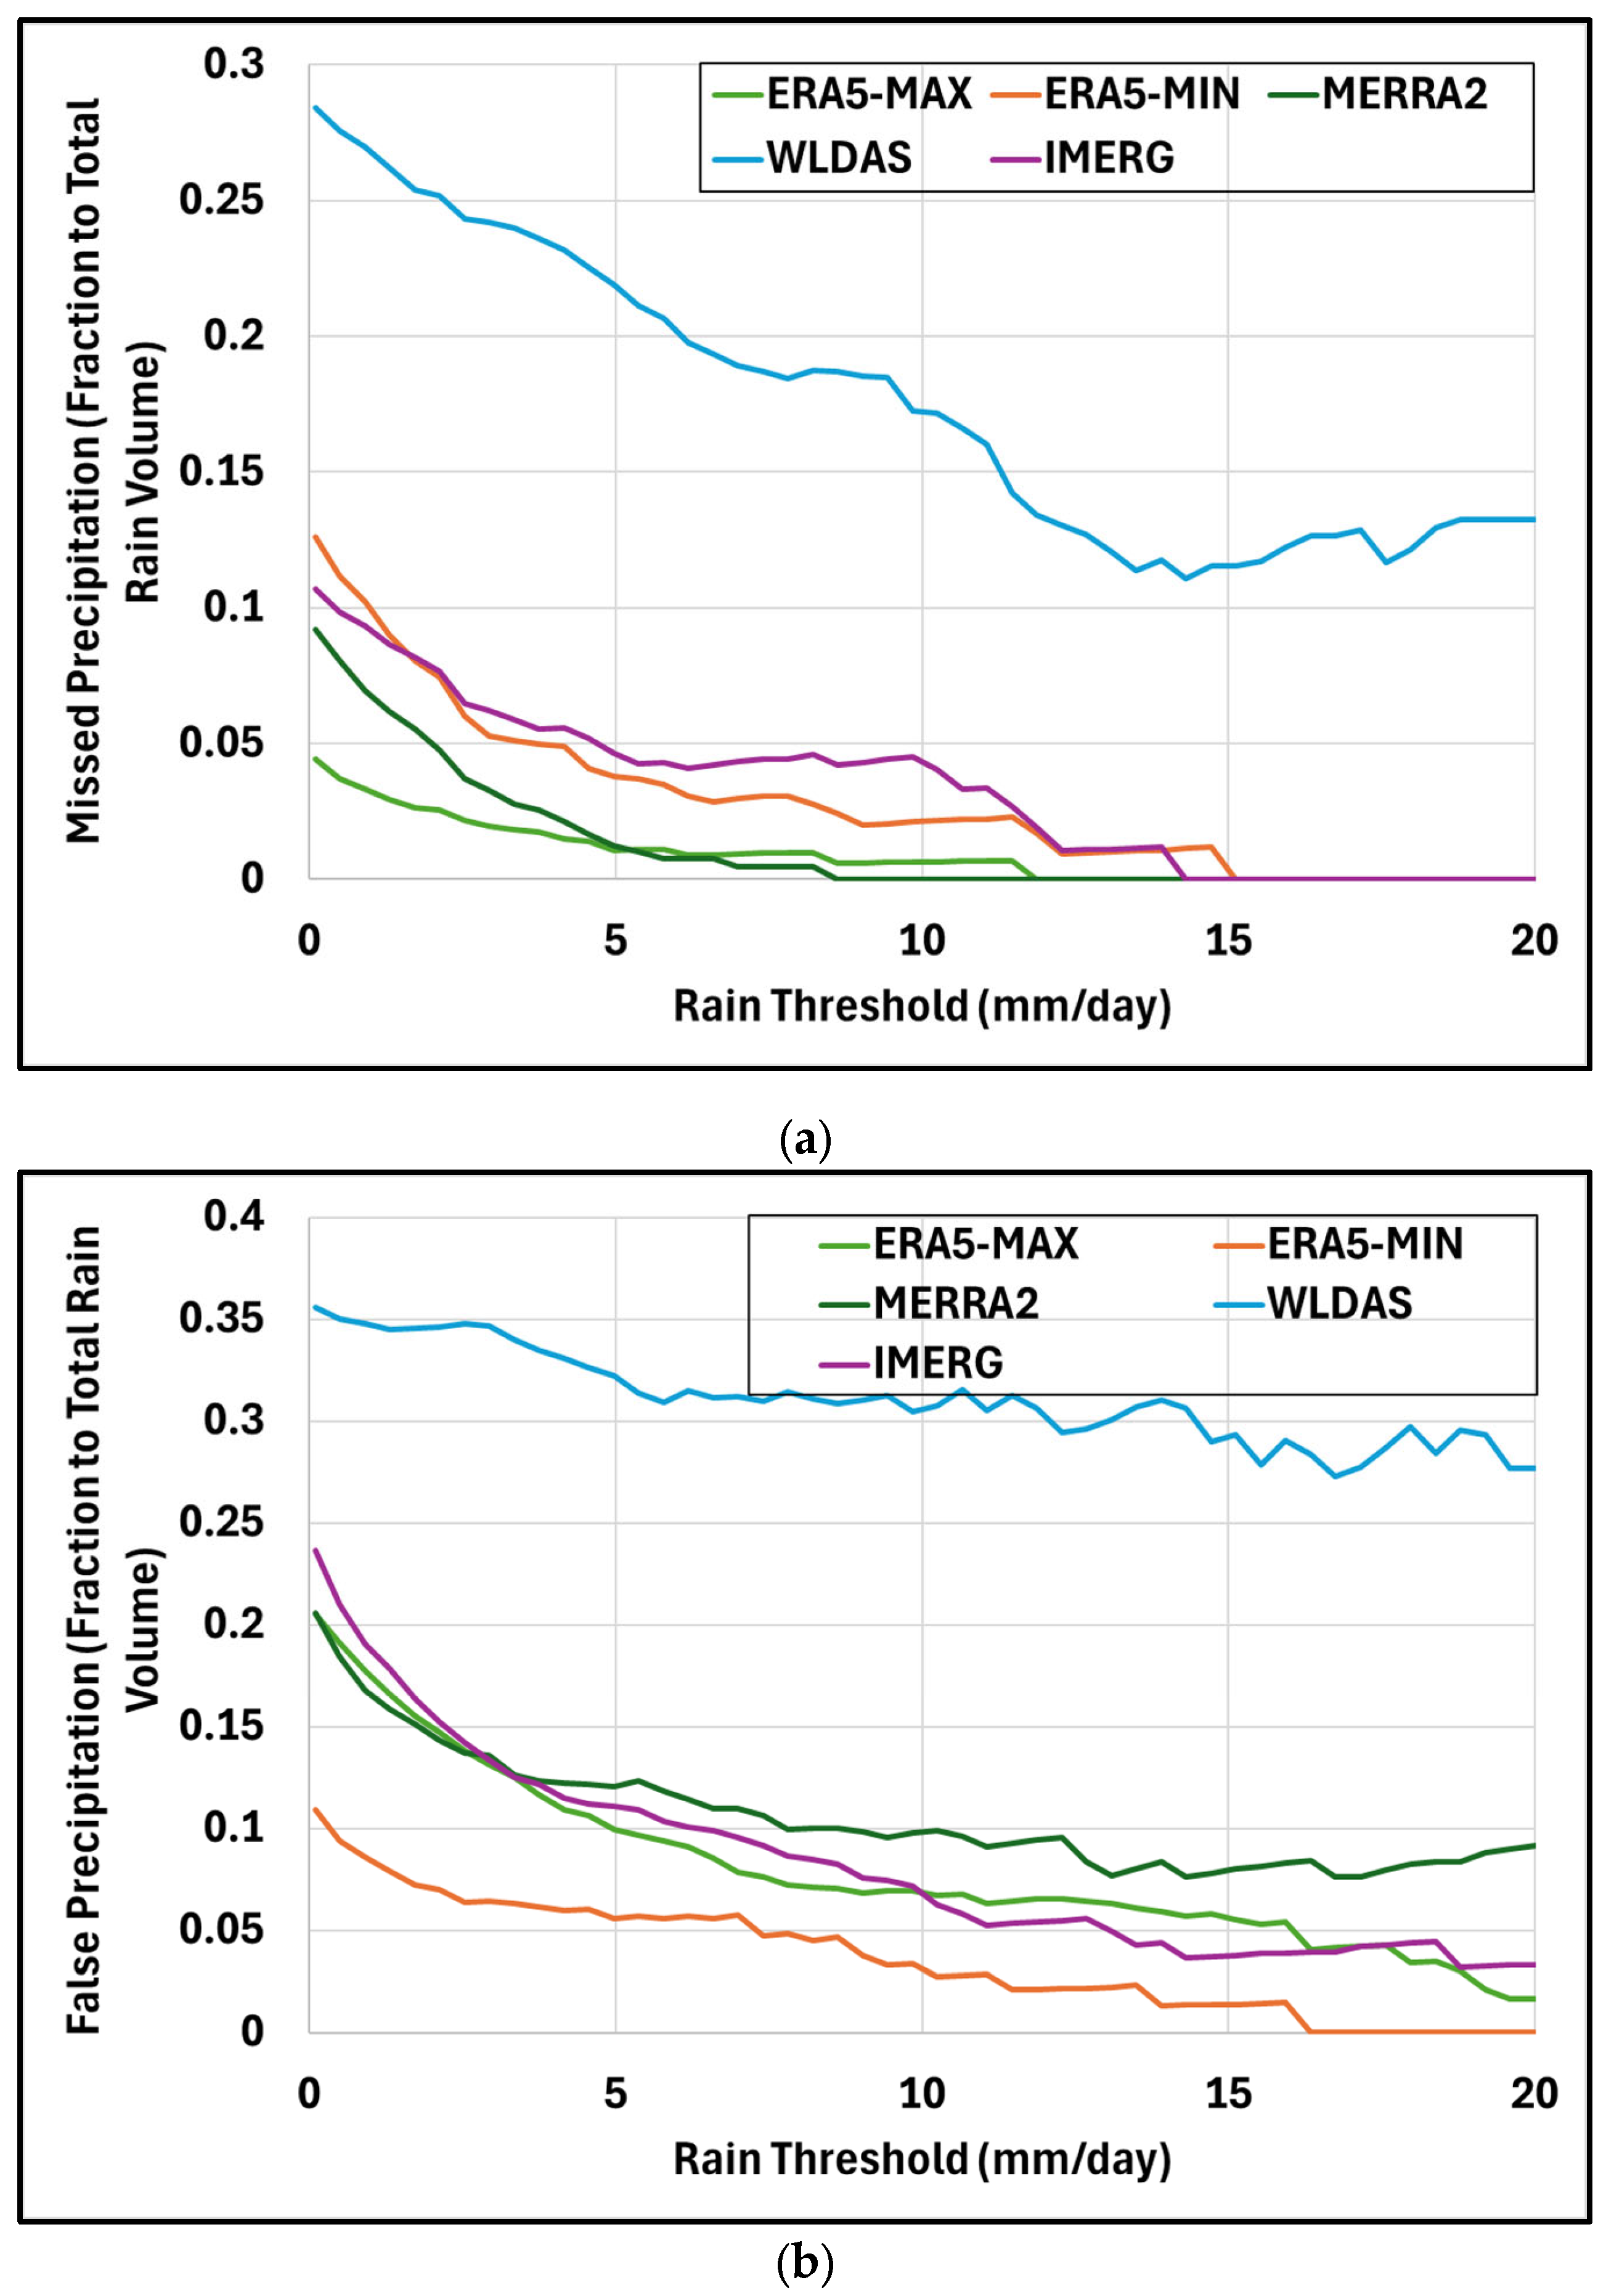
Table 1.
Key features of each dataset, including spatial and temporal resolutions, and precipitation units.
Table 1.
Key features of each dataset, including spatial and temporal resolutions, and precipitation units.
| ERA5 | MERRA2 | WLDAS | IMERG | |
|---|---|---|---|---|
| Spatial Resolution | 0.28° × 0.56° | 0.5° × 0.625° | 0.01° × 0.01° | 0.1° × 0.1° |
| Number of Pixels within the Study Area | 20 | 4 | 12,522 | 125 |
| Temporal Resolution |
Hourly | Hourly | Daily | Daily |
| Units | kg/m2s | kg/m2s | kg/m2s | mm/day |
Table 2.
Contingency table for calculating the probability of detection.
| RSat > 0.1 | RSat ≤ 0.1 | |
|---|---|---|
| RRef > th | HPOD | MPOD |
| RRef ≤ th | FPOD | ZPOD |
Table 3.
Contingency table for calculating the false alarm rate.
| RSat > th | RSat ≤ th | |
|---|---|---|
| RRef > 0.1 | HFAR | MFAR |
| RRef ≤ 0.1 | FFAR | ZFAR |
Table 4.
10th, 50th, 75th, 90th, 95th, and 99th percentiles for each precipitation product (precipitation rates greater than 0.1 mm/day).
Table 4.
10th, 50th, 75th, 90th, 95th, and 99th percentiles for each precipitation product (precipitation rates greater than 0.1 mm/day).
| Percentile | ERA5-MAX | ERA5-MIN | MERRA2 | WLDAS | IMERG | Ground |
| 10th | 0.16 | 0.14 | 0.15 | 0.15 | 0.13 | 0.15 |
| 50th | 1.11 | 0.62 | 0.68 | 0.87 | 0.50 | 0.98 |
| 75th | 3.60 | 2.04 | 2.14 | 2.80 | 1.39 | 2.55 |
| 90th | 9.06 | 6.81 | 5.96 | 7.61 | 4.27 | 7.17 |
| 95th | 16.50 | 12.67 | 11.02 | 12.60 | 9.32 | 12.72 |
| 99th | 41.64 | 28.18 | 24.36 | 27.27 | 27.41 | 27.45 |
Disclaimer/Publisher’s Note: The statements, opinions and data contained in all publications are solely those of the individual author(s) and contributor(s) and not of MDPI and/or the editor(s). MDPI and/or the editor(s) disclaim responsibility for any injury to people or property resulting from any ideas, methods, instructions or products referred to in the content. |
© 2025 by the authors. Licensee MDPI, Basel, Switzerland. This article is an open access article distributed under the terms and conditions of the Creative Commons Attribution (CC BY) license (http://creativecommons.org/licenses/by/4.0/).
Copyright: This open access article is published under a Creative Commons CC BY 4.0 license, which permit the free download, distribution, and reuse, provided that the author and preprint are cited in any reuse.


