
Submitted:
11 November 2025
Posted:
13 November 2025
You are already at the latest version
Abstract
Background/objectives: Dietary diversity, a key indicator of diet quality and nutritional status, remains poorly documented in Kinshasa’s urban and rural area for children under five years of age. This study aimed to identify factors associated with dietary diversity among children aged 24–59 months. Methods: A community based cross-sectional survey was conducted in December 2024 among 348 children aged 24–59 months, selected through a three stages random sampling. Dietary diversity was assessed using Dietary Diversity Score (DDS), defined as consumption of at least five of the eight food groups in the previous 24 hours. Multivariate regression logistic analyses were performed to identify determinants of adequate dietary diversity. Results: Among the 348 children, 63.5% achieved adequate dietary diversity. Higher odds ratio were observed among children age 48-59 months (aOR = 1.87; 95% CI: 1.02–3.43), from Christian households (aOR = 2.50; 95% CI: 1.02–6.10), of high socioeconomic status (aOR = 1.88; 95% CI: 1.003–3.51), and living in rural areas (AOR = 1.65; 95% CI: 1.02–2.66). Conclusion: Improving dietary diversity requires integrated strategies combining early child-feeding interventions, socioeconomic support, and promotion of local food production, particularly in low-income urban and rural settings.
Keywords:
dietary diversity score
; children under 5 years of age
; socioecomique statut
; cross sectional survey
; Kinshasa DRC
1. Introduction
Dietary diversity is a key determinant of nutritional status, linear growth, and cognitive development in young children. A diverse diet provides macronutrients and, importantly, essential micronutrients such as iron, zinc, and vitamin A, which are critical for preventing stunting and supporting proper neurocognitive development [1,2]. In many parts of sub-Saharan Africa, a large proportion of children about 66% consume an insufficient variety of food groups, contributing to persistent chronic malnutrition and vulnerability to infections [3,4].
Although most of studies focus on the critical period of 6–23 months corresponding to the window of complementary feeding. the 24–59-month age group also deserves special attention. This group is overlooked in integrated health programs and receives less parental attention [5,6]. Nutritional deficits accumulated during early childhood can become entrenched during early childhood can persist and worsen during this period, exacerbating stunting and impairing cognitive development. At this age, children share family meals and their diets more accurately reflects household's food habits and overall socioeconomic conditions [7,8]. Several recent studies confirm that low dietary diversity remains associated with stunting and malnutrition up to 59 months of age, underscoring the need for targeted research on this population [9,10].
In sub-Saharan Africa, the proportion of children meeting the minimum dietary diversity remains low. Multi-country analyses indicate that, on average, fewer than one in five children achieve the minimum recommended dietary diversity according to the Food and Agriculture Organization (FAO) and the World Health Organization (WHO) standards [9]. Persistent disparities between urban and rural are influenced by maternal education, household food security, seasonal food availability, and economic access to animal-source foods, fruits, and vegetables [11,12].
In the Democratic Republic of Congo (DRC), the nutritional status of children under five is a public health concern DRC DHS, 2024. The Global Nutrition Report and UNICEF data show that more than 40% of children suffer from stunted growth, with substantial disparities across provinces and between rural and urban areas [13,14]. Despite increased theoretical access to food markets, children living in the peri-urban zones of Kinshasa remain exposed to monotonous diet dominated by starchy staples due to economic insecurity, limited nutrition education, and unstable purchasing power [15,16]. Recent local studies have shown that even in urban areas, dietary practices are suboptimal and micronutrient intake remains insufficient, exacerbating the risks of chronic malnutrition. However, data on the dietary diversity of children aged 24–59 months in Kinshasa, particularly in the rapidly expanding urban-rural areas such as the Mont Ngafula II health zone (HZ), remain scarce.
Documenting the prevalence of adequate dietary diversity, identifying the most commonly consumed food groups, and analyzing the associated factors are essential for guiding local nutrition and community education interventions. This study therefore aims to fill this knowledge gap and provide evidence to support planning of child nutrition programs in urban-rural areas of Kinshasa.
Thus, the main objective of this study is to estimate the prevalence of adequate dietary diversity and to identify the associated socio-demographic, economic, and nutritional factors among children aged 24–59 months in Kinshasa.
2. Materials and Methods
2.1. Study Design and Sampling
This is an analytical cross-sectional study based on a community survey conducted in the Mont Ngafula II Health Zone (HZ), an urban-rural area of Kinshasa. This study targeted households with children aged 24–59 months who had been residing in the area for at least the previous six months. Children younger than 24 months or older 59 months of age, those with serious medical conditions or physical malformations, and those who were not permanent residents of the study area were excluded.
A three-stage probability sampling strategy was employed. At the first stage, five health areas (HAs) (Kimbwala, Matadi-Kibala, Matokama, Mitendi, and Sans fil) were randomly selected from Mont Ngafula II sampling frame. In the second stage, within each HA, enumeration areas (EAs) were randomly selected proportional to the size. And the third stage, within each EA, targeted households were listed and systematically selected. Only one eligible child aged 24–59 months was selected to assess Dietary Diversity Score (DDS).
The sample was calculated using OpenEpi, considering the total population of children aged 24–59 months in the health zone (11,233), a 95% confidence level, a 5% precision margin, and the estimated proportion of children with adequate dietary diversity of 74.6% [17]. The minimum required sample size was 284. Accounting for a 10% nonresponse rate (29 participants) was added, a target sample size of 313 was set. Ultimately,348 children were included in the study.
2.2. Data Collection
Data were collected from November 25 to December 20, 2024, using structured questionnaires administered through the SurveyCTO collect v2.81 application. Interviewers were master's students who received five days of training on the study objectives, target population, interview techniques, and the use of SurveyCTO for questionnaire administration. They were supervised daily to ensure data quality. Prior to data collection, a pilot test was conducted in a health zone not included in the study to identify potential issues and refine the questionnaire.
Data collection techniques included face-to-face interviews using a pretested questionnaire developed in French and translated into Lingala (one of the national languages), along with direct observation. Data were collected daily until the required sample size was reached.
Children’s individual dietary diversity was assessed using a standard dietary diversity questionnaire comprising eight food groups appropriate for children aged 24–59 months [18]. These questionnaires also collected information on household and child sociodemographic characteristic, including the age and sex of the head of household, the age and sex of child, religion, marital status, household size, education level, occupation of the head of household, and socioeconomic status [19]. In addition, data were collected on household food insecurity using the Household Food Insecurity Access Scale (HFIAS) developed by the U.S. Agency for International Development [21], and on child development using the ECDI2030 tool (a UNICEF-validated instrument assessing early childhood development through 20 behavioral and cognitive items adapted to everyday contexts) [22].
2.3. Measurement of Variables
2.3.1. Dietary Diversity Score
Children's dietary diversity was assessed using a 24-hour recall covering eight food groups appropriate for children aged 24–59 months. The DDS collected reflects the previous day's meals. These food groups included: (1) cereals (grains, roots, and tubers), (2) vitamin A-rich vegetables (e.g., squash, sweet potatoes, or other orange-fleshed vegetables), (3) Other fruits and vegetables (e.g., onions, cucumbers, zucchini, okra, eggplant), (4) meat, poultry, or fish, (5) eggs, (6) legumes or nuts, (7) milk and dairy products, and (8) oils and fats. The DDS was calculated based on the number of food groups consumed by each child, ranging from 0 (no consumption) to 8 (consumption of all food groups). A DDS ≥ 5 was considered to indicate adequate dietary diversity, while a DDS < 5 reflects inadequate dietary diversity [18].
2.3.2. Others Variables
Anthropometric measurements (weight and height) were taken in following with WHO field protocols. Weight was measured using a digital electronic scale was used, accurate to 0.1 kg, with children barefoot and wearing light clothing. Height was measured in a standing position using a portable wooden stadiometer provided by UNICEF, with the assistance of two data collectors: one taking the measurement and the other ensuring the child was properly positioned to guarantee accuracy. These measurements were used to calculate height-for-age z-scores (HAZ) using WHO Anthro software. A z-score below -2 standard deviations indicated stunting, while values ≥ -2 standard deviations indicated the absence of these forms of malnutrition [20].
Parental education level was classified into two categories: low (no education, incomplete primary or secondary education) and secondary school or above (complete secondary education, higher education, or university education). Marital status was grouped into two categories: single (unmarried, separated, divorced, or widowed) and in married/in union (married or cohabiting).Household socioeconomic status (SES) was determined using an index derived from a principal component analysis (PCA) that incorporated ownership of household assets (radio, television, furniture, refrigerator, etc.), means of transportation (bicycle, motorcycle, car, canoe, etc.), housing characteristics and access to electricity. The items used measure socioeconomic status consistently (Cronbach's alpha of 0.77).
Household food security was assessed using the Household Food Insecurity Access Scale (HFIAS), which includes nine items addressing food access constraints related to availability quantity, and quality during the 30 days preceding the survey. Households reporting no or rare concerns were classified food secure, while others were categorized as food insecure [21].
The early childhood development was assessed using the ECDI2030, a UNICEF-validated tool comprising 20 behavioral and cognitive items adapted to everyday situations. The threshold score for being "on track" varied by age group: 7 (24–29 months), 9 (30–35 months), 11 (36–41 months), and 15 (48–59 months. A child was considered to be on track for development if they achieve or exceed the minimum score required for their age group. The proportions of children on track in the areas of health, learning, and psychosocial well-being are calculated by comparing the number of children who have reached the threshold score to the total number of children assessed [23,24].
2.4. Statistical Analysis
Data were extracted and analyzed using Stata 18 SE (Stata Corp LLC, college Station, TX, USA). Analyses were conducted with a 95% confidence level and a significance threshold of 5%, considering p-value < 0.05 statistically significant. Descriptive statistics were used to characterize children, mothers, and households, as well as to estimate the proportion of children with adequate dietary diversity. Bivariate association between dietary diversity and explanatory variable were examined using the Chi-square test or, when appropriate, Fischer's exact test. Variables with a p-value ≤ 0.20 in bivariate analyze were retained for multivariate modeling.
A binary logistic regression model with robust standard errors [vce(robust)] was used to identify factors associated with adequate dietary diversity. Predicted marginal probabilities and interactions were estimated using margins command and visualized with marginsplot to illustrate adjusted probabilities. Multicollinearity was assessed using the uncentered variance inflation factor (VIF); the mean VIF of 2.37 indicated no significant collinearity. The overall model fit was assessed using the Hosmer-Lemeshow goodness -of -fit test, and model specification was verified with the link test. Model performance was evaluated using sensitivity, specificity, positive and negative predictive values, and the overall percentage of correct classification. Adjusted odds ratios (aOR) with 95% confidence intervals (95% CIs) were calculated to quantify the effect of each explanatory variable on the likelihood of achieving adequate dietary diversity. All statistical test were two-tailed, and significance was set at p < 0.05.
2.5. Ethical Considerations
The study was conducted in accordance with the guidelines of the Declaration of Helsinki. Confidentiality was ensured by anonymizing all identifying variables in the dataset. Informed consent was obtained from all participants prior to data collection. Participants were informed of their right to decline or withdraw from the study at any time, and no biological samples were collected or analyzed. The findings will be used solely for purposes, and no conflicts of interest were declared. Ethical Approval for this study was granted by the Ethical Approval Committee of the Kinshasa School of Public Health, University of Kinshasa (Approval NO ESP/CE/101B/2024).
3. Results
3.1. Food Groups Consumed, Prevalence of Dietary Diversity and Sample Characteristics
A total of 348 children aged 24–59 months were included in the analysis. The most commonly consumed food groups were roots and tubers (76.7%), meat, poultry, and fish (74.7%), and foods rich in vitamin A (72.2%), whereas eggs (20%) and legumes and pod vegetables (42%) were the least consumed (Table 1).
Among children, 221 (63.51%) had adequate dietary diversity, and 127 (36.49) had inadequate dietary diversity. The gender of the children was almost evenly distributed, with 178 boys (51.15%) and 170 girls (48.85%). Higher levels of dietary diversity were observed among children aged between 48–59 months (71.12%), those whose parent were older than 30 years (68.20%), those from married or in a union (69.41%), those living in rural areas (69.80%), those from Christian household (65.51%), and those belonging to a wealthy household (72.41%) (Table 2).
3.2. Factors Associated with Being on Adequate Dietary Diversity
3.2.1. Multivariate Logistic Regression
The adjusted logistic regression included 347 observations. After adjustment, children aged 48–59 months were more likely to have adequate dietary diversity compared with younger children (aOR=1.87; 95% CI: 1.02–3.43; p = 0.043). Children from households with high socioeconomic status were more likely to have adequate dietary diversity than those from low socioeconomic status (aOR= 1.88; 95% CI: 1.003–3.51; p = 0.049). Children living in rural areas were more likely to have adequate dietary diversity than those in urban areas (aOR= 1.65; 95% CI: 1.02–2.66; p = 0.040). Likewise, Children whose parents identified as Christian were more likely to have adequate dietary diversity (aOR = 2.50, 95% CI: 1.02–6.10; p= 0.044). Other covariates were not statistically significant in the fully adjusted model (Table 3).
3.2.2. Predicted Probabilities and Interaction Analyses
The marginal predicted probabilities of adequate dietary diversity by SES and child age group showed a graded pattern. For children aged 24–35-month, adjusted probabilities were 0.512 (95% CI 0.392–0.632) for poor, 0.540 (0.417–0.664) for middle, and 0.656 (0.552–0.759) for rich SES. For those aged 36–47-month, the corresponding probabilities were 0.603 (0.486–0.719) for poor, 0.630 (0.528–0.731) for middle, and 0.734 (0.625–0.842) for rich SES ; and for children aged 48–59-month, the probabilities were 0.655 (0.527–0.782) for poor, 0.680 (0.564–0.795) for middle, and 0.775 (0.675–0.875) for rich SES (Figure 1).
An interaction model including Area × SES produced evidence of effect modification. In urban areas, adjusted probabilities were 0.628 for the poor (95% CI 0.509–0.747), 0.510 for the Middle (95% CI 0.394–0.626), and 0.629 for the Rich (95% CI 0.505–0.754). In rural areas adjusted probabilities were 0.546 (0.410–0.683) for the poor, 0.744 (0.620–0.868) for the middle, and 0.821 (0.715–0.927) for the rich.
These findings indicate that dietary diversity increases significantly with socioeconomic status in rural areas, whereas differences between socioeconomic groups are smaller in urban setting. The interaction suggests that the effect of SES on dietary diversity is more pronounced in rural contexts (margins represented by Area) (Figure 2).
3.2.3. Model Performance and Diagnostics
The classification table (cut off point 0.5) indicated high sensitivity 87.73%) but low specificity (28.35%), with overall correct classification rate of 65.99%. The Hosmer–Lemeshow goodness-of-fit test showed adequate model calibration (Hosmer–Lemeshow χ 2 (8) = 6.88; p = 0.550). The linktest yielded a significant _hat (p =0.004) and a non-significant _hatsq (p = 0.181), indicating that the model meaningful predictive information without evidence of specification error. Collinearity diagnostics (uncentered VIF) showed mean VIF of 2.37, confirming the absence of multicollinearity.
4. Discussion
The study conducted in the Mont Ngafula II health zone in Kinshasa identified four major factors associated with adequate dietary diversity (DDS ≥ 5) among children aged 24–59 months. These factors including being aged 48-59 months, having a high socioeconomic status, living in a rural area, belonging to the Christian religion faith.
Our findings indicate that children aged 48-59 months were nearly twice as likely to achieve adequate dietary diversity compared to their younger counterparts. This positive age gradient has been consistently reported in several African studies. In Ethiopia, Woldegebriel et al. (2020) found that the likelihood of meeting the minimum dietary diversity increased significantly with age, particularly among children aged 48–59 months [25]. Similarly, a multi-country analysis by Bliznashka et al. (2021) across 33 low- and middle-income countries demonstrated a steady rise in dietary diversity scores among children aged 24–59 months [26].
However, this association may be influenced by cultural practices not assessed in our study, such as reserving certain foods for older children. As children grow older, their physiological abilities (e.g., chewing and digestion), and social abilities (e.g., food autonomy) improve, enabling them to consume a wider variety of foods. Children aged 48–59 months tend to share more family meals and rely less on less varied complementary foods. This gradual dietary diversification nutritionally supports their increasing energy and micronutrient requirements [25,26].
In the context of Mont Ngafula II, where most households share common family meals and mothers are often engaged in the informal sector, younger children (24–35 months) often receive less varied, soft textured meals, whereas older children consume family meals that include several food groups (staple foods, leafy vegetables, fish, oils, etc.). Furthermore, the peri-urban environment of the area, characterized by the proximity to markets and farming zones, offers greater availability of diverse foods (vegetables, tropical fruits, and local protein sources), which particularly benefit children aged 4–5 years. The increasing participation of children in this age group in preschool or community setting further enhances their exposure to varied meals outside the home. These combined factors largely explain the significantly higher likelihood of adequate dietary diversity observed in this group, consistent with findings from other African contexts, notably Kang et al. (2023); Raru et al. (2023); and Paulo et al. (2024) [27,9,3]. In the Mont Ngafula II health zone, the low dietary diversity observed among the youngest children (24–35 months) underscores the need to strengthen Infant and Young Child Feeding (IYCF) counseling from the onset of complementary feeding. Cooking demonstration sessions tailored to local resources should be routinely implemented during prenatal and postnatal education. Community health workers can be trained to closely monitor the dietary practices of children aged 6–35 months. Strategically, integrating the DDS score into nutritional monitoring tools used during growth or vaccination visits would facilitate the early identification of at-risk households.
The children whose parents belonged to the Christian religion were nearly three times more likely to have adequate dietary diversity. The positive association with Christianity is more contextual and requires detailed interpretation. Studies show that religious affiliations have an impact on eating habits through two contradictory processes: on the one hand, certain customs (such as strict fasting in Orthodox denominations) can reduce the availability of animal-based foods at home and negatively affect children's dietary diversity; on the other hand, when active, Christian institutions often play a beneficial role by conveying health messages, setting up support groups for mothers, and encouraging community projects (cafeterias, distributions, training) that help improve children's diets [28,29]. According to Kumera et al. (2018) in their research in Africa, religious practices can either hinder or promote the consumption of certain foods. Periods of fasting imposed by certain denominations can restrict the intake of animal-based foods among children [30]. Furthermore, a national study conducted by Ndovie et al. (2016) reveals that Christian families have a greater dietary diversity, potentially due to less restrictive cultural traditions and the social support provided by religious institutions [31]. In the context of Mont Ngafula II, nutrition workers should collaborate with local Christian groups to amplify their reach, while remaining inclusive of other faiths. It is plausible that, in Mont Ngafula II, the networks and interventions supported by certain local Christian churches strengthen access to information and food aid, hence the association observed.
The children whose parents identified as Christian religion were nearly three times more likely to have adequate dietary diversity. The positive association with Christianity appears context- dependent and warrants further interpretation. Previous studies have shown that religious affiliation can influence eating habits through two opposing mechanisms: on one hand, certain customs such as strict fasting in Orthodox denominations may reduce the availability of animal-source foods at home and negatively impact children's dietary diversity; on the other hand, active Christian institutions often play a beneficial role by disseminating health messages, establishing support groups for mothers, and promoting community initiatives such as cafeterias, food distributions, and training sessions that help improve child nutrition [28,29].
According to Kumera et al. (2018), religious practices in Africa can either hinder or promote the consumption of certain foods. Periods of fasting imposed by specific denominations can restrict animal-source food intake among children [30]. Moreover, a national study by Ndovie et al. (2016) found that Christian families tend to exhibit greater dietary diversity, possibly due to few cultural food restrictions and stronger social support from religious institutions [31]. In the context of Mont Ngafula II, nutrition professionals should collaborate with local Christian groups to expand outreach efforts while maintaining inclusivity toward other faiths. It is plausible that, the networks and interventions organized by certain local Christian churches enhance access to nutrition information and food assistance, which may explain hence the observed association.
Children from households in the richest tertile were significantly more likely to achieve adequate dietary diversity than those in the poorest tertile. This finding is consistent with evidence from other African setting. Headey (2017), in a multi-country analysis, identified household wealth as a key determinant of dietary diversity among children in sub-Saharan Africa [32]. Similarly, Harvey et al. (2018) reported that the likelihood of achieving minimum dietary diversity increases with higher wealth quintiles [33]. Although the wealth index used in our analysis validated, it primarily reflects the ownership of durable assets rather than seasonal income variation. Nevertheless, alignment with regional findings supports the external validity of our result.
This relationship can be explained by the fact that wealthier households have greater purchasing power and more consistent access to markets, enabling them to obtain foods rich in micronutrients such as animal-source foods, fruits and dairy products. They also benefit from better nutrition education and greater exposure to public health messaging. Conversely, poorer households often rely heavily on inexpensive staple foods such as cassava, maize, and rice, which limits dietary diversity and increases the risk of nutrient deficiencies [32,33]. In Mont Ngafula II, the implementation of targeted social safety nets such as conditional cash transfers for households with children under five years combined with nutrition education could help reduce food inequities. Evidence from several African programs indicates that pairing cash transfers with nutrition counseling enhances the consumption of diverse foods [34,35].
Children living in rural areas had greater dietary diversity than those in urban areas. This result, although seemingly counterintuitive, has been reported in contexts where local agricultural production enhances direct access to a wider range of foods. In Zambia, Hearst et al. (2022) observed higher dietary diversity among farming households with home gardens [36]. Similarly, Khonje et al. (2022) demonstrated that agricultural production diversity is positively associated with children’s dietary diversity across sub-Saharan Africa [37]. However, the simple urban–rural dichotomy can conceal substantial heterogeneity within each setting. Further analyses integrating market accessibility and household food production capacity would provide greater insight
In the context of Mont Ngafula II, this association may be explained by the fact that many rural households possess arable land, small-scale livestock, or proximity to local markets. Such self-production increases the availability of nutrient-rich foods such as eggs, vegetables and smoked fish. In contrast, poor urban households despite their physical proximity to markets face higher prices and often rely on expensive, energy-dense staples such as bread, rice, or cassava flour, which limits dietary diversity. Thus, the apparent rural advantage likely reflects greater food availability rather than higher economic. Local health authorities could strengthen food and nutrition security by mapping agricultural production zones and reinforcing short food supply chains between rural producers and urban consumers. In addition, the promotion of community gardens, the preservation of seasonal foods (e.g., dried vegetables, smoked fish); and implementation of urban nutrition education campaigns encouraging the preparation of affordable yet diverse meals would help bridge the dietary gap.
Strengths and Limitations of the Study
This study addresses a critical public health issue in a relatively undocumented context, focusing on children aged 24–59 months, an age group that remains highly vulnerable yet often overlooked in nutritional interventions. The use of validated tools and indicators, a robust methodological design, and a sufficiently large sample size, combined with careful contextualization, enhance the reliability and policy relevance of the findings for decision-makers and community stakeholders in the study area.
However, several limitations must be acknowledged when interpreting these results. The cross-sectional design prevents establishing causal relationships between the variables examined, allowing only associations to be described. Additionally, dietary information was based on 24-hour recall, which may be subject to recall bias, particularly among parents or caregivers. Data collection at a single point in the year also limits consideration of seasonal variations in food availability, which could affect dietary diversity. Finally, some potentially confounding factors, such as the children's infection status, total energy intake, or precise household income, were not assessed and may have influenced certain associations.
5. Conclusions
This study reveals that the dietary diversity of children aged 24–59 months in Mont Ngafula II is influenced by multiple interrelated factors. The findings, consistent with regional evidence, suggest that a combination of early interventions to improve young children's diets, efforts to reduce economic inequalities, and the promotion of local food production could sustainably enhance the quality of child nutrition. Longitudinal studies and pilot community-based interventions are recommended to validate and operationalize these findings.
Supplementary Materials
The following supporting information can be downloaded at the website of this paper posted on Preprints.org
Author Contributions
Conceptualization, D.B.B., M.B.K .,and P.M.B.; methodology, D.B.B., M.B.K, B.B.M, and P.M.B.; software, D.B.B, B.B.M.,S.N.B. and P.M.B, formal analysis, D.B.B, M.B.K., B.B.M.; and E.B.D; investigation, D.B.B., M.B.K., R.M.M,Y.M.J and G.B.B; results interpretation, D.B.B., M.B.K, and B.B.M.; validation, S.N.B .; P.M.B.,.; writing–original draft preparation, D.B.B, M.B.K., and P.M.B; writing–review and editing, D.B.B, and P.M.B.; visualization, D.B.B, M.B.K, and P.M.B. All authors read and approve the final manuscript.
Funding
This study did not receive external funding.
Institutional Review Board Statement
This study was approved by the ethics committee of the Kinshasa School of Public Health (ESP/CE/101B/2024) on 25 November 2024.
Informed Consent Statement
Informed consent was obtained from all subjects involved in the study.
Data Availability Statement
The data used for this publication and the do. file can be made available upon reasonable request to the corresponding author.
Acknowledgments
We thank the KSPH students and assistant who were involved in data collection. We express also our thank to parents and children in Mont Ngafula II HZ for sharing their experiences with us.
Conflicts of Interest
The authors declare that they have no conflicts of interest.
References
- Vollmer S, Laillou A, Albers N, Nanama S. Measuring child food poverty : understanding the gap to achieving minimum dietary diversity. Public Health Nutr. 2025 Jan 8 ;28(1) : e27. [CrossRef] [PubMed] [PubMed Central]
- George CM, Coglianese N, Bauler S, Perin J, Kuhl J, Williams C, Kang Y, Thomas ED, François R, Ng A, Presence AS, Jean Claude BR, Tofail F, Mirindi P, Cirhuza LB. Low dietary diversity is associated with linear growth faltering and subsequent adverse child developmental outcomes in rural Democratic Republic of the Congo (REDUCE program). Matern Child Nutr. 2022 Jul ;18(3): e13340. Epub 2022 Mar 21. [CrossRef] [PubMed] [PubMed Central]
- Raru TB, Merga BT, Mulatu G, Deressa A, Birhanu A, Negash B, Gamachu M, Regassa LD, Ayana GM, Roba KT. Minimum Dietary Diversity Among Children Aged 6-59 Months in East Africa Countries : A Multilevel Analysis. Int J Public Health. 2023 Jun 1 ;68 :1605807. [CrossRef] [PubMed] [PubMed Central]
- Abdulahi A, Shab-Bidar S, Rezaei S, Djafarian K. Nutritional Status of Under Five Children in Ethiopia : A Systematic Review and Meta-Analysis. Ethiop J Health Sci. 2017 Mar ;27(2) :175-188. [CrossRef] [PubMed] [PubMed Central]
- Kanté AM, Gutierrez HR, Larsen AM, Jackson EF, Helleringer S, Exavery A, Tani K, Phillips JF. Childhood Illness Prevalence and Health Seeking Behavior Patterns in Rural Tanzania. BMC Public Health. 2015 Sep 23 ;15 :951. [CrossRef] [PubMed] [PubMed Central]
- Uggla Caroline and Mace Ruth. Parental investment in child health in sub-Saharan Africa : a cross-national study of health-seeking behaviors (2016) R. Soc. Open Sci. 3 150460. [CrossRef]
- Azupogo Fusta, Chipirah J, Halidu Ramatu. The association between dietary diversity and anthropometric indices of children aged 24-59 months: A cross-sectional study in northern Ghana 2022}, Afr. J. Food Agric. Nutr;2022 ,10 :22; 20829-20848. [CrossRef]
- Belay DG. Determinants of Inadequate Minimum Dietary Diversity Intake Among Children Aged 6 – 23 Months in Sub-Saharan Africa: Pooled Prevalence and Multilevel Analysis of Demographic and Health Survey in 33 Sub-Saharan African Countries. frontiers in nutrition ,2022;9(July):1–16.
- Paulo HA, Andrew J, Luoga P, Omary H, Chombo S, Mbishi JV, Addo IY. Minimum dietary diversity behaviour among children aged 6 to 24 months and their determinants : insights from 31 Sub-Saharan African (SSA) countries. BMC Nutr. 2024 Dec 18 ;10(1) :160. [CrossRef] [PubMed] [PubMed Central]
- Gassara G, Chen J. Household Food Insecurity, Dietary Diversity, and Stunting in Sub-Saharan Africa : A Systematic Review. Nutriments 2021, 13(12), 4401. [CrossRef]
- FAO and WHO. Indicators for assessing infant and young child feeding practices: definitions and measurement methods. 2021. https://www.who.int/publications/i/item/9789240018389 (accessed on 6 July 2025).
- UNICEF. The State of the World's Children 2023: Nutrition for Every Child. https://www.unicef.org/reports/state-worlds-children-2023 (accessed on 15 July 2025).
- Global Nutrition Report. Profile of the Democratic Republic of Congo. https://globalnutritionreport.org/resources/nutrition-profiles/africa/central-africa/democratic-republic-of-the-congo (accessed on 01 August 2025).
- Bangelesa F, Hatløy A, Mbunga BK, Mutombo PB, Matina MK, Akilimali PZ, Paeth H, Mapatano MA. Is stunting in children under five associated with the state of vegetation in the Democratic Republic of the Congo ? Secondary analysis of Demographic Health Survey data and the satellite-derived leaf area index. Heliyon. 2023 Feb 3 ;9(2) : e13453. [CrossRef] [PubMed] [PubMed Central]
- George CM, Coglianese N, Bauler S, Perin J, Kuhl J, Williams C, Kang Y, Thomas ED, François R, Ng A, Presence AS, Jean Claude BR, Tofail F, Mirindi P, Cirhuza LB. Low dietary diversity is associated with linear growth faltering and subsequent adverse child developmental outcomes in rural Democratic Republic of the Congo (REDUCE program). Matern Child Nutr. 2022 Jul ;18(3):e13340. Epub 2022 Mar 21. [CrossRef] [PubMed] [PubMed Central]
- (accessed on 3 August 2025).
- Niken V, Nur D, Nugroho D, Anjani G. Socio-demographics, dietary diversity score, and nutritional status of children aged 2–5 years : A cross-sectional study of Indonesian coastal areas. Clin Epidemiol Glob Heal [Internet]. 2024 ;27(Septembre 2023) :101599. [CrossRef]
- FAO. Food and nutrition security in urban Africa: case study of Kinshasa. 2024. https://www.fao.org/publications/en/ (accessed on 2 Jun 2025).
- Swindale A, Bilinsky P. Household Dietary Diversity Score (HDDS) for measuring household food access: Indicator Guide VERSION 2. Nutritional Assistance Project, Academy for Development and Education [Internet]. 2006;14p. Available from: www.fantaproject.org.
- WHO Multicentre Growth Reference Study Group. WHO Child Growth Standards: Length/Height-for-Age, Weight-for-Age, Weight-for-Length, Weight-for-Height and Body Mass Index-for-Age: Methods and Development; Library Cataloguing-in-Publication Data; WHO Child Growth Standards: Geneva, Switzerland, 2006; Volume 51.
- Coates, J.; Swindale, A.; Bilinsky, P. Household Food Insecurity Access Scale (HFIAS) for Measurement of Food Access: Indicator Guide; Version 3; FHI360/FANTA: Washington, DC, USA, 2007.
- UNICEF. Tools—UNICEF MICS. 2023. Available online: https://mics.unicef.org/tools (accessed on 7 August 2025).
- UNICEF. The Early Childhood Development Index 2030: A New Measure of Early Childhood Development; United Nations Children’s Fund: New York, NY, USA, 2023; Available online: https://data.unicef.org/wp-content/uploads/2023/09/ECDI2030_Technical_Manual_Sept_2023.pdf (accessed on 18 June 2025).
- Petrowski N, de Castro F, Davis-Becker S, Gladstone M, Lindgren Alves CR, Becher Y, Grisham J, Donald K, van den Heuvel M, Kandawasvika G, Maqbool S, Tofail F, Xin T, Zeinoun P, Cappa C. Establishing performance standards for child development: learnings from the ECDI2030. J Health Popul Nutr. 2023 Dec 12;42(1):140. [CrossRef] [PubMed] [PubMed Central]
- Woldegebriel AG, Desta AA, Gebreegziabiher G, Berhe AA, Ajemu KF, Woldearegay TW. Dietary Diversity and Associated Factors among Children Aged 6-59 Months in Ethiopia: Analysis of Ethiopian Demographic and Health Survey 2016 (EDHS 2016). Int J Pediatr. 2020 Aug 21; 2020:3040845. [CrossRef] [PubMed] [PubMed Central]
- Bliznashka L, Perumal N, Yousafzai A, Sudfeld C. Diet and development among children aged 36-59 months in low-income countries. Arch Dis Child. 2022 Aug;107(8):719-725. Epub 2021 Dec 24. [CrossRef] [PubMed] [PubMed Central]
- Yunhee Kang, Rebecca A Heidkamp, Kudakwashe Mako-Mushaninga, Aashima Garg, Joan N Matji, Mara Nyawo, Hope C Craig, Andrew L Thorne-Lyman. Factors associated with diet diversity among infants and young children in the Eastern and Southern Africa region. Maternal & Child Nutrition. 2023;19(3): e13487. [CrossRef]
- Birhanu H, Gonete KA, Hunegnaw MT, Aragaw FM. Minimum acceptable diet and associated factors among children aged 6-23 months during fasting days of orthodox Christian mothers in Gondar city, North West Ethiopia. BMC Nutr. 2022 Aug 10 ;8(1):76. [CrossRef] [PubMed] [PubMed Central]
- Armdie AZ, Fenta EH, Shiferaw S. The effect of mothers and caregivers' fasting status on the dietary diversity of children 6-23 months : A longitudinal study in Debrebirhan, Ethiopia. PLoS One. 2022 Feb 24 ;17(2) : e0264164. [CrossRef] [PubMed] [PubMed Central]
- Kumera G, Tsedal E, Ayana M. Dietary diversity and associated factors among children of Orthodox Christian mothers/caregivers during the fasting season in Dejen District, North West Ethiopia. Nutr Metab (Lond). 2018 Feb 14 ;15 :16. [CrossRef] [PubMed] [PubMed Central]
- Ndovie P, Geresomo N, Nkhata SG, Pakira L, Chabwera M, Millongo F, Nyau V. Exploring the determinants of undernutrition among children aged 6-59 months old in Malawi : Insights on religious affiliation, ethnicity, and nutritional status using the 2015-2016 Malawi demographic and health survey. Nutrition. 2026 Jan;141:112922. Epub 2025 Aug 5. Headey D. Remoteness, urbanization, and child nutrition in sub-Saharan Africa. Food Policy. 2017 ; 67 :64–77. [CrossRef] [PubMed]
- Headey D. Remoteness, urbanization, and child nutrition in sub-Saharan Africa. Food Policy. 2017 ; 67 :64–77.
- Harvey CM, Newell ML, Padmadas SS. Socio-economic differentials in minimum dietary diversity among young children in South-East Asia: evidence from Demographic and Health Surveys. Public Health Nutr. 2018 Nov;21(16):3048-3057. Epub 2018 Sep 4. [CrossRef] [PubMed] [PubMed Central]
- Briaux J, Martin-Prevel Y, Carles S, Fortin S, Kameli Y, Adubra L, Renk A, Agboka Y, Romedenne M, Mukantambara F, Van Dyck J, Boko J, Becquet R, Savy M. Evaluation of an unconditional cash transfer program targeting children's first-1,000-days linear growth in rural Togo : A cluster-randomized controlled trial. PLoS Med. 2020 Nov 17 ;17(11) : e1003388. [CrossRef] [PubMed] [PubMed Central]
- Jef L. Leroya; Marie Ruelb; Ellen: The impact of conditional cash transfer programmes /on child nutrition. https://globalepri.org/wpcontent/uploads/2016/07/Leroy2009TheImpactofConditionalCashTransferProgrammesonChildNutrition.pdf.
- Hearst MO, Wells L, Hughey L, Makhoul Z. Household Dietary Diversity among Households with and without Children with Disabilities in Three Low-Income Communities in Lusaka, Zambia. Int J Environ Res Public Health. 2023 Jan 28;20(3):2343. [CrossRef] [PubMed] [PubMed Central]
- Khonje, MG, Ricker-Gilbert, J., Muyanga, M., & Qaim, M. (2022). Agricultural production diversity and nutrition of children and adolescents in rural sub-Saharan Africa: a multinational longitudinal study. The Lancet Planetary Health, 6(5), e391–e399.
Figure 1.
Socio-économique status and Child Dietary diversity : Predictive Margins by Age. Predictive margins of dietary diversity score (Pr (DDS)) vary according to socioeconomic status (SES) and child’s age group. The probabilities of achieveing adequate dietary diversity (DDS) are presented for Poor (blue), Middle (red), and Rich (green) categories across three age groups : 24–35 months, 36–47 months, and 48–59 months, with error bars representing 95% confidence intervals.
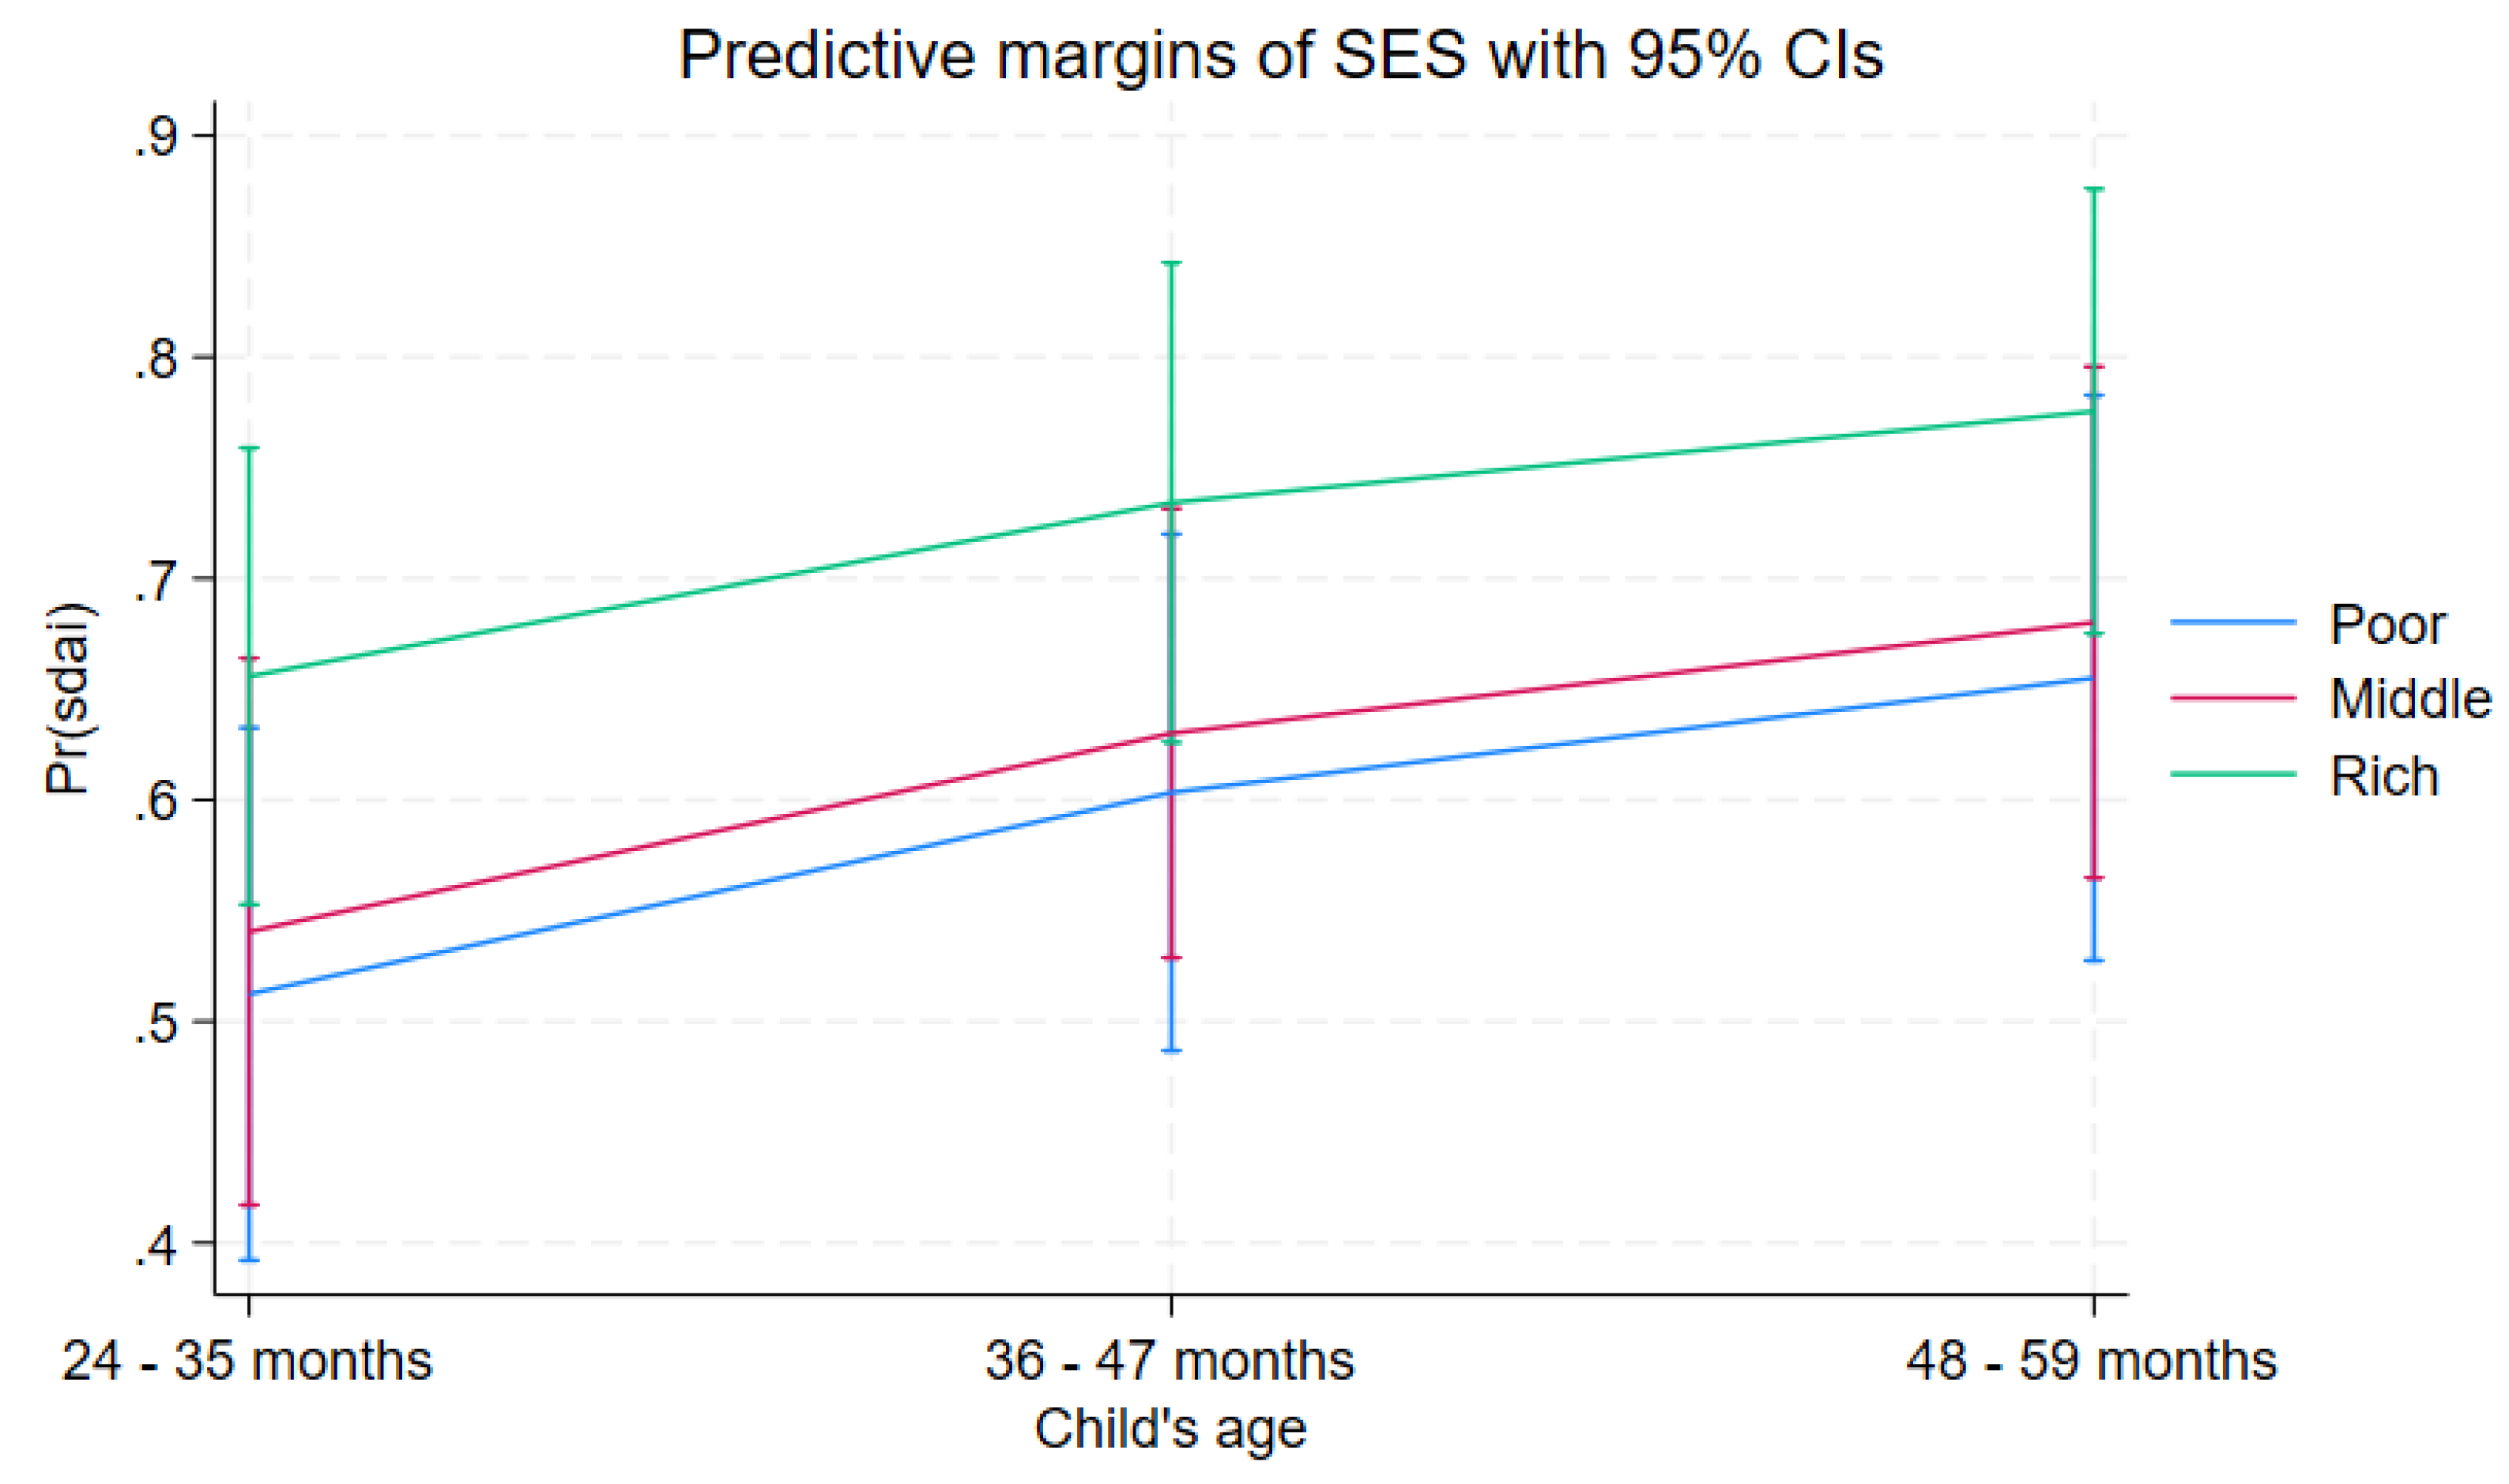
Figure 2.
Interaction effects between Area (Urban, Rural) and socioeconomic status (SES) on predicted dietary diversity scores (DDS). The figure dépicts the probabilities of children achieveing adequate DDS each Area–SES category, with confidence intervals indicating the reliability of the estimates.
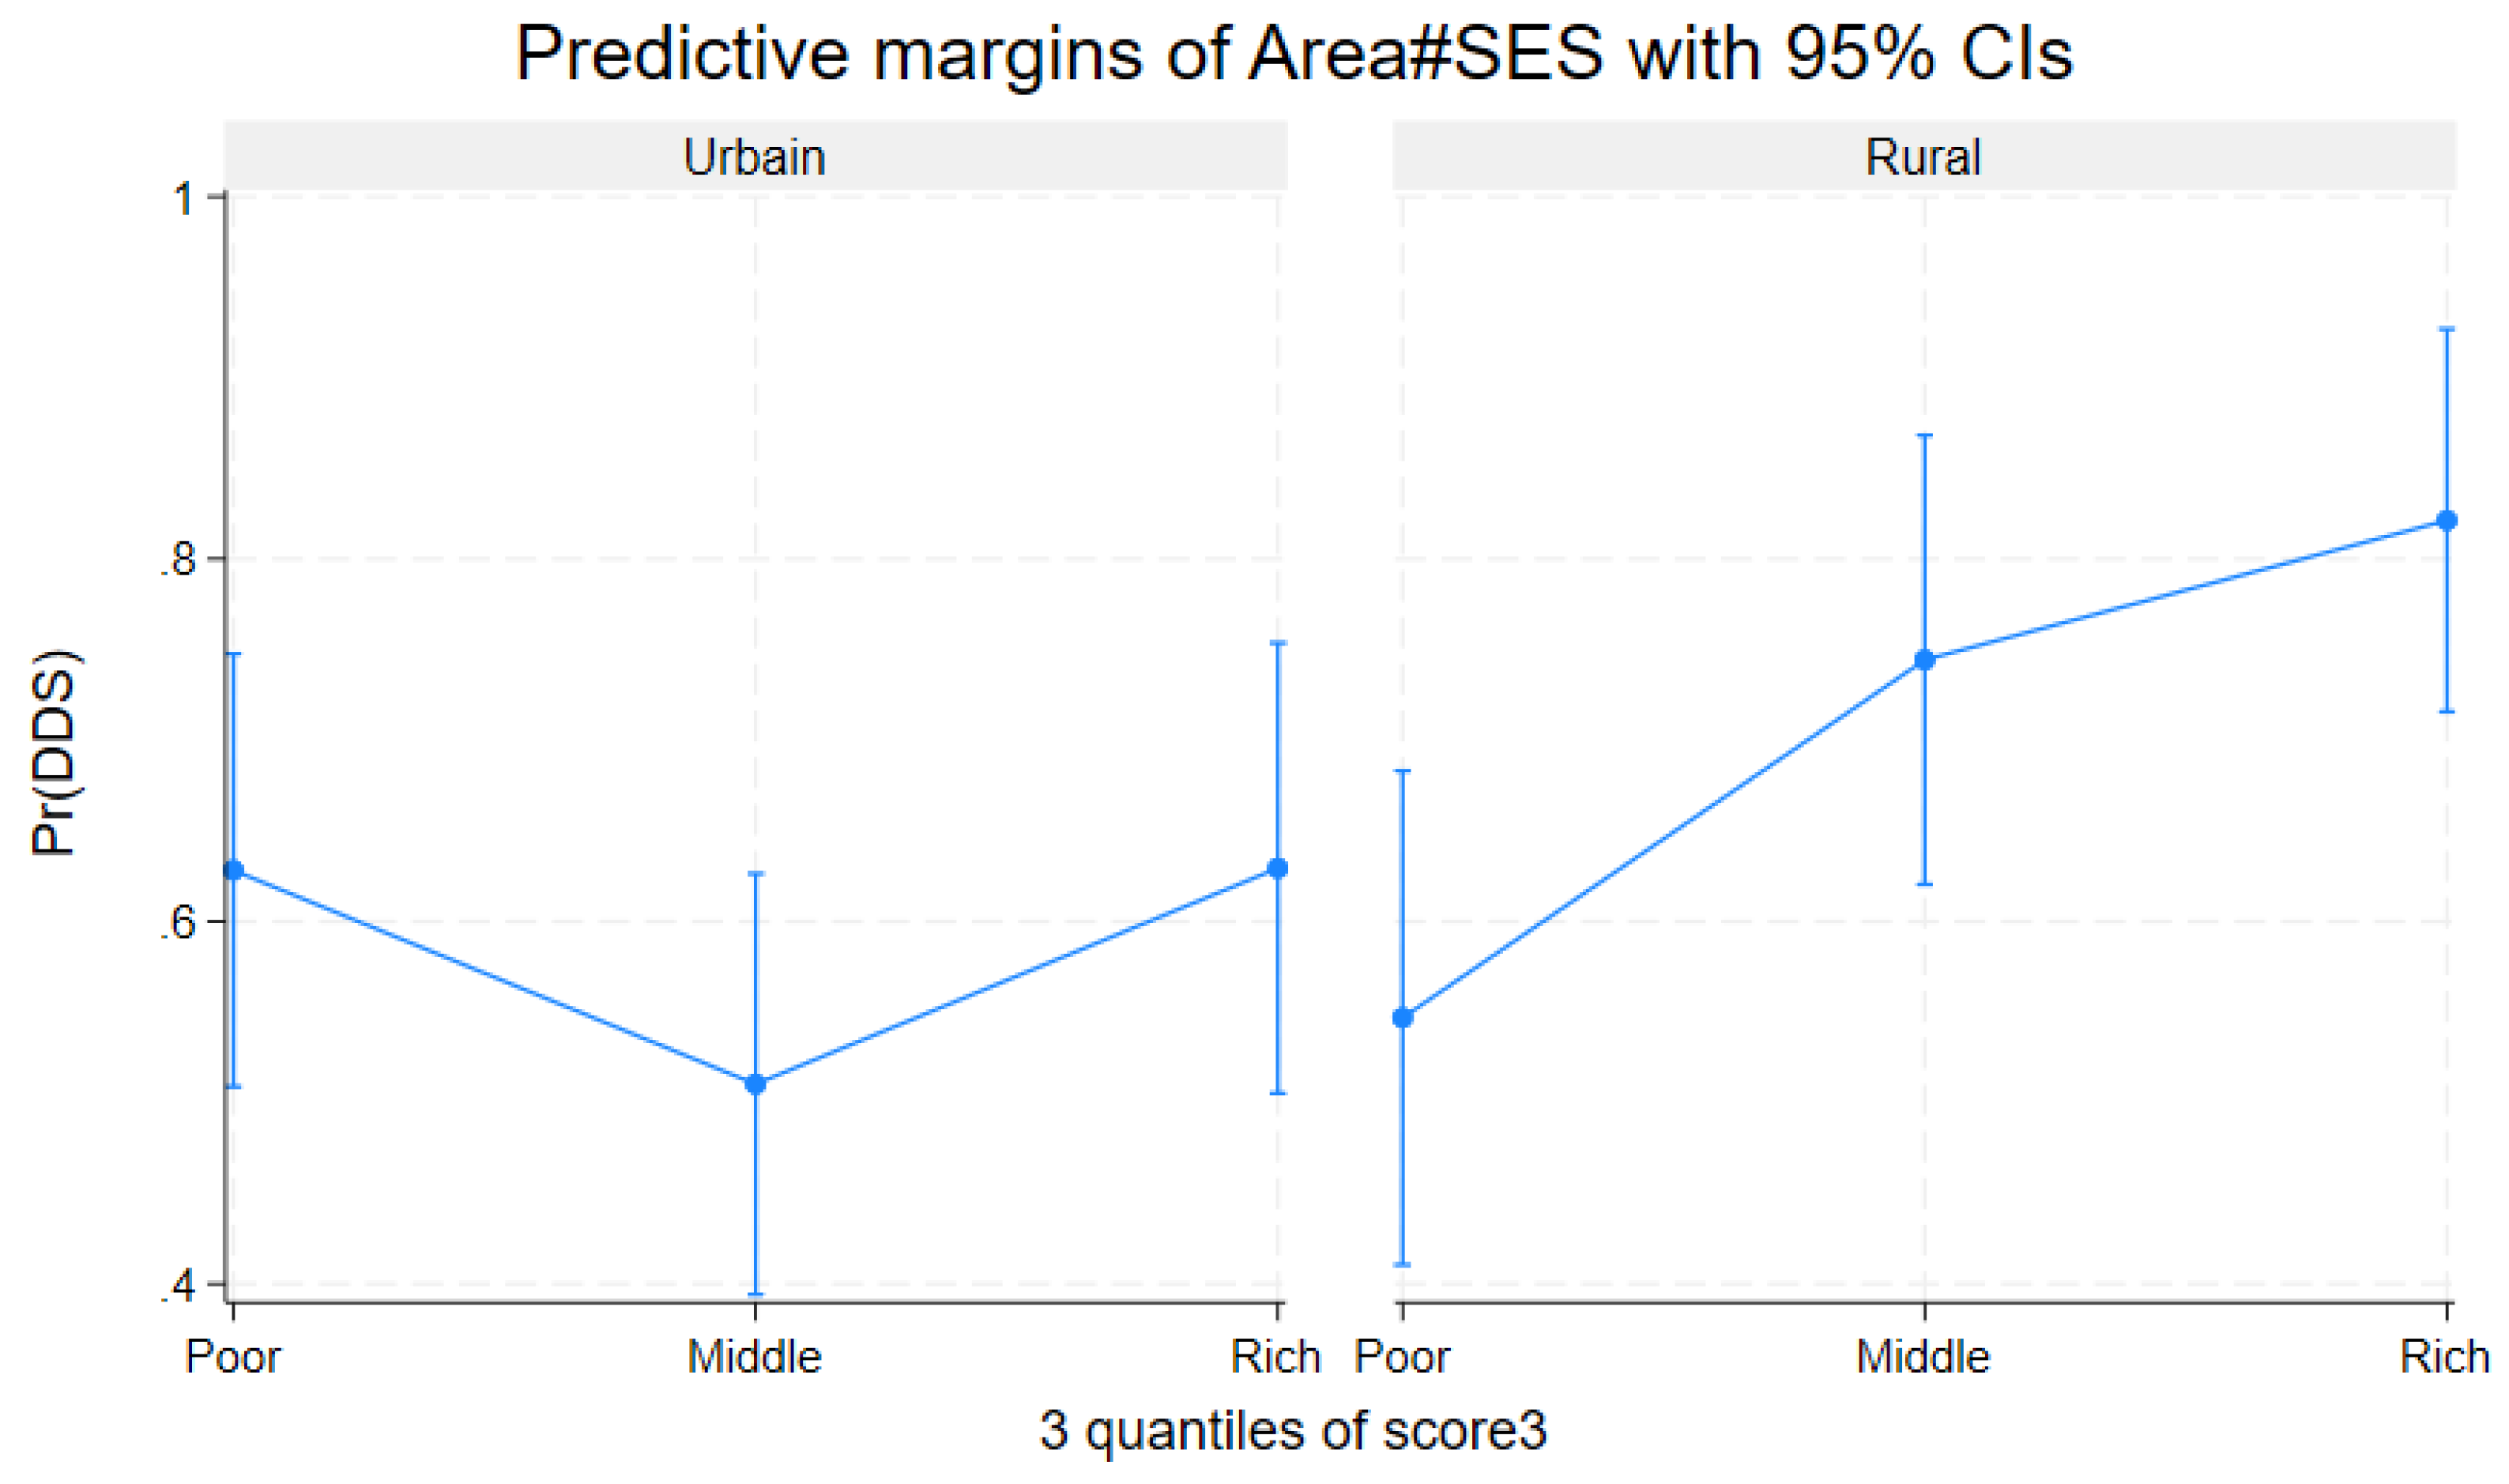

Table 1.
Food groups consumed and Dietary diversity scrore.
| Foods groups | n (total=348) or Mean (SD) | % |
| Seeds, roots, and tubers | 267 | 76.72 |
| Foods rich in vitamin A | 248 | 72.26 |
| Fruits and vegetables | 237 | 68.10 |
| Meat, poultry, and fish | 260 | 74.71 |
| Eggs | 70 | 20.21 |
| Legumes and pod vegetables | 146 | 41.95 |
| Milk and dairy products | 189 | 54.31 |
| Oils and fats | 252 | 72.41 |
| DDS continu (mean± SD) | 4.795 ± 2.281 | 100 |
DDS : Diet diversity score SD : Standar deviation.
Table 2.
Socio-demographic characteristics overall and according to Dietary diversity.
| Characteristics |
Total (column) n (%) |
Dietary diversity (row) | ||
|
Adequate n (%) |
Inadequate n (%) |
p-value | ||
| 348 (100.00) | 221 (63.51) | 127 (36.49) | ||
| Children’s characteristics | ||||
| Gender | 0.831 | |||
| Boy | 178 (51.15) | 114 (64.04) | 64 (35.96) | |
| Girl | 170 (48.85) | 107 (62.94) | 63 (37.06) | |
| Age (in months) | 0.079 | |||
| 24 – 35 | 134 (38.51) | 76 (56.72) | 58 (43.28) | |
| 36 – 46 | 124 (35.63) | 81 (65.32) | 43 (34.68) | |
| 47 – 59 | 90 (25.86) | 64 (71.11) | 26 (28.89) | |
| Preschool education | 0.399 | |||
| No | 251 (72.13) | 156 (62.15) | 95 (37.85) | |
| Yes | 97 (27.87) | 65 (67.01) | 32 (32.99) | |
| Early childhood development | 0.282 | |||
| Not on track | 103 (29.60) | 61 (59.22) | 42 (40.78) | |
| On track | 245 (70.40) | 160 (65.31) | 85 (34.69) | |
| Stunting (n=313) | 0.810 | |||
| Yes | 38 (12.14) | 23 (60.53) | 15 (39.47) | |
| No | 275 (87.86) | 172 (62.55) | 103 (37.45) | |
| Parents or caregivers’ Characteristics | ||||
| Age (in years) * | 0.019 | |||
| < 30 | 131 (37.64) | 73 (55.73) | 58 (44.27) | |
| ≥ 30 | 217 (62.36) | 148 (68.20) | 69 (31.80) | |
| Gender | 0.261 | |||
| Male | 33 (9.48) | 18 (54.55) | 15 (45.45) | |
| Female | 315 (90.52) | 203 (64.44) | 112 (35.56) | |
| Education level | 0.471 | |||
| Low | 142 (40.80) | 87 (61.27) | 55 (38.73) | |
| Secondary school or above | 206 (59.20) | 134 (65.05) | 72 (34.95) | |
| Occupation | 0.858 | |||
| Unemployed | 56 (16.09) | 34 (60.71) | 22 (39.29) | |
| Housewife | 78 (22.41) | 51 (65.38) | 27 (34.62) | |
| Employee | 214 (61.49) | 136 (63.55) | 78 (36.45) | |
| Religion* | 0.048 | |||
| No religion | 4 (1.15) | 1(25.00) | 3 (75.00) | |
| Christian | 316 (90.80) | 207 (65.51) | 109 (34.49) | |
| Muslim | 1 (0.29) | 1 (100.00) | 0 (0.00) | |
| Local/Traditional | 27 (7.76) | 12(44.44) | 15 (55.56) | |
| Marital status* | 0.049 | |||
| Alone | 86 (24.71) | 47(54.65) | 39 (45.35) | |
| Married/in union | 262 (75.29) | 174 (69.41) | 88 (33.59) | |
| Household characteristics | ||||
| Household size | 0.564 | |||
| < 6 | 141 (40.52) | 87 (61.70) | 54 (38.30) | |
| ≥ 6 | 207 (59.48) | 134 (64.73) | 73 (32.27) | |
| Area * | 0.035 | |||
| Urban | 199 (57.18) | 117 (58.79) | 82 (41.21) | |
| Rural | 149 (42.82) | 104 (69.80) | 45 (30.20) | |
| Socioeconomic status* | 0.040 | |||
| Poor | 116 (33.33) | 66 (56.90) | 50 (43.10) | |
| Middle | 116 (33.33) | 71 (61.21) | 45 (38.79) | |
| Rich | 116 (33.33) | 84 (72.41) | 32 (27.59) | |
| Food security level | 0.123 | |||
| Food insecurity | 287 (82.47) | 177 (61.67) | 110 (38.33) | |
| Food security | 61 (17.53) | 44 (72.13) | 17 (27.87) | |
| Number of meals per day | 0.801 | |||
| < 3 | 277 (79.60) | 175 (63.18) | 102 (36.82) | |
| ≥ 3 | 71 (20.40) | 46 (64.79) | 25 (35.21) | |
*: variables statistically significant.
Table 3.
Full adjusted model examining child, parent or caregiver, household characteristics, and Dietary diversity, n = 347.
Table 3.
Full adjusted model examining child, parent or caregiver, household characteristics, and Dietary diversity, n = 347.
| Variable | aOR | CI 95% | p-Value |
| Child age (24–35 months = ref) * | |||
| 36 - 47 months | 1.48 | 0.85–2.56 | 0.161 |
| 48 - 59 months | 1.87 | 1.02–3.43 | 0.043 |
| Parent or caregiver age (under 30 years = ref) | |||
| 30 years and above | 149 | 0.91–2.44 | 0.108 |
| Marital status (alone = ref) | |||
| Married or in union | 1.37 | 0.79–2.36 | 0.260 |
| SES (poor = ref) * | |||
| Middle | 1.12 | 0.63–2.01 | 0.685 |
| Rich | 1.88 | 1.003–3.51 | 0.049 |
| Area (Urbain=ref) * | |||
| Rural | 1.65 | 1.02–2.66 | 0.040 |
| Religion (Local/tradition=ref) * | |||
| No religion | 0.47 | 0.05–4.24 | 0.503 |
| Christian | 2.50 | 1.02–6.10 | 0.044 |
| Muslim | 1 | ||
| Food Security (Severate food insecurity=ref) | |||
| Food security | 1.24 | 0.61–2.52 | 0.543 |
| Low food insecurity | 0.74 | 0.28–1.93 | 0.542 |
| Moderate food insecurity | 0.92 | 0.51–1.63 | 0.764 |
*: variables statistically significant.
Disclaimer/Publisher’s Note: The statements, opinions and data contained in all publications are solely those of the individual author(s) and contributor(s) and not of MDPI and/or the editor(s). MDPI and/or the editor(s) disclaim responsibility for any injury to people or property resulting from any ideas, methods, instructions or products referred to in the content. |
© 2025 by the authors. Licensee MDPI, Basel, Switzerland. This article is an open access article distributed under the terms and conditions of the Creative Commons Attribution (CC BY) license (http://creativecommons.org/licenses/by/4.0/).
Copyright: This open access article is published under a Creative Commons CC BY 4.0 license, which permit the free download, distribution, and reuse, provided that the author and preprint are cited in any reuse.


