
Submitted:
11 November 2025
Posted:
12 November 2025
You are already at the latest version
Abstract
Lab on a Chip devices offer high efficiency, low volume and fast analytical measurement, but their use is still niche. A key component for these devices is the detector, and one common type of detection is fluorescence spectroscopy. However, in some cases the detector can be bulky and lose the appeal of small footprint devices. To make lab-on-a-chip devices truly compact, detectors must also be compact. In this paper we discuss the use of simple and low-cost commercial multispectral sensors for use in lab on a chip devices, more specifically for fluorescence detection. Which we demonstrate to allow detection on nanomolar scale with a very simple set up.
Keywords:
fluorescence
; low-cost sensors
; 3D printing
; multispectral sensors
; lab-on-a-chip
1. Introduction
Lab on a chip (LoC) devices condense laboratorial process in a single compact chip [1], which can include pre-concentration, mixing, separation, detection, and others [2,3]. This miniaturization allows for more automated, efficient and low volume analysis [1]. By condensing the analysis steps in a single chip, some advantages appear, such as low sample and reagents consumption, high efficiency and high throughput [4].
Notwithstanding, LoC devices still struggles to find mass market adoption [5,6,7]. One problem that LoC devices face is standardization and that they often need external laboratory equipment to work, such as external detectors, pumps, high voltage power supplies, among other [8].
In recent years, various 3D printing techniques have been employed for fabricating LoC devices, allowing for lower costs, higher design flexibility and rapid prototyping [9]. These techniquess are based on layer-by-layer fabrication in an additive form, which can proportionate complex geometry fabrication, that it would be impossible to fabricate with photolithographic techniques [10]. Due to the recent explosion in popularity of masked stereolithography (MSLA) and fused deposition modeling (FDM), the printers and materials became very cheap and easily available, consequently making 3D printing LoC increasingly popular [11].
Various methods can be employed for identifying and quantifying analytes, one common strategy being fluorescence spectroscopy, which is based on exciting samples with a shorter wavelength and measuring the light emitted at a longer wavelength [12]. The technique is useful due to its high sensitivity related to a low background noise [13].
The typical experimental setup for fluorescence assays involves a light source, lens, wavelength selection filters and photodetectors [14]. Although all this parts can become bulky, ideally lab on a chip devices can take advantage of miniaturized detectors [8,15] and light sources. Hence, there is a constant search for accurate and reliable detection systems that can be easily integrated with these devices.
In this paper we discuss the use of compact and low-cost commercial multispectral sensors for microfluidic LoC fluorescence assays. These sensors were associated with microcontrollers for simple data acquisition measurements. This new sensor could open vast possibilities for LoC devices with integrated detectors in very compact systems.
2. Design
A multispectral photodetector was chosen for the sensor, due to its compact size, low cost (around 10 USD) and I2C serial communication bus. The used sensor was an AS7341 from ams-OSRAM, but many other similar sensors are available, such as the AS7343 and AS7261. The AS7341 has 11 different selectable channels with 8 different visible color filters. The spectral response of the AS7341 sensor was compared with a commercial USB ultraviolet-visible (UV-vis) spectrometer (USB 4000, Ocean Optics) by measuring different light emitting diode (LED) emission spectra, which resulted in the graphs in Figure 1.
Obviously the commercial spectrometer has a much higher spectral resolution, as observed in Figure 1; however, the graphs still maintain a similar overall shape and can be used to determine the LED color used. Another drawback for this sensor is the filters band pass, since each channel has a relatively wide response window, which is represented by its datasheet (Figure S1), resulting in a wider band compared with the spectrometer.
Despite its drawbacks, this sensor offers great opportunities for miniaturized and low-cost systems, offering many outputs in a chip where traditional systems would need many photodiodes. Moreover, in most chemical analyses, only one channel is strictly necessary for keeping track of the chemical compound. So, having different channels to choose from brings more flexibility to use the same sensor in different situations.
Another advantage is the internal analog to digital converter (ADC) with communication with I2C. This lowers the possibility of noise between the sensor and microcontroller, since the signals from the sensors are in digital form. But since there is no way for directly accessing the photodiode signal, the maximum gain of 1024x can be a limitation for lower light intensity.

Table 1.
Bill of materials.
| Quantity | Component | Source of materials | Material type | Cost |
|---|---|---|---|---|
| 1 | AS7341 | AliExpress | Multispectral Sensor | $5.99 |
| 1 | 450nm 5mW Laser | AliExpress | Laser Diode | $10.50 |
| 1 | Raspberry Pico | Local electronic store | Microcontroller board | $6.50 |
| 1 | 3D printed parts | Local 3D printer store | Photocurable resins | $1.50* |
*Considering only the resin needed for printing the parts
3. Build Instructions
Two simple devices were utilized in this sensor prototype, one for validation of the sensor at a static system and the other for application in capillary electrophoresis. In both cases the AS7341 sensor was controlled with a Raspberry Pi Pico microcontroller through its I2C communication ports. A simple program was made in micropython, with a pre-made library for this sensor, for monitoring and recording the data acquired in a .csv file, which was saved on the microcontroller and could be read with Thonny IDE or other IDEs for programing in micropython.
3.1. 3D Printing of the LoC Microfluidic Device
All 3D printed parts were printed in an Anycubic M5s MSLA printer with Anycubic Standard Clear or Standard Grey resin, the layer height utilized was 20µm with 1.2s normal exposure. After printing, the pieces were washer with excess ethanol by hand and placed in an ultrasonic bath with ethanol for 15 minutes for removing resin in the channels. Finally, the prints were placed in a post curing chamber for 3 minutes. In addition to the channels and capillary support, a backplate for securing the AS sensor was printed and fixed in place with nuts and screws.
3.2. Construction of Analytical Curves of Fluorescent Probes
The first system was used to construct analytical curves for fluorescein and rhodamine B to demonstrate the detector signal relation to concentration. For this a simple device with channel was used, which consisted of one single 0.6 mm channel with 3 mm optical path. The light source was perpendicular to the sensor, minimizing the amount of light from the LED that hit directly the sensor. To drive the LED a simple LM317 current source was utilized, this source was powered by the 5V from USB cable that powered the microcontroller, and a 470 Ω trimpot was used to adjust the current to 15 mA for the blue LED and 2.5 mA for the green LED. The microfluidic chip inlet and outlet were connected to silicone tubes for loading solutions and cleaning the microfluidic channel.
3.3. Application for Amino Acids Separation Detection
For the application in capillary electrophoresis, a simple support was printed with MSLA 3D printed. A 100 µm internal diameter fused silica capillary was placed inside this support, the AS7341 sensor was aligned with the capillary and a 450 nm laser diode, powered by the 5V line from the microcontroller, was placed forming a 90-degree angle between the light source and detector. This detection system was used in a home-made CE-C4D system, which was previously reported by our group [16,17,18].
Detailed photos can be found for each system in Figure S2, all CAD models are also annexed in the supplementary materials section.
3.4. Materials
Fluorescein and rhodamine B were purchased from Synth (Diadema – SP, Brazil). Fluorescein 5 isothiocyanate (FITC), L-arginine and L-histidine were purchased from Sigma-Aldrich. The resins used for 3D printing were Anycubic Standard Clear and Anycubic Standard Grey, which were acquired from Slim3D (Curitiba-PR, Brazil). The blue laser diode and AS7341 on a breakout board were purchased online from AliExpress. Raspberry Pi Pico and other electronics supply were obtained from MakerHero (Palhoça - SC, Brazil).
4. Operating Instructions
For construction of analytical curves for each data point, the channel was first loaded with deionized water and a blank was recorded. Afterwards, the channel was loaded with the probe, and the full spectrum was recorded 10 times for each replicate, then the average was calculated and used as the data point. Within measurements of the same replicate, the channel was washed with deionized water, and between replicates the channel was washed with 5 mL of ethanol followed by 10 mL deionized water.
For separation of amino acids, a fluorescent derivatization was made with FITC following a procedure adapted from Takizawa and Nakamura [19]. A 1 mg/mL FITC solution was prepared in pure acetone, a fresh solution was prepared every day due to FITC low stability [20]. A wide range of concentrations of L-arginine and L-histidine were tested, varying from 0.25 to 25 µmol L-1. The concentration of FITC was fixed at 100 µmol L-1 for all solutions, which made the amino acids the limiting reagent. The solutions were prepared in borate buffer pH 9 at 20 mmol L-1 and were incubated at 50 ºC for 5 h. After incubating, the solutions were injected directly into the CE equipment. The separation conditions were 20 kV in 100 µm fused silica capillary with 50 cm length (42 cm to the detector), the run buffer was the same as the dilution buffer, and the injection was made with hydrodynamic pressure at 11 kPa for 1.5 seconds.
5. Validation
5.1. Use of AS7341 in Analytical Curves
An analytical curve was constructed varying concentrations of fluorescein and rhodamine B in a simple microfluidics channel, which is presented in Figure 2. These probes were chosen for the wide availability of derivates with similar fluorescence characteristics and due to their excitation wavelength being higher than the resin absorption wavelength (as discussed in S3).
Since fluorescein has emission on 510 nm and rhodamine B has emission on 627 nm [21], channel F4 and F6 were chosen for each sample. Each probe will have a different optimal channel, and its choice is a combination of high sensitivity to the probe emission and low background noise from the LED emission.
Despite the conditions not being optimized for each probe (i.e., pH, ionic force), this set up was already able to achieve limits of detection on dozens of nanomolar scales.
The full spectrum is presented in Figure S4. Despite the sensor having 8 visible channels, only 6 are used in each measurement. This is caused by the only 6 ADCs present, which can be individually assigned to each channel. For a full 8 channels spectra, it would be necessary to reassign the ADC mid measurement. Which can be done by modifying the python code, but for simplicity and faster integration time, only 6 channels were recorded in each measurement.
5.2. Application in Capillary Electrophoresis
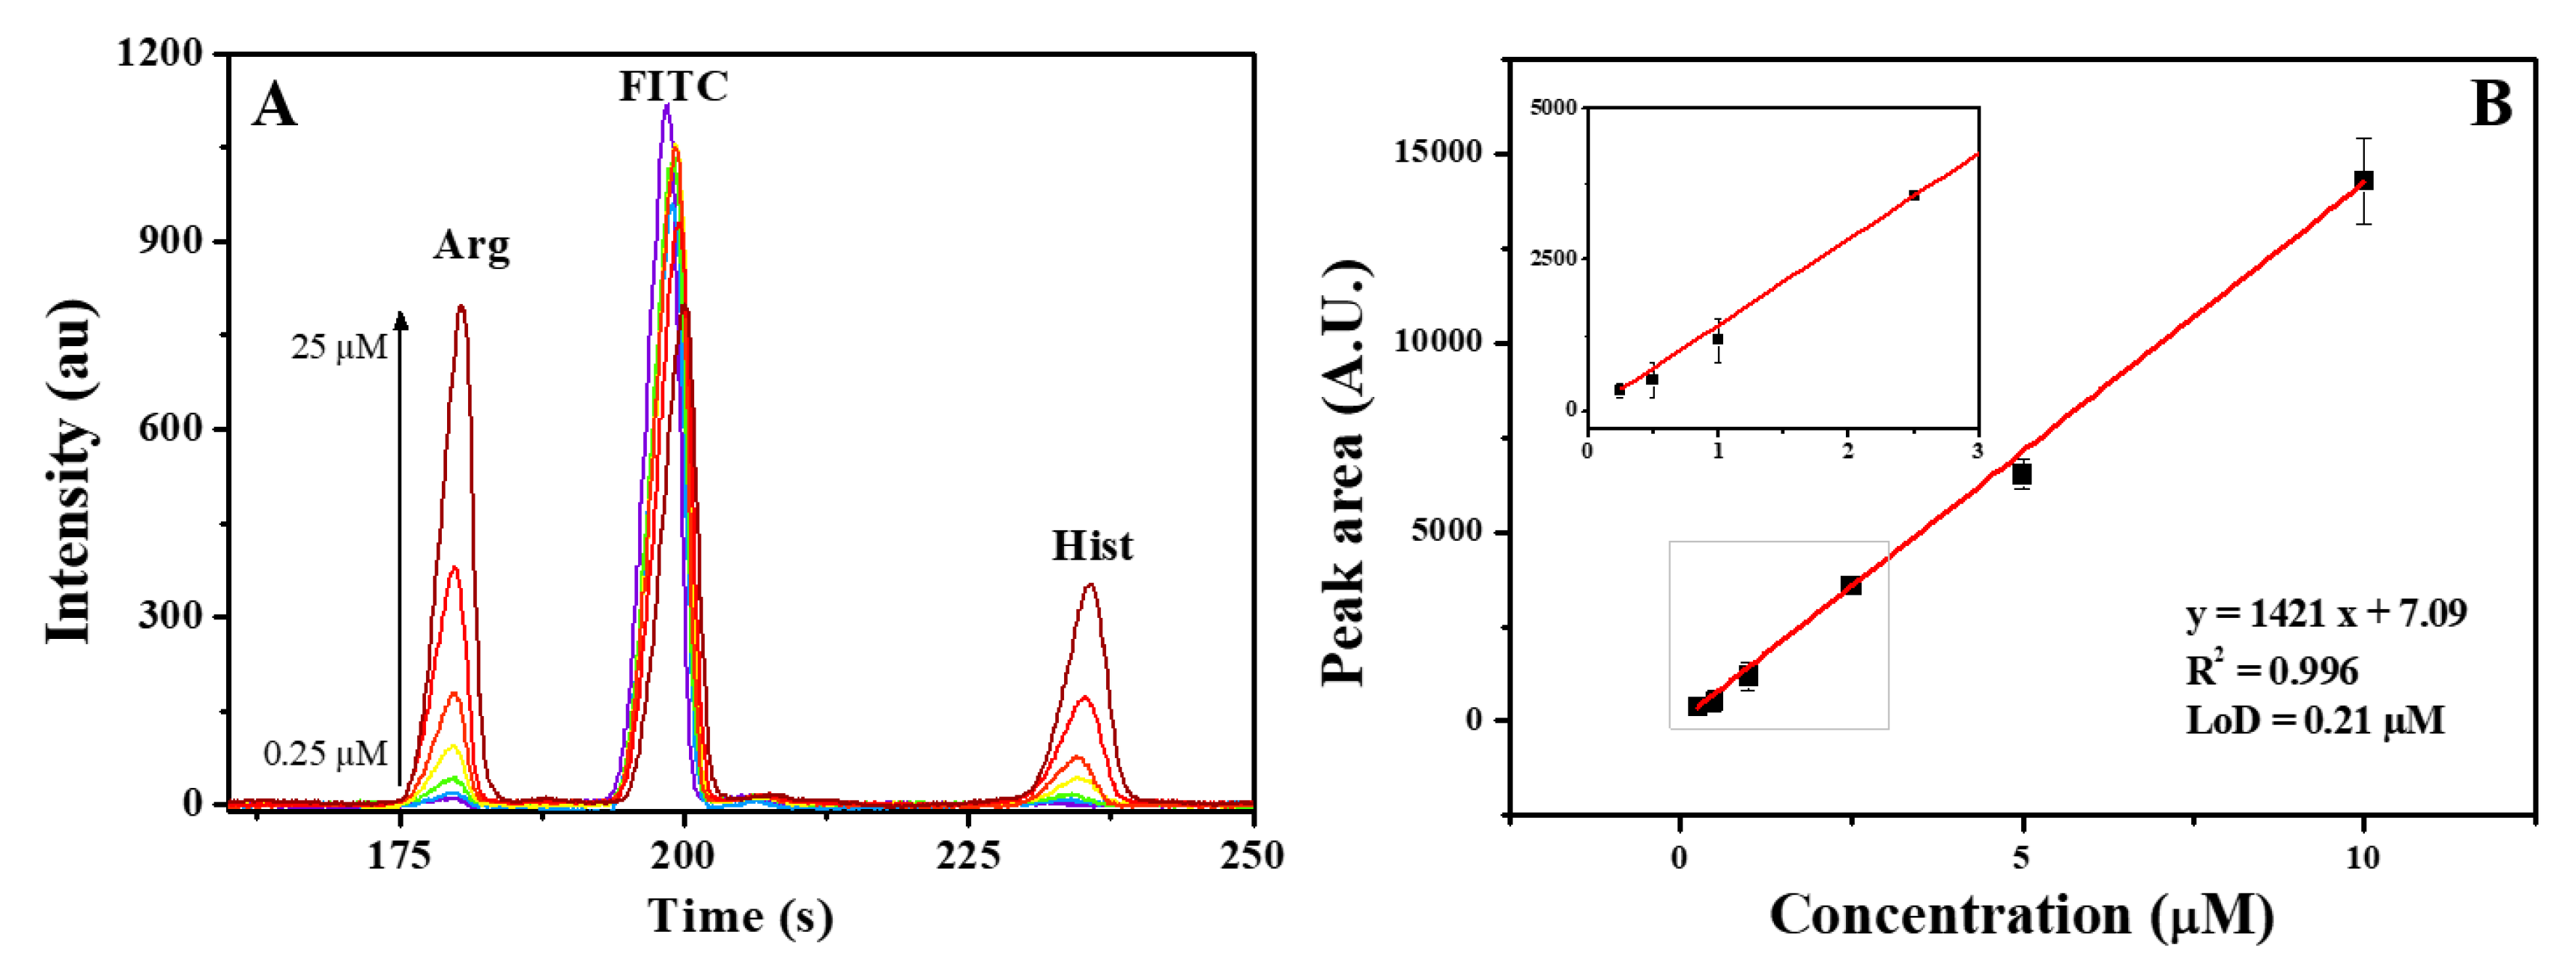
To demonstrate the applicability of this sensor in separation analyses, this sensor was used for detecting two amino acids derivatized with FITC and separated by using capillary electrophoresis. The separation was carried out in a standard 100 µm fused silica capillary and a cheap blue laser (450 nm) was utilized as the excitation source.
The main parameter that is tunable in this sensor is the integration time. A higher integration time will result in higher sensitivity and lower noise but also will result in a lower data acquisition sampling, which will lead to a worse peak resolution in the electropherograms. So, a balance between sensitivity and resolution must be made. The measurements displayed at Figure 3 were recorded with 0.1 s, which made it possible to achieve a limit of detection of 210 nmol L-1 of arginine while maintaining a high-resolution signal.
This LoD is far from the limits offered by laser-induced fluorescence detection (LIF), that often has detection limits in pM [13]. However, considering the simplicity of the electronic design and that arginine and histidine concentrations on urine is, on average, 88 and 61 µmol L-1 [22], respectively, this sensor is sensitive enough for many applications involving monitoring biomarkers.
Another aspect that can improve the sensitivity is the light source. In this case a 450-nm 5-mW diode laser was used. This light is far from the ideal 495 nm for exciting fluorescein. But, considering this laser diode cost only 10 USD, the whole detection system was built for around 25 USD, including the sensor, laser, 3D printed parts and microcontroller, showing the potential of this compact sensor for bioanalyses in low-cost devices.
6. Conclusions
This new class of sensors shows great potential for lab on a chip devices. Allowing for small devices with multispectral capabilities, while only 10 USD, maintaining analytical accuracy and providing more flexibility for different analyses. The devices fabricated so far achieved limits of detection of 22 nM for fluorescein detection in direct measurements on the microfluidic channel. Also, when coupled to capillary electrophoresis separation system, it was possible to detect concentrations of arginine above 210 nM, reflecting a huge potential for applications in bioanalysis.
Supplementary Materials
The following supporting information can be downloaded at: Preprints.org.
| Name | Type | Description |
| S1 | Word (.docx) | Supplementary material |
| S2 | Program (.py) | Micropython code simple dada acquisition with AS7341 |
| S3 S4 |
CAD (.step) CAD (.step) |
CAD model for AS7341 with capillary CAD model for AS7341 channel device |
Author Contributions
Conceptualization, M.S.K; methodology, M.S.K; software, M.S.K.; validation, M.S.K; investigation, M.S.K.; resources, J.A.F.S.; writing—original draft preparation, M.S.K.; writing—review and editing, J.A.F.S.; supervision, J.A.F.S. All authors have read and agreed to the published version of the manuscript.
Funding
This research was funded by São Paulo Research Foundation (FAPESP), grant number 2024/09879-0, CAPES, grant number 88887.950443/2024-00, and National Council for Scientific and Technological Development (CNPq), grant numbers 313532/2023-0 and 408338/2024-5.
Institutional Review Board Statement
Not applicable.
Informed Consent Statement
Not applicable.
Data Availability Statement
Data will be made available on request.
Conflicts of Interest
The authors declare no conflict of interest.
References
- Krakos, A. Lab-on-Chip Technologies for Space Research — Current Trends and Prospects. Microchimica Acta 2024, 191, 1–21. [Google Scholar] [CrossRef]
- Zhuang, J.; Yin, J.; Lv, S.; Wang, B.; Mu, Y. Advanced “Lab-on-a-Chip” to Detect Viruses – Current Challenges and Future Perspectives. Biosens Bioelectron 2020, 163, 112291. [Google Scholar] [CrossRef] [PubMed]
- Lim, Y.C.; Kouzani, A.Z.; Duan, W. Lab-on-a-Chip: A Component View. Microsystem Technologies 2010, 16, 1995–2015. [Google Scholar] [CrossRef]
- Verma, N.; Pandya, A. Challenges and Opportunities in Micro/Nanofluidic and Lab-on-a-Chip. Prog Mol Biol Transl Sci 2022, 186, 289–302. [Google Scholar] [CrossRef]
- Nosrati, R. Lab on a Chip Devices for Fertility: From Proof-of-Concept to Clinical Impact. Lab Chip 2022, 22, 1680–1689. [Google Scholar] [CrossRef] [PubMed]
- Battat, S.; Weitz, D.A.; Whitesides, G.M. An Outlook on Microfluidics: The Promise and the Challenge. Lab Chip 2022, 22, 530–536. [Google Scholar] [CrossRef] [PubMed]
- Reyes, D.R.; Van Heeren, H.; Guha, S.; Herbertson, L.; Tzannis, A.P.; Ducree, J.; Bissig, H.; Becker, H. Accelerating Innovation and Commercialization through Standardization of Microfluidic-Based Medical Devices. Lab Chip 2021, 21, 9–21. [Google Scholar] [CrossRef]
- Mohammed, M.I.; Haswell, S.; Gibson, I. Lab-on-a-Chip or Chip-in-a-Lab: Challenges of Commercialization Lost in Translation. Procedia Technology 2015, 20, 54–59. [Google Scholar] [CrossRef]
- Chiadò, A.; Palmara, G.; Chiappone, A.; Tanzanu, C.; Pirri, C.F.; Roppolo, I.; Frascella, F. A Modular 3D Printed Lab-on-a-Chip for Early Cancer Detection. Lab Chip 2020, 20, 665–674. [Google Scholar] [CrossRef]
- Fernandes Quero, R.; de Jesus, D.P.; Fracassi da Silva, J.A. Simple Modification to Allow High-Efficiency and High-Resolution Multi-Material 3D-Printing Fabrication of Microfluidic Devices. Lab Chip 2023, 23, 3694–3703. [Google Scholar] [CrossRef]
- Gyimah, N.; Scheler, O.; Rang, T.; Pardy, T. Can 3D Printing Bring Droplet Microfluidics to Every Lab?—A Systematic Review. Micromachines 2021, 12, 339. [Google Scholar] [CrossRef]
- Zacharioudaki, D.E.; Fitilis, I.; Kotti, M. Review of Fluorescence Spectroscopy in Environmental Quality Applications. Molecules 2022, 27, 4801. [Google Scholar] [CrossRef]
- Taylor, A.T.; Lai, E.P.C.; Taylor, A.T.; Lai, E.P.C. Current State of Laser-Induced Fluorescence Spectroscopy for Designing Biochemical Sensors. Chemosensors 2021, 9, 275. [Google Scholar] [CrossRef]
- Măriuţa, D.; Colin, S.; Barrot-Lattes, C.; Le Calvé, S.; Korvink, J.G.; Baldas, L.; Brandner, J.J. Miniaturization of Fluorescence Sensing in Optofluidic Devices. Microfluidics and Nanofluidics 2020, 24, 1–28. [Google Scholar] [CrossRef]
- Guo, L.; Feng, J.; Fang, Z.; Xu, J.; Lu, X. Application of Microfluidic “Lab-on-a-Chip” for the Detection of Mycotoxins in Foods. Trends Food Sci Technol 2015, 46, 252–263. [Google Scholar] [CrossRef]
- Costa, B.M.C.; Bressan, L.P.; de Jesus, D.P.; da Silva, J.A.F. Simultaneous Determination of Tryptophan and 5-hydroxytryptophan in Dietary Supplements using Capillary Zone Electrophoresis and Capacitively Coupled Contactless Conductivity Detection. Braz. J. Anal. Chem. 2025, 12, 107–117. [Google Scholar] [CrossRef]
- Cardoso, N.M.; Pereira, B.K.; da Silva, J.A.F.; de Jesus, D.P. Simple and Fast Determination of Carbaryl Pesticide in Commercial Topical Formulations by Capillary Electrophoresis. Braz. J. Anal. Chem. 2025, 12, 158–169. [Google Scholar] [CrossRef]
- da Silva, J.A.F.; de Castro, N.V.; de Jesus, D.P.; Faria, A.F.; de Souza, M.V.N.; de Oliveira, M.A.L. Fast determination of ethambutol in pharmaceutical formulations using capillary electrophoresis with capacitively coupled contactless conductivity detection. Electrophoresis 2010, 31, 570–574. [Google Scholar] [CrossRef] [PubMed]
- Takizawa, K.; Nakamura, H. Separation and Determination of Fluorescein Isothiocyanate-Labeled Amino Acids by Capillary Electrophoresis with Laser-Induced Fluorescence Detection. Analytical Sciences 1998, 14, 925–928. [Google Scholar] [CrossRef]
- Dytrtová, J.J.; Moslova, K.; Jakl, M.; Sirén, H.; Riekkola, M.-L. Fluorescein Isothiocyanate Stability in Different Solvents. Monatsh Chem 2021, 152, 1299–1306. [Google Scholar] [CrossRef]
- Data fluorescein & rhodamine.
- Dereziński, P.; Klupczynska, A.; Sawicki, W.; Pałka, J.A.; Kokot, Z.J. Amino Acid Profiles of Serum and Urine in Search for Prostate Cancer Biomarkers: A Pilot Study. Int J Med Sci 2017, 14, 1. [Google Scholar] [CrossRef] [PubMed]
Figure 1.
Comparison of spectrum obtained by a commercial UV-Vis (light gray solid line) spectrometer and by the AS7341 multispectral sensor (red squares and lines) for different LEDs. The red squares were the signal output value obtained from each channel. The wavelength for each channel represents the maximum response of a given channel. The intensity was normalized.
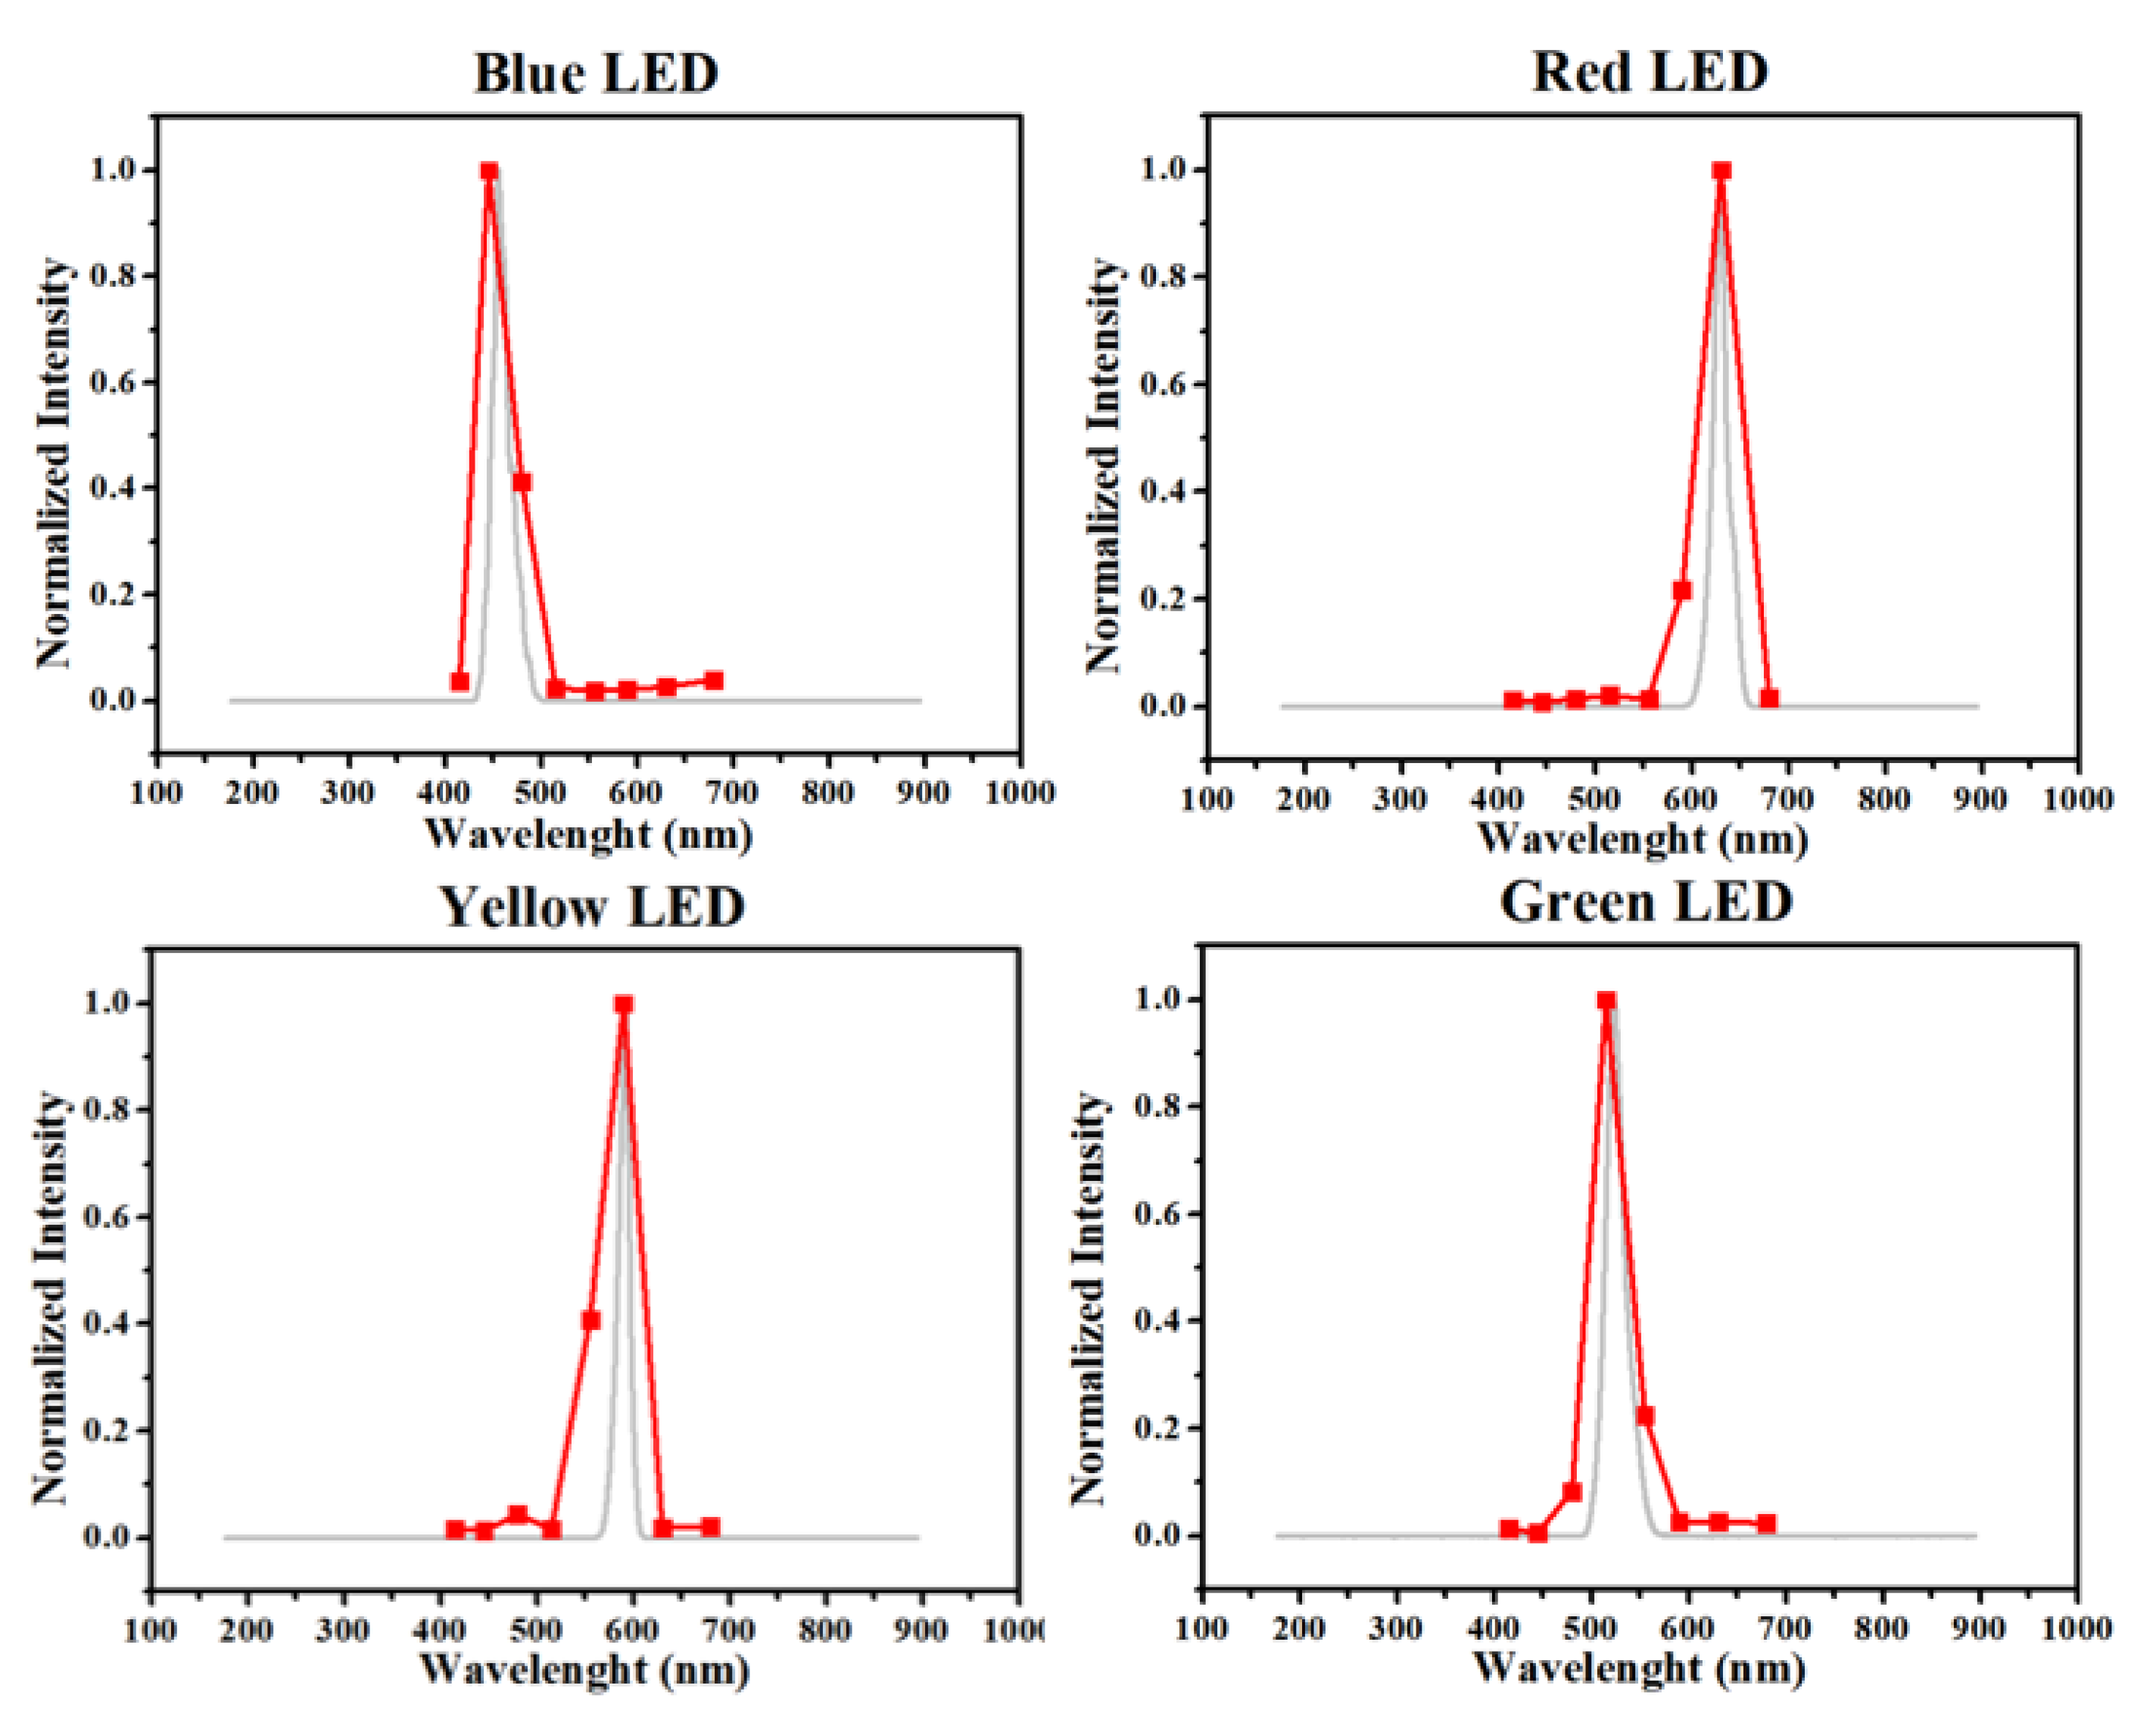
Figure 2.
Calibration curves for fluorescein using channel F4 (left) and rhodamine B in channel F6 (right), integration time was set at 0.11 seconds for all measurements and both curves were made in triplicate, full spectra for these measurements is presented at S4.
Figure 2.
Calibration curves for fluorescein using channel F4 (left) and rhodamine B in channel F6 (right), integration time was set at 0.11 seconds for all measurements and both curves were made in triplicate, full spectra for these measurements is presented at S4.
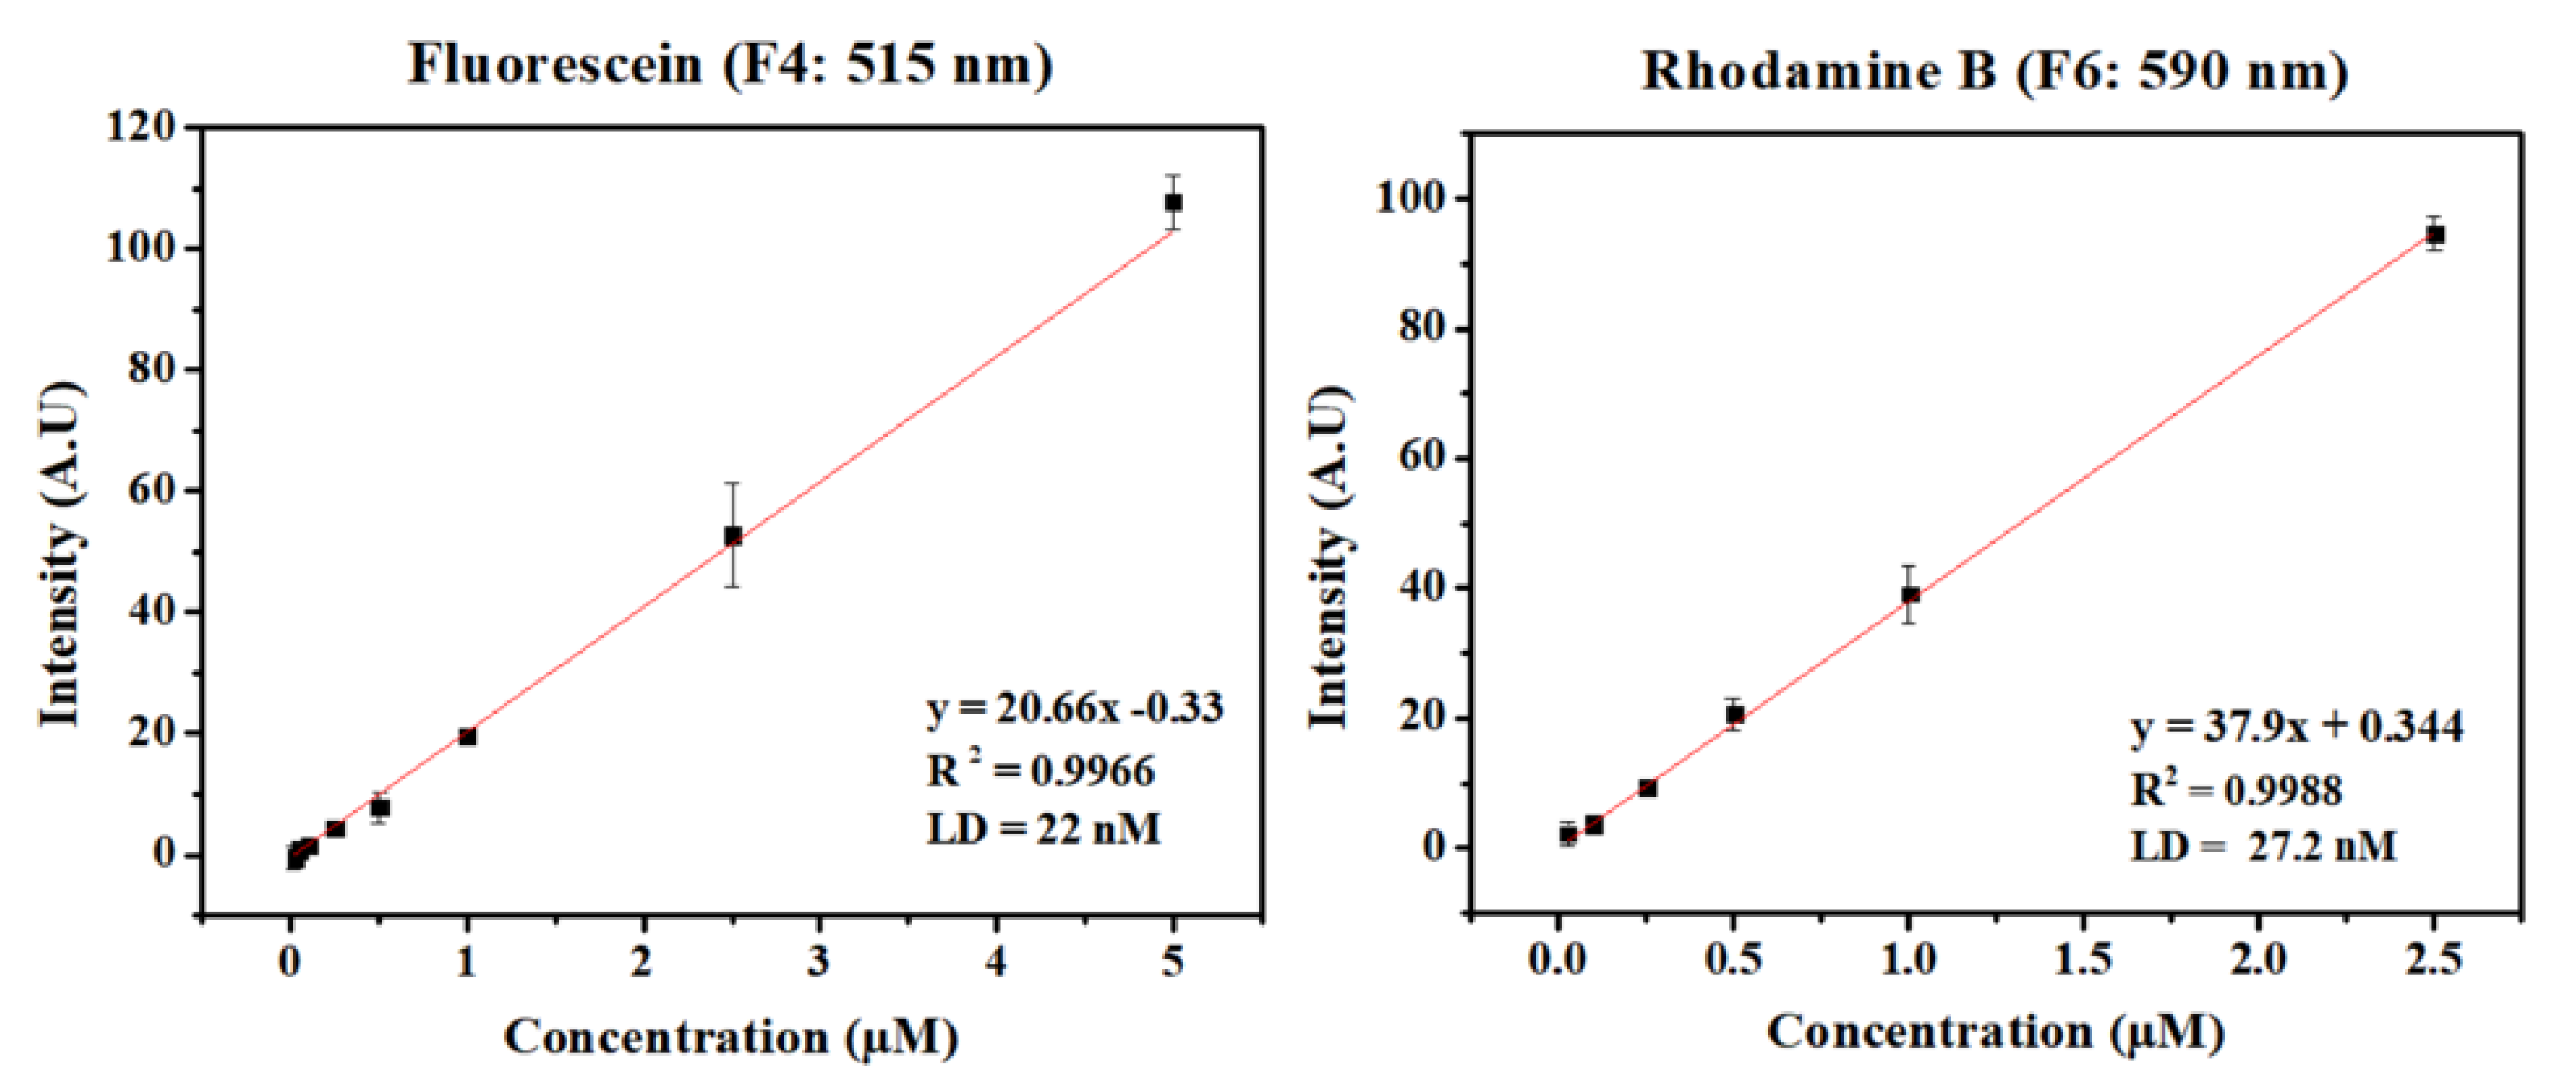
Figure 3.
Electropherograms recorded using AS7341 (A) and analytical curve constructed using the peak area of arginine peaks (B)(n=3).
Figure 3.
Electropherograms recorded using AS7341 (A) and analytical curve constructed using the peak area of arginine peaks (B)(n=3).
Disclaimer/Publisher’s Note: The statements, opinions and data contained in all publications are solely those of the individual author(s) and contributor(s) and not of MDPI and/or the editor(s). MDPI and/or the editor(s) disclaim responsibility for any injury to people or property resulting from any ideas, methods, instructions or products referred to in the content. |
© 2025 by the authors. Licensee MDPI, Basel, Switzerland. This article is an open access article distributed under the terms and conditions of the Creative Commons Attribution (CC BY) license (http://creativecommons.org/licenses/by/4.0/).
Copyright: This open access article is published under a Creative Commons CC BY 4.0 license, which permit the free download, distribution, and reuse, provided that the author and preprint are cited in any reuse.


