
Submitted:
11 November 2025
Posted:
13 November 2025
You are already at the latest version
Abstract
Aiming to obtain chemicals from renewable sources to mitigate global warming, the catalytic pyrolysis of tamarind pulp, obtained from juice industries, was studied. Catalysts based on HZSM-5 zeolite prepared from rice husk ash using ultrasound, microwaves, and a combination of both were employed. The catalysts were characterized by elemental analysis, X-ray diffraction, specific surface area and porosity measurements, scanning electron microscopy, and acidity measurements. The specific surface areas and the micropore volumes were slightly affected by the treatments, microwave alone or combined with ultrasound, having the strongest effect. The number of acid sites increased, and the relative number of strong sites decreased with the treatments. The relative amount of Bronsted to Lewis sites was increased by ultrasound and decreased by microwave, alone or combined. These catalysts decreased oxygenated products and increased BTEX production during tamarind pulp pyrolysis. The product distribution was similar for all cases, meaning that HZSM-5 with the following characteristics are selective catalysts to BTEX in tamarind pulp pyrolysis: specific surface area= 310-347 m2/g; micropore volume= 0.099-0.105 cm3/g; acidity= 327 to 571 µmol NH3/gcat and Bronsted to Lewis acid sites ratio= 0.034 to 0.044.
Keywords:
HZSM-5
; tamarind
; fast pyrolysis
; benzene
; toluene
; ethylbenzene
; xylenes
; BTEX
1. Introduction
Since the Industrial Revolution, the human-environment relationship has focused on maximizing commodity production for providing a comfortable life to society. However, industrialization and fossil fuels severely stress global ecosystems via atmospheric emissions and indiscriminate waste disposal. This disrupts critical biogeochemical processes, causing significant climatic alterations, notably the rise in global mean temperature [1]. The petroleum industry has been historically identified as a major contributor to environmental pollution. Fossil fuel combustion releases carbon monoxide and carbon dioxide, the latter exacerbating the greenhouse effect, in addition to producing nitrogen oxides (NOx) and sulfur oxides (SOx), which contribute to acid rain and photochemical smog [2]. Restoring climate balance critically requires reducing energy dependence on petroleum-derived fuels and promoting greater use of renewable energy sources such as wind, solar, hydropower and biomass [3].
Biomass is considered a 100% renewable resource since its chemical energy is solar-derived through photosynthesis [4,5]. It can be converted into energy via thermochemical processes to yield heat and electricity (cogeneration), synthesis gas (syngas), and valuable chemical products, including biofuels [6]. Among these processes, pyrolysis emerges as a major route, because of its economy, flexibility and simplicity [7]. The most advanced regime, flash pyrolysis, is distinguished by achieving virtually instantaneous heating by introducing the biomass directly into a pre-heated reactor. This approach represents the optimal condition for achieving the highest bio-oil yield [8,9].
However, the major constituents of biomass pyrolysis oil encompass a diverse array of oxygenated organic compounds, including carboxylic acids, ketones, phenols and their derivatives, furans, sugars, aldehydes, and alcohols [10]. This intrinsic compositional complexity and high oxygen content critically confer undesirable properties to bio-oil, specifically low heating value, chemical instability, and high corrosivity [10,11]. Consequently, comprehensive upgrading processes are mandatory for effective utilization as a fuel source or as a platform chemical feedstock.
An effective strategy to overcome these drawbacks is the in situ application of heterogeneous catalysts to directly hydrodeoxygenate the pyrolysis vapors. This approach yields a higher-quality bio-oil enriched in hydrocarbons, demonstrating superior product selectivity compared to conventional non-catalytic thermal pyrolysis [10,12]. The most widely employed catalysts used in pyrolysis are zeolites, favored for their exceptional characteristics such as high specific surface area, well-defined microporous structure, and significant Brønsted and Lewis acidity, properties indispensable for promoting the key hydrodeoxygenation (HDO) reaction pathways [12].
Keeping these ideas in mind, this work deals with the convergence of two residual biomass valorization strategies for obtaining high value-added products. While rice husk ash is a sustainable silica source for catalytic zeolite synthesis, tamarind pulp (Tamarindus indica L.) is the biomass feedstock for pyrolysis.
Tamarind, a widely cultivated tropical fruit, yields a significant agro-industrial residue, as its pulp (a byproduct of the juice industry), constitutes approximately 30% of the fruit mass [13]. Several studies have investigated the potential of tamarind seed husks for producing value-added chemicals. Keder et al. [14], for instance, performed tamarind seed pyrolysis at different temperatures and obtained the maximum bio-oil yield of 45 wt.% at 400 ℃. Moreover, Makhairas and Pugazhvadivu [15] used microwave pyrolysis of tamarind seeds to extract high quality bio-oil (36%) with higher calorific value than the bio-oil produced by traditional pyrolysis.
Tamarind seed husk biomass has been explored to study its slow pyrolysis behavior and potential for bio-oil and biochar production. The first study on slow pyrolysis of seed husk of tamarind with detailed characterization of pyrolysis products and in-depth investigations into the breaking pathways during pyrolysis was carried out by Kaur et. al. [16], from 300 to 450 ℃. They concluded that 400 °C is the optimized temperature for bio-oil production (yield= 38.8 wt.%; conversion= 67.1%). Furthermore, ketones, aldehydes, carboxylic acids, furans, phenolics and N-containing functionalities are the main products and thus bio-oil can be a source of functional chemicals. However, as far as we know, no work has been reported on catalytic pyrolysis of seed husk of tamarind. The use of catalysts can provide the control of reactions towards the desirable products, for instance, high value benzene, toluene, ethylbenzene and xylenes (BTEX).
On the other hand, the demand for high-purity silica in zeolite synthesis is a significant cost driver. Therefore, utilizing rice husk ash as a silicon precursor emerges as a robust strategy for circular economic implementation and process cost reduction. Brazil, being one of the largest rice producers outside Asia, generates this agro-industrial byproduct on a massive scale [17]. Due to its high calorific value, rice husk is primarily valued in thermal power plants for bioenergy generation. The ash resulting from this thermal combustion can achieve purity exceeding 90%, meeting the reactivity requirements for the synthesis of zeolites, such as ZSM-5 [18,19].
2. Materials and Methods
2.1. Biomass Preparation and Characterization
The tamarind pulp residue (TP) was dried at ambient conditions, for 15 days, subsequently ground to fine powder by pestle and mortar and sieved to 100 mesh. The resulting material was characterized by elemental analysis of carbon, hydrogen and nitrogen (CHN), in a 2400 Series II Perkin Elmer equipment and by thermogravimetry in a TGA (Q50 V.67 Build 203) Exapro equipment, from 25 to 700 ºC at a heating rate of 5 ºC/min under nitrogen flow.
2.2. Catalysts Preparation
The samples were synthesized according to the methodology adapted from Bortolini et al. [20], using crystallization seeds and rice husk ash (RHA) as a silica source, without any organic template. The RHA was obtained by burning rice husks in a fluidized bed during the rice processing and industrialization companies in Rio Grande do Sul, Brazil.
During zeolite preparation, an acidic aqueous solution containing aluminum sulfate and sulfuric acid was slowly dropped on a basic aqueous solution of sodium hydroxide and the silica source (RHA) under vigorous stirring. The mixture was then kept under constant stirring at 25 °C, for 60 min, to form the hydrogel. The hydrogel was transferred to a Teflon vessel containing ZSM-5 zeolite seeds (CBV 2314, Zeolyst) and autoclaved. This system was kept in an oven at 190 °C, for 24 h. The solid was then vacuum filtered and washed with deionized water until the conductivity was less than 50 μS/m. The sample was dried at 80 °C for 12 h to get the Z sample.
Other samples were treated with ultrasound (NI1201D, Nova Instruments) and microwave (ME044, Electrolux) to improve the dissolution and homogenization of the reactants. In order to obtain the ZU sample, the basic solution was kept under an ultrasonic bath for 10 min before the addition of the acidic dispersion. The remaining subsequent steps followed the same methodology. For preparing the ZM sample, the resulting gel was kept for 30 s under microwave (760 W), followed by the same steps described. Another sample (ZUM) was got by using both treatments, under the same conditions already described.
The acidic form of the zeolites was obtained by ion exchange, using a heated ammonium nitrate solution (80 °C) and keeping the dispersion under stirring, for 2 h. Subsequently, the material was vacuum filtered and washed with deionized water until an electrical conductivity of less than 50 μS/m was obtained. The samples were then dried at 80 °C, for 12 h and then calcined for 2 h, at 600 °C to obtain the zeolites in their acidic form (HZ, HZU, HZM, and HZUM samples).
2.3. Rice Husk ash Characterization
The rice husk ash used as a source of silica was characterized by X-ray fluorescence (XRF), X-ray diffraction (XRD), specific surface area (Sg) measurements, scanning electron microscopy (SEM), and temperature programmed desorption of ammonia (NH3-TPD).
The chemical composition of the ash was determined by the X-Ray Fluorescence technique (XRF), using a WD-FRX model RIX 3100 Rigaku Dengui equipment. Quantitative analysis was performed using the fused sample technique with a calibration curve from rock patterns and artificial patterns for the most found element (manganese). The loss on ignition (LOI) was performed by heating 2 g of the sample to 1000 °C, the value being obtained by the difference in sample mass before and after being heated to 1000 °C.
2.4. Catalysts Characterization
The silicium and aluminum contents of the catalysts were determined by X-ray Fluorescence (XRF) technique, using the S2 Puma XRF model Bruker equipment. The analyses were carried out using a sample cup for XRF and 6μ Mylar Film in a Helium atmosphere.
The X-ray diffractograms were obtained in a D2 Phaser Bruker equipment, using Cu-Kα radiation. The specific surface area and porosity measurements were carried out in a NOVA 4200e model Quantachrome apparatus. Prior to experiments, the sample was heated at 300 °C, for 3 h, under vacuum. The specific surface area (Sg) was calculated using the BET method and the micropore volume (Vmicro) was obtained by t-plot method. The morphology of the samples was observed by scanning electron microscopy (SEM). An EVO 10 model Zeiss equipment working at a 10 kV accelerating voltage was used. Before the analysis, the samples were placed on aluminum brackets with carbon tape and metalized with gold.
The acidity of the samples was measured by temperature-programmed desorption of ammonia (NH3-TPD) using a QME 200 model Pfeiffer quadrupole mass spectrometer. First, the sample was heated at 550 °C for 60 min, under helium flow (60 mL.min−1). Then, adsorption of NH3 was performed under a flow (60 mL.min−1) of 4 vol% NH3/He mixture, at 70 °C, for 30 min. Before heating, the sample was purged by helium flow for 60 min. Then, the temperature was raised up (20 oC. min−1) to 800 °C, under helium flow.
The Bronsted and Lewis acid sites of the catalysts were identified by Fourier transform infrared (FTIR) spectroscopy on samples previously adsorbed with pyridine. The catalyst (around 10 mg) was exposed to pyridine vapor for 15 h, dried at 100 ◦C for 18 h, cooled at room temperature and then analyzed in a FT-IR/NIR model Frontier equipment. The spectra were deconvoluted to calculate the Bronsted to Lewis acid sites ratio.
2.5. Catalyst Evaluation
The catalysts were evaluated in the fast pyrolysis of tamarind pulp residue, using an EGA/Py-3030D model Frontier equipment coupled to a QP2010-Ultra Shimadzu gas chromatograph-Mass Spectrometer (CG/MS). Non-catalytic pyrolysis was also performed. For each run, a mixture of 0.88 mg of biomass and 4.4 mg of catalyst (catalyst/biomass ratio= 5:1) was used. Pyrolysis was performed at 550 °C for 1 min, under helium (99.999% purity) flow a (100 mL·min−1). Condensable vapors were fed to the GC/qMS via an injector port at 280 °C, operating in split mode (1:30). For separation, an SH-5MS capillary column (30 m x 0.25 mm x 0.25 μm Crossbond 5% diphenyl/95% dimethyl polysiloxane) was used. All experiments were performed in duplicate. The compound identification was tentatively achieved via retention indices and mass spectral data. Semi-quantitative analysis was performed by determining the chromatographic peak area percentage for each compound.
3. Results and Discussion
3.1. Biomass Characterization
The elemental analysis showed that the tamarind pulp is made of 43.26% carbon, 5.10% hydrogen, and 1.35% nitrogen, the remaining 50.29% being attributed to oxygen. This composition immediately highlights the high oxygen content and the notably low H/C ratio of approximately 0.12, which is characteristic of biomass [21,22].
The thermogravimetric curve (Figure 1) shows two weight losses. The first one, up to 110 ºC, is attributed to the loss of volatiles adsorbed on biomass, corresponding to a weight loss of 6.85%. The second event is associated with the successive degradation of hemicellulose, cellulose, and lignin. The final residue (27.9%) is related to the ash content and fixed carbon generated during analysis.
3.2. Rice Husk Ash Characterization
Table 1 presents the RHA composition obtained through XRF analysis. It is observed that it has high silica content, small amount of alumina, and few impurities. Similar results for rice husk ash were observed by Dey et al. [23] and Khoshbin & Karimzadeh [24]. Because of the high silicon content, RHA was used directly in the synthesis of ZSM-5 zeolite, without any prior treatment.
3.3. Catalyst Characterization
3.3.1. Si/Al Ratio Results
Table 2 shows that the Si and Al content remained similar across all zeolites. However, ultrasound and microwave treatments slightly reduced the Si/Al ratio. The combined treatment (ultrasound plus microwave) sample exhibited the lowest Si/Al, ratio.
3.3.2. X-Ray Diffraction Results
3.3.3. Textural Properties Results
The nitrogen adsorption-desorption isotherms for the synthesized samples are shown in Figure 3. All samples show Type I isotherms, which are characteristic of zeolites and other primary microporous solids. Some interparticle mesopores were also observed at higher pressures. The values of specific surface area range between 310 and 347 m2.g−1, which are also typical of ZSM-5. One can see that the different treatments change micropore volumes, the samples treated with microwave showing the highest values, in accordance with previous work [26,27]. However, the treatment with ultrasound alone slightly decreased the micropore volume, as found previously [28].

Table 3.
Textural properties of zeolite-based catalysts. HZ: HZSM-5 zeolite without any treatment; HZU: HZSM-5 treated with ultrasound; HZM: HZSM-5 treated with microwave; HZUM: HZSM-5 treated with both ultrasound and microwave.
Table 3.
Textural properties of zeolite-based catalysts. HZ: HZSM-5 zeolite without any treatment; HZU: HZSM-5 treated with ultrasound; HZM: HZSM-5 treated with microwave; HZUM: HZSM-5 treated with both ultrasound and microwave.
| Samples | Sg (m2/g) | Vmicro (cm3/g) |
| HZ HZU HZM HZUM |
322 310 342 347 |
0.099 0.096 0.105 0.100 |
3.3.4. Acidity Results
Figure 4 presents the NH3-TPD curves for the samples. All catalysts exhibit two desorption peaks, the first one centered at around 250 °C, related to weak acid sites. The second peak, with a maximum around 450 °C, is related to moderate and strong acid sites [29]. After deconvolution of the curves by the Lorentzian method, the number of weak, moderate, and strong acid sites was calculated, and the values are shown in Table 4. Weak, moderate and strong acid sites were considered those between 150 and 250 °C; 250 and 400 °C, and 400 and 600 °C, respectively.
It can be noted that the different treatments markedly changed the strength and amount of acid sites. The total acidity decreased in the order: HZUM > HZU > HZM > HZ, indicating that the treatments increased the number of acid sites, ultrasound alone or combined with microwave being the most effective. However, it is observed that the use of ultrasound alone does not significantly alter the relative amount of acid sites with different strengths, while microwaves increase the relative amount of weak acid sites and decrease the strong acid sites. The combined treatment decreases the weak acid sites and increases the moderate ones. Furthermore, it is noted that ultrasound shifts the peak of moderate acid sites to lower temperatures, while the microwave does the opposite. The combined treatment led to major changes, the HZUM sample showing mostly moderate and strong acid sites. The majority of the samples (HZ, HZU, and HZUM) presented strong acid sites (> 59%), HZ showing the highest relative amount (63.8%). As a whole the treatments decreased the relative amounts of strong acid sites and increased the moderate sites. The relative amount of Bronsted to Lewis acid sites in the catalysts was also affected by the treatments, as shown in Table 5. In a general tendency, ultrasound increases the relative amount of Bronsted sites while microwave, alone or combined, does the opposite.
3.3.5. SEM Results
The SEM images of the catalysts is displayed in Figure 5. All catalysts predominantly exhibit a coffin-shaped morphology characteristic ZSM-5 zeolite [30], indicating that the treatment does not alter the particles shape. However, microwave caused certain “hole-like” imperfections in the formed crystals, which may be associated with the increased mesopore volume among the particles, as noted for HZM and HZUM samples.
3.3.6. Catalytic Evaluation Results
Table 5 shows the compounds obtained from tamarind pyrolysis. High concentration of oxygenated compounds and a low content of hydrogenated compounds were found in bio-oil. This is expected, since biomasses typically exhibit a low H/C ratio and high oxygen content, as shown by CHN analysis. This concentration of oxygenated compounds (78.1 ± 1.3%) is similar to previous works on the pyrolysis of tamarind [16] and other lignocellulosic materials [31,32]. A drastic catalytic effect was observed for all samples. The catalysts caused an increase of hydrogenated fraction up to 89.7% and 92.3%, while simultaneously reducing the oxygenated fraction to values between 7.5% and 9.0%.
Table 5.
Compounds formed during the catalytic and non-catalytic pyrolysis of tamarind bagasse. TP: tamarind; HZ: HZSM5 without any treatment; HZU: HZSM5 treated with ultrasound; HZM: HZSM5 treated with microwave; HZUM: HZSM5 treated with both ultrasound and microwave.
Table 5.
Compounds formed during the catalytic and non-catalytic pyrolysis of tamarind bagasse. TP: tamarind; HZ: HZSM5 without any treatment; HZU: HZSM5 treated with ultrasound; HZM: HZSM5 treated with microwave; HZUM: HZSM5 treated with both ultrasound and microwave.
| Compounds | TP | TP + HZ | TP + HZU | TP + HZM | TP + HZUM |
| Hydrogenated Oxygenated Nitrogenous |
19.4 ± 1.2% 78.1 ± 1.3% 2.6 ± 0.1% |
89.7 ± 1.3% 9.0 ± 1.1% 1.2 ± 0.3% |
91.3 ± 0.0% 8.3 ± 0.1% 0.4 ± 0.0% |
92.3 ± 0.1% 7.5 ± 0.2% 0.3 ± 0.0% |
92.0 ± 0.6% 7.6 ± 0.7% 0.4 ± 0.6% |
Figure 6 shows the distribution of compounds in bio-oil produced from catalytic and non-catalytic pyrolysis. The non-catalytic biomass pyrolysis (TP) resulting bio-oil which is dominated by unstable oxygenated compounds, primarily phenols, sugars, ketones, and others (furans, fatty acids, alcohols). These findings are typical of biomass pyrolysis, according to previous works [16,31,32]. Furthermore, the BTEX fraction is very low (4.7 ± 0.9%) and the undesirable polyaromatic hydrocarbons (PHA) are not produced under these conditions.
The introduction of the catalysts promotes a massive conversion of oxygenated compounds into monoaromatic hydrocarbons (BTEX and other MHA), thus indicating a drastic increase in bio-oil quality. The bio-oil composition becomes dominated by BTEX (ranging from 61.5 to 64.2%) and PHA (ranging from 18.4 to 21.5%). Furthermore, there is a sharp reduction in undesirable compounds: phenol drops to 2.4–6.8%; sugars are nearly eliminated, especially with HZU, HZM, and HZUM and ketones and carboxylic acids are drastically reduced to less than 1.0%.
Considering BTEX production, HZUM (64.2 ± 0.7%) is statistically superior to HZM and HZU, and also to HZ (61.5 ± 0.2%), although the difference was not remarkably expressive. The PHA is primarily composed of naphthalene, which is toxic and acts as coke precursors, despite having market value. Among the catalysts, HZU produced the highest amount of PHA (21.5 ± 0.3%), with this value being statistically superior to the others.
Figure 7 illustrates the differences found in chromatograms of non-catalytic and catalytic pyrolysis. Non-catalytic pyrolysis produces predominantly oxygenated compounds and some nitrogenated species. Conversely, catalytic pyrolysis produces mainly BTEX and naphthalenes. This is a valuable result, since these compounds are crucial feedstocks for the production of various chemical and petrochemical products. They are utilized in the synthesis of polymers, including polystyrene, nylon, polyurethane, synthetic rubbers, and polyester; they function as solvents in paints, adhesives, and coatings; and they serve as high-value gasoline additives [33]. The commercial importance and value of these products are evident in market projections: the estimated production volume for BTEX is expected to reach approximately 143 Million Tons in 2025, generating revenues of USD 269.1 billion, with an anticipated Compound Annual Growth Rate (CAGR) exceeding 7% [34].
The results show that HZSM-5 is an efficient catalyst to produce BTEX form tamarind pulp, regardless of the use of ultrasound and microwaves or their combination. These treatments cause changes in specific surface area, micropore volume, strength and distribution of acid sites and Bronsted to Lewis acid sites ratio but these changes are not enough to affect significantly the selectivity of the catalysts to BTEX. Therefore, it can be stated that HZSM-5 samples with specific surface area ranging from 310 to 347 m2/g, micropore volume from 0,099 to 0,105 cm3/g, acidity from 327 to 571 µmol NH3/gcat and Bronsted to Lewis acid sites ratio from 0,034 to 0,044 are efficient catalysts to produce BTEX.
5. Conclusions
Green HZSM-5 type zeolites were successfully obtained using rice husk ash and employing different treatment conditions, namely ultrasound, microwaves, and a combination of both. The different treatments slightly affect the specific surface area and the micropore volume, the samples treated with microwave alone or combined with ultrasound showing the highest values. As a whole, the treatments increase the number of acid sites and decrease the relative number of strong sites, the combined treatment causes a large decrease in weak sites. Ultrasound increases the relative amount of Bronsted to Lewis sites while microwave, alone or combined, does the opposite. These catalysts largely affect tamarind pyrolysis by decreasing oxygenated compounds and increasing BTEX production. However, no significant difference in the products distribution was found. It means that the HZSM-5 with the following characteristics are selective catalysts to BTEX in tamarind pulp pyrolysis: specific surface area from 310 to 347 m2/g, micropore volume from 0,099 to 0,105 cm3/g, acidity from 327 to 571 µmol NH3/gcat and Bronsted to Lewis acid sites ratio from 0,034 to 0,044.
Author Contributions
Conceptualization: all authors; methodology: L.C, D. S. L., and M. M. S.; software: L. C.; validation: all authors; writing—original draft preparation: all authors; writing—review and editing: all authors; visualization: all authors; supervision: M.C.R. and L.C.; project administration: M.C.R and L.C; funding acquisition: M.C.R. All authors have read and agreed to the published version of the manuscript.
Funding
This research was funded by FINEP (Financiadora de Estudos e Projetos), grant number 01.22.0231.00”.
Acknowledgments
The authors would like to acknowledge the financial support provided by FINEP and CAPES (Coordenação de Aperfeiçoamento de Pessoa de Nível Superior) for the PhD. Scholarship granted to L.C.
Conflicts of Interest
The authors declare no conflicts of interest. The funders had no role in the design of the study; in the collection, analyses, or interpretation of data; in the writing of the manuscript; or in the decision to publish the results.
Abbreviations
The following abbreviations are used in this manuscript:
| RHA | Rice Husk Ash |
| Z | ZSM5 zeolite without any treatment |
| ZU | ZSM5 zeolite treated with ultrasound |
| ZM | ZSM5 zeolite treated with microwave |
| ZUM | ZSM5 zeolite treated with ultrasound and microwave |
| HZ | HZSM5 zeolite without any treatment |
| HZU | HZSM5 zeolite treated with ultrasound |
| HZM | HZSM5 zeolite treated with microwave |
| HZUM | HZSM5 zeolite treated with ultrasound and microwave |
| NH3-TPD | Temperature Programmed Desorption of Ammonia |
| Sg | Specific Surface Area |
| SEM | Scanning Electron Microscopy |
| FTIR | Fourier Transform Infrared Spectroscopy |
| HDO | Hydrodeoxygenation reaction |
| BTEX | Benzene, Toluene, Ethylbenzene, and Xylenes |
| PHA | Polyaromatic Hydrocarbons |
| MHA | Monoaromatic Hydrocarbons |
| Py-GC/MS | Fast Catalytic Micropyrolysis |
References
- Causes and Effects of Climate Change. Available online: https://www.un.org/en/climatechange/science/causes-effects-climate-change (accessed on 15 October 2025).
- Mahala, K.R. The Impact of Air Pollution on living things and Environment: A review of the current evidence. WJARAI 2024, 24, 03. [Google Scholar] [CrossRef]
- Nunes, L.J.R. The Rising Threat of Atmospheric CO2: A Review on the Causes, Impacts, and Mitigation Strategies. Environments 2023, 10, 66. [Google Scholar] [CrossRef]
- Perea-Moreno, M.-A.; Samerón-Manzano, E.; Perea-Moreno, A.-J. Biomass as Renewable Energy: Worldwide Research Trends. Sustainability 2019, 11, 863. [Google Scholar] [CrossRef]
- Saleem, M. Possibility of utilizing agriculture biomass as a renewable and sustainable future energy source. Heliyon 2025, 11, 15. [Google Scholar] [CrossRef]
- Seo, M.W.; Lee, S.H.; Nam, H.; Lee, D.; Tokmurzin, D.; Wang, S.; Park, Y.-K. Recent advances of thermochemical conversion processes for biorefinery. Bioresource Technology 2022, 343. [Google Scholar] [CrossRef]
- Parvari, E.; Mahajan, D.; Hewitt, E.L. A Review of Biomass Pyrolysis for Production of Fuels: Chemistry, Processing, and Techno-Economic Analysis. Biomass 2025, 5, 54. [Google Scholar] [CrossRef]
- Aboelela, D.; Saleh, H.; Attia, A.M.; Elhenawy, Y.; Majozi, T.; Bassyouni, M. Recent Advances in Biomass Pyrolysis Processes for Bioenergy Production: Optimization of Operating Conditions. Sustainability 2023, 15, 11238. [Google Scholar] [CrossRef]
- Pahnila, M.; Koskela, A.; Sulasalmi, P.; Fabritius, T. A Review of Pyrolysis Technologies and the Effect of Process Parameters on Biocarbon Properties. Energies 2023, 16, 6936. [Google Scholar] [CrossRef]
- Mishra, R.K.; Kumar, D.J.P.; Sankannavar, R.; Binnal, P.; Mohanty, K. Hydro-deoxygenation of pyrolytic oil derived from pyrolysis of lignocellulosic biomass: A review. Fuel 2024, 360, 15. [Google Scholar] [CrossRef]
- Lachos-Perez, D.; Martins-Vieira, J.C.; Missau, J.; Anshu, K.; Siakpebru, O.K.; Thengane, S.K.; Morais, A.R.C.; Tanabe, E.H.; Bertuol, D.A. Review on Biomass Pyrolysis with a Focus on Bio-Oil Upgrading Techniques. Analytica 2023, 4, 182–205. [Google Scholar] [CrossRef]
- Rangel, M.d.C.; Mayer, F.M.; Carvalho, M.d.S.; Saboia, G.; de Andrade, A.M. Selecting Catalysts for Pyrolysis of Lignocellulosic Biomass. Biomass 2023, 3, 31–63. [Google Scholar] [CrossRef]
- Vikram, B.; Gauram, D.K.; Yadav, H.C.; Gaurha, A.; Kumar, V.; Omer, S.; Chawla, R. Tamarind Cultivation, Value-Added Products and Their Health Benefits: A Review. IJPSS 2023, 35, 903–911. [Google Scholar] [CrossRef]
- Kader, M.A.; Islam, M.R.; Parveen, M.; Haniu, H.; Takai, K. Pyrolysis decomposition of tamarind seed for alternative fuel. Bioresour Technol. 2013, 149, 1–7. [Google Scholar] [CrossRef] [PubMed]
- Mathiarasu, A.; Pugazhvadivu, M. Studies on microwave pyrolysis of tamarind seed. AIP Conf. Proc. 2020, 2225. [Google Scholar]
- Somani, O.G.; Choudhari, A.L.; Rao, B.S.; Mirajkar, S.P. Enhancement of crystallization rate by microwave radiation: Synthesis of ZSM-5. Materials Chemistry and Physics 2003, 82, 538–545. [Google Scholar] [CrossRef]
- García, R.R.M.; Giannetti, B.F.; Agostinho, F.; Almeida, C.M.V.B.; Sevegnani, F.; Pérez, K.M.P.; Velásquez, L. Assessing the sustainability of rice production in Brazil and Cuba. JAFR 2021, 4. [Google Scholar] [CrossRef]
- Jia, H.; Du, T.; Fang, X.; Gong, H.; Qiu, Z.; Li, Y.; Wang, Y. Synthesis of Template-Free ZSM-5 from Rice Husk Ash at Low Temperatures and its CO2 Adsorption Performance. ACS Omega 2021, 6, 3961–3972. [Google Scholar] [CrossRef]
- Fard, A.M.; Ebrahimi, A.A. Eco-friendly synthesis of ZSM-5 from rice husk ash using top-down modifications for enhancing acetone-to-olefin conversion: Evaluation of catalytic performance and operating conditions. Fuel 2025, 386, 15. [Google Scholar] [CrossRef]
- Bortolini, H.; Lima, D.S.; Perez-Lopez, O.W. Hydrothermal synthesis of analcime without template. JCW 2020, 532. [Google Scholar] [CrossRef]
- Fajobi, M.O.; Lasode, O.A.; Adeleke, A.A.; Ikubanni, P.P.; Balogun, A.O. Investigation of physicochemical characteristics of selected lignocellulose biomass. Scientific Reports 2022, 2918. [Google Scholar] [CrossRef]
- Onokwai, A.O.; Ajisegiri, E.S.A.; Okokpujie, I.P.; Ibikunle, R.A.; Oki, M.; Dirisu, J.O. Characterization of lignocellulose biomass based on proximate, ultimate, structural composition, and thermal analysis. Materials Today: Proceedings 2022, 65, 2156–2162. [Google Scholar] [CrossRef]
- Dey, K.P.; Ghosh, S.; Naskar, M.K. Organic template-free-synthesis of ZSM-5 zeolite particles using rice husk ash as silica source. Ceramics International 2013, 39, 2153–2157. [Google Scholar] [CrossRef]
- Khoshbin, R.; Karimzadeh, R. Synthesis of mesoporous ZSM-5 from rice husk ash with ultrasound assisted alkali-treatment method used in catalytic cracking of light naphta. Advanced Power Technology 2017, 28, 1888–1897. [Google Scholar] [CrossRef]
- Koningsveld, H.V. High-temperature (350 K) orthorhombic framework structure of zeolite H-ZSM-5. Acta Cyst. 1990, 46, 731–735. [Google Scholar] [CrossRef]
- Fukasawa, T.; Otsuka, K.; Murakami, T.; Ishigami, T.; Fukui, K. Synthesis of zeolites with hierarchical porous structures using a microwave heating method. CISC 2021, 42. [Google Scholar] [CrossRef]
- Chen, W.; Song, G.; Lin, Y.; Qiao, Y.; Qiao, J.; Wu, T.; Yi, *!!! REPLACE !!!*; Kawi, S. Synthesis and catalytic performance of Linde-type A zeolite (LTA) from coal fly ash utilizing microwave and ultrasound collaborative activation method. Catalysis Today 2022, 397–399, 407–418. [Google Scholar] [CrossRef]
- Lima, D.S.; Lopez, O.W.P. Catalytic conversion of glycerol to olefins over Fe, Mo, and Nb catalysts supported on zeolite ZSM-5. Renewable Energy. 2019, 136, 828. [Google Scholar] [CrossRef]
- Awoke, Y.; Sánchez-Sánchez, M.; Arnaiz, I.; Diaz, I. Synthesis of ZSM-5 from natural mordenite from Spain. Microporous and Mesoporous Materials 2025, 385. [Google Scholar] [CrossRef]
- Kaur, R.; Kumar, A.; Biswas, B.; Krishna, B.; Bhaskar, T. Py-GC/MS and slow pyrolysis of tamarind seed husk. JMCWM 2024, 26, 1131–1146. [Google Scholar] [CrossRef]
- Mayer, F.M.; Carvalho, M.d.S.; Mallmann, A.; Oliveira, A.P.S.; Ruiz, D.; Boeira, A.C.S.; Lima, D.d.S.; Rangel, M.d.C. Catalytic pyrolysis of MDF wastes over beta zeolite-supported platinum. Catalysis Today 2025, 449. [Google Scholar] [CrossRef]
- Ojiha, D.K.; Viju, D.; Vinu, R. Fast pyrolysis kinetics of lignocellulosic biomass of varying compositions. ECM 2021, 10. [Google Scholar] [CrossRef]
- Hayes, G.; Laurel, M.; Mackinnon, D.; Zhao, T.; Houck, H.A.; Becer, C.R. Polymers without Petrochemicals: Sustainable Routes to Conventional Monomers. Chem. Rev. 2023, 123, 2609–2734. [Google Scholar] [CrossRef] [PubMed]
- Benzene-Toluene-Xylene (BTX) Market Size & Share Analysis—Growh Trends and Forecast (2025-2030). Available online: https://www.mordorintelligence.com/industry-reports/benzene-toluene-xylene-btx-market (accessed on 7 November 2025).
Figure 1.
TG and DTG curves of tamarind pulp.

Figure 2.
X-ray diffractograms of the catalysts. HZ: HZSM5 without any treatment; HZU: HZSM5 zeolite treated with ultrasound; HZM: HZSM5 zeolite treated with microwave; HZUM: HZSM5 prepared using both ultrasound and microwave.
Figure 2.
X-ray diffractograms of the catalysts. HZ: HZSM5 without any treatment; HZU: HZSM5 zeolite treated with ultrasound; HZM: HZSM5 zeolite treated with microwave; HZUM: HZSM5 prepared using both ultrasound and microwave.
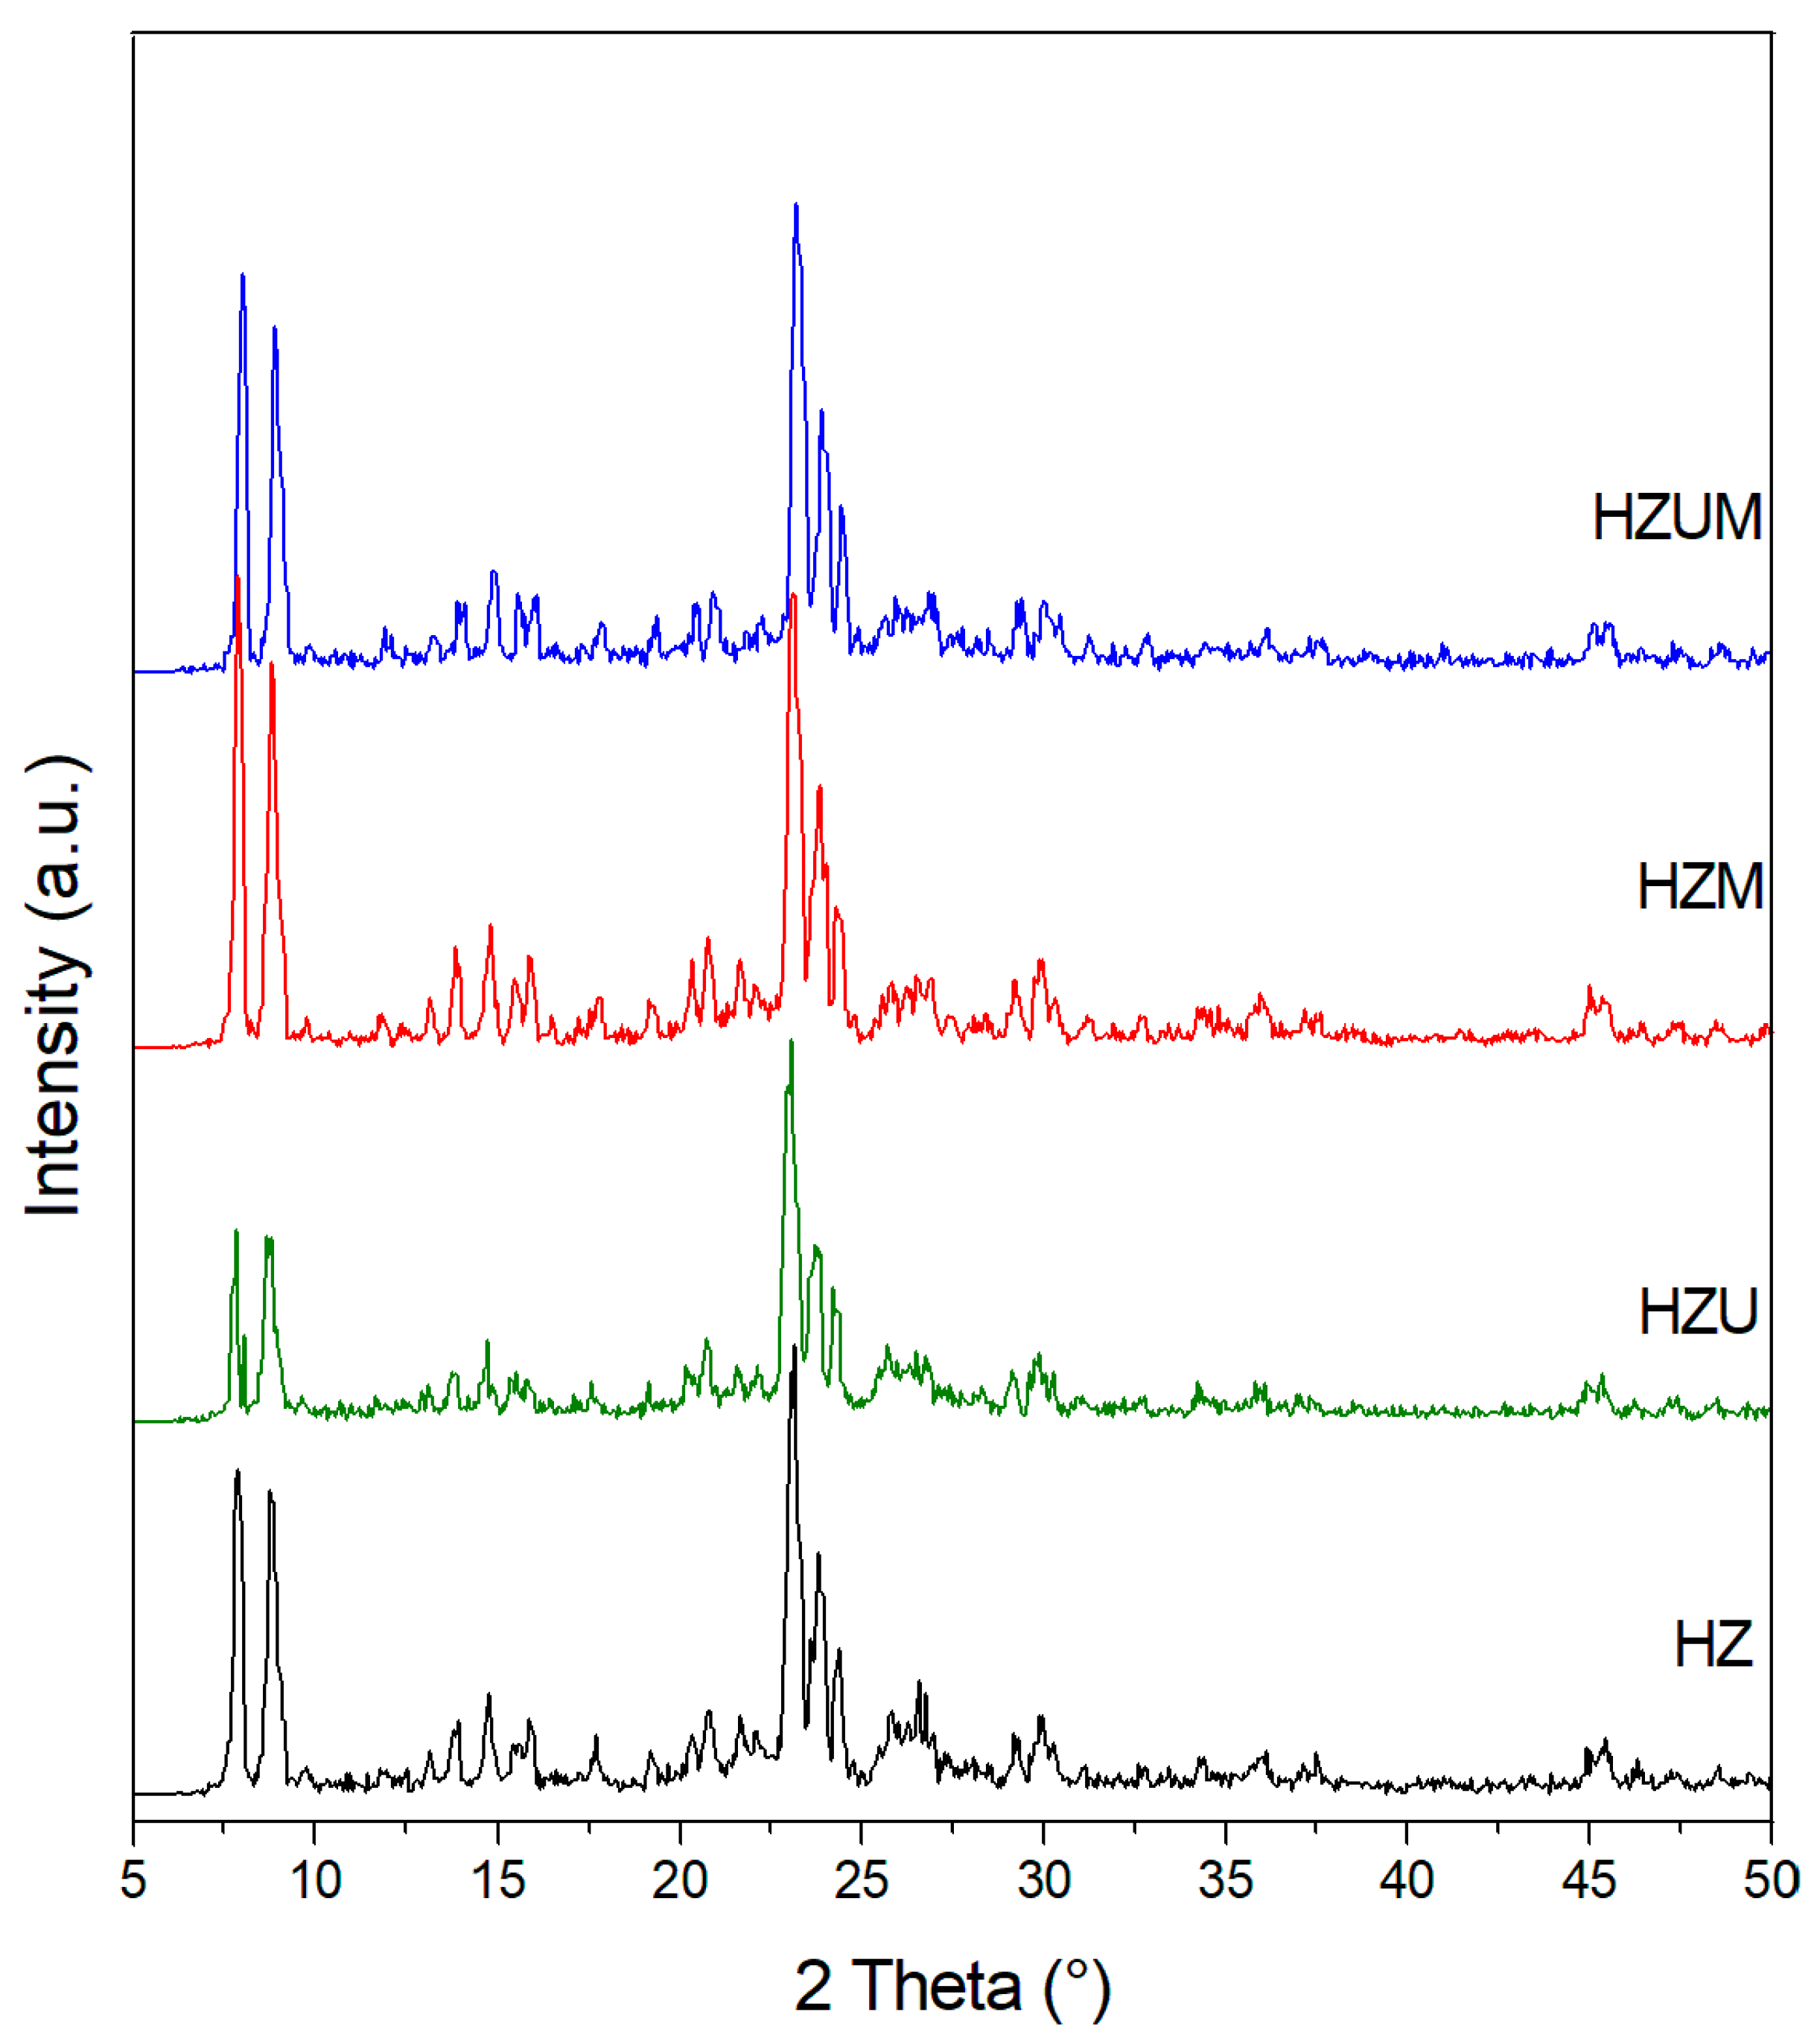
Figure 3.
Nitrogen adsorption and desorption curves of HZSM5 zeolite-based catalysts. (a) HZ: HZSM-5 zeolite without any treatment; (b) HZU: HZSM-5 treated with ultrasound; (c) HZM: HZSM-5 treated with microwave; (d) HZUM: HZSM-5 treated with both ultrasound and microwave.
Figure 3.
Nitrogen adsorption and desorption curves of HZSM5 zeolite-based catalysts. (a) HZ: HZSM-5 zeolite without any treatment; (b) HZU: HZSM-5 treated with ultrasound; (c) HZM: HZSM-5 treated with microwave; (d) HZUM: HZSM-5 treated with both ultrasound and microwave.
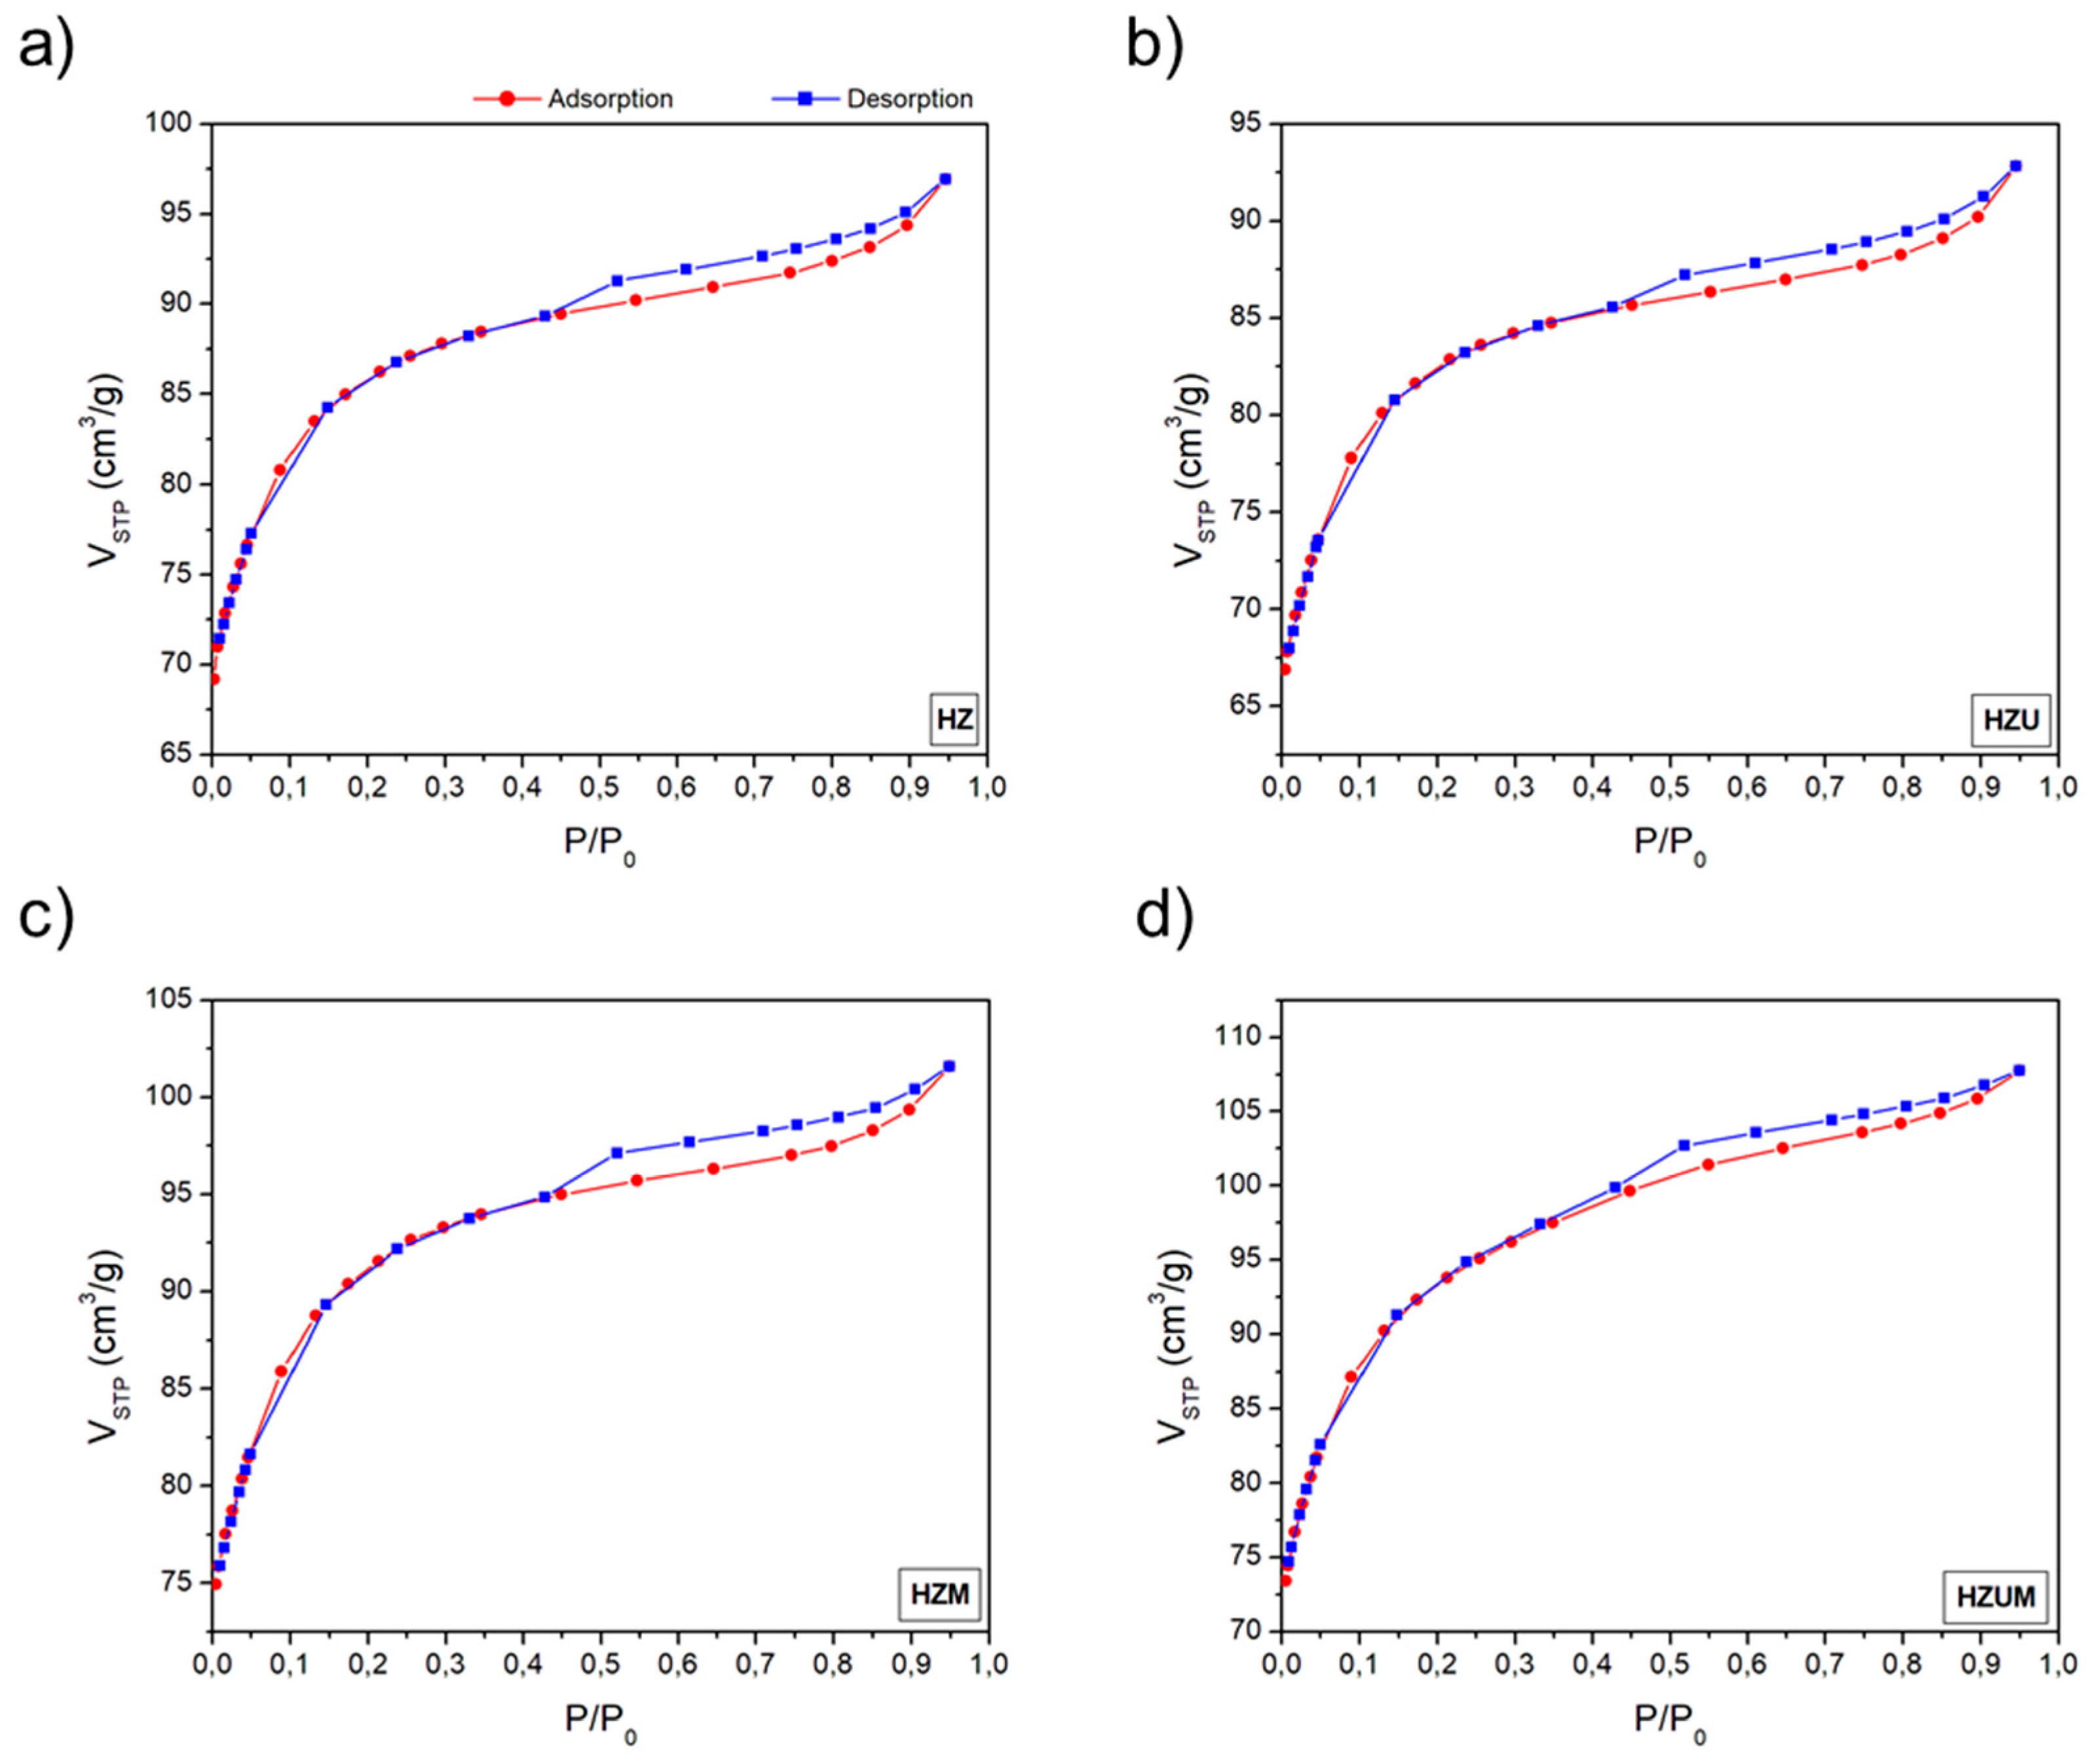
Figure 4.
Curves of NH3-TPD for the samples. HZ: HZSM-5 zeolite without any treatment; HZU: HZSM-5 treated with ultrasound; (c) HZM: HZSM-5 treated with microwave; (d) HZUM: HZSM-5 treated with both ultrasound and microwave.
Figure 4.
Curves of NH3-TPD for the samples. HZ: HZSM-5 zeolite without any treatment; HZU: HZSM-5 treated with ultrasound; (c) HZM: HZSM-5 treated with microwave; (d) HZUM: HZSM-5 treated with both ultrasound and microwave.
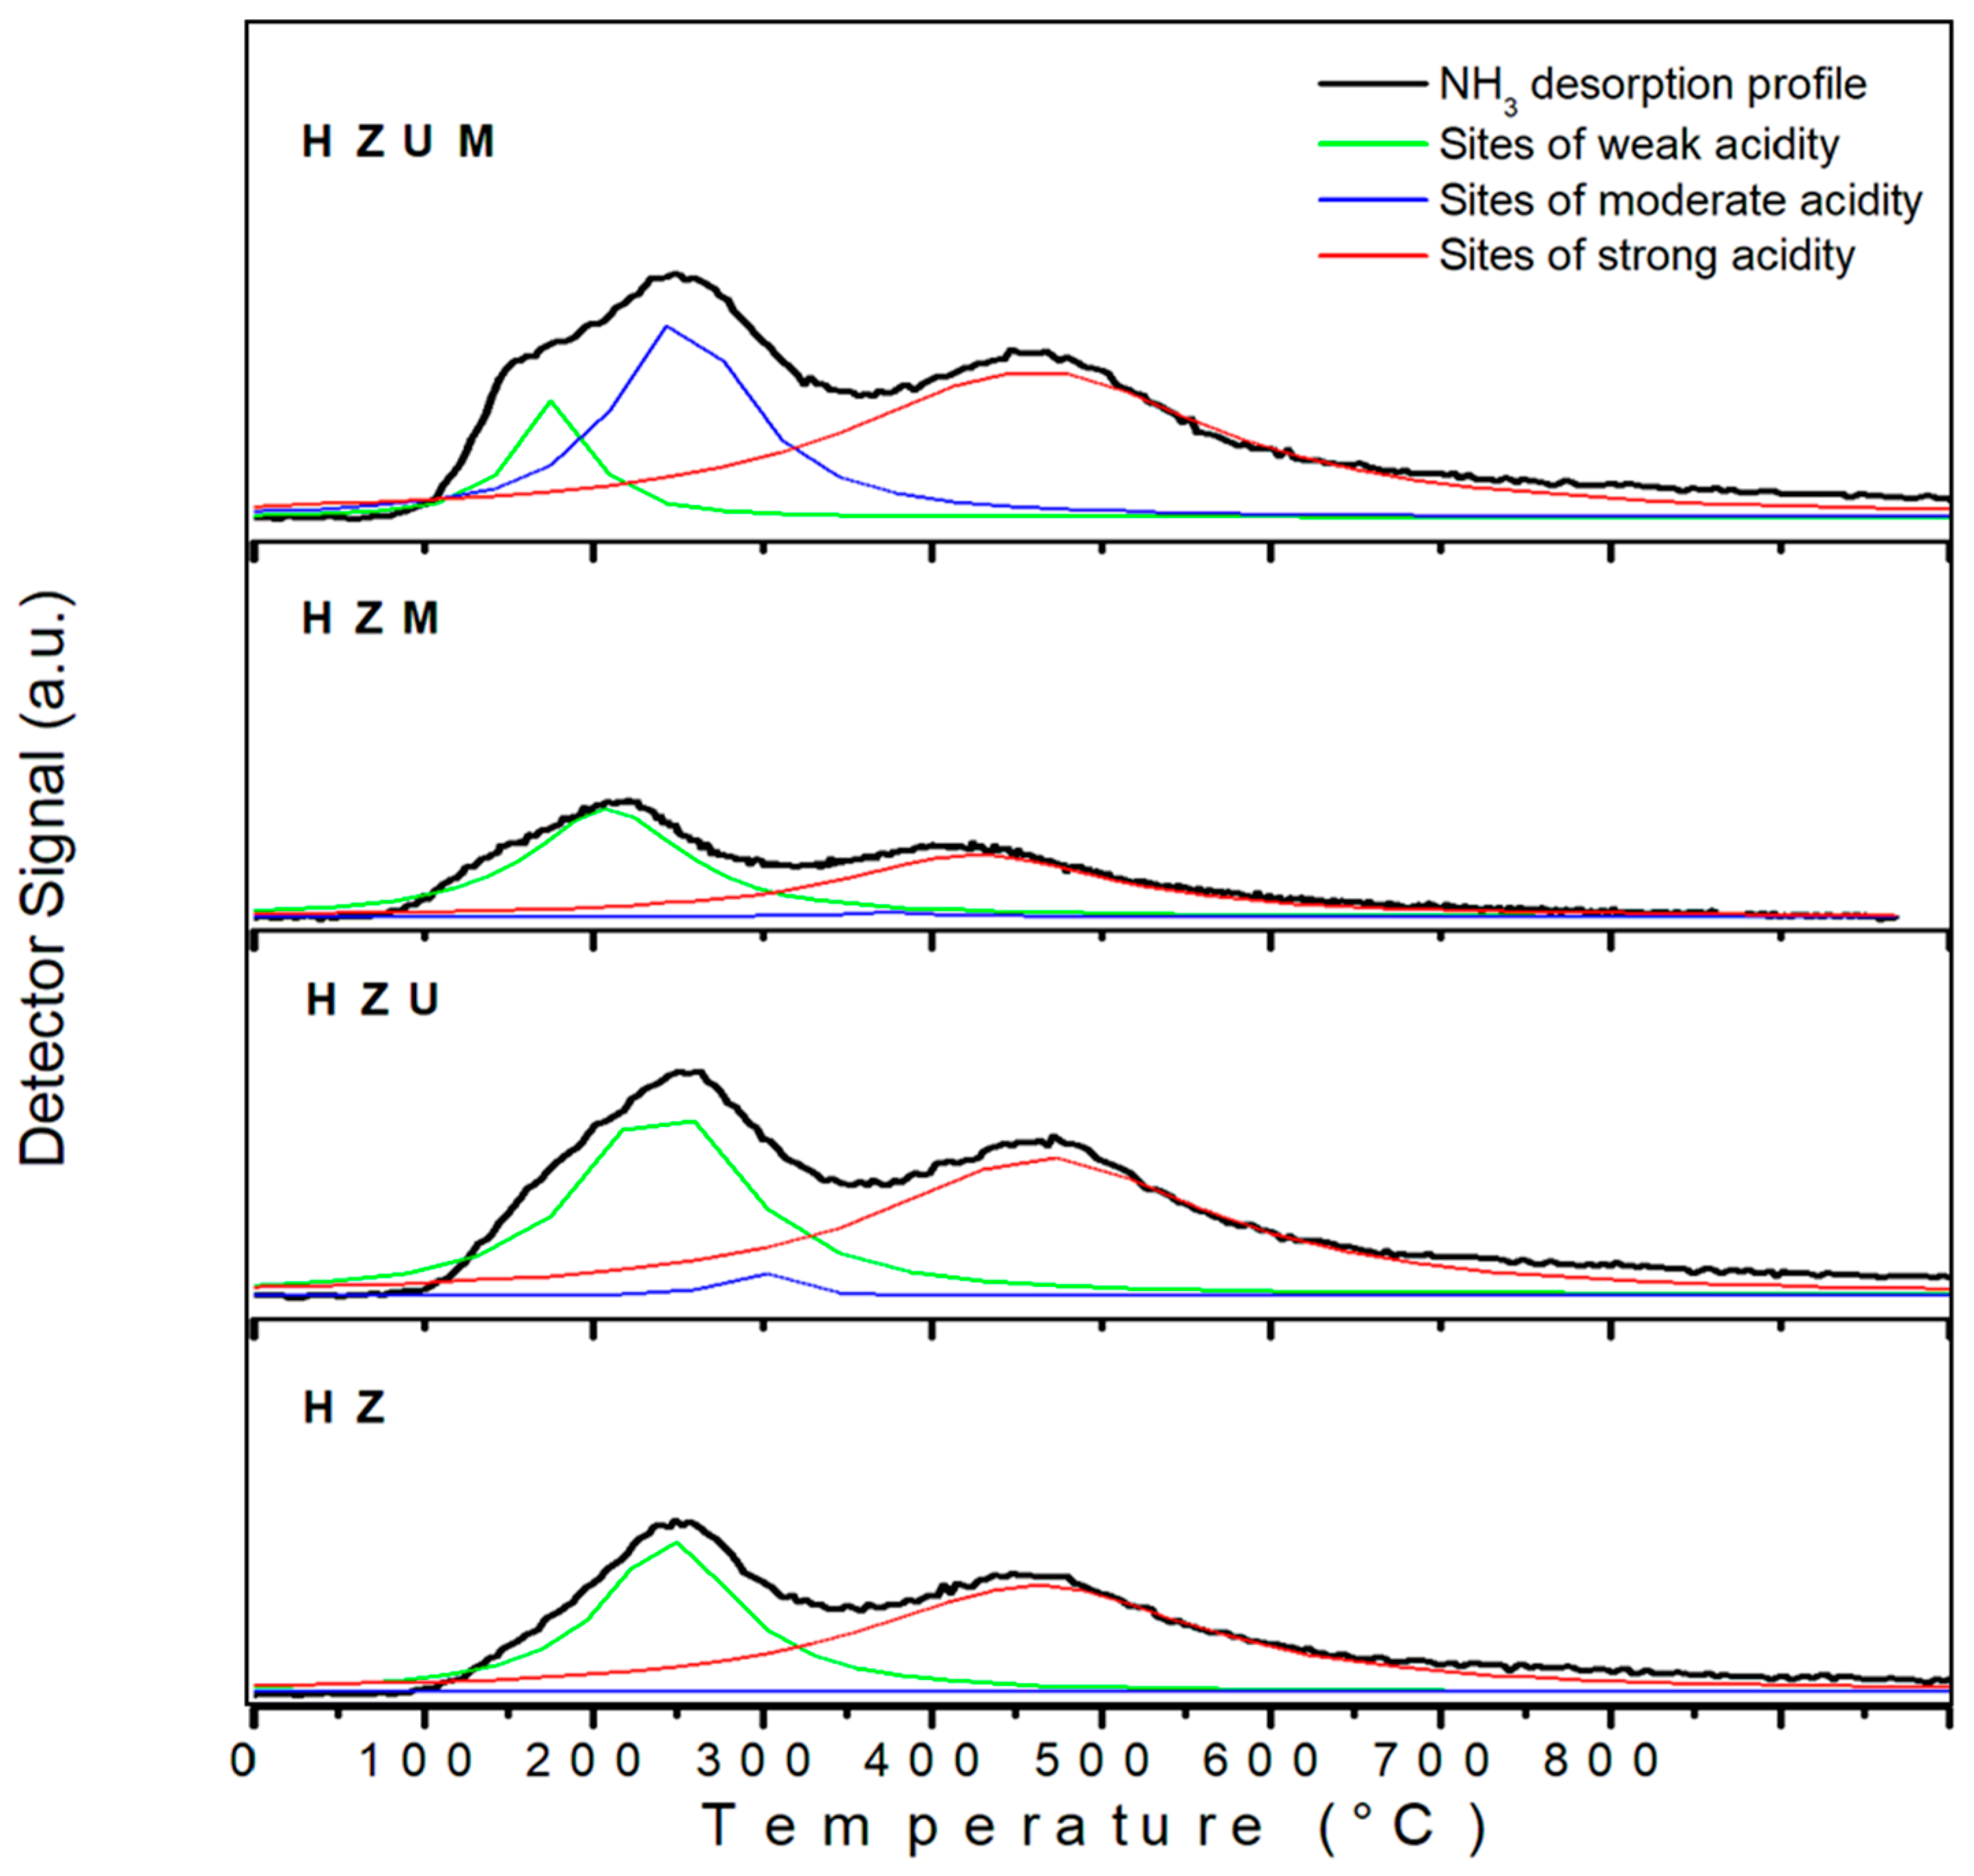
Figure 5.
Scanning electron micrographs for HZ (HZSM05 without any treatment): a) 2000x, b) 20000x; for HZU (HZSM-5 treated with ultrasound): c) 2000x, d) 20000x; for HZM (treated with microwave: e) 2000x, f) 20000x and for HZUM (treated by both ultrasound and microwave): g) 2000x, h) 20000x.
Figure 5.
Scanning electron micrographs for HZ (HZSM05 without any treatment): a) 2000x, b) 20000x; for HZU (HZSM-5 treated with ultrasound): c) 2000x, d) 20000x; for HZM (treated with microwave: e) 2000x, f) 20000x and for HZUM (treated by both ultrasound and microwave): g) 2000x, h) 20000x.
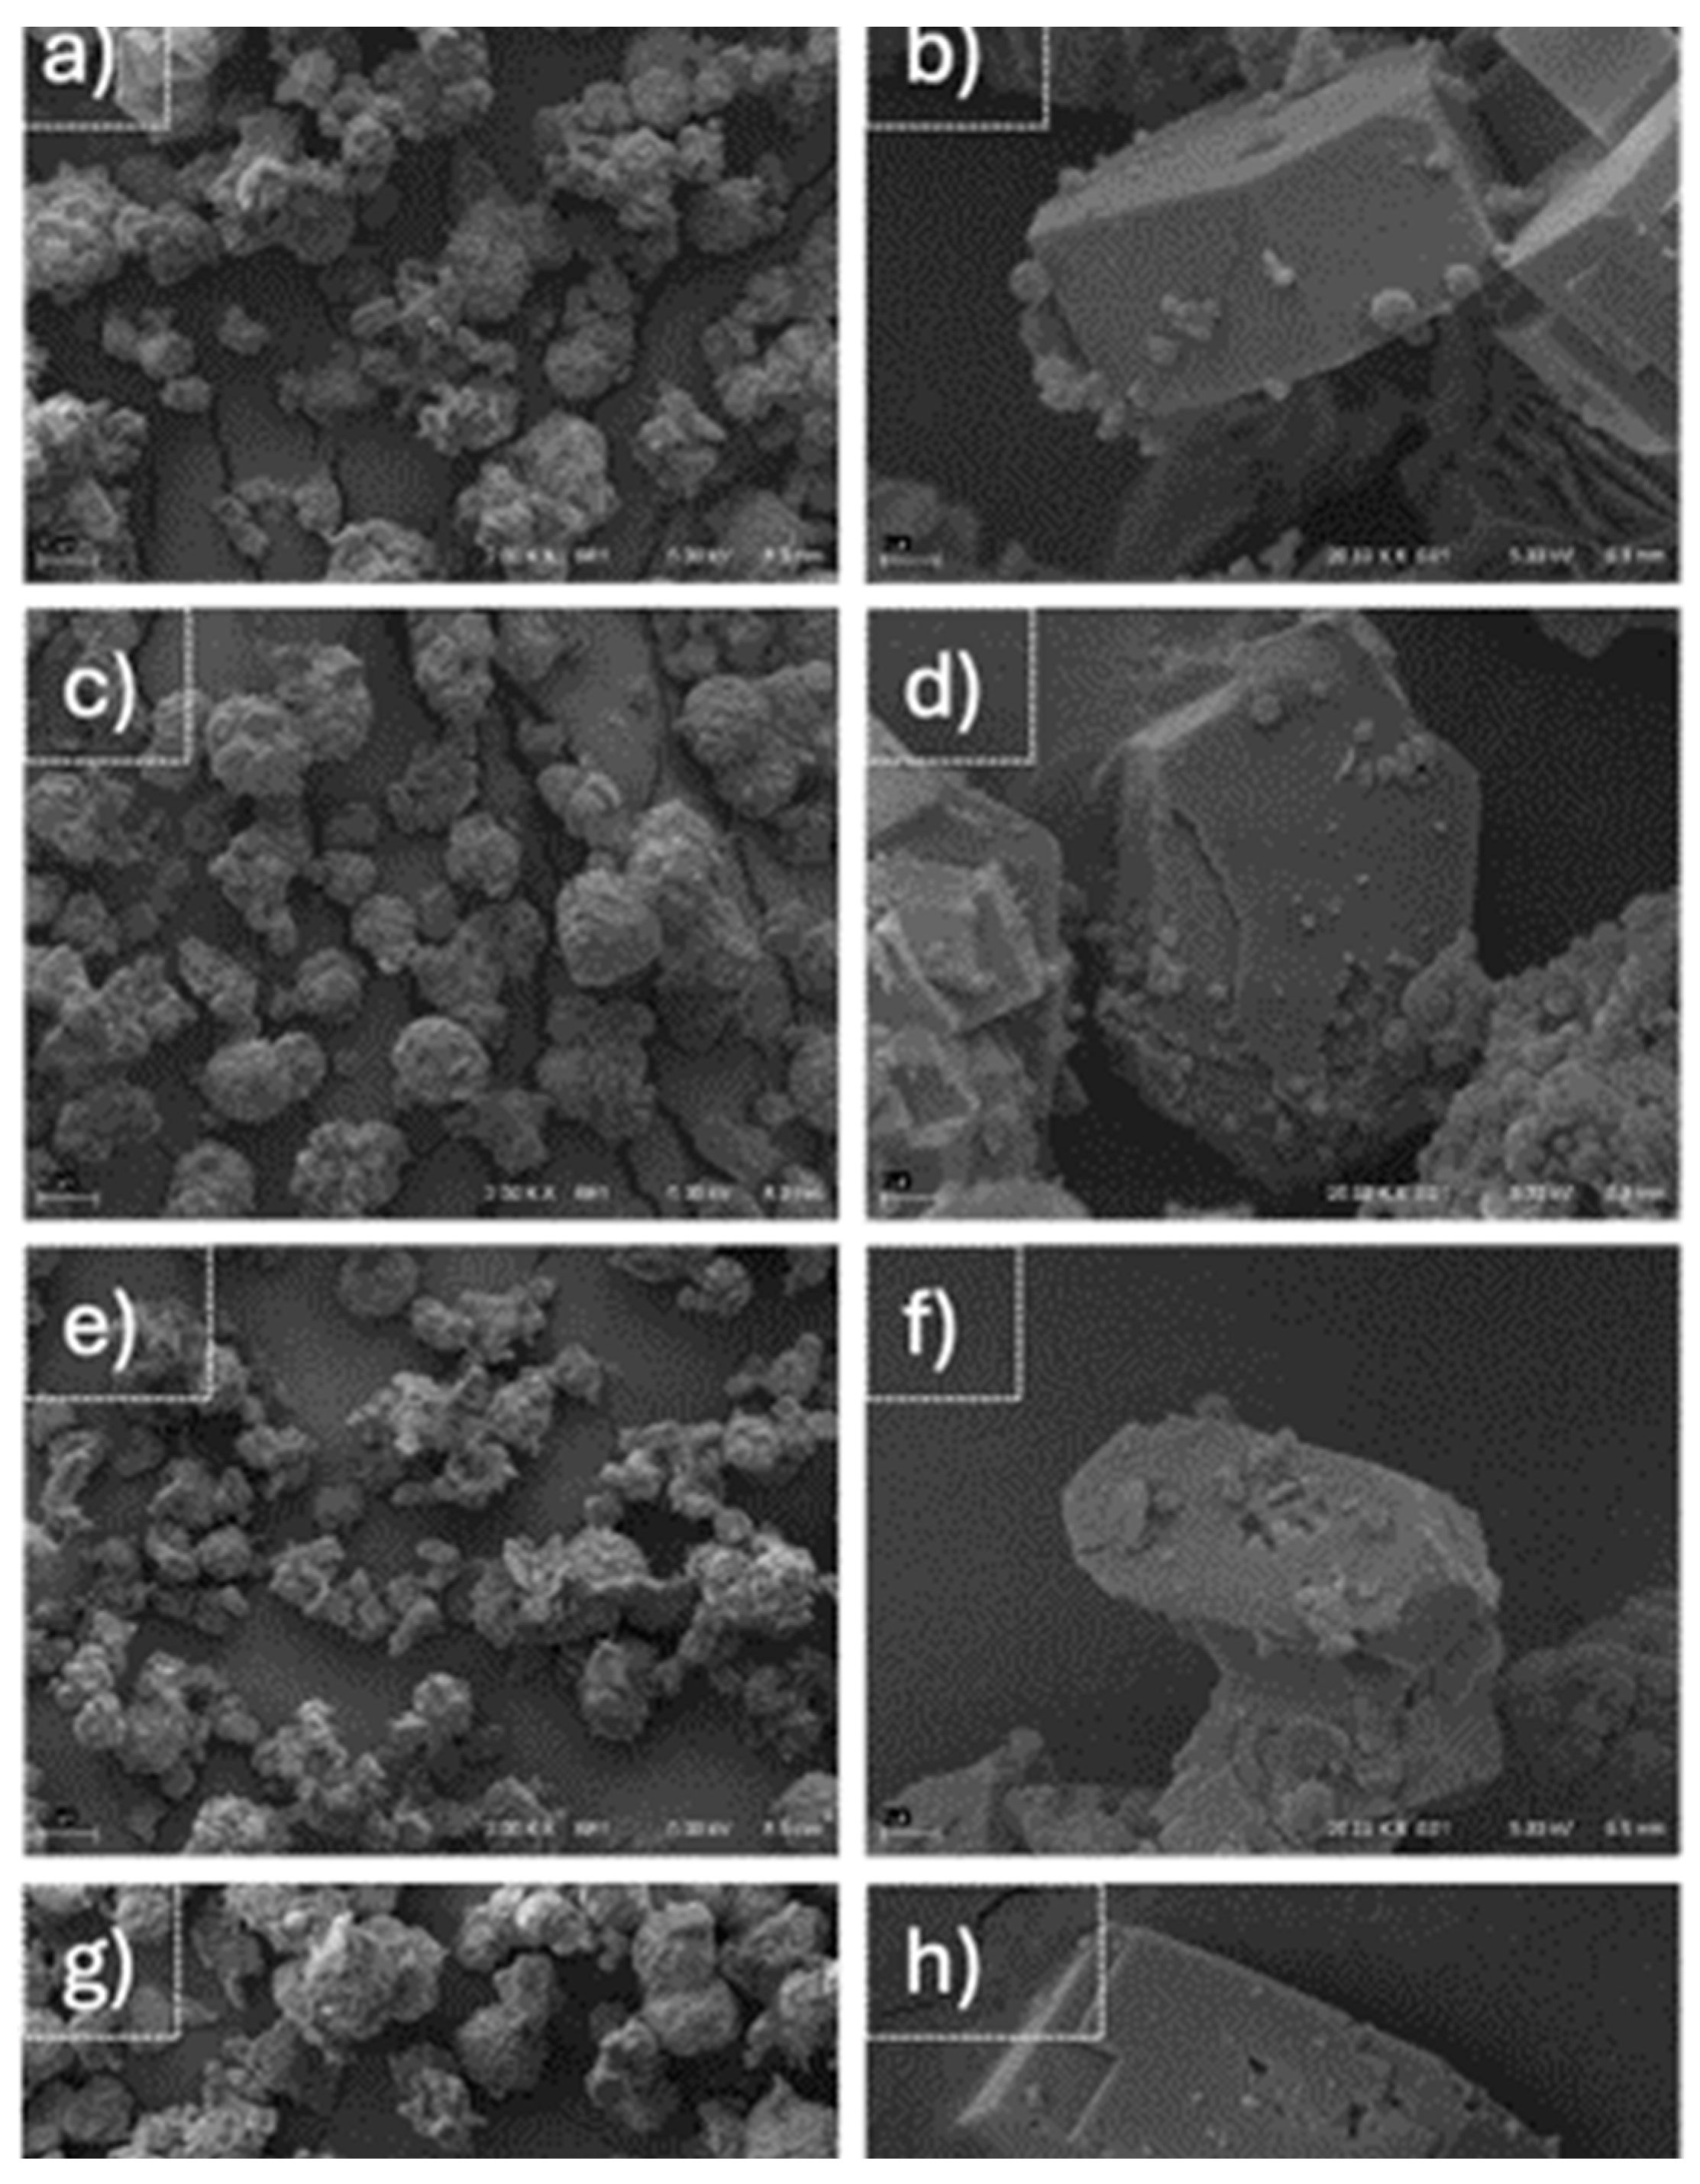
Figure 6.
Distribution of products obtained during non-catalytic pyrolysis and catalytic pyrolysis. TP: tamarind pulp); HZNT: HZSM-5 without any treatment; HZU: HZSM-5 treated with ultrasound; HZM: HZSM-5 treated with microwave; HZUM: HZSM-5 treated with both ultrasound and microwave.
Figure 6.
Distribution of products obtained during non-catalytic pyrolysis and catalytic pyrolysis. TP: tamarind pulp); HZNT: HZSM-5 without any treatment; HZU: HZSM-5 treated with ultrasound; HZM: HZSM-5 treated with microwave; HZUM: HZSM-5 treated with both ultrasound and microwave.
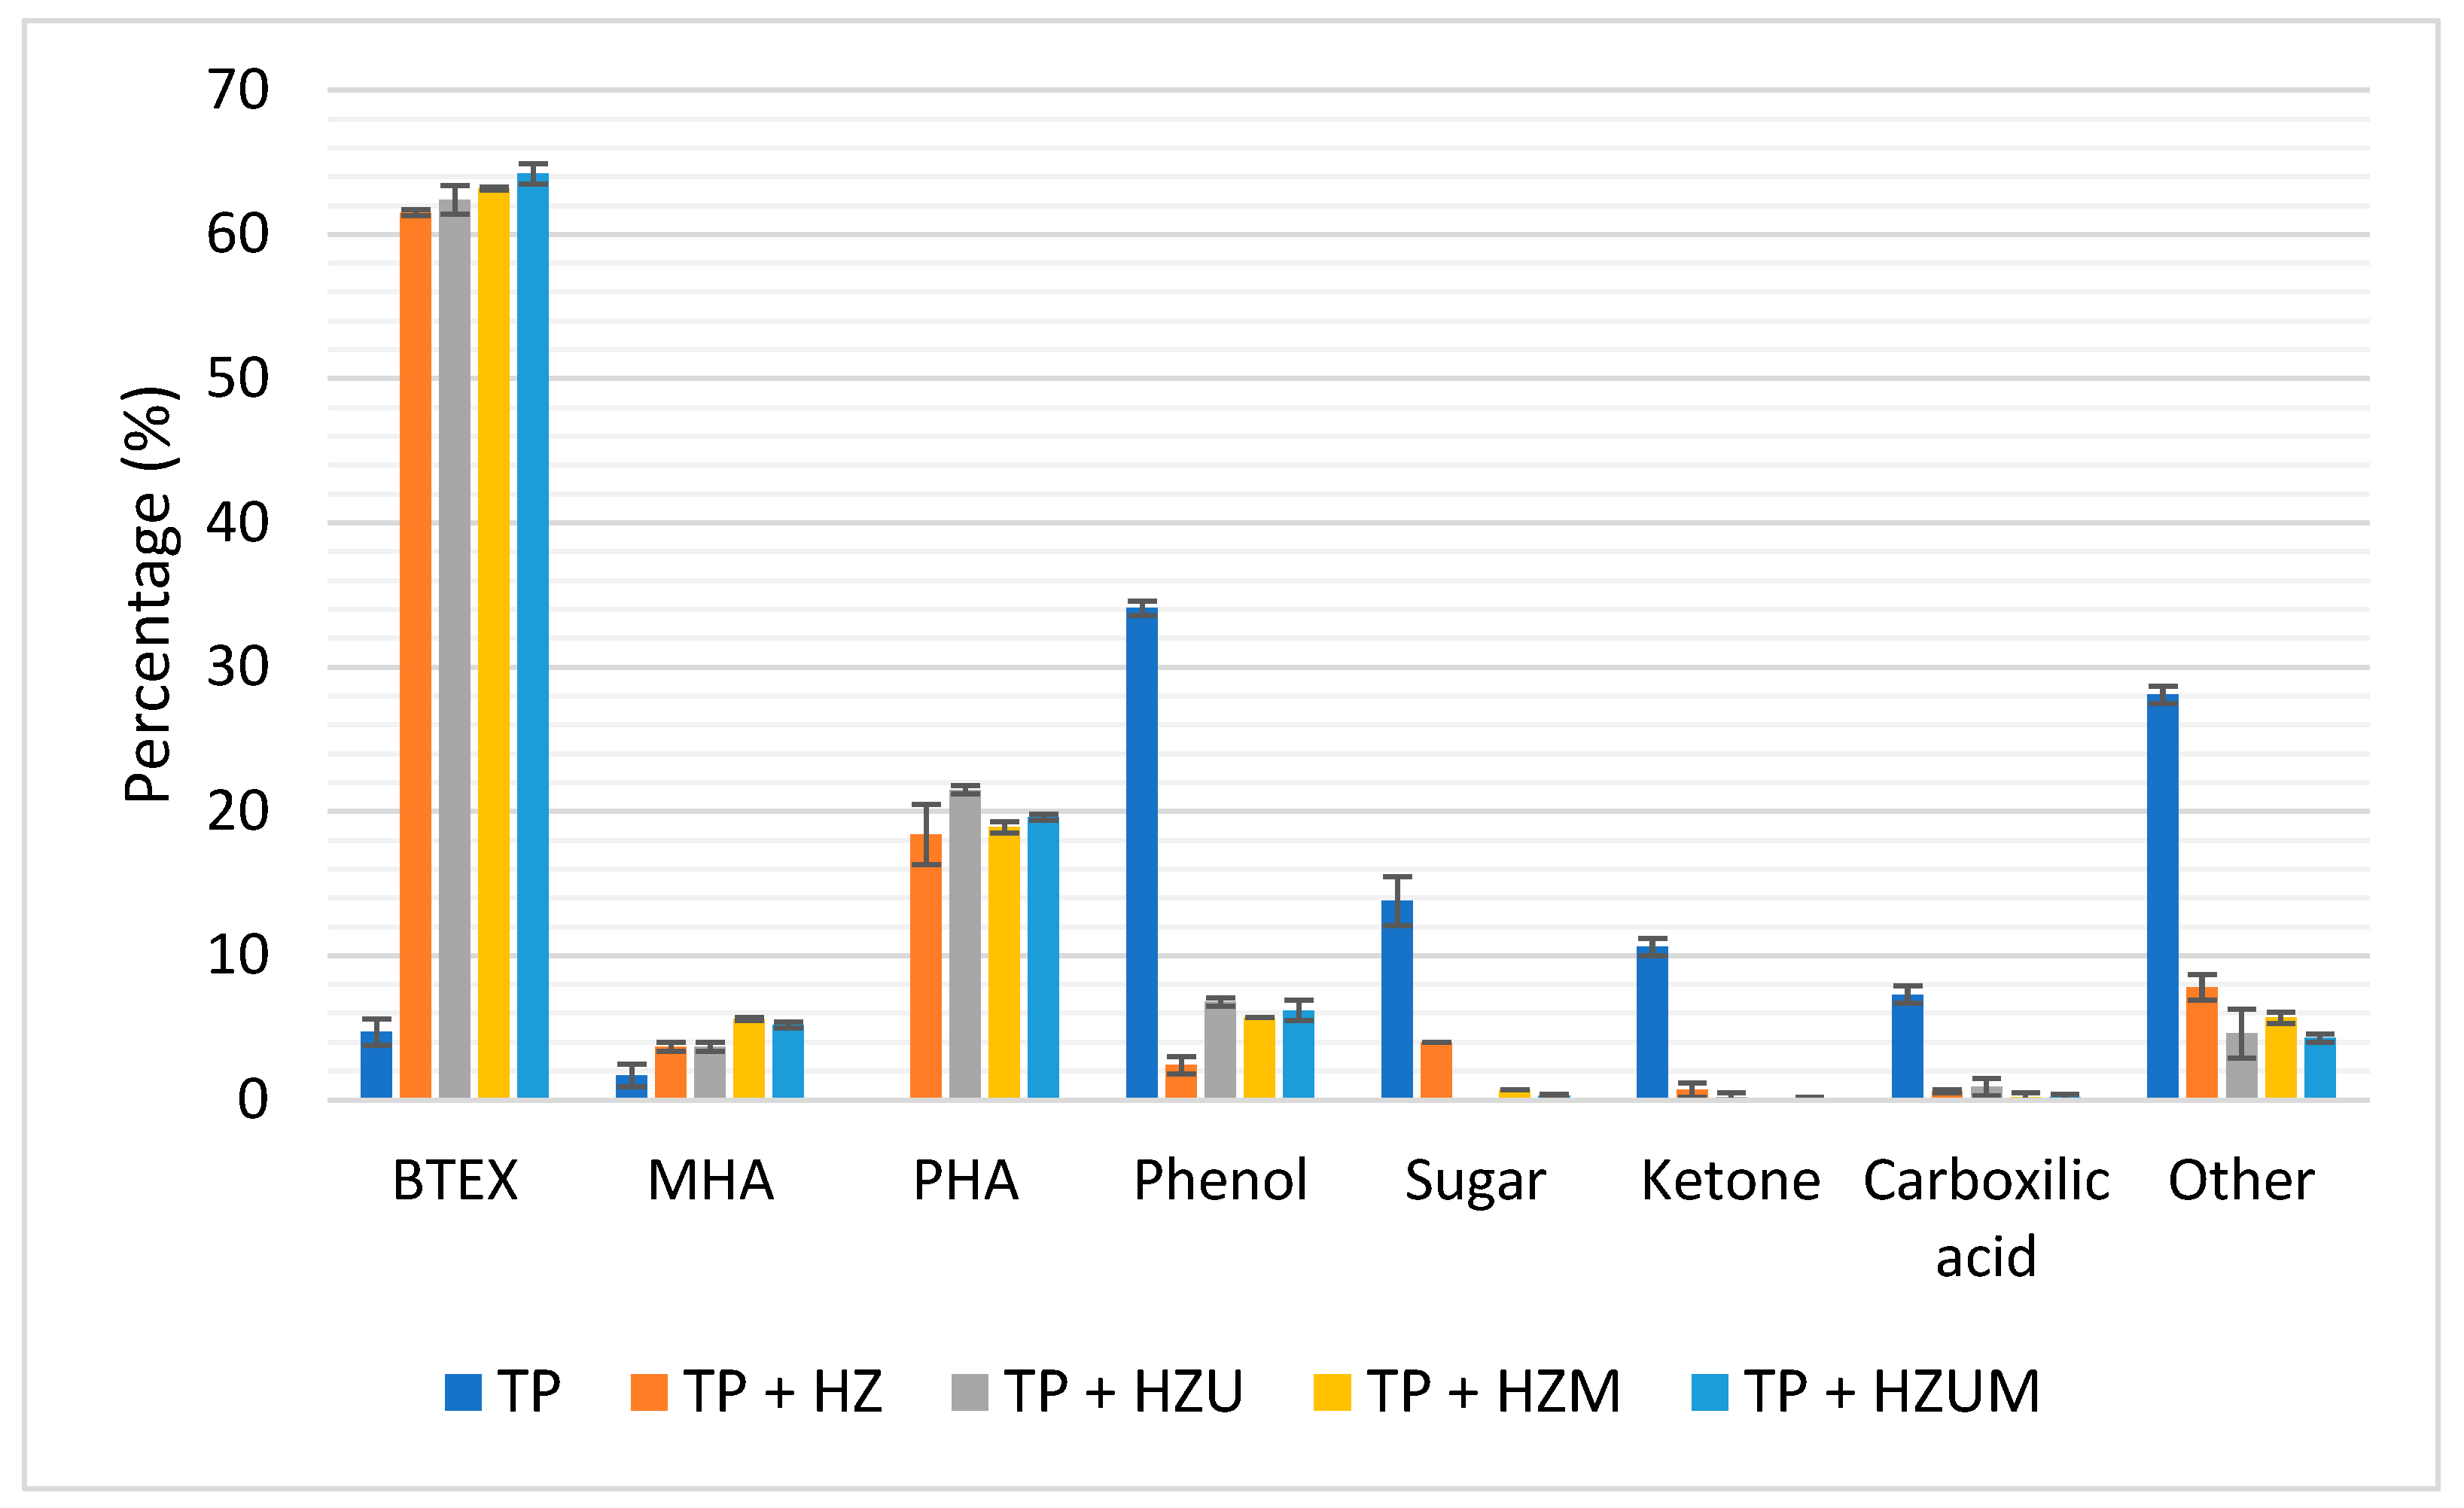
Figure 7.
Chromatograms of (a) non-catalytic pyrolysis (TP), and (b) catalytic pyrolysis over HZUM (HZSM-5 treated with both ultrasound and microwave).
Figure 7.
Chromatograms of (a) non-catalytic pyrolysis (TP), and (b) catalytic pyrolysis over HZUM (HZSM-5 treated with both ultrasound and microwave).
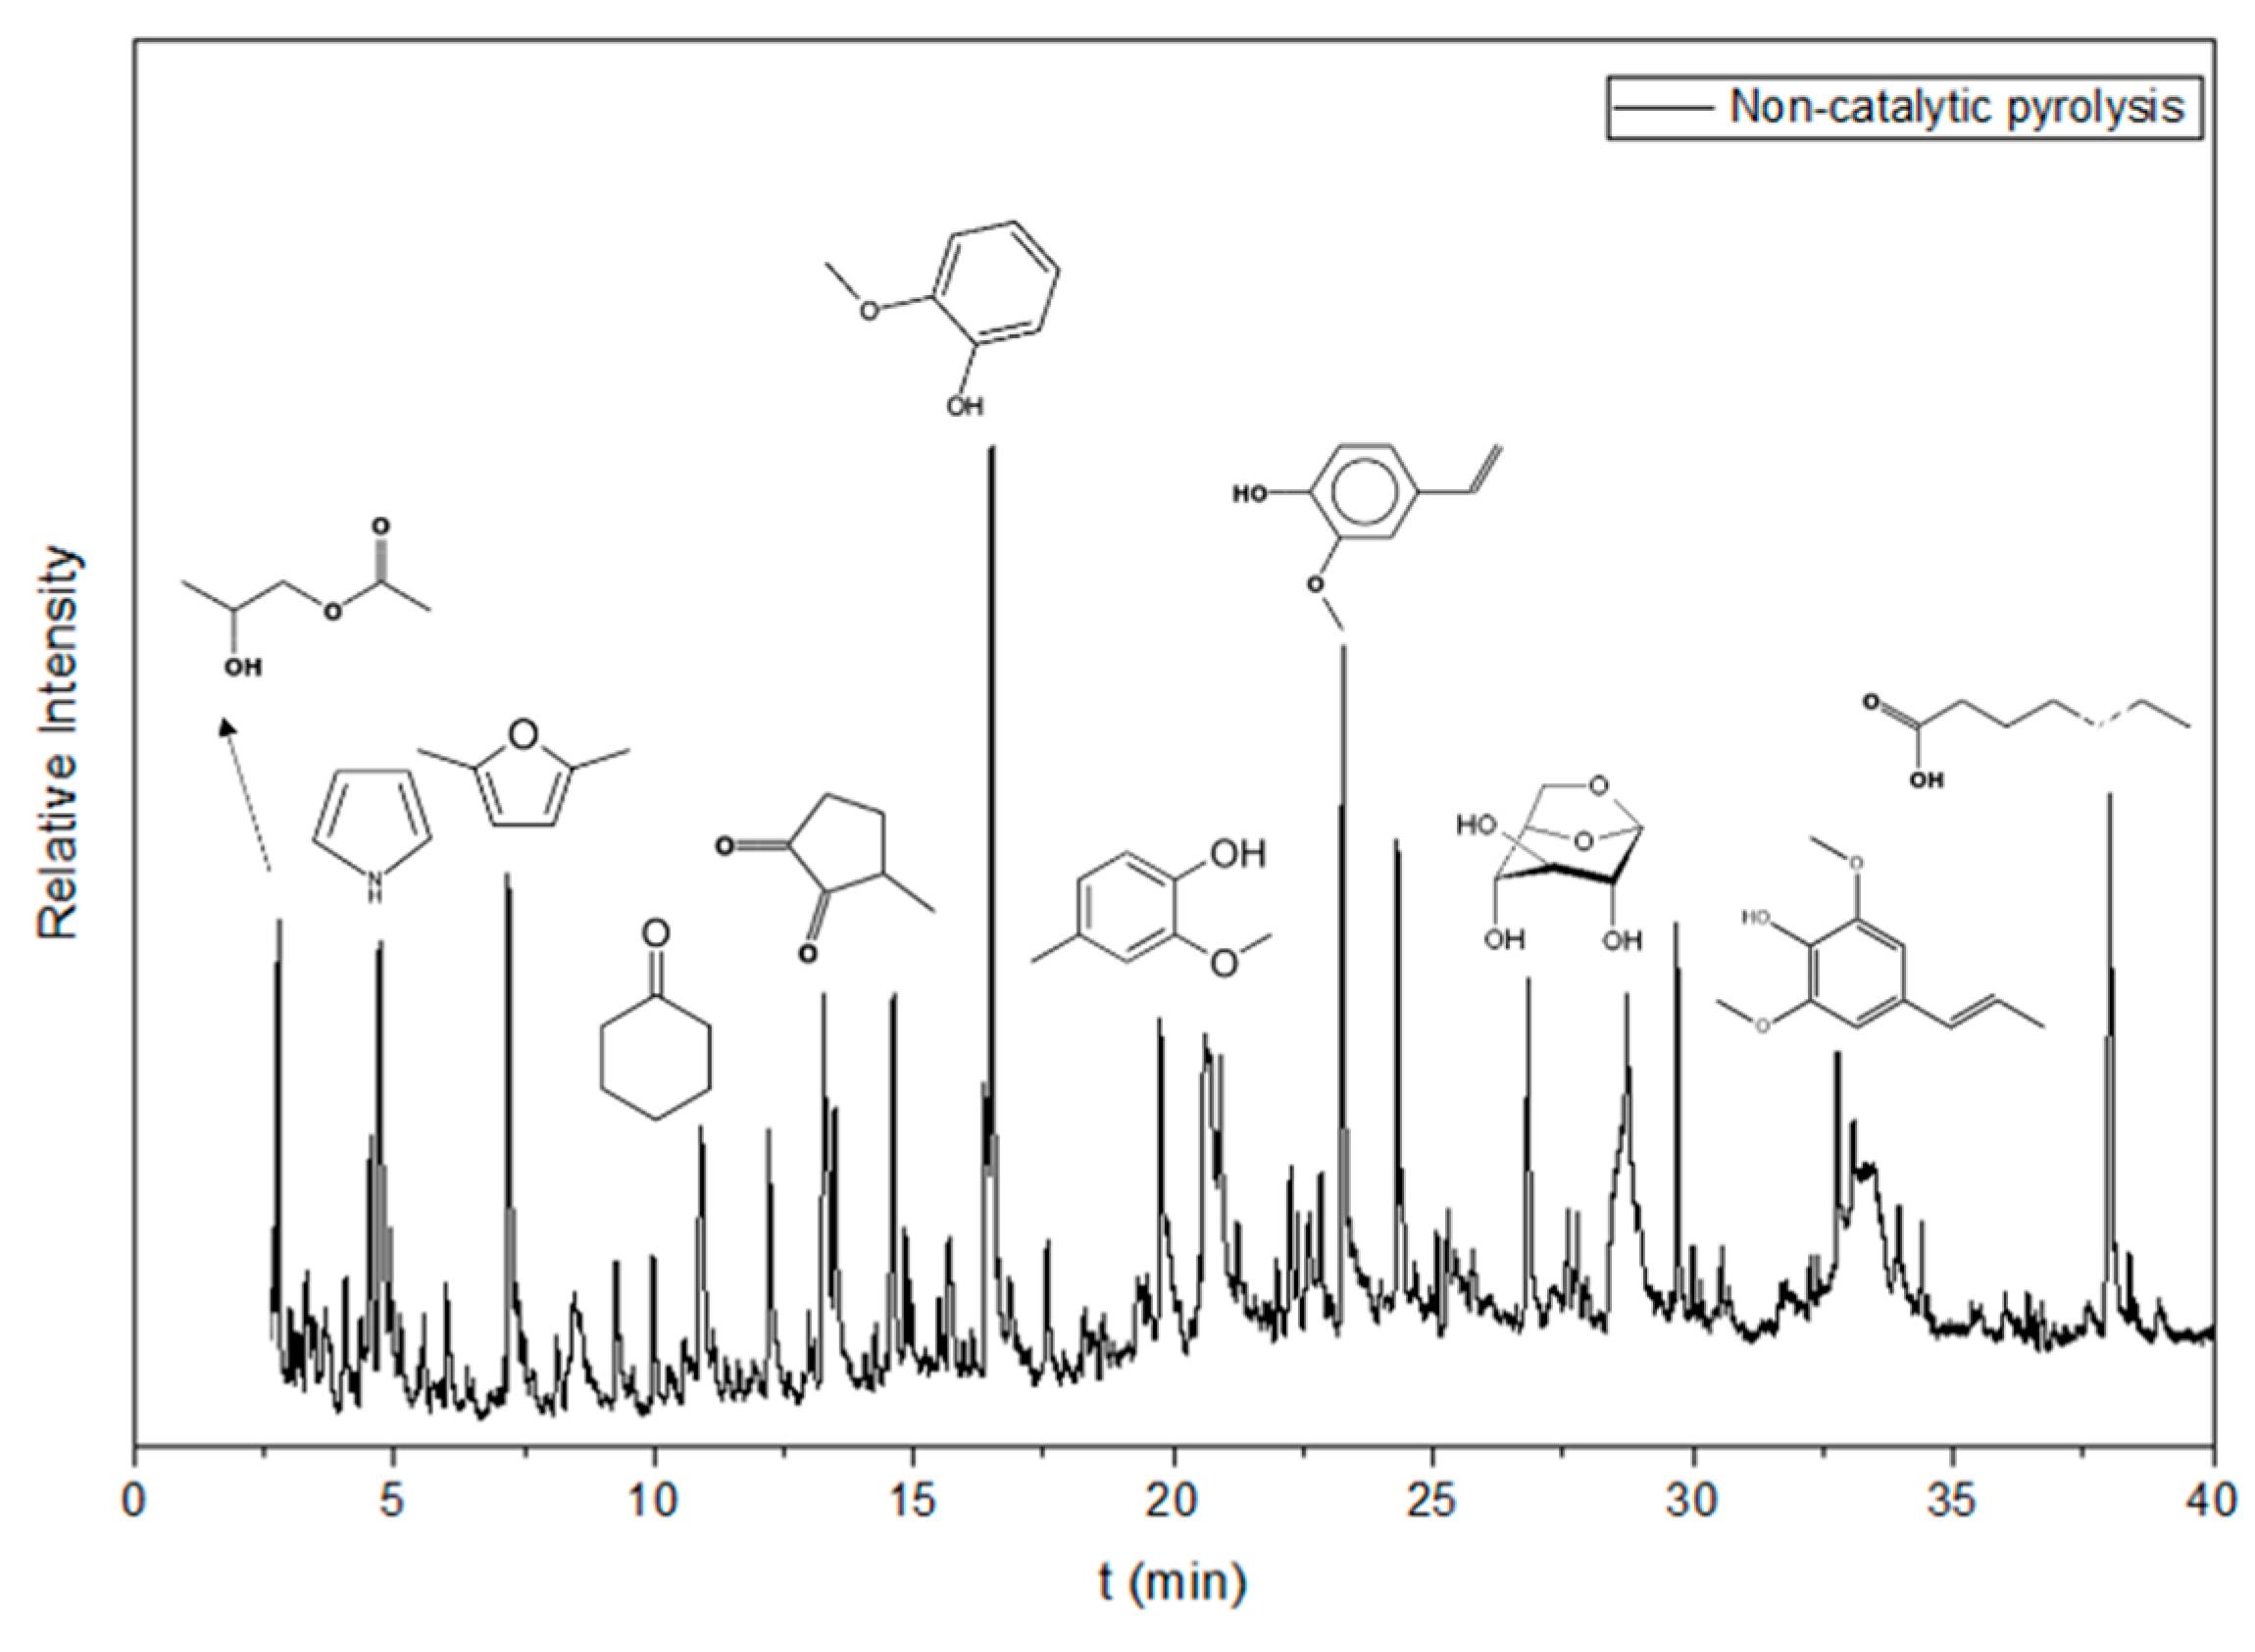
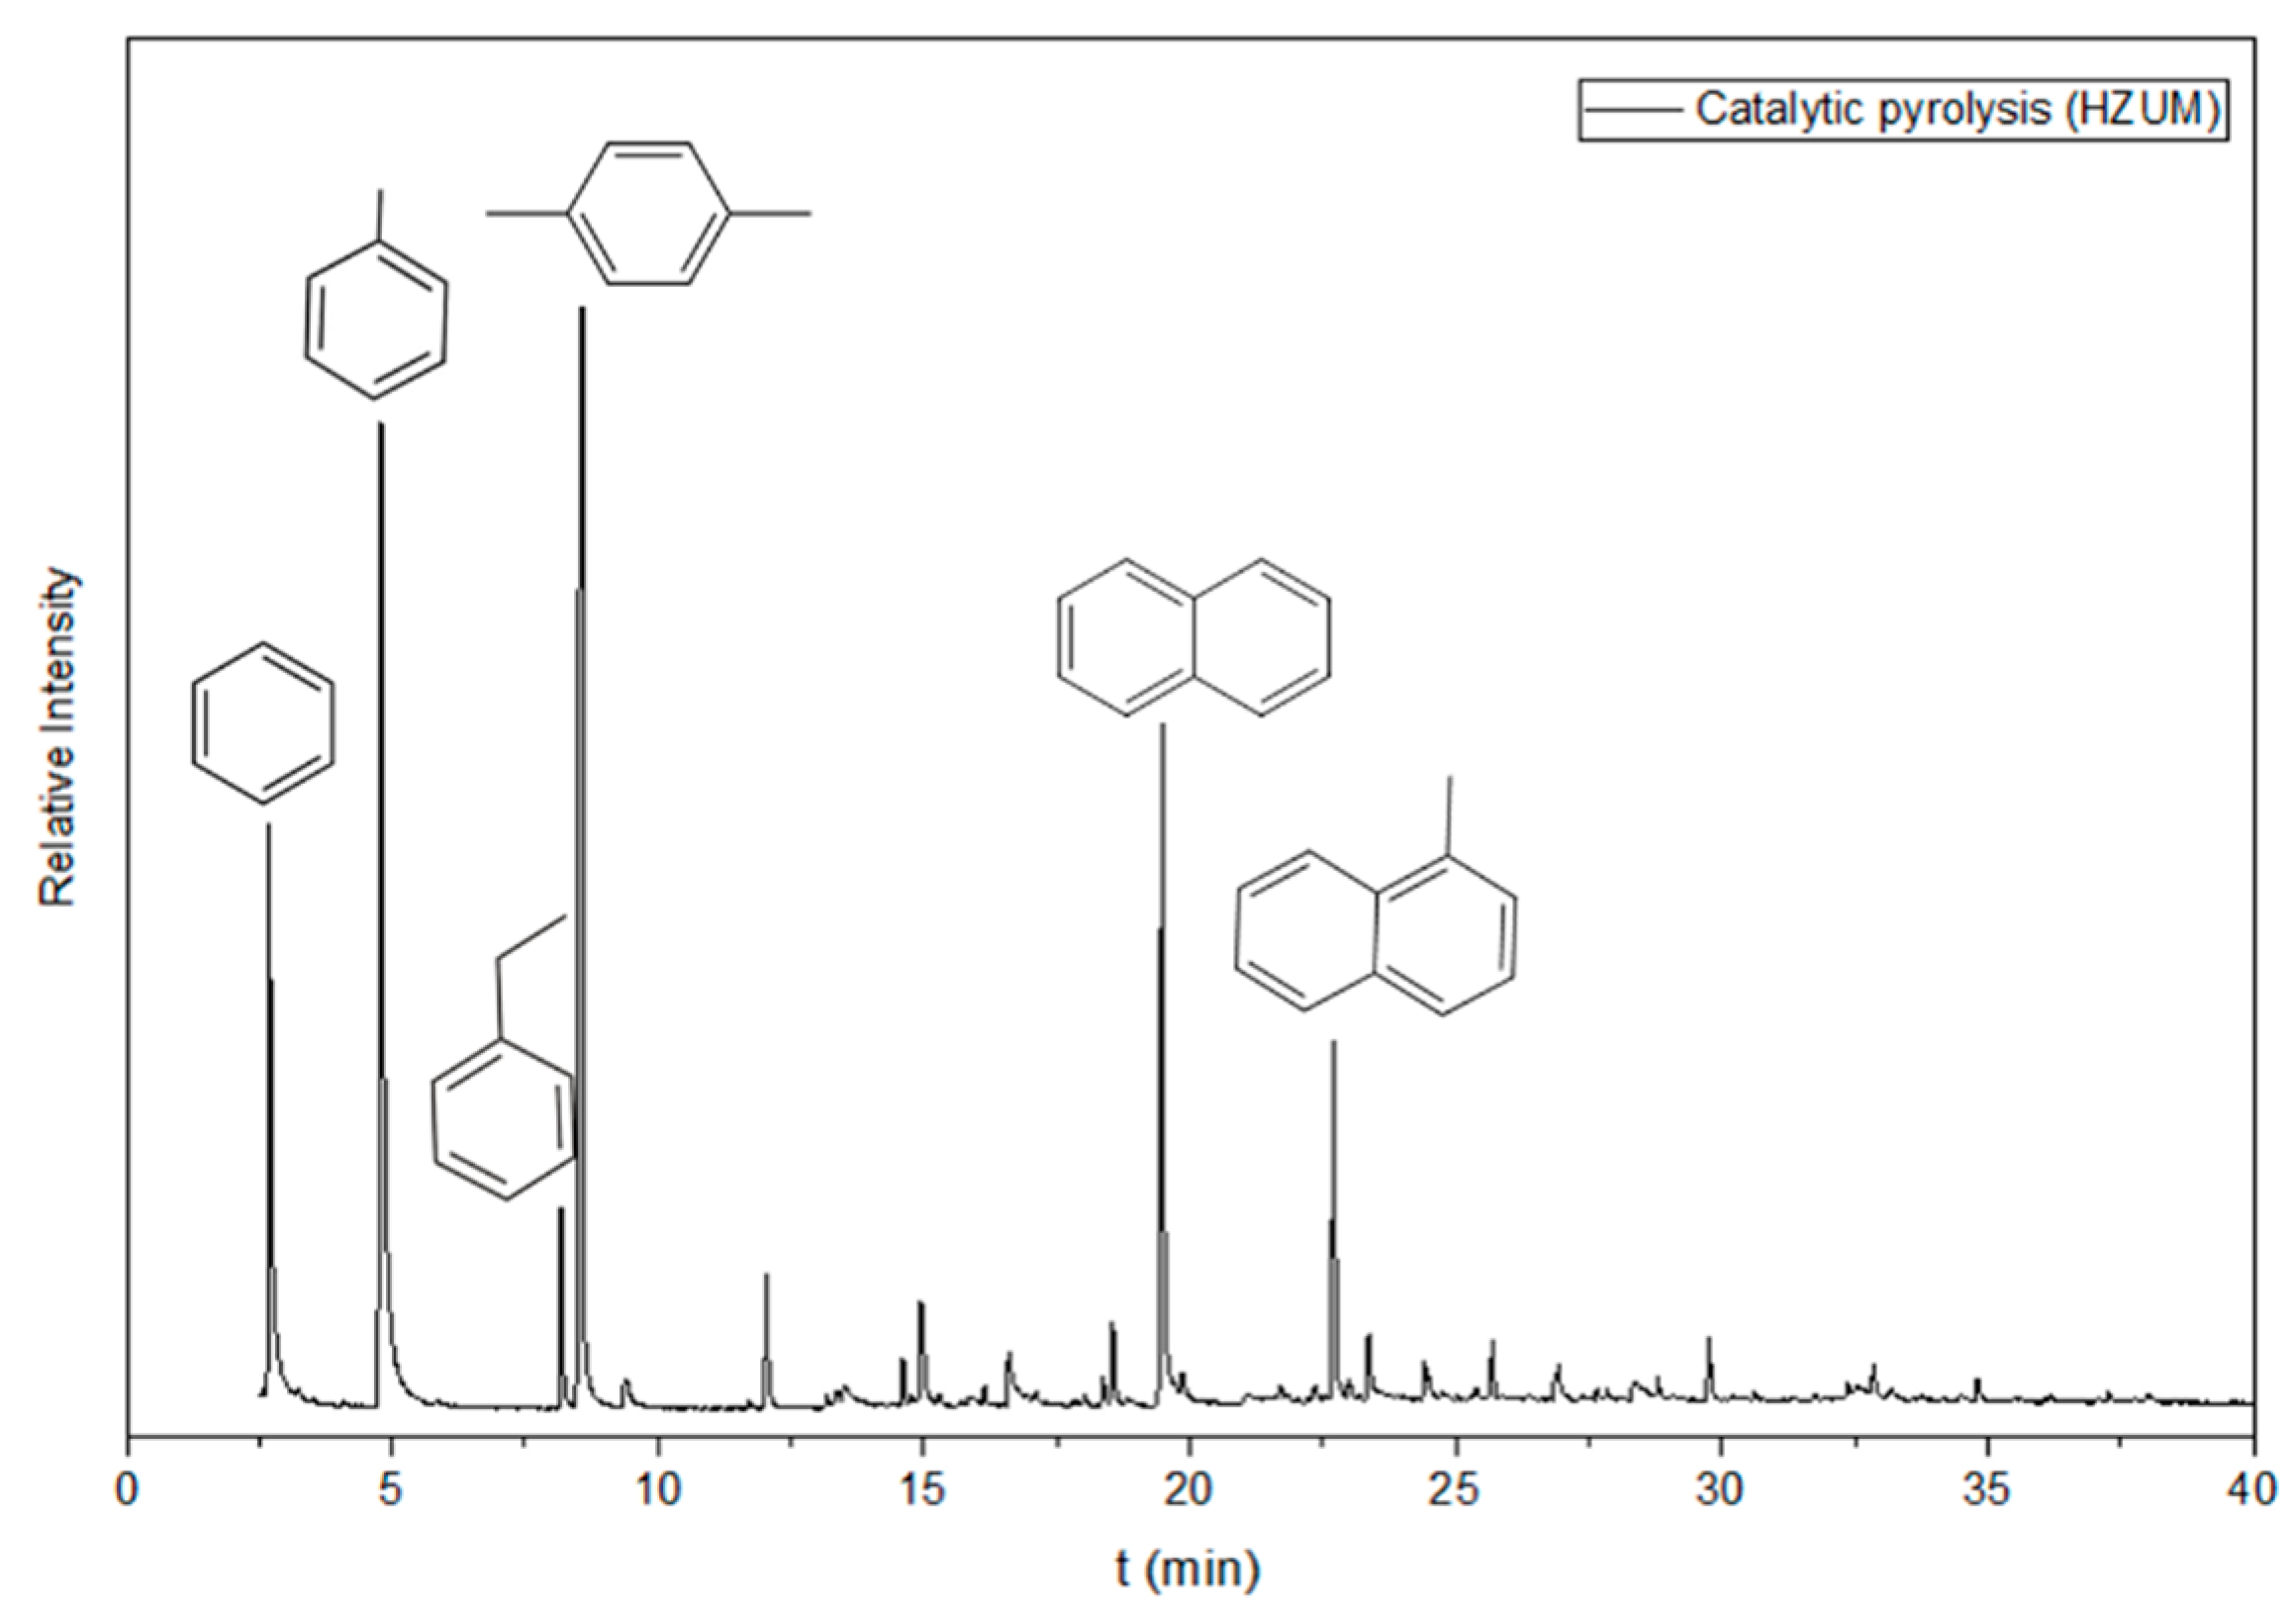
Table 1.
Rice husk ash (RHA) composition determined by XRF analysis.
| Composition | SiO2 | Al2O3 | TiO2 | Fe2O3 | MnO | MgO | CaO | Na2O | K2O | P2O5 | LOI |
| % | 93.49 | 1.36 | nd | nd | 0.3 | 0.12 | 0.33 | Nd | 1.5 | 0.18 | 1.54 |
Table 2.
Si/Al ratio (w/w) values of zeolite-based catalysts. HZ: HZSM5 zeolite without any treatment; HZU: HZSM5 zeolite treated with ultrasound; HZM: HZSM5 zeolite treated with microwave; HZUM: HZSM5 zeolite treated with ultrasound and microwave.
Table 2.
Si/Al ratio (w/w) values of zeolite-based catalysts. HZ: HZSM5 zeolite without any treatment; HZU: HZSM5 zeolite treated with ultrasound; HZM: HZSM5 zeolite treated with microwave; HZUM: HZSM5 zeolite treated with ultrasound and microwave.
| Samples |
Elements (% w/w) Si Al |
Si/Al |
| HZ HZU HZM HZUM |
94.2 3.5 93.8 3.8 93.8 3.9 93.7 4.1 |
27 25 25 23 |
Table 4.
Acidity of the samples obtained by NH3-TPD. HZ: HZSM-5 without any treatment; HZU: HZSM-5 treated with ultrasound; HZM: HZSM-5 treated with microwave; HZUM: HZSM-5 treated with both ultrasound and microwave.
Table 4.
Acidity of the samples obtained by NH3-TPD. HZ: HZSM-5 without any treatment; HZU: HZSM-5 treated with ultrasound; HZM: HZSM-5 treated with microwave; HZUM: HZSM-5 treated with both ultrasound and microwave.
| Samples |
T (maximum) (ºC) 1° 2° 3° peak peak peak |
Relative amount of acid sites (%) Weak Moderate Strong acidity acidity acidity |
Total acidity (µmol NH3/gcat) |
| HZ HZU HZM HZUM |
246 350 461 241 294 467 208 375 426 175 253 460 |
36.0 0.2 63.8 36.7 1.7 59.6 47.8 1.7 50.5 9.5 29.0 61.5 |
327 480 392 571 |
Table 5.
Bronsted and Lewis acid sites of the samples. HZ: HZSM-5 without any treatment; HZU: HZSM-5 treated with ultrasound; HZM: HZSM-5 treated with microwave; HZUM: HZSM-5 treated with both ultrasound and microwave.
Table 5.
Bronsted and Lewis acid sites of the samples. HZ: HZSM-5 without any treatment; HZU: HZSM-5 treated with ultrasound; HZM: HZSM-5 treated with microwave; HZUM: HZSM-5 treated with both ultrasound and microwave.
| Sample | BAS (a.u) | LAS (a.u) | BAS/LAS |
| 1545 (cm−1) | 1445 (cm−1) | ||
| HZ | 0.00031 | 0.0073 | 0.042 |
| HZU | 0.00032 | 0.0073 | 0.044 |
| HZM | 0.00029 | 0.0075 | 0.038 |
| HZUM | 0.00028 | 0.0082 | 0.034 |
Disclaimer/Publisher’s Note: The statements, opinions and data contained in all publications are solely those of the individual author(s) and contributor(s) and not of MDPI and/or the editor(s). MDPI and/or the editor(s) disclaim responsibility for any injury to people or property resulting from any ideas, methods, instructions or products referred to in the content. |
© 2025 by the authors. Licensee MDPI, Basel, Switzerland. This article is an open access article distributed under the terms and conditions of the Creative Commons Attribution (CC BY) license (http://creativecommons.org/licenses/by/4.0/).
Copyright: This open access article is published under a Creative Commons CC BY 4.0 license, which permit the free download, distribution, and reuse, provided that the author and preprint are cited in any reuse.


