
Submitted:
10 November 2025
Posted:
11 November 2025
You are already at the latest version
Abstract
The Logistics Performance Index (LPI), developed by the World Bank, is a global benchmark for assessing national logistics efficiency. However, most studies have treated the LPI as a dependent or descriptive variable, overlooking its potential as a predictive indicator of sustainable development. This study reformulates the LPI as a multivariable explanatory construct to evaluate the predictive capacity of its six dimensions—customs, infrastructure, international shipments, logistics competence, tracking and tracing, and timeliness—on three key sustainability indicators: GDP per capita, the Human Develop- ment Index (HDI), and CO2 emissions. Using 2023 data for approximately 120 countries from the World Bank database, thirteen statistical and machine learning models were applied, including linear regression, penalized regressions, support vector regression (SVR), k-nearest neighbors (KNN), and ensemble methods such as ExtraTrees, Random Forest, Gradient Boosting, CatBoost, and XGBoost. Model performance was evaluated using Spearman’s correlation, mean absolute error (MAE), root mean squared error (RMSE), and SHAP interpretability analysis. Among all models, ensemble algorithms—particularly ExtraTrees—achieved the highest predictive accuracy (ρ ≥ 0.79), identifying infrastructure and tracking as the most influential predictors. K-means clustering revealed three distinct logistic–environmental profiles (low, medium, and high emissions), reflecting structural heterogeneity among countries. The findings demonstrate that the LPI can function as a robust and explainable predictive tool for anticipating economic, social, and environmental outcomes, offering a data-driven framework for designing sustainability-oriented logistics policies.
Keywords:
logistics performance index
; sustainability
; human development index
; machine learning
; predictive analytics
; CO2 emissions
1. Introduction
Logistics has emerged as a strategic pillar of sustainable development, influencing economic competitiveness, social well-being, and environmental impact simultaneously [1,2]. In this context, the Logistics Performance Index (LPI), developed by the World Bank since 2007, provides a standardized, comparative framework for evaluating national logistics performance across six dimensions: customs, infrastructure, international shipments, logistics competence, tracking and tracing, and timeliness [3].
Since 2022, the LPI has incorporated operational metrics and big data sources, enhancing its utility for comparative, empirical, and predictive analyses [4,5]. This method update enables the identification of structural gaps and logistics patterns across regions, extending beyond traditional global rankings. For instance, Germany and Finland are notable for their high efficiency, while Eastern European and Latin American countries persistently struggle [6].
Several studies have suggested possible relationships between logistics performance and development outcomes. However, empirical evidence directly linking the LPI to carbon dioxide () emissions, the Human Development Index (HDI), or gross domestic product (GDP) remains limited[7,8]. Institutional quality, infrastructure, and human capital continue to be major sources of regional disparity [9,10,11,12].
Despite its value as a comparative indicator, the LPI has scarcely been explored as a predictive tool for sustainable development. Most studies treat the LPI as a dependent variable explained by macroeconomic or institutional factors [4,13], thereby limiting its potential for anticipating logistics-related impacts on key development dimensions. Furthermore, using the aggregated index often obscures the specific influence of each of its six components, hindering the design of targeted logistics policies. Additionally, the methodological improvements introduced in the 2023 LPI have not yet been validated as robust predictors of sustainable development [14].
This study adopts a novel approach, treating the LPI as an explanatory variable. A detailed examination of its sub-indicators reveals that efficient infrastructure and logistics systems can reduce energy-related externalities and improve access to essential goods and services, including roads, ports, and transport networks.
Similarly, more agile and efficient customs procedures facilitate international trade by reducing transaction times and costs. This promotes trade expansion, stimulates economic growth, and increases fiscal revenues that support social welfare and development.
Tracking and tracing capabilities require specialized human capital, linking logistics efficiency with workforce training and skill development. Enhanced traceability optimizes cargo movement, decreases operational costs and transit times, and ultimately drives productivity and economic performance.
Finally, punctuality in freight and maritime transport fosters reliable trade flows, competitiveness, and higher GDP per capita, thereby improving living conditions and reinforcing the connection between logistics efficiency and human development.
Through a quantitative comparative analysis, the study assesses the LPI’s predictive capacity on three structural indicators: GDP per capita, HDI, and emissions. Disaggregating by logistics dimension enables identification of the components that best explain environmental, economic, and social performance. This provides empirical evidence for formulating outcome-oriented, sustainable logistics policies.
1.1. Contribution
This study conceptualizes the LPI as a multivariable predictor of sustainable development and assesses its relationship with three key indicators: GDP per capita, the Human Development Index (HDI), and emissions. A wide range of linear, nonlinear, and ensemble machine learning models are applied and compared—including Support Vector Regression (SVR), Multilayer Perceptron (MLP), Kernel Ridge Regression (KRR), Random Forest, Gradient Boosting, CatBoost, and ExtraTrees—to determine the approach with the highest predictive accuracy for each sustainability dimension.
Disaggregating the analysis by the six LPI dimensions allows us to identify which components, such as infrastructure, timeliness, and tracking and tracing, exert the greatest influence on economic, social, and environmental performance. This approach enables the formulation of differentiated logistics policies aligned with specific development objectives.
The empirical analysis draws on 2023 LPI data from approximately 120 countries, including OECD members and Chile as a representative example of Latin American logistics performance.
The results offer quantitative and practical insights for prioritizing logistics interventions based on their expected impact across the three pillars of sustainability.
Accordingly, the research addresses the following questions:
- What is the relationship between LPI dimensions and emissions, and which dimensions best explain this environmental indicator?
- To what extent does the LPI predict HDI, and which logistics components influence this social variable the most?
- Which predictive approach—linear, nonlinear, or ensemble learning—achieves the highest accuracy in estimating GDP per capita based on the LPI?
The structure of this article is as follows: Section 2 reviews the theoretical background of the LPI and its relationship with sustainable development variables. Section 3 describes the method, including the analytical framework, research procedures, and model selection criteria. Section 4 presents the main empirical results. Section 5 discusses the technical and strategic implications of this research and its contribution to the academic debate. Finally, Section 6 provides conclusions and future research directions.
2. Literature Review
2.1. Background
The Logistics Performance Index, developed by the World Bank, is a strategic tool for evaluating national logistics performance. It comprises six dimensions related to customs operations, infrastructure quality, ease of arranging international shipments, logistics competence, tracking and tracing, and timeliness [15,16]. Several studies have demonstrated that the LPI is associated with critical sustainable development variables and can therefore help anticipate logistics impacts in complex contexts.
From an environmental perspective, the LPI has been linked to emissions since components such as infrastructure and timeliness can mitigate negative externalities associated with energy consumption and inefficient transportation use [7]. From a social standpoint, a positive relationship has been found between the LPI and the Human Development Index (HDI), particularly through dimensions such as tracking and logistics competence, which reflect access to essential goods and services [17]. Economically, the LPI has shown a correlation with GDP per capita because it captures factors that directly influence trade efficiency and integration into global value chains [18].
Moreover, specialized literature documents how disruptive events, such as natural disasters, chronic congestion, technical failures, and institutional vulnerabilities, affect supply chain continuity and increase logistics costs [19,20]. In this context, LPI dimensions such as timeliness and tracking are essential for identifying logistics vulnerabilities, predicting disruptions, and improving operational resilience. Recent studies confirm this perspective, emphasizing that engineering standards and structural resilience are crucial for minimizing logistics losses in multi-hazard scenarios Verschuur et al. [21], and highlighting the role of digital transformation and traceability in enabling adaptive capacity during crisis He et al. [22].
2.2. Methods Applied to the Logistics Performance Index
Several studies have examined the relationship between the LPI and sustainable development variables. In the environmental domain, researchers have used fixed-effects regression models and DEA-RAM approaches to link the LPI -particularly the infrastructure, timeliness, and tracking and tracing dimensions- with lower emission levels [11,23]. Other approaches, such as quantile regression and the generalized method of moments (GMM), have been used to capture heterogeneous and dynamic effects. However, these approaches lack external validation or dimension-level analysis [24,25,26].
From a social perspective, studies have identified a positive correlation between the LPI and the HDI, emphasizing the influence of infrastructure and timeliness Kılıç et al. [17], Visbal-Cadavid et al. [27]. However, most of these studies are cross-sectional and lack predictive performance assessment. In the economic dimension, researchers have applied hierarchical models, multicriteria approaches, and data envelopment analysis-based analyses to examine the relationship between the LPI, national competitiveness, and relative logistics efficiency. However, these studies have not directly estimated external variables such as GDP per capita [15,28,29].
Additionally, clustering techniques (e.g., K-means, GMM), multivariate analysis, hierarchical clustering, and Bayesian networks have been used to identify logistics performance patterns among countries, highlighting infrastructure and tracking components [4,30,31]. Likewise, Alotaibi and Alajlan [32] explored the relationship between the LPI, the HDI, and emissions through quantile regression for G20 countries without assessing the LPI’s predictive value or decomposing the index by dimension.
The literature reveals significant associations between the LPI and sustainable development indicators. However, several methodological limitations remain. These gaps motivate the present study: (i) the predominant use of the aggregated index prevents distinguishing the contribution of each logistics dimension, (ii) the limited evaluation of the LPI ’s predictive capacity through a systematic comparison of statistical and machine learning models, and (iii) the lack of an analytical framework connecting the LPI dimensions with environmental, social, and economic indicators in a disaggregated and quantitative manner.
3. Methods and Models
This study proposes a predictive approach to evaluating the Logistics Performance Index as an explanatory variable for three sustainability indicators: emissions, HDI, and GDP per capita. Unlike previous research, which treated the LPI as a dependent or aggregated variable [15,23], this analysis focuses on its capacity to anticipate environmental, social, and economic impacts by disaggregating its six dimensions. The working hypothesis is that improvements in logistics, such as efficient infrastructure, streamlined customs procedures, and effective tracking, stimulate economic growth, strengthen social welfare, and reduce environmental impacts. This is in line with the framework proposed by the Inter-American Development Bank [33]. However, recent evidence suggests that logistics efficiency without green innovation may increase emissions in advanced economies [24], while port investment enhances trade and growth, particularly in emerging economies [34].
3.1. Phase 1: Model Specification
Multiple linear regression models were estimated for each target variable, expressed as:
where corresponds to the six dimensions of the LPI (j=1:customs efficiency, j=2:infrastructure, j=3:international shipments, j=4:logistics services, j=5:tracking, and j=6:timeliness), and .
The assumptions regarding the error terms follow the standard linear model conditions: the expected value of the errors equals zero, and =constant (homoscedasticity), i.e., with ). The estimators, obtained by maximum likelihood, are denoted by , where .
3.2. Phase 2: Machine Learning Models
Thirteen algorithms were implemented and grouped into four families: (i) ensamble methods (ExtraTrees [35], RandomForest [36], CatBoost [37], XGBoost [38], GradientBoosting [39], AdaBoost [40]); (ii) K-Nearest Neighbors [41]; (iii) penalized linear models (Ridge [42], Lasso [43], Elastic Net [44],lineal regression); y (iv) Support Vector Regression [45].
The selection was based on five criteria: predictive accuracy, robustness, computational efficiency, scalability, and interpretability (Table 1).
3.3. Phase 3: Comparative Model Analysis
This phase integrates visualizations and metrics to evaluate the accuracy, stability, interpretability, structural patterns, and computational efficiency of models. The objective is to identify algorithms that provide the best balance of precision and robustness in line with the research questions.
3.3.1. Performance and Stability Comparison
The performance of the models was evaluated using Spearman ’s correlation coefficient (), defined as [46]:
where represents the observed values and are the predicted values and n denotes the total number of observations. This metric measures a model’s ability to preserve the relative order between predicted and observed values. This makes it particularly suitable for cases involving non-strictly linear relationships.
The comparison was complemented with accuracy and error measures: the mean absolute error (MAE) and the root mean square error (RMSE) [46].
3.3.2. Interpretability and Structural Analysis
Model interpretability was addressed using the SHAP (SHapley Additive Explanations) methodology. This methodology assigns each variable, , a value, , representing its average marginal contribution to the model prediction across all possible feature permutations. The SHAP value for a given feature i is defined as [47]:
where F denotes the total set of features, S is a subset of F excluding i, is the model prediction considering only the variables in S, y represents the cardinality of the subset S. This approach ensures a consistent and additive decomposition of the model prediction.
Additionally, the K-means clustering algorithm was applied to normalized logistics variables to explore nonlinear structural patterns between logistics dimensions and emissions [31].
In the K-Means algorithm, the centroids were computed as the average of the observations assigned to each group. Formally, the centroid of cluster j is defined as:
where corresponds to the centroid vector of cluster j, represents the set of countries assigned to cluster j, denotes the standardized feature vector of each country, and is the total number of observations in cluster j. This definition ensures that each centroid reflects the average profile of logistics performance and emissions of the countries it comprises.
The proximity of each country to its cluster was evaluated using the Euclidean distance in the standardized variable space, defined as:
where represents the standardized feature vector (Customs Score, Infrastructure Score, and total ) of country j, and denotes the centroid of the assigned cluster. Smaller distance values identify countries representative of the group, while larger distances indicate peripheral cases with more heterogeneous logistics or energy structures relative to the cluster ’s central profile.
4. Results
4.1. Correlaciones y métricas de desempeño
The initial analysis showed that GDP per capita had the highest correlation (), followed by HDI (). Total emissions had lower values. Among the tested algorithms, ExtraTrees demonstrated the greatest consistency and predictive accuracy because it effectively captures nonlinear interactions and complex dependencies that linear models cannot.
Thirteen algorithms and five specifications were applied, resulting in 65 models. Only two cases did not yield valid results, which are represented as blank cells in Figure 1.
The variable associated with renewable energy exhibited low correlations in the range of and was excluded from the main discussion.
The results summarized in Table 2, confirm that ExtraTrees, GradientBoosting, and CatBoost achieved the best balance between accuracy and stability with a Spearman ’s rho of at least and reduced errors (MAE ≤ 70 thousand; RMSE ≤ 94 thousand). In contrast, AdaBoost showed a significantly lower performance, while XGBoost exhibited greater variability.
4.2. Predictor Importance
The SHAP analysis of the ExtraTrees model for total showed that the Infrastructure and Tracking and Tracing Scores were the most important predictors, followed by Timeliness and Logistics Competence. Customs and International Shipments exhibited lower importance (Figure 2).
4.3. Cluster Analysis
To identify structural patterns between logistics performance and emissions, the K-means algorithm was applied with to standardized variables: Customs Score, Infrastructure Score, and Total (Mt). Since the database contained multiple records per country without an explicit temporal dimension, each country was consolidated into a single observation using average values. The resulting clusters were labeled according to their mean emission levels: Low Emissions, Intermediate Emissions, and High Emissions.
Figure 3 shows the three-dimensional distribution of countries, where three distinct groups emerge:
- Cluster 1 (Low emissions, ): Countries with low-to-medium logistics performance and reduced emissions (median ≈ 8.8 thousand Mt). These economies are characterized by underdeveloped transportation infrastructure, inefficient customs processes, and poor environmental management, reflecting the early stages of logistics modernization.
- Cluster 3 (Intermediate, ): Countries with intermediate–high logistics performance and moderate emissions (median ≈ 37 thousand Mt). This group includes economies that have improved logistics efficiency and environmental control. Others, however, remain dependent on fossil fuel–based strategies. In these cases, the transition toward sustainable logistics largely depends on the energy matrix, degree of urbanization, and level of production diversification. Overall, this cluster represents economies in transition toward greater sustainability.
- Cluster 2 (High emissions, ): Economies with advanced logistics infrastructure and very high emissions (median ≈ 574 thousand Mt). In these countries, developing logistics enhances competitiveness, but it also leads to higher emissions. Logistics activity is often closely associated with the production and distribution of hydrocarbons, which intensifies its environmental impact.
Comparative statistics are presented in Table 3, which reveals clear differences in both the magnitude of emissions and logistics performance. This confirms the structural heterogeneity among countries. The table summarizes statistics for each logistics-environmental cluster and considers the average of the LPI dimensions of customs and infrastructure (on a scale of 0–5) as well as absolute (Mt). For each group, measures of central tendency (mean and median) and dispersion are reported (in megatons). In this case, dispersion is represented by the interquartile range (IQR), which is the interval between the 25th and 75th percentiles. This allows us to evaluate the internal heterogeneity of the classified countries.
Table 4 presents the 20 countries with the highest absolute emissions, along with their logistics-environmental cluster and distance to the centroid. This distance was calculated using the centroid definition of the K-Means algorithm (Ecuación (6)), that is, as the average of the standardized features of the countries assigned to each group. In this framework, lower distances indicate representative cases of the cluster, while higher distances reveal peripheral positions with more heterogeneous logistics or energy profiles.
The results show a concentration of major emitters in the High Emissions cluster (e.g., Japan and Germany), which is characterized by medium-to-high logistics performance and high volumes. However, some countries with high absolute emissions were found in the Low Emissions cluster (e.g., Kazakhstan and Ukraine), which confirms that the classification depends on the combined Customs and Infrastructure profile rather than solely on emission levels.
In terms of internal representativeness, Saudi Arabia exhibited a small distance to the centroid (a typical profile of the High Emissions group), whereas Japan and Iran showed larger distances, indicating logistics trajectories that are less aligned with the cluster’s central pattern. This finding demonstrates structural heterogeneity even among highly industrialized countries with high emissions.
4.4. Correlations and Explained Variance
4.5. Residual Analysis
Figure 5 shows the distribution of standardized residuals for total in the ExtraTrees model. The symmetric, zero-centered distribution indicates a consistent fit without systematic bias. A few outliers appear at the extremes, corresponding to countries with specific logistics structures and energy matrices.
5. Discussion
The results confirm that the LPI is a robust predictor in the economic and social dimensions, though its explanatory capacity in the environmental dimension is limited. GDP per capita was the best-explained variable, with average values of and maximums of 0.817. These values showed the relationship between logistics efficiency, competitiveness, and integration into global value chains, which is consistent with [18]. Although GDP per capita does not capture income distribution, its widespread use in the literature establishes it as a standard reference for economic development [7]. In this context, tracking, infrastructure, and timeliness are critical factors for economic growth. These results could inform investments in and modernization of the logistics system to improve customs performance and infrastructure for more efficient freight transport.
In the social dimension, the strong correlation with the HDI confirms that logistics efficiency directly affects access to goods and services, reinforcing its role in human well-being and social equity. Timeliness and tracking appear as key determinants of this relationship, consistent with research linking logistics to inclusion and territorial cohesion [17,27].
Residual analysis showed the models’ robustness, though the presence of outliers indicates that explaining emissions requires complementing logistics dimensions with energy and industrial factors. This finding indicates that, although the LPI is a strategic indicator, it should be integrated with other environmental metrics to comprehensively evaluate sustainability.
5.1. Analysis of Sustainable Aspects
In this study, sustainability is interpreted under the Triple Bottom Line (TBL) framework, which integrates three interdependent dimensions:
- People (Social): Tracking and timeliness promote equitable access to goods and services, thereby enhancing human development.
- Planet (Ambiental): The impact of logistics efficiency on emissions, which is closely related to infrastructure and transport performance.
- Profit (Económico): The relationship between logistics performance, GDP per capita, and competitiveness, emphasizing the role of infrastructure and customs efficiency.
The TBL framework is directly aligned with Sustainable Development Goals 8, 12, and 13. [48]. Figure 6 Figure 1 represents the integration of the TBL framework into the LPI context, showing how the three dimensions interact in assessing logistics sustainability.
Table 6 summarizes the average Spearman correlation coefficients () obtained for each dimension and their intersections, quantifying the predictive power of the LPI as an indicator of sustainability.
Within this framework, three key intersections were identified:
- Bearable (Ambiental ∩ Social): ∩ HDI with , reflecting a sustainable and livable development path.
- Viable (Ambiental ∩ Economic): ∩ GDP per capita with , indicating moderate viability between environmental performance and economic growth.
- Equitable (Social ∩ Economic): HDI ∩ GDP per capita with , showing that logistics quality can promote both social equity and economic expansion simultaneously.
The convergence of these three dimensions defines the sustainable domain, representing balanced logistics performance with direct implications for the SDGs [7,49]. This demonstrates that the LPI captures not only efficiency and competitiveness, but also provides an integrated analytical perspective on sustainable development.
5.2. Cluster Analysis and Logistic Sustainability
Analysis of Table 4 confirms that countries with the highest emissions are concentrated in the High Emissions cluster. This cluster is characterized by medium–to-high logistics performance and strong integration into global value chains. This pattern reflects a structural trade-off between competitiveness and sustainability. Countries with advanced infrastructure and efficient logistics networks, such as Japan and Germany, generate significant emissions due to their reliance on energy- and transport-intensive industrial sectors [24].
The results presented in Section 4.3 show that the relationship between logistics performance and emissions is neither linear nor uniform.
- Cluster 1 (Low) comprises mainly small or developing economies (e.g. Laos, Guatemala and Papua New Guinea), which are characterized by limited transport networks and low absolute emissions. This group also contains atypical cases with high emissions, such as Kazakhstan, Pakistan and Iraq. These countries are classified as such because their combined customs and infrastructure profiles are closer to the low-performance centroid than to those of advanced economies. Therefore, membership in a cluster depends not solely on absolute emissions, but also on the interaction between logistics performance and environmental footprint.
- Cluster 2 (High) comprises countries with advanced infrastructure and modern logistics systems (e.g. Japan, Germany, Canada and Saudi Arabia). In these economies, logistics expansion enhances competitiveness, but it also increases emissions, generating notable environmental externalities [24]. In energy- and resource-exporting economies such as Saudi Arabia and Iran, logistics are closely tied to hydrocarbon trade, which further intensifying their carbon footprint.
- Cluster 3 (Intermediate) includes countries with medium–high logistics performance and intermediate emission levels (e.g. Israel, New Zealand and Kuwait). This cluster exhibits high internal dispersion: while some nations have combined logistics improvement with environmental mitigation (such as New Zealand), while others continue carbon-intensive trajectories (e.g., Italy or Poland). This suggests that the transition toward sustainable logistics is not a homogeneous process, but rather depends on factors such as the energy mix, degree of urbanization and productive diversification. Therefore, the intermediate cluster represents a transitional stage toward sustainability.
A regional analysis reveals additional patterns. In Latin America, for instance, Mexico and Brazil belong to the High cluster, reflecting their economic influence in the region and the absence of strict emission regulations. Most Latin American countries, however, are concentrated in the low cluster, which is characterized by limited infrastructure and low absolute emissions. In Asia, the largest proportion of high-cluster countries (Japan, Iran, Indonesia, Saudi Arabia, and South Korea) highlights the link between industrialization and dependency on fossil fuels. Germany is the only European country in this group, which is an important finding given its recognized logistics efficiency and highly carbon-intensive industrial structure.
The results also show that the clusters reflect structural differences in countries’ economic and human development levels. The Low cluster comprises mainly less-developed nations with lower economic activity, resulting in reduced LPI scores and emission levels. In contrast, the High cluster comprises advanced economies with high levels of development and welfare, but with insufficient environmental regulation, leading to very high emissions. The intermediate cluster is particularly relevant as it comprises emerging economies that combine mid-level logistics indicators with incipient sustainability strategies. This suggests that these countries are attempting to achieve growth without following carbon-intensive trajectories.
Table 7 summarizes the comparative profiles of the three clusters, and Figure 7 shows their relative positions. Together, these representations reveal the clusters’ structural heterogeneity: the High cluster has median emissions of around 574 thousand metric tons of , whereas the Low cluster barely reaches 8.8 thousand metric tons. The intermediate cluster encompasses diverse pathways toward aligning logistics competitiveness with environmental sustainability.
The cluster analysis shows that logistical efficiency does not automatically imply sustainability. For countries in the High group, the priority should be advancing green innovation and the energy transition. For countries in the intermediate group, the priority should be consolidating policies that decouple logistics growth from emissions. For countries in the low group, the priority should be improving infrastructure and connectivity while avoiding carbon-intensive development paths. These findings align with recent literature on sustainable logistics, which emphasizes the integration of economic, social, and environmental objectives into public policy [32,34].
5.3. Strategic Applications of the Logistics Performance Index
Table 8 provides a synthesis of the reviewed literature linking logistics performance with the three pillars of sustainability—environmental, social, and economic—structured according to the Planet–People–Profit framework (see Figure 6). This synthesis reveals that the analyzed studies have strategic implications for sustainable development, supporting the design of decarbonization policies, technological innovation, and logistics digitalization.
In this context, the LPI emerges as a valuable explanatory variable capable of modeling the balance between efficiency, equity, and sustainability. Beyond descriptive benchmarking, providing a quantitative foundation for strategic planning and decision-making aligned with Sustainable Development Goals 8, 9, 11, 13, and 17.
Within the predictive framework proposed in this study, variables are organized into two complementary categories:
- Strategic Challenge Variables: Structural factors that define the logistics system and are expressed through measurable conditions, such as emission intensity, energy dependence, and human capital gaps, that influence sustainable performance. These act as model inputs, describing the system’s initial state and inherent constraints.
- Suggested action variables: Strategic responses or interventions derived from quantitative analyses aimed at transforming initial conditions toward more sustainable scenarios. They operate as model outputs representing policies, investments, or transformations that optimize the balance among logistics efficiency, environmental sustainability, and social equity.
Table 8 conceptualizes the LPI as a quantitative system that links logistics variables with the three pillars of sustainability through an input-output structure consistent with the Planet-People-Profit framework.
5.4. Future Research Directions
This study is a methodological and empirical advancement because it reformulates the Logistics Performance Index as a predictive, multivariable indicator of sustainable development. This approach moves beyond the descriptive and structural methods that dominate existing literature. This study establishes the LPI as a tool that can anticipate economic, social, and environmental impacts through comparative predictive models based on machine learning.
Table 9 summarizes the works reviewed in Section 5.3. While previous studies mainly relied on econometric, spatial, or efficiency-based approaches, the present research integrates machine learning techniques, cross-validation, and SHAP-based interpretability. This enhances the predictive analysis’s robustness, transparency, and reproducibility.
The proposed model introduces a comparative analytical framework that simultaneously evaluates the three dimensions of development—economic, social, and environmental—under the Planet–People–Profit framework. It provides replicable, policy-relevant, quantitative evidence for sustainable logistics planning. Furthermore, including ensemble algorithms and unsupervised clustering methods enables the model to capture structural heterogeneity and classify logistics-environmental patterns. This expands the empirical understanding of the relationship between logistics performance and sustainability.
Based on these results, three research avenues are proposed:
- (i)
- Generalize hybrid predictive models (machine learning (ML) + optimization) applied to the LPI, incorporating dynamic and nonlinear scenarios to improve explanatory power and structural sensitivity.;
- (ii)
- Extend the analysis to time series and dynamic panels to validate the stability and causality of the index across different regional and development contexts.
- (iii)
- Formalize composite LPI––HDI–GDP metrics aimed at quantifying green efficiency and logistics equity as integrated dimensions of sustainable performance.
6. Conclusions
The results confirm that the LPI goes beyond its descriptive role to behave as a robust predictor of sustainable development, particularly in economic and social dimensions. Of the analyzed variables, GDP per capita had the highest predictive accuracy (), which validates the influence of infrastructure, tracking, and timeliness as key drivers of economic growth and competitiveness. In the social dimension, the strong correlation between the LPI and the HDI shows that efficient logistics directly improves equitable access to goods and services. This reinforces the link between operational reliability and territorial well-being.
In contrast, the predictive capacity in the environmental dimension was limited, suggesting that emissions depend largely on energy and industrial factors external to the logistics system. Nevertheless, SHAP and clustering analyses revealed that infrastructure and tracking partially influence environmental outcomes. This confirms the LPI’s explanatory relevance within integrated sustainability models.
From a methodological perspective, ensemble models, particularly ExtraTrees, Gradient Boosting, and CatBoost, consistently outperformed traditional linear approaches in terms of both accuracy and stability. This finding reinforces the relevance of machine learning as an analytical tool for the predictive evaluation of logistics sustainability.
Overall, this study shows that the LPI can be used for strategic planning to predict economic and social outcomes, design differentiated logistics policies, and support decision-making aimed at promoting growth, equity, and environmental mitigation. However, its comprehensive application requires complementary energy and industrial metrics to better capture the complexity of sustainable systems.
Future research should focus on developing hybrid predictive models that combine machine learning with mathematical optimization. These models should extend the analysis to time series and dynamic panels to assess causality and incorporate composite LPI––HDI–GDP metrics to formalize green efficiency and logistics equity.
Author Contributions
Conceptualization, C.D. and I.D.; methodology, C.D. and I.D.; software, C.C.; validation, C.C. and I.D.; formal analysis, C.D. and I.D.; investigation, C.D. and I.D.; resources, C.D. and I.D.; data curation, C.C. and I.D.; writing—original draft preparation, C.D., and I.D.; visualization, C.D.and C.C.; funding acquisition, I.D. All authors have read and agreed to the published version of the manuscript.
Funding
This research was funded by The Industrial Engineering Department of the Universidad de Santiago de Chile, the Facultad de Ingeniería de la Universidad de Santiago de Chile, USACH.
Data Availability Statement
Dataset available on request from the authors.
Acknowledgments
We would like to thank to the Universidad de Santiago de Chile for their support in this research.
Conflicts of Interest
The authors declare no conflicts of interest.
References
- Liang, Z.; Chiu, Y.h.; Guo, Q.; Liang, Z. Low-carbon logistics efficiency: Analysis on the statistical data of the logistics industry of 13 cities in Jiangsu Province, China. Research in Transportation Business & Management 2022, 43, 100740. [CrossRef]
- Wang, Y.; Liu, D.; Sui, X.; Li, F. Does logistics efficiency matter? Evidence from green economic efficiency side. Research in International Business and Finance 2022, 61, 101650. [CrossRef]
- World Bank. World Bank releases Logistics Performance Index 2023. https://www.worldbank.org/en/news/press-release/2023/04/21/world-bank-releases-logistics-performance-index-2023, 2023. Press release, April 21, 2023.
- Jonasíková, D.; Konečný, V.; Zuzaniak, M. Evolution of logistics performance index and their structure in selected countries. Transportation Research Procedia 2025, 87, 217–231. VSI: TRPRO_LOGI 2024, . [CrossRef]
- Arvis, J.F.; Ojala, L.; Shepherd, B.; Ulybina, D.; Wiederer, C. Connecting to Compete 2023: Trade Logistics in an Uncertain Global Economy - The Logistics Performance Index and Its Indicators. Report 39760, World Bank Publications, 2023. [CrossRef]
- Ojala, L.; Çelebi, D. The World Bank’s Logistics Performance Index (LPI) and drivers of logistics performance. In Proceedings of the Proceedings of MAC-EMM, OECD, Querétaro, México, 2015; pp. 3–30. Presented at the International Transport Forum Roundtable, March 9–10, 2015.
- Ibrahim, M.D.; Pereira, M.A.; Caldas, P. Efficiency analysis of the innovation-driven sustainable logistics industry. Socio-Economic Planning Sciences 2024, 96, 102050. [CrossRef]
- Carraro, C.; Campagnolo, L.; Eboli, F.; Lanzi, E.; Parrado, R.; Portale, E. Quantifying Sustainability: A New Approach and World Ranking. Technical report, Fondazione Eni Enrico Mattei (FEEM), 2012.
- Phuong Vu, T.; Grant, D.B.; Menachof, D.A. Exploring logistics service quality in Hai Phong, Vietnam. The Asian Journal of Shipping and Logistics 2020, 36, 54–64. [CrossRef]
- Oyesiku, O.O.; Somuyiwa, A.O.; Oduwole, A.O. Analysis of transport and logistics education regulations and economic development in Nigeria. Transportation Research Procedia 2020, 48, 2462–2487. Proceedings of WCTR 2019 Mumbai, . [CrossRef]
- Karaduman, H.A.; Karaman-Akgül, A.; Çağlar, M.; Akbaş, H.E. The relationship between logistics performance and carbon emissions: an empirical investigation on Balkan countries. International Journal of Climate Change Strategies and Management 2020, 12, 449–461. [CrossRef]
- Sergi, B.S.; D’Aleo, V.; Konecka, S.; Szopik-Depczyńska, K.; Dembińska, I.; Ioppolo, G. Competitiveness and the Logistics Performance Index: The ANOVA method application for Africa, Asia, and the EU regions. Sustainable Cities and Society 2021, 69, 102845. [CrossRef]
- Jomthanachai, S.; Wong, W.P.; Khaw, K.W. An Application of Machine Learning to Logistics Performance Prediction: An Economics Attribute-Based of Collective Instance. Comput. Econ. 2023, 63, 741–792. [CrossRef]
- Göçer, A.; Özgür Özpeynirci.; Semiz, M. Logistics performance index-driven policy development: An application to Turkey. Transport Policy 2022, 124, 20–32. [CrossRef]
- Çemberci, M.; Civelek, M.E.; Canbolat, N. The Moderator Effect of Global Competitiveness Index on Dimensions of Logistics Performance Index. Procedia - Social and Behavioral Sciences 2015, 195, 1514–1524. World Conference on Technology, Innovation and Entrepreneurship, . [CrossRef]
- Arikan Kargi, V.S. Evaluation of logistics performance of the OECD member countries with integrated entropy and WASPAS method. Journal of Management & Economics 2022, 29.
- Kılıç, A.; Akdamar, E.; Göğebakan, M.; Bastug, S. Effect of Logistics Performance Index on Human Development Index: An Application to Logistics Sector. Transactions on Maritime Science 2023, 12. [CrossRef]
- Song, M.J.; Lee, H.Y. The relationship between international trade and logistics performance: A focus on the South Korean industrial sector. Research in Transportation Business & Management 2022, 44, 100786. [CrossRef]
- Cho, H.S.; Lee, J.S.; Moon, H.C. Maritime Risk in Seaport Operation: A Cross-Country Empirical Analysis with Theoretical Foundations. The Asian Journal of Shipping and Logistics 2018, 34, 240–247. [CrossRef]
- Romero-Faz, D.; Camarero-Orive, A. Risk assessment of critical infrastructures – New parameters for commercial ports. International Journal of Critical Infrastructure Protection 2017, 18, 50–57. [CrossRef]
- Verschuur, J.; Koks, E.; Li, S.; Hall, J. Multi-hazard risk to global port infrastructure and resulting trade and logistics losses. Communications Earth & Environment 2023, 4. [CrossRef]
- He, X.; Hu, W.; Li, W.; Hu, R. Digital transformation, technological innovation, and operational resilience of port firms in case of supply chain disruption. Marine Pollution Bulletin 2023, 190, 114811. [CrossRef]
- Lu, M.; Xie, R.; Chen, P.; Zou, Y.; Tang, J. Green Transportation and Logistics Performance: An Improved Composite Index. Sustainability 2019, 11. [CrossRef]
- Magazzino, C.; Alola, A.A.; Schneider, N. The trilemma of innovation, logistics performance, and environmental quality in 25 topmost logistics countries: A quantile regression evidence. Journal of Cleaner Production 2021, 322, 129050. [CrossRef]
- Liu, J.; Yuan, C.; Hafeez, M.; Yuan, Q. The relationship between environment and logistics performance: Evidence from Asian countries. Journal of Cleaner Production 2018, 204, 282–291. [CrossRef]
- Wan, B.; Wan, W.; Hanif, N.; Ahmed, Z. Logistics performance and environmental sustainability: Do green innovation, renewable energy, and economic globalization matter? Frontiers in Environmental Science 2022, Volume 10 - 2022. [CrossRef]
- Visbal-Cadavid, D.; Delahoz-Domínguez, E.; Mendoza-Mendoza, A. A multiple factor analysis and hierarchical clustering of global logistics governance and development. Decision Analytics Journal 2025, 15, 100579. [CrossRef]
- Beysenbaev, R.; Dus, Y. Proposals for improving the Logistics Performance Index. The Asian Journal of Shipping and Logistics 2020, 36, 34–42. [CrossRef]
- Akdamar, E. THE EFFECT OF HUMAN DEVELOPMENT ON THE LOGISTICS EFFICIENCY OF THE COUNTRIES. Mehmet Akif Ersoy Üniversitesi İktisadi ve İdari Bilimler Fakültesi Dergisi 2022, 9, 871–896.
- Qazi, A. Adoption of a probabilistic network model investigating country risk drivers that influence logistics performance indicators. Environmental Impact Assessment Review 2022, 94, 106760. [CrossRef]
- Chomjinda, J.; Piladaeng, J.; Kulthon, T.; Thongnim, P. Green Clustering Analyzing Logistics Performance and Carbon Emissions with K -Means and Gaussian Mixture Models. In Proceedings of the 2024 International Technical Conference on Circuits/Systems, Computers, and Communications (ITC-CSCC), 2024, pp. 1–6. [CrossRef]
- Alotaibi, A.A.; Alajlan, N. Using Quantile Regression to Analyze the Relationship between Socioeconomic Indicators and Carbon Dioxide Emissions in G20 Countries. Sustainability 2021, 13. [CrossRef]
- Banco Interamericano de Desarrollo (BID). Infraestructura física y logística para la integración regional y el fortalecimiento de las cadenas de valor en los países andinos. Technical report, INTAL - Instituto para la Integración de América Latina y el Caribe, 2021.
- Munim, Z.H.; Schramm, H.J. The Impacts of Port Infrastructure and Logistics Performance on Economic Growth: The Mediating Role of Seaborne Trade. Journal of Shipping and Trade 2018, 3, 1–19. [CrossRef]
- Geurts, P.; Ernst, D.; Wehenkel, L. Extremely randomized trees. Machine Learning 2006, 63, 3–42. [CrossRef]
- Breiman, L. Random forests. Machine Learning 2001, 45, 5–32. [CrossRef]
- Prokhorenkova, L.; Gusev, G.; Vorobev, A.; Dorogush, A.V.; Gulin, A. CatBoost: Unbiased boosting with categorical features. arXiv preprint arXiv:1706.09516 2019.
- Chen, T.; Guestrin, C. XGBoost: A scalable tree boosting system. In Proceedings of the Proceedings of the 22nd ACM SIGKDD International Conference on Knowledge Discovery and Data Mining (KDD ’16). ACM, 2016, pp. 785–794. [CrossRef]
- Friedman, J.H. Greedy function approximation: A gradient boosting machine. Annals of Statistics 2000, 29, 1189–1232. [CrossRef]
- Schapire, R.E. Explaining AdaBoost. In Empirical Inference; Springer Berlin Heidelberg, 2013; pp. 37–52. [CrossRef]
- Cover, T.; Hart, P. Nearest Neighbor Pattern Classification. IEEE Transactions on Information Theory 1967, 13, 21–27. [CrossRef]
- Hoerl, A.E.; Kennard, R.W. Ridge Regression: Biased Estimation for Nonorthogonal Problems. Technometrics 1970, 12, 55–67. [CrossRef]
- Tibshirani, R. Regression Shrinkage and Selection via the Lasso. Journal of the Royal Statistical Society: Series B (Methodological) 2018, 58, 267–288. [CrossRef]
- Zou, H.; Hastie, T. Regularization and Variable Selection via the Elastic Net. Journal of the Royal Statistical Society: Series B (Statistical Methodology) 2005, 67, 301–320. [CrossRef]
- Awad, M.; Khanna, R. Support Vector Regression. In Efficient Learning Machines: Theories, Concepts, and Applications for Engineers and System Designers; Apress: Berkeley, CA, 2015; pp. 67–80. [CrossRef]
- Shani, G.; Gunawardana, A., Evaluating Recommendation Systems. In Recommender Systems Handbook; Springer US: Boston, MA, 2011; pp. 257–297. [CrossRef]
- Lundberg, S.M.; Lee, S.I. A Unified Approach to Interpreting Model Predictions. In Proceedings of the Proceedings of the 31st International Conference on Neural Information Processing Systems (NIPS 2017), Red Hook, NY, USA, 2017; pp. 4768–4777.
- Nica, I.; Chiriță, N.; Georgescu, I. Triple Bottom Line in Sustainable Development: A Comprehensive Bibliometric Analysis. Sustainability 2025, 17. [CrossRef]
- Derpich, I.; Duran, C.; Carrasco, R.; Moreno, F.; Fernandez-Campusano, C.; Espinosa-Leal, L. Pursuing Optimization Using Multimodal Transportation System: A Strategic Approach to Minimizing Costs and CO2 Emissions. Journal of Marine Science and Engineering 2024, 12. [CrossRef]
Figure 1.
Spearman correlation between predictions and observed values for different models and target variables.
Figure 1.
Spearman correlation between predictions and observed values for different models and target variables.
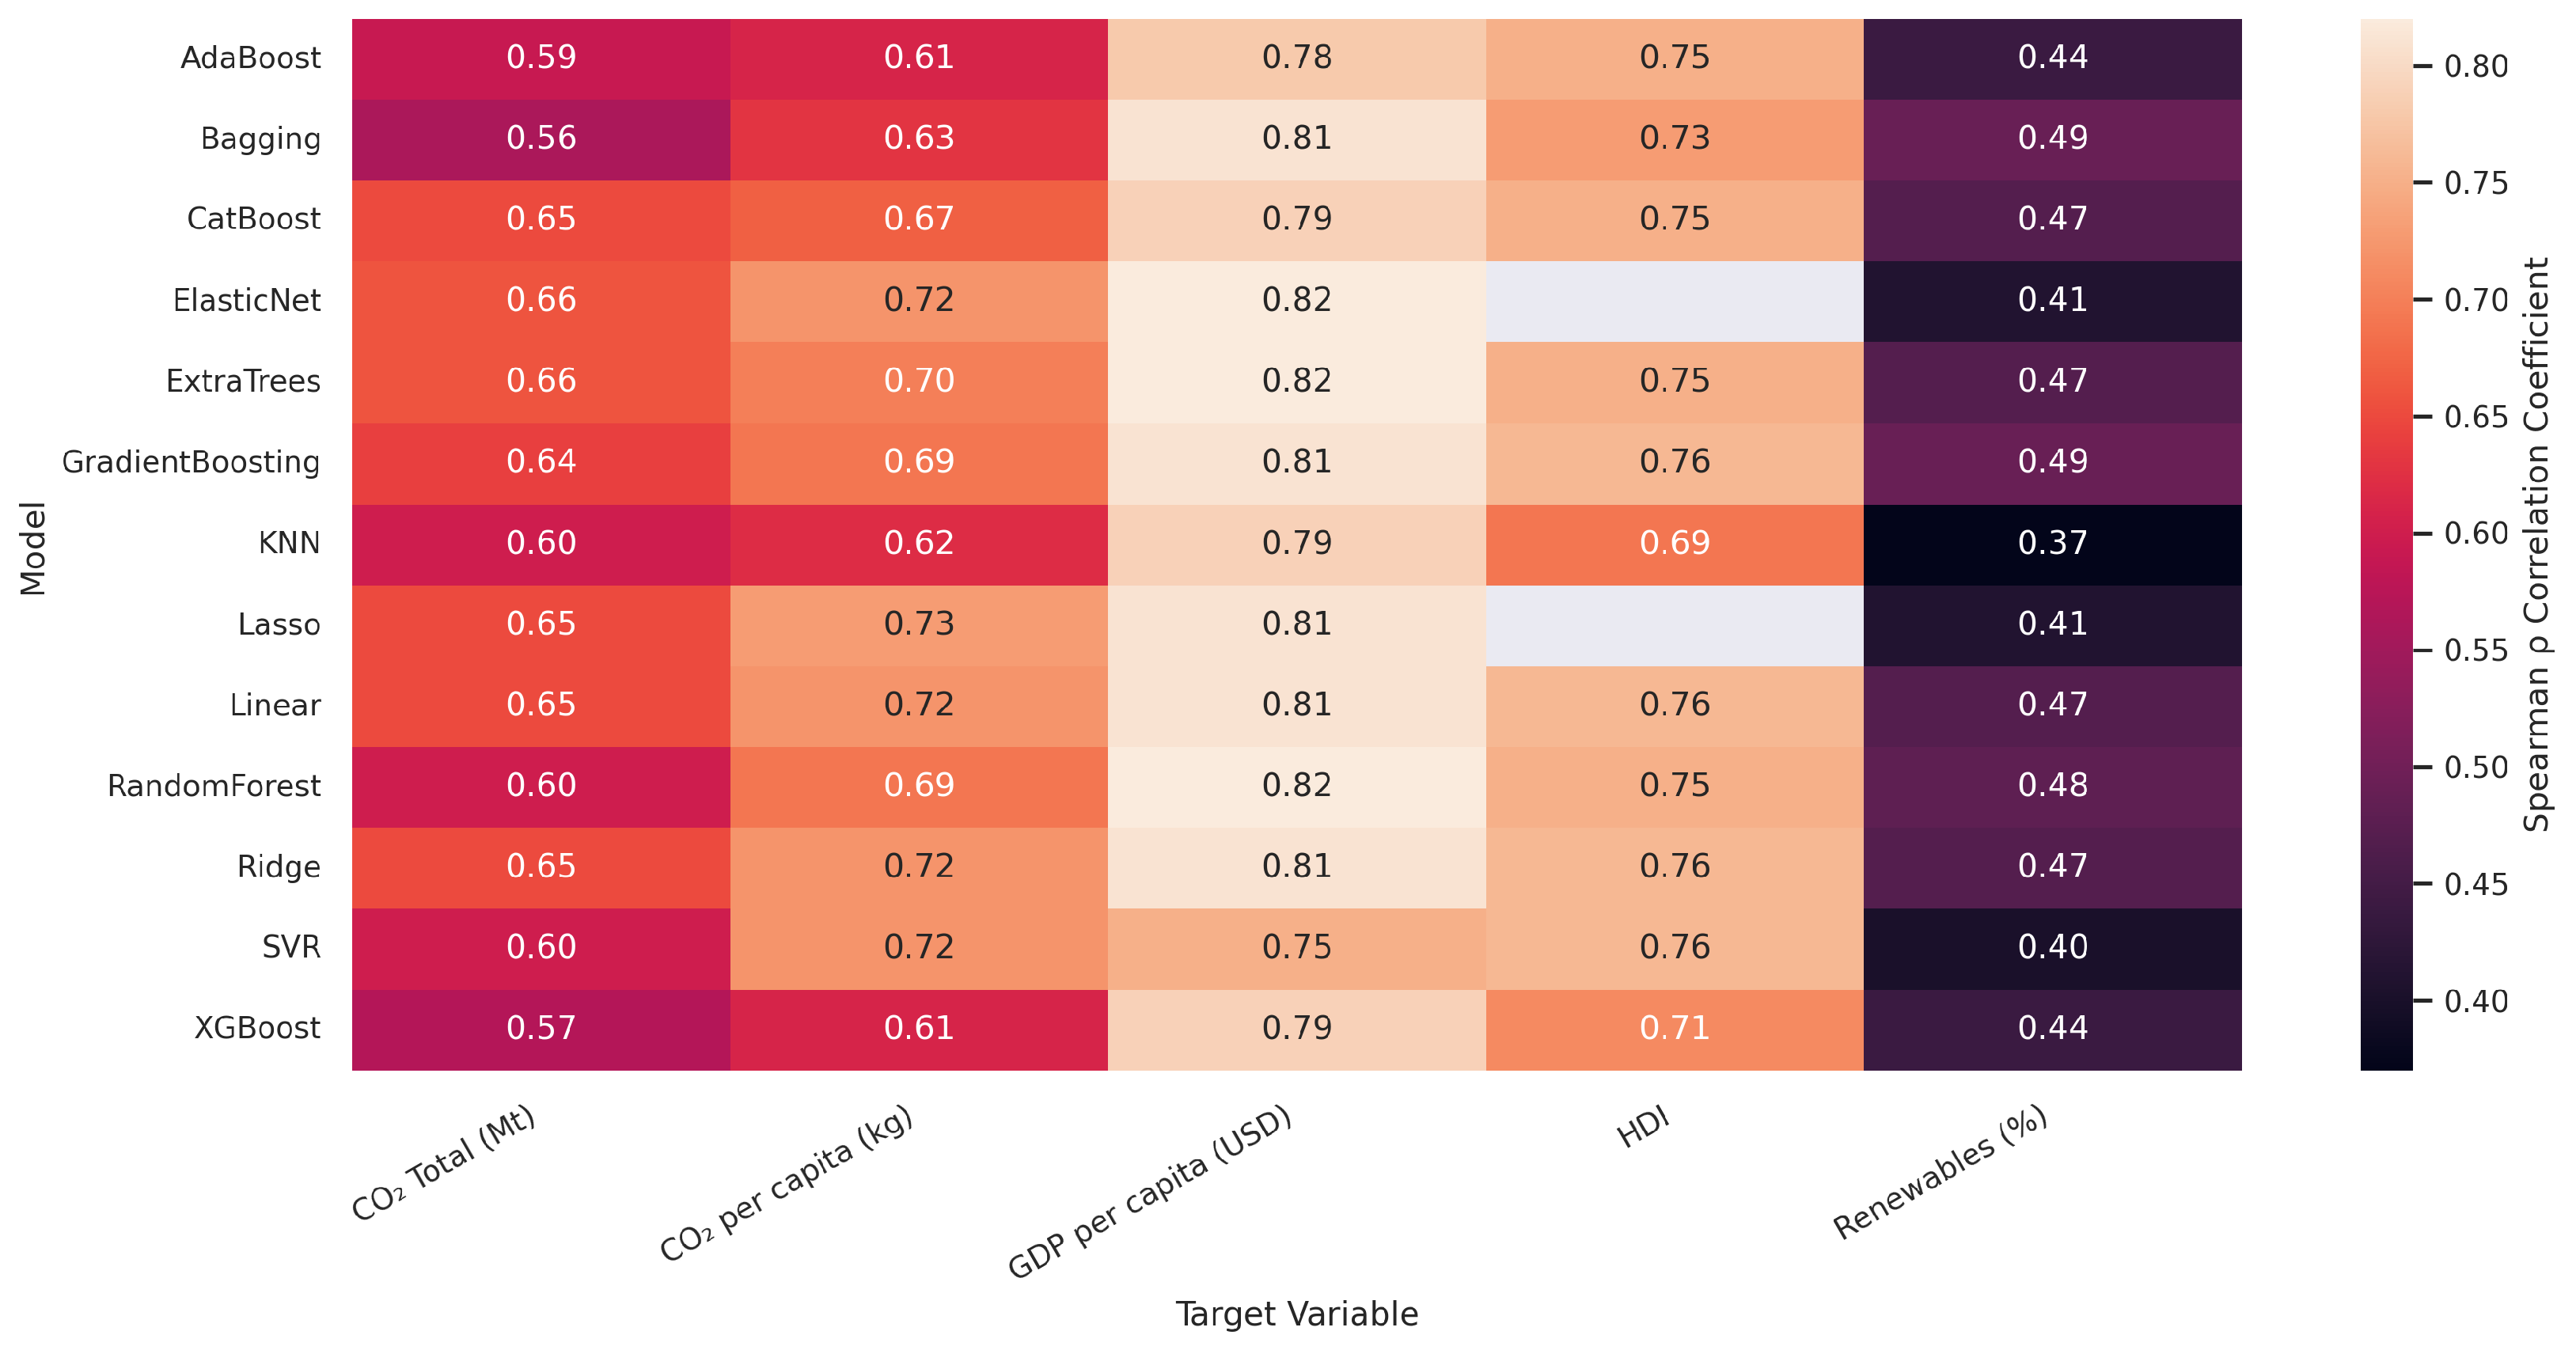
Figure 2.
SHAP variable importance for ExtraTrees (total ).
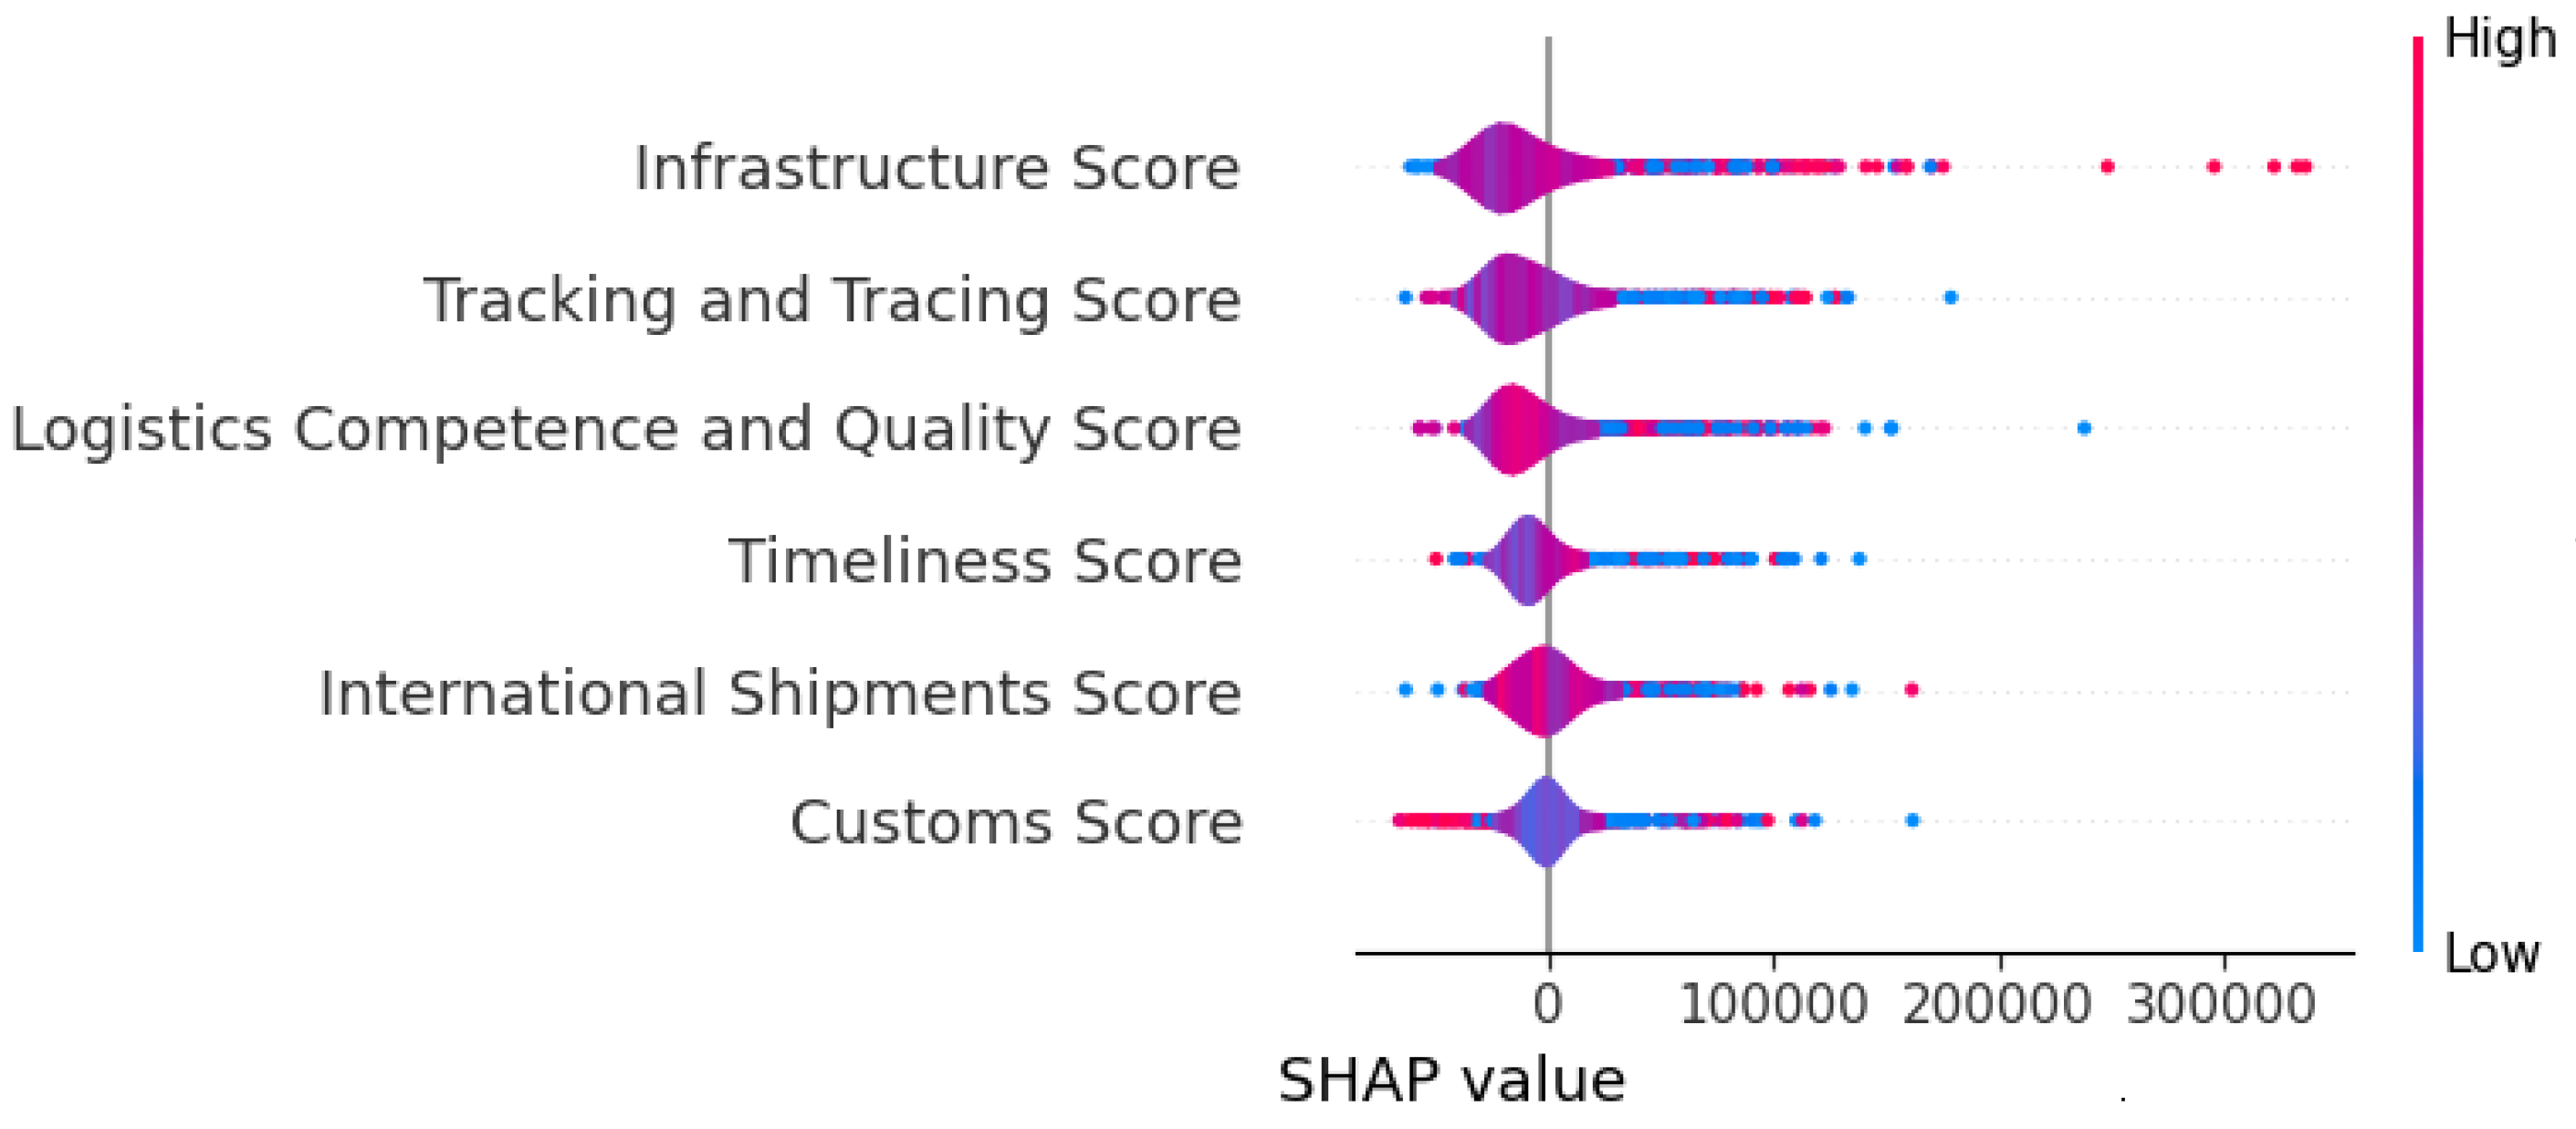
Figure 3.
K-means clustering of countries based on customs, infrastructure, and emissions.
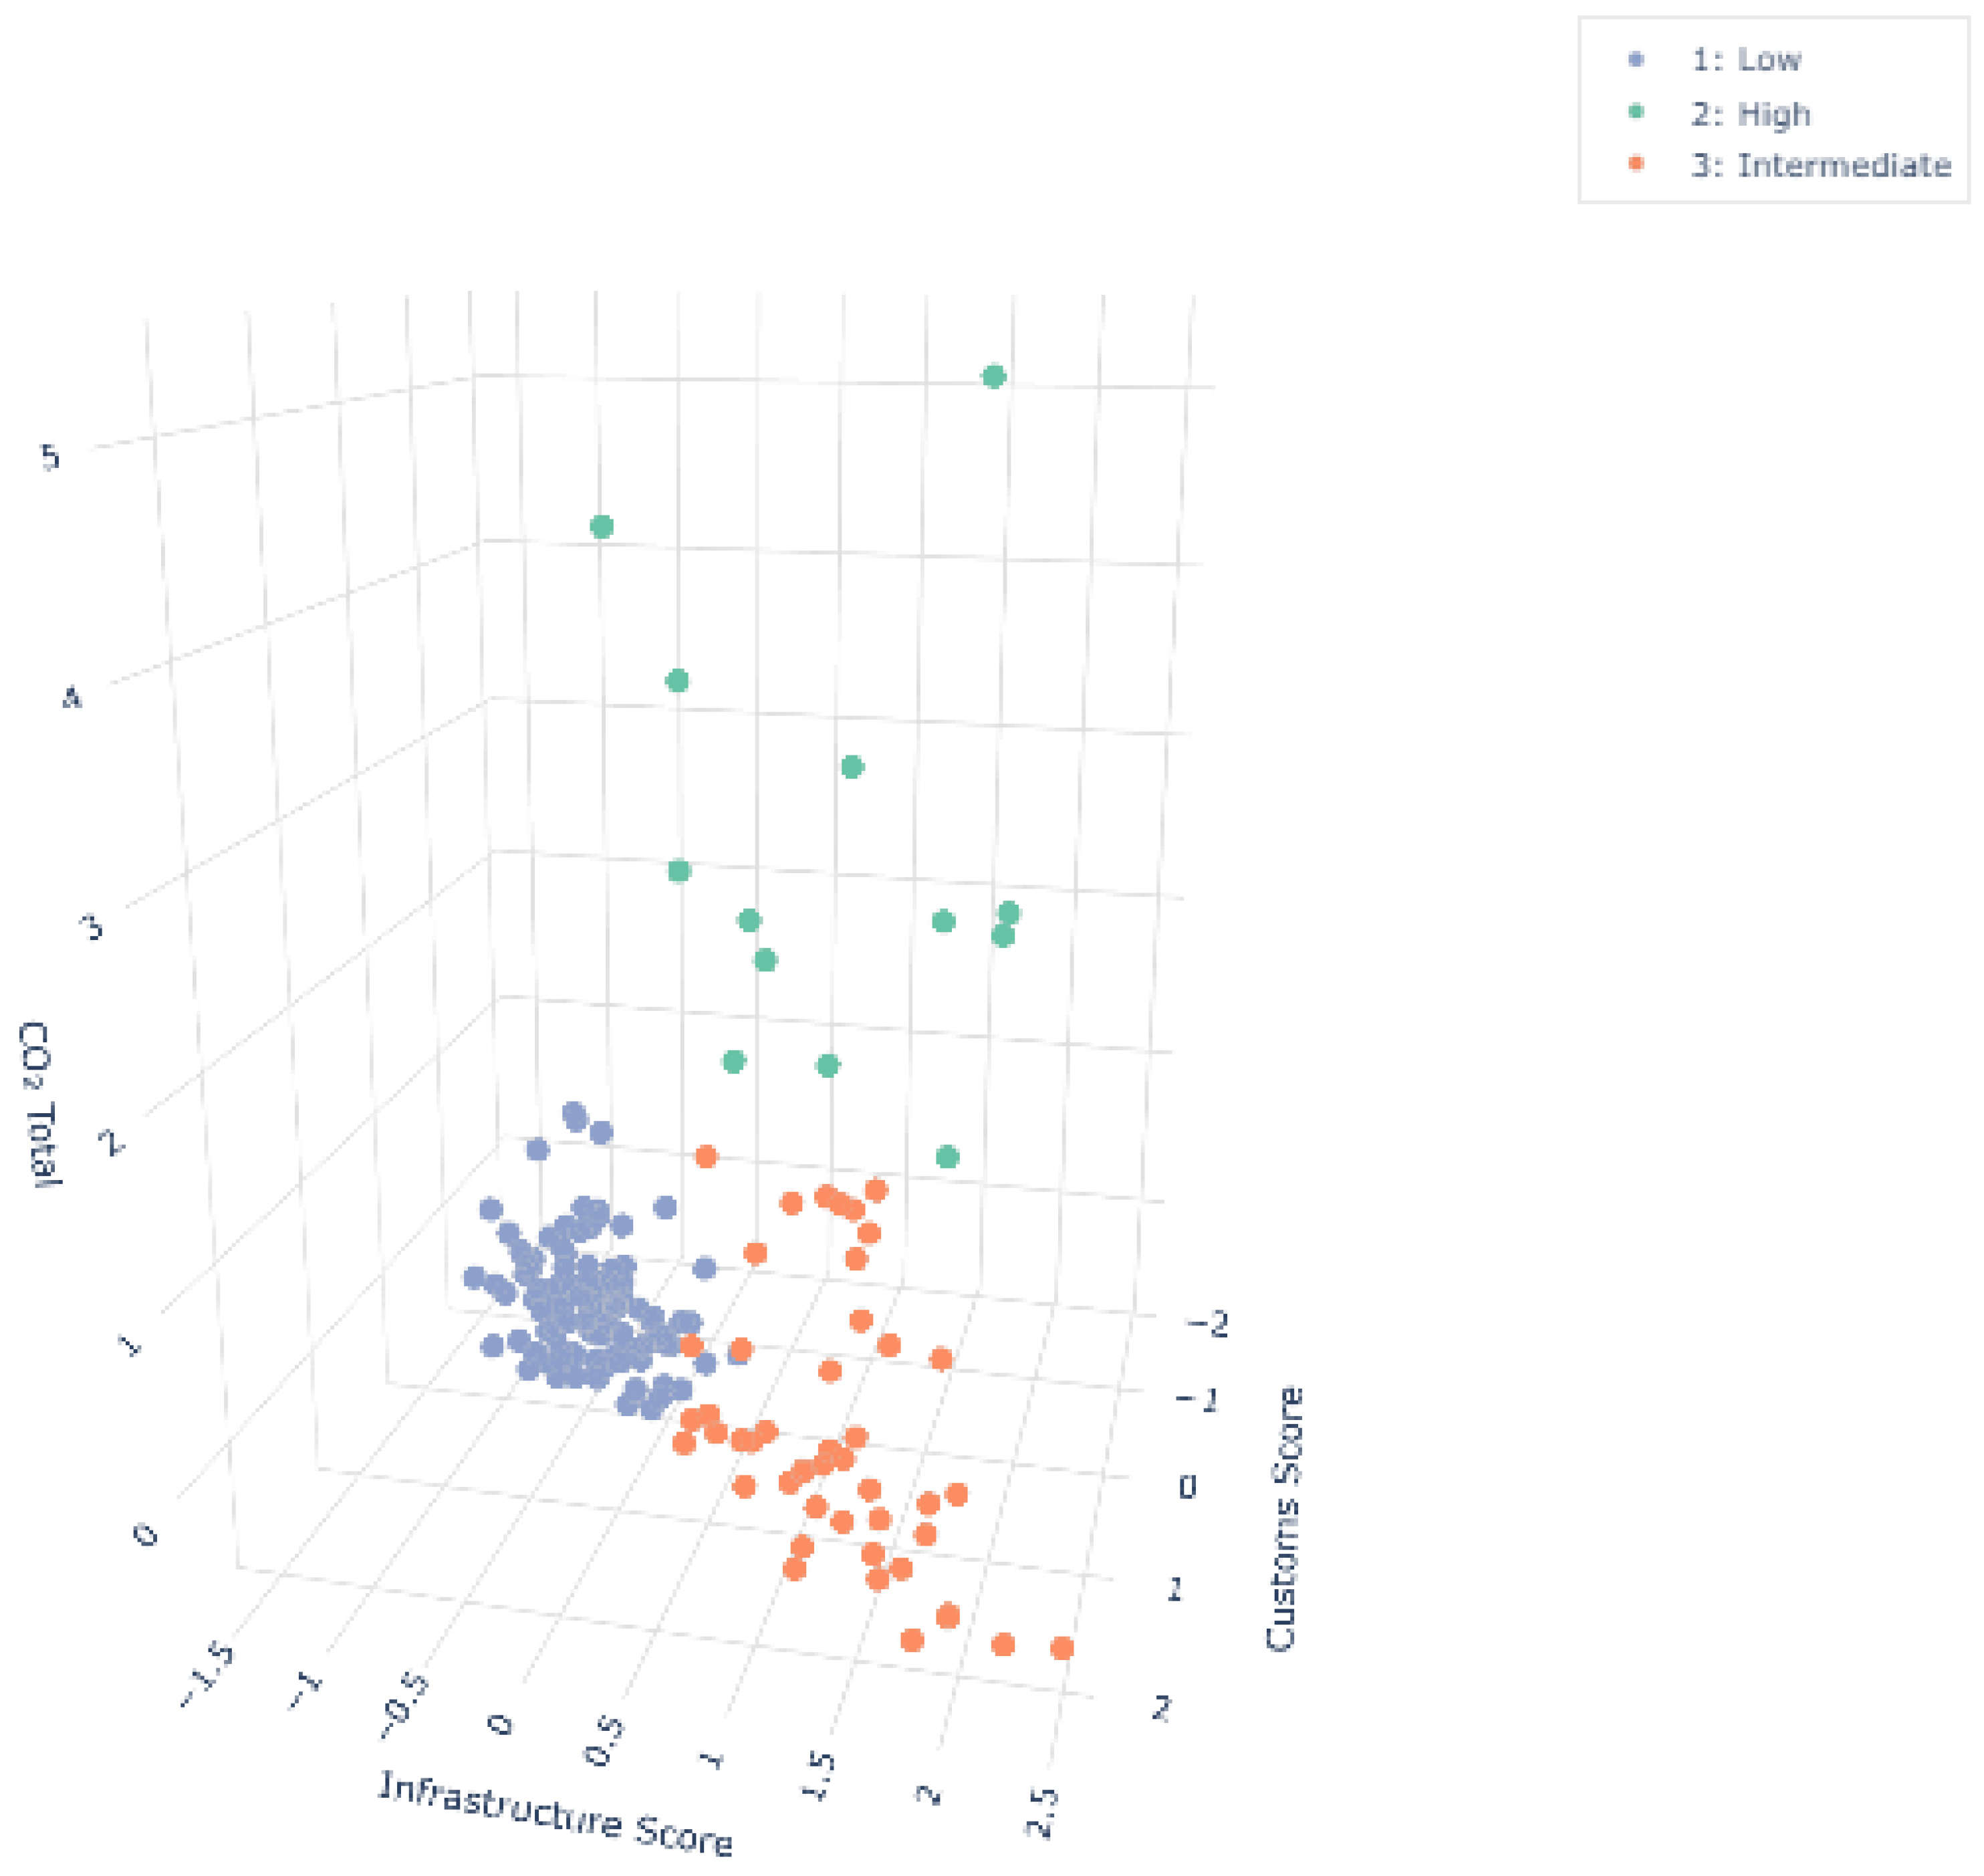
Figure 4.
Explained variance of regression models across four target variables.
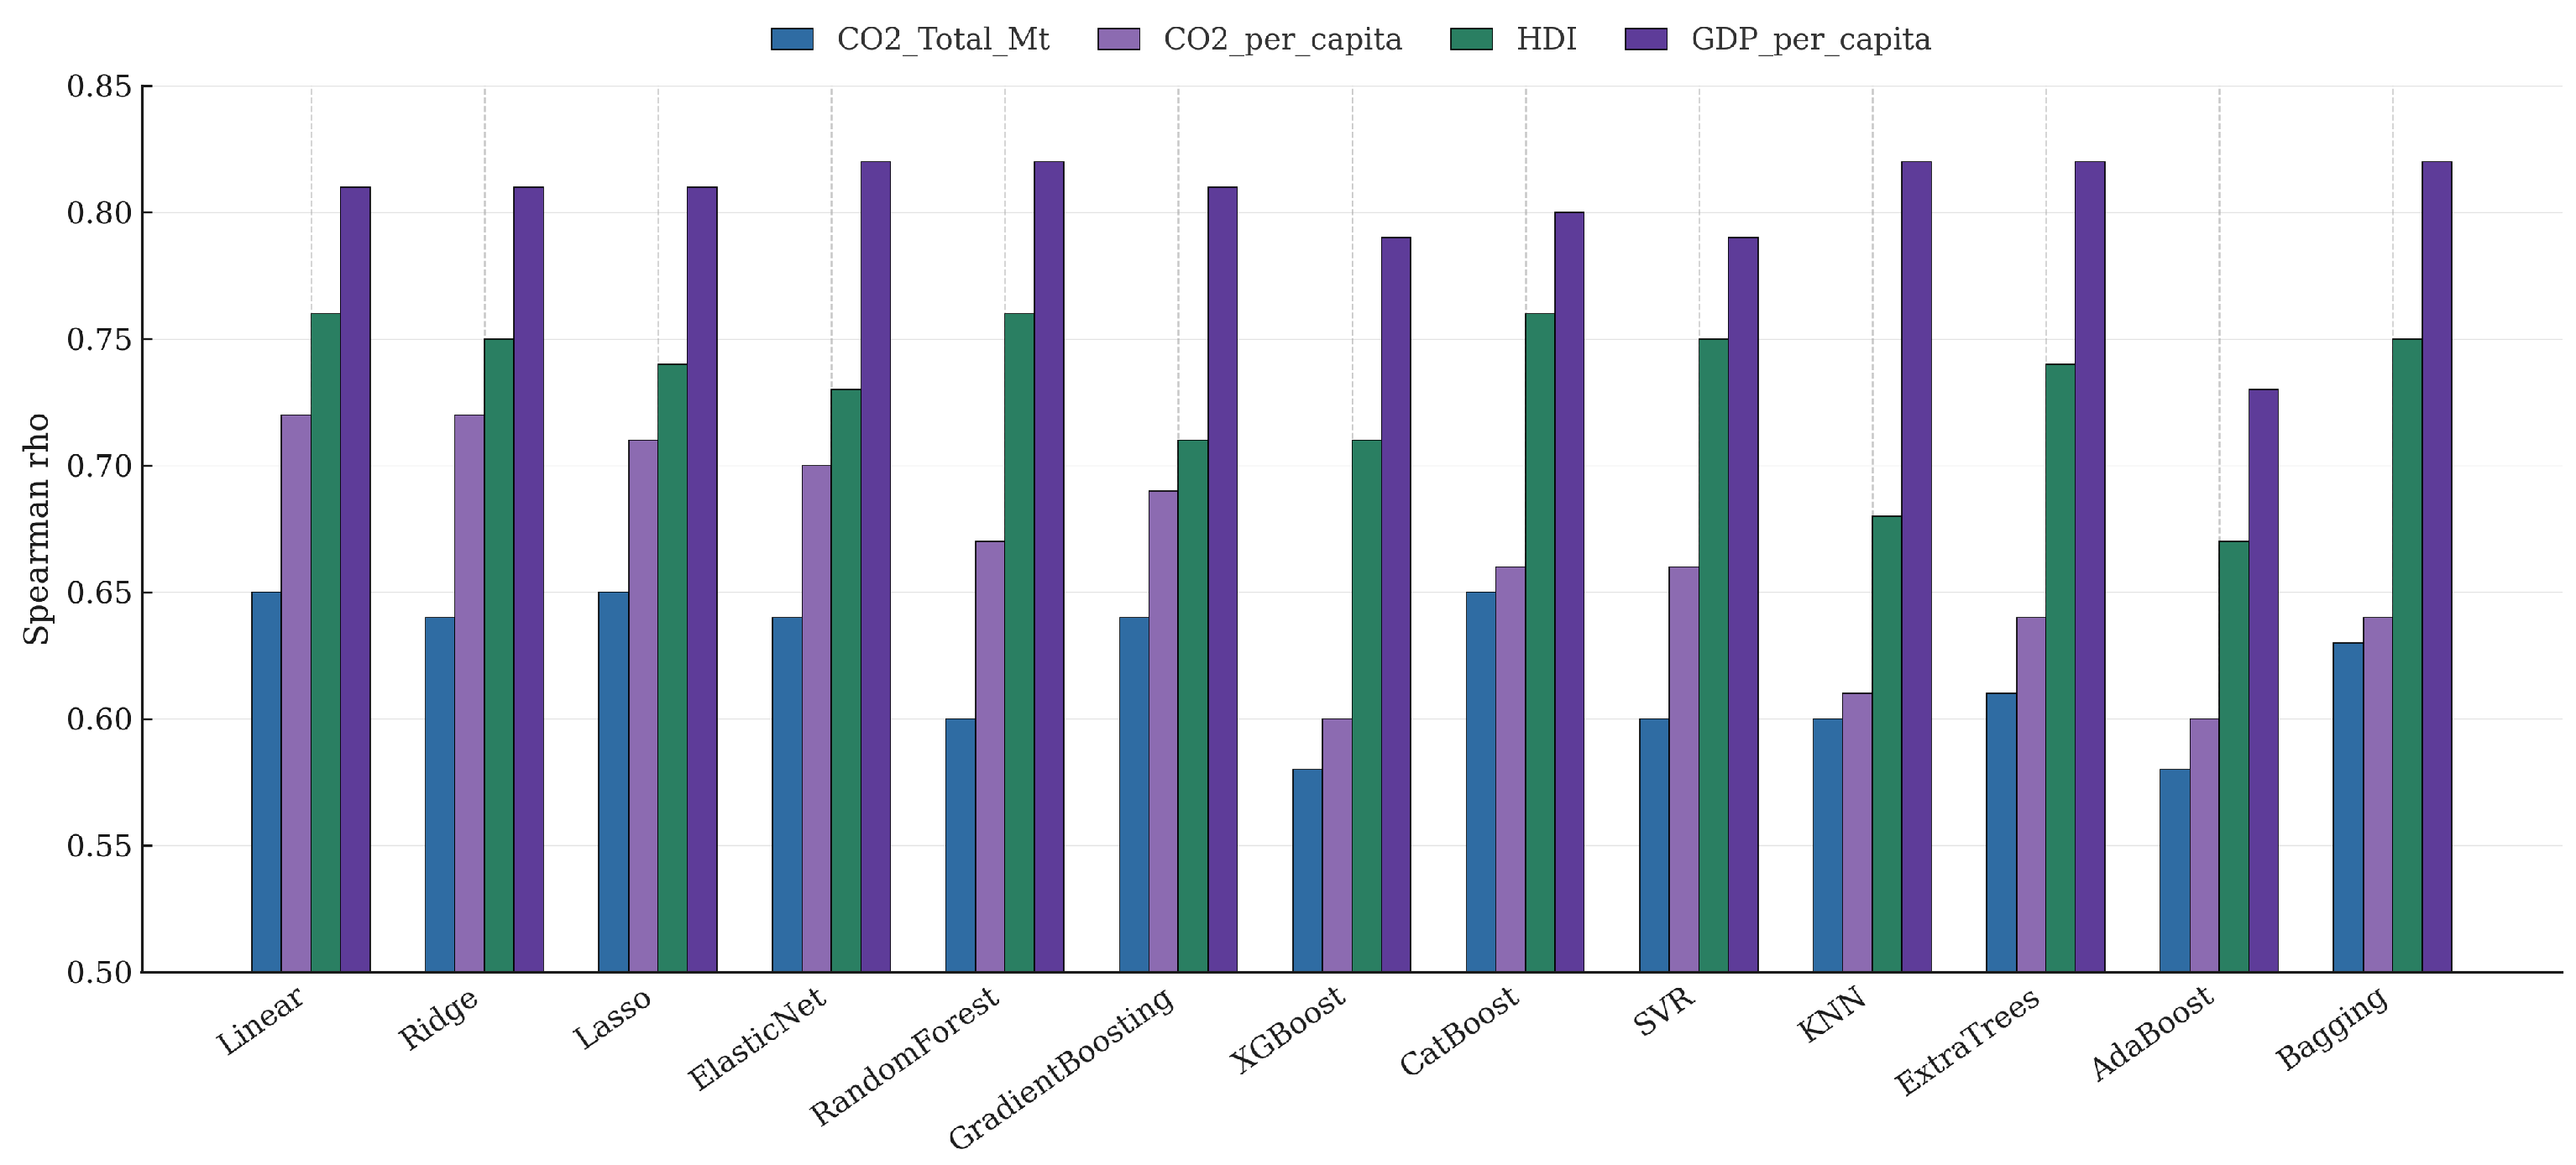
Figure 5.
Distribution of standardized residuals for total in the ExtraTrees model.
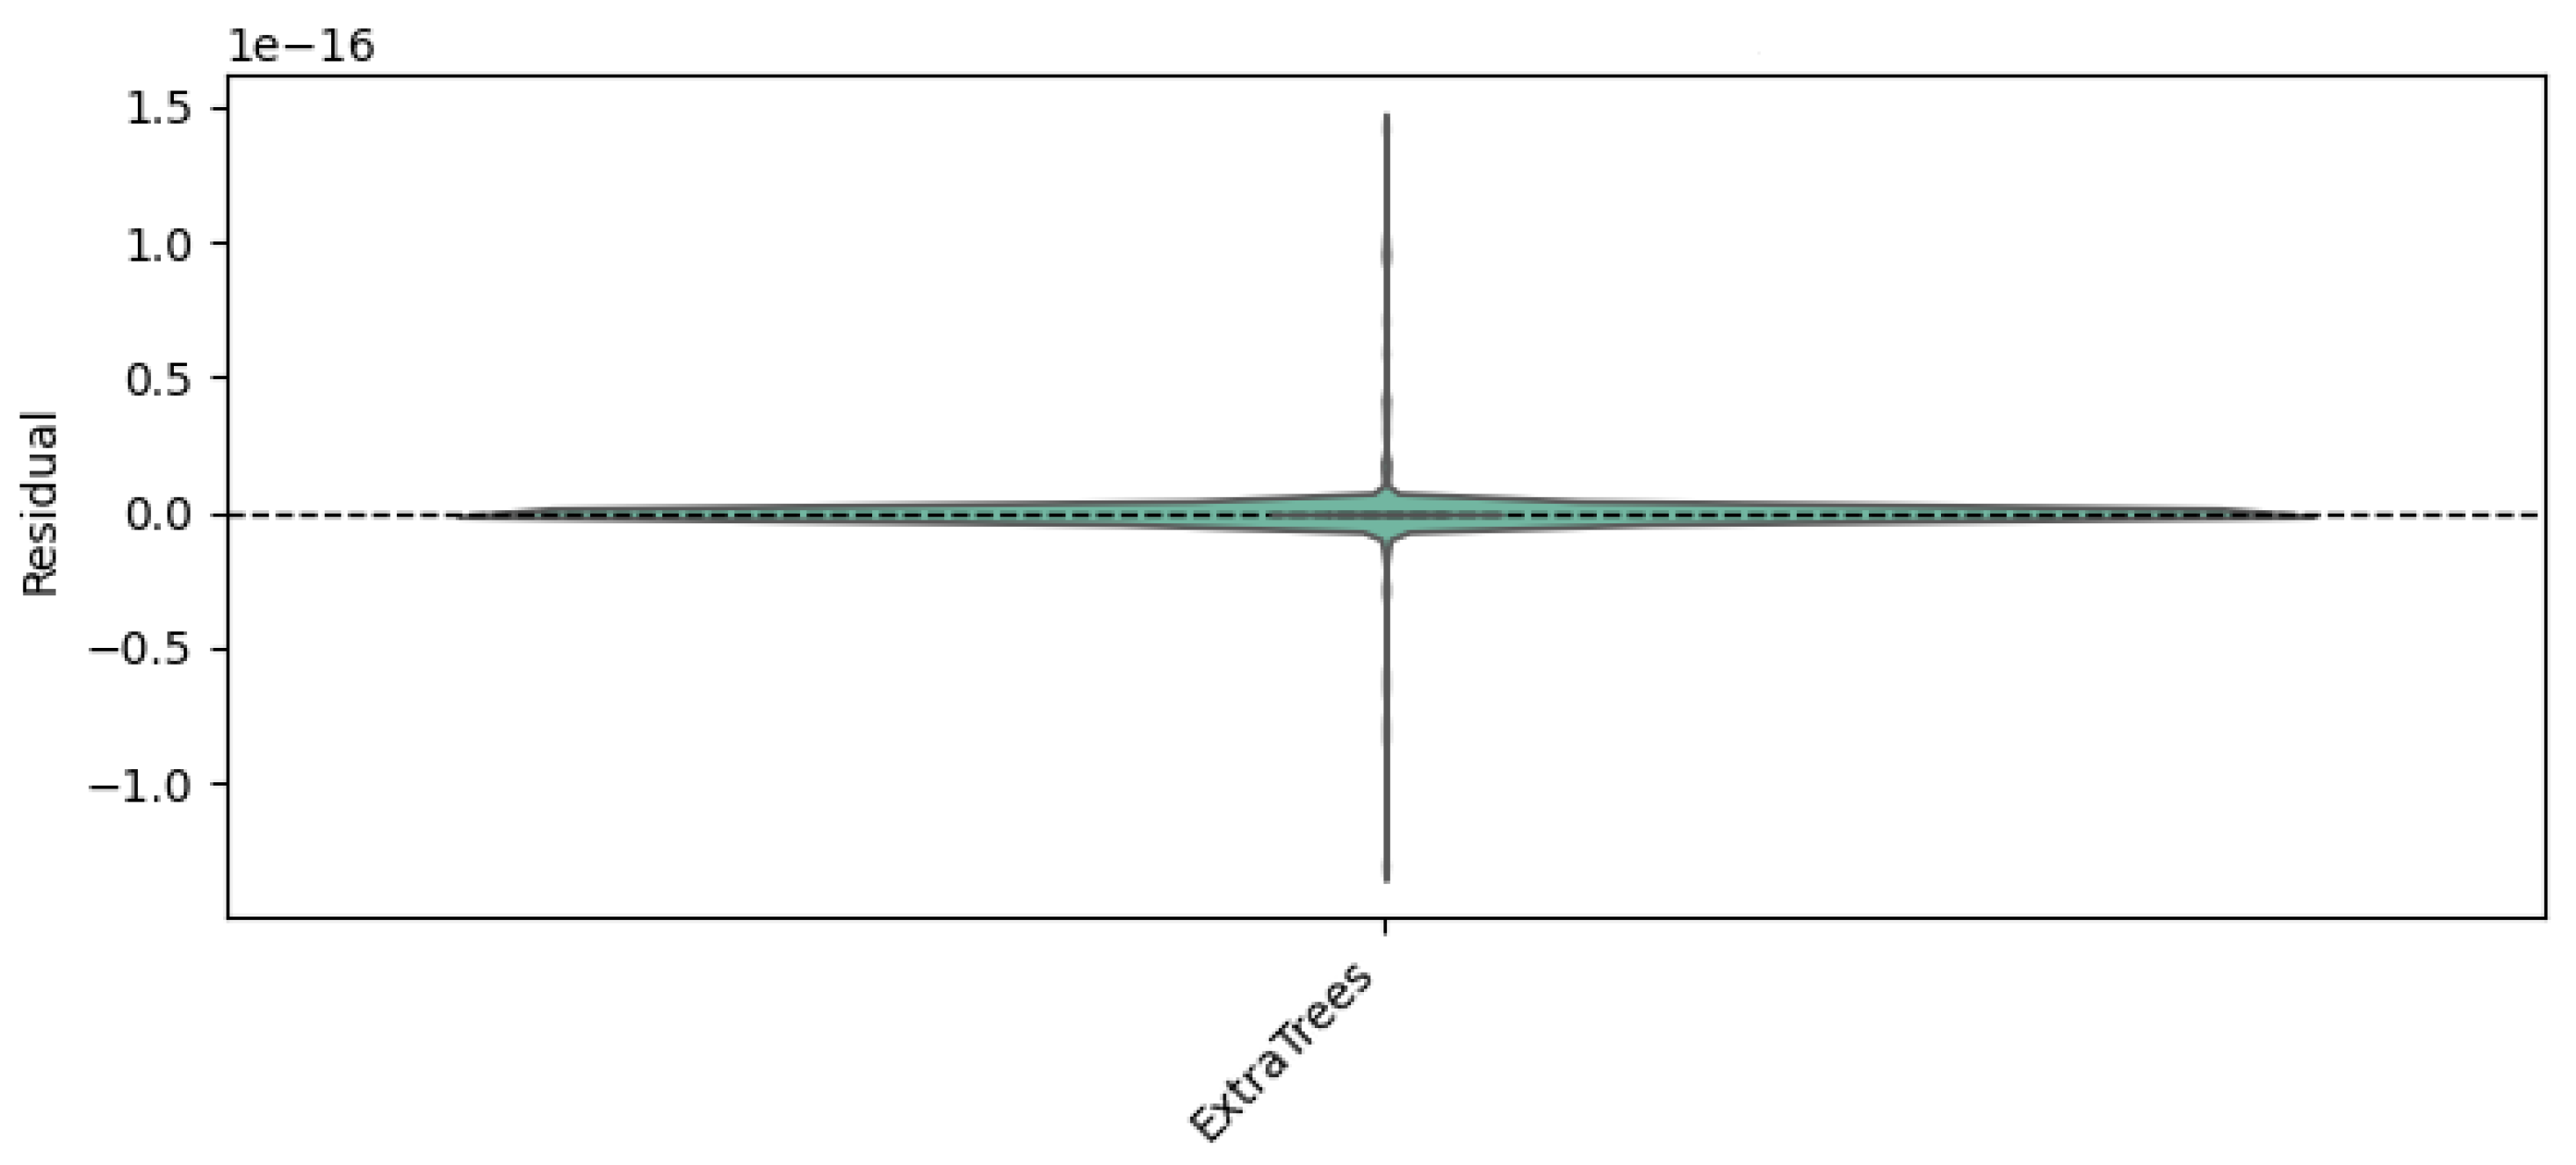
Figure 6.
Triple Bottom Line Framework for the LPI.
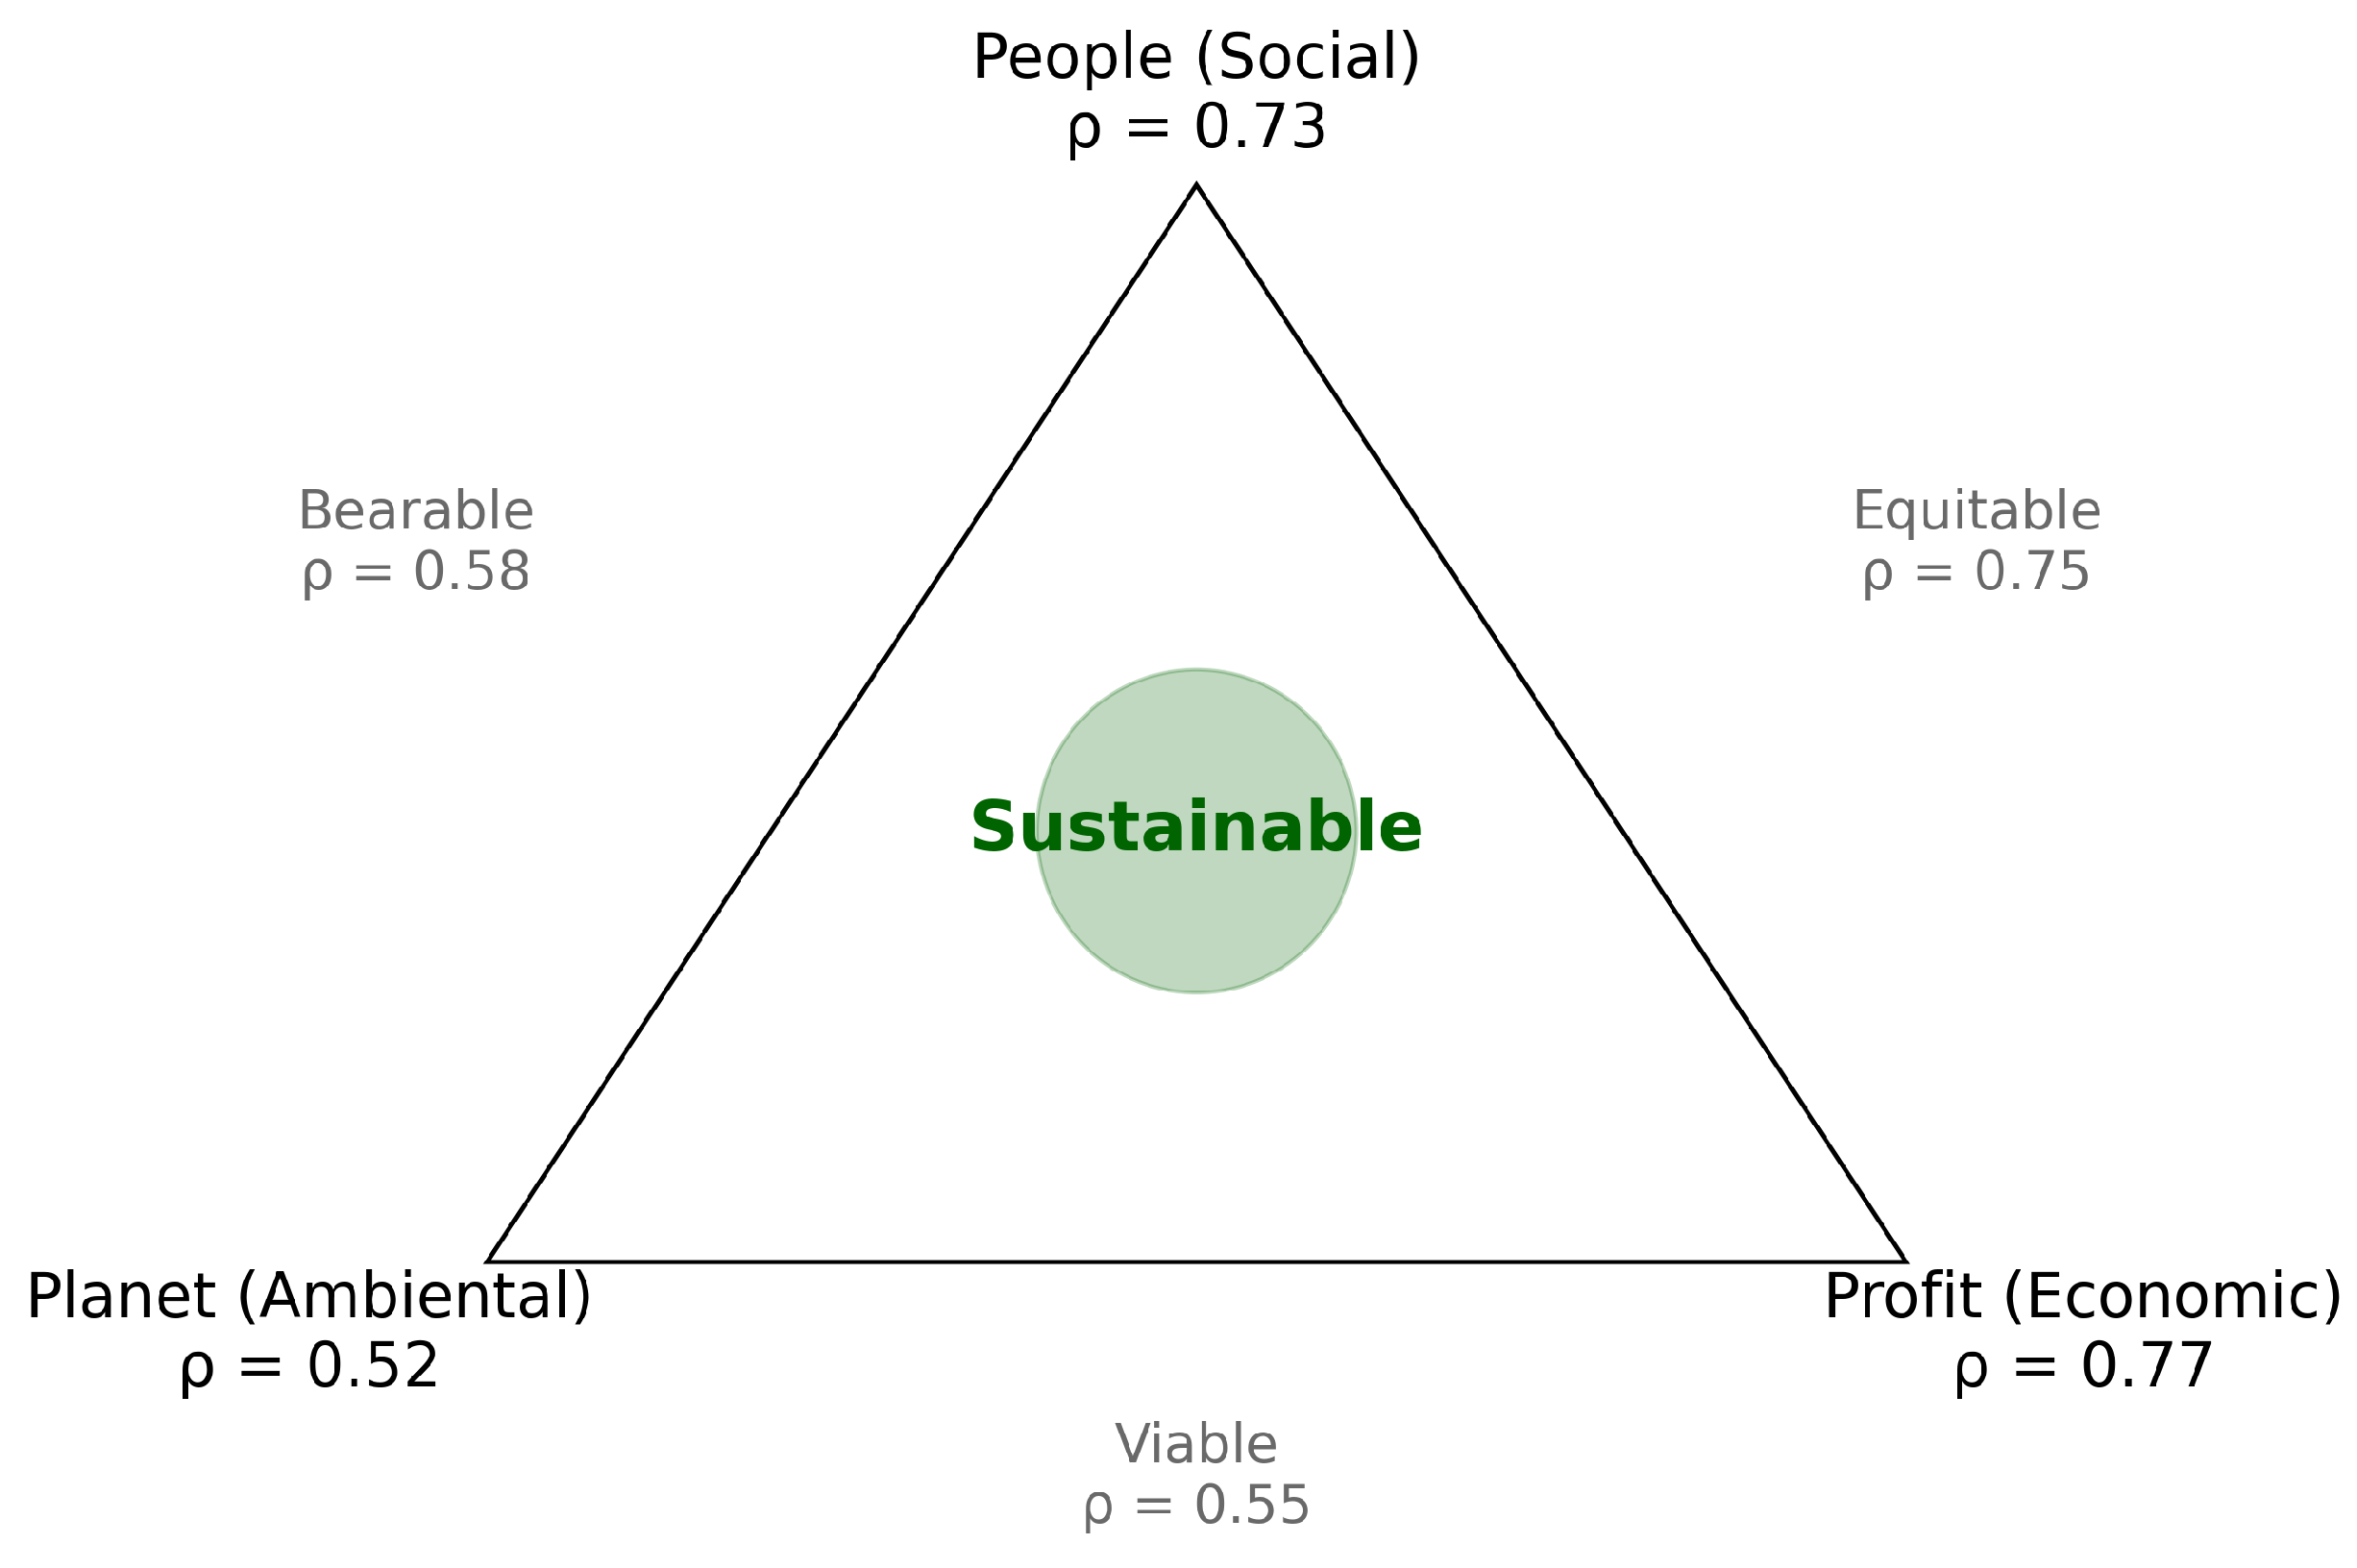
Figure 7.
Logistics–Environmental Clusters of Major Emitters.
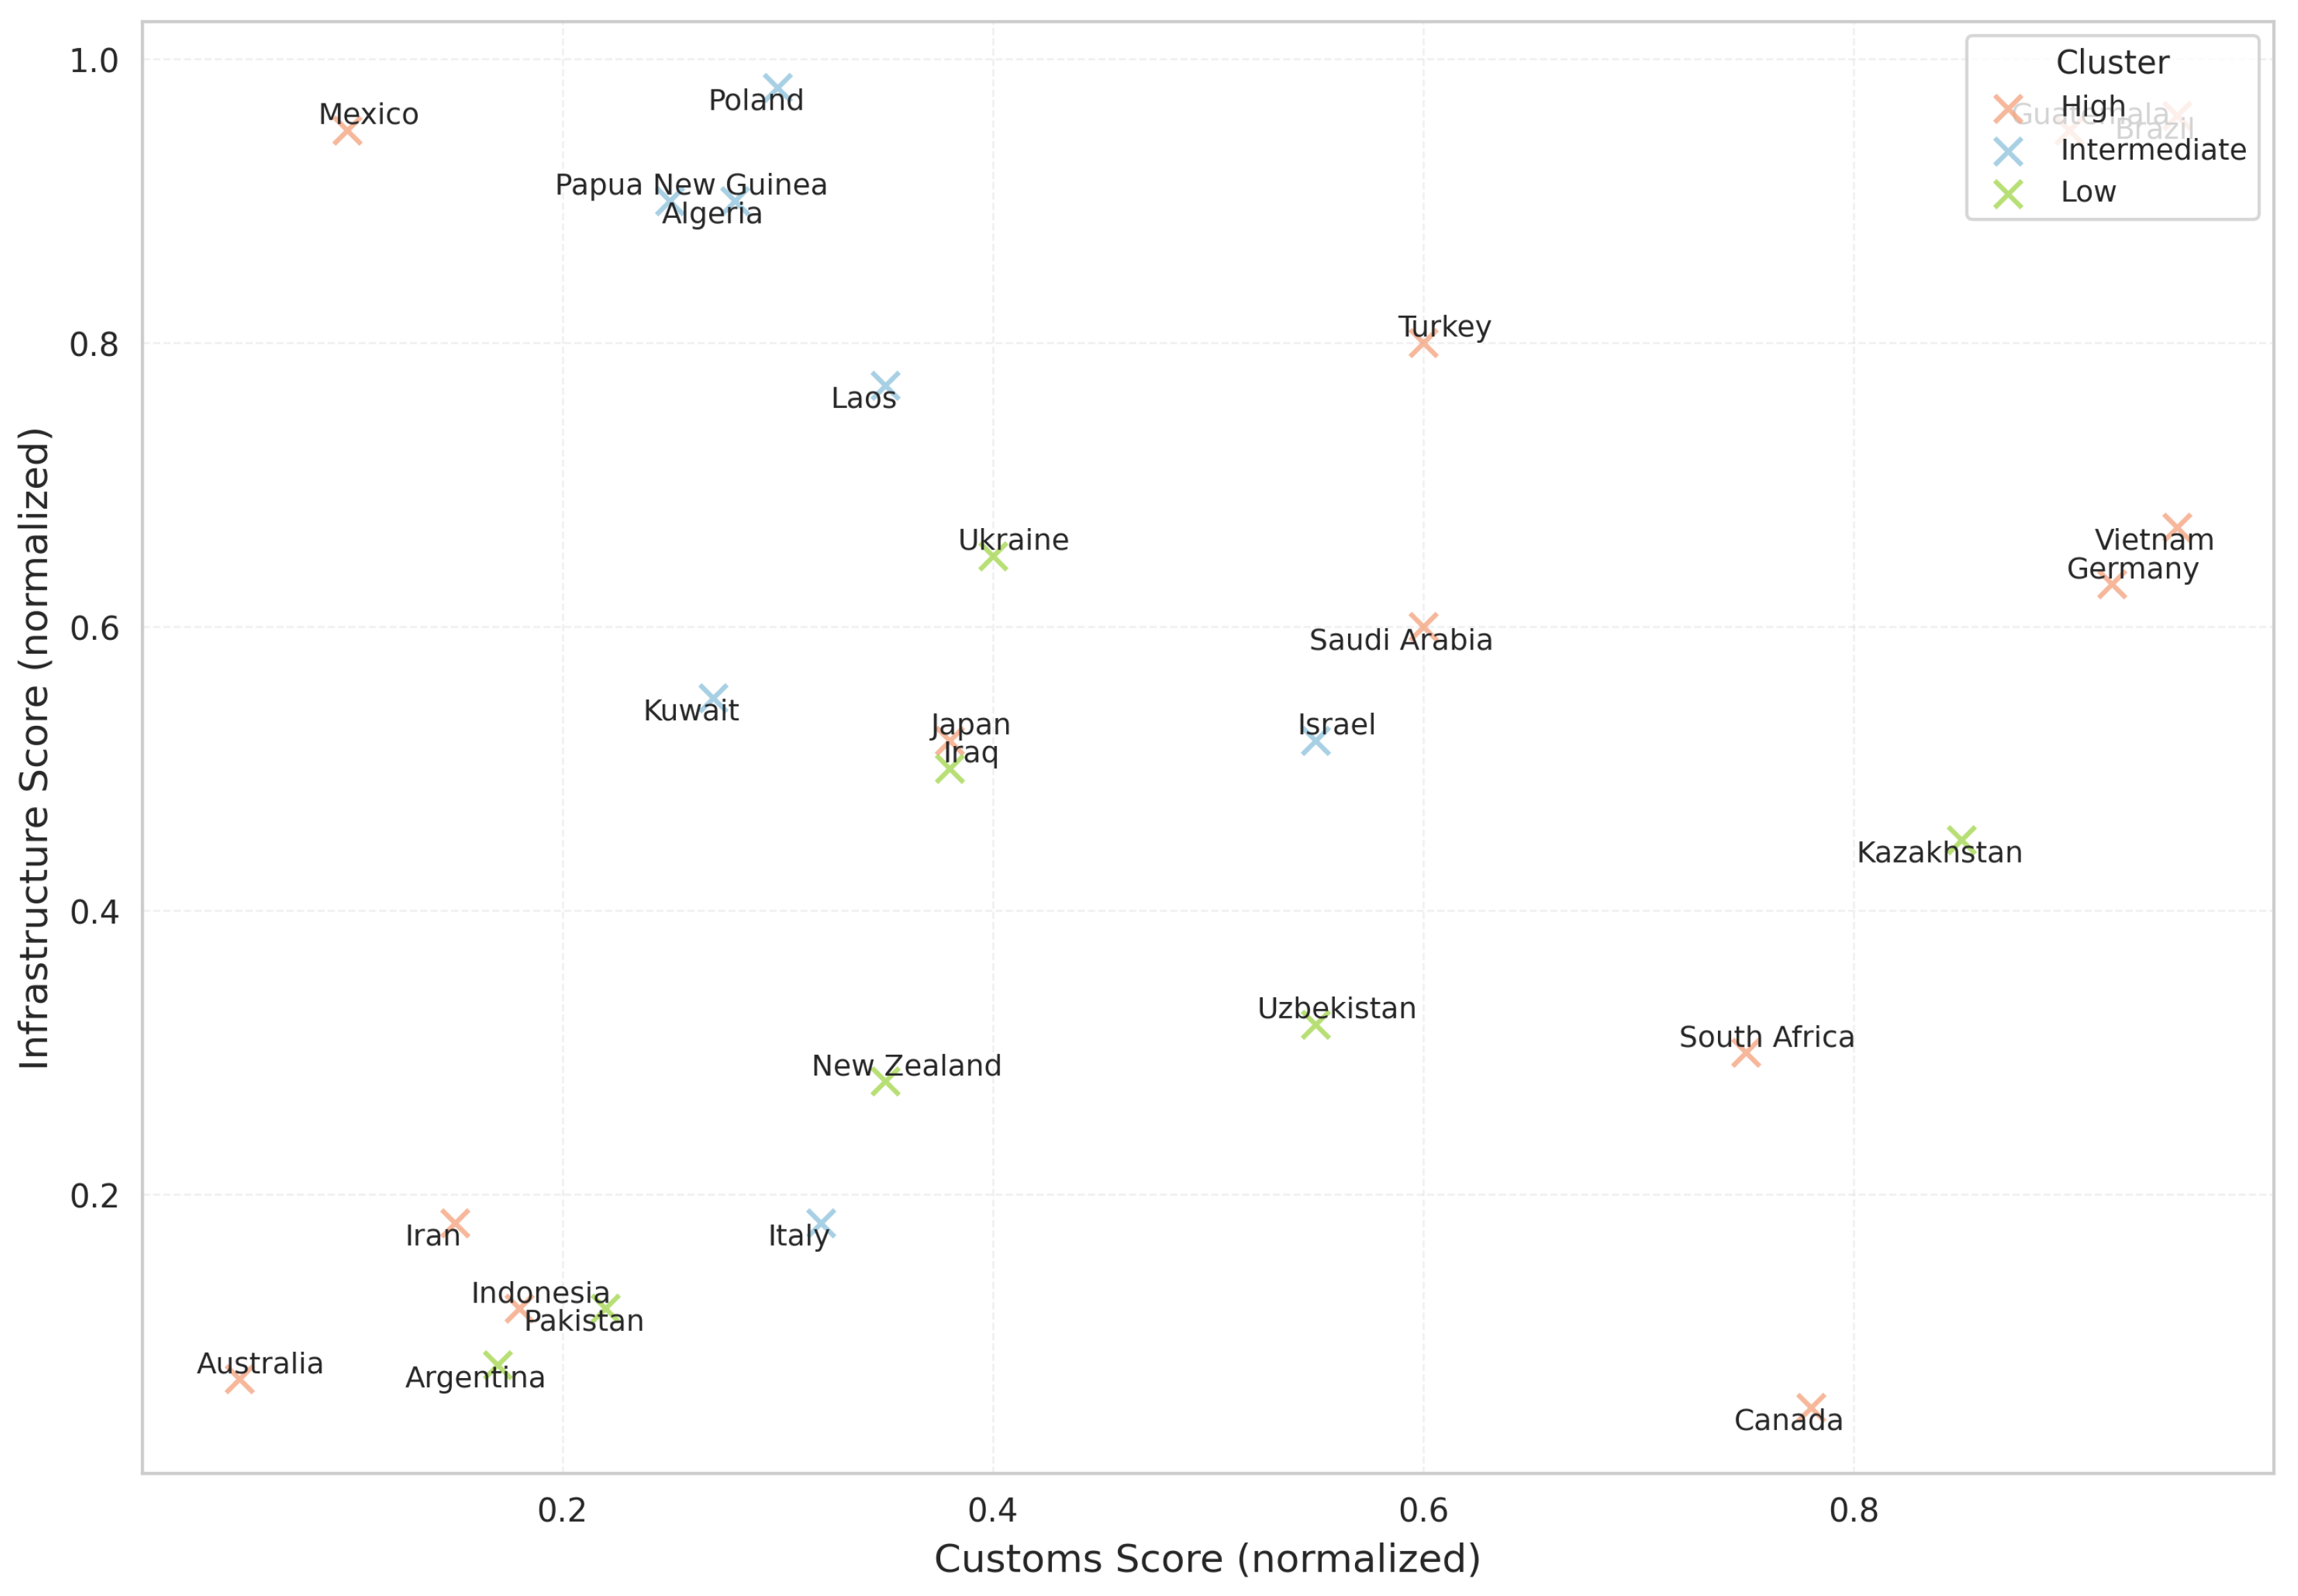

Table 1.
Strengths and limitations by model family.
| Models | Accuracy | Robustness | Eficiency | Nonlinear | Scalable | Interpretability |
|---|---|---|---|---|---|---|
| Ensemble (Bagging y Boosting) | ||||||
| Extra Trees [35] | ✔ | ✔ | ✔ | ✔ | ✔ | × |
| Random Forest [36] | ✔ | ✔ | × | ✔ | ✔ | × |
| CatBoost [37] | ✔ | ✔ | × | ✔ | × | × |
| XGBoost [38] | ✔ | ✔ | ✔ | ✔ | ✔ | × |
| Gradient Boosting [39] | ✔ | ✔ | × | ✔ | × | × |
| AdaBoost [40] | ✔ | × | × | ✔ | × | × |
| K-Nearest Neighbors | ||||||
| KNN [41] | × | × | × | × | × | ✔ |
| Penalized Linear Models | ||||||
| Lineal Regression | × | × | ✔ | × | ✔ | ✔ |
| Ridge [42] | ✔ | ✔ | ✔ | × | ✔ | × |
| Lasso [43] | ✔ | ✔ | ✔ | × | ✔ | × |
| Elastic Net [44] | ✔ | ✔ | × | × | ✔ | × |
| Margin-Based Models | ||||||
| SVR [45] | ✔ | ✔ | × | ✔ | × | × |
Table 2.
Performance of predictive models in terms of correlation and error.
| Model | RMSE | MAE | |
|---|---|---|---|
| ExtraTrees | 0.82 | 88 k | 68 k |
| GradientBoosting | 0.81 | 92 k | 70 k |
| CatBoost | 0.81 | 94 k | 70 k |
| RandomForest | 0.80 | 95 k | 72 k |
| XGBoost | 0.79 | 99 k | 74 k |
| AdaBoost | 0.59 | 150 k | 150 k |
| Other models1 | k | k |
1 Includes linear regression, Ridge, Lasso, Elastic Net, KNN, and SVR.
Table 3.
Statistical Summary by Logistics-Environmental Cluster ( in Mt).
| Cluster | Emissions | # Countries | Customs | Infra | Mean | Median | IQR (P25–P75) |
|---|---|---|---|---|---|---|---|
| 0 | High | 13 | 3.22 | 3.53 | 560 920 | 573 536 | 428 913–622 914 |
| 1 | Low | 107 | 2.35 | 2.36 | 29 219 | 8 817 | 3 758–27 354 |
| 2 | Intermediate | 47 | 3.42 | 3.66 | 90 541 | 37 426 | 13 990–125 390 |
Notes: measured in millions of tons (Mt). IQR = interquartile range (P25–P75). Abbreviations: High = high emissions; Intermediate = medium emissions; Low = low emissions; Infra = Infrastructure.
Table 4.
Top 20 -Emitting Countries by Logistics–Environmental Cluster.
| Country | Customs | Infra | (Mt) | Cluster | Centroid Dist. |
|---|---|---|---|---|---|
| Japan | 3.90 | 4.20 | 944 759 | High | 2.791 |
| Iran | 2.20 | 2.40 | 778 802 | High | 2.682 |
| Indonesia | 2.80 | 2.90 | 674 536 | High | 1.332 |
| Saudi Arabia | 3.00 | 3.60 | 622 914 | High | 0.541 |
| Germany | 3.90 | 4.30 | 582 951 | High | 1.556 |
| Canada | 4.00 | 4.30 | 575 012 | High | 1.674 |
| South Korea | 3.90 | 4.10 | 573 536 | High | 1.370 |
| Mexico | 2.50 | 2.80 | 487 094 | High | 1.638 |
| Brazil | 2.90 | 3.20 | 479 504 | High | 0.870 |
| Turkey | 2.71 | 3.21 | 428 913 | High | 1.256 |
| South Africa | 3.30 | 3.60 | 397 373 | High | 1.027 |
| Australia | 3.70 | 4.10 | 373 616 | High | 1.613 |
| Vietnam | 3.10 | 3.20 | 372 949 | High | 1.273 |
| Kazakhstan | 2.60 | 2.50 | 239 867 | Low | 1.386 |
| Pakistan | 2.12 | 2.20 | 202 283 | Low | 1.158 |
| Iraq | 2.10 | 2.20 | 192 908 | Low | 1.117 |
| Argentina | 2.70 | 2.80 | 183 778 | Low | 1.282 |
| Algeria | 2.30 | 2.10 | 180 358 | Low | 1.008 |
| Uzbekistan | 2.60 | 2.40 | 137 900 | Low | 0.793 |
| Ukraine | 2.40 | 2.40 | 136 198 | Low | 0.672 |
Notes: Countries are ordered by absolute emissions. Abbreviations: High = high emissions; Interm. = medium emissions; Low = low emissions; Infra = Infrastructure.
Table 5.
Spearman correlation coefficients () for predictive models and target variables.
| Model | per capita | Total | HDI | PIB per capita |
|---|---|---|---|---|
| Extratrees | 0.573 | 0.631 | 0.732 | 0.790 |
| RandomForest | 0.556 | 0.595 | 0.749 | 0.785 |
| CatBoost | 0.548 | 0.599 | 0.755 | 0.817 |
| GradientBoosting | 0.530 | 0.560 | 0.564 | 0.751 |
| XGBoost | 0.563 | – | 0.749 | 0.793 |
| Bagging | 0.377 | 0.526 | 0.711 | 0.733 |
| KNN | 0.514 | 0.567 | 0.673 | 0.783 |
| Ridge | 0.541 | 0.527 | 0.743 | 0.805 |
| Lasso | 0.510 | 0.527 | – | 0.805 |
| Linear | 0.541 | 0.546 | 0.743 | 0.805 |
| Elastic Net | 0.504 | 0.476 | – | 0.784 |
| AdaBoost | – | – | 0.722 | 0.563 |
| SVR | 0.524 | – | 0.739 | – |
Table 6.
Predictive capacity of the LPI across sustainability dimensions.
| Dimension | Variable | Average Value |
|---|---|---|
| Environmental | per capita and total | 0.510 |
| Social | Human Development Index (HDI) | 0.734 |
| Economic | GDP per capita | 0.770 |
| Bearable | and HDI | 0.588 |
| Viable | and GDP per capita | 0.575 |
| Equitable | HDI and GDP per capita | 0.755 |
Table 7.
Profiles of Logistics–Environmental Clusters.
| Cluster | Logistics Profile | Emission Level | Representative Countries |
|---|---|---|---|
| Low | Limited infrastructure, low international competitiveness and sparse transport networks. | Low absolute emissions. Includes cases with high emissions but weak logistics performance, e.g. Kazakhstan, Pakistan and Iraq. | Laos, Guatemala and Papua New Guinea. |
| High | Advanced infrastructure and modern logistics systems; strong integration in global trade. | Very high emissions driven by intensive industrialization and fossil fuel dependence. | Japan, Germany, Canada and Saudi Arabia. |
| Intermediate | Medium–high logistics performance; high internal variability in efficiency and sustainability. | Intermediate emissions; includes countries with green mitigation policies and those pursuing carbon-intensive growth. | New Zealand, Israel, Kuwait, Italy and Poland. |
Table 8.
LPI Variables by Sustainability Pillar.
| Dimension | Strategic Challenge Variables | Suggested Action Variables |
|---|---|---|
| Planet(Ambiental) [1,2,4,7,9,10,11,12,13,14,15,17,18,19,21,23,24,26,27,28,29,30,31,32,34] | Logistics emission intensity: level of emissions associated with transport and distribution operations. Fossil energy dependence: share of non-renewable fuel consumption in the national logistics energy mix. Limited green infrastructure: deficit in resilient or low-emission logistics infrastructure. Uneven energy efficiency: regional variability in energy use across logistics systems. Operational vulnerability: exposure of logistics networks to climatic or external disruptions. | Low-carbon multimodal transport: replacement of carbon-intensive modes with sustainable alternatives. Integration of environmental metrics: inclusion of LPI––GDP indicators in logistics policy models. Green electrification and digitalization: investment in electric systems and digital tracking of emissions. Energy standardization: establishment of international standards for logistics efficiency. International environmental cooperation: strengthening technology transfer networks and climate finance mechanisms. |
| People(Social) [1,2,4,7,9,10,11,12,13,14,15,17,18,19,21,23,24,26,27,28,29,30,31,32,34] | Territorial logistics inequality: disparities in accessibility, connectivity, and infrastructure coverage. Human capital gap: shortage of technical, digital, and managerial skills in the logistics sector. Limited institutional governance: weak coordination between public and private actors in sustainable transport policies. Low professionalization: lack of specialized training in sustainable logistics and environmental management. Weak university–industry linkages: insufficient technology transfer and collaboration in applied innovation. | Sustainable technical and digital training: educational programs focused on green logistics competencies. Green employment and labor equity: job creation linked to the energy transition. Inclusive governance: development of participatory and collaborative institutional frameworks. Social integration of logistics metrics: incorporation of equity, accessibility, and welfare indicators into performance evaluation. University–industry partnerships: promotion of joint innovation projects and regional academic mobility. |
| Profit(Economic) [1,2,4,7,9,10,11,12,13,14,15,17,18,19,21,23,24,26,27,28,29,30,31,32,34] | Carbon economic intensity: dependence on logistics sectors with high environmental impact. Infrastructure investment gap: insufficient funding for strategic logistics infrastructure. Regional competitiveness asymmetry: disparities in logistics efficiency and technological access. Lag in digitalization and diversification: low technology adoption and sectoral concentration. Unsustainable trade patterns: growth in trade without environmental or energy-efficiency criteria. | Modernization of logistics infrastructure: integration of innovation, automation, and sustainability. Green trade policies: economic incentives aimed at reducing supply-chain emissions. Circular business models: implementation of resource reuse and optimization systems. Composite indicator integration: application of LPI–HDI–GDP– metrics in policy formulation. Climate risk management: incorporation of environmental risk into infrastructure planning and financing. |
Table 9.
Future Research Lines of the LPI under the Planet–People–Profit (PPP) framework.
| Papers | Domain (PPP) | LPI Focus | Model Type | Research Line |
|---|---|---|---|---|
| [7,11,12,14,15,18,34] | Profit– Planet | Logistics infrastructure, competitiveness, and economic growth | Structural, spatial, and multivariate econometric models | Generalize econometric and structural models to estimate interdependencies among infrastructure, innovation, and trade, integrating the mediating effects of the LPI on economic growth and validating its regional robustness under global shocks. |
| [21,28,30] | Planet– Profit | Port infrastructure, resilience, and risk management | Probabilistic and composite evaluation models | Integrate multihazard risk models and Bayesian networks with logistics performance indicators to quantify vulnerability and resilience, enhancing the methodological robustness of the LPI under structural and climate uncertainty. |
| [1,2,23,24,26,31,32] | Planet | Logistics efficiency, sustainability, and carbon emissions | Efficiency, clustering, and advanced econometric models | Expand non-parametric efficiency, spatial econometric, and quantile regression models to estimate patterns of green logistics performance, validating the environmental sensitivity and regional heterogeneity of the LPI. |
| [10,17,19,27,29] | People | Human capital, institutional development, and logistics efficiency | Econometric, panel, and multivariate models | Integrate multivariate and panel analyses to assess interactions between human capital, governance, and logistics development, validating the social and institutional sensitivity of the LPI across different development levels. |
| [4,9] | People | Tracking, timeliness, and logistics competence | Causal and dynamic models | Apply causal and time-series models to measure the effects of tracking and timeliness on operational efficiency and validate the structural stability of the LPI. |
| [13] | Profit | Economic prediction and logistics efficiency | Hybrid predictive models (ML + optimization) | Develop hybrid models combining machine learning and mathematical optimization to improve the explanatory and predictive capacity of the LPI, evaluating its robustness in nonlinear economic contexts. |
Disclaimer/Publisher’s Note: The statements, opinions and data contained in all publications are solely those of the individual author(s) and contributor(s) and not of MDPI and/or the editor(s). MDPI and/or the editor(s) disclaim responsibility for any injury to people or property resulting from any ideas, methods, instructions or products referred to in the content. |
© 2025 by the authors. Licensee MDPI, Basel, Switzerland. This article is an open access article distributed under the terms and conditions of the Creative Commons Attribution (CC BY) license (http://creativecommons.org/licenses/by/4.0/).
Copyright: This open access article is published under a Creative Commons CC BY 4.0 license, which permit the free download, distribution, and reuse, provided that the author and preprint are cited in any reuse.


