
Submitted:
22 July 2025
Posted:
23 July 2025
You are already at the latest version
Abstract
This study investigates the systemic interrelations between logistics performance, environmental performance, sustainable development progress, and institutional governance. While existing literature often examines these dimensions separately, this research conceptualizes them as co-determined drivers of national development. Using data from 128 countries, the analysis integrates four composite indices—Logistics Performance Index (LPI), Environmental Performance Index (EPI), Sustainable Development Goals Index (SDG), and Worldwide Governance Indicators (WGI)—alongside GDP per capita. Methodologically, the study applies multiple linear regressions and correlation analyses to assess the associations among these variables and employs Fuzzy Cognitive Mapping (FCM) to simulate scenario-based systemic interactions. Results show that all ESG indicators are positively and significantly associated with LPI, with WGI exerting the strongest effect. In turn, LPI, EPI, SDG, and WGI jointly explain 81.7% of the variance in GDP per capita, confirming their integrated role in shaping economic performance. FCM simulations further reveal that both environmental and institutional improvements generate reinforcing effects on logistics capacity and GDP outcomes. The study’s originality lies in its multiple method approach and its synthesis of ESG and logistics performance metrics into a unified explanatory framework. It contributes to development studies by highlighting the structural embeddedness of logistics within broader institutional and sustainability ecosystems. Policy implications suggest that integrated reforms—combining infrastructure, regulatory quality, and environmental stewardship—are essential for enhancing long-term national competitiveness and resilience.
Keywords:
logistics performance
; LPI
; ESG
; GDP
; institutional quality
; sustainable development
; Fuzzy cognitive map
1. Introduction
In contemporary socio-economic discourse, the notion of development transcends the simplistic metrics of aggregate output. In a world increasingly governed by systemic complexity, institutional asymmetries, and ecological precarity, the demand for a more holistic evaluative paradigm becomes both epistemologically and pragmatically urgent. The principal aim of this research is to empirically examine the functional interdependencies among national logistics efficiency, ESG indicators, and per capita economic output. Unlike existing approaches that isolate these domains, this study posits their co-deterministic influence on structural development. The core hypothesis is that logistics performance, institutional stability (eunomia) and equitable governance (isonomia), and sustainable praxes operate not in isolation but as interdependent vectors shaping macroeconomic capabilities.
The rationale for examining logistics performance in conjunction with ESG indicators lies in their growing convergence within global development strategies. Logistics systems are not just economic facilitators—they directly influence carbon emissions, resource use, labor conditions, and regulatory compliance. ESG frameworks, on the other hand, increasingly incorporate operational dimensions such as supply chain transparency, environmental impact, and institutional governance. By analyzing their interaction, this study sheds light on how infrastructure quality and operational efficiency are embedded within broader sustainability and governance ecosystems, offering a more systemic understanding of national development dynamics.
To operationalize this inquiry, a two-tiered methodology is employed. First, the study investigates how ESG-related indicators—specifically the Environmental Performance Index (EPI), Sustainable Development Goals Index (SDG), and Worldwide Governance Indicators (WGI)—influence national logistics performance, as measured by the Logistics Performance Index (LPI). This stage uses simple linear regression models to quantify the strength and direction of these relationships. Subsequently, a multiple linear regression model is applied to assess how logistics performance, alongside ESG indicators, jointly affects economic output, with Gross Domestic Product (GDP) per capita serving as the dependent variable. This sequential approach allows for the examination of both direct and mediated pathways linking sustainability, governance, and logistics to economic development. In the second stage, a Fuzzy Cognitive Mapping (FCM) model is applied to simulate conceptual interrelations and causal feedbacks among the indicators. This enables a semantic representation of influence dynamics often obscured in linear modeling.
The empirical results confirm a statistically significant and conceptually consistent relationship among logistics performance, governance quality, environmental sustainability, and economic output. Logistics efficiency and institutional coherence—captured through the World Bank’s Logistics Performance Index (LPI) and Worldwide Governance Indicators (WGI)—emerge as the strongest predictors of GDP per capita, underscoring their foundational role in economic development. In parallel, sustainability indicators such as the Environmental Performance Index (EPI) from Yale University and the Sustainable Development Goals Index (SDG), compiled by Dublin University, contribute to reinforcing long-term developmental integrity. The use of these high-quality, internationally validated datasets enhances the credibility of the analysis, while the models’ strong explanatory power (R2 > 0.80) confirms the robustness of the observed relationships. Collectively, the findings highlight that economic performance is structurally embedded within broader systems of governance, infrastructure, and sustainability.
This study offers a novel and interdisciplinary contribution to the field of development economics by empirically examining, for the first time, the joint impact of logistics performance and ESG-related indicators on national economic outcomes. Unlike prior research that treats these domains in isolation, it adopts a holistic analytical framework that integrates sustainability, institutional governance, and infrastructure efficiency. Methodologically, the combination of econometric modeling with Fuzzy Cognitive Mapping (FCM) enhances both the explanatory depth and the conceptual clarity of the analysis—capturing not only linear associations but also complex, dynamic interdependencies. This dual approach allows for the simulation of causal pathways and feedback loops, offering a more realistic and policy-relevant understanding of how development systems function. By identifying the most influential variables and their conditions of effectiveness, the study contributes valuable insights for policymakers, scholars, and practitioners aiming to design integrated, future-proof development strategies in a post-growth global context.
In this context, the main variables employed in the analysis—logistics performance, environmental performance, sustainable development progress, institutional quality, and economic output—are briefly introduced below, as they form the empirical backbone of the study’s integrated framework.
The Logistics Performance Index (LPI), developed by the World Bank, is a composite benchmarking tool designed to evaluate and compare the effectiveness of trade logistics across countries. The LPI serves as a stand-in for each nation’s participation in international value chains and freight flow friction [1].The LPI is primarily based on structured surveys administered to international freight forwarders and logistics professionals, who rate the countries they operate in along six core dimensions: (1) the efficiency of customs clearance procedures, (2) the quality of trade and transport infrastructure, (3) the ease of arranging competitively priced international shipments, (4) the competence and quality of logistics services, (5) the ability to track and trace consignments, and (6) the timeliness of shipments reaching their destination. Each dimension is scored on a scale from 1,very low performance, to 5, very high performance, [2].
The Environmental Performance Index (EPI) 2024 provides a data-driven summary of the state of sustainability in 180 countries, based on 58 indicators grouped into 11 issue categories and three overarching policy objectives: environmental health, ecosystem vitality, and climate change mitigation. These indicators assess national performance in areas such as air quality, biodiversity and habitat, water resources, agriculture, and waste management. Scores are normalized on a scale from 0 to 100, where 100 represents the best observed outcomes globally. Each country’s overall EPI score is calculated as a weighted average of the underlying indicators, enabling cross-country comparisons and progress tracking over time. The EPI serves as a valuable policy tool, helping decision-makers identify priority areas for environmental improvement and benchmark national outcomes against global best practices [3].
The Sustainable Development Goals Index (SDG Index) is a composite measure designed to assess countries’ progress toward achieving the 17 United Nations Sustainable Development Goals (SDGs) outlined in the 2030 Agenda. The index draws on 125 indicators—98 global and 27 OECD-specific—covering a broad spectrum of domains such as poverty, health, education, gender equality, clean energy, institutional quality, and economic resilience. Each goal is scored on a normalized scale from 0 to 100, with 100 indicating full achievement. A country’s overall SDG Index score is calculated as the unweighted arithmetic mean of its performance across all 17 goals. The 2024 edition of the index also incorporates the International Spillover Index, which measures negative cross-border effects—such as trade, environmental degradation, and financial flows—exerted by one country on others. Together, these indicators provide a holistic tool for benchmarking sustainable development performance, enabling cross-national comparisons and the identification of policy priorities [4].
The Worldwide Governance Indicators (WGI), developed by the World Bank, assess six key dimensions of governance—a) Voice and Accountability, b) Political Stability and Absence of Violence/Terrorism, c) Government Effectiveness, d) Regulatory Quality, e) Rule of Law, and f) Control of Corruption—across more than 200 countries and territories from 1996 to 2023. These indicators are constructed from over 30 primary data sources, including household and firm surveys, expert assessments, and institutional reports from think tanks, NGOs, private firms, and international organizations. The methodology follows a three-step process: (1) individual source variables are assigned to one of the six governance dimensions based on conceptual alignment; (2) each variable is rescaled to a 0–1 range for comparability; and (3) a statistical technique called the Unobserved Components Model (UCM) is used to combine the rescaled data into aggregate scores. The UCM accounts for differences in scale and reliability across sources, assigning greater weight to more consistent datasets. The resulting scores follow a standard normal distribution (mean = 0, SD = 1) and are also reported as percentile ranks (0–100), providing a robust, perception-based measure of governance quality globally [5].
Gross Domestic Product (GDP) per capita is a widely used economic indicator that measures the average economic output per person in a given country. It is calculated by dividing the total GDP of a nation by its midyear population, thereby accounting not only for the size of an economy but also for its demographic scale. This normalization allows for meaningful cross-country comparisons of economic well-being and productivity, independent of population size. GDP itself reflects the total monetary value of all goods and services produced within a country’s borders, including product taxes and excluding subsidies not captured in market prices. Importantly, GDP per capita is reported in current U.S. dollars and does not account for inflation, asset depreciation, or the depletion of natural resources, which may affect the sustainability of growth. Despite these limitations, it remains a key proxy for living standards and macroeconomic performance, and is regularly reported by the World Bank and other international institutions [6].
The structure of this paper is organized as follows: Section 2 provides a critical literature review that examines the individual and combined effects of Logistics Performance (LPI), Environmental Performance (EPI), Sustainable Development (SDG Index), and Governance Quality (WGI) on economic output. Section 3 outlines the methodological framework, detailing the econometric models and Fuzzy Cognitive Mapping (FCM). Section 4 presents the empirical results and interprets the key statistical findings. Section 5 offers a broader discussion, situating the results within the context of previous research and policy relevance. Finally, Section 6 concludes the paper by summarizing the main contributions and suggesting directions for future research.
2. Literature Review
The review explores how ESG indicators (EPI, SDG, WGI) relate to logistics performance (LPI) and jointly impact GDP per capita, providing the empirical basis for the study.
2.1. Logistics Performance (LPI) and Environmental Performance
This section presents studies that examine the relationship LPI and environmental outcomes, with a focus on CO2 emissions as the primary sustainability metric. Given the energy-intensive nature of the logistics sector, the reviewed literature explores whether improvements in LPI correlate with lower emissions or exacerbate environmental pressures. Several studies also assess how this relationship interacts with GDP growth, providing insights into whether logistics efficiency promotes sustainable development or reinforces carbon-intensive economic expansion.
The literature investigating the environmental implications of logistics performance reveals a nuanced and at times contradictory relationship, particularly when carbon dioxide (CO2) emissions are used as the primary indicator of environmental performance. Wan et al. [7], analyzing 22 emerging economies, found that higher LPI scores were consistently associated with increased CO2 emissions across all quantiles, suggesting that improvements in logistics infrastructure and services may intensify environmental degradation if not accompanied by green innovation and renewable energy adoption. Similarly, Salem et al. [8] showed that in Gulf countries, the customs and infrastructure components of the LPI had significant effects on both CO2 emissions and energy consumption, highlighting the ecological trade-offs embedded in logistics expansion.
Conversely, other studies identify potential synergies between LPI and environmental quality. Mumin et al. [9], using data from 43 African nations, observed that LPI was negatively associated with CO2 emissions when combined with technological innovation, suggesting that logistics modernization aligned with green technologies can enhance environmental outcomes.
Magazzino et al. [10], studying the top 25 logistics-performing countries, concluded that improvements in LPI significantly increase carbon emissions, reinforcing concerns that the global supply chain remains far from decarbonized. Interestingly, while LPI supported trade and economic connectivity, it had a paradoxically negative effect on GDP in the upper quantiles—implying a cost in terms of environmental degradation. On the other hand, Suki et al. [11] confirmed the dual nature of LPI in Asian economies, where it fosters economic growth while simultaneously contributing to environmental deterioration, thus necessitating infrastructural transformation toward greener logistics. Similarly, Khan et al. [12] demonstrated in ASEAN economies that the integration of renewable energy into logistics operations leads to reductions in emissions while improving national competitiveness and economic image.
2.2. Logistics Performance (LPI) and Sustainable Development
Recent research highlights the increasingly multidimensional role of logistics performance in advancing sustainable development goals (SDGs). Beyond its traditional function in trade facilitation and economic growth, logistics infrastructure and services are now examined as pivotal levers for achieving environmental, social, and institutional sustainability.
Barakat and Gerged [13] provide compelling evidence of an indirect effect of LPI on social sustainability—particularly SDG 8.5, which targets equal pay and decent work—through the mediating role of trade openness. Their moderated mediation analysis, which includes 168 countries, shows that while LPI positively influences male wage levels via increased trade openness, the effect on female wages remains statistically insignificant. Notably, tariffs were found to moderate this indirect relationship, thus emphasizing the role of trade policy in enhancing the inclusivity of logistics-driven growth
Vilalta-Perdomo et al. [14] explore the contribution of logistics systems to food security under SDG 2 (Zero Hunger). Analyzing LPI and SDG 2 scores globally, the study identifies logistics performance—particularly customs efficiency—as a significant predictor of a nation’s progress toward food accessibility and availability. These findings establish logistics as a backbone for sustainable food systems and equitable resource distribution.
Shamout [15] examines the role of logistics performance in achieving the United Nations Sustainable Development Goals, particularly SDG 11 (Sustainable Cities and Communities) and SDG 13 (Climate Action). Analyzing 47 European and Central Asian countries, the study finds that key LPI components—such as customs efficiency, infrastructure, and tracking—positively influence environmental health and ecosystem vitality. However, it also notes that economic growth, trade, and industrialization increase CO2 emissions, emphasizing that logistics can support environmental sustainability only when aligned with broader SDG-focused policies.
In a broader cross-country analysis, Larson [16] finds that logistics performance is strongly correlated with indicators of social well-being, including education, health, and equality. While LPI is associated with economic dynamism, it also correlates with increased emissions due to transportation-related energy consumption. This duality reinforces the necessity for green logistics strategies that promote growth without compromising environmental goals
On the other hand, Rashidi and Cullinane [17] found that although countries with high LPI scores often demonstrate strong trade and transport infrastructure, these rankings do not necessarily translate into superior performance in sustainability terms. In particular, the study uncovers that some nations rank highly on the LPI yet underperform in environmental and social dimensions, such as emissions control and labor intensity. Conversely, a few lower-ranking LPI countries exhibit comparatively better sustainability metrics. This misalignment suggests that while LPI reflects trade efficiency and logistics competence, it does not sufficiently capture the environmental and social responsibilities embedded in sustainable development strategies.
2.3. Logistics Performance (LPI) and Governance Quality (WGI)
The interdependence between logistics performance and governance quality has garnered increased attention in recent years, particularly through the lens of the World Governance Indicators (WGI).
Uyar et al. [18] demonstrate that public governance has a significant direct impact on logistics performance, and that corporate governance acts as a mediating factor. Their global dataset reveals that countries with stronger public institutions and corporate accountability mechanisms exhibit higher logistics sector efficiency. In a similar vein, Koh et al. [19] find that in Asian economies, corruption negatively affects all six dimensions of the LPI. However, government effectiveness moderates this relationship—where governance is strong, the negative impact of corruption is reduced, thereby preserving logistics capacity. Visbal-Cadavid et al. [20], using multiple factor analysis and hierarchical clustering, show that countries with strong governance and infrastructure quality consistently fall into the most advanced logistics clusters globally, while those with institutional deficits underperform in both LPI and human development.
From a firm-level perspective, Karaman et al. [21] highlight that in weak governance environments, the link between logistics performance and sustainability reporting becomes more pronounced—suggesting that firms compensate for institutional gaps via voluntary transparency mechanisms. Finally, Shepherd and Sriklay [22] apply machine learning to LPI data and confirm that institutional quality is among the top predictors of national logistics performance, alongside economic structure and infrastructure.
Collectively, these findings reinforce the conclusion that effective public governance not only enhances logistics performance but also acts as a foundational enabler of broader economic, social, and environmental progress. Integrating WGI indicators into logistics evaluation frameworks is thus essential for a comprehensive understanding of national development dynamics.
2.4. Logistics Performance (LPI) and Economic Development (GDP)
A plethora of studies confirm a strong link between logistics performance (LPI) and economic output (GDP), with LPI positively influencing growth directly or through factors like trade and infrastructure quality.
Coto-Millan et al. [23] argue that logistics is no longer a passive background factor in global production but a core production determinant. Their panel study across 85 countries from 2007–2022 reveals that enhancements in logistics infrastructure—particularly customs efficiency and shipment tracking—significantly elevate GDP. Conversely, inefficiencies in delivery timeliness and shipping costs suppress output growth, indicating asymmetries among LPI components.
Celebi [24] introduces a mediation model and finds that the relationship between LPI and GDP is not purely direct. Instead, Foreign Direct Investment (FDI) and patent activity serve as strong mediators. Countries with superior logistics performance attract more FDI and foster innovation, which in turn boost GDP. Notably, both FDI and patents fully mediate the LPI–GDP relationship, highlighting the role of logistics in facilitating not just trade but technological advancement.
In a complementary study, Karabulut and Civelek [25] examined the potential mediating role of business creation. Using data from 76 countries, they found that even without new business formation, improvements in logistics infrastructure directly support economic growth. This suggests that logistics capacity enhances efficiency and competitiveness of existing firms, contributing to GDP growth without necessarily depending on entrepreneurship as a transmission mechanism.
Sabir et al. [26] reinforce this link through a time-series panel study of 107 countries. Their results confirm a statistically significant long-term relationship between logistics and GDP. Crucially, the study stresses that policymakers should focus on comprehensive logistics development—not just physical infrastructure—to sustain economic expansion.
Kumari and Bharti [27] found that enhanced logistics efficiency significantly increases bilateral trade, with population size acting as a key moderating factor. Larger countries benefit more in absolute GDP due to economies of scale, but when focusing on GDP per capita, smaller and medium-sized countries often achieve greater relative gains. This distinction underscores the importance of evaluating logistics performance not just at the aggregate level, but through a per capita lens to capture its true developmental impact.
Jayathilaka et al. [28] analyzed data from 142 countries (2007–2018) and found that LPI positively affects net exports across regions, especially in Asia, Europe, and Oceania. In contrast, GDP has mixed or even negative effects in some regions, highlighting that logistics efficiency—not just economic scale—drives trade. Building upon this multi-layered influence, Saini and Hrusecka [29] examine the relationship between the Logistics Performance Index (LPI), Ease of Doing Business (EODB) and Logistics Cost (LC) with GDP per capita in ten countries, combining large and medium-sized economies, finding that LPI is the most stable and significant determinant of economic growth, in contrast to EODB and LC, which show mixed results. The study highlights that logistics efficiency is a key driver of economic growth, particularly when analyzed in terms of GDP per capita, which is in line with the methodological approach of this paper.
Widayat et al. [30] show that key LPI components—customs, infrastructure, and timeliness—strongly influence a country’s global competitiveness, often more than macroeconomic factors. Improved logistics boost competitiveness, which in turn drives sustainable economic growth, reinforcing their strategic role in national development policies.
Taken together, the literature confirms the consistent and multifactorial impact of logistics performance on economic development, both directly and through mediating mechanisms such as investment, innovation, and trade facilitation.
2.5. Environmental Performance, Sustainable Development, Governance Quality and Economic Development
Environmental performance, governance quality, and sustainable development each influence economic growth, but their effects are deeply interrelated. Recent studies emphasize their combined role in promoting resilient, inclusive, and sustainable development, rather than viewing them in isolation.
Recent research suggests that governance does not merely act as an independent driver of development, but often functions as a moderating or mediating factor between environmental outcomes and economic expansion. Wendling et al. [31] confirm that governance quality (WGI) is one of the strongest predictors of environmental performance index (EPI), even beyond the effects of income levels. Similarly, Mavragani et al. [32] demonstrate that economies with high institutional quality and openness achieve better environmental results (EPI), pointing to governance as a foundational enabler of sustainability. This interdependence is further emphasized by Jain et al. [33], who find that while economic growth in many countries is linked to environmental (EPI) degradation, effective governance and balanced government structures can reduce or even reverse this effect.
Focusing on South Asia, Ullah et al. [34] show that governance quality significantly moderates the environmental consequences of rising GDP per capita, with stronger institutions able to curb CO2 emissions even amid economic expansion. Reinforcing this, Naz et al. [35] argue that environmental performance acts as a mediating variable in the relationship between governance and sustainable development, suggesting that institutional reform alone is insufficient without ecological accountability.
Recent findings deepen this perspective. San Ong et al. [36] highlight that governance (WGI) exerts a stronger influence on environmental performance (EPI) in developing countries, where regulatory enforcement and public accountability are more variable. De Miranda et al. [37] add that innovation and governance (WGI) jointly shape environmental (EPI) outcomes, implying that policies for sustainable development must account for both institutional and technological capacities. Meanwhile, Handoyo [38], using cross-national correlation analysis, provides strong empirical support for the positive association between all six WGI components—public accountability, regulatory quality, government effectiveness, political stability, rule of law, and control of corruption—and environmental sustainability (EPI). The analysis affirms that well-governed countries not only manage their economies more effectively but also outperform in environmental resilience and ecosystem protection.
As Baciu [39] demonstrates, all core governance dimensions (WGI)—ranging from control of corruption to regulatory quality—positively influence sustainable development across a global panel of countries. Saba et al. [40] reinforce this by showing that institutional quality plays a decisive role in mitigating environmental degradation, especially in vulnerable regions. At the same time, Ellis and Edmonds [41] raise important concerns about the rise of indicator-based governance, cautioning that while sustainability indices are critical tools, they must complement—rather than replace—normative, legal, and participatory structures. These insights point toward the growing importance of comprehensive and balanced metrics for development assessment.
2.6. Research Gap
Although an extensive body of literature acknowledges the developmental significance of logistics performance, environmental sustainability, governance quality, and economic output, these dimensions are rarely examined within a fully integrated framework. Empirical studies have independently explored how the Logistics Performance Index (LPI) correlates with GDP, how environmental constraints influence long-term growth, or how institutional quality shapes development trajectories. However, most of these analyses adopt a fragmented approach, examining bivariate or partial relationships. The dynamic, multidirectional interplay between these variables—how logistics, governance, and environmental performance reinforce or counteract each other in shaping economic outcomes— remains conceptually underarticulated and empirically underexamined.
2.7. Research Questions
Building on the insights drawn from the literature, it becomes evident that logistics performance, environmental sustainability, governance quality, and sustainable development are not merely parallel dimensions but part of an interdependent system influencing national prosperity. The recurring empirical evidence of their mutual reinforcement points to a structural nexus that warrants deeper investigation. The study formulates two key research questions to empirically explore the nature and extent of these interrelations:
RQ1: What is the relationship between ESG-related metrics (Environmental Performance Index, Sustainable Development Goals Index, and Worldwide Governance Indicators) and a country’s Logistics Performance Index (LPI)?
RQ2: To what extent do logistics performance and ESG-related indicators jointly explain cross-country variation in GDP per capita?
3. Materials and Methods
3.1. Data and Variables
To address the research questions, this study utilized a set of internationally recognized indicators reflecting economic performance, governance quality, environmental sustainability, and logistics efficiency. The most recently available data were collected from authoritative sources for each indicator. Although the reference years differ slightly across variables—owing to the publication cycles of each index—the selection prioritized the most up-to-date datasets accessible as of 2024. This minor temporal variation does not compromise the analysis, as these indicators typically exhibit limited short-term volatility and remain robust proxies of structural national performance. Table 1 presents the full list of variables, including their definitions, sources, and reference years.
To ensure comparability across variables measured on different scales, all indicators were normalized to a common 0–100 range. The Environmental Performance Index (EPI) and Sustainable Development Goals Index (SDG) required no transformation, as they are already expressed on a 0–100 scale by their original sources. In contrast, the Logistics Performance Index (LPI) and its subcomponents—originally scored from 1 to 5—were normalized using the formula:
LPI scaled = (X − 1) / 4 × 100
Similarly, the Worldwide Governance Indicators (WGI), originally ranging from –2.5 to +2.5, were rescaled as follows:
WGI scaled = (X + 2.5) / 5 × 100
The WGI variable employed in this study is an original composite measure constructed by the authors, calculated as the arithmetic mean of the six governance dimensions provided by the World Bank (Voice and Accountability, Political Stability, Government Effectiveness, Regulatory Quality, Rule of Law, and Control of Corruption).
Due to the highly skewed distribution of GDP per capita across countries, a natural logarithmic transformation was applied to stabilize variance and improve linearity, following standard econometric practice [42].
GDP per capita = lnGDP
Subsequently, LnGDP per capita was normalized using the min–max scaling method, after applying the logarithmic transformation:
LnGDP scaled = [(lnGDP − min lnGDP) / (max lnGDP − min lnGDP)] × 100
This normalization process preserves the relative distances between countries while enabling coherent integration across all analytical stages—regression models and fuzzy cognitive mapping.
To assess the statistical properties of the dataset, normality tests were conducted on both the original and normalized values of all variables. The Shapiro–Wilk and Kolmogorov–Smirnov tests were applied to evaluate distributional normality, complemented by visual inspections using histograms and Q–Q plots. Although some variables—particularly GDP per capita and governance scores—exhibited non-normality in their raw forms, the normalization process improved symmetry and reduced skewness in most cases.
Additionally, descriptive statistics were computed for each variable, including measures of central tendency (mean, median), dispersion (standard deviation, range), and shape (skewness, kurtosis). These descriptive profiles served both as diagnostic tools and as foundational inputs for regression modeling, enabling a more precise interpretation of relative variable behavior across countries.
For the purposes of this analysis, a sample of 123 countries was selected based on the availability of complete and consistent data across all key variables (LPI, EPI, SDG, WGI, and GDP per capita). This ensures comparability and statistical validity throughout the study.
All statistical analyses were conducted using IBM SPSS Statistics version 23, which provided the computational environment for regression modeling, correlation testing, and diagnostic validation.
3.2. Regression Analyses
To explore the structural relationships among logistics performance, sustainability indicators, governance quality, and economic output, four linear regression models were estimated. These analyses serve both an explanatory and preparatory function: they provide insights into the statistical associations among key variables and generate the empirical basis for the Fuzzy Cognitive Map (FCM) simulation framework introduced later.
The regressions were divided into two groups, corresponding to the study’s two central research questions:
Analyses for Research Question 1 (RQ1)
“How do ESG-related metrics relate to logistics performance?”
To examine this, three separate univariate regression models were constructed, each using LPI as the dependent variable and a single ESG proxy as the independent variable:
Model 1: LPI ~ EPI
Model 2: LPI ~ SDG
Model 3: LPI ~ WGI
These models isolate the potential influence of environmental sustainability, sustainable development progress, and governance quality on national logistics performance.
Analysis for Research Question 2 (RQ2)
“How do all selected indicators jointly relate to GDP per capita?”
A fourth regression model was developed using GDP per capita (log-transformed and normalized) as the dependent variable and the full set of explanatory indicators as independent variables:
Model 4: GDP ~ LPI + EPI + SDG + WGI
This multivariate model captures the combined effect of logistics, environmental sustainability, governance, and development progress on economic performance.
For each model, a comprehensive suite of diagnostics was conducted and reported in the results section:
Model Summary tables provide R, R2, and Adjusted R2 values, quantifying the explanatory power of each model.
ANOVA tables confirm model significance via F-tests, all statistically significant at p < 0.05.
The regression output includes coefficient tables reporting both standardized and unstandardized beta values, allowing for the interpretation of the strength and direction of each predictor’s effect.
Collinearity diagnostics—specifically the Variance Inflation Factor (VIF) and Tolerance—were employed to assess potential multicollinearity among independent variables.
Residual analyses were conducted to verify key model assumptions, including linearity, normality, and homoscedasticity.
Finally, scatterplots were used to visually inspect the linear fit, detect potential outliers, and identify any deviations from model assumptions.
3.3. Corellation Analyses
To further examine the interdependencies between key institutional and logistical indicators—specifically the component dimensions of the Logistics Performance Index (LPI) and the Worldwide Governance Indicators (WGI)—a series of bivariate correlation analyses were conducted.
Given the non-parametric nature of some variables and the results of the normality tests, the Kendall’s tau-b coefficient was selected over Pearson’s r. The Shapiro–Wilk and Kolmogorov–Smirnov tests revealed that many of the governance and logistics sub-indicators exhibited significant skewness and deviated from a normal distribution. Since Pearson’s r assumes bivariate normality and continuous linear relationships, it was deemed inappropriate for these data.
Kendall’s tau-b was thus employed as a more robust and distribution-free alternative. It is particularly suitable for ordinal or rank-based data and handles tied ranks more effectively than Spearman’s rho. Moreover, Kendall’s tau-b provides a more conservative and interpretable measure of monotonic association between non-normally distributed variables [43].
3.4. Fuzzy Cognitive Map Construction Rationale
To complement the statistical findings and explore complex interrelations between ESG metrics, logistics performance, and economic development, a Fuzzy Cognitive Mapping (FCM) approach was applied. FCM provides a simulation-based methodology capable of capturing non-linear, dynamic, and feedback-driven causal structures—particularly useful in multidimensional policy analysis.
Fuzzy Cognitive Maps (FCMs) offer a robust modeling framework for capturing complex causal relationships among multidimensional variables in dynamic systems. Originally introduced by Kosko [44], FCMs integrate elements of fuzzy logic and neural networks, enabling the representation of uncertainty, feedback loops, and nonlinear interdependencies. Glykas [45] highlights the advantages of FCMs in strategic decision-making contexts, emphasizing their capacity to simulate alternative scenarios and incorporate the temporal evolution of systems—overcoming limitations of traditional strategy maps which often assume static, linear causality. Moreover, recent advancements by Aral et al. [46] have further reinforced the applicability of FCMs in social and policy modeling, showcasing their ability to encode stakeholder knowledge into weighted causal graphs and simulate systemic impacts under various interventions. In this study, FCM is employed as a complementary tool to regression and correlation analysis, allowing for the exploration of structural interactions between ESG indicators, logistics performance, and economic outcomes under defined policy scenarios.
The choice of Fuzzy Cognitive Mapping (FCM) over System Dynamics (SD) is methodologically grounded in the nature of the research problem and the data structure. While SD models require precise quantitative parameters and detailed temporal dynamics, FCM is better suited for capturing conceptual interdependencies, semi-quantitative causal relationships, and expert-informed structures—especially in policy contexts involving institutional quality, sustainability, and logistics performance. FCM allows for the integration of both statistical findings and heuristic reasoning, accommodating uncertainty and feedback without the need for fully parameterized models [47,48]. Given the aggregated, cross-national nature of the data and the emphasis on scenario-based exploration, FCM offers a more flexible and interpretable modeling approach for analyzing systemic development dynamics.
Building on the results of the regression and correlation analyses, a Fuzzy Cognitive Map was constructed to model the systemic interdependencies between the key variables under study. The causal structure of the FCM was derived directly from the statistical outputs—specifically the direction and strength of the associations observed in the regression coefficients and the Kendall’s tau-b correlation matrix (see Table 26).
To translate the statistical findings into a functional cognitive model, edge weights in the Fuzzy Cognitive Map were assigned proportionally based on the strength and direction of empirical relationships derived from the statistical analyses. Specifically, the relationships between the six components of the Logistics Performance Index (LPI) and the six components of the Worldwide Governance Indicators (WGI) were determined using Kendall’s tau-b correlation coefficients, as part of the correlation analysis framework. These bivariate correlations capture non-parametric, monotonic associations between institutional and logistical dimensions.
Furthermore, the causal relationships between LPI, EPI, SDG, and WGI were extracted from the standardized regression coefficients of Models 1, 2 and 3, where LPI served as the dependent variable. These models enabled the quantification of how sustainability and governance indicators affect logistics performance.
The structural links connecting GDP per capita with the four main explanatory indicators (LPI, WGI, SDG and EPI) were drawn from the multivariate regression coefficients of Model 4, in which GDP was the dependent variable. This final model captured the joint economic impact of institutional, environmental, and logistical variables.
Each link (edge) in the FCM represents a directed, weighted influence from one variable (node) to another. The weights range from –1 to +1 and reflect the empirical magnitude and polarity of the relationships. Positive weights indicate reinforcing relationships, while negative weights represent inhibitory effects. Variables with consistently strong statistical effects in the prior analyses were assigned proportionally higher weights.
A threshold of ±0.30 was applied to all coefficients and correlation values to retain only meaningful and interpretable connections in the cognitive model. This filtering process yielded a parsimonious yet empirically grounded FCM architecture, which served as the foundation for the scenario simulations (A,B and C) described in the following sections.
The FCM was implemented using the Mental Modeler software environment, which allows for both visualization and simulation of complex systems. The software enables users to encode expert or data-informed relationships, run scenario simulations, and examine dynamic outcomes of variable changes across the network.
3.5. Fuzzy Cognitive Map Scenarios Rationale
Based on the finalized cognitive model, three simulation scenarios (A, B, and C) were designed and executed. Each scenario modifies a distinct subset of input variables—selected for their theoretical significance and empirical support—and observes the system-wide ripple effects on core outcomes such as GDP and LPI. Scenario A represents the median (baseline) case, reflecting moderate and stable development dynamics. Scenario B constitutes the best-case trajectory, where targeted improvements in sustainability, governance, and logistics lead to enhanced economic performance. Scenario C models the worst-case scenario, simulating regression across key dimensions and its detrimental impact on national development. Collectively, these scenarios are not abstract constructions; they are structured to reflect plausible trajectories observed in the real world, enabling policy-oriented experimentation under varying post-growth conditions.
In Scenario A, the Environmental Performance Index (EPI) is increased by one unit, reflecting a policy framework that strongly emphasizes environmental sustainability. This is grounded in empirical findings showing that environmental performance enhances long-term infrastructure planning, fosters clean technology adoption, and improves logistics reliability. For instance, the Environmental Kuznets Curve hypothesis suggests that economic growth initially harms the environment, but improves it at higher income levels [33]. The SDG Index increases by 0.5 points to reflect moderate but targeted progress on specific Sustainable Development Goals—such as Goals 9 (industry, innovation, and infrastructure) and 16 (peace, justice, and strong institutions)—which are shown to have positive associations with logistics performance [4]. To assess how ESG improvements translate into functional performance, the LPI subcomponent “Logistics Quality and Competence” (QUAL) is increased by 1, given its role in representing technical capability and skill intensity in national logistics systems. Simultaneously, the WGI subindicator “Rule of Law” (RL) is increased by 1, as legal predictability, property rights, and contract enforcement have been found to foster trade efficiency and support supply chain performance [49].
Scenario A is designed to evaluate a sustainability-led pathway and test its impacts on logistics performance (RQ1) and economic development (RQ2). This scenario simulates a moderate, status quo trajectory in which institutional quality, sustainability performance, and logistics efficiency remain relatively stable. The input values in this scenario reflect conditions typical of middle-income countries with no major structural disruption or breakthrough.
Scenario B focuses on strengthening governance and commercial readiness as levers to stimulate economic performance. The WGI subindicator “Regulatory Quality” (RQ) is increased by 1, representing improvements in policy consistency and pro-business regulatory frameworks. Such regulatory reforms are empirically associated with better trade facilitation, customs performance, and investment attraction [49,50]. In parallel, the LPI subcomponent “Competence and Quality of Logistics Services” (COM) is increased by 1, in alignment with studies indicating that logistics expertise and service quality drive trade efficiency and competitiveness [51]. Furthermore, the SDG Index is fully increased by 1 point in this scenario to simulate a multidimensional and integrated development effort that supports institutional strengthening and operational capacity.
By modifying these specific variables, Scenario B simulates a bottom-up development strategy that begins with institutional consolidation and sectoral capacity-building, aiming to observe their combined effects on LPI and GDP per capita (RQ1 and RQ2).Scenario B models a developmental trajectory characterized by targeted improvements in key variables. These inputs correspond to real-world policy advances such as major investments in renewable energy, cross-sectoral SDG alignment, and institutional reforms that enhance transparency and effectiveness. For instance, a +1 increase in EPI could reflect measurable reductions in fine particulate pollution or increased protected natural areas, while a +1 increase in SDG index may align with improved access to education or healthcare. Such positive shifts have been observed in high-performing countries (e.g., Sweden, Germany) and are used here to test the upper limits of systemic synergies.
The design of A and B Scenarios reflects an intention to explore two contrasting but complementary development trajectories: one driven by sustainability and environmental goals (top-down), and the other by governance quality and competitiveness (bottom-up). The selection of specific variables for adjustment is grounded in robust empirical evidence. The EPI, SDG, WGI (RL/RQ), and LPI components (QUAL/COM) have all been identified in prior studies as critical enablers of economic and trade performance [51,52]. The magnitudes of change were chosen to represent realistic yet policy-significant improvements that are achievable over medium-term planning horizons. By testing how these shifts affect both logistics performance (RQ1) and economic output (RQ2), the scenarios provide valuable insight into the causal logic of different reform strategies and allow for simulation within the FCM framework.
Scenario C simulates a regressive development pathway, in which the degradation of Environmental Performance Index (EPI), Sustainable Development Goals Index (SDG), Transparency (TR), and Government Effectiveness (WGI-GE) by 0.5, leads to a measurable decline in GDP per capita. Empirical studies support these interdependencies. A decrease in LPI weakens trade capacity and economic output, as shown by Widayat et al. [30], who demonstrate that poor logistics directly erode global competitiveness. Similarly, Inoue and Todo [53] highlight how disruptions in supply chains can reduce GDP by over 5% in major urban economies. Deterioration in governance, especially in indicators such as regulatory quality, control of corruption, and government effectiveness, has been linked to economic stagnation and investor withdrawal [49]. Environmental degradation also imposes long-term economic costs; Kurth et al. [54] emphasize that declining EPI scores—particularly related to emissions and resource use—can destabilize infrastructure and affect productivity. The Sustainable Development Goals (SDG Index) reflect holistic progress; a decline in SDG performance signals structural imbalances across sectors, hindering equitable and sustainable growth. Lastly, transparency and institutional trust are strongly correlated with economic efficiency, particularly in contexts of public investment and reform delivery [55]. Altogether, the literature validates the inclusion of these variables in the negative scenario and underscores their combined impact on national economic decline.
Scenario C is designed to represent a realistic yet adverse policy environment in which institutional fragility, underinvestment in logistics, and erosion of sustainability commitments converge to undermine economic performance. This scenario reflects observed patterns in countries facing political instability, weak governance, environmental degradation, or systemic neglect of infrastructure. It serves not only as a stress-test for development resilience but also as a cautionary projection of how multi-dimensional decline can compound and reverse developmental gains. Modeling such a scenario allows policymakers to anticipate critical thresholds and identify leverage points for avoiding long-term stagnation.
4. Results
4.1. Descriptive Statistics and Normality Tests
Table 2 presents descriptive statistics and Shapiro-Wilk test results for the main variables of interest (initial data-non normalized). Most variables, including LPI initial, EFF initial, QUAL initial, and COM initial, deviate significantly from normality (p < 0.05), as indicated by the Shapiro-Wilk test. Only EASE initial approximates a normal distribution with a p-value of 0.086. Skewness and kurtosis values support this observation, suggesting slightly asymmetric and platykurtic distributions. Given these findings, non-parametric methods such as Kendall’s Tau-b or data transformations are appropriate for subsequent analyses.
Table 3 show normality testing on the normalized variables (Shapiro-Wilk test, α = 0.05), which revealed that most remain non-normally distributed despite transformation. Key variables such as LPI, EFF, QUAL, COM, and most WGI indicators showed p-values below the significance threshold, indicating significant deviations from normality. However, variables like EASE (p = 0.086) and WGI GE (p = 0.411) passed the test, suggesting near-normal distributions. GDPLOG, though transformed, still displayed marginal deviation (p = 0.015), though greatly improved compared to its raw form. These findings justify the use of both parametric and non-parametric methods in subsequent analyses, depending on the variable and analytical context.
A comparison between the initial (Table 2) and normalized (Table 3) datasets revealed that normalization improved the distributional characteristics of several variables, particularly in reducing skewness and kurtosis. Nonetheless, the Shapiro-Wilk test results indicated that a majority of variables continued to deviate from perfect normality. This non-normality, however, does not significantly affect the validity of the analysis, as non-parametric correlation methods (e.g., Kendall’s Tau-b) will be employed where appropriate. Additionally, in all linear regression models, residual diagnostics and outlier controls will be systematically applied to ensure the robustness of the results.
4.2. Regression Analyses
4.2.1. Model 1 Regression Analysis
A simple linear regression (Dependent variable: LPI, Independent variable: EPI) was conducted to examine the effect of environmental performance (EPI) on logistics performance (LPI).
According to Table 4, the model was statistically significant and explained a substantial proportion of the variance in LPI (R2 = 0.468, Adjusted R2 = 0.463). The standardized regression coefficient (R = 0.684) indicates a strong positive association between the two variables. Additionally, the Durbin-Watson statistic (2.089) suggests no serious autocorrelation in the residuals. These findings support the hypothesis that better environmental performance is associated with improved logistics performance at the country level.
The ANOVA results (Table 5) confirmed the statistical significance of the model (F(1,121) = 106.269, p < 0.05), indicating that the regression equation reliably predicts logistics performance based on environmental performance scores. The large F-value and highly significant p-value strengthen the conclusion that EPI has a substantial predictive effect on LPI.
The regression coefficients (Table 6) further confirmed the statistical significance of the model. The unstandardized coefficient (B = 0.789) indicates that for every one-unit increase in a country’s Environmental Performance Index (EPI), its Logistics Performance Index (LPI) increases by approximately 0.789 units. This effect is statistically significant at the p < 0.001 level (t = 10.309), providing strong evidence of a positive and meaningful relationship.
The standardized coefficient (Beta = 0.684) supports this finding, showing that EPI has a strong effect on LPI even when measured in standardized units. The low standard error (SE = 0.077) and high t-value indicate a precise and robust estimate of the regression slope.
The collinearity statistics (Table 6) confirmed the absence of multicollinearity in the model. Specifically, the Tolerance value of 1.000 and Variance Inflation Factor (VIF) of 1.000 indicate that the predictor variable (EPI) is not linearly correlated with any other variable in the model. As expected in a simple linear regression with a single independent variable, these values reflect perfect independence. This ensures the stability and interpretability of the regression coefficient and eliminates concerns about inflated standard errors due to multicollinearity.
The collinearity diagnostics (Table 7) revealed no indication of multicollinearity. The Condition Index values were all below the critical threshold of 30, with the highest observed index at 7.948, which is well within acceptable limits. Furthermore, the variance proportions for both the constant and EPI are evenly distributed across dimensions, and no high proportions (>0.90) were found in the same dimension.
These results further confirm the absence of multicollinearity concerns in the model, supporting the stability of the regression estimates and reinforcing the validity of the inference drawn from the coefficients.
The residual statistics (Table 8) suggest that the assumptions of linear regression are reasonably satisfied. The residuals exhibit a mean of approximately zero (0.000) and a standard deviation of 10.574, consistent with the model’s error term. The standardized residuals fall within the range of -1.818 to +2.678, which is well within the commonly accepted threshold of ±3 for outlier detection, indicating no serious violations or extreme deviations.
The distribution of standardized predicted values is symmetrical (mean = 0.000, SD = 1.000), supporting the assumption of homoscedasticity. These findings confirm that the residuals are appropriately distributed, enhancing the credibility of the model estimates and validating the use of linear regression in this context.
The scatterplot (Figure 1) visualizes the linear relationship between Logistics Performance Index (LPI) and Environmental Performance Index (EPI). The data points show a clear upward trend, supporting the presence of a positive linear association between the two variables. While some dispersion is present—especially at mid-range EPI scores—the majority of observations cluster around the regression line, indicating a reasonably good fit. The linear trend line reinforces the regression findings and suggests that increases in environmental performance are generally associated with higher logistics efficiency.
4.2.2. Model 2 Regression Analysis
A simple linear regression (Dependent variable: LPI, Independent variable: SDG) was conducted to examine the effect of sustainable development (SDG) on logistics performance (LPI).
The linear regression model (Table 9) explains 47.0% of the variance in LPI (R2 = 0.470, Adjusted R2 = 0.466), indicating a strong and meaningful relationship. The correlation coefficient (R = 0.686) suggests a high degree of association, and the Durbin-Watson statistic (2.127) confirms the independence of residuals, further validating the model’s reliability.
The ANOVA results (Table 10) indicate that the model is statistically significant (F= 107.430, p < 0.05), confirming that SDG scores meaningfully contribute to the prediction of LPI. The high F-value and the very low p-value validate the robustness of the linear relationship.
The regression coefficient (Table 11) is statistically significant (b = 1.026, p < 0.001), indicating that for every one-point increase in a country’s Sustainable Development Goal (SDG) score, its Logistics Performance Index (LPI) is expected to increase by approximately 1.03 units. The standardized coefficient (β = 0.686) suggests a strong positive effect. The model demonstrates high explanatory power and precision (t = 10.365), and no multicollinearity issues were detected (VIF = 1.000, Tolerance = 1.000).
The collinearity diagnostics (Table 12) support the absence of multicollinearity in the model. The highest Condition Index (14.514) falls well below the critical threshold of 30, and the variance proportions for both the constant and SDG predictor, while high in the same dimension, are not indicative of collinearity since there is only one predictor in the model. These results confirm that the regression estimates are stable and not affected by collinearity.
The residual statistics (Table 13) demonstrate that the assumptions of linear regression are satisfied. The residuals are symmetrically distributed around a mean of zero (0.000) with a standard deviation of 10.547. All standardized residuals fall within the acceptable range of ±3, indicating that there are no influential outliers. Furthermore, the standardized predicted values are well-balanced (range: -2.629 to 1.721), supporting the assumptions of linearity and homoscedasticity. These results confirm the robustness and reliability of the regression model.
The scatterplot (Figure 2) illustrates a clear positive linear relationship between SDG scores and LPI. The upward-sloping regression line reflects a consistent trend: as countries perform better on Sustainable Development Goals, their logistics performance tends to improve. While there is some dispersion of data points around the line, especially at mid-range SDG values, the majority of observations align well with the model’s predicted trajectory. No curvature or clustering pattern indicates a violation of linearity, supporting the assumption of a linear relationship.
4.2.3. Model 3 Regression Analysis
A simple linear regression (Dependent variable: LPI, Independent variable: WGI) was conducted to examine the effect of governance quality (WGI) on logistics performance (LPI).
The regression model (Table 14) using WGI as the predictor of LPI demonstrated a very strong linear relationship. The model explains 67.7% of the variance in logistics performance (R2 = 0.677, Adjusted R2 = 0.674), with a high correlation coefficient (R = 0.823). The standard error of the estimate (8.269) is the lowest among the models tested so far, indicating superior predictive accuracy. Additionally, the Durbin-Watson statistic (2.130) suggests no autocorrelation in the residuals, confirming model independence.
The ANOVA test (Table 15) confirmed the model’s statistical significance (F= 253.69, p < 0.05), showing that the governance index (WGI) is a highly effective predictor of logistics performance (LPI). The exceptionally high F-statistic further supports the robustness of the model.
The regression coefficient (Table 16) for WGI was statistically significant (b = 0.659, p < 0.001), indicating that a one-unit increase in governance quality is associated with a 0.659-point increase in LPI. The standardized coefficient (β = 0.823) is the highest among all tested models, confirming a very strong positive effect. The precision of the estimate is reflected in the high t-value (15.928), and multicollinearity is absent (VIF = 1.000, Tolerance = 1.000). Overall, governance emerges as the most powerful predictor of logistics performance in this analysis.
The collinearity diagnostics (Table 17) show no indication of multicollinearity. The highest Condition Index (5.847) is well below the accepted threshold of 30, and although the variance proportions are high for both the constant and WGI, this is not a concern given the univariate nature of the model. The results confirm that the regression estimates are statistically stable and reliable.
The residual analysis (Table 18) confirms that the assumptions of linear regression are satisfied. The residuals are symmetrically distributed around zero, with no extreme outliers (standardized residuals fall within the acceptable ±3 range). The relatively low standard deviation of residuals (8.235) further supports the model’s high predictive accuracy. These results indicate that the model is both statistically and diagnostically robust.
The scatterplot (Figure 4) illustrates a strong positive linear relationship between governance quality (WGI) and logistics performance (LPI). The data points are closely aligned with the regression line, indicating a well-fitting model. The slope is steep, consistent with the high standardized regression coefficient (β = 0.823). There is minimal dispersion, and no visible curvature or clustering that would suggest non-linearity. These visual patterns reinforce the statistical results and confirm that WGI is a powerful predictor of LPI.
4.2.4. Model 4 Regression Analysis
A multiple linear regression (Dependent variable: GDP, Independent variables: LPI, EPI, SDG, WGI) was conducted to assess the combined effect of logistics performance (LPI), environmental sustainability (EPI), sustainable development (SDG), and institutional quality (WGI) on economic output, as measured by GDP per capita. The model aimed to evaluate whether these systemic factors jointly contribute to explaining cross-country variation in GDP levels. This analysis builds upon prior single-variable regressions and tests the cumulative predictive power of the LESG dimensions within a unified framework.
The regression model (Table 19) predicting GDP based on LPI, EPI, SDG, and WGI achieved a high R2 of 0.817, indicating that 81.7% of the variance in GDP can be explained by these predictors. The Durbin-Watson statistic (2.067) suggests no autocorrelation in residuals, confirming that the model satisfies the independence assumption. These results highlight the strong explanatory power of institutional and ESG-related indicators in determining economic performance.
The ANOVA results (Table 20) confirm that the regression model is statistically significant overall (F = 131.97, p < 0.05). This indicates that the combination of LPI, EPI, SDG, and WGI provides a meaningful and robust prediction of GDP levels across countries. The model’s predictive strength is unlikely to be due to random variation.
According to Table 21 all four predictors—WGI, EPI, SDG, and LPI—show statistically significant positive effects on GDP (p < 0.01 for all). Among them, governance quality (WGI) exhibited the strongest influence (β = 0.355), followed closely by LPI (β = 0.220), SDG (β = 0.215), and EPI (β = 0.207). Variance Inflation Factor (VIF) values were all below 5, indicating no problematic multicollinearity. This suggests that both institutional quality and ESG-related factors jointly contribute to economic performance.
Although the fifth dimension (Table 22) shows a condition index above 30 (33.385), only the SDG variable loads heavily on this dimension (variance proportion = 0.98), while the remaining predictors are well below the critical threshold. Combined with VIF values under 5, there is no evidence of severe multicollinearity, and the model remains statistically reliable.
The residuals (Table 23) are symmetrically distributed around zero, with standardized residuals within the acceptable range of ±3. The standard deviation of residuals closely matches the model’s standard error of the estimate, suggesting homoscedasticity. These indicators support the assumption of normally distributed and independent residuals, validating the reliability of the regression model.
The joint scatterplot (Figure 5) with marginal boxplots demonstrates a strong positive association between LPI and GDP. The upward trend reflects that countries with higher logistics performance also tend to have higher economic output. The distributions of both variables are approximately symmetric, with no significant outliers detected. This visual representation supports the regression findings and further validates the inclusion of LPI as a meaningful predictor of GDP.
The scatterplot (Figure 6) between EPI and GDP reveals a positive and approximately linear relationship, suggesting that countries with better environmental performance tend to have higher GDP levels. The marginal boxplots confirm the absence of significant outliers in both variables. Although the strength of the correlation appears slightly lower than that of LPI, the EPI still demonstrates a meaningful association with economic output, supporting its inclusion in the multiple regression model.
The scatterplot (Figure 7) confirms a strong positive association between countries’ SDG scores and GDP levels. The trend is visibly linear, indicating that improvements in sustainable development are aligned with higher economic output. The distribution of SDG scores is relatively concentrated among mid-to-high values, while GDP remains more dispersed. Nonetheless, the alignment of points reinforces the relevance of SDG performance in explaining economic variation across countries.
Among all the predictors, the scatterplot (Figure 8) for WGI and GDP exhibits the strongest linear relationship. Countries with better governance consistently show higher GDP levels, with very little dispersion around the trend. This visual evidence supports the regression results, where WGI demonstrated the highest standardized effect (β = 0.355). The result reinforces the importance of institutional quality in shaping national economic performance.
4.3. Corellation Analyses
To investigate the relationships between the component variables of LPI and WGI, Kendall’s tau-b correlation coefficient was employed.
4.3.1. Correlation analysis among LPI and the six components of LPI
Table 24 presents the Kendall’s tau-b correlations among the six subcomponents of the Logistics Performance Index (LPI) and the LPI as well: Efficiency (EFF), Quality (QUAL), Ease (EASE), Competence (COM), Frequency (FREQ), and Timeliness (TR). All pairwise correlations are positive and statistically significant at the 0.01 level, indicating strong internal consistency within the LPI structure.
The highest correlation was observed between LPI and Competence (COM) (τ = 0.873, p < 0.05), followed closely by Efficiency (EFF) (τ = 0.863) and Timeliness (TR) (τ = 0.858). The lowest, albeit still strong, correlation was with Ease (EASE) (τ = 0.767), suggesting it might reflect slightly different logistical dimensions.
These results confirm that the LPI components are strongly interrelated and collectively measure a cohesive latent construct, justifying the use of their aggregate score in regression and FCM modeling.
4.3.2. Correlation analysis among WGI and the six components of WGI
Table 25 displays Kendall’s tau-b correlation coefficients among the six subcomponents of the Worldwide Governance Indicators (WGI) and the WGI as well: Control of Corruption (CC), Government Effectiveness (GE), Political Stability and Absence of Violence (PV), Rule of Law (RL), Regulatory Quality (RQ), and Voice and Accountability (VA), as well as their relationship with the composite WGI index.
All correlations are positive and highly significant (p < 0.05), indicating strong internal consistency. The strongest associations with the overall WGI score were observed for Rule of Law (τ = 0.862), Regulatory Quality (τ = 0.846), and Government Effectiveness (τ = 0.824). The weakest, yet still substantial, was for Political Stability (τ = 0.669).
These findings suggest that while all six dimensions contribute meaningfully to the overall governance indicator, particular emphasis is placed on institutional effectiveness and rule-based governance. The internal coherence of WGI further justifies its use as a single composite measure in both regression analysis and conceptual modeling frameworks such as FCM.
4.4. Fuzzy cognitive map (FCM) construction
A Fuzzy Cognitive Map was developed to visualize the directional relationships among the variables examined in this study. The structure of the map is based on the strength of associations derived from regression models and Kendall’s tau-b correlations, as summarized in Table 26.
The Fuzzy Cognitive Map (FCM) above (Figure 9), represents the systemic relationships among the key variables analyzed in this study, with GDP per capita serving as the model’s main output. The LPI (Logistics Performance Index) acts as a moderator, receiving influence from both its six internal components (EFF, QUAL, EASE, COM, FREQ, TR) and from three higher-level inputs: EPI (Environmental Performance Index), SDG Index, and WGI (Worldwide Governance Indicators). These three indicators also exert direct influence on GDP, independently of LPI. Meanwhile, WGI itself is a composite construct, shaped by six sub-dimensions of governance (CC, GE, PV, RL, RQ, VA).
All causal relationships in the model are positive, and the weights applied to each connection are drawn directly from Table 26, based on standardized beta coefficients and Kendall’s tau-b correlations. Arrows in the diagram indicate the direction of influence, and the numerical weights quantify the strength of each effect. This model can function as a scenario analysis tool, enabling users to adjust input parameters (e.g., governance scores, environmental metrics) and simulate how these changes might influence GDP, both directly and indirectly, through logistics performance.
With the creation of this model—grounded in the statistical analyses conducted in the previous sections—it becomes possible to visually and functionally address both core research questions posed in this study. Specifically, the Fuzzy Cognitive Map (FCM) provides a conceptual response to Research Question 1 (RQ1): “How do ESG-related metrics (EPI, SDG, WGI) relate to logistics performance (LPI)?” and Research Question 2 (RQ2): “To what extent do logistics and ESG indicators jointly explain a country’s GDP per capita?” The FCM does not merely summarize statistical associations; it reflects an integrated system of influence where structural variables interact dynamically to shape development outcomes. It reveals pathways, interdependencies, and mediating effects that may not be evident through linear models alone. As such, the map serves both as an analytical synthesis and as a communication tool to understand and illustrate the systemic nature of development processes.
4.5. Fuzzy Cognitive Map (FCM) Scenarios
4.5.1. FCM (A) Scenario
In Scenario A, as presented in Figure 10, the fuzzy cognitive map model was simulated by applying targeted activations to four key components: Environmental Performance Index (EPI) and Logistics Infrastructure Quality (QUAL) were fully activated (+1), Rule of Law (WGI-RL) was also set to maximum activation (+1), and the Sustainable Development Goals Index (SDG) received a moderate activation (+0.5). The resulting system response showed a significant increase in the governance output node (WGI +0.03), followed by measurable gains in GDP per capita (+0.02) and the Logistics Performance Index (LPI) (+0.01). These results suggest that combined improvements in institutional quality, infrastructure, and sustainability performance can produce complementary effects on both economic output and logistics efficiency.
4.5.2. FCM (B) Scenario
In this FCM simulation, as presented in Figure 11, four key variables were actively modified: the Environmental Performance Index (EPI), the Sustainable Development Goals Index (SDG), the Regulatory Quality (WGI-RQ), and the Trade Competitiveness node (COM)—each set at a maximum activation level of +1. This reflects a policy configuration emphasizing sustainability, regulation, and market integration, without intervening in logistics infrastructure or rule-of-law institutions. The results show a notable increase in GDP per capita (+0.05), indicating that coordinated ESG and regulatory efforts can significantly stimulate economic outcomes. The governance composite (WGI) also improves (+0.03), suggesting that boosting regulatory quality can positively influence broader institutional performance. In contrast, the Logistics Performance Index (LPI) exhibits only a marginal increase (+0.01), underscoring that without physical infrastructure investments, the impact on logistics systems remains limited. These results reinforce the view that ESG and regulatory reforms can be economically effective, but structural transformation in logistics requires complementary infrastructural interventions.
4.5.3. FCM (C) Scenario
The simulation results of Scenario C (Figure 12) reveal a cascade of negative interdependencies initiated by the intentional reduction of core development variables. In this worst-case scenario, the input values for Environmental Performance Index (EPI), Sustainable Development Goals Index (SDG), Transparency (TR), and Government Effectiveness (WGI-GE) were each reduced by 0.5, reflecting systemic degradation in environmental governance and institutional integrity. Additionally, logistics performance (LPI) declined by -0.14, governance quality (WGI) by -0.09, and GDP per capita by -0.11. These reductions triggered secondary effects across the system, weakening interconnected components such as competitiveness (COM), regulatory quality, and infrastructure efficiency. The results illustrate how deteriorating conditions in sustainability and governance rapidly propagate through the development framework, undermining both economic output and structural resilience. Scenario C thus emphasizes the critical role of multi-domain coherence and demonstrates how institutional and environmental regression can jointly erode long-term growth potential.
5. Discussion
The initial set of regression analyses confirmed that the Logistics Performance Index (LPI) is not an isolated technical indicator but rather the outcome of deeper structural conditions. Governance quality, as captured by the Worldwide Governance Indicators (WGI), emerged as the most potent predictor of logistics efficiency (β = 0.823), followed closely by sustainable development (SDG) and environmental performance (EPI). This corroborates previous scholarly assertions that logistics systems are embedded in broader institutional and normative architectures (Uyar et al., 2021; Shepherd & Sriklay, 2023). Countries exhibiting higher degrees of regulatory quality, legal predictability, and public accountability consistently display superior logistics performance, thus validating the hypothesis that governance operates as a catalytic enabler.
Environmental and developmental dimensions also demonstrated statistically significant positive associations with LPI. These findings reflect a paradigmatic shift in the logistics-development nexus. The positive effect of EPI on LPI, (β = 0.684), aligns with studies emphasizing the role of eco-efficiency and clean infrastructure in trade facilitation [9]. Similarly, the SDG Index—reflecting multidimensional national progress—proved to be a strong determinant of logistics competence (β = 0.686), resonating with empirical insights that link inclusive development to infrastructural coherence [14,15]. Collectively, these results reinforce the view that logistics capacity is co-determined by environmental stewardship and social inclusivity.
However, the current study’s results diverge from more critical findings in Wan et al. [7] and Magazzino et al. [10], who documented that LPI improvements may exacerbate CO2 emissions in the absence of complementary environmental policy. In contrast, this study suggests that countries with stronger environmental performance tend to also enjoy better logistics outcomes—likely reflecting an underlying policy orientation that integrates sustainability into logistics design.
In the multivariate analysis, the fourth regression model (Model 4) assessed the combined effects of LPI, EPI, SDG, and WGI on economic output, as measured by GDP per capita. The model achieved a high explanatory power (R2 = 0.817), indicating that these four systemic factors jointly account for over 80% of the cross-national variance in GDP. All predictors were statistically significant at p < 0.05, with WGI again exerting the strongest influence (β = 0.355), followed by LPI (β = 0.220), SDG (β = 0.215), and EPI (β = 0.207). This finding affirms the systemic role of institutional coherence in shaping national prosperity [39]. Moreover, the inclusion of logistics performance in the model revealed its substantive contribution to economic output, in accordance with earlier studies underscoring logistics as a cornerstone of productive capacity and international competitiveness [23,30]. Notably, the model substantiates the conceptual proposition that sustainability, governance, and logistics are not peripheral to growth, but integral levers of structural development.
The contributions of SDG and EPI to GDP further support a growing consensus in the literature that sustainable development and environmental responsibility are not antithetical to growth. Studies by Naz et al. [35] and Mavragani et al. [32] showed that countries with stronger performance on SDGs and EPI often experience more inclusive and resilient economic growth, especially when supported by institutional coherence. This study empirically reinforces these conclusions, demonstrating that both SDG progress and environmental performance contribute positively to GDP when considered alongside logistics and governance indicators
The simulation-based exploration through Fuzzy Cognitive Mapping (FCM) further substantiated the regression findings while offering dynamic insights into systemic interactions. Scenario A, centered on environmental and legal improvements, produced moderate but consistent increases in both LPI and GDP. This outcome resonates with the literature emphasizing the enabling function of environmental governance in long-term infrastructural planning and trade efficiency [31,36]. Scenario B, emphasizing regulatory quality and logistics service competence, generated more immediate economic gains—supporting the proposition that institutional consolidation and technical proficiency exert direct developmental effects [50,51].
The comparative reading of both scenarios (A and B) illuminates two complementary development pathways: one anchored in sustainability and rule of law, the other in administrative capacity and operational readiness. The convergence of results across both the econometric and cognitive models strengthens the central argument of this study: development is not the linear product of singular variables but emerges through the coalescence of multiple, interacting vectors—governance, sustainability, and logistics—operating within a complex systemic architecture.
Moreover, Scenario C offers a critical lens into the vulnerabilities of development systems when multiple structural dimensions regress simultaneously. The observed declines in GDP, logistics capacity, and governance indicators underscore how tightly interwoven these domains are—and how negative shifts in one area can amplify deterioration in others. The artificial reduction of EPI, SDG, TR, and WGI-GE by 0.5 simulates real-world conditions such as institutional backsliding, environmental neglect, and erosion of public trust, all of which are increasingly present in fragile or crisis-prone states. The findings suggest that once a threshold of systemic degradation is crossed, feedback mechanisms may accelerate decline, making recovery increasingly difficult without targeted, multi-sectoral intervention. This scenario therefore functions as a warning: resilience cannot be achieved through isolated improvements, but only through coordinated progress across governance, sustainability, and infrastructure domains.
The three simulation scenarios—A (baseline), B (optimistic), and C (regressive)—effectively reflect plausible development paths observed globally. Scenario A typifies the “steady-state” trajectory seen in many middle-income countries that sustain gradual improvements in governance, infrastructure, and sustainability without major disruptions [56]. Scenario B resembles the progress of advanced economies that have strategically invested in green logistics, institutional reform, and technological innovation, resulting in enhanced competitiveness and resilience [57]. In stark contrast, Scenario C mirrors conditions in fragile and conflict-affected states—documented by both the OECD [58] and the Overseas Development Institute [59]—where simultaneous breakdowns in logistics, governance, and environmental stewardship interactively degrade economic performance. By situating these scenarios within empirically validated typologies, FCM-based simulations serve as a robust analytical tool to explore how integrated policy interventions—or their failure—can influence long-term development under uncertainty.
The findings of this study resonate strongly with the institutional theory of economic development advanced by Daron Acemoglu, recipient of the 2023 Nobel Prize in Economic Sciences. In his recent work Power and Progress [60], he argues that technological or economic advancement does not automatically lead to shared prosperity; rather, it is the quality of institutions—particularly those that constrain power and enable broad-based participation—that determines whether growth becomes inclusive. This insight aligns with our results, which show that governance quality, institutional transparency, and public effectiveness are among the most influential variables affecting GDP per capita and development resilience in the simulation model. Scenario C, which simulates institutional erosion, directly illustrates the risks Acemoglu warns about: when institutions falter, even high logistics capacity or sustainability frameworks are insufficient to maintain prosperity. Conversely, Scenarios A and B reflect Acemoglu’s thesis that inclusive, accountable institutions are preconditions for equitable growth, especially under conditions of systemic complexity.
In summary, the discussion reveals that logistics performance cannot be divorced from the environmental, developmental, and institutional milieu in which it operates. By situating LPI within an expanded analytic constellation that includes ESG metrics, this study provides an integrative perspective on how national capacities are constructed and sustained. The findings underscore the need for policy paradigms that transcend technocratic efficiency and embrace a holistic, interdependent view of development in an era of global transition.
6. Conclusions
This study set out to elucidate the structural interdependencies among logistics performance, ESG indicators, and macroeconomic development, with the aim of constructing an integrated empirical framework for assessing national developmental capacity. In particular, the research investigated (a) the extent to which environmental sustainability, sustainable development progress, and institutional governance (EPI, SDG, WGI) are systematically associated with logistics performance (LPI), and (b) how these variables collectively explain variation in GDP per capita.
The statistical findings reveal consistently strong and statistically significant associations between the variables under investigation. All three ESG indicators exhibited a positive and significant effect on logistics performance, with governance quality (WGI) emerging as the most influential predictor. Furthermore, in the multivariate regression model, logistics performance (LPI), governance (WGI), environmental sustainability (EPI), and sustainable development (SDG) jointly explained over 80% of the variance in GDP per capita (R2 = 0.817). Each variable was individually significant (p < 0.05), confirming their combined contribution to national economic output. These results provide a clear empirical response to the study’s research questions: first, ESG indicators are robust and complementary predictors of logistics capacity; and second, logistics performance and ESG factors together exert substantial influence on economic development.
Beyond the strength of these statistical associations, the study contributes to the literature through its methodological and conceptual synthesis. To the best of our knowledge, this is among the first empirical efforts to integrate ESG metrics and logistics performance into a unified econometric and simulation-based framework for understanding economic growth, thus offering a novel conceptual and methodological contribution to the field of development studies. The combination of linear regression and correlation analysis with Fuzzy Cognitive Mapping (FCM) further enhances the study’s originality, allowing for the exploration of both linear effects and nonlinear systemic interactions. This dual approach advances the discourse on structural development by revealing the embeddedness of logistics systems within broader sustainability and governance regimes.
The findings of this study underscore that logistics performance, institutional quality, and sustainability indicators act as co-determinants of economic development rather than independent variables. The FCM-based simulations demonstrate that integrated improvements across these domains (as in Scenario B) generate clear gains in GDP per capita, whereas simultaneous regressions (Scenario C) create systemic vulnerabilities and output losses. These results resonate with recent empirical work highlighting that modern growth is increasingly dependent on infrastructure quality, institutional coherence, and environmental balance. As Krugman [61] emphasizes, the long-term productivity of economies hinges not only on capital and labor, but also on the efficiency of networks—both physical and institutional. The scenario framework employed here validates these claims by showing how changes in one area (e.g., logistics or transparency) can cascade throughout the development system. This reinforces the need for multidimensional policy approaches that strengthen the foundations of economic performance in a post-growth global context.
The findings hold significant implications for policy. First, investment in logistics infrastructure should be coupled with parallel reforms in governance and environmental regulation, as these elements function synergistically. Second, national development strategies should abandon siloed interventions and instead adopt holistic models that recognize the systemic nature of development. The scenario-based simulations underscore that both sustainability-driven and governance-driven interventions can enhance logistics performance and GDP outcomes, albeit through different causal pathways. Therefore, development policies must be tailored not only to economic constraints but also to institutional and environmental configurations.
While the study offers a comprehensive and multi-dimensional perspective, it is not without limitations. The reliance on cross-sectional data limits causal inference and captures only a snapshot of national performance. Additionally, the use of normalized and composite indicators, while methodologically justified for comparability, may obscure specific country-level nuances. Nonetheless, these limitations do not invalidate the study’s conclusions. The normalization and transformation procedures were rigorously applied, the statistical models were robustly validated, and the integration of FCM mitigates some of the rigidity inherent in linear modeling. The selected indicators are well-established, widely recognized, and capture structural rather than short-term fluctuations, lending credibility to the analytical framework.
Future research can extend this work in several directions. Longitudinal panel data would allow for dynamic modeling of causal relationships and time-lagged effects. Furthermore, the FCM approach could be enriched by incorporating expert knowledge from policymakers, logistics professionals, and ESG practitioners to enhance the semantic granularity of the model. Finally, comparative regional analyses would help identify context-specific development pathways and refine policy recommendations according to geopolitical and socio-economic characteristics.
In conclusion, this study demonstrates that logistics performance is not an isolated economic function but a structurally interlinked outcome of governance, sustainability, and institutional design. Understanding development through this lens enables a more realistic and actionable conceptualization of national prosperity in the 21st century.
Author Contributions
Conceptualization, P.K., K.T., D.K.N. and D.P.S.; methodology, P.K., K.T., D.K.N. and D.P.S.; software, P.K., K.T., D.K.N. and D.P.S.; validation, P.K., K.T., D.K.N. and D.P.S.; formal analysis, P.K., K.T., D.K.N. and D.P.S.; investigation, P.K., K.T., D.K.N. and D.P.S.; resources, P.K., K.T., D.K.N. and D.P.S.; data curation, P.K., K.T., D.K.N. and D.P.S.; writing—original draft preparation, P.K., K.T., D.K.N. and D.P.S.; writing—review and editing, P.K., K.T., D.K.N. and D.P.S.; visualization, P.K., K.T., D.K.N. and D.P.S.; supervision, D.P.S.; project administration, D.P.S.; funding acquisition, D.P.S. All authors have read and agreed to the published version of the manuscript.
Funding
This research received no external funding.
Institutional Review Board Statement
Not applicable.
Informed Consent Statement
Not applicable.
Data Availability Statement
The following supporting information (data and analyses) can be downloaded at: KAROUNTZOS, PANAGIOTIS (2025), “Redefining Development through Logistics performance and ESG metrics “, Mendeley Data, V1, [62]. doi: 10.17632/8vc6dwwpc9.1.
Conflicts of Interest
The authors declare no conflicts of interest.
Abbreviations
The following abbreviations are used in this manuscript:
| LPI | Logistics Performance Index |
| EPI | Environmental Performance Index |
| SDG | Sustainable Development Goals Index |
| WGI | Worldwide Governance Indicators |
| GDP | Gross Domestic Product |
| PCA | Principal Component Analysis |
| FCM | Fuzzy Cognitive Map |
References
- Rodrigue, J.-P. The Geography of Transport Systems, 5th ed.; Routledge: New York, NY, USA, 2020.
- Arvis, J.F.; Ojala, L.; Wiederer, C.; Shepherd, B.; Raj, A.; Dairabayeva, K.; Kiiski, T. Connecting to Compete 2018: Trade Logistics in the Global Economy—The Logistics Performance Index and Its Indicators, No. 128355; World Bank: Washington, DC, USA, 2018.
- Block, S.; Emerson, J.W.; Esty, D.C.; de Sherbinin, A.; Wendling, Z.A.; Kurczynski, K.; Lin, F. Environmental Performance Index; Yale Center for Environmental Law & Policy: New Haven, CT, USA, 2024. Available online: https://epi.yale.edu (accessed on 8 July 2025).
- Sachs, J.D.; Lafortune, G.; Fuller, G. The SDGs and the UN Summit of the Future. Sustainable Development Report 2024; SDSN: Paris, France; Dublin University Press: Dublin, Ireland, 2024. [CrossRef]
- World Bank. Worldwide Governance Indicators, 2024 Update; World Bank: Washington, DC, USA, 2024. Available online: https://www.worldbank.org/en/publication/worldwide-governance-indicators (accessed on 8 July 2025).
- World Bank. GDP per capita (current US$); World Bank: Washington, DC, USA, 2024. Available online: https://data.worldbank.org/indicator/NY.GDP.PCAP.CD (accessed on 8 July 2025).
- Wan, B.; Wan, W.; Hanif, N.; Ahmed, Z. Logistics performance and environmental sustainability: Do green innovation, renewable energy, and economic globalization matter? Front. Environ. Sci. 2022, 10, 996341. [CrossRef]
- Salem, M.A.; Alshawtari, F.A.; Shatila, A. Sustainable development in GCC: Do logistics indicators matter? J. Law Sustain. Dev. 2023, 11(10), e683. [CrossRef]
- Abdul Mumin, M.; Yakubu, I.N.; Adam, I.O. The synthesis of logistics performance and technological innovation on environmental quality. Technol. Sustain. 2025, 4(1), 114–129. Available online: https://www.emerald.com/insight/2754-1312.html (accessed on 8 July 2025).
- Magazzino, C.; Alola, A.A.; Schneider, N. The trilemma of innovation, logistics performance, and environmental quality in 25 topmost logistics countries: A quantile regression evidence. J. Clean. Prod. 2021, 322, 129050. [CrossRef]
- Suki, N.M.; Suki, N.M.; Sharif, A.; Afshan, S. The role of logistics performance for sustainable development in top Asian countries: Evidence from advance panel estimations. Sustain. Dev. 2021, 29(4), 595–606. [CrossRef]
- Khan, S.A.R.; Zhang, Y.; Kumar, A.; Zavadskas, E.; Streimikiene, D. Measuring the impact of renewable energy, public health expenditure, logistics, and environmental performance on sustainable economic growth. Sustain. Dev. 2020, 28(4), 833–843. [CrossRef]
- Barakat, M.; Gerged, A.M. Does logistics performance foster sustainable development? A moderated mediation effect. Int. J. Soc. Econ. 2025. [CrossRef]
- Vilalta-Perdomo, E.; Michel-Villarreal, R.; Thierry-Aguilera, R.; Krejci, C.; Rainer, J.; Burgos, D. The impact of logistics performance on the achievement of the UN Sustainable Development Goal 2: Zero hunger. Center for Open Science 2023, pp. 1–24. Available online: https://osf.io (accessed on 8 July 2025).
- Shamout, M.D. Towards a cleaner and sustainable Europe and Central Asia: An investigation of the logistics–environment nexus. Sustain. Dev. 2024, 32(6), 6629–6642. [CrossRef]
- Larson, P.D. Relationships between logistics performance and aspects of sustainability: A cross-country analysis. Sustainability 2021, 13(2), 623. [CrossRef]
- Rashidi, K.; Cullinane, K. Evaluating the sustainability of national logistics performance using Data Envelopment Analysis. Transp. Policy 2019, 74, 35–46. [CrossRef]
- Uyar, A.; Fernandes, V.; Kuzey, C. The mediating role of corporate governance between public governance and logistics performance: International evidence. Transp. Policy 2021, 109, 37–47. [CrossRef]
- Koh, B.H.; Wong, W.P.; Tang, C.F.; Lim, M.K. The double-edge resource-based view of logistics performance and governance in Asian countries. Asia Pac. J. Mark. Logist. 2018, 30(3), 652–668. [CrossRef]
- Visbal-Cadavid, D.; Delahoz-Domínguez, E.; Mendoza-Mendoza, A. A multiple factor analysis and hierarchical clustering of global logistics governance and development. Decis. Anal. J. 2025, 100579. [CrossRef]
- Karaman, A.S.; Kilic, M.; Uyar, A. Green logistics performance and sustainability reporting practices of the logistics sector: The moderating effect of corporate governance. J. Clean. Prod. 2020, 258, 120718. [CrossRef]
- Shepherd, B.; Sriklay, T. Extending and understanding: An application of machine learning to the World Bank’s logistics performance index. Int. J. Phys. Distrib. Logist. Manag. 2023, 53(9), 985–1014. [CrossRef]
- Coto-Millan, P.; Paz Saavedra, D.; de la Fuente, M.; Fernandez, X.L. Integrating logistics into global production: A new approach. Logistics 2024, 8(4), 99. [CrossRef]
- Celebi, U. The impact of logistics performance index upon Gross Domestic Product: Mediating roles of foreign direct investment and patents. J. Glob. Strateg. Manag. 2021. [CrossRef]
- Karabulut, C.; Civelek, M.E. The mediator role of starting new business in the relationship between logistics performance and growth. J. Int. Trade Logist. Law 2023, 9(1), 143–150. Available online: https://ssrn.com/abstract=4466698 (accessed on 8 July 2025).
- Sabir, M.; Akram, M.; Mian, R.U. Transport, logistics, and economic growth nexus: A cross-country analysis. Transp. Telecommun. J. 2024, 25(4), 462–472. [CrossRef]
- Kumari, M.; Bharti, N. Trade and logistics performance: Does country size matter? Marit. Econ. Logist. 2021, 23, 401–423. [CrossRef]
- Jayathilaka, R.; Jayawardhana, C.; Embogama, N.; Jayasooriya, S.; Karunarathna, N.; Gamage, T.; Kuruppu, N. Gross domestic product and logistics performance index drive the world trade: A study based on all continents. PLoS ONE 2022, 17(3), e0264474. [CrossRef]
- Saini, M.; Hrusecka, D. Comparative impact of logistics performance index, ease of doing business and logistics cost on economic development: A fuzzy QCA analysis. J. Bus. Econ. Manag. 2021, 22(6), 1577–1592. [CrossRef]
- Widayat, W.; Subiyantoro, H.; Sidik, M. Influence of logistic performance on global competitiveness. In Proceedings of the First Multidiscipline International Conference (MIC 2021), Jakarta, Indonesia, 30 October 2021; European Alliance for Innovation: Ghent, Belgium, 2022, p. 156. [CrossRef]
- Wendling, Z.A.; Jacob, M.; Esty, D.C.; Emerson, J.W. Explaining environmental performance: Insights for progress on sustainability. Environ. Dev. 2022, 44, 100741. [CrossRef]
- Mavragani, A.; Nikolaou, I.E.; Tsagarakis, K.P. Open economy, institutional quality, and environmental performance: A macroeconomic approach. Sustainability 2016, 8(7), 601. [CrossRef]
- Jain, M.; Jain, T.; Jain, P. Revisiting the nexus between economic growth and environment health: An empirical study on 180 nations. Preprint at Res. Sq. 2023. [CrossRef]
- Ullah, S.; Ali, M.; Batool, A.; Ali, F. The governance-growth nexus and its environmental implications in South Asia. Pak. J. Humanit. Soc. Sci. 2024, 12(4), 2921–2930. [CrossRef]
- Naz, S.; Ditta, A.; Ramzan, M.; Abbas, M. Governance and sustainable development: The role of environmental performance at the country level. Pak. J. Humanit. Soc. Sci. 2024, 12(4), 2987–2996. [CrossRef]
- San Ong, T.; Soh, W.N.; Tan, C.L.; Teh, B.H.; Ong, T.C. Role of country governance for improved environmental performance. Indones. J. Sustain. Account. Manag. 2022, 6(2), 278–290. [CrossRef]
- de Miranda, R.L.; Lange, A.A.; Kroenke, A.; dos Santos Parisotto, I.R. The influence of the governance and innovation indexes on the environmental performance of countries. Indep. J. Manag. Prod. 2021, 12(5), 1301–1317. [CrossRef]
- Handoyo, S. The role of public governance in environmental sustainability. J. Ilm. Peuradeun 2018, 6(2), 161–178. Available online: http://journal.scadindependent.org/index.php/jipeuradeun/article/view/255 (accessed on 8 July 2025).
- Baciu, L.E. The impact of governance upon sustainable development: Empirical evidence. Stud. Univ. Babeș-Bolyai Oecon. 2023, 68(2), 73–86. [CrossRef]
- Saba, C.S.; Alola, A.A.; Ngepah, N. Exploring the role of governance and institutional indicators in environmental degradation across global regions. Environ. Dev. 2025, 45, 101152. [CrossRef]
- Ellis, J.; Edmonds, D. Coming to terms with the SDGs: A perspective from legal scholarship. Leid. J. Int. Law 2023, 36(2), 251–271. [CrossRef]
- Wooldridge, J.M. Introductory Econometrics: A Modern Approach, 5th ed.; Cengage Learning: Boston, MA, USA, 2015.
- Kendall, M.G. The treatment of ties in ranking problems. Biometrika 1945, 33(3), 239–251. [CrossRef]
- Kosko, B. Fuzzy cognitive maps. Int. J. Man-Mach. Stud. 1986, 24(1), 65–75.
- Glykas, M. Performance measurement scenarios with fuzzy cognitive strategic maps. Int. J. Inf. Manag. 2012, 32(2), 182–195. [CrossRef]
- Aral, S.; Ghosh, R.; Sun, T. The social data science framework. arXiv 2022, arXiv:2201.02297. [CrossRef]
- Glykas, M. (Ed.). Fuzzy Cognitive Maps: Advances in Theory, Methodologies, Tools and Applications; Springer: Berlin, Germany, 2010.
- Papageorgiou, E.I.; Salmeron, J.L. A review of fuzzy cognitive maps research during the last decade. IEEE Trans. Fuzzy Syst. 2013, 21(1), 66–79. [CrossRef]
- Kaufmann, D.; Kraay, A.; Mastruzzi, M. The worldwide governance indicators: Methodology and analytical issues. Hague J. Rule Law 2011, 3(2), 220–246. [CrossRef]
- Francois, J.; Manchin, M. Institutions, infrastructure, and trade. World Dev. 2013, 46, 165–175. [CrossRef]
- Hausman, W.H.; Lee, H.L.; Subramanian, U. The impact of logistics performance on trade. Prod. Oper. Manag. 2013, 22(2), 236–252. [CrossRef]
- Gani, A. The logistics performance effect in international trade. Asian J. Shipp. Logist. 2017, 33(4), 279–288. [CrossRef]
- Inoue, H.; Todo, Y. The propagation of economic impacts through supply chains: The case of a mega-city lockdown to prevent the spread of COVID-19. PLoS ONE 2020, 15(9), e0239251. [CrossRef]
- Kurth, M.; Kozlowski, W.; Ganin, A.; Mersky, A.; Leung, B.; Dykes, J.; Linkov, I. Lack of resilience in transportation networks: Economic implications. Transp. Res. D Transp. Environ. 2020, 86, 102419. Available online: https://arxiv.org/abs/1912.04331 (accessed on 8 July 2025).
- Transparency International. Corruption Perceptions Index 2020. Available online: https://www.transparency.org/en/cpi/2020 (accessed on 8 July 2025).
- OECD. Resource Flows to Fragile and Conflict-Affected States; OECD Publishing: Paris, France, 2020. Available online: https://www.oecd.org/dac/conflict-fragility-resilience/resource-flows-to-fragile-states.html (accessed on 8 July 2025).
- UNCTAD. World Investment Report 2023: Investing in Sustainable Energy for All; United Nations Conference on Trade and Development: Geneva, Switzerland, 2023. Available online: https://unctad.org/publication/world-investment-report-2023 (accessed on 8 July 2025).
- OECD. States of Fragility 2018; OECD Publishing: Paris, France, 2018. [CrossRef]
- ODI—Overseas Development Institute. Economic Development in Fragile Contexts: Learning from Success and Failure; SET Programme: London, UK, 2018. Available online: https://set.odi.org/wp-content/uploads/2018/05/SET-Econ-Development-in-Fragile-States_Final-report.pdf (accessed on 8 July 2025).
- Acemoglu, D.; Johnson, S. Power and Progress: Our Thousand-Year Struggle over Technology and Prosperity; PublicAffairs: New York, NY, USA, 2023.
- Krugman, P. Arguing with Zombies: Economics, Politics, and the Fight for a Better Future; W.W. Norton & Company: New York, NY, USA, 2020.
- Karountzos, P. Redefining Development through Logistics Performance and ESG Metrics. Mendeley Data 2025, V1. [CrossRef]
Figure 1.
Regression line between LPI and EPI. Source: own construction.
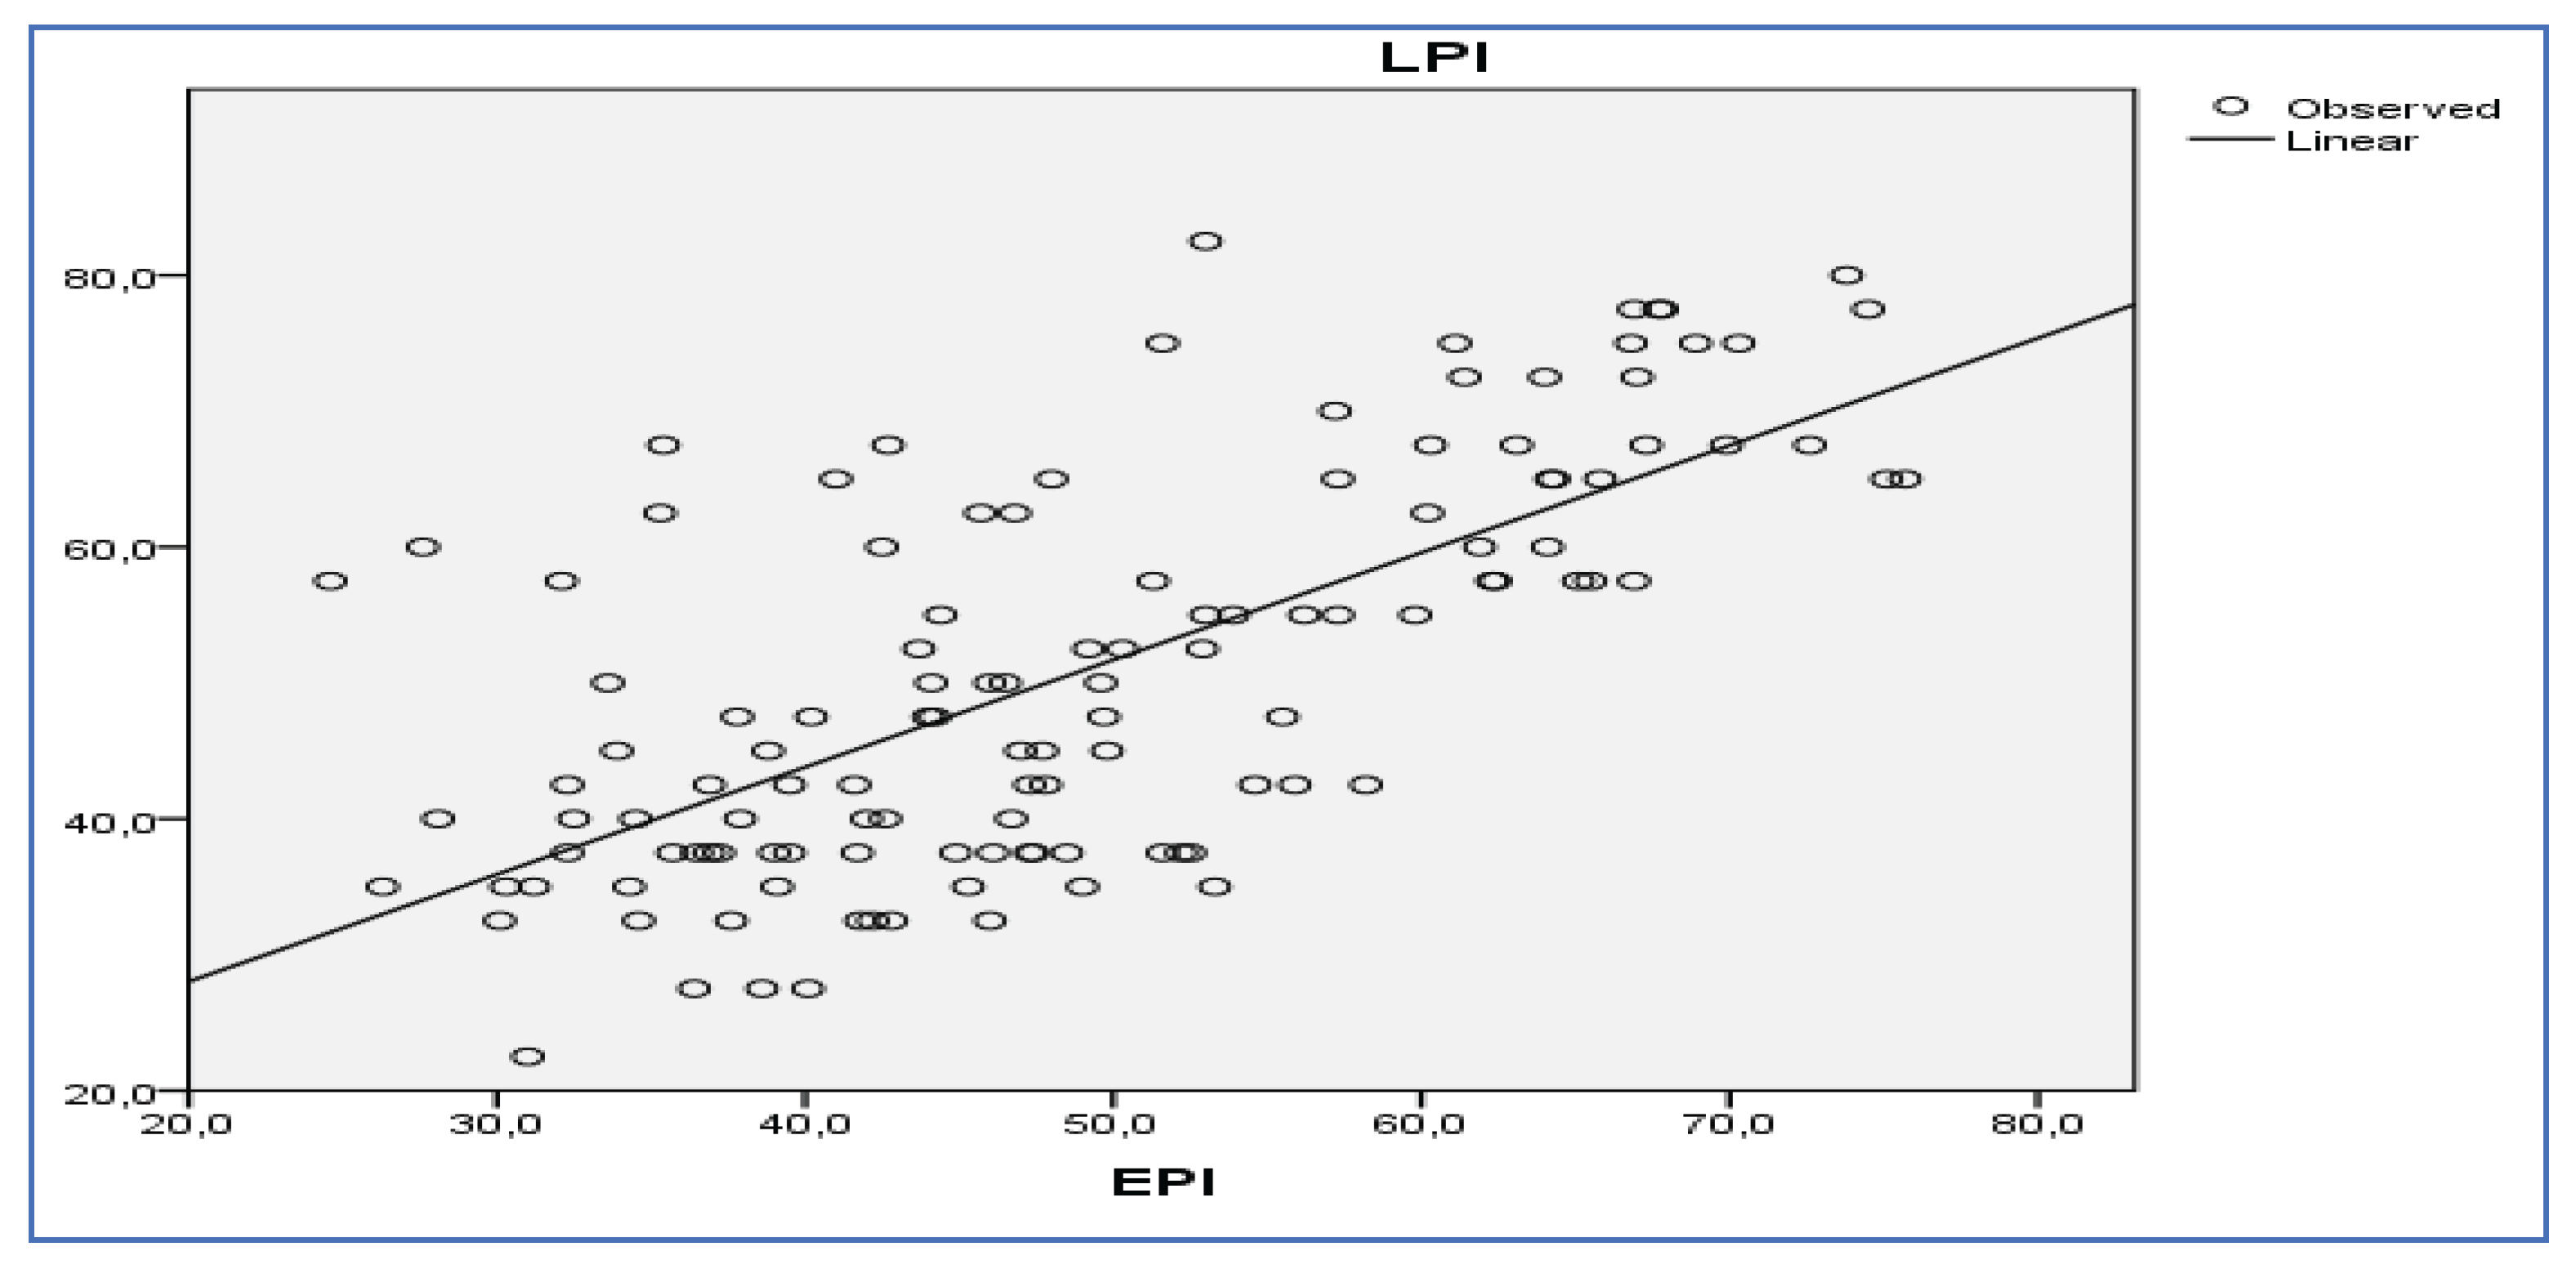
Figure 2.
Regression line between LPI and SDG. Source: own construction.
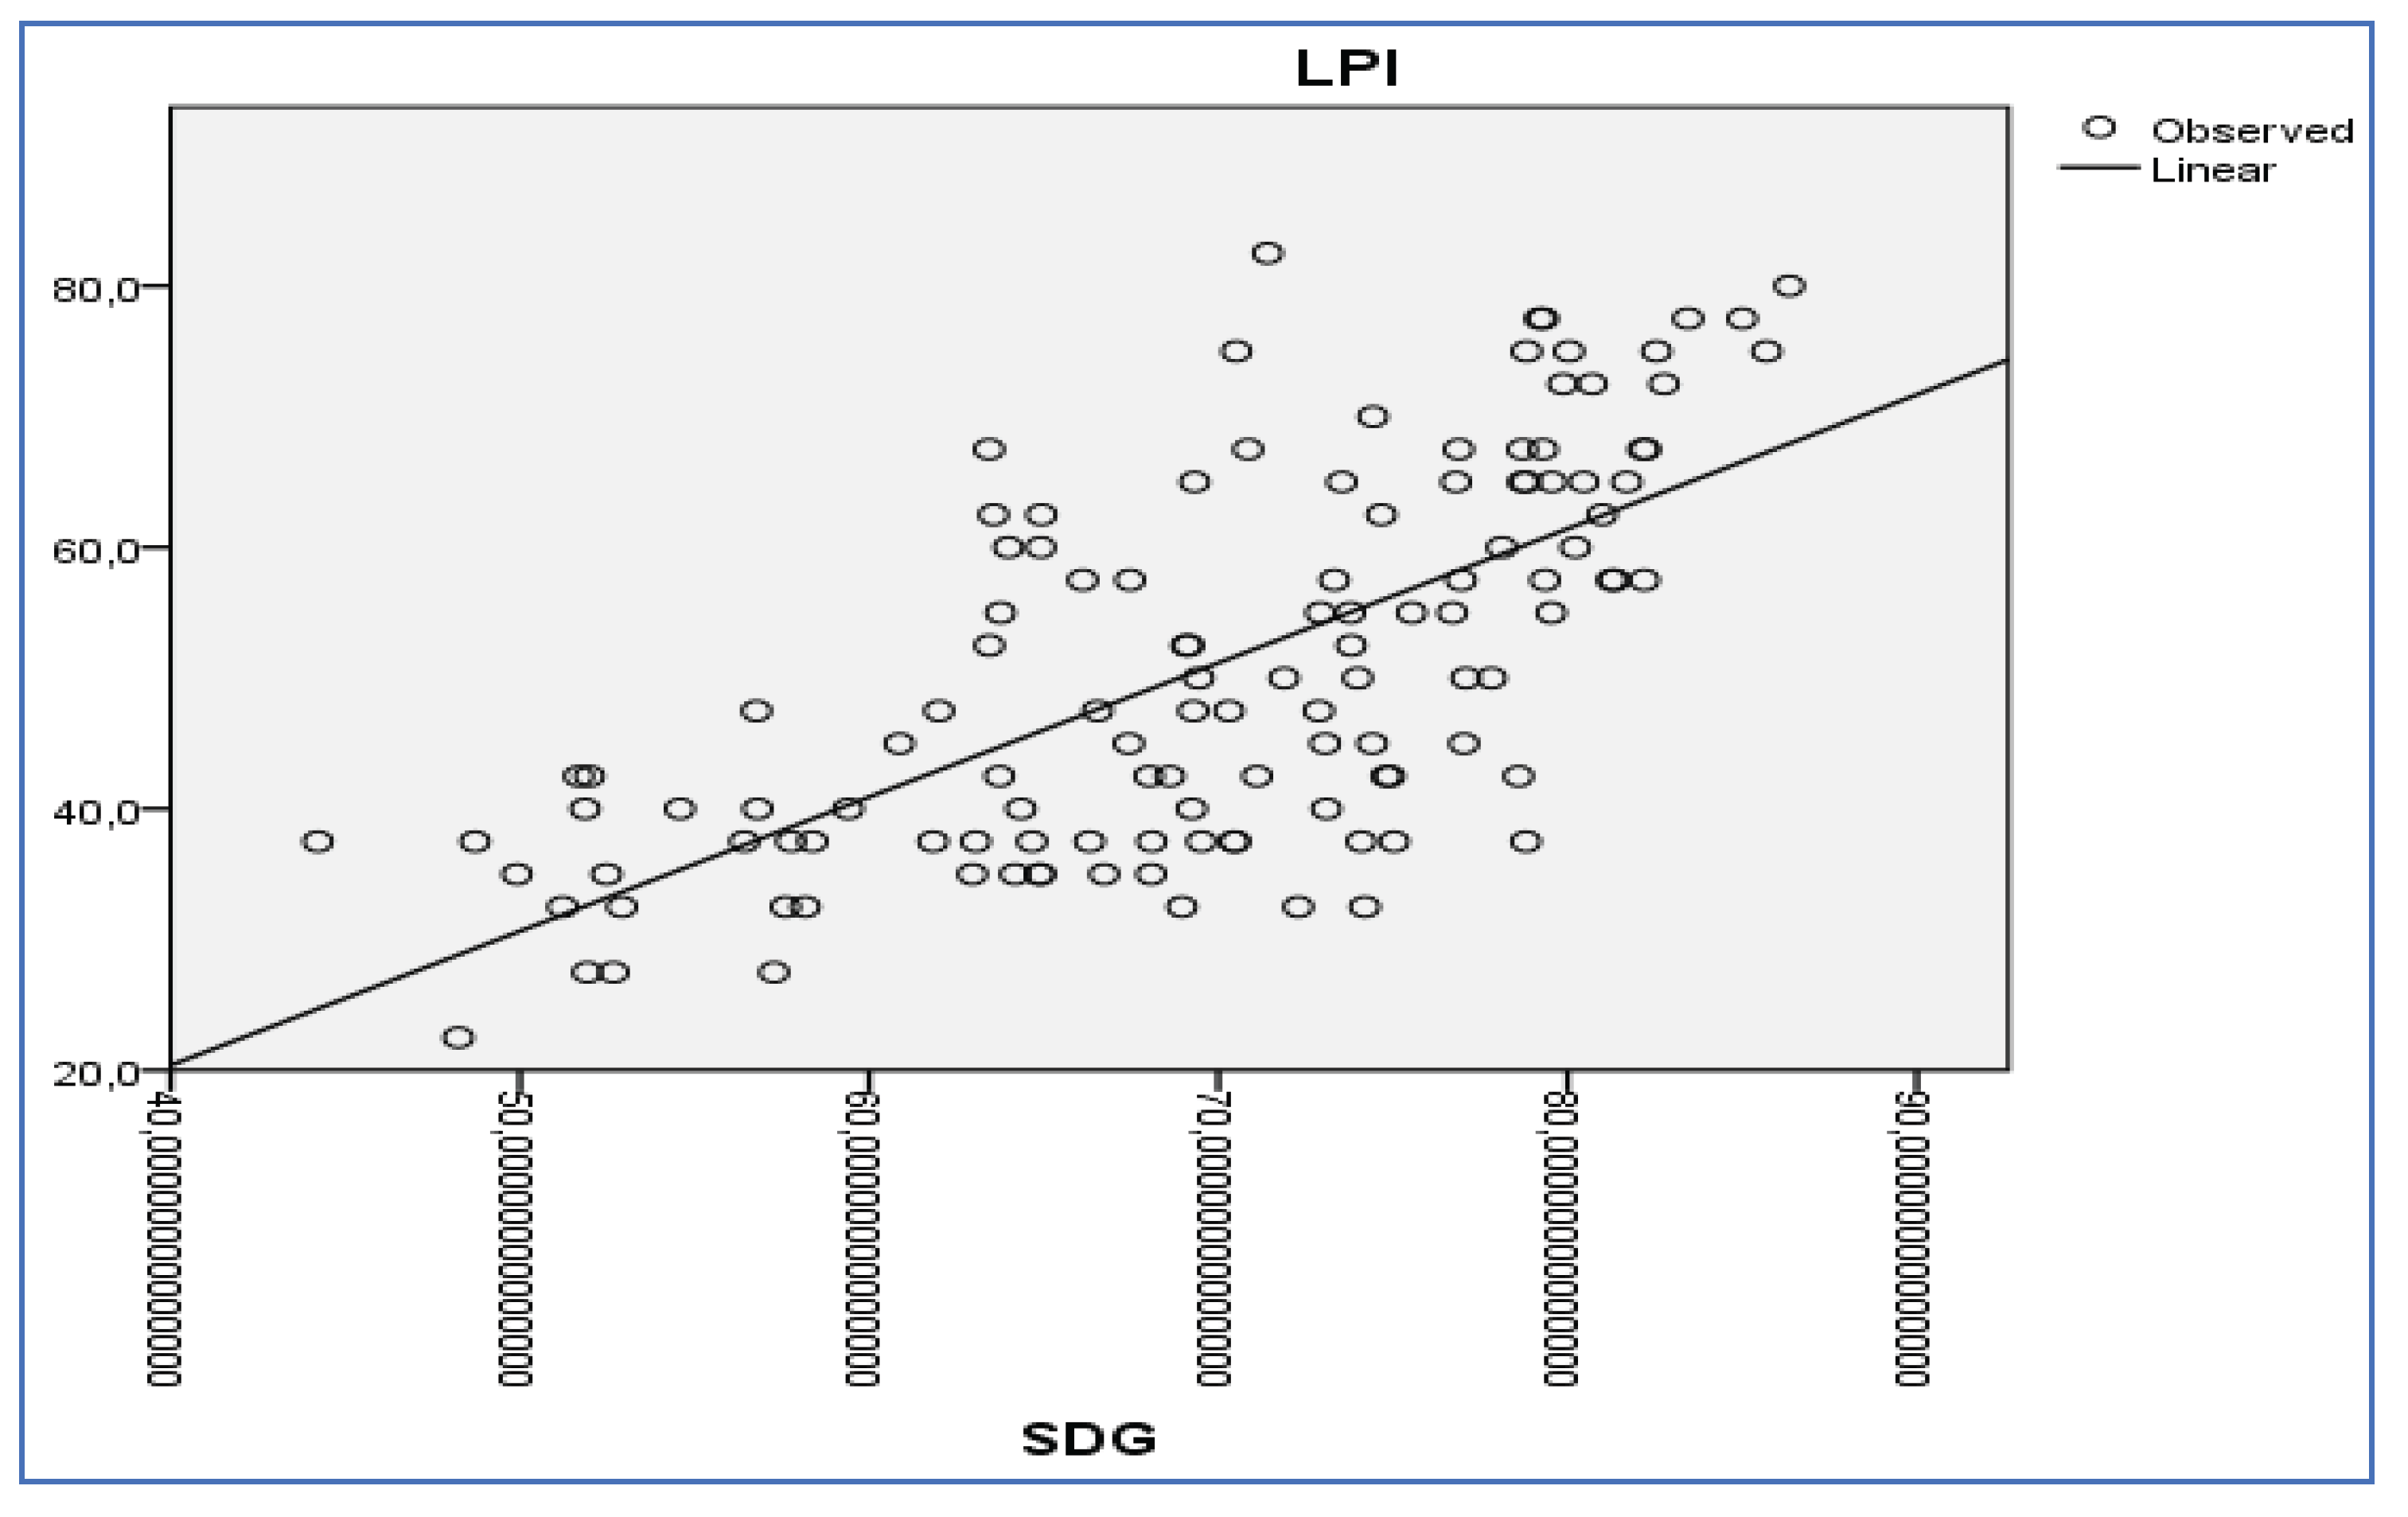
Figure 4.
Regression line between LPI and WGI. Source: own construction.
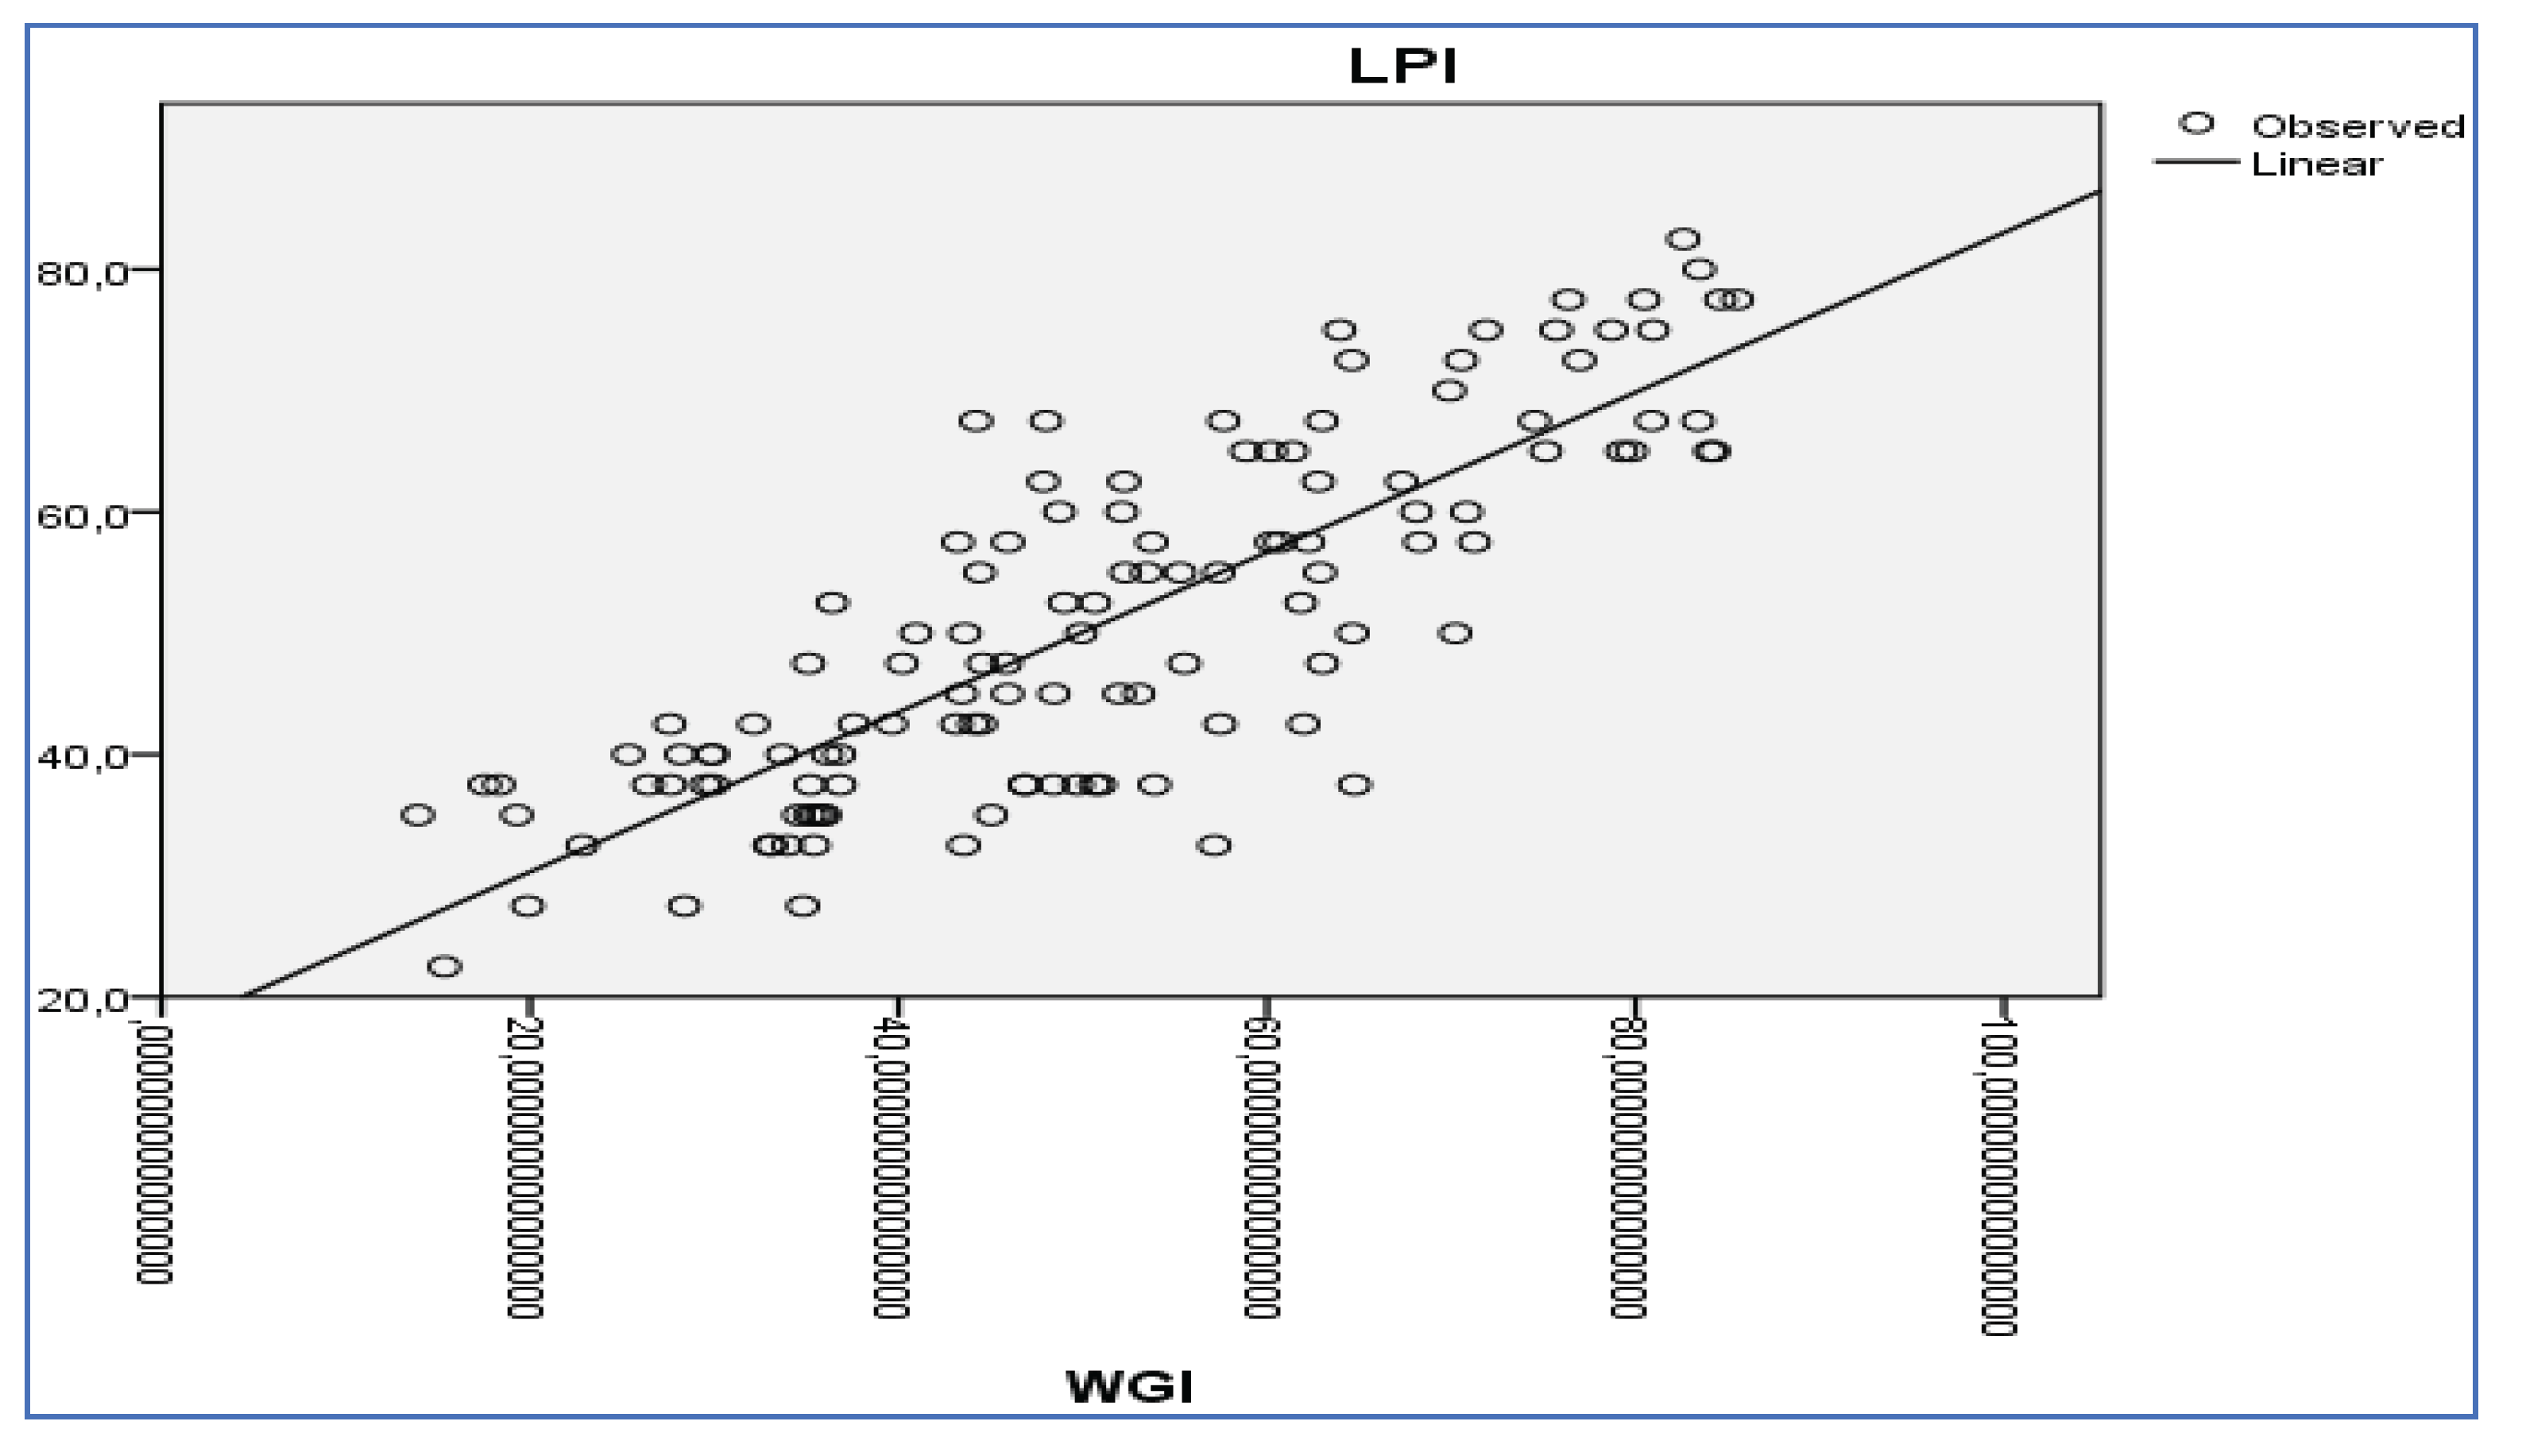
Figure 5.
Relationship between GDP and LPI. Source: own construction.
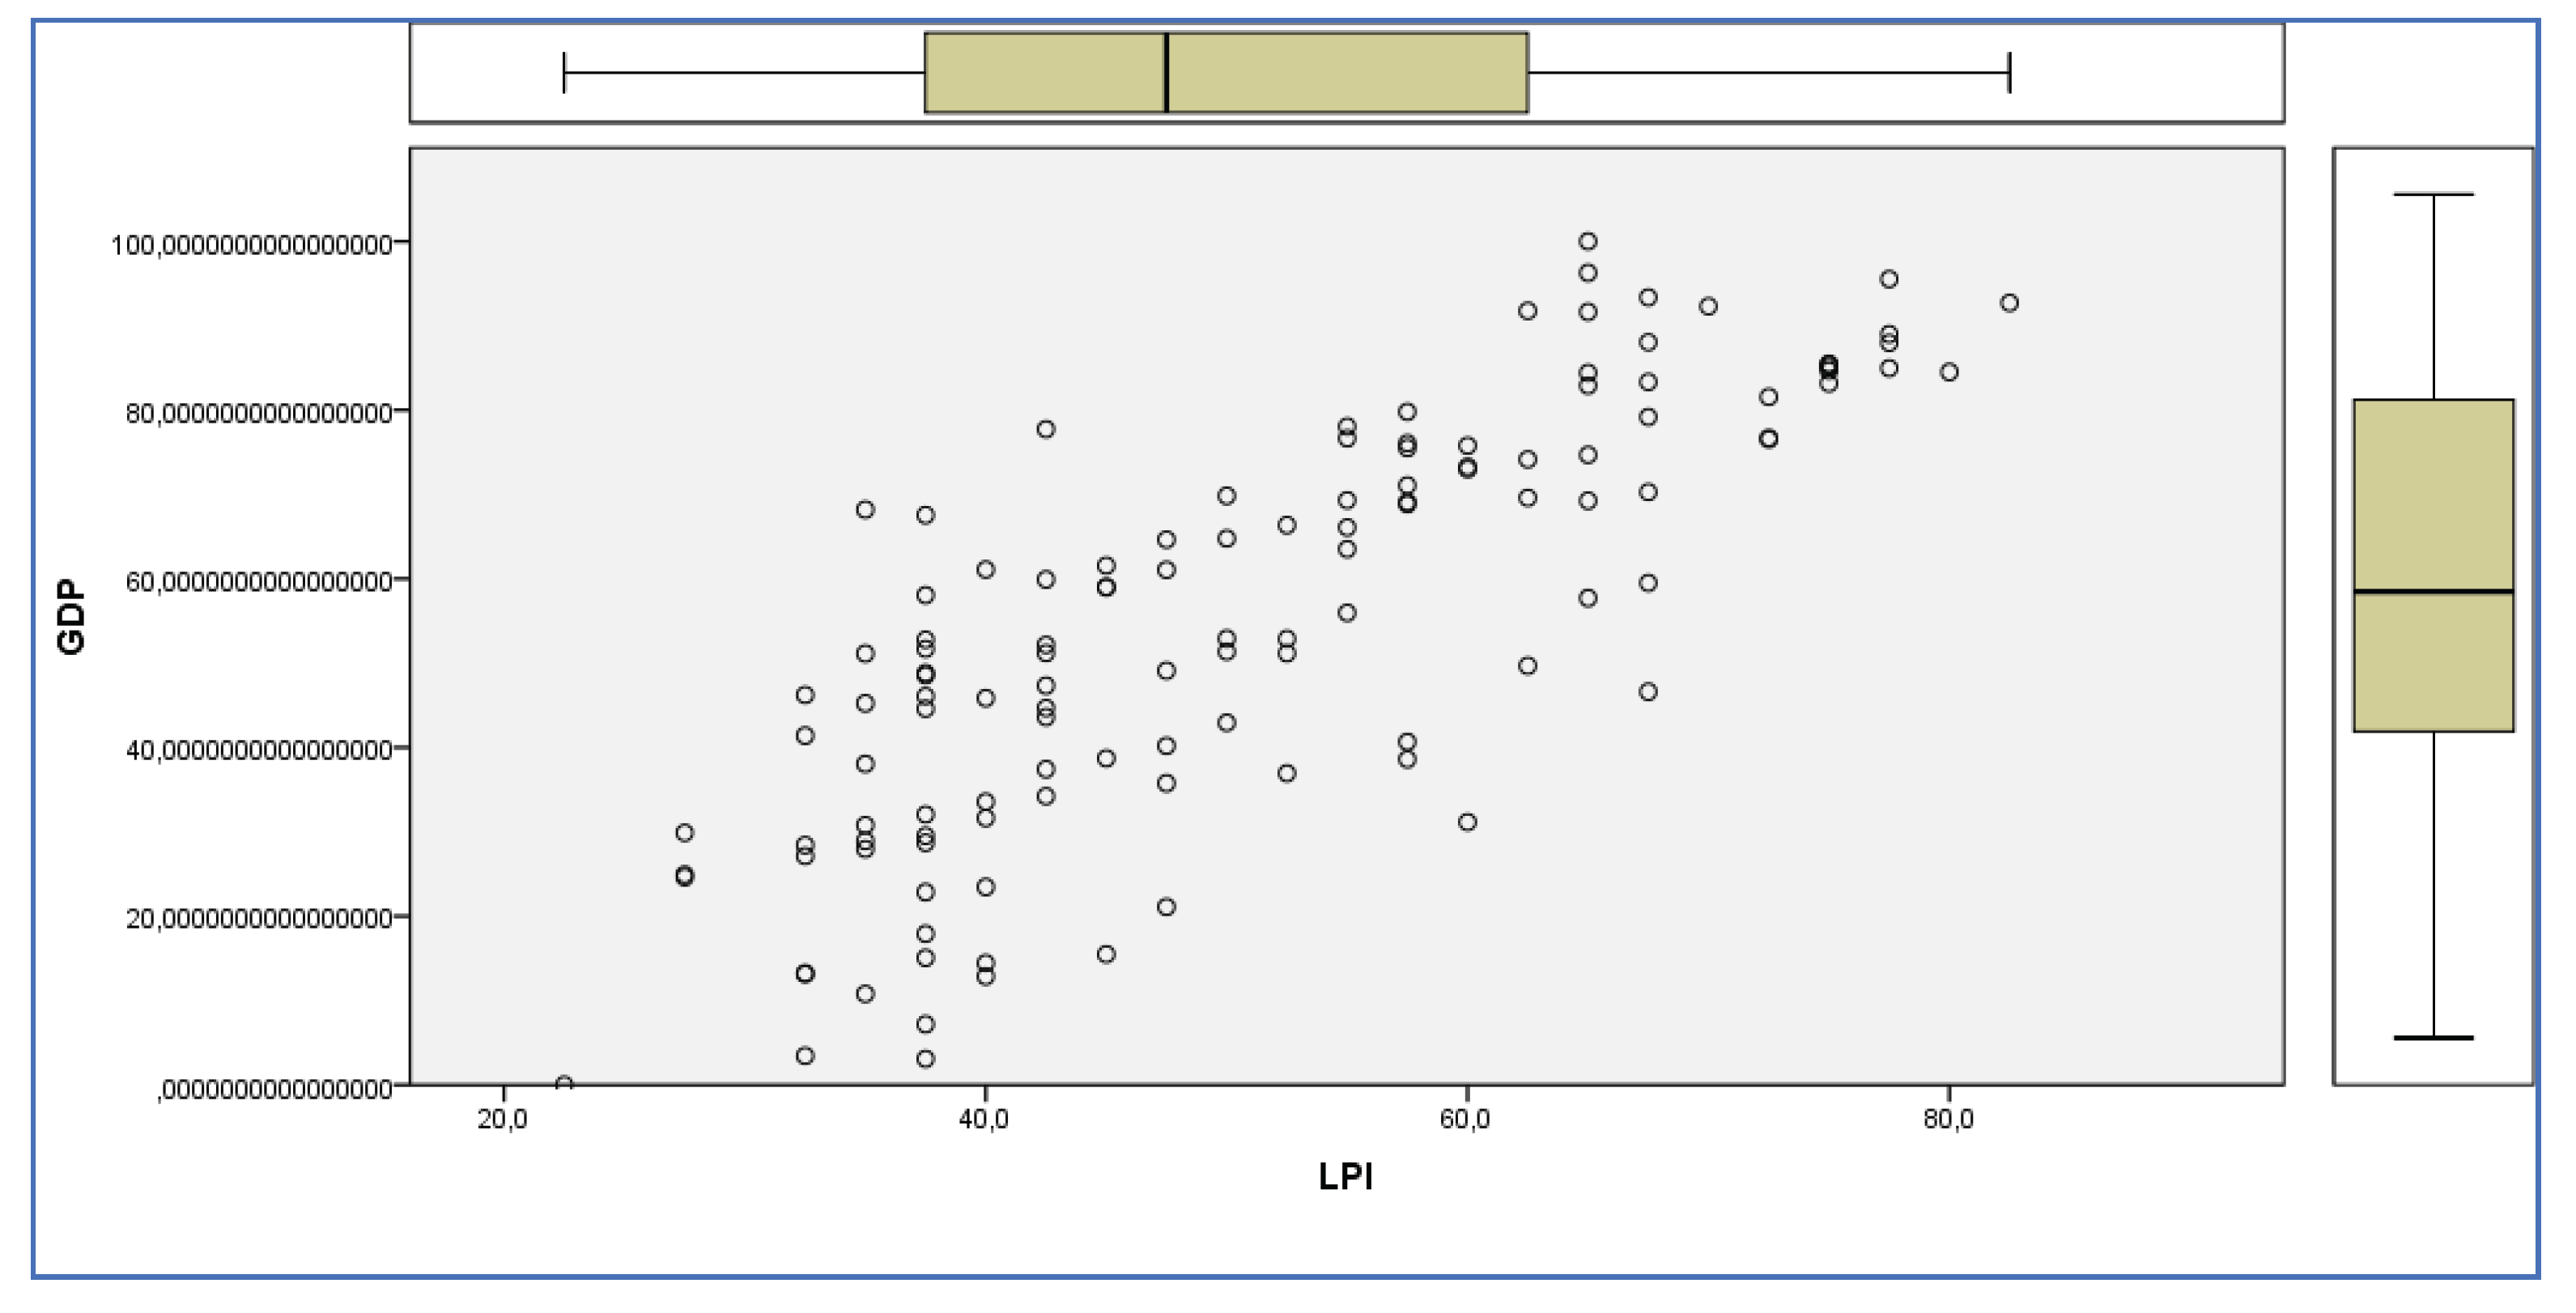
Figure 6.
Relationship between GDP and LPI. Source: own construction.
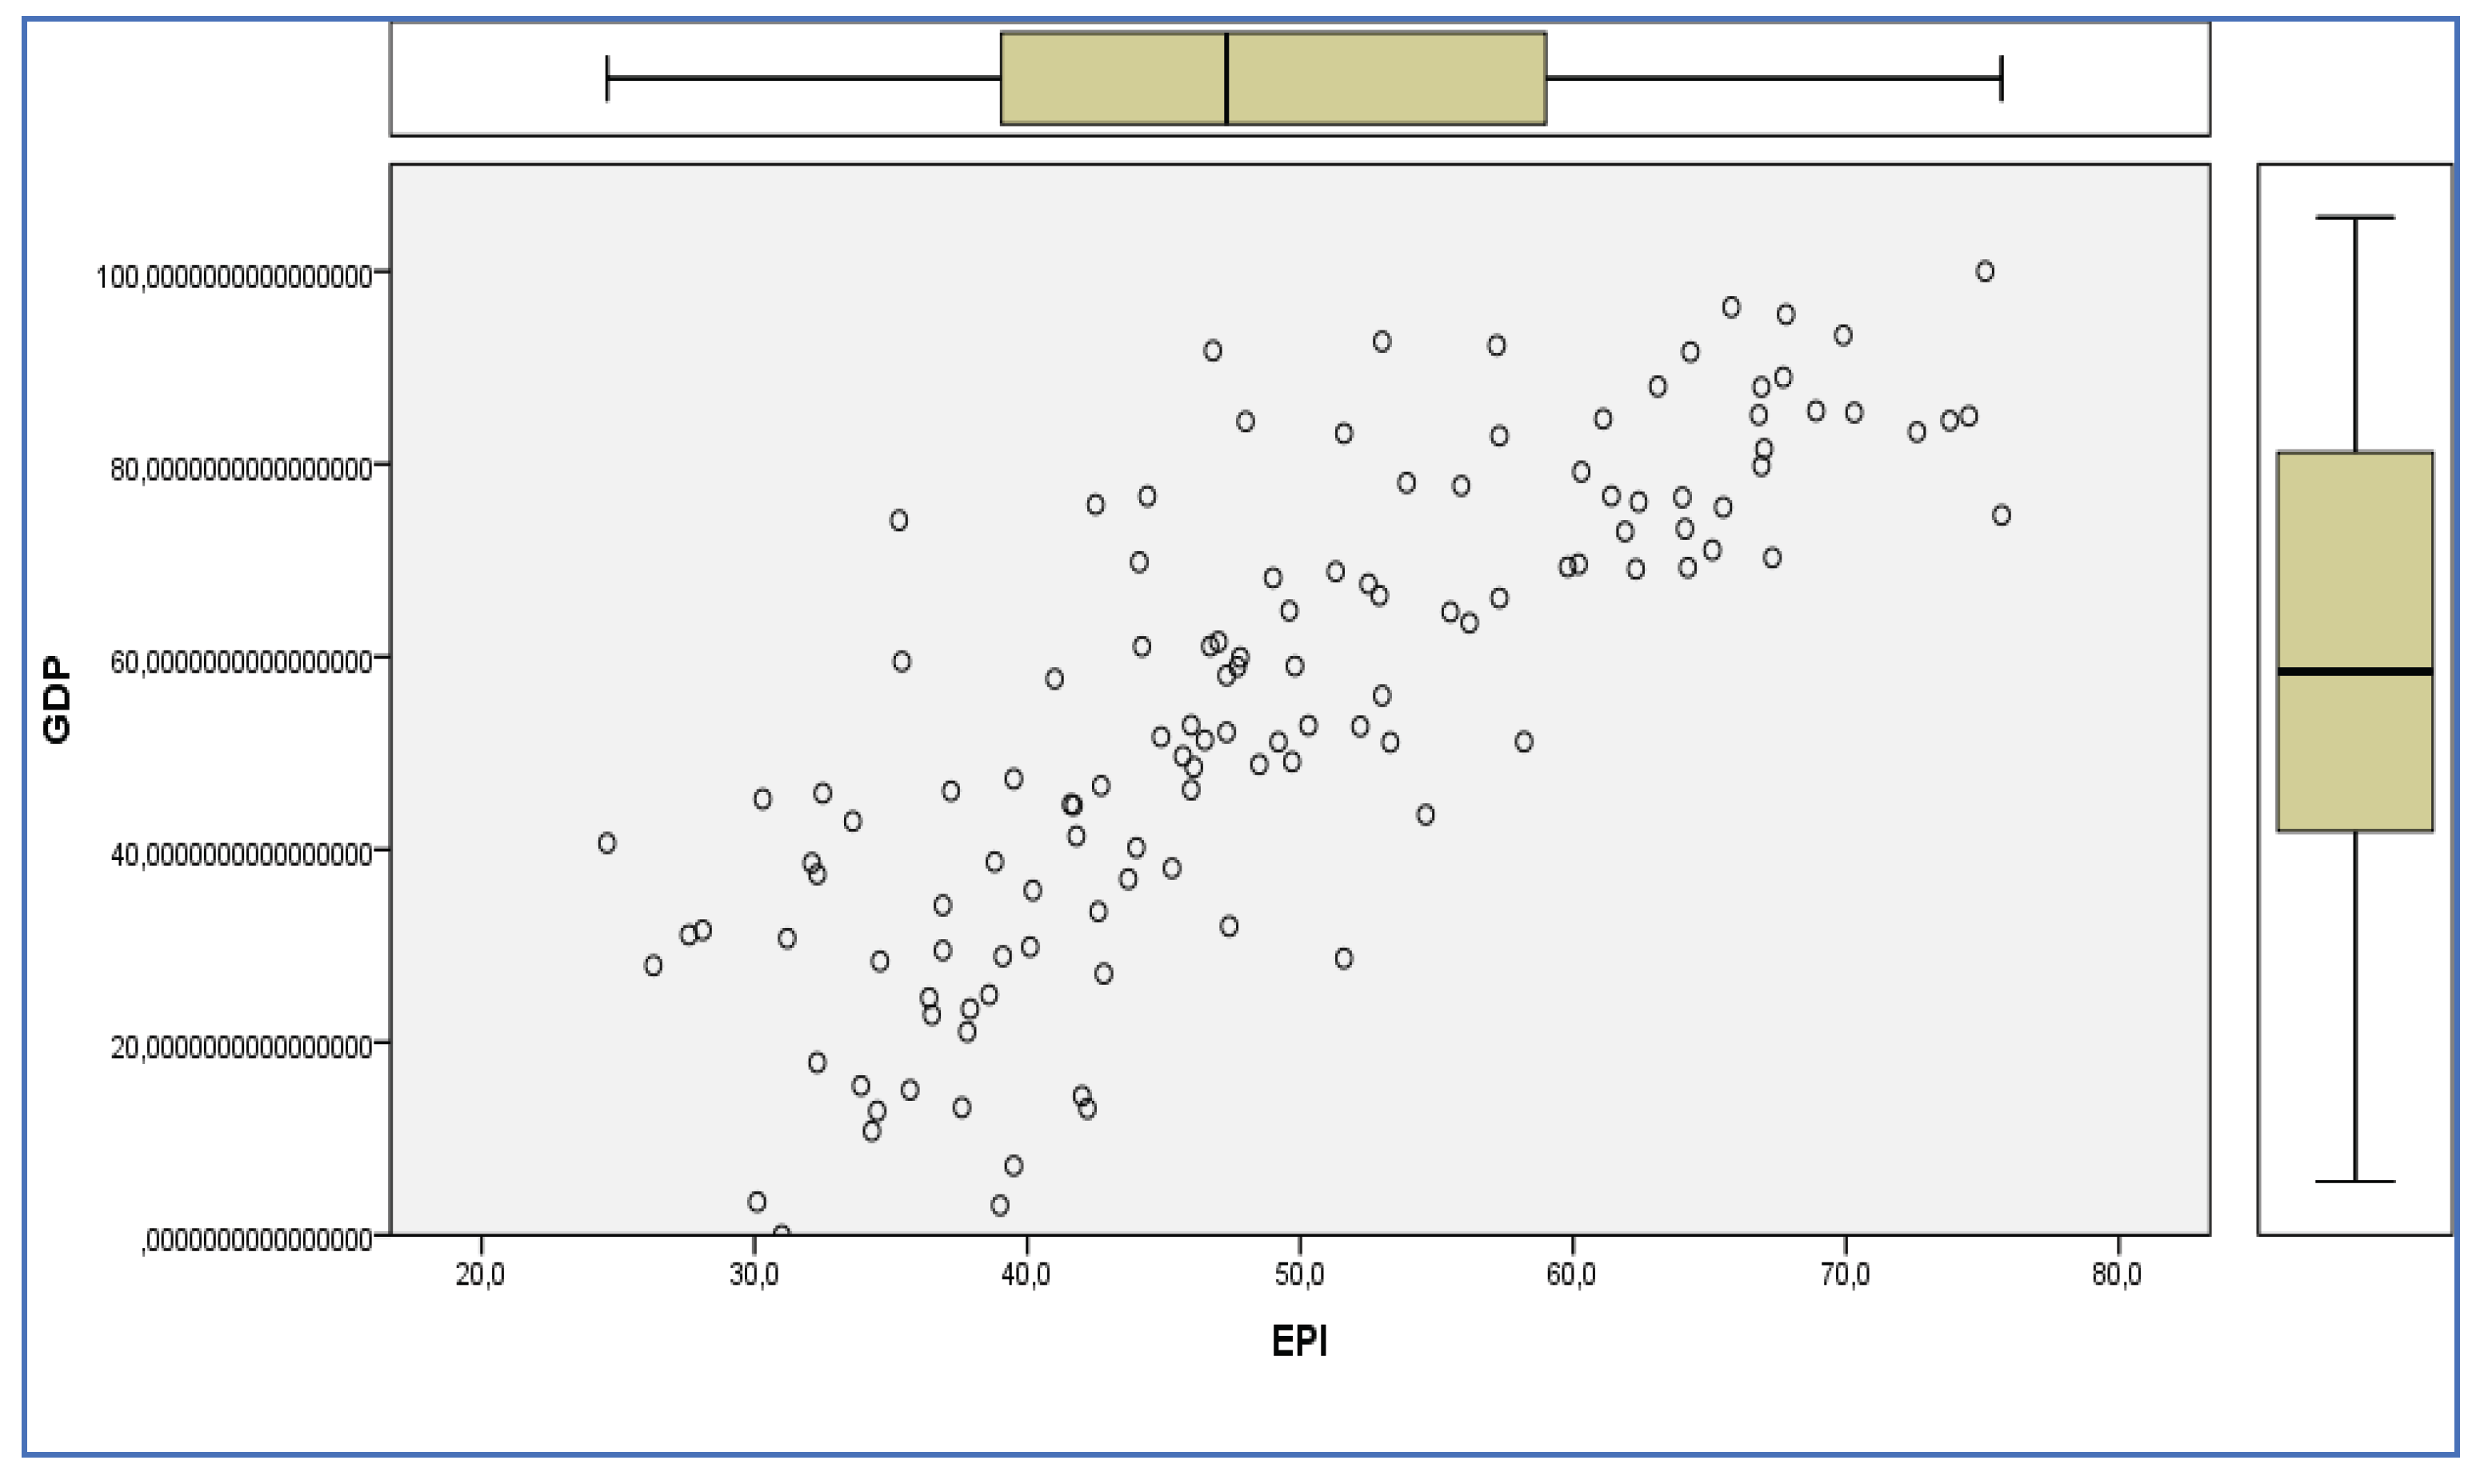
Figure 7.
Relationship between GDP and SDG. Source: own construction.
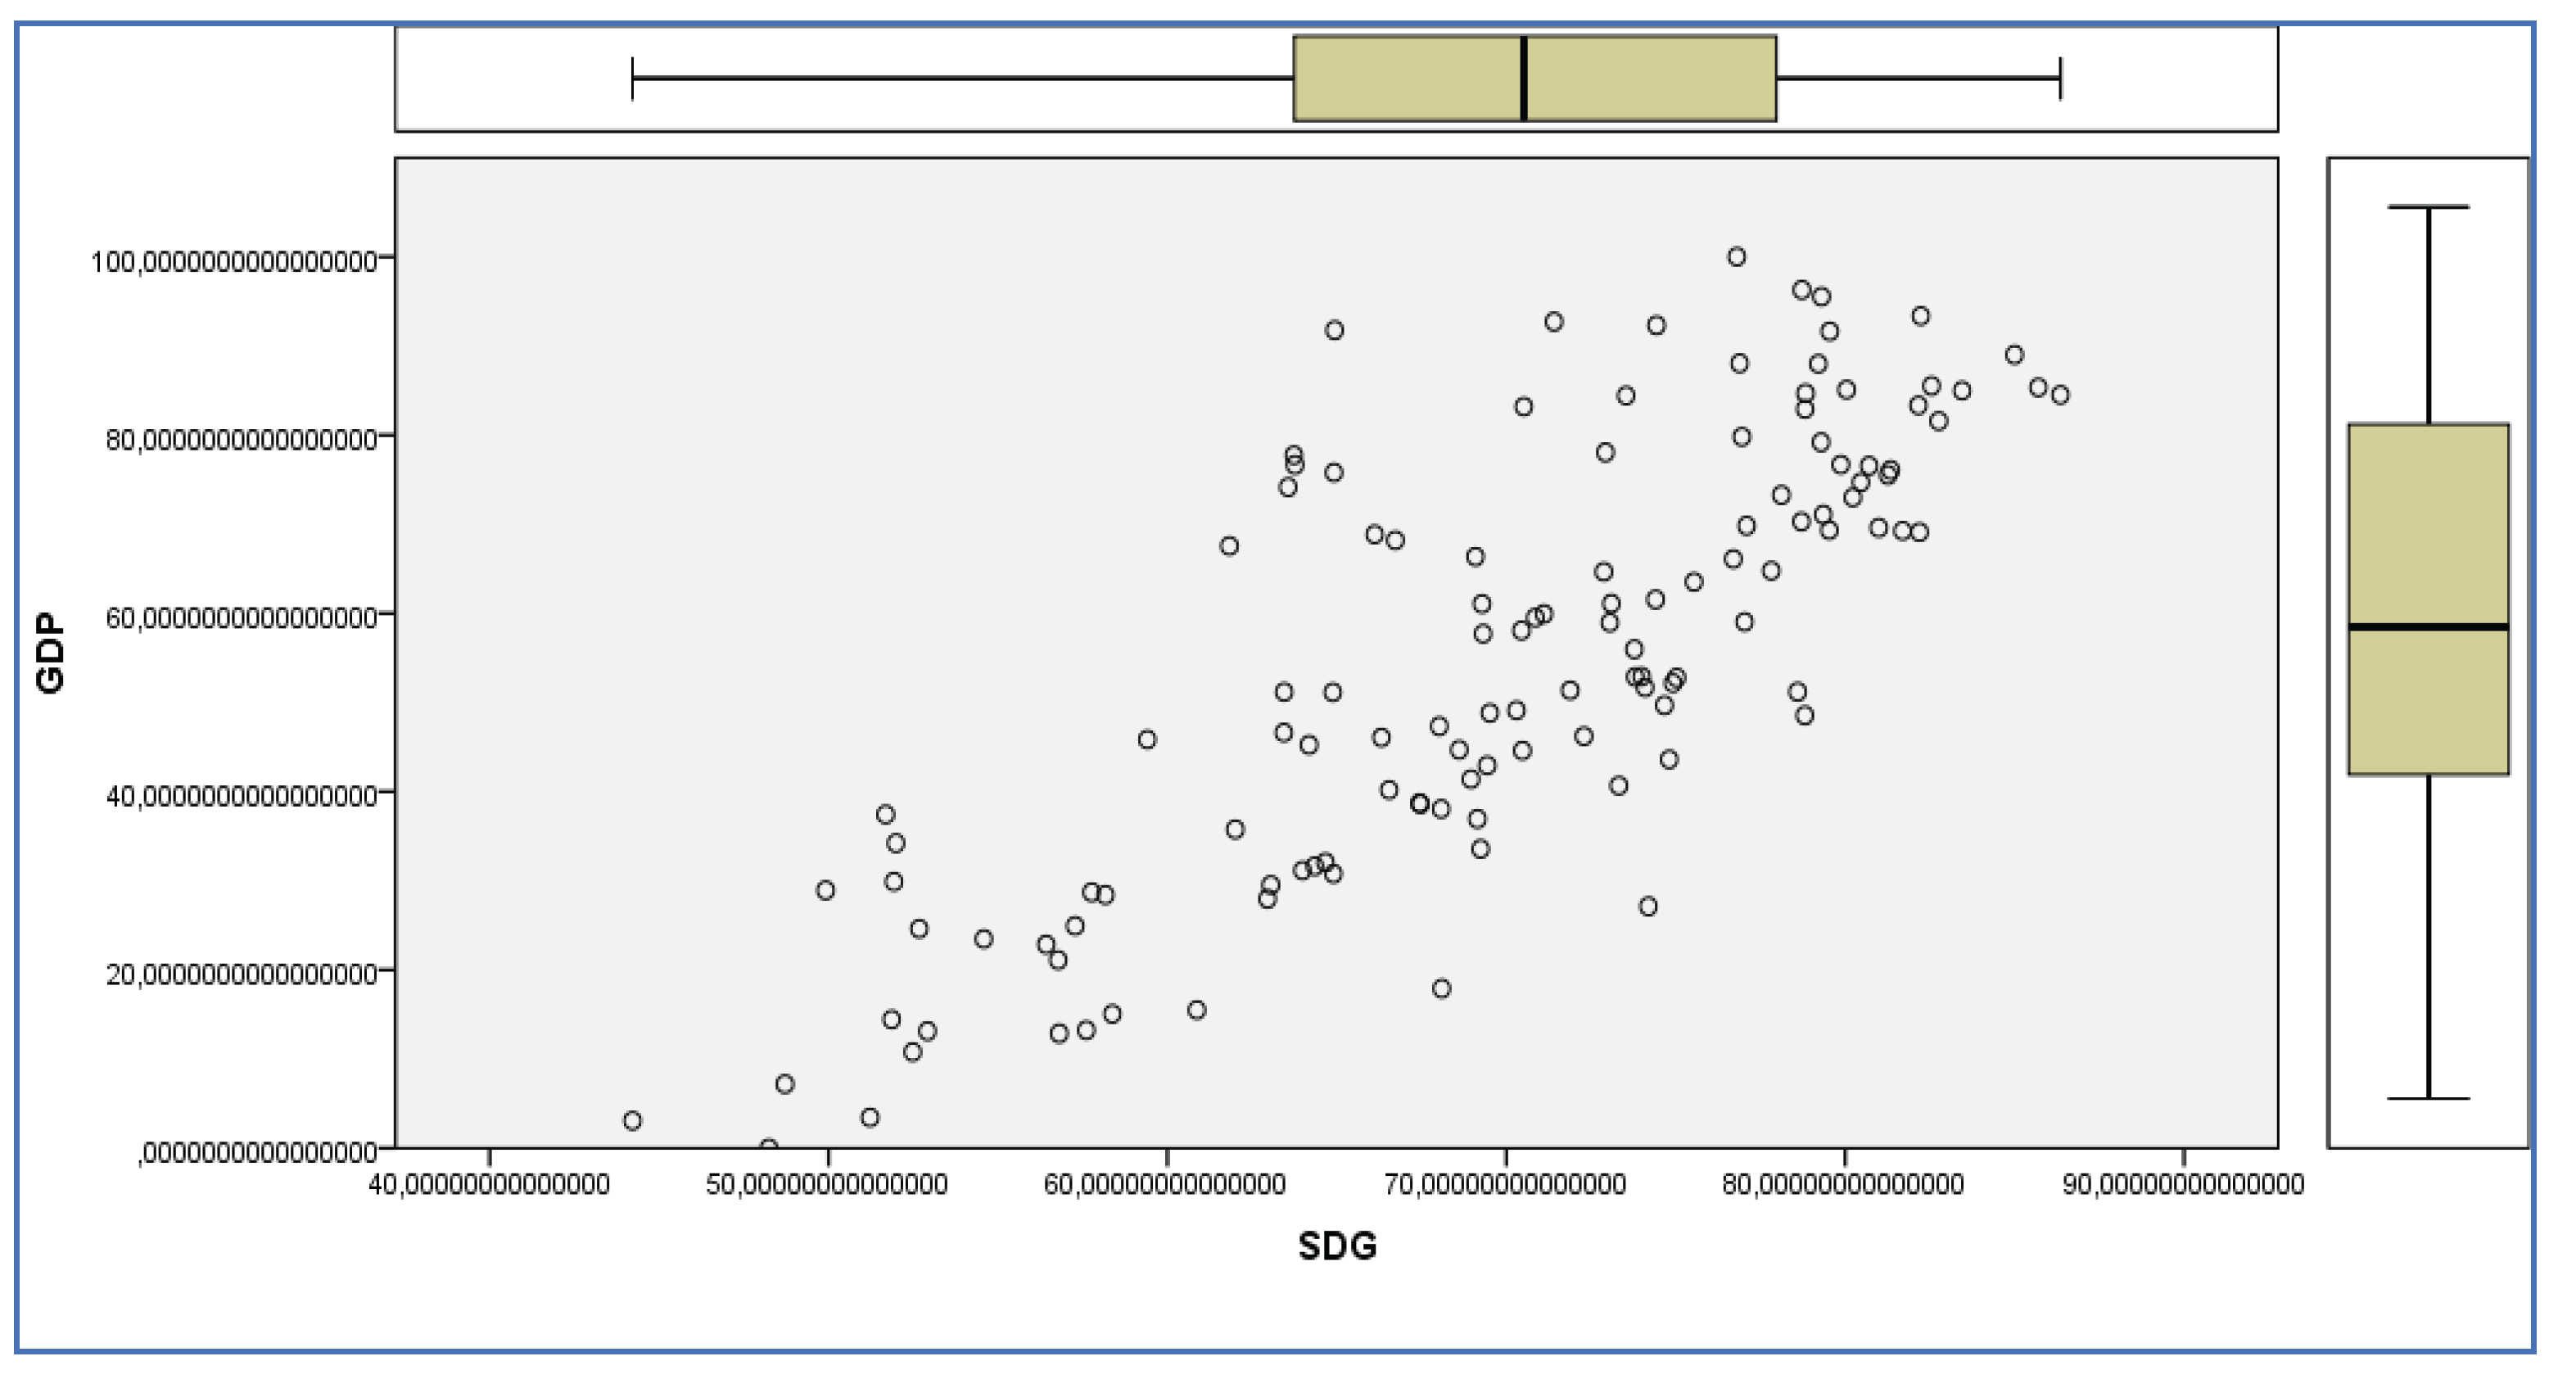
Figure 8.
Relationship between GDP and SDG. Source: own construction.
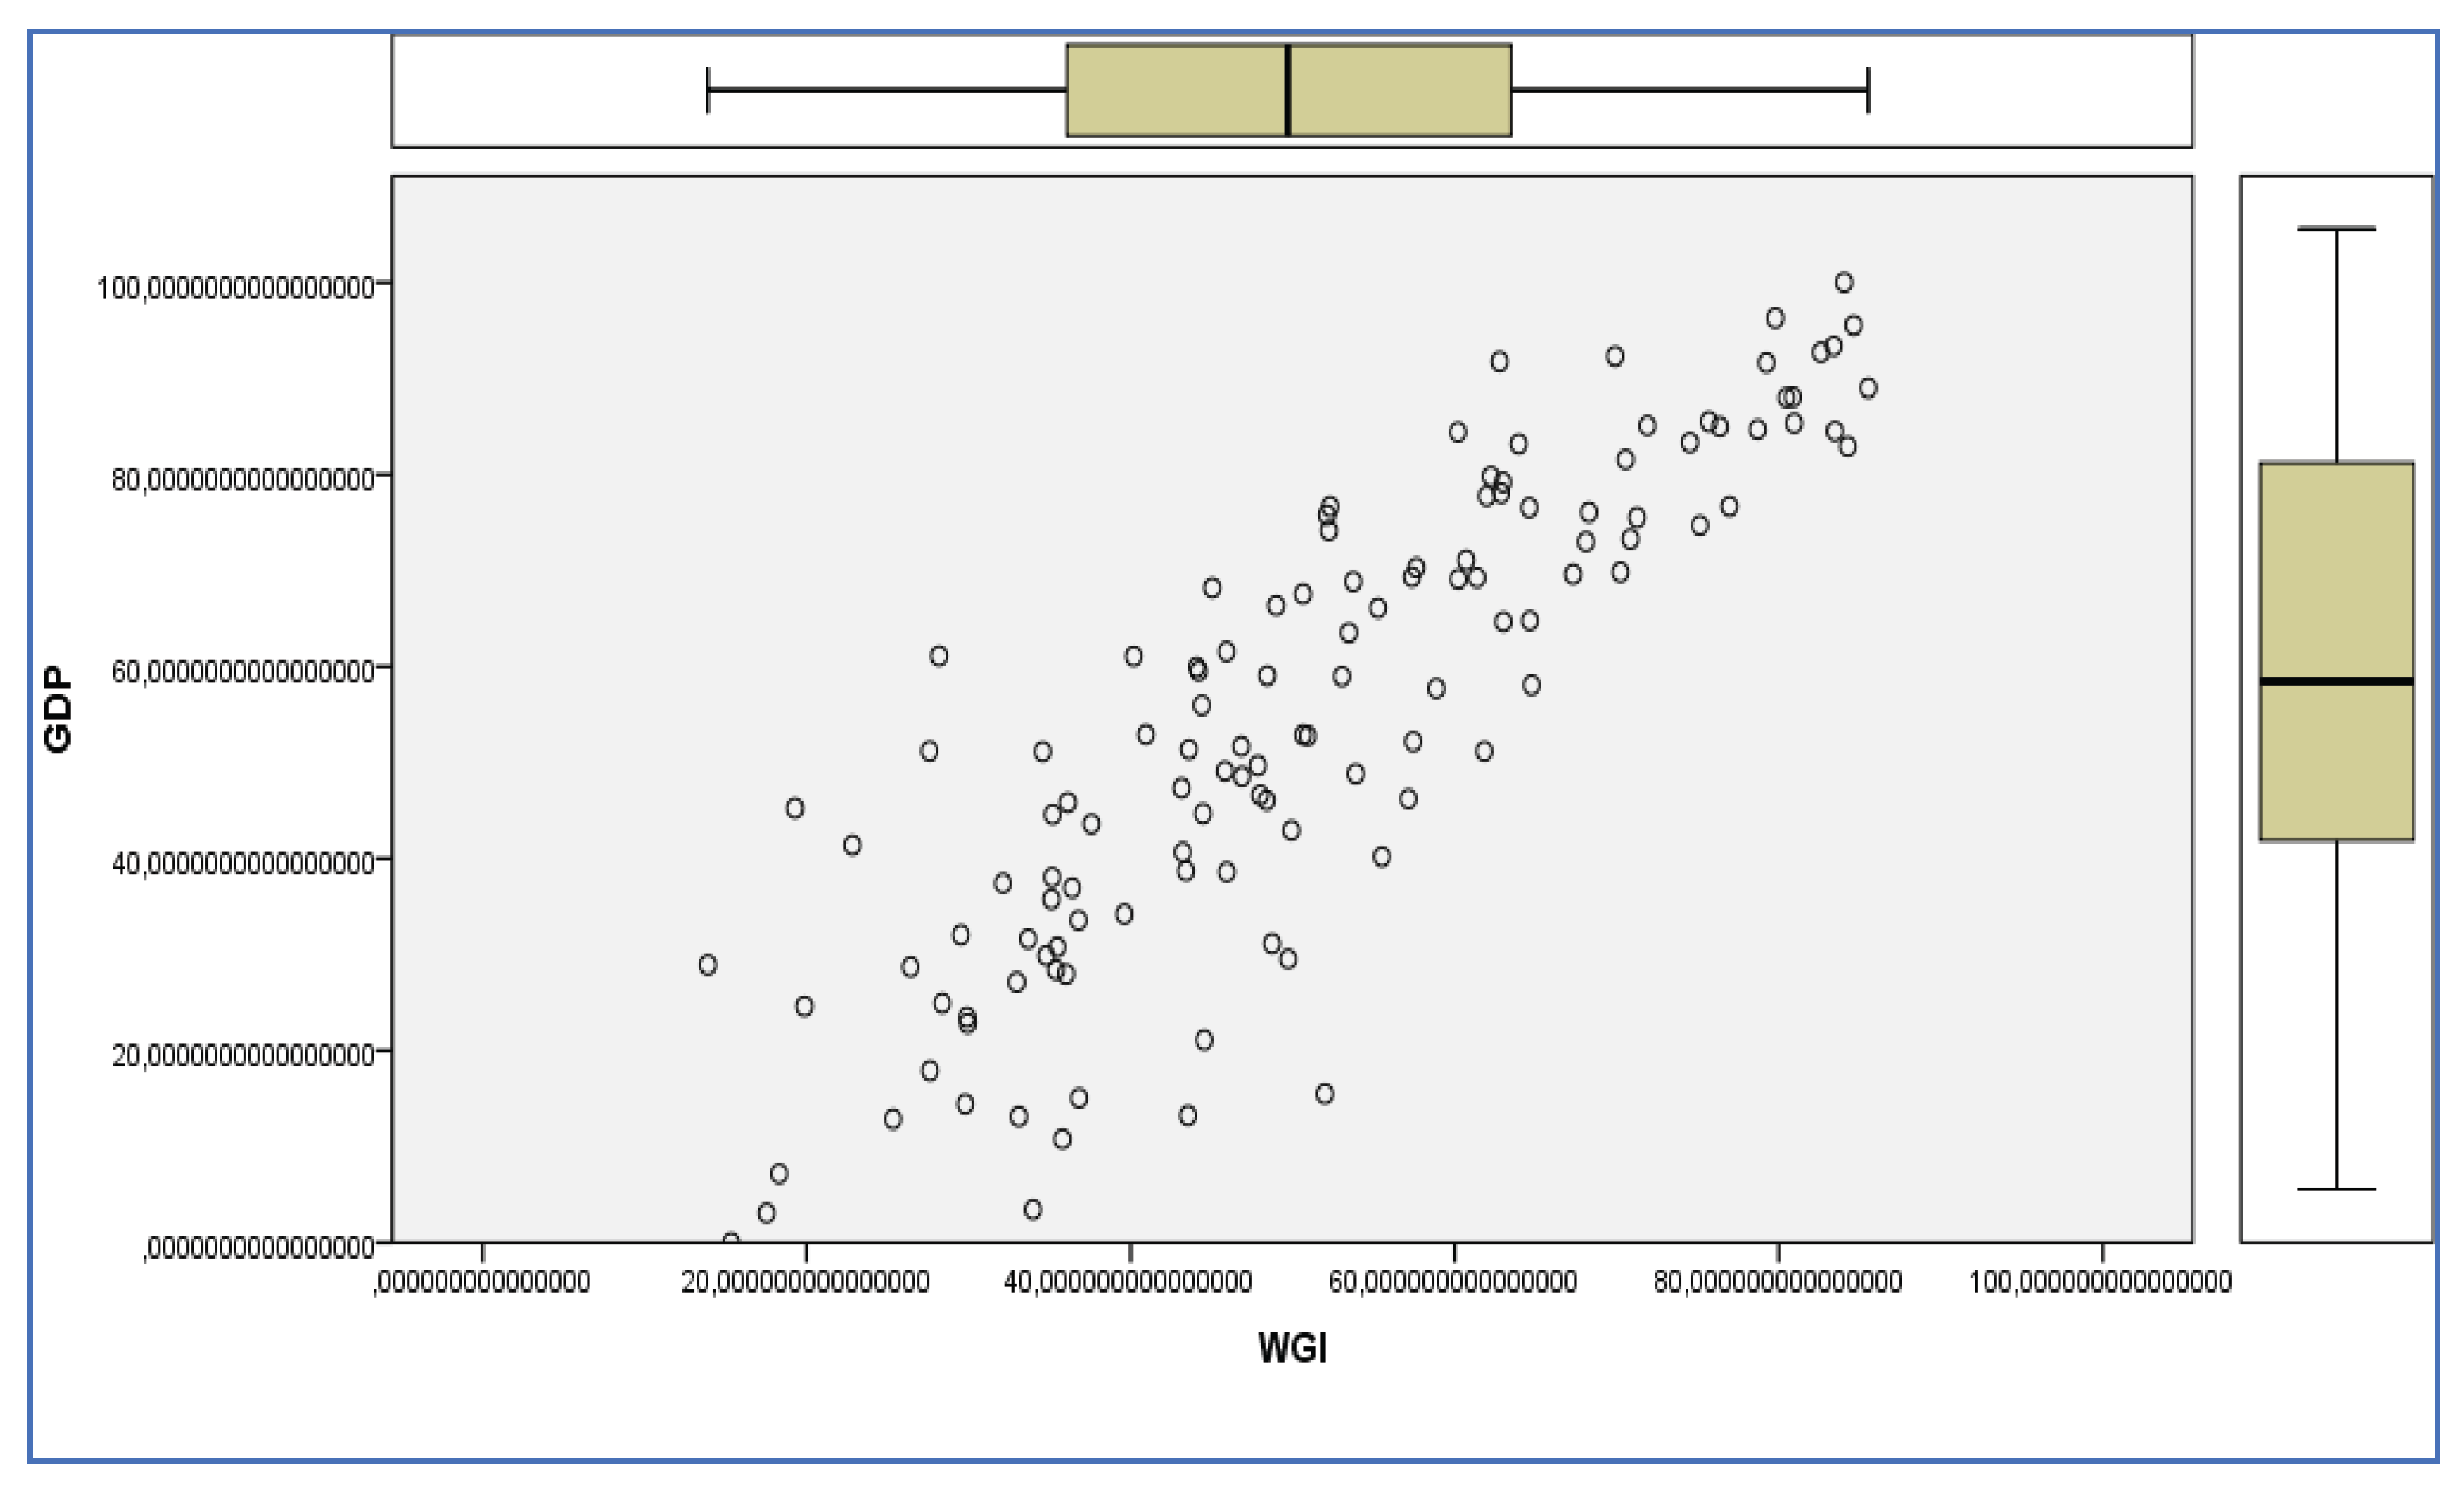
Figure 9.
Fuzzy Cognitive Map.
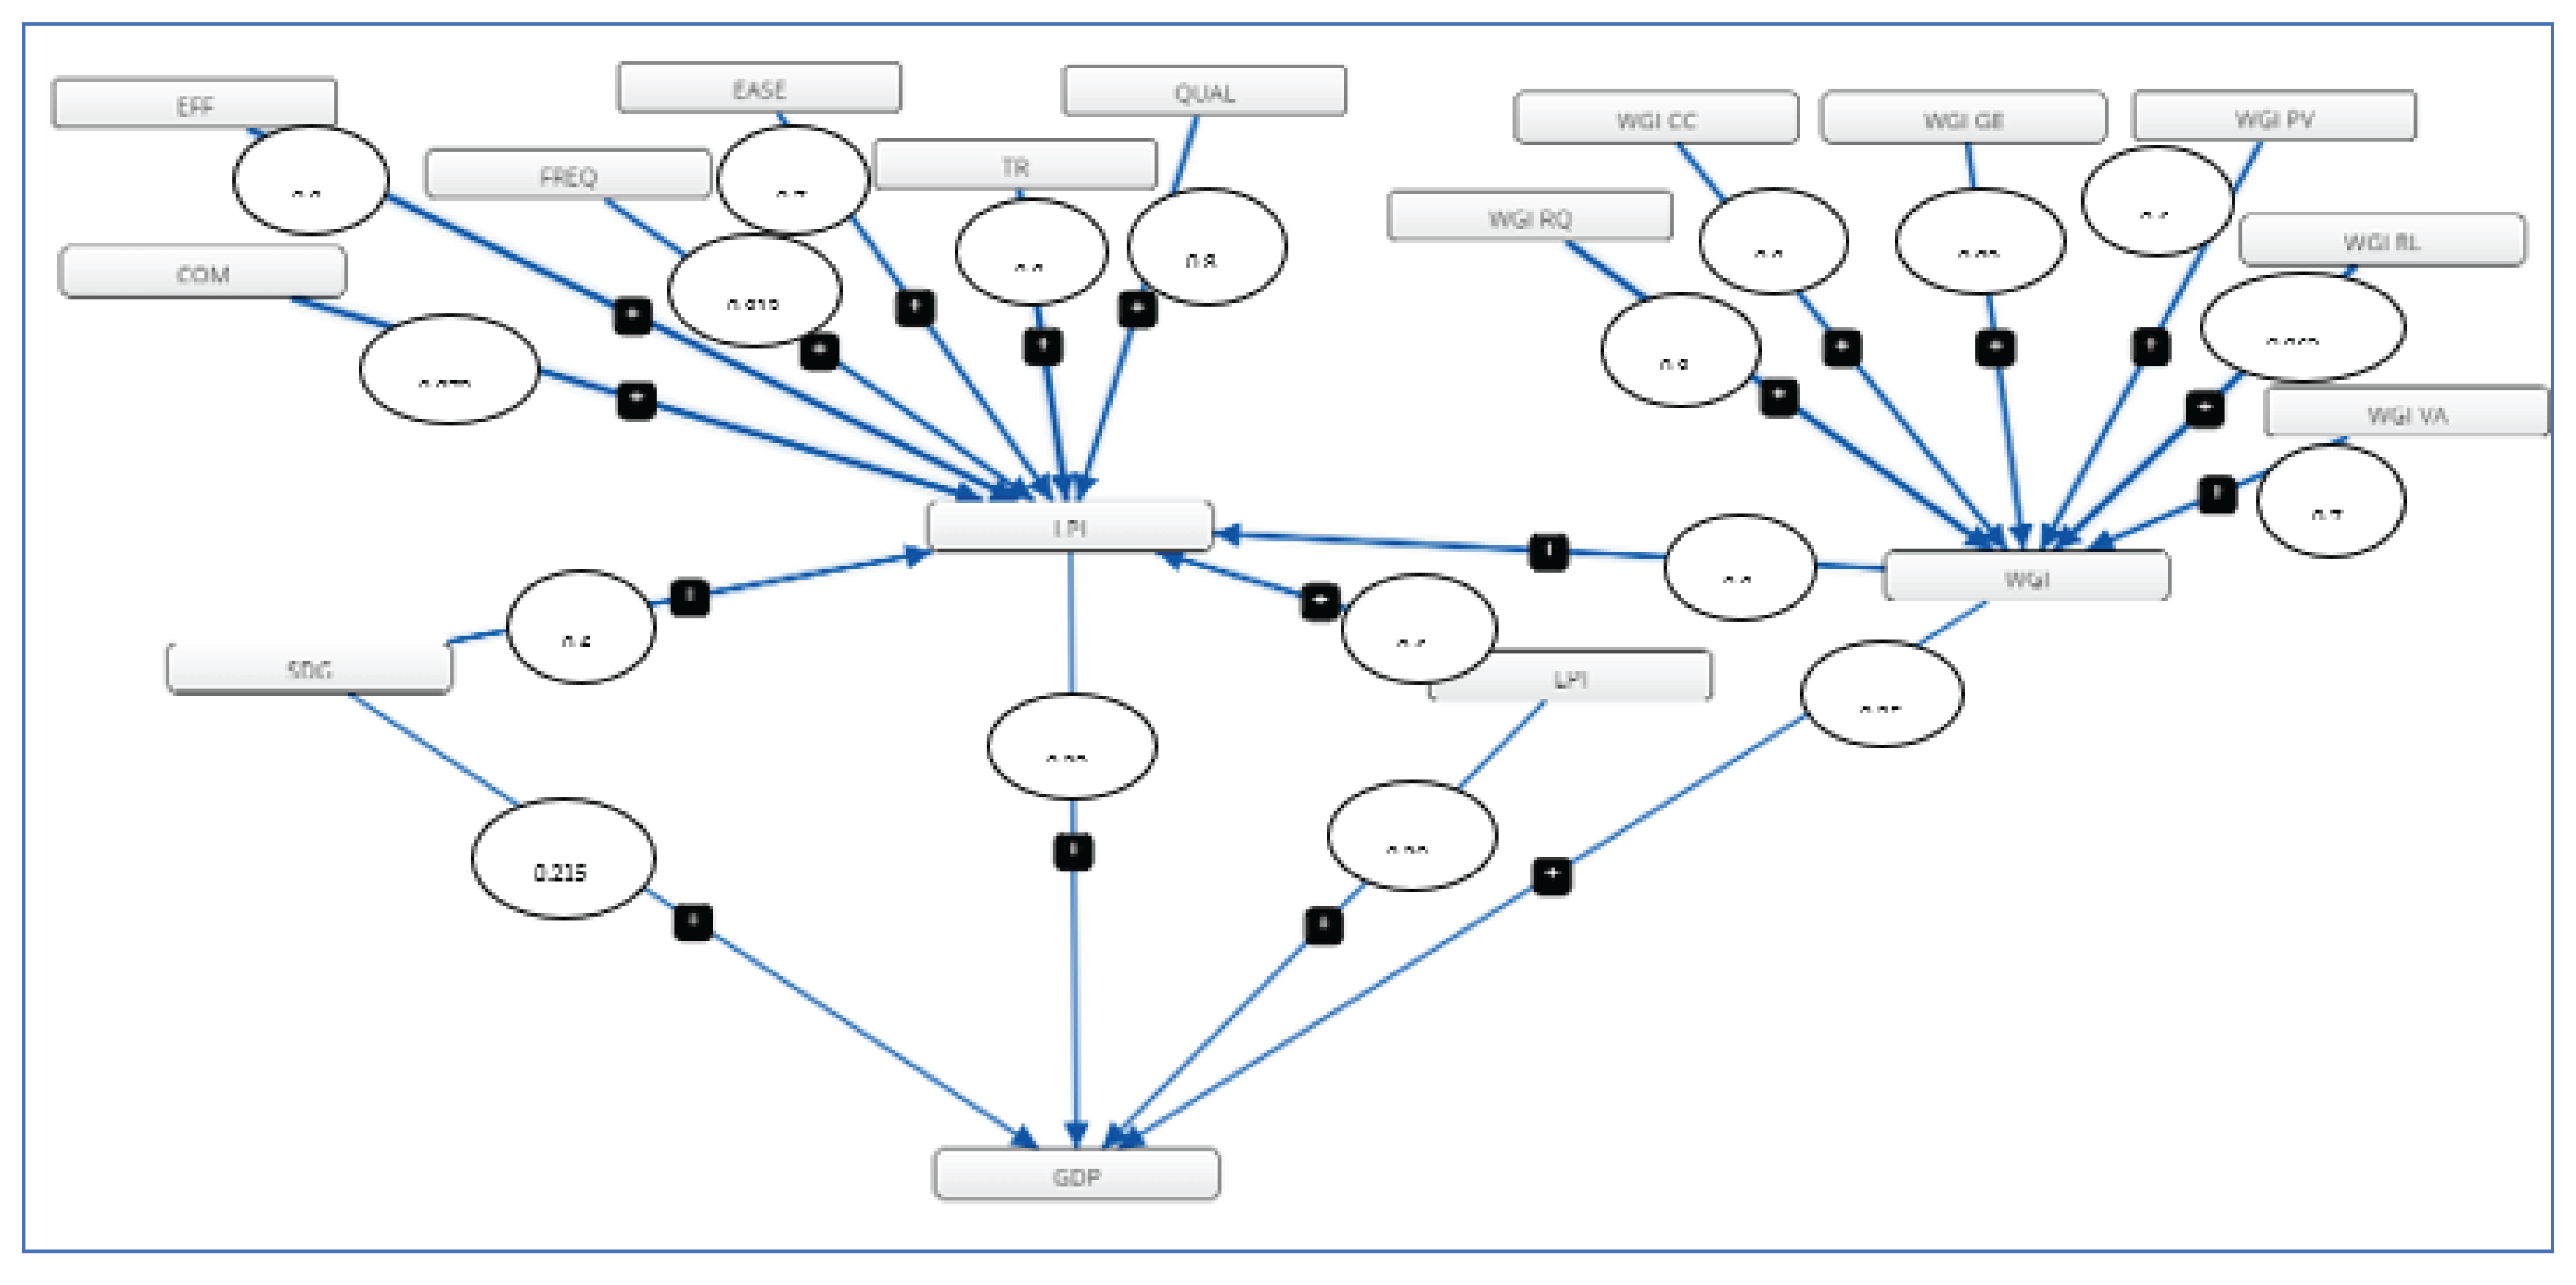
Figure 10.
FCM (A) scenario.
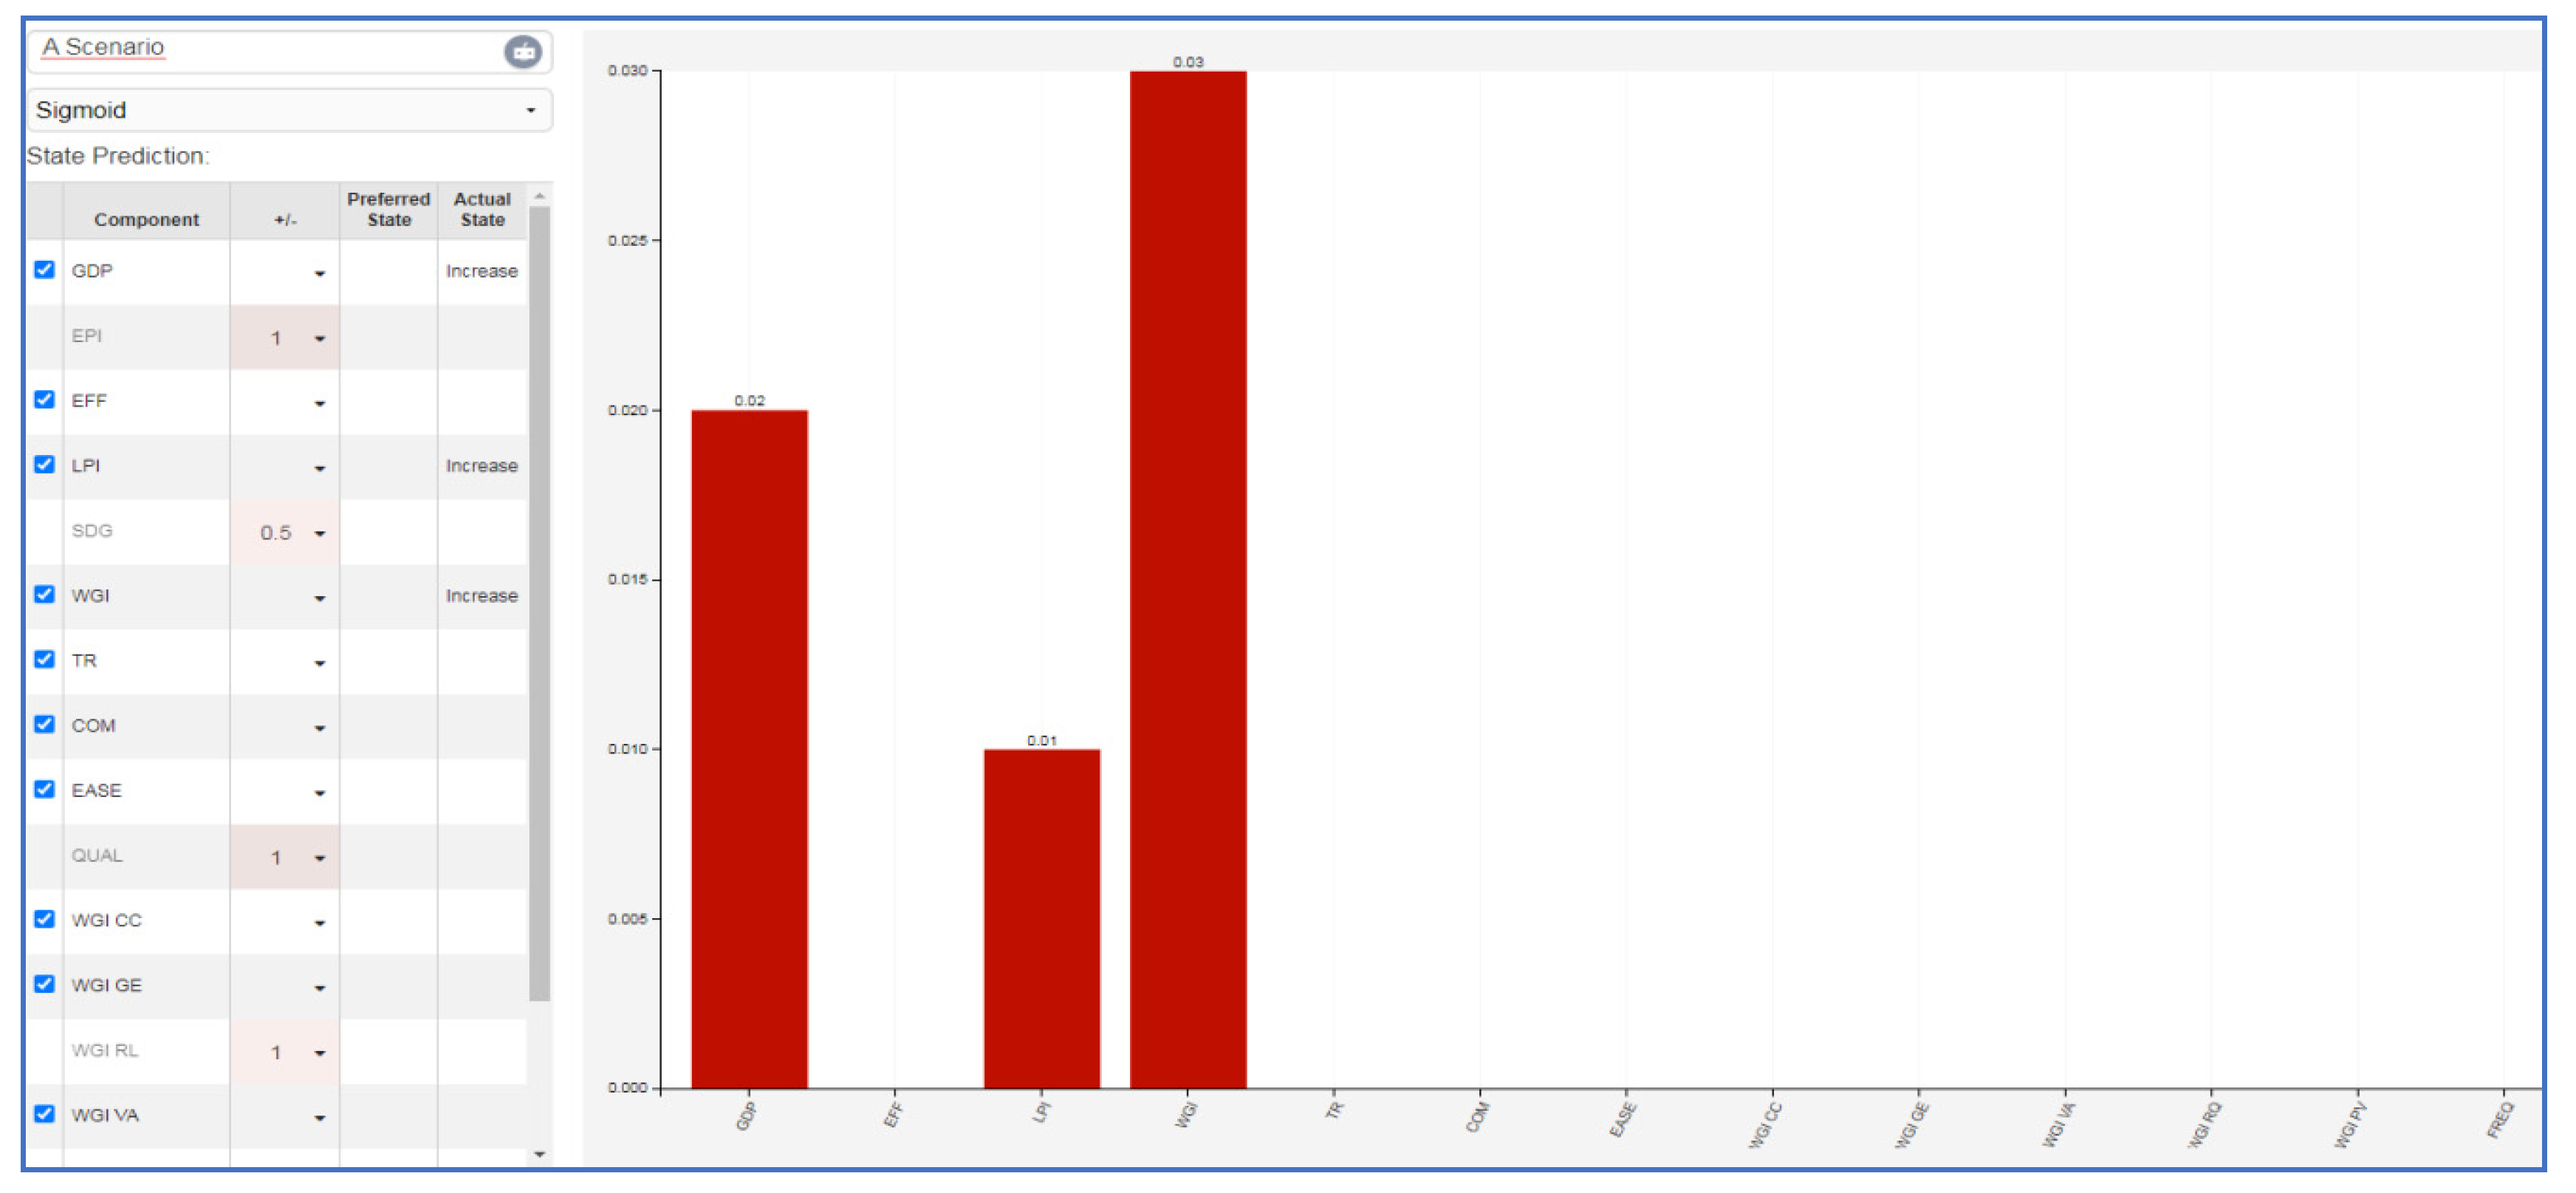
Figure 11.
FCM (B) scenario.
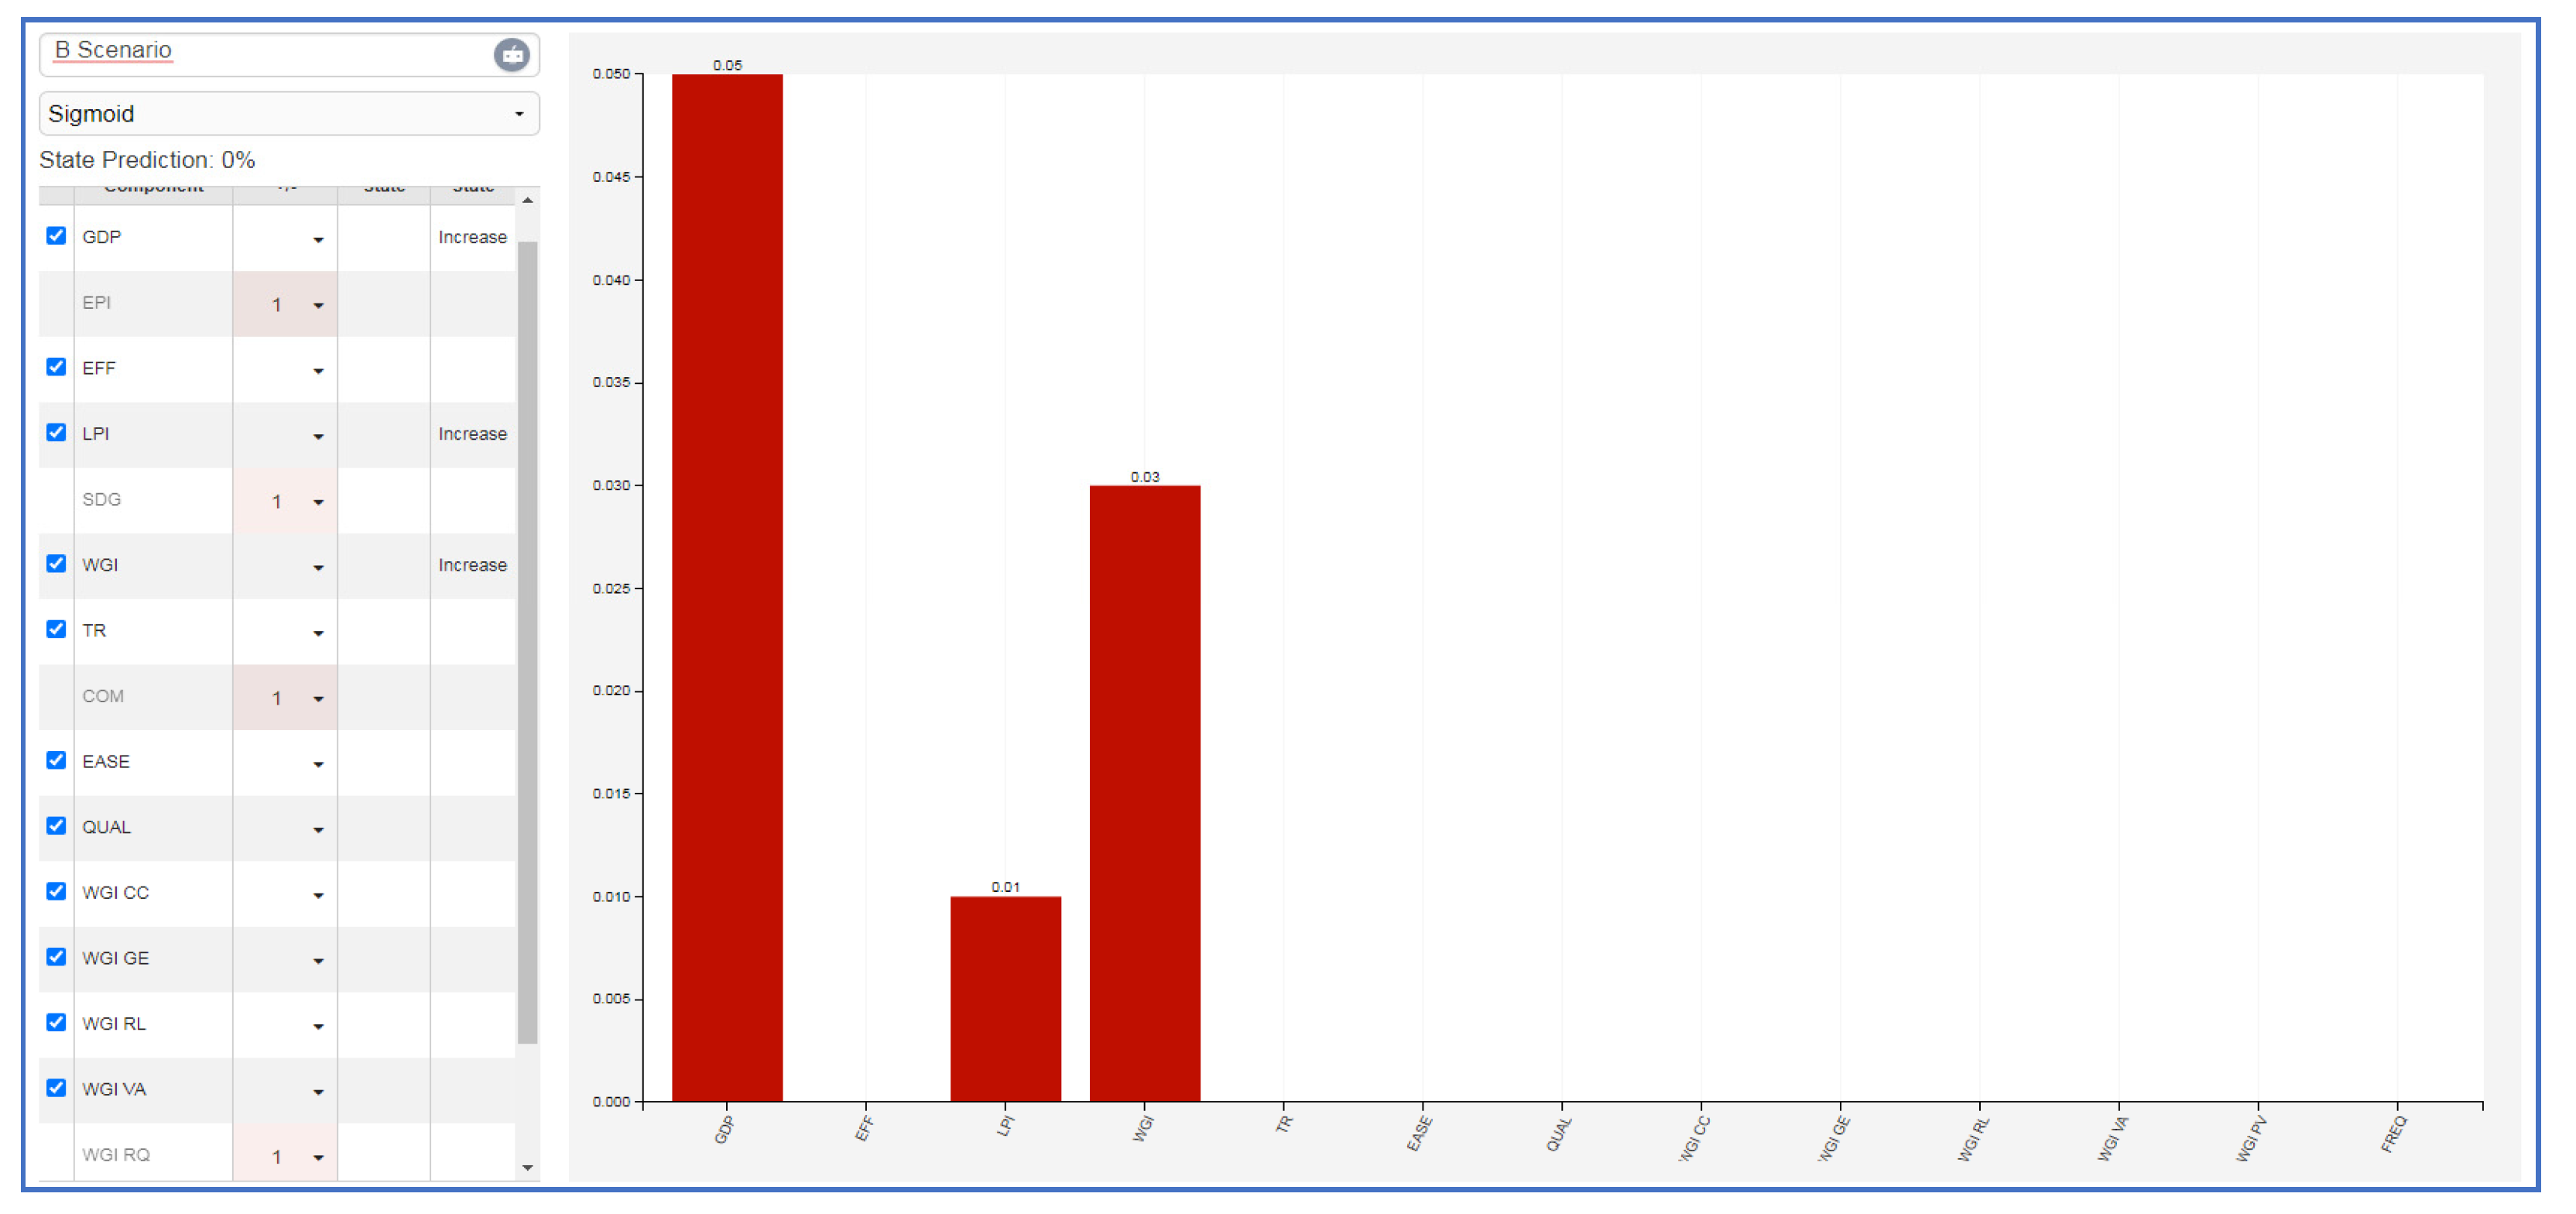
Figure 12.
FCM (C) scenario.
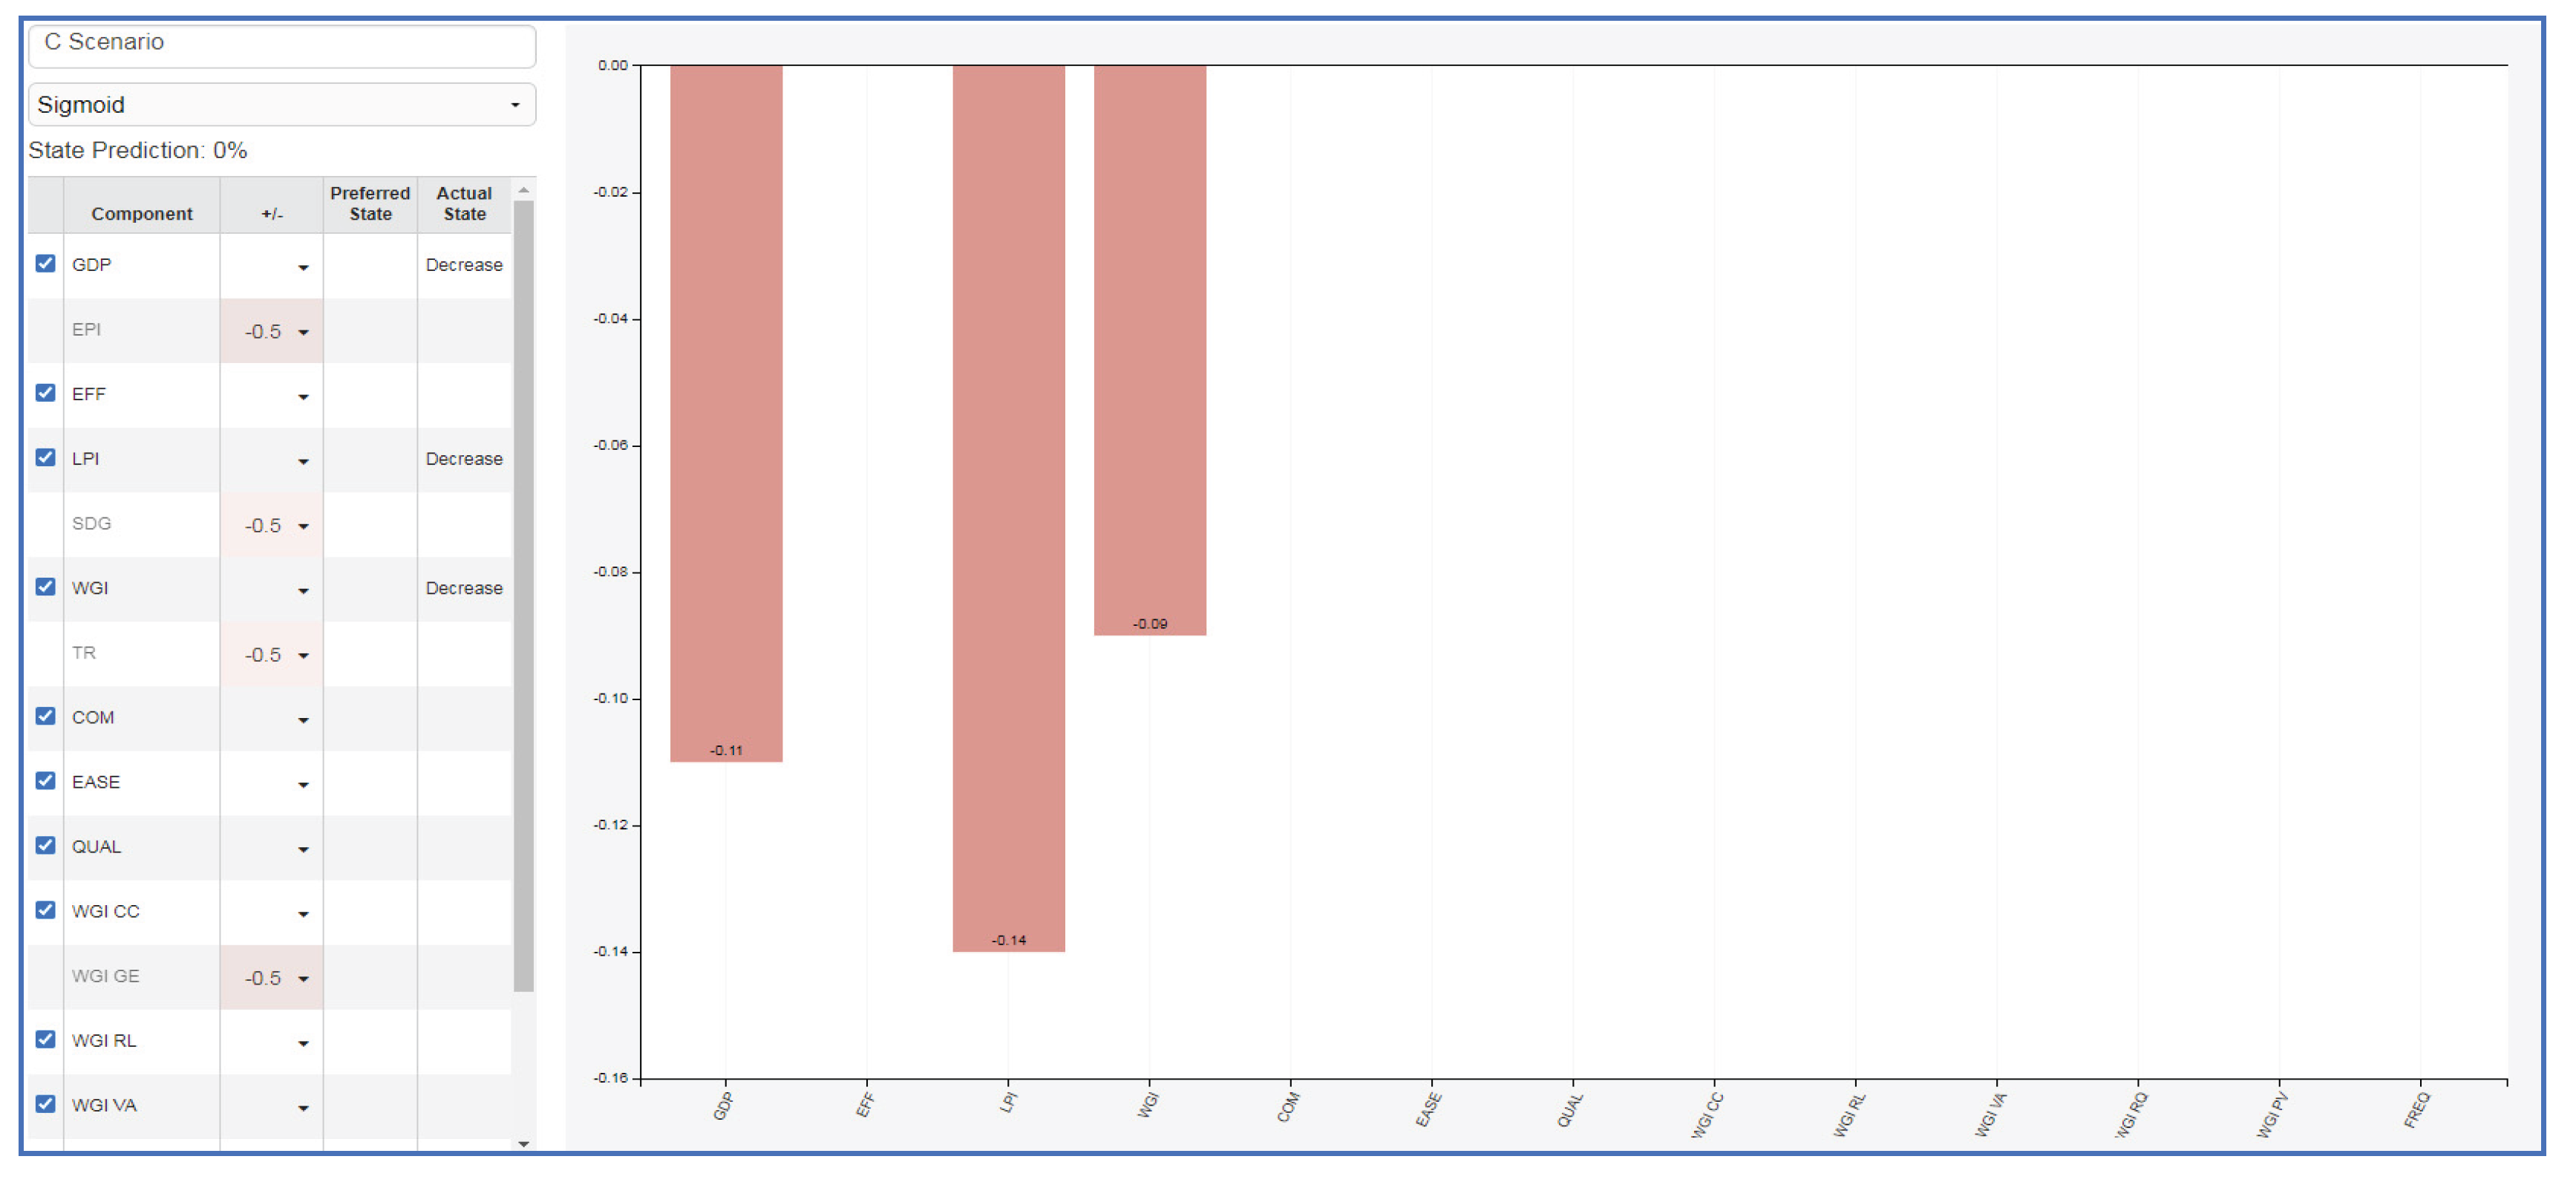

Table 1.
The variables of the study.
| Variable Name | Description | Source | Year |
| GDP | GDP per capita (current US$). GDP per capita is gross domestic product divided by midyear population. GDP is the sum of gross value added by all resident producers in the economy plus any product taxes and minus any subsidies not included in the value of the products. It is calculated without making deductions for depreciation of fabricated assets or for depletion and degradation of natural resources. Data are in current U.S. dollars. |
World Bank | 2023 |
| LPI | Logistics Performance Index: Overall (1=low to 5=high). | World Bank | 2023 |
| TR | LPI: Track and trace consignments (1=low to 5=high). | World Bank | 2023 |
| COM | LPI: Competence and quality of logistics services (1=low to 5=high). | World Bank | 2023 |
| EASE | LPI: Ease of arranging competitively priced shipments (1=low to 5=high). | World Bank | 2023 |
| EFF | LPI: Customs clearance efficiency (1=low to 5=high). | World Bank | 2023 |
| FREQ | LPI: Frequency of timely deliveries (1=low to 5=high). | World Bank | 2023 |
| QUAL | LPI: Quality of trade and transport-related infrastructure (1=low to 5=high). | World Bank | 2023 |
| EPI | Environmental Performance Index (0–100). | Yale University & Columbia University | 2024 |
| SDG | Sustainable Development Goals Index (0–100). | Dublin University (Sachs, Lafortune & Fuller, 2024). | 2024 |
| WGI | Mean of six WGI indicators (scale –2.5 to +2.5), where higher values indicate better situation. | Author’s calculation based on World Bank data | 2023 |
| WGI CC | Control of Corruption: Captures perceptions of the extent to which public power is exercised for private gain. Scale: –2.5 to +2.5. | World Bank | 2023 |
| WGI GE | Government Effectiveness: Reflects the quality of public services, civil service, and the credibility of government policy. Scale: –2.5 to 2.5. | World Bank | 2023 |
| WGI PV | Political Stability & Absence of Violence: Measures the likelihood of political instability and/or politically motivated. Scale: –2.5 to 2.5. | World Bank | 2023 |
| WGI RL | Rule of Law: Gauges confidence in and adherence to laws, property rights, the police, and the courts. Scale: –2.5 to 2.5. | World Bank | 2023 |
| WGI RQ | Regulatory Quality: Assesses the government’s ability to formulate and implement sound policies and regulations. Scale: –2.5 to +2.5. | World Bank | 2023 |
| WGI VA | Voice and Accountability: Reflects the extent of citizen participation in selecting their government, as well as freedom of expression and media. Scale: –2.5 to +2.5. | World Bank | 2023 |
Table 2.
Descriptive statistics and normality tests of initial data.
| Variable | Mean | Std Dev | Skewness | Kurtosis | Shapiro-Wilk p | Normality (S-W) |
| LPI_initial | 3.033 | 0.58 | 0.326 | -0.983 | 0.000 | No |
| EFF_initial | 2.836 | 0.607 | 0.389 | -0.766 | 0.002 | No |
| QUAL_initial | 2.957 | 0.71 | 0.406 | -0.982 | 0.000 | No |
| EASE_initial | 2.959 | 0.496 | 0.063 | -0.757 | 0.086 | Yes |
| COM_initial | 3.061 | 0.635 | 0.305 | -1.033 | 0.000 | No |
| FREQ_initial | 3.267 | 0.555 | 0.041 | -0.849 | 0.026 | No |
| TR_initial | 3.087 | 0.656 | 0.154 | -0.927 | 0.005 | No |
| EPI | 48.909 | 12.556 | 0.285 | -0.823 | 0.009 | No |
| SDG | 69.68 | 9.687 | -0.537 | -0.481 | 0.001 | No |
| WGI CC_initial | 0.036 | 1.019 | 0.535 | -0.701 | 0.000 | No |
| WGI GE_initial | 0.12 | 0.983 | 0.037 | -0.557 | 0.411 | Yes |
| WGI PV_initial | -0.076 | 0.891 | -0.878 | 0.576 | 0.000 | No |
| WGI RL_initial | 0.053 | 0.991 | 0.197 | -0.922 | 0.004 | No |
| WGI RQ_initial | 0.153 | 0.971 | 0.153 | -0.879 | 0.030 | No |
| WGI VA_initial | 0.055 | 0.997 | -0.064 | -1.155 | 0.001 | No |
| WGI_initial | 0.057 | 0.905 | 0.122 | -0.79 | 0.029 | No |
| GDP_initial | 21576.194 | 25969.989 | 1.745 | 2.907 | 0.000 | No |
Table 3.
Descriptive statistics and normality tests of normalized data.
| Variable | Mean | Std Dev | Skewness | Kurtosis | Shapiro-Wilk p | Normality (S-W) |
| LPI | 50.833 | 14.492 | 0.326 | -0.983 | 0.000 | No |
| EFF | 45.894 | 15.174 | 0.389 | -0.766 | 0.002 | No |
| QUAL | 48.923 | 17.753 | 0.406 | -0.982 | 0.000 | No |
| EASE | 48.963 | 12.405 | 0.063 | -0.757 | 0.086 | Yes |
| COM | 51.524 | 15.868 | 0.305 | -1.033 | 0.000 | No |
| FREQ | 56.667 | 13.881 | 0.041 | -0.849 | 0.026 | No |
| TR | 52.175 | 16.39 | 0.154 | -0.927 | 0.005 | No |
| WGI CC | 50.711 | 20.386 | 0.535 | -0.701 | 0.000 | No |
| WGI GE | 52.395 | 19.652 | 0.037 | -0.557 | 0.411 | Yes |
| WGI PV | 48.484 | 17.819 | -0.878 | 0.576 | 0.000 | No |
| WGI RL | 51.066 | 19.816 | 0.197 | -0.922 | 0.004 | No |
| WGI RQ | 53.056 | 19.425 | 0.153 | -0.879 | 0.030 | No |
| WGI VA | 51.103 | 19.939 | -0.064 | -1.155 | 0.001 | No |
| WGI | 51.136 | 18.094 | 0.122 | -0.79 | 0.029 | No |
| GDP LOG | 9.165 | 1.421 | -0.215 | -0.871 | 0.015 | No |
| GDP | 54.668 | 24.769 | -0.215 | -0.871 | 0.015 | No |
Table 4.
Model summary.
| R | R Square | Adjusted R Square | Std. Error of the Estimate | Durbin-Watson |
| 0,684 | 0,468 | 0,463 | 10,617 | 2,089 |
Table 5.
ANOVA.
| Sum of Squares | df | Mean Square | F | Sig. | ||
| Regression | 11980,080 | 1 | 11980,080 | 106,269 | 0,000 | |
| Residual | 13640,753 | 121 | 112,733 | |||
| Total | 25620,833 | 122 | ||||
Table 6.
Coefficients.
| Unstandardized Coefficients | Standardized Coefficients | t | Sig. | Collinearity Statistics | ||||||
| B | Std. Error | Beta | Tolerance | VIF | ||||||
| (Constant) | 12,235 | 3,865 | 3,166 | 0,002 | ||||||
| EPI | 0,789 | 0,077 | 0,684 | 10,309 | 0,000 | 1,000 | 1,000 | |||
Table 7.
Collinearity diagnostics.
| Dimension | Eigenvalue | Condition Index | Variance Proportions | |
| (Constant) | EPI | |||
| 1 | 1,969 | 1,000 | 0,02 | 0,02 |
| 2 | 0,031 | 7,948 | 0,98 | 0,98 |
Table 8.
Residual statistics.
| Minimum | Maximum | Mean | Std. Deviation | N | |
| Predicted Value | 31,649 | 71,977 | 50,833 | 9,909 | 123 |
| Residual | -19,2987 | 28,438 | 0,000 | 10,574 | 123 |
| Std. Predicted Value | -1,936 | 2,134 | 0,000 | 1,000 | 123 |
| Std. Residual | -1,818 | 2,678 | 0,000 | 0,996 | 123 |
Table 9.
Model summary.
| R | R Square | Adjusted R Square | Std. Error of the Estimate | Durbin-Watson |
| 0,686 | 0,470 | 0,466 | 10,5906 | 2,127 |
Table 10.
ANOVA.
| Sum of Squares | df | Mean Square | F | Sig. | ||
| Regression | 12049,408 | 1 | 12049,408 | 107,430 | 0,000 | |
| Residual | 13571,426 | 121 | 112,161 | |||
| Total | 25620,833 | 122 | ||||
Table 11.
Coefficients.
| Unstandardized Coefficients | Standardized Coefficients | t | Sig. | Collinearity Statistics | |||
| B | Std. Error | Beta | Tolerance | VIF | |||
| (Constant) | -20,652 | 6,963 | -2,966 | 0,004 | |||
| SDG | 1,026 | 0,099 | 0,686 | 10,365 | 0,000 | 1,000 | 1,000 |
Table 12.
Collinearity diagnostics.
| Dimension | Eigenvalue | Condition Index | Variance Proportions | |
| (Constant) | SDG | |||
| 1 | 1,991 | 1,000 | 0,00 | 0,00 |
| 2 | 0,009 | 14,514 | 1,00 | 1,00 |
Table 13.
Residuals statistics.
| Minimum | Maximum | Mean | Std. Deviation | N | |
| Predicted Value | 24,708 | 67,936 | 50,833 | 9,938 | 123 |
| Residual | -22,964 | 29,892 | 0,000 | 10,547 | 123 |
| Std. Predicted Value | -2,629 | 1,721 | 0,000 | 1,000 | 123 |
| Std. Residual | -2,168 | 2,823 | 0,000 | 0,996 | 123 |
Table 14.
Model summary.
| R | R Square | Adjusted R Square | Std. Error of the Estimate | Durbin-Watson |
| 0,823 | 0,677 | 0,674 | 8,2691 | 2,130 |
Table 15.
ANOVA.
| Sum of Squares | df | Mean Square | F | Sig. | |
| Regression | 17347,002 | 1 | 17347,002 | 253,690 | 0,000 |
| Residual | 8273,832 | 121 | 68,379 | ||
| Total | 25620,833 | 122 |
Table 16.
Coefficients.
| Unstandardized Coefficients | Standardized Coefficients | t | Sig. | Collinearity Statistics | ||||
| B | Std. Error | Beta | Tolerance | VIF | ||||
| (Constant) | 17,133 | 2,243 | 7,637 | 0,000 | ||||
| WGI | 0,659 | 0,041 | 0,823 | 15,928 | 0,000 | 1,000 | 1,000 | |
Table 17.
Collinearity diagnostics.
| Dimension | Eigenvalue | Condition Index | Variance Proportions | |
| (Constant) | WGI | |||
| 1 | 1,943 | 1,000 | 0,03 | 0,03 |
| 2 | 0,057 | 5,847 | 0,97 | 0,97 |
Table 18.
Residual statistics.
| Minimum | Maximum | Mean | Std. Deviation | N | |
| Predicted Value | 26,298 | 73,493 | 50,833 | 11,924 | 123 |
| Residual | -22,303 | 21,239 | 0,000 | 8,235 | 123 |
| Std. Predicted Value | -2,058 | 1,900 | 0,000 | 1,000 | 123 |
| Std. Residual | -2,697 | 2,568 | 0,000 | 0,996 | 123 |
Table 19.
Model Summary.
| R | R Square | Adjusted R Square | Std. Error of the Estimate | Durbin-Watson |
| 0,904 | 0,817 | 0,811 | 10,764 | 2,067 |
Table 20.
ANOVA.
| Sum of Squares | df | Mean Square | F | Sig. | ||
| Regression | 61173,759 | 4 | 15293,440 | 131,972 | 0,000 | |
| Residual | 13674,358 | 118 | 115,884 | |||
| Total | 74848,117 | 122 | ||||
Table 21.
Coefficients.
| Unstandardized Coefficients | Standardized Coefficients | t | Sig. | Collinearity Statistics | |||
| B | Std. Error | Beta | Tolerance | VIF | |||
| (Constant) | -47,544 | 8,218 | -5,786 | 0,000 | |||
| WGI | 0,485 | 0,114 | 0,355 | 4,244 | 0,000 | 0,222 | 4,507 |
| EPI | 0,409 | 0,137 | 0,207 | 2,993 | 0,003 | 0,322 | 3,103 |
| SDG | 0,549 | 0,174 | 0,215 | 3,153 | 0,002 | 0,334 | 2,998 |
| LPI | 0,376 | 0,120 | 0,220 | 3,127 | 0,002 | 0,313 | 3,192 |
Table 22.
Collinearity diagnostics.
| Dimension | Eigenvalue | Condition Index | Variance Proportions | ||||
| (Constant) | WGI | EPI | SDG | LPI | |||
| 1 | 4,894 | 1,000 | 0,00 | 0,00 | 0,00 | 0,00 | 0,00 |
| 2 | 0,067 | 8,556 | 0,10 | 0,13 | 0,00 | 0,01 | 0,03 |
| 3 | 0,021 | 15,269 | 0,02 | 0,00 | 0,49 | 0,00 | 0,49 |
| 4 | 0,013 | 19,119 | 0,06 | 0,76 | 0,35 | 0,01 | 0,48 |
| 5 | 0,004 | 33,385 | 0,83 | 0,10 | 0,15 | 0,98 | 0,00 |
Table 23.
Residual statistics.
| Minimum | Maximum | Mean | Std. Deviation | N | |
| Predicted Value | 7,544 | 100,662 | 54,668 | 22,392 | 123 |
| Residual | -26,422 | 30,524 | -0,000000000000002 | 10,587 | 123 |
| Std. Predicted Value | -2,104 | 2,054 | 0,000 | 1,000 | 123 |
| Std. Residual | -2,455 | 2,836 | 0,000 | 0,983 | 123 |
Table 24.
Correlation coefficients of LPI and the six components of LPI.
| LPI | EFF | QUAL | EASE | COM | FREQ | TR | |||
| LPI | Correlation Coefficient | 1,000 | 0,863** | 0,836** | 0,767** | 0,873** | 0,813** | 0,858** | |
| Sig. (2-tailed) | . | 0,000 | 0,000 | 0,000 | 0,000 | 0,000 | 0,000 | ||
| N | 123 | 123 | 123 | 123 | 123 | 123 | 123 | ||
| EFF | Correlation Coefficient | 0,863** | 1,000 | 0,822** | 0,657** | 0,793** | 0,699** | 0,742** | |
| Sig. (2-tailed) | 0,000 | . | 0,000 | 0,000 | 0,000 | 0,000 | 0,000 | ||
| N | 123 | 123 | 123 | 123 | 123 | 123 | 123 | ||
| QUAL | Correlation Coefficient | 0,836** | 0,822** | 1,000 | 0,649** | 0,803** | 0,682** | 0,739** | |
| Sig. (2-tailed) | 0,000 | 0,000 | . | 0,000 | 0,000 | 0,000 | 0,000 | ||
| N | 123 | 123 | 123 | 123 | 123 | 123 | 123 | ||
| EASE | Correlation Coefficient | 0,767** | 0,657** | 0,649** | 1,000 | 0,682** | 0,668** | 0,696** | |
| Sig. (2-tailed) | 0,000 | 0,000 | 0,000 | . | 0,000 | 0,000 | 0,000 | ||
| N | 123 | 123 | 123 | 123 | 123 | 123 | 123 | ||
| COM | Correlation Coefficient | 0,873** | 0,793** | 0,803** | 0,682** | 1,000 | 0,742** | 0,784** | |
| Sig. (2-tailed) | 0,000 | 0,000 | 0,000 | 0,000 | . | 0,000 | 0,000 | ||
| N | 123 | 123 | 123 | 123 | 123 | 123 | 123 | ||
| FREQ | Correlation Coefficient | 0,813** | 0,699** | 0,682** | 0,668** | 0,742** | 1,000 | 0,771** | |
| Sig. (2-tailed) | 0,000 | 0,000 | 0,000 | 0,000 | 0,000 | . | 0,000 | ||
| N | 123 | 123 | 123 | 123 | 123 | 123 | 123 | ||
| TR | Correlation Coefficient | 0,858** | 0,742** | 0,739** | 0,696** | 0,784** | 0,771** | 1,000 | |
| Sig. (2-tailed) | 0,000 | 0,000 | 0,000 | 0,000 | 0,000 | 0,000 | . | ||
| N | 123 | 123 | 123 | 123 | 123 | 123 | 123 | ||
| **. Correlation is significant at the 0.01 level (2-tailed). | |||||||||
Table 25.
Correlation coefficients of WGI and the six components of WGI.
| WGI CC | WGI GE | WGI PV | WGI RL | WGI RQ | WGI VA | WGI | |||
| WGI | Correlation Coefficient | 0,836** | 0,824** | 0,669** | 0,862** | 0,846** | 0,715** | 1,000 | |
| Sig. (2-tailed) | 0,000 | 0,000 | 0,000 | 0,000 | 0,000 | 0,000 | . | ||
| N | 123 | 123 | 123 | 123 | 123 | 123 | 123 | ||
| WGI CC | Correlation Coefficient | 1,000 | 0,780** | 0,588** | 0,817** | 0,768** | 0,632** | 0,836** | |
| Sig. (2-tailed) | . | 0,000 | 0,000 | 0,000 | 0,000 | 0,000 | 0,000 | ||
| N | 123 | 123 | 123 | 123 | 123 | 123 | 123 | ||
| WGI GE | Correlation Coefficient | 0,780** | 1,000 | 0,582** | 0,816** | 0,792** | 0,572** | 0,824** | |
| Sig. (2-tailed) | 0,000 | . | 0,000 | 0,000 | 0,000 | 0,000 | 0,000 | ||
| N | 123 | 123 | 123 | 123 | 123 | 123 | 123 | ||
| WGI PV | Correlation Coefficient | 0,588** | 0,582** | 1,000 | 0,600** | 0,581** | 0,520** | 0,669** | |
| Sig. (2-tailed) | 0,000 | 0,000 | . | 0,000 | 0,000 | 0,000 | 0,000 | ||
| N | 123 | 123 | 123 | 123 | 123 | 123 | 123 | ||
| WGI RL | Correlation Coefficient | 0,817** | 0,816** | 0,600** | 1,000 | 0,812** | 0,633** | 0,862** | |
| Sig. (2-tailed) | 0,000 | 0,000 | 0,000 | . | 0,000 | 0,000 | 0,000 | ||
| N | 123 | 123 | 123 | 123 | 123 | 123 | 123 | ||
| WGI RQ | Correlation Coefficient | 0,768** | 0,792** | 0,581** | 0,812** | 1,000 | 0,631** | 0,846** | |
| Sig. (2-tailed) | 0,000 | 0,000 | 0,000 | 0,000 | . | 0,000 | 0,000 | ||
| N | 123 | 123 | 123 | 123 | 123 | 123 | 123 | ||
| WGI VA | Correlation Coefficient | 0,632** | 0,572** | 0,520** | 0,633** | 0,631** | 1,000 | 0,715** | |
| Sig. (2-tailed) | 0,000 | 0,000 | 0,000 | 0,000 | 0,000 | . | 0,000 | ||
| N | 123 | 123 | 123 | 123 | 123 | 123 | 123 | ||
| **. Correlation is significant at the 0.01 level (2-tailed). | |||||||||
Table 26.
Coefficients FCM.
| Relationship | Method | Coefficient (Standardized β or Kendall’s tau-b) |
| EPI → LPI | Model 1 Linear Regression |
0.684 |
| SDG → LPI | Model 2 Linear Regression |
0.686 |
| WGI → LPI | Model 3 Linear Regression |
0.823 |
| LPI → GDP | Model 4 Linear Regression |
0.220 |
| EPI → GDP | Model 4 Linear Regression |
0.207 |
| SDG → GDP | Model 4 Linear Regression |
0.215 |
| WGI → GDP | Model 4 Linear Regression |
0.355 |
| EFF → LPI | Correlation Kendall’s tau-b | 0.863 |
| QUAL → LPI | Correlation Kendall’s tau-b | 0.836 |
| EASE → LPI | Correlation Kendall’s tau-b | 0.767 |
| COM → LPI | Correlation Kendall’s tau-b | 0.873 |
| FREQ → LPI | Correlation Kendall’s tau-b | 0.813 |
| TR → LPI | Correlation Kendall’s tau-b | 0.858 |
| WGI CC → WGI | Correlation Kendall’s tau-b | 0.836 |
| WGI GE → WGI | Correlation Kendall’s tau-b | 0.824 |
| WGI PV → WGI | Correlation Kendall’s tau-b | 0.669 |
| WGI RL → WGI | Correlation Kendall’s tau-b | 0.862 |
| WGI RQ → WGI | Correlation Kendall’s tau-b | 0.846 |
| WGI VA → WGI | Correlation Kendall’s tau-b | 0.715 |
Disclaimer/Publisher’s Note: The statements, opinions and data contained in all publications are solely those of the individual author(s) and contributor(s) and not of MDPI and/or the editor(s). MDPI and/or the editor(s) disclaim responsibility for any injury to people or property resulting from any ideas, methods, instructions or products referred to in the content. |
© 2025 by the authors. Licensee MDPI, Basel, Switzerland. This article is an open access article distributed under the terms and conditions of the Creative Commons Attribution (CC BY) license (http://creativecommons.org/licenses/by/4.0/).
Copyright: This open access article is published under a Creative Commons CC BY 4.0 license, which permit the free download, distribution, and reuse, provided that the author and preprint are cited in any reuse.


