Submitted:
07 November 2025
Posted:
10 November 2025
You are already at the latest version
Abstract
Understanding wildfire dynamics and their climatic and socio-economic drivers is es-sential for effective fire management in Southeastern Europe. This study presents the first long-term assessment of wildfire trends across different land-cover types in Bul-garia and the wider Balkan region using the FireCCI51 burned area dataset (2001–2022). Burned area patterns were analyzed in relation to temperature, relative humid-ity, precipitation, the Angström Index, and Vapor Pressure Deficit (VPD). Croplands accounted for 96.4% of the total burned area (4.9 Mha), while wildfires in forests, grasslands, shrublands, and wetlands represented 3.6%. A declining trend in burned area was observed across all land-cover types, particularly in croplands and forests, likely linked to rural depopulation, agricultural land abandonment, and reduced use of fire in land management. Burned area correlated positively with temperature (r = 0.37–0.53) and VPD (r = 0.40–0.53), and negatively with relative humidity (r = –0.48 to –0.55) and the Angström Index, confirming the role of atmospheric dryness in fire oc-currence. Fire activity peaked in August, coinciding with maximum VPD and mini-mum Angström Index values. These findings highlight the combined influence of cli-matic aridity and socio-economic change on fire regimes and underscore the value of long-term satellite monitoring for adaptive fire management in the Balkans.
Keywords:
wildfires
; firecci51
; land cover
; vapor pressure deficit
; Angström index
1. Introduction
Wildfires are among the most significant ecological disturbances shaping terrestrial ecosystems, influencing vegetation composition, soil processes, and carbon cycling [1,2]. Their frequency and severity are increasingly driven by the combined effects of climate change, land-use dynamics, and socio-economic transformation [3,4]. Across Europe, particularly in the Mediterranean and Balkan regions, prolonged droughts, heatwaves, and changing human activity patterns have intensified the complexity of fire regimes [5,6].
Bulgaria, located in the southeastern part of the Balkan Peninsula, represents a climatic and ecological transition zone between continental and Mediterranean influences. This diversity in topography and climate results in highly variable vegetation and fire regimes. Historically, most wildfires in the country have been human-induced [7], mainly associated with agricultural residue burning, grazing management, and forestry operations. However, since the 1990s, Bulgaria has undergone profound socio-economic transformations linked to rural depopulation, agricultural land abandonment, and the restructuring of land ownership and management systems [8,9].
Bulgarian National Statistical Institute is having archives of population census from 1880 until 2021, when the last statistical information is published [10,11,12]. Based on these reports the Bulgarian population in 1985 is about 8,9 million people, whereas in 2021 is 6.519.789. This is a decrease of about 11% in comparison to the previous population census in 2011 [12]. These processes have led to a reduction in intentional burning and fewer human ignitions, while simultaneously increasing the extent of unmanaged vegetation and secondary forest regrowth. The combination of declining agricultural activity and changing land use has significantly altered fire dynamics, particularly in croplands and lowland forest areas [3,13]. At the same time, climate change has intensified the environmental conditions conducive to wildfires [14]. Rising temperatures, increased vapor pressure deficit (VPD), and prolonged summer droughts have decreased fuel moisture content and increased fire danger across Southeastern Europe [4,15]. Understanding the interactions between these climatic and socio-economic factors is therefore crucial for developing effective fire management and adaptation strategies [16]. However, despite the growing availability of global satellite-based fire datasets [17,18,19], long-term and spatially explicit analyses of wildfire activity in Bulgaria and the broader Balkan region remain limited.
Recent advances in Earth observation have made it possible to monitor burned areas consistently over large spatial and temporal scales [18,19]. Among the most widely used datasets are the FireCCI51 product developed under the European Space Agency’s Climate Change Initiative (CCI) [19] and the MODIS MCD64A1 Collection 6 product developed by NASA [18]. FireCCI51 provides global monthly burned area data at 250 m spatial resolution from 2001 onward, derived from MODIS Terra surface reflectance data, and includes vegetation and land-cover information from the ESA CCI Land Cover dataset. MODIS MCD64A1 C6, in turn, offers global burned area mapping at 500 m resolution using data from both Terra and Aqua satellites, employing a hybrid algorithm that integrates active fire detections and surface reflectance changes These products offer extensive coverage spanning from 2000 to the present, making them valuable resources for examining both historical and contemporary fire dynamics [20] and particularly valuable for regions like Bulgaria, where ground-based fire statistics are often incomplete or inconsistent.
Integrating these satellite-based observations [21] with meteorological and socio-economic data provides an opportunity to better understand the long-term relationships between fire activity, climate variability, and human influence [4]. By examining temporal and spatial wildfire trends across different land-cover types and relating them to indicators such as the Angström Index [22] and VPD [23], this study contributes to the understanding of how climatic aridity and socio-economic change jointly shape fire regimes in Bulgaria. This research represents the first comprehensive, long-term analysis of wildfire dynamics across multiple land-cover types in Bulgaria and the Balkan region, providing a baseline for future studies on fire–climate–society interactions and for the development of regionally tailored fire management strategies.
2. Materials and Methods
2.1. Study Area
Bulgaria is located in Southeastern Europe, occupying the eastern part of the Balkan Peninsula between latitudes 41°14′–44°13′ N and longitudes 22°21′–28°37′ E, covering an area of approximately 111,000 km² (Figure 2). The country exhibits diverse topographic and climatic conditions that strongly influence vegetation patterns and wildfire regimes. The relief is characterized by a complex combination of lowlands, plains, plateaus, and mountain ranges, including the Balkan Mountains (Stara Planina), the Rhodope Mountains, and the Rila and Pirin massifs, which contain the highest peaks in the region.
Bulgaria’s climate is transitional between continental and Mediterranean, with considerable spatial variability. The northern regions experience a temperate-continental climate with cold winters and hot summers, while southern areas are influenced by the Mediterranean climate, characterized by mild, wet winters and hot, dry summers. The mean annual temperature ranges from 5–7 °C in mountainous areas to 12–13 °C in the lowlands, and annual precipitation varies between 500–1,200 mm, depending on altitude and exposure.
Vegetation cover reflects this climatic and topographic heterogeneity. Forests occupy around 38% of the national territory, dominated by broadleaf species such as Fagus sylvatica, Quercus spp., and Carpinus spp., and conifers such as Pinus sylvestris and Picea abies in higher elevations. Grasslands, shrublands, and agricultural areas also constitute significant land cover types, particularly in lowland and valley regions.
Wildfires are a recurrent disturbance in Bulgaria, primarily occurring during the dry summer months. Fire activity varies geographically, being more frequent in southern and southwestern regions where Mediterranean climatic influences prevail. Anthropogenic factors—such as land abandonment, due to population decrease [10,11,12] (Figure 1), agricultural burning, and changes in forest management—also contribute significantly to the ignition and spread of fires.
2.2. Land Cover
The FireCCI51 burned area product identifies burned regions based on the ESA Climate Change Initiative (CCI) Land Cover classification system. The land cover characteristics of the study area were evaluated using the same classification framework. The ESA CCI Land Cover (CCI-LC) project provides consistent, global land cover maps at a spatial resolution of 300 meters, produced annually for the period 1992–2015 [24]. The CCI-LC dataset includes 38 land cover classes worldwide, of which 24 are represented in Bulgaria as of 2015 (Figure 2, Table 1).
The land area of Bulgaria is about 11.1 million hectares and 56.3% Cropland (Grid code (GC): 10, 11, 12, 20, 30 and 40), 38.2% Forest (GC: 60, 61, 70, 80, 90 and 100), 1.8% Herbaceous vegetation (Grassland) (GC: 110, 130, 150 and 153), 0.2% Shrubland (GC: 120 and 122), 0.1% Wetland (GC: 180) and 3.5% Other Land cover (GC: 190, 200, 201, 202 and 210) (Figure 2, Table 1).
2.2. Burned Area Information
Wildfire activity across Bulgaria was analyzed using the FireCCI51 burned area (BA) product [19], developed within the European Space Agency’s (ESA) Climate Change Initiative (CCI) program. The FireCCI51 dataset provides consistent, long-term information on global burned areas for the period 2001–2022, enabling detailed assessment of spatio-temporal fire dynamics. The product is primarily based on MOD09GQ Collection 6 imagery acquired by the MODIS sensor onboard the Terra satellite, which delivers daily surface reflectance data in the red (0.62–0.67 μm) and near-infrared (0.84–0.88 μm) spectral bands at a 250 m spatial resolution.
Each burned pixel in the FireCCI51 dataset is accompanied by land cover information derived from the CCI Land Cover (LC) products, allowing for the identification of affected vegetation and land use types. The monthly BA pixel products were obtained from the Centre for Environmental Data Analysis (CEDA) archive for each year between 2001 and 2022 [17]. For spatial analysis, all monthly raster datasets were clipped to the administrative boundary of Bulgaria. The clipped rasters were subsequently converted into polygon shapefiles, where burned area extent was quantified based on the land cover grid codes.
In addition, the yearly burned area data for Bulgaria from the European Forest Fire Information System (EFFIS) were downloaded [25] to compare with the FireCCI51 burned area dataset. The EFFIS dataset covers the period 2006–2022. Burned area information for 2005 and earlier years was not available in the EFFIS database [5].
All geospatial processing, including data extraction, overlay, and area calculations, was performed in ArcGIS® 10.2 (ESRI, Redlands, CA, USA). The resulting datasets were used to derive annual and multi-year statistics of burned area distribution and to explore its relationships with climatic variables.
2.3. Climatic Data
Climate data were sourced from the Bulgarian State Meteorological Service, covering the period from 2001 to 2022. The dataset comprises monthly records of air temperature (°C), relative humidity (%), and rainfall (mm) from four representative stations located in Sliven, Sandanski, Lovech, and Kurjali for the study area. For the analysis, average values across all stations were calculated. These mean air temperature and relative humidity values were then used to compute the Angström index and vapor pressure deficit (VPD).
The Angström Index is simple and uses only temperature and relative humidity in its calculation. This index provides an indication of fire risk and danger potential [26,27]. The Angström Index is calculated according to formula [22] (1).
where:
I = Angström Index, R = Relative humidity (%) and T = Air Temperature (°C)
The interpretation of this index is:
> 4.0 Fire occurrence unlikely,
4.0 – 2.5 Fire conditions unfavorable,
2.5 – 2.0 Fire conditions favorable,
< 2.0 Fire occurrence very likely,
The Angström Index is a widely used index in determining the relationship between long-term meteorological data and wildfires Vapor pressure deficit (VPD) indicates the difference between the saturation vapor pressure and the actual vapor pressure [28]. VPD (kPa) was calculated with the equation below (2):
Where T is air temperature (ºC) and RH is relative humidity (%). When VPD is high, it means the air is very dry, which accelerates the evaporation of moisture from vegetation and soil [29]. This dries out the forest fuels making them available for ignition[30,31]. High VPD can also lead to increased water stress in plants, making them more prone to wilting. Furthermore, high VPD can exacerbate fire conditions by increasing the rate at which fire spread once ignited [32].
2.3. Statistical Analysis
Correlation and regression analyses were undertaken to investigate the relationships between climatic variables and burned area in different land cover types. Before the analyses, Shapiro-Wilk normality test was conducted on all variables. All statistical analyses were performed using the statistical software SPSS, Version 26.0 [33].
3. Results
3.1. Long-Term Temporal Trends in Climatic Variables in Bulgaria
The analysis of climatic variables in Bulgaria from 2001 to 2022 showed a gradual increase in temperature over the study period (Figure 3a). The mean annual temperature rose from 13.3 °C in 2001 to 14.1 °C in 2022, while the mean maximum temperature increased from 19.3 °C to 20.3 °C. Relative humidity values remained relatively stable, ranging between 48% and 52% (Figure 3a).
The Angström Index exhibited a slight decreasing trend, from approximately 3.9 in the early 2000s to 3.7 in recent years. The vapor pressure deficit (VPD) showed a slight increase after 2010, reaching values above 0.9 kPa in most years and up to 1.0 kPa in some cases (Figure 3b). Annual precipitation varied considerably among years, with a minimum of 408 mm in 2022 and a maximum of 965 mm in 2014 (Figure 3c).
3.2. Long-Term Temporal Trends in Burned Area in Bulgaria
The FireCCI51 dataset analysis for the period 2001–2022 revealed that wildfires occurred across five main land cover (LC) types: forest (LC: 60, 61, 70, 90, 100), grassland (LC: 130), shrubland (LC: 120), wetland (LC: 180), and cropland (LC: 10, 11, 12, 20, 30, 40). The total burned area was estimated at 144,573.5 ha in forests (Figure 4b and Figure 5b), 24,004.2 ha in grasslands (Figure 4c and Figure 5d), 1,225.1 ha in shrublands (Figure 4c and Figure 5c), 492.4 ha in wetlands (Figure 4c and Figure 5e), and 4,902,739.5 ha in croplands (Figure 4a, 5a). Overall, the total burned area detected by FireCCI51 in Bulgaria between 2001 and 2022 was 4,902,739.5 ha, of which 96.38% occurred in croplands.
Fires occurring in forest, grassland, wetland, and shrubland land cover types were classified as “wildfires” in this study. These accounted for a total of 3.62% of all burned areas (Figure 5f). The proportional distribution among these land cover types was 81.50% in forests, 13.52% in grasslands, 0.28% in shrublands, and 4.69% in wetlands. The trends in the burned area indicated that there was a decrease across all land cover types from 2001 to 2022, especially in croplands (Figure 5a) and forested areas (Figure 5b). A peak in the burned area of forested lands was observed in 2007 (Figure 4b), corresponding to an increase in wildfires (Figure 4d).
The wildfire dataset was also compared with the burned area information provided by EFFIS for Bulgaria, available since 2006. The results indicated that the wildfire data were strongly correlated with the EFFIS burned area information for the period 2006–2022 (r = 0.851, p < 0.01) (Figure 4d).
3.3. Long-Term Relationship Between Fire Activity and Climatic Variables
The correlation analysis revealed statistically significant relations between climatic variables and burned area across different land-cover types (p < 0.01; Figure 6). Among the climatic parameters, temperature, maximum temperature, and vapor pressure deficit (VPD) exhibited strong positive correlations with burned area across most vegetation types, whereas relative humidity showed negative associations. Precipitation was weakly related to burned area.
Burned area in cropland was positively correlated with temperature (p = 0.51), maximum temperature (p = 0.52), and VPD (p = 0.53), and negatively correlated with relative humidity (p = −0.55) and the Angström index (p = −0.54). Similar relationships were observed for burned area in forest (p = 0.36) with temperature and (p = 0.38) with maximum temperature, p = −0.48 with relative humidity. In grassland (p = 0.43) with temperature, (p = –0.46) for VPD and (p = −0.55) with relative humidity. Shrubland and wetland showed weaker but still significant positive correlations with thermal and dryness indicators (p = 0.20–0.31), suggesting that these ecosystems are less responsive to interannual climatic variability in fire conditions.
The composite “Wildfires” variable—representing the sum of burned area excluding cropland—displayed positive correlations with temperature (p = 0.36), maximum temperature (p = 0.39), and VPD (p = 0.40), and negative correlations with relative humidity (p = −0.48) and the Angström index (p = −0.41). These findings indicate that higher atmospheric dryness and temperature extremes are the significant drivers of fire extent across natural vegetation types.
Overall, the results demonstrate that wildfire activity across all vegetation types, including cropland, is closely linked to variations in temperature and vapor pressure deficit, while being inversely related to relative humidity. The strength and consistency of these correlations confirm that interannual fluctuations in atmospheric dryness are a dominant control on burned area distribution across the region’s major land-cover types.
3.4. Monthly Wildfire Activity Across Land Cover Types
The monthly distribution of burned areas showed significant correlations between vapor pressure deficit (VPD), Angström index, and burned area across cropland (Figure 7a), forest (Figure 7b), grassland (Figure 7c), shrubland (Figure 7d), and all wildfires combined (Figure 7f), with the exception of wetlands (Figure 7e). Fires primarily occurred from June to November in cropland, forest, shrubland, and grassland land cover types, with peak burned area observed in August (Figure 7a–d), coinciding with the highest VPD values.
Across all land cover types, burned area was positively correlated with VPD, indicating that drier conditions consistently promote fire activity. Conversely, all variables showed negative correlations with the Angström index, suggesting that increased solar radiation and clearer skies—typically associated with lower humidity—may suppress fire spread or coincide with favorable burning conditions. In forest areas, secondary peaks in burned area were visible in March and November (Figure 7b), while in wetlands, the highest burned area occurred in March (Figure 7e).
The majority of burned area in the FireCCI51 dataset was attributed to cropland fires (Figure 5a). Fires in croplands typically began in June and continued through November, a pattern associated with harvesting periods in different regions. Overall, the results highlight August as the critical month for fire risk and emphasize the importance of VPD and Angström index as key indicators of wildfire dynamics.
4. Discussion
The present study demonstrates that wildfire activity in Bulgaria between 2001 and 2022 has been shaped by the combined effects of climate variability and socio-economic transformation. Despite rising temperatures and increasing vapor pressure deficit (VPD), the total burned area—particularly in croplands and forests—has shown a steady decline, which can be affected by the uneven economic development of the state regions and depopulated areas with lower economic wealth [34]. This finding aligns with evidence from other parts of Eastern and Southeastern Europe, suggesting that human-induced changes in land use and rural demography strongly influence fire occurrence [35,36,37].
The use of the FireCCI51 burned area product provided consistent, high-resolution information on fire distribution across multiple land-cover types [19]. Its 250 m resolution and integration of ESA CCI Land Cover data make it particularly suitable for landscape-level analysis of agricultural and forest fires. Comparison with the European Forest Fire Information System (EFFIS) dataset revealed a strong correlation (r = 0.851, p < 0.01), confirming the reliability of FireCCI51 for regional applications.
Previous studies have demonstrated strong agreement between FireCCI51 and MODIS MCD64A1 C6 data at global and continental scales [19,38]. While MCD64A1 C6 offers broader temporal consistency and dual-sensor coverage (Terra + Aqua), FireCCI51 provides enhanced burned area detection in heterogeneous landscapes typical of Bulgaria and similar to north Greece [20]. Future analyses combining both datasets could improve the accuracy of regional burned area estimates and capture smaller agricultural fires that often go undetected by coarser-resolution products.
4.1. Long-Term Burned Area Trends in Bulgaria
The declining burned area observed in Bulgaria reflects significant socio-economic transformations since the 1990s [10,11,12] (Figure 1). Following the transition from state-managed agriculture to a market economy, extensive rural depopulation and land abandonment occurred, especially in mountainous and marginal regions [8,9]. These changes led to a reduction in agricultural burning—a primary ignition source—and a decline in human activity in fire-prone rural landscapes. Consequently, the frequency of small- to medium-scale fires decreased even as climatic conditions became more conducive to fire spread.
However, abandoned lands undergoing secondary succession may accumulate fine and woody fuels over time, potentially increasing the risk of larger and more intense fires under extreme drought events [3]. This duality highlights the complex interplay between human withdrawal and ecological fuel buildup, an emerging challenge across the Balkans and Eastern Europe. Since 2016 in Bulgarian statistics every year extreme fire events started to occur regularly in the summer season [39,40].
The findings in this study underscore the importance of incorporating socio-economic indicators (e.g., population density, agricultural activity, land abandonment rates) into future fire models to better capture the human–climate interactions driving fire regimes. Effective wildfire management in Bulgaria and the Balkans will depend on strategies that address both climatic aridity and the consequences of rural depopulation, including fuel accumulation and landscape homogenization.
4.2. Climatic Drivers and Seasonal Patterns
The results indicate that long-term climate trends are important for wildfire dynamics in Balkan landscapes. The correlations between burned area, temperature, and VPD—along with the negative relationships with relative humidity and the Angström Index—confirm that atmospheric dryness remains the primary climatic driver of wildfire activity in Bulgaria (Figure 6). Higher VPD is associated with increased fire activity and similar results were obtained in different landscapes [4,30,31].
Seasonal analysis showed that fire occurrence peaks in August, coinciding with maximum VPD and minimum Angström Index values, typical of Mediterranean–continental transition climates (Figure 7). The presence of secondary peaks in March and November, especially in forest ecosystems, suggests continuing agricultural or prescribed burning practices during transitional seasons. The forested areas in Bulgaria are predominantly covered by broadleaved deciduous trees (Table 1). Fires within these land cover types can occur during autumn and winter (Figure 7b). During the summer months, the presence of green herbaceous and woody vegetation in the understory and sub-canopy layers of forests reduces the amount of dry combustible material, while higher relative humidity contributes to greater fuel moisture content [29,41]. However, as autumn approaches, the leaves of deciduous trees dry and fall, and the herbaceous plants on the forest floor also desiccate, resulting in an accumulation of dead combustible material [26].
During autumn and winter, the occurrence of foehn winds can further increase air temperature and decrease relative humidity, leading to the rapid drying of forest floor fuels and an elevated fire risk. Due to the short duration of foehn wind events, fires tend to occur within a brief period of time (typically 3–5 days). Considering that the values used in the analyses are based on monthly averages, the discrepancies observed in the graphs (Figure 7b and Figure 7f) are therefore understandable. To achieve a more accurate interpretation of this relationship, the use of weekly average meteorological data would be necessary.
5. Conclusions
This study provides the first comprehensive assessment of wildfire dynamics and their climatic and socio-economic drivers in Bulgaria using the FireCCI51 burned area dataset for the period 2001–2022. The analysis revealed a significant decline in total burned area across all land-cover types, particularly in croplands and forests. This underscores the critical influence of socio-economic factors—especially rural depopulation, agricultural land abandonment, and reduced use of fire in land management—on shaping contemporary fire regimes in Bulgaria and the wider Balkan region. However, intense and big fire occurrences are increasing especially in the coniferous areas.
Fire activity showed strong positive correlations with temperature and negative correlations with relative humidity, highlighting atmospheric dryness as a dominant climatic control on fire occurrence. Peak fire activity was observed in August, coinciding with the driest and hottest period of the year.
The agreement between FireCCI51 and EFFIS datasets confirms the reliability of satellite-derived burned area information for long-term fire monitoring in Southeastern Europe. These findings emphasize the importance of integrating remote sensing data with climatic and socio-economic indicators to better understand the coupled human–climate dynamics influencing regional fire regimes.
Future research should focus on combining multiple burned area products with spatially explicit socio-economic datasets to assess how demographic shifts, land-use changes, and agricultural transitions interact with climate-induced aridity to alter fire risk. The results provide a foundation for developing adaptive, data-driven fire management strategies that address both environmental and societal dimensions of wildfire risk in Bulgaria and the broader Balkan landscape.
Author Contributions
Conceptualization, N.D. and K.A.C.; methodology, N.D. and K.A.C.; statistical analysis, N.D. and K.A.C.; writing—original draft preparation, N.D. and K.A.C.; writing—review and editing, N.D. and K.A.C.; visualization N.D. and K.A.C.; project administration, N.D; funding acquisition, N.D. Two authors have read and agreed to the published version of the manuscript.
Funding
This work is partially supported by the National Scientific fund program for COST actions support with grant number: КП-06-КОСТ/23 and Centre of Competence on Digitization of the economy in an environment of Big Data-second stage, established under Grant No. BG16RFPR002-1.014-0013-C01, financed by the Science and Education for Smart Growth Operational Program and co-financed by the European Union through the European Structural and Investment Funds.
Data Availability Statement
The data that support the findings of this study are available from the corresponding author, [N.D.], upon reasonable request.
Acknowledgments
This work is partially supported by the National Scientific fund program for COST actions support with grant number: КП-06-КОСТ/23 and Centre of Competence on Digitisation of the economy in an environment of Big Data-second stage, established under Grant No. BG16RFPR002-1.014-0013-C01, financed by the Science and Education for Smart Growth Operational Program and co-financed by the European Union through the European Structural and Investment Funds.
Conflicts of Interest
The authors declare no conflicts of interest.
References
- Bowman, D.M.J.S.; Kolden, C.A.; Abatzoglou, J.T.; Johnston, F.H.; van der Werf, G.R.; Flannigan, M. Vegetation fires in the Anthropocene. Nature Reviews Earth & Environment 2020, 1, 500-515. [CrossRef]
- Hardesty, J.; L., M.R.; W., F. Fire, ecosystems, and people: a preliminary assessment of fire as a global conservation issue. The George Wright Forum 2005, 22, 78-87.
- Coskuner, K.A. Land use/land cover change as a major driver of current landscape flammability in Eastern Mediterranean region: A case study in Southwestern Turkey Bosque (Valdivia) 2022, 43, 157-167. [CrossRef]
- Coskuner, K.A.; Harman, I.; Zeynalov, S.; Bilgili, E. Exploring long-term wildfire dynamics across land cover types in relation to climate in the eastern mediterranean landscapes. Sumar List 2025, 149, 1-26.
- San-Miguel-Ayanz, J.; Durrant, T.; Boca, R.; Maianti, P.; Libertà, G.; Jacome Felix Oom, D.; Branco, A.; De Rigo, D.; Suarez-Moreno, M.; Ferrari, D.; et al. Advance report on forest fires in Europe, Middle East and North Africa 2023; European, Commission Joint Research, Centre Publications Office of the European Union: 2024.
- Turco, M.; Jerez, S.; Augusto, S.; Tarín-Carrasco, P.; Ratola, N.; Jiménez-Guerrero, P.; Trigo, R.M. Climate drivers of the 2017 devastating fires in Portugal. Scientific Reports 2019, 9, 13886. [CrossRef]
- Borisova, B.; Todorova, E.; Ihtimanski, I.; Glushkova, M.; Zhiyanski, M.; Georgieva, M.; Stoyanov, T.; Bozhilova, M.; Atanasova, M.; Dimitrov, S. Wildfire risk assessment and mapping – an approach for Natura 2000 forest sites. Trees, Forests and People 2024, 16, 100532. [CrossRef]
- Terres, J.M.; Scacchiafichi, L.N.; Wania, A.; Ambar, M.; Anguiano, E.; Buckwell, A.; Coppola, A.; Gocht, A.; Källström, H.N.; Pointereau, P.; et al. Farmland abandonment in Europe: Identification of drivers and indicators, and development of a composite indicator of risk. Land Use Policy 2015, 49, 20-34. [CrossRef]
- Ustaoglu, E.; Collier, M.J. Farmland abandonment in Europe: an overview of drivers, consequences, and assessment of the sustainability implications. Environmental Reviews 2018, 26, 396-416. [CrossRef]
- NSI. National Statistical Institute of Bulgaria. Population and Housing Census 2011 – Final results and methodological report. ofia: NSI. Retrieved from https://www.nsi.bg/census2011/PDOCS2/Census2011final_en.pdf. 2012.
- NSI. National Statistical Institute of Bulgaria. Statistical Reference Book 2021 – Population (Historical series 1880–2021). Sofia: NSI. Retrieved from https://www.nsi.bg/en/content/6703/statistical-reference-book-2021. 2021.
- NSI. National Statistical Institute of Bulgaria. Post-Census Revision of Population Data 2012–2021. Sofia: NSI. Retrieved from https://www.nsi.bg/sites/default/files/files/pressreleases/Population_census2021_rev_EN.pdf. 2023.
- Vilar, L.; Camia, A.; San-Miguel-Ayanz, J.; Martín, M.P. Modeling temporal changes in human-caused wildfires in Mediterranean Europe based on Land Use-Land Cover interfaces. Forest Ecol Manag 2016, 378, 68-78. [CrossRef]
- IPCC. Climate Change 2023: Synthesis Report. Contribution of Working Groups I, II and III to the Sixth Assessment Report of the Intergovernmental Panel on Climate Change [Core Writing Team, H. Lee and J. Romero (eds.)]. IPCC, Geneva, Switzerland, pp. 35-115. 2023. [CrossRef]
- Rodrigues, M.; Camprubí, A.C.; Balaguer-Romano, R.; Ruffault, J.; Fernandes, P.M.; de Dios, V.R. Drivers and implications of the extreme 2022 wildfire season in Southwest Europe. bioRxiv 2022, 2022.2009.2029.510113. [CrossRef]
- Bilgili, E.; Kucuk, O.; Saglam, B.; Coskuner, K.A. Mega Forest Fires: Causes, Organization and Management. In Forest Fires: Causes, Effects, Monitoring, Precautions and Rehabilitation Activities, Kavzaoglu, T., Ed.; Turkish Academy of Sciences. : Ankara, 2021; pp. 1-23. [CrossRef]
- CEDA. The Centre for Environmental Data Analysis (CEDA) https://archive.ceda.ac.uk/. Available online: (accessed on.
- Giglio, L.; Boschetti, L.; Roy, D.P.; Humber, M.L.; Justice, C.O. The Collection 6 MODIS burned area mapping algorithm and product. Remote Sens Environ 2018, 217, 72-85. [CrossRef]
- Lizundia-Loiola, J.; Otón, G.; Ramo, R.; Chuvieco, E. A spatio-temporal active-fire clustering approach for global burned area mapping at 250 m from MODIS data. Remote Sens Environ 2020, 236, 111493. [CrossRef]
- Katagis, T.; Gitas, I.Z. Assessing the Accuracy of MODIS MCD64A1 C6 and FireCCI51 Burned Area Products in Mediterranean Ecosystems. Remote Sens-Basel 2022, 14, 602. [CrossRef]
- Alonso-Canas, I.; Chuvieco, E. Global burned area mapping from ENVISAT-MERIS and MODIS active fire data. Remote Sens Environ 2015, 163, 140-152. [CrossRef]
- Angström, A. Riskern for skogsbrand och deras beroende av vtlder och klimat. Svenska Skogsvardsforeningens Tidskrift 1942, 4, 323-343.
- Sedano, F.; Randerson, J.T. Multi-scale influence of vapor pressure deficit on fire ignition and spread in boreal forest ecosystems. Biogeosciences 2014, 11, 3739-3755. [CrossRef]
- ESA. Land Cover CCI Product User Guide Version 2. Tech. Rep. (2017). Available at: http://maps.elie.ucl.ac.be/CCI/viewer/download/ESACCI-LC-Ph2-PUGv2_2.0.pdf. 2017.
- EFFIS. EFFIS Annual Statistics for Bulgaria. https://forest-fire.emergency.copernicus.eu/apps/effis.statistics/estimates/ 2025.
- Coskuner, K.A. Assessing Forest Fires in The North Eastern Anatolia with Long Term Meteorological Parameters. Journal of Natural Hazards and Environment 2021, 7, 374 - 381. [CrossRef]
- Pérez-Sánchez, J.; Senent-Aparicio, J.; Díaz-Palmero, J.M.; Cabezas-Cerezo, J. A comparative study of fire weather indices in a semiarid south-eastern Europe region. Case of study: Murcia (Spain). Sci Total Environ 2017, 590-591, 761-774. [CrossRef]
- Bonan, G. Ecological Climatology; Cambridge University Press: 2008; p. 201.
- Bilgili, E.; Coskuner, K.A.; Usta, Y.; Saglam, B.; Kucuk, O.; Berber, T.; Goltas, M. Diurnal surface fuel moisture prediction model for Calabrian pine stands in Turkey. iForest - Biogeosciences and Forestry 2019, 12, 262-271. [CrossRef]
- Mueller, S.E.; Thode, A.E.; Margolis, E.Q.; Yocom, L.L.; Young, J.D.; Iniguez, J.M. Climate relationships with increasing wildfire in the southwestern US from 1984 to 2015. Forest Ecol Manag 2020, 460, 117861. [CrossRef]
- Rao, K.; Williams, A.P.; Diffenbaugh, N.S.; Yebra, M.; Konings, A.G. Plant-water sensitivity regulates wildfire vulnerability. Nature Ecology & Evolution 2022, 6, 332-339. [CrossRef]
- Seager, R.; Hooks, A.; Williams, A.P.; Cook, B.; Nakamura, J.; Henderson, N. Climatology, Variability, and Trends in the U.S. Vapor Pressure Deficit, an Important Fire-Related Meteorological Quantity. Journal of Applied Meteorology and Climatology 2015, 54, 1121-1141. [CrossRef]
- SPSS, I.C. IBM SPSS Statistics for Windows, Version 26.0, IBM Corp.: Armonk, NY, 2019.
- NSI. National Statistical Institute of Bulgaria. Gross domestic product (GDP) – regional level in 2023. Available from https://www.nsi.bg/en/content/22135/gross-domestic-product-gdp-regional-level-2023. 2024.
- EAA. European Environment Agency. Nature-based solutions for fire-resilient European forests. EEA Briefing. Link: https://www.eea.europa.eu/en/analysis/publications/nature-based-solutions-for-fire-resilient-european-forests. 2025.
- Fayet, C.M.J.; Verburg, P.H. Modelling opportunities of potential European abandoned farmland to contribute to environmental policy targets. CATENA 2023, 232, 107460. [CrossRef]
- Graus, S.; Ferreira, T.M.; Vasconcelos, G.; Ortega, J. Changing Conditions: Global Warming-Related Hazards and Vulnerable Rural Populations in Mediterranean Europe. Urban Science 2024, 8. [CrossRef]
- Boschetti, L.; Roy, D.P.; Giglio, L.; Huang, H.; Zubkova, M.; Humber, M.L. Global validation of the collection 6 MODIS burned area product. Remote Sens Environ 2019, 235, 111490. [CrossRef]
- WWF. World Wide Fund for Nature (WWF). Analysis of the situation with forest fires in Bulgaria, 2025. https://wwfeu.awsassets.panda.org/downloads/fire-survey-wwf_28-03-25.pdf. 2025.
- BG, P.o. Parliament of the Republic of Bulgaria (Parliament of BG). Report – Response to forest fires in national parks, nature parks, and reserves (GD PBZN–MVR). https://www.parliament.bg/pub/press/Doklad.pdf. 2025.
- Bilgili, E.; Coskuner, K.A.; Usta, Y.; Goltas, M. Modeling surface fuels moisture content in Pinus brutia stands. J Forestry Res 2019, 30, 575-587. [CrossRef]
Figure 1.
Bulgarian population chart based on the National Statistical Institute reports [10,11,12].
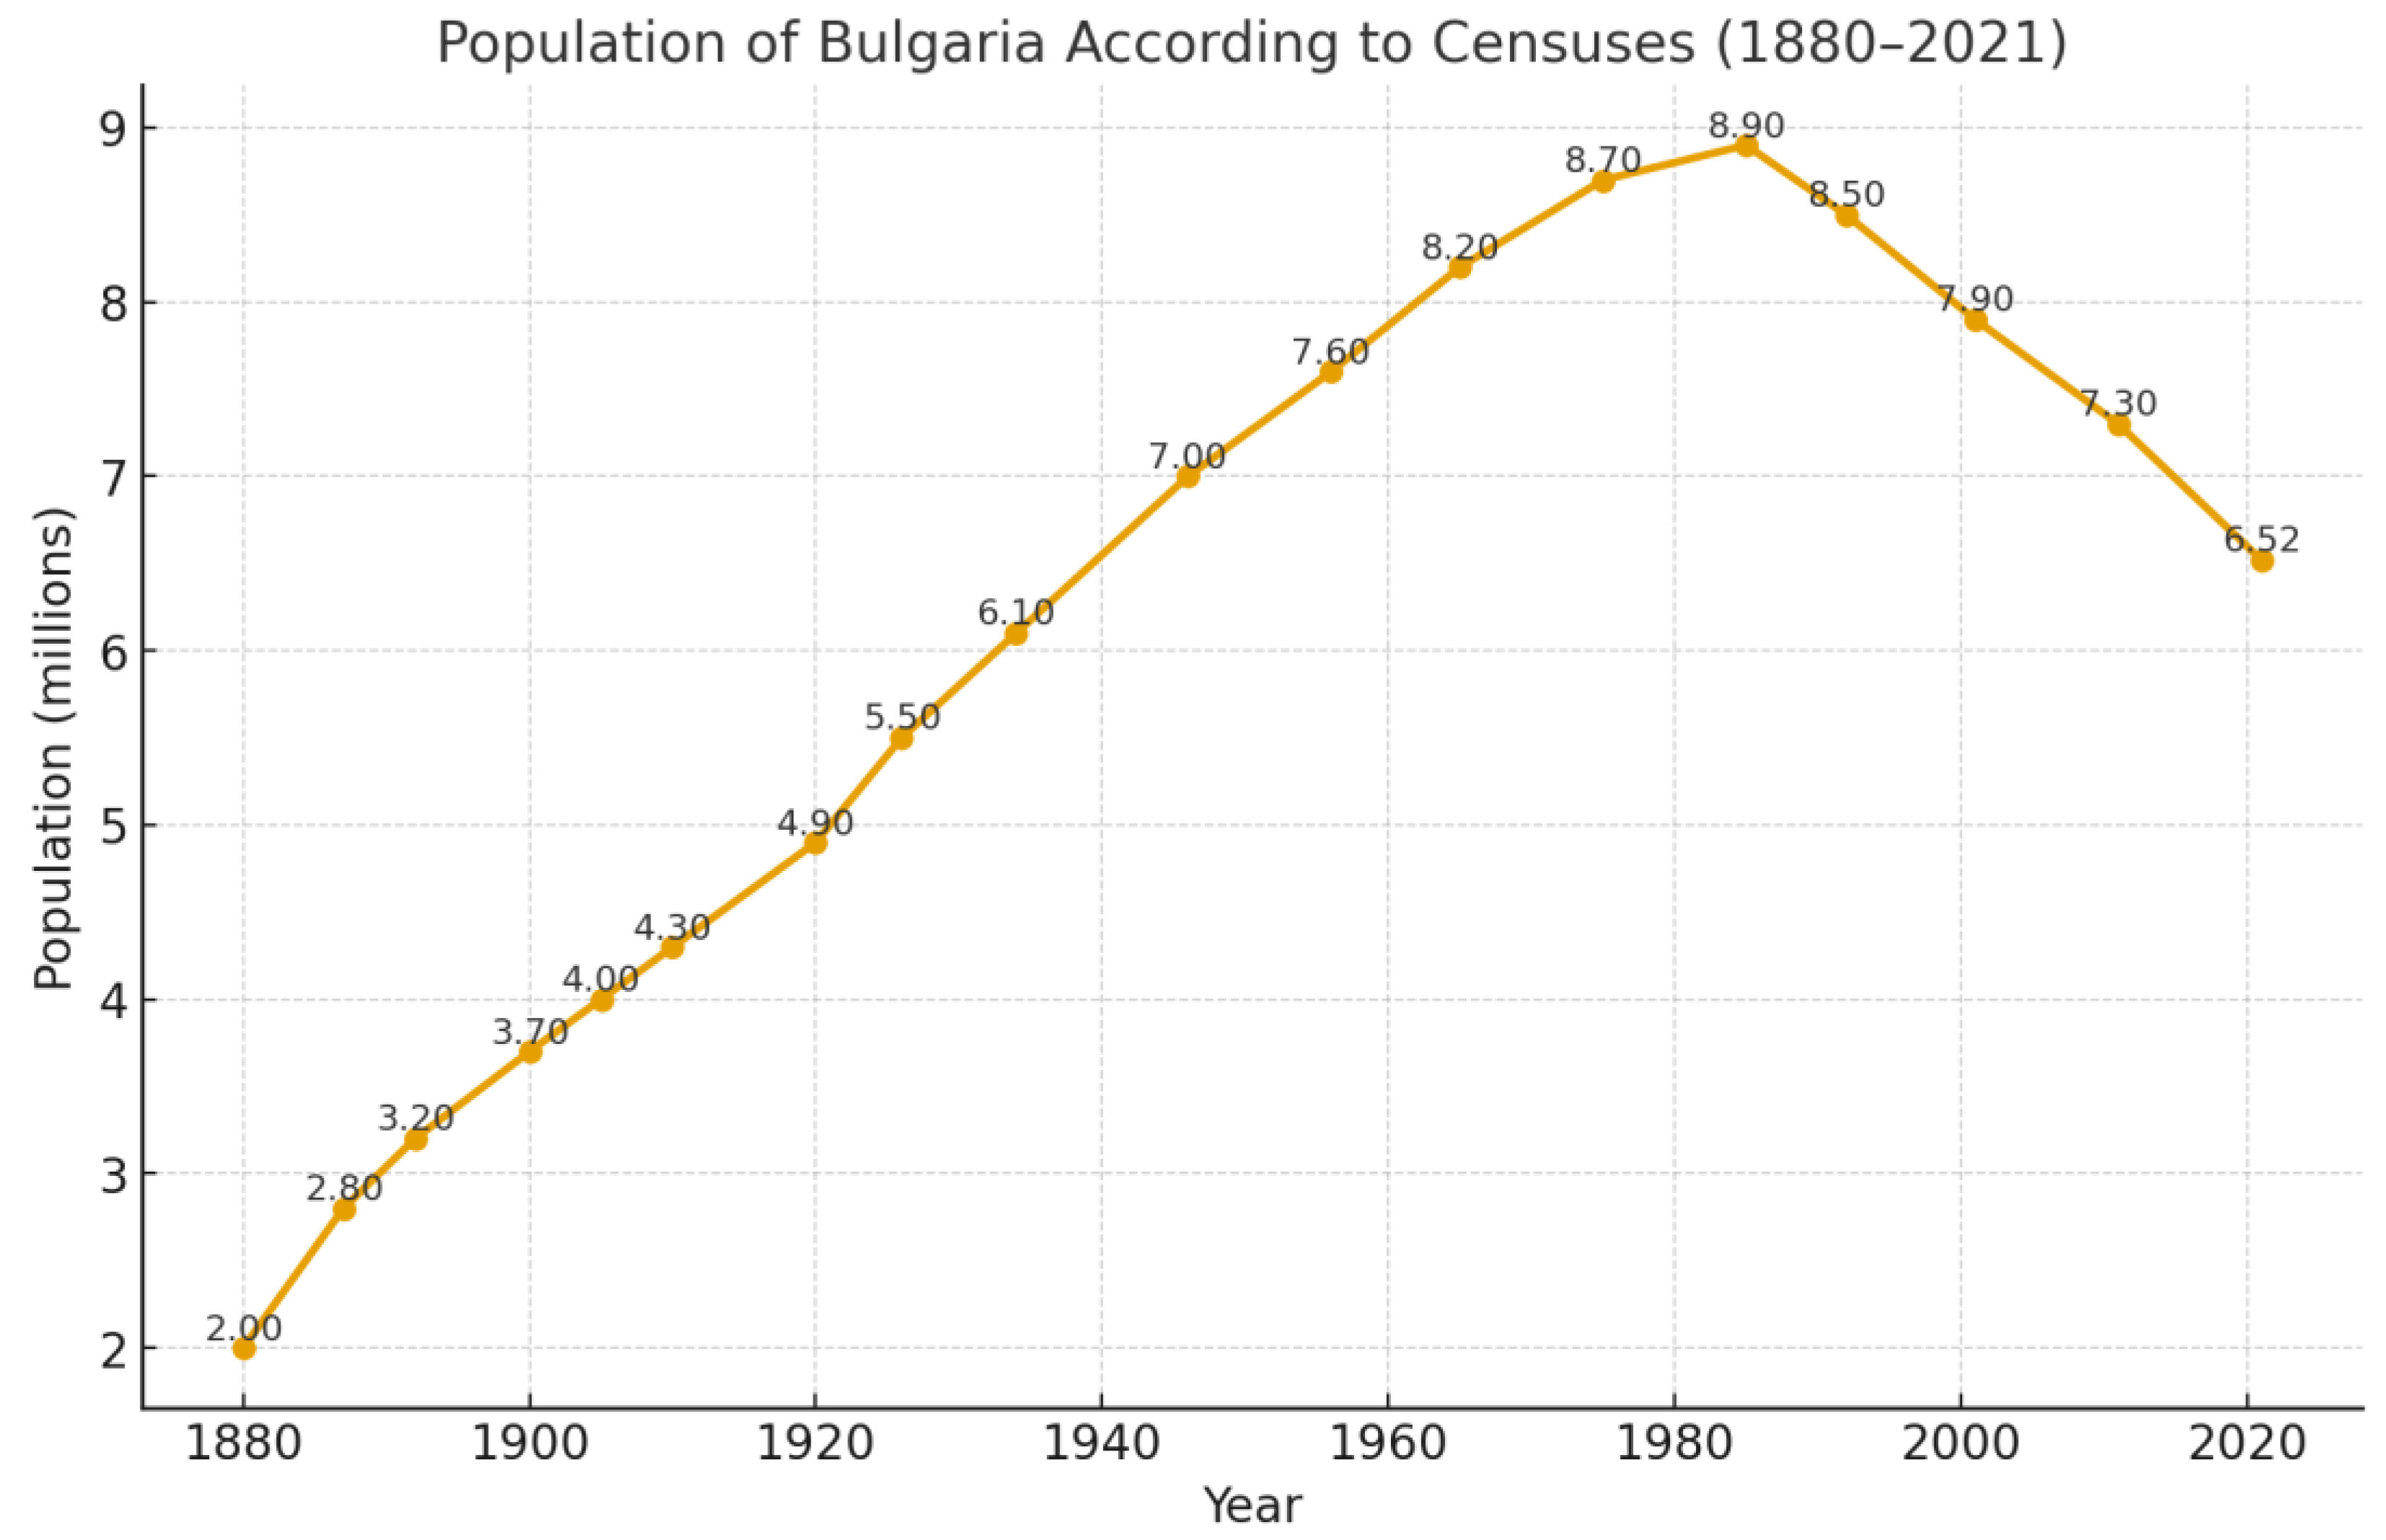
Figure 2.
The location and land cover types according to the ESA CCI Land Cover classification of the study site (http://maps.elie.ucl.ac.be/CCI/viewer/index.html).
Figure 2.
The location and land cover types according to the ESA CCI Land Cover classification of the study site (http://maps.elie.ucl.ac.be/CCI/viewer/index.html).
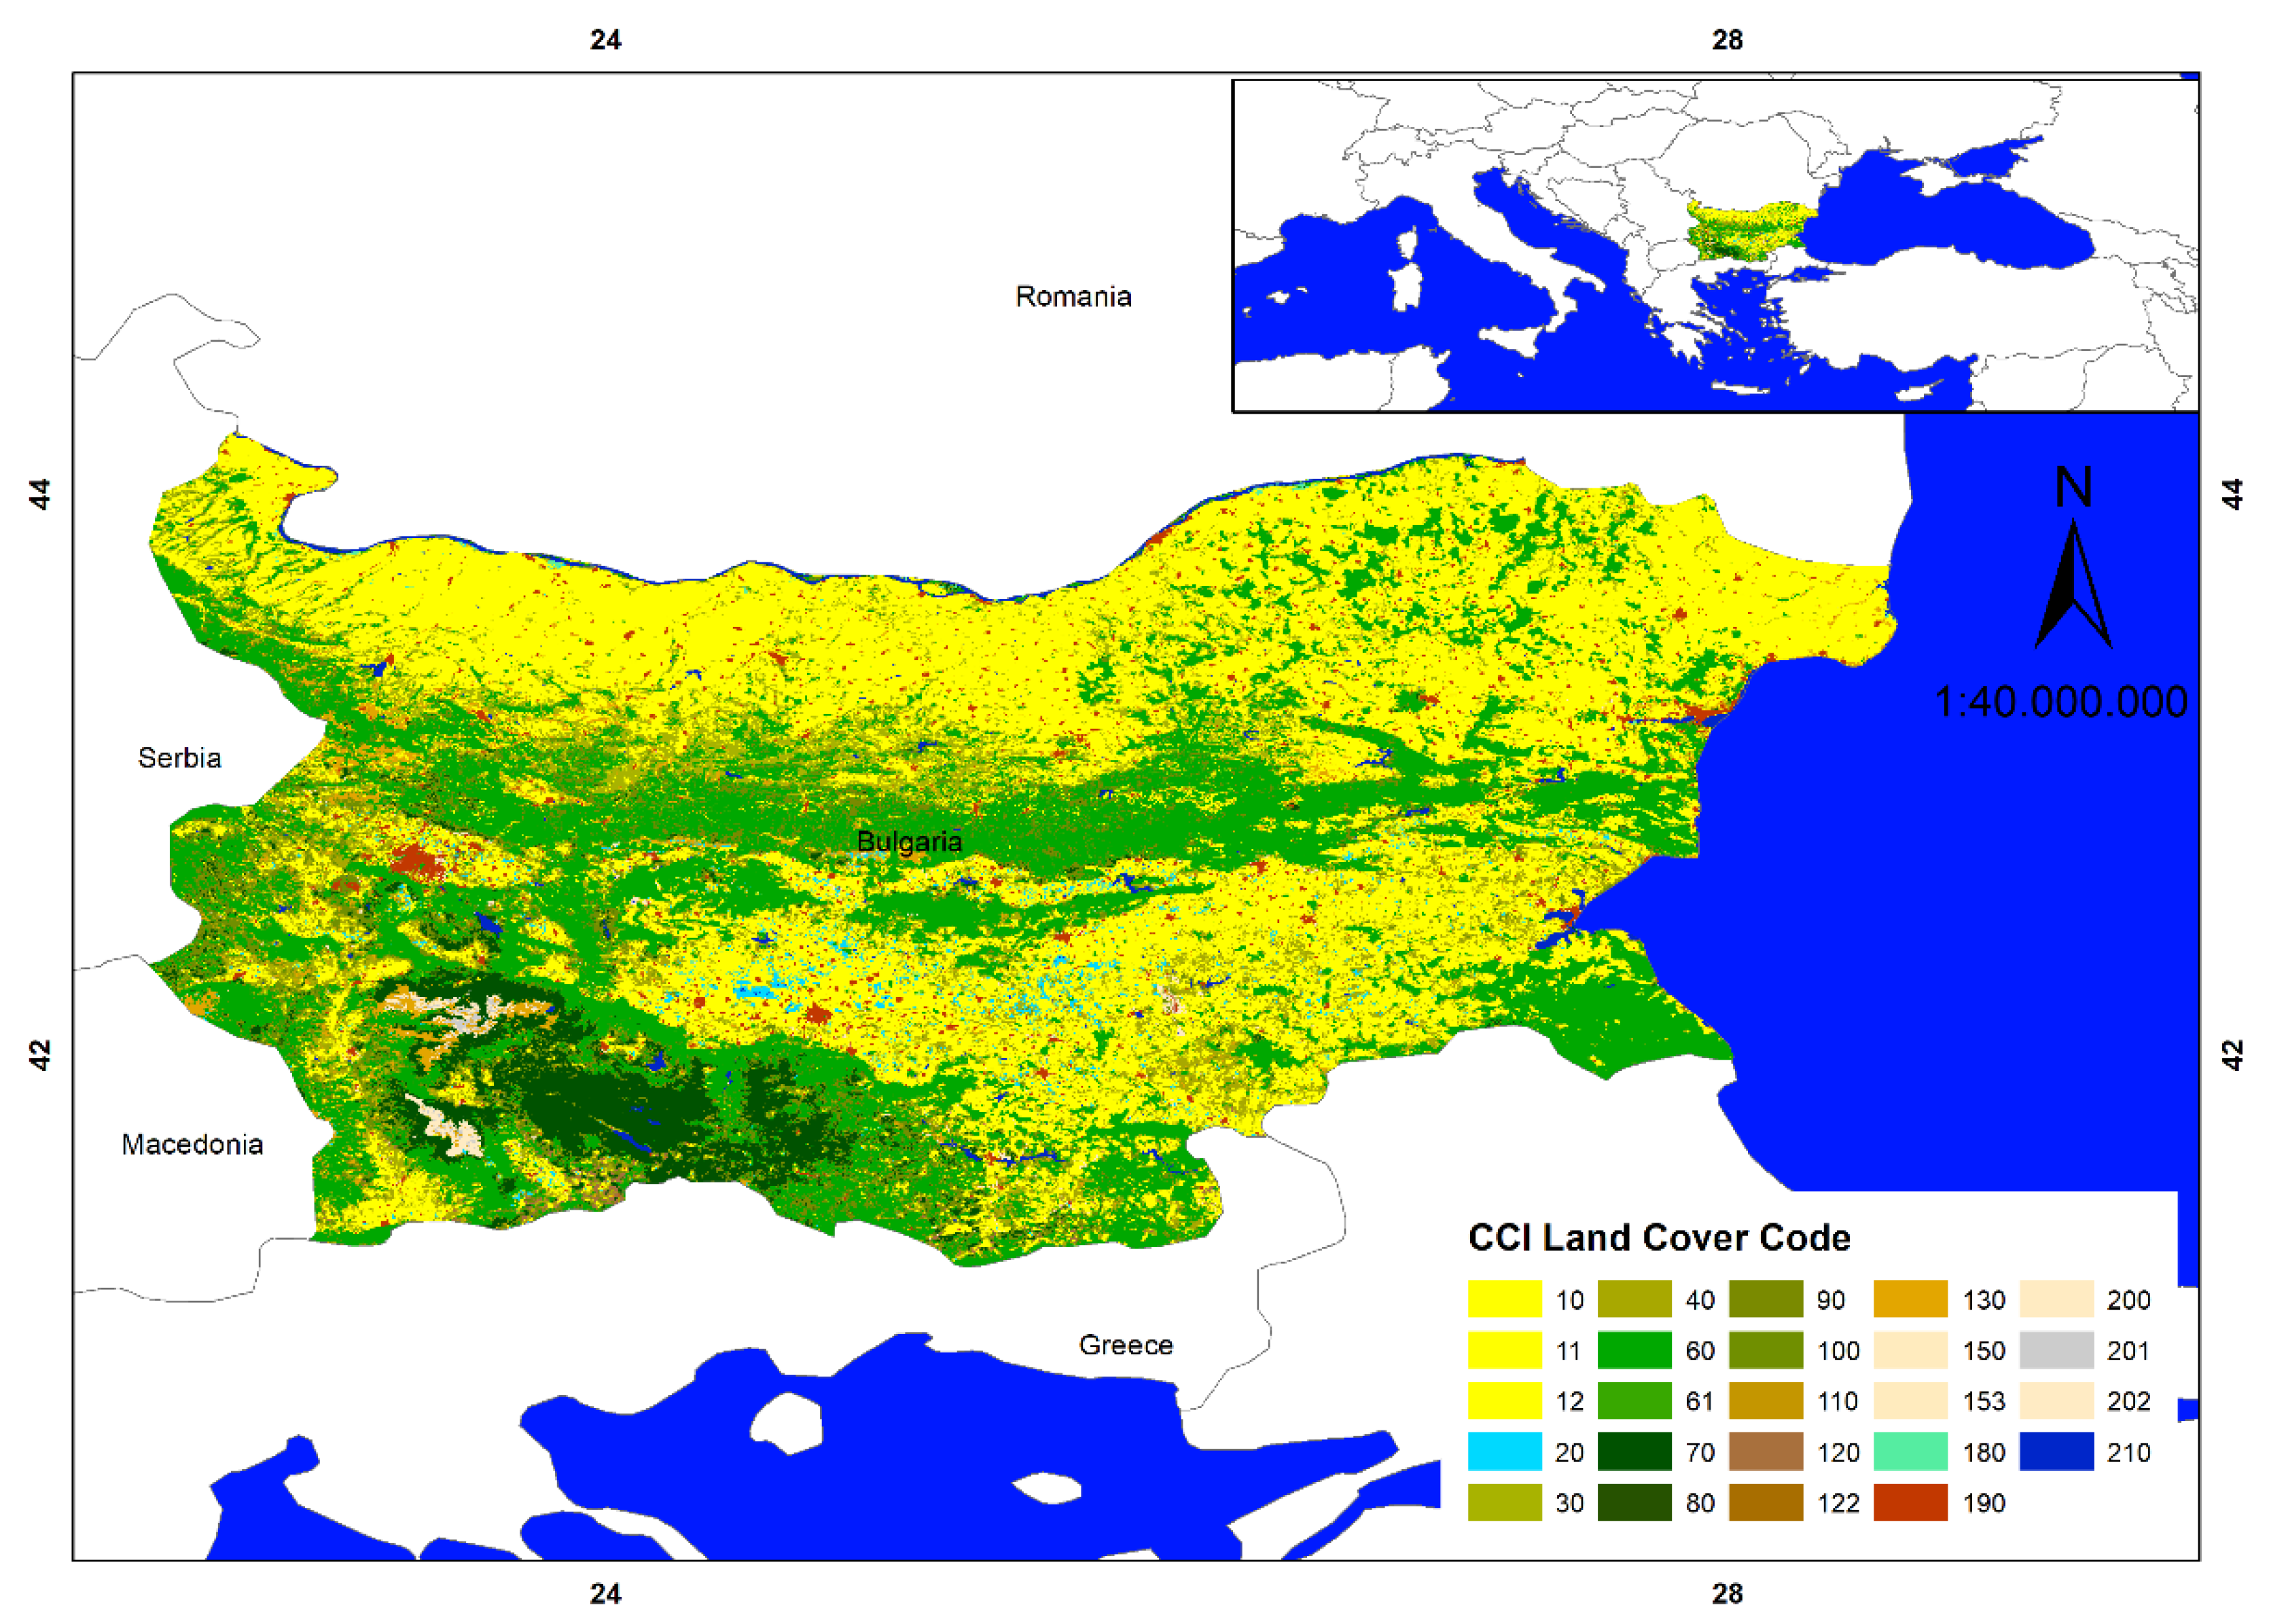
Figure 3.
Temporal trends in climatic variables between 2001 and 2022 in the study area (air temperature (°C) - Relative humidity (%) (a), Angström index - Vapor pressure deficit (kPa) (b) and precipitation (mm) (c)).
Figure 3.
Temporal trends in climatic variables between 2001 and 2022 in the study area (air temperature (°C) - Relative humidity (%) (a), Angström index - Vapor pressure deficit (kPa) (b) and precipitation (mm) (c)).
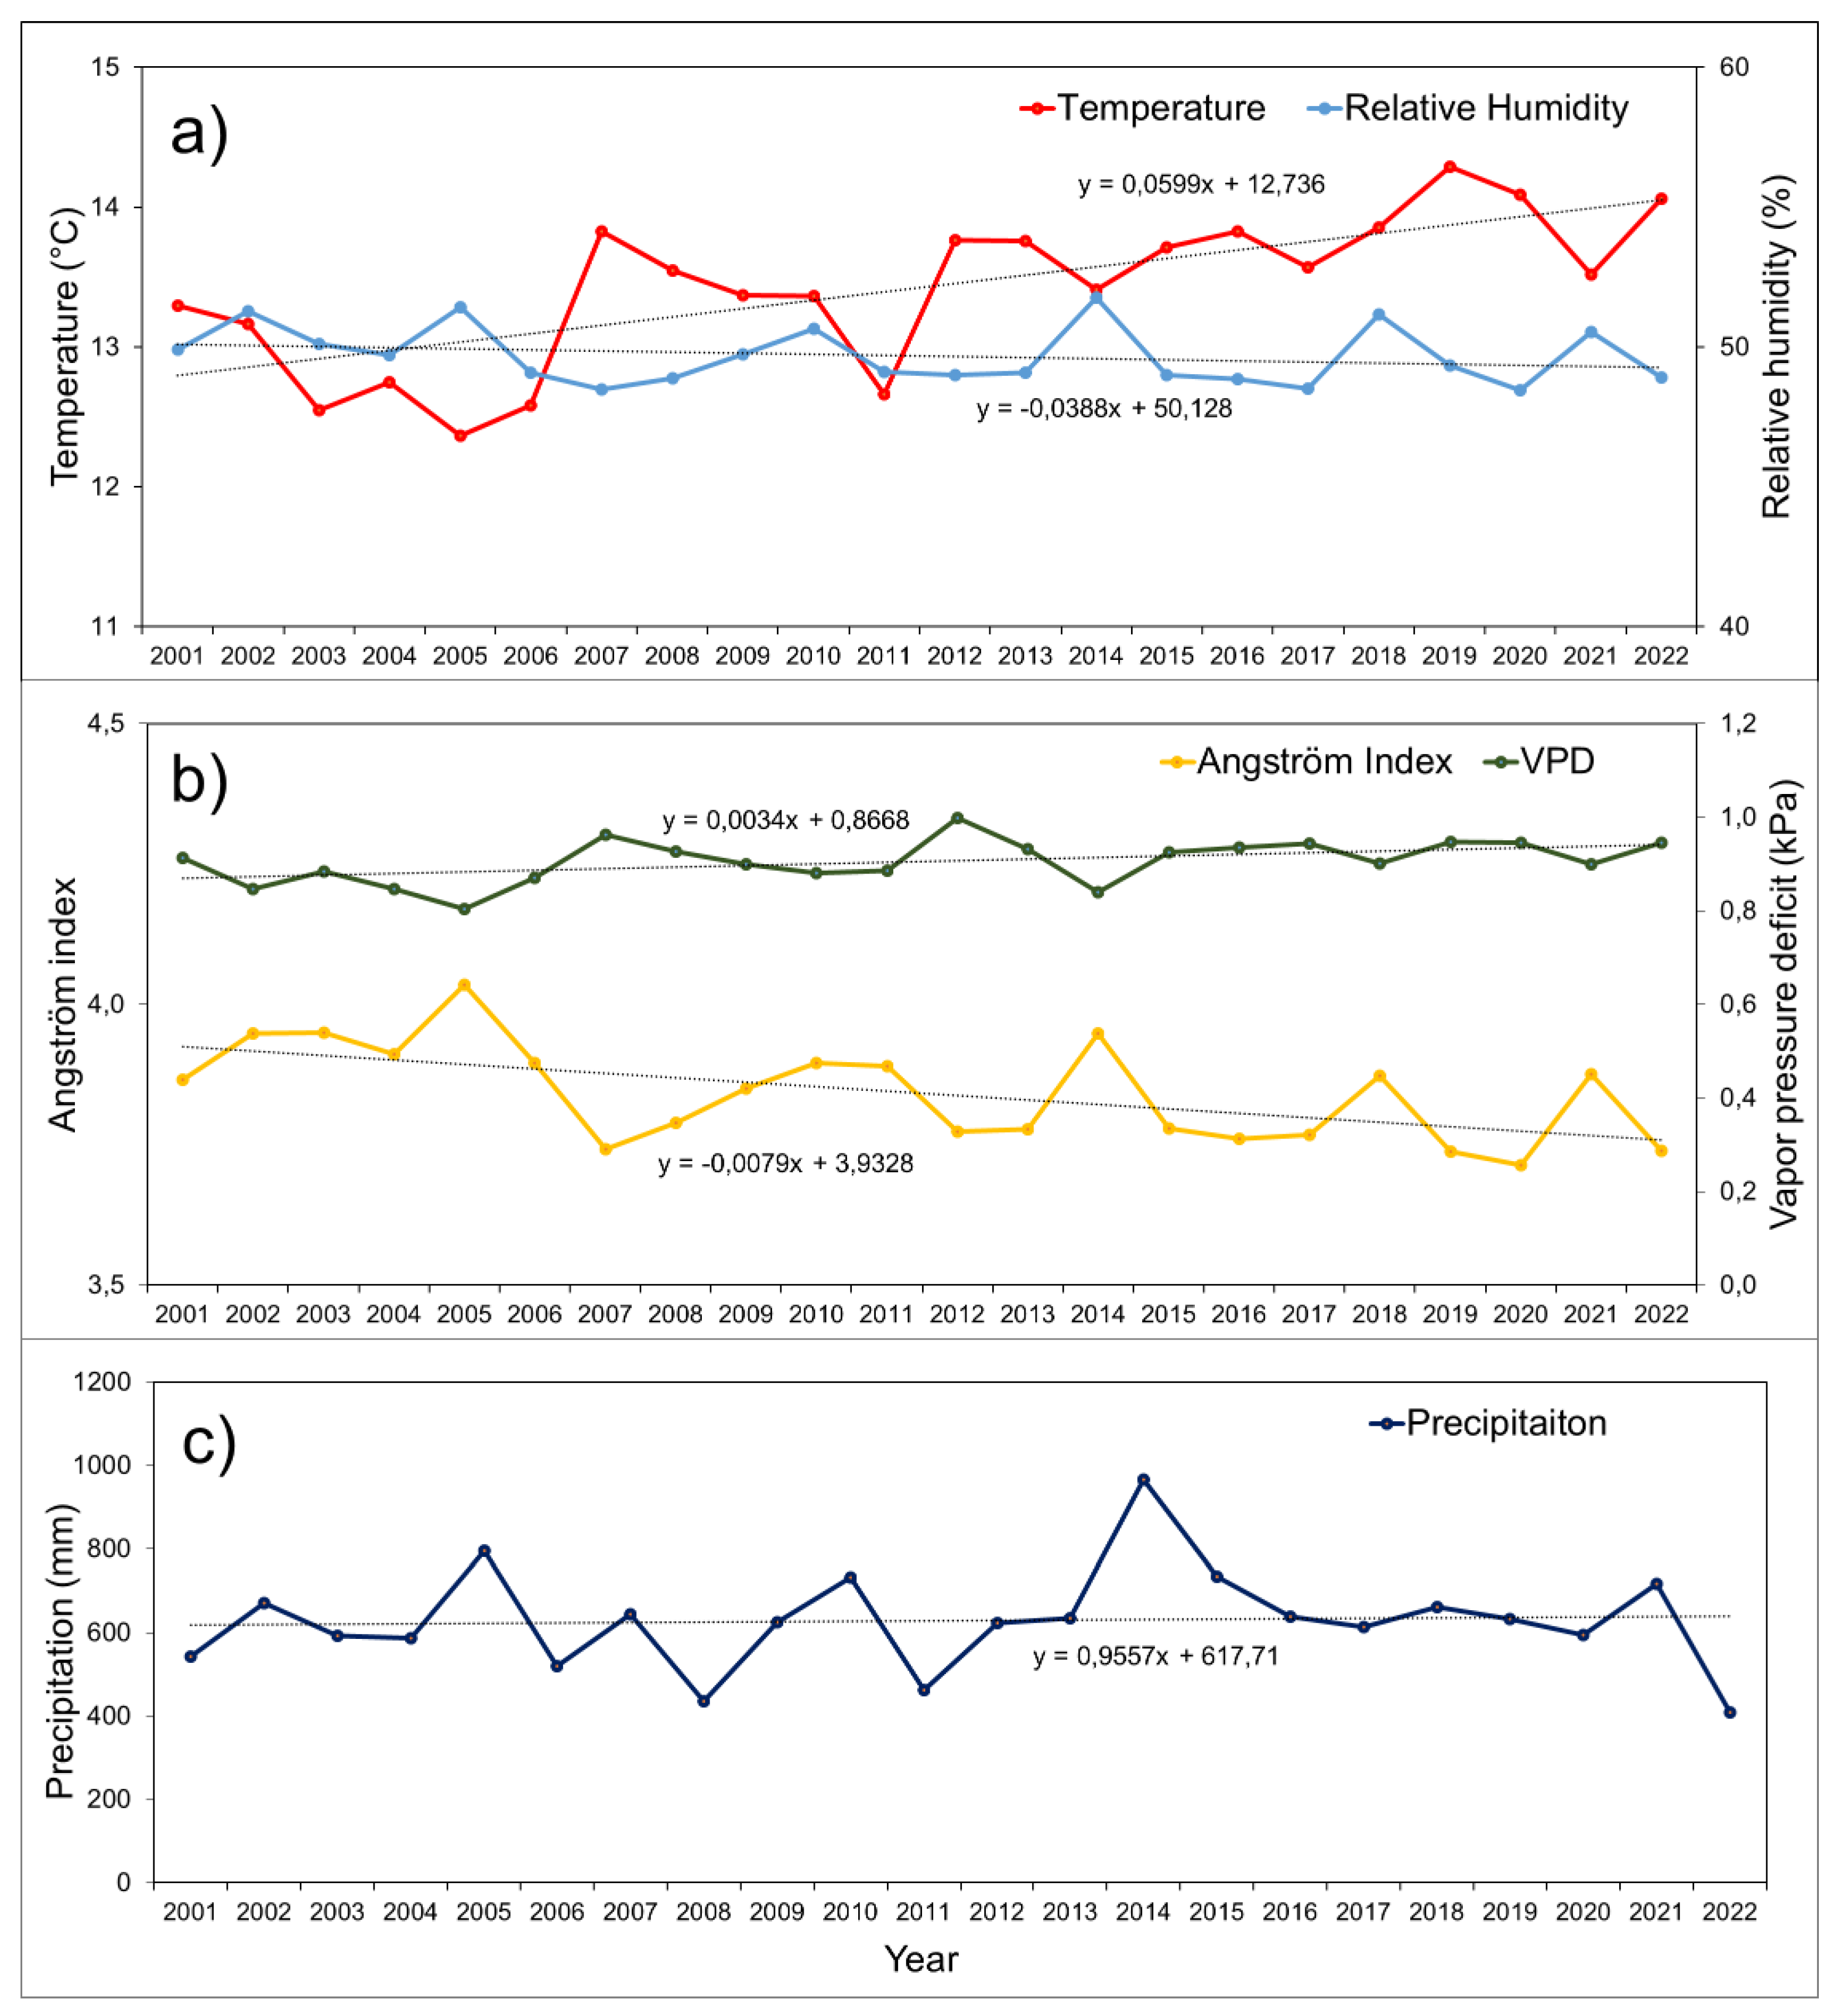
Figure 4.
Temporal trends in burned area across different land cover types based on FireCCI51 data: Cropland (a), Forest (b), Grassland, Shrubland, and Wetland (c) — and trends in wildfires derived from EFFIS burned area information (d). Note that EFFIS provides burned area data starting from 2006.
Figure 4.
Temporal trends in burned area across different land cover types based on FireCCI51 data: Cropland (a), Forest (b), Grassland, Shrubland, and Wetland (c) — and trends in wildfires derived from EFFIS burned area information (d). Note that EFFIS provides burned area data starting from 2006.
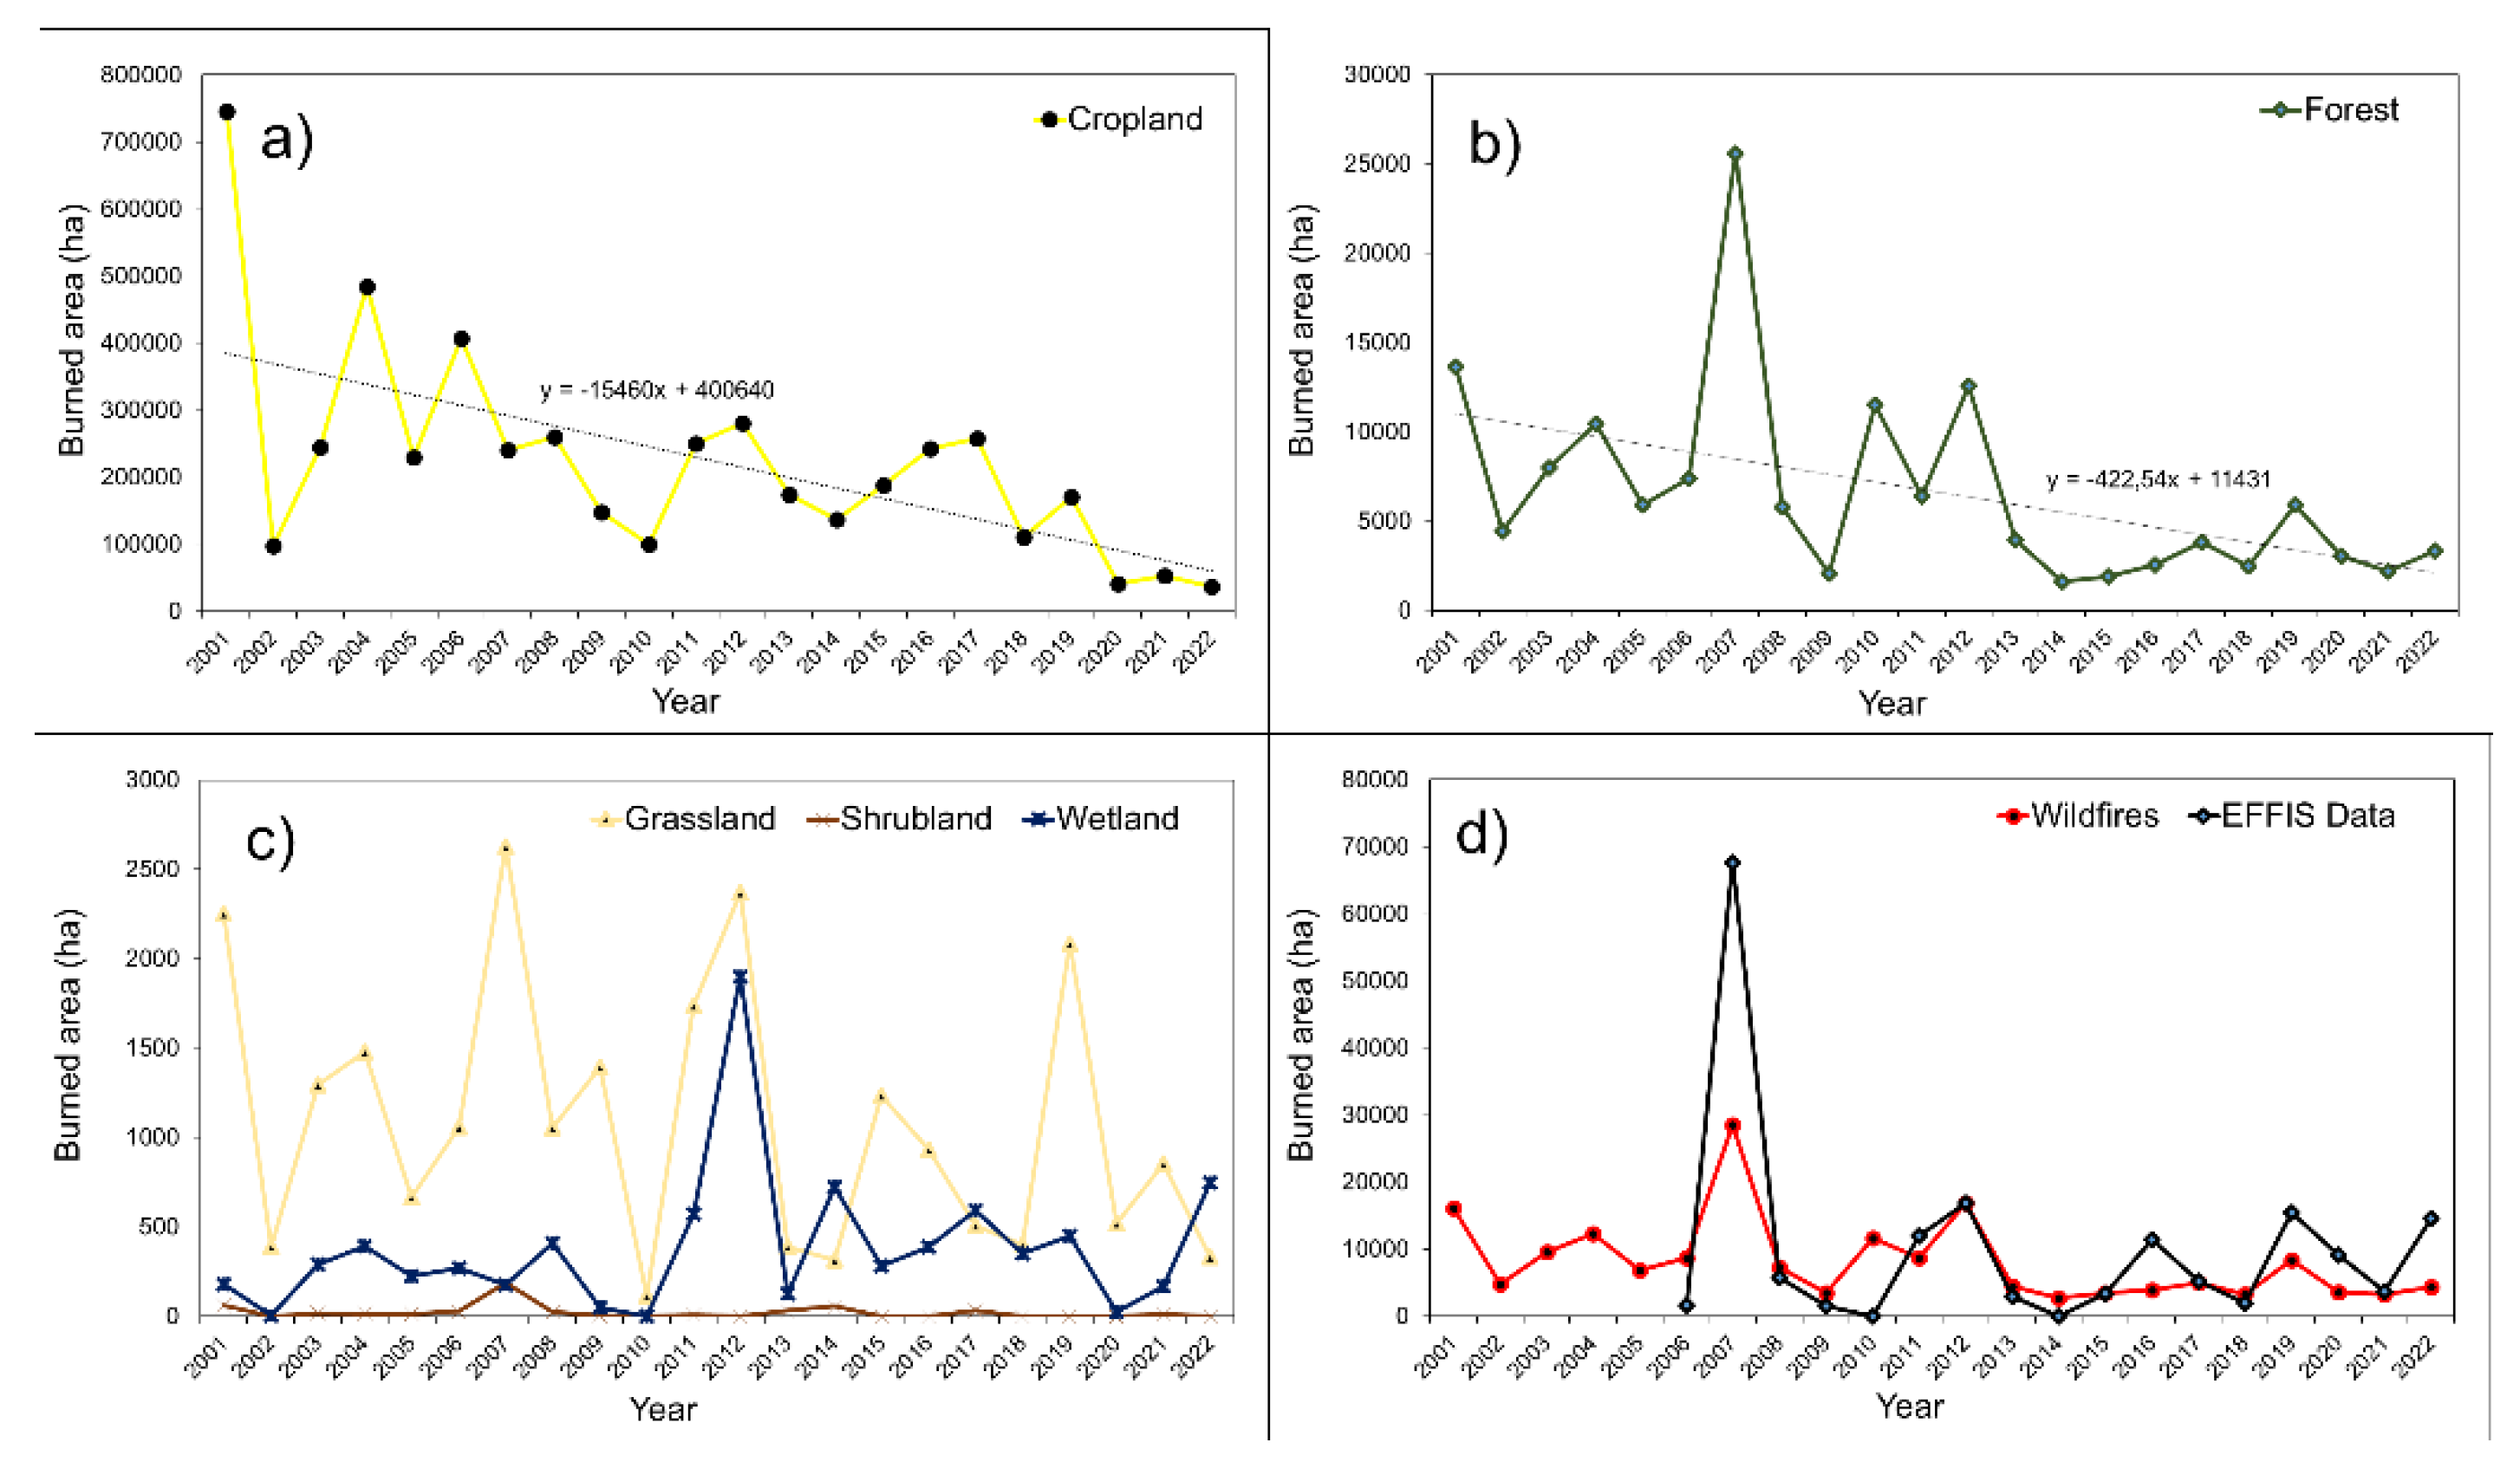
Figure 5.
FireCCI51 burned areas across land cover types in Bulgaria (Cropland (a), Forest (b), Shrubland (c), Grassland (e), Wetland (f) and Wildfires (f) from 2001 to 2020. Wildfires indicate that total burned area in in forest, grassland, wetland, and shrubland land cover types.
Figure 5.
FireCCI51 burned areas across land cover types in Bulgaria (Cropland (a), Forest (b), Shrubland (c), Grassland (e), Wetland (f) and Wildfires (f) from 2001 to 2020. Wildfires indicate that total burned area in in forest, grassland, wetland, and shrubland land cover types.
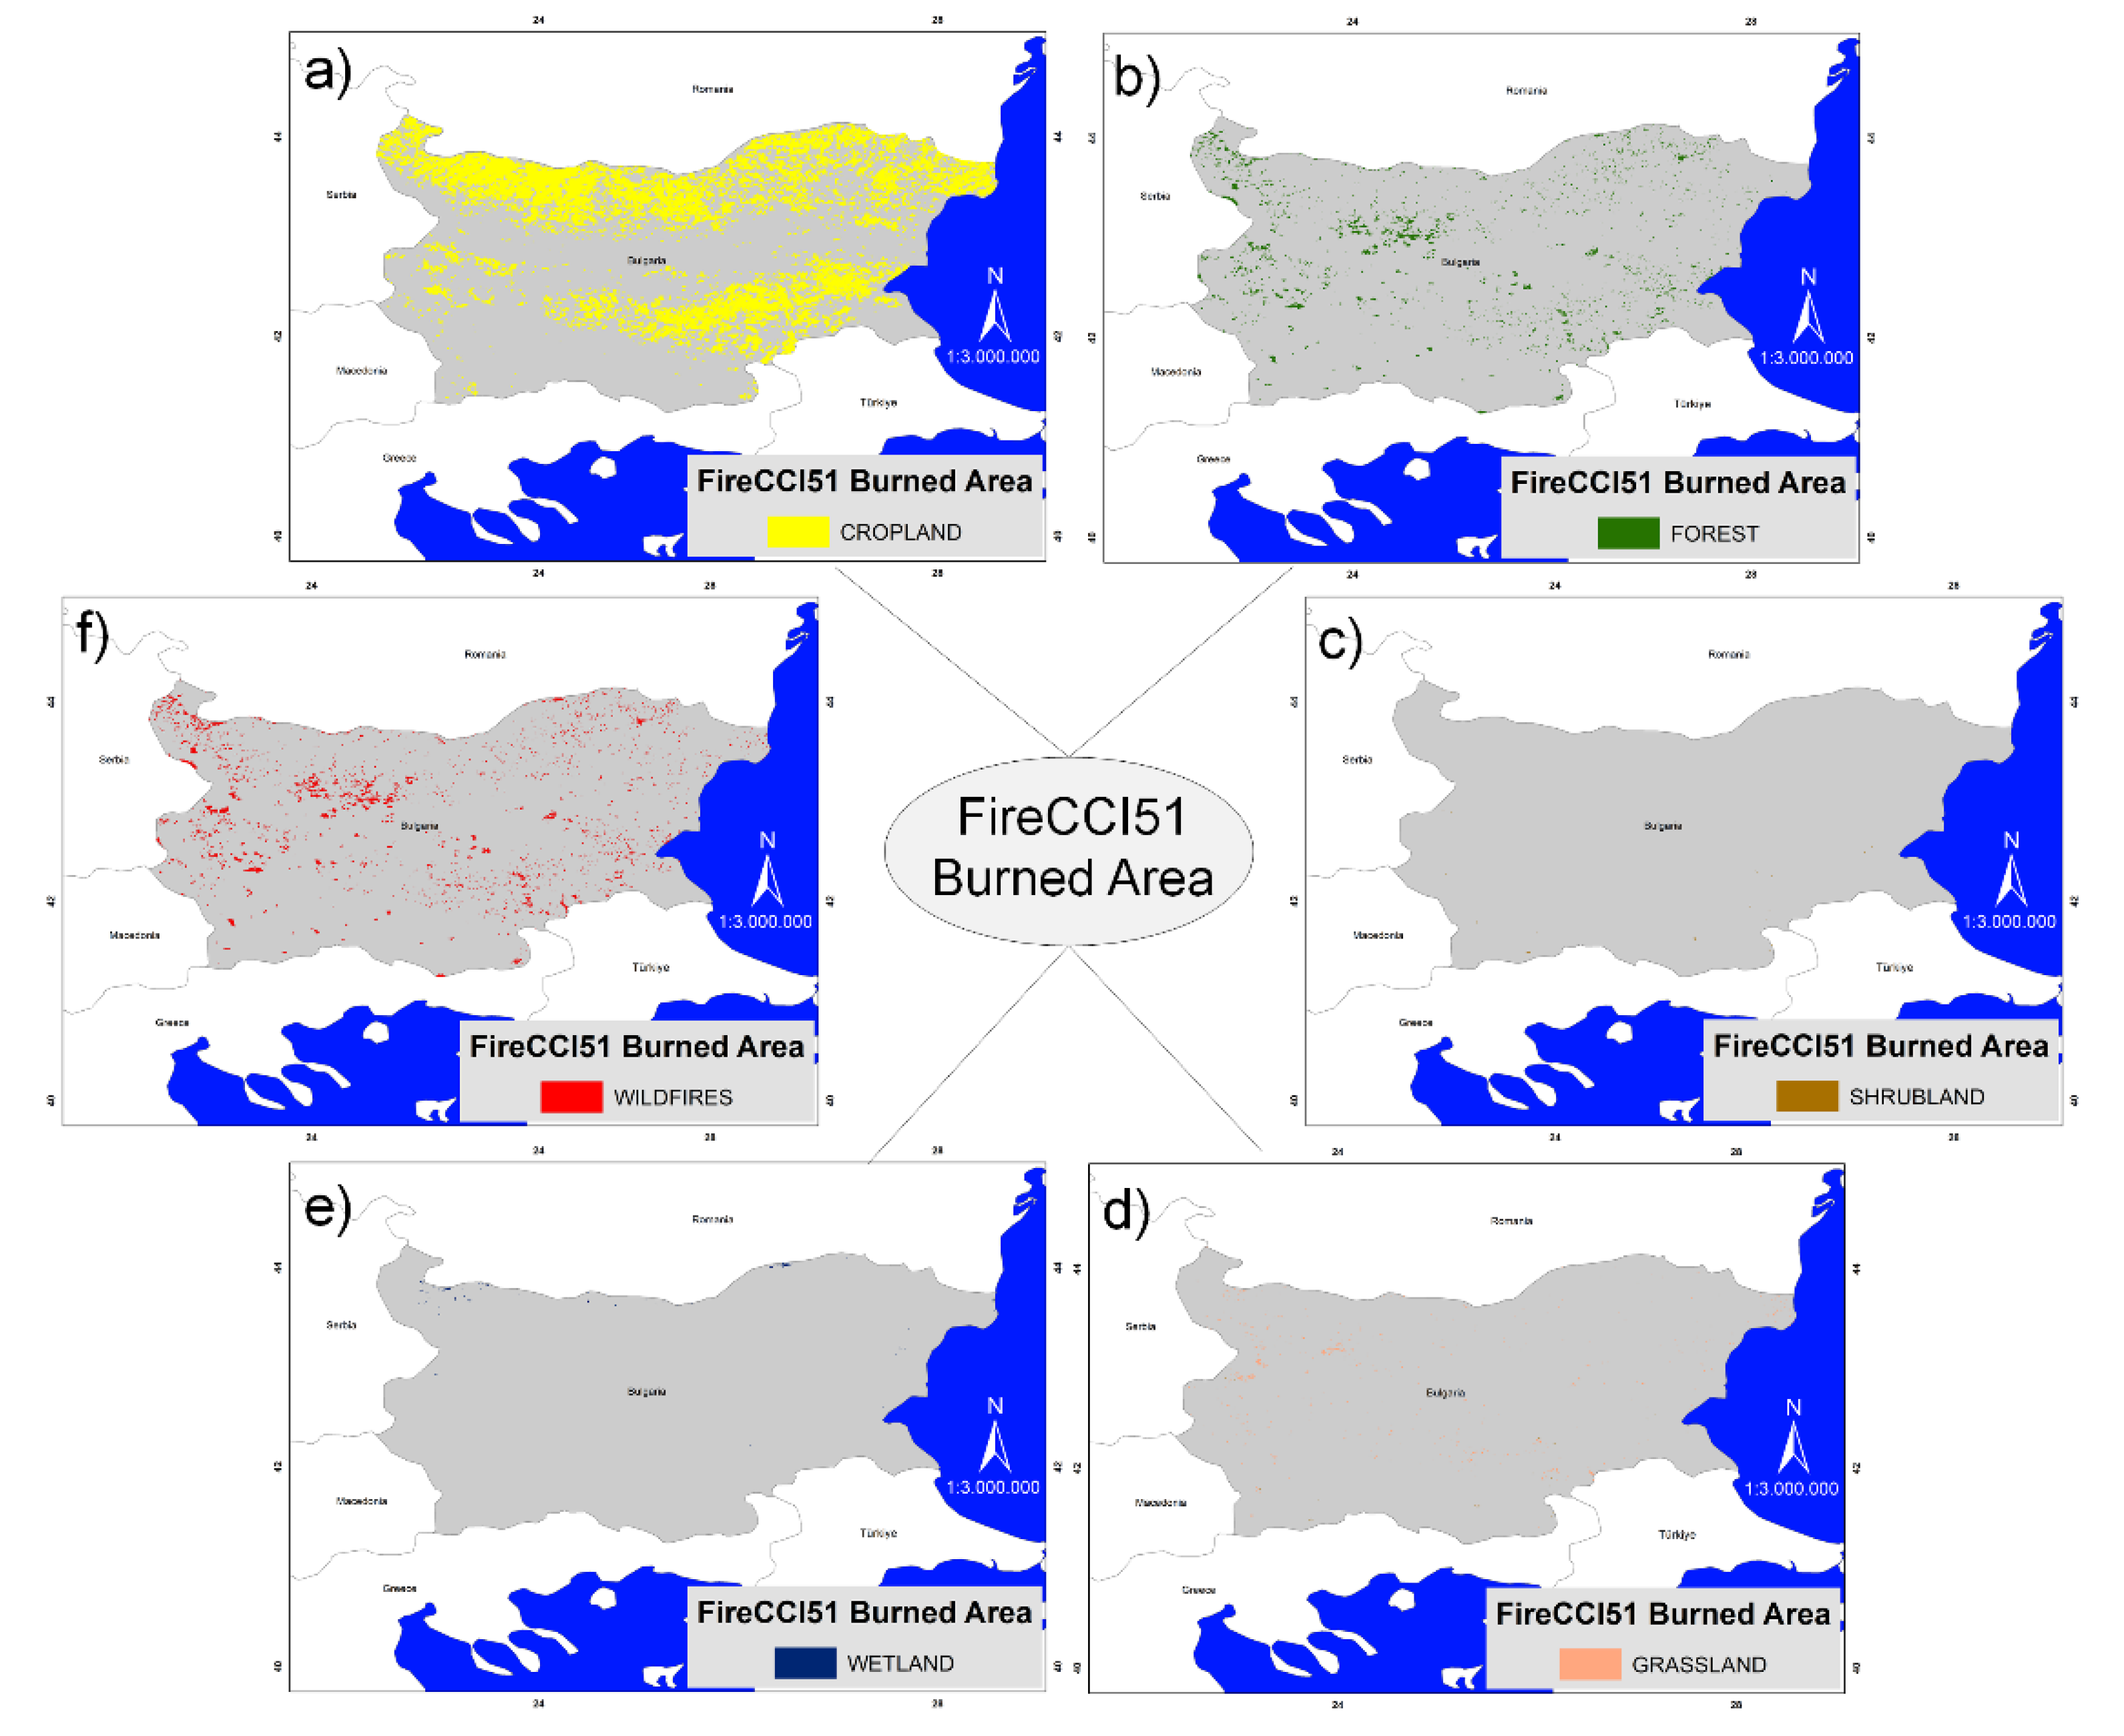
Figure 6.
The results present the correlations between monthly mean climatic variables and the FireCCI51 burned area data for different land-cover types during the period 2001–2022.
Figure 6.
The results present the correlations between monthly mean climatic variables and the FireCCI51 burned area data for different land-cover types during the period 2001–2022.
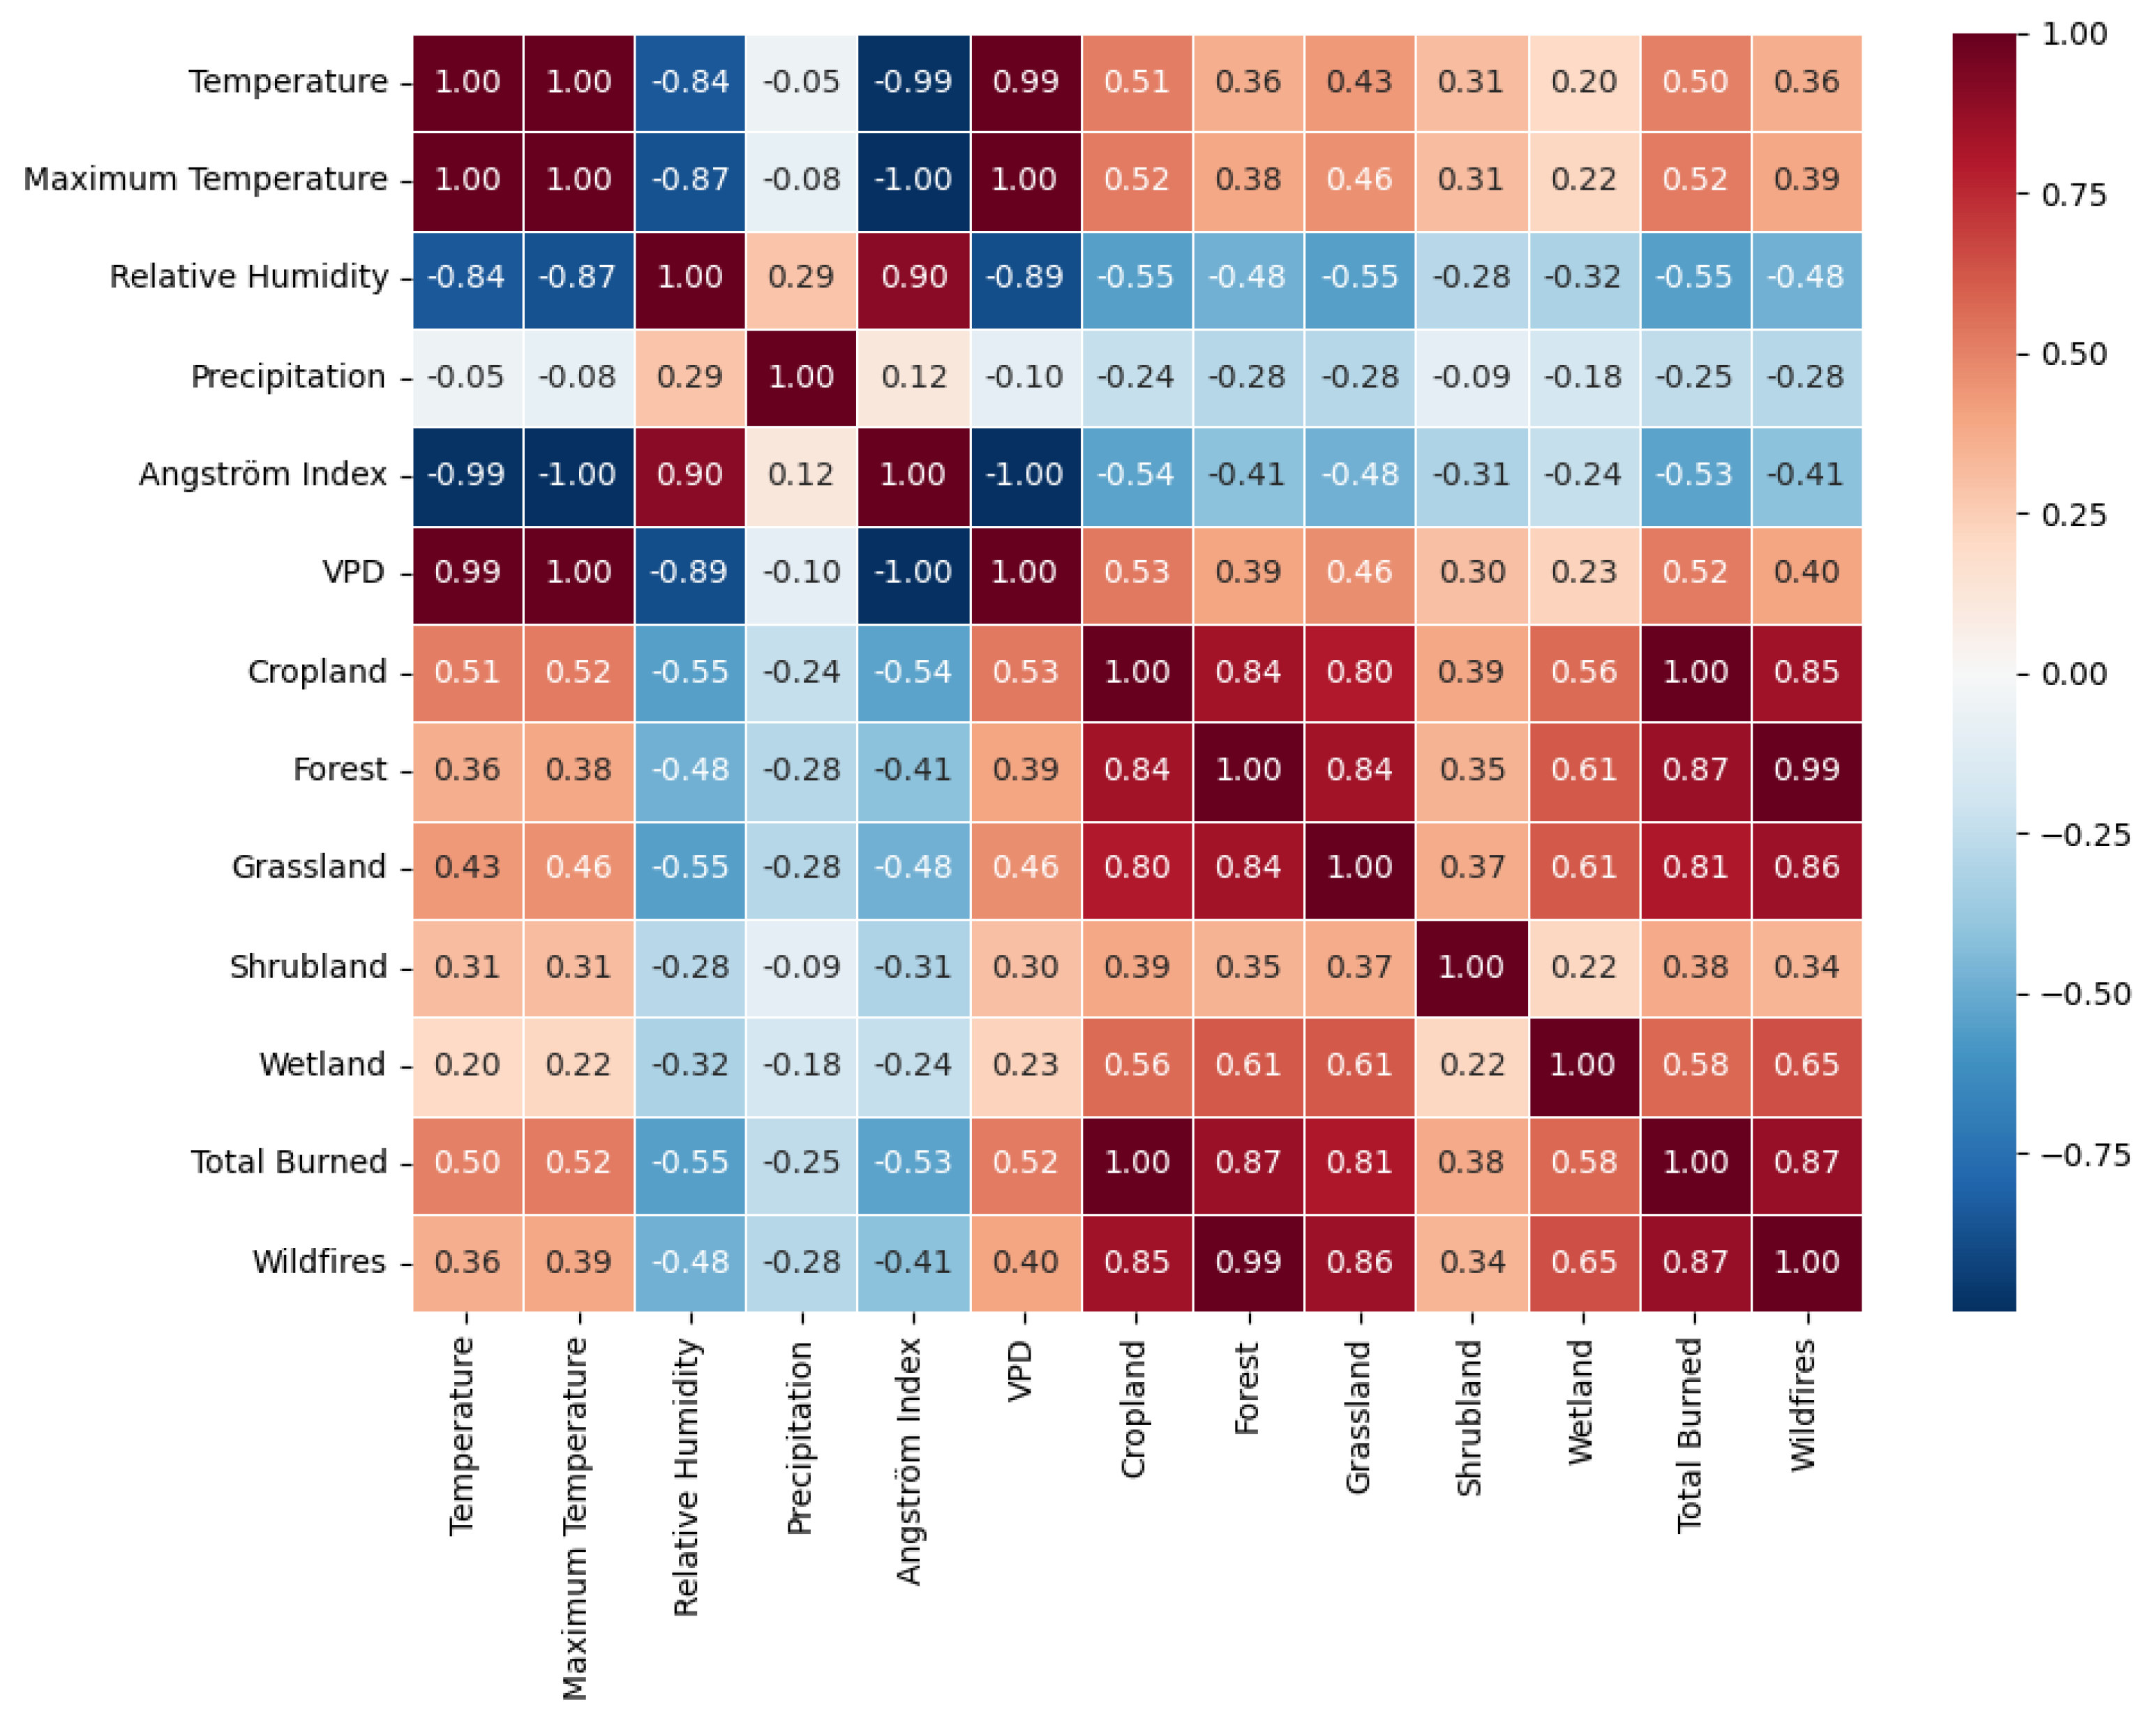
Figure 7.
Monthly distribution of mean vapor pressure deficit (VPD), Angström index, and burned area in cropland (a), forest (b), grassland (c), shrubland (d), wetland (e), and all wildfires (f) based on FireCCI51 data in Bulgaria during the study period (r = correlation coefficient).
Figure 7.
Monthly distribution of mean vapor pressure deficit (VPD), Angström index, and burned area in cropland (a), forest (b), grassland (c), shrubland (d), wetland (e), and all wildfires (f) based on FireCCI51 data in Bulgaria during the study period (r = correlation coefficient).
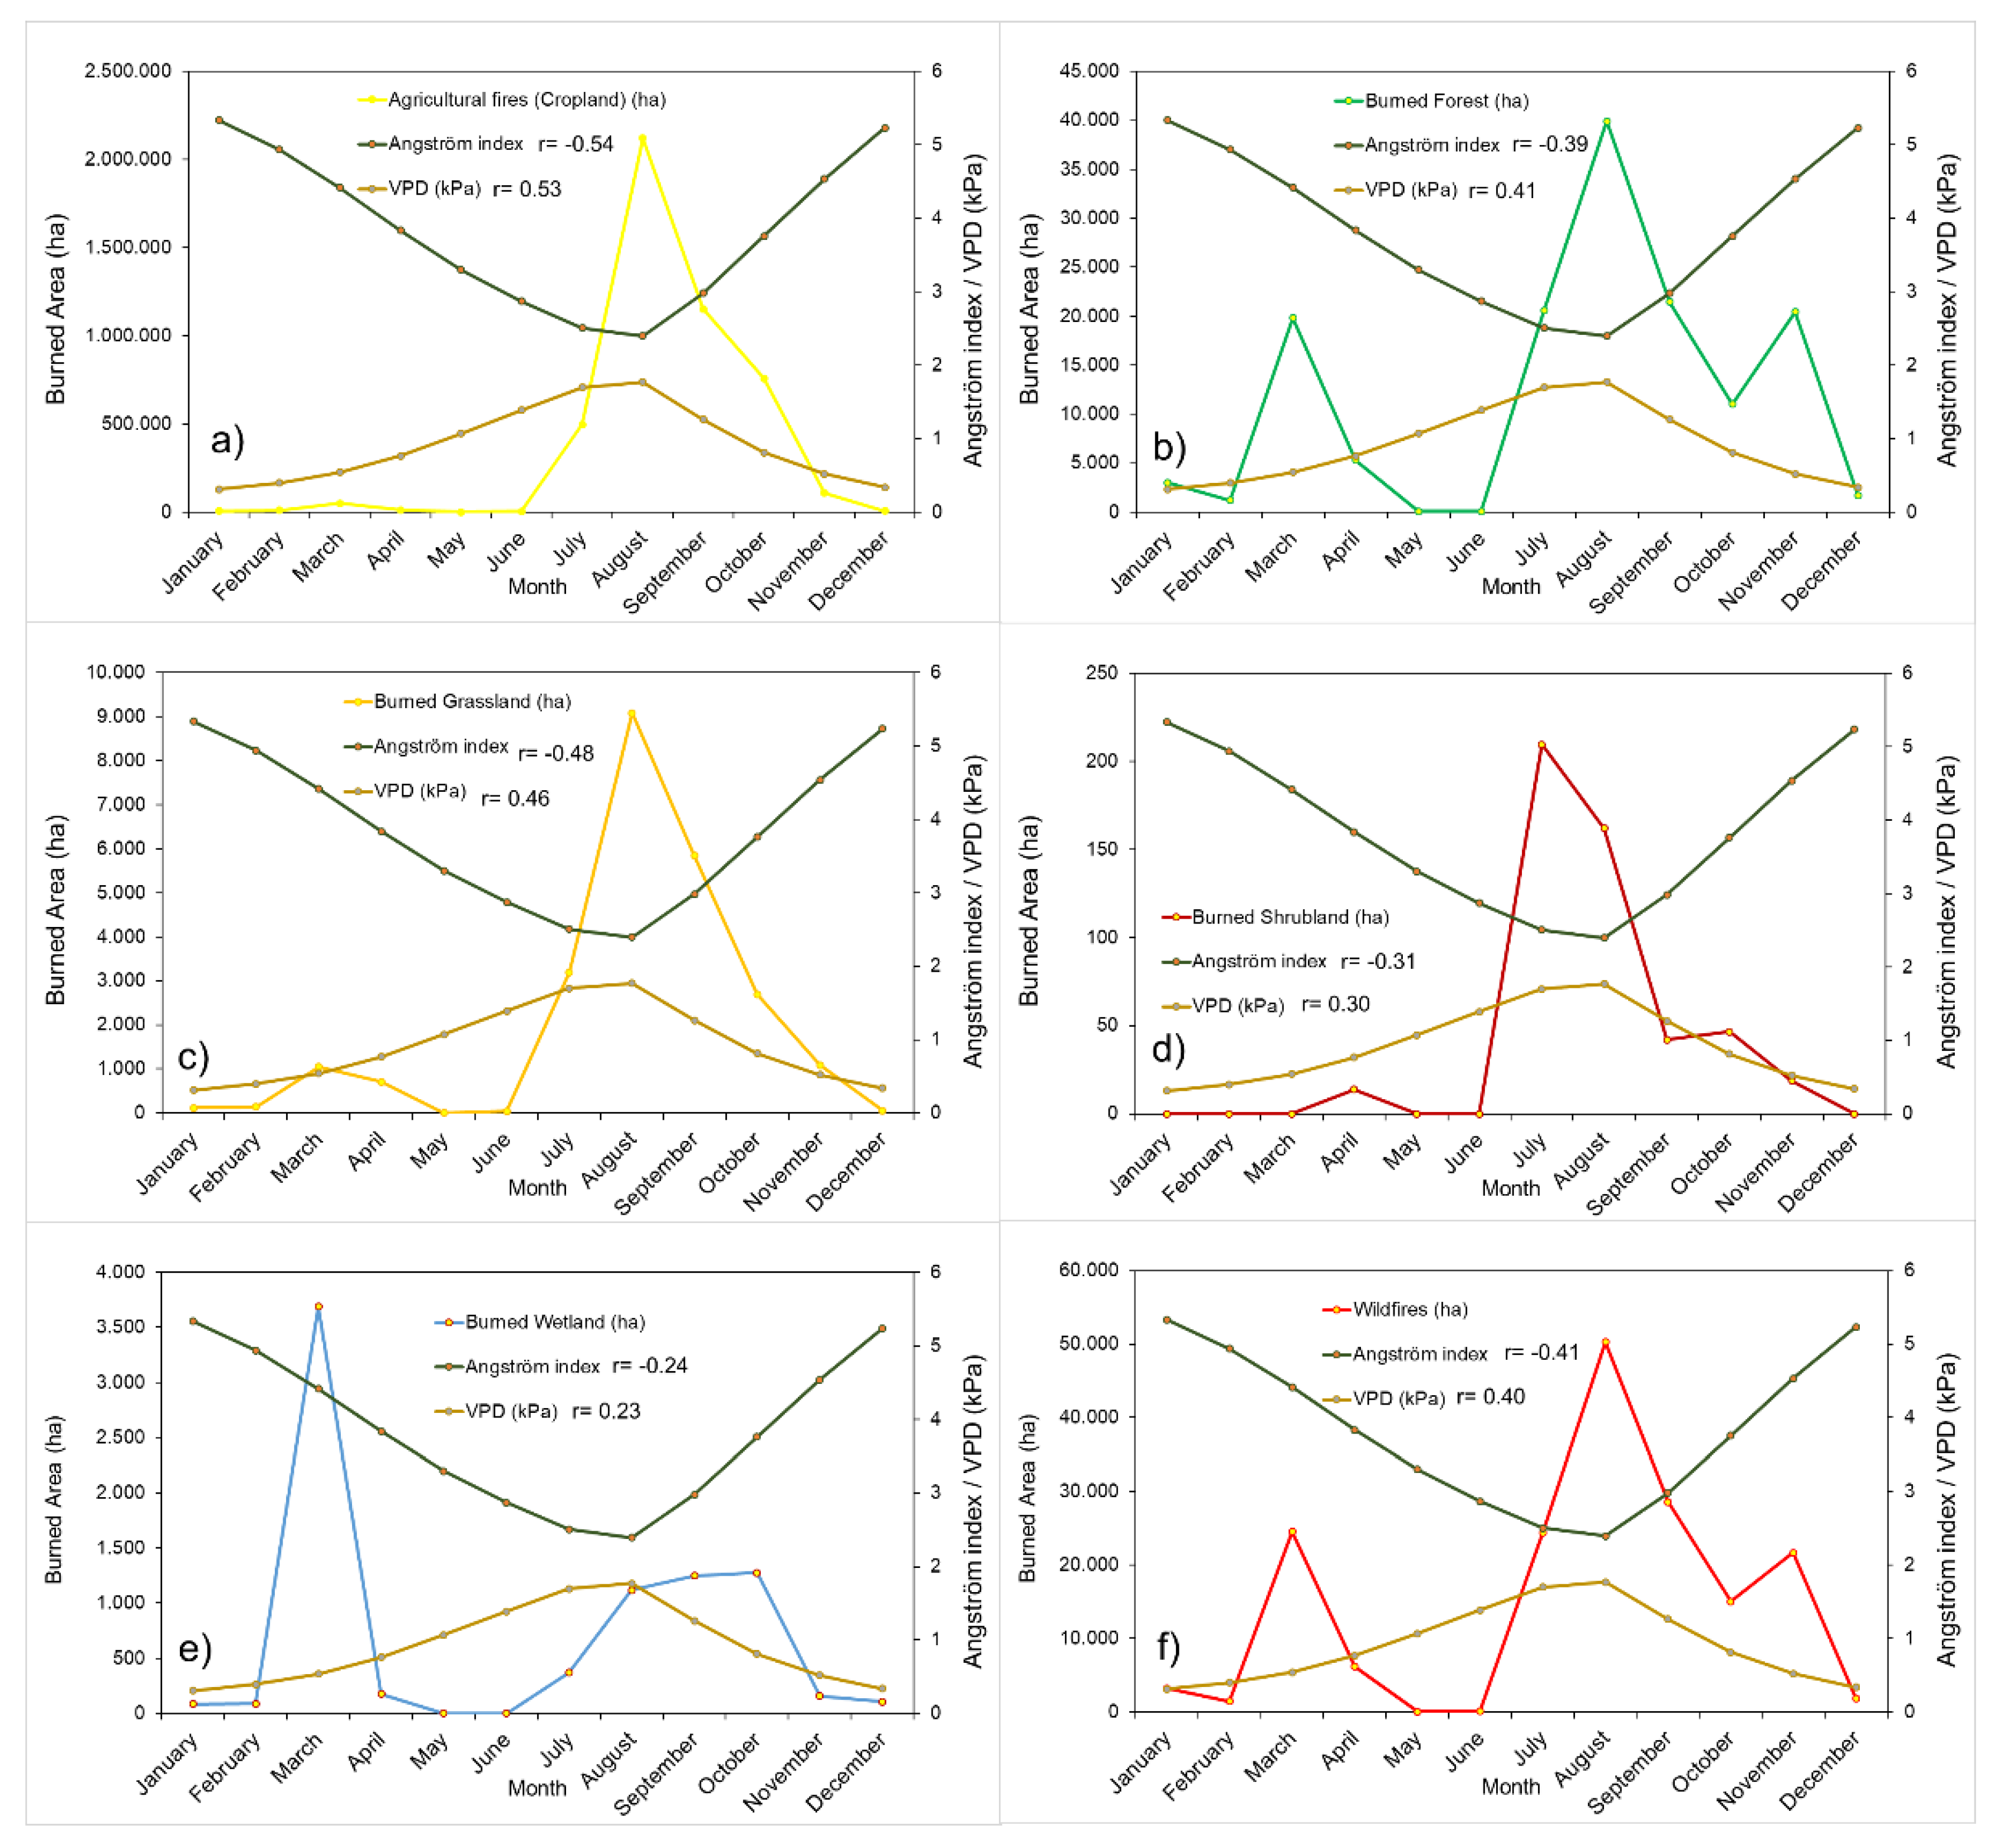

Table 1.
The land cover (ESA CCI) classification of the study site.
| GC* | Land Cover | Area (Ha) | Area (%) |
| 10 | Cropland, rain fed | 2.519.520 | 22,7 |
| 11 | Cropland, rain fed, herbaceous cover | 2.347.390 | 21,1 |
| 12 | Cropland, rain fed, tree or shrub cover | 22.767 | 0,2 |
| 20 | Cropland, irrigated or post flooding | 93.592 | 0,8 |
| 30 | Mosaic cropland (>50%) / natural vegetation (<50%) | 771.165 | 6,9 |
| 40 | Mosaic natural vegetation (>50%) / cropland (<50%)) | 501.082 | 4,5 |
| 60 | Tree cover, broadleaved, deciduous, closed to open (>15%) | 2.991.320 | 26,9 |
| 61 | Tree cover, broadleaved, deciduous, closed (>40%) | 40.867 | 0,4 |
| 70 | Tree cover, needle leaved, evergreen, closed to open (>15%) | 532.077 | 4,8 |
| 80 | Tree cover, needle leaved, deciduous, closed to open (>15%) | 77 | 0,0 |
| 90 | Tree cover, mixed leaf type (broadleaved and needle leaved) | 307.411 | 2,8 |
| 100 | Mosaic tree and shrub (>50%) / herbaceous cover (<50%) | 367.783 | 3,3 |
| 110 | Mosaic herbaceous cover (>50%) / tree and shrub (<50%) | 1.928 | 0,0 |
| 120 | Shrubland | 21.870 | 0,2 |
| 122 | Deciduous shrubland | 78 | 0,0 |
| 130 | Grassland | 179.555 | 1,6 |
| 150 | Sparse vegetation (tree, shrub, herbaceous cover) (<15%) | 13.331 | 0,1 |
| 153 | Sparse herbaceous cover (<15%) | 35 | 0,0 |
| 180 | Shrub or herbaceous cover, flooded, fresh/saline/brackish water | 7.974 | 0,1 |
| 190 | Urban areas | 225.647 | 2,0 |
| 200 | Bare areas | 46.281 | 0,4 |
| 201 | Consolidated bare areas | 8.871 | 0,1 |
| 202 | Unconsolidated bare areas | 41 | 0,0 |
| 210 | Water bodies | 102.877 | 0,9 |
*GC: Grid code.
Disclaimer/Publisher’s Note: The statements, opinions and data contained in all publications are solely those of the individual author(s) and contributor(s) and not of MDPI and/or the editor(s). MDPI and/or the editor(s) disclaim responsibility for any injury to people or property resulting from any ideas, methods, instructions or products referred to in the content. |
© 2025 by the authors. Licensee MDPI, Basel, Switzerland. This article is an open access article distributed under the terms and conditions of the Creative Commons Attribution (CC BY) license (http://creativecommons.org/licenses/by/4.0/).
Copyright: This open access article is published under a Creative Commons CC BY 4.0 license, which permit the free download, distribution, and reuse, provided that the author and preprint are cited in any reuse.


