
Submitted:
17 January 2024
Posted:
18 January 2024
You are already at the latest version
Abstract
Wildfires are important natural drivers of forest stands dynamics, strongly influencing on their natural regeneration and ecosystem services. This paper presents a comprehensive analysis of spatiotemporal burnt area (BA) patterns over the period 2000–2022 in the Middle Volga region of the Russian Federation on the base of remote sensing time series, considering the impact of cli-matic factors on forest fires. The temporal trends were assessed with the Mann-Kendall nonpara-metric statistical test and Theil-Sen’s slope estimator using the LandTrendr algorithm on the Google Earth Platform (GEE). The accuracy assessment indicated a high overall accuracy (> 84%) and F-score value (> 82%) for forest burnt area detection as evaluated against 581 test sites of ref-erence data. The results revealed that the fire occurrences in the region were mainly irregular with the highest frequency of 7.3 over a 22-year period. The total forest BA was about 280 thousand ha, which equals to 1.7% of the land surface area or 4.0% of the total forested area under study in the Middle Volga region. The coniferous forest stands are the most fire-prone ecosystems accounting for 59.0 % of the total BA; deciduous stands accounts for 25.1%; and insignificant fire occurrences were registered in young forests and shrub lands. On a seasonal scale, temperature generally has a greater impact on the BA than precipitation and wind speed.
Keywords:
wildfires
; forest
; climatic factors
; monitoring
; fire recurrence
; remote sensing
; machine learning
; Landsat
; time series
; trend analyses
1. Introduction
In recent decades, the number of wildfires has remarkably increased in many parts of the world [1,2,3,4]. The frequency of large wildfires in the Russian Federation, for instance, increased by nearly two times over the period 1991–2020 compared to the average statistics of 1960–1990, while at the same time the forest burnt area also increased by three times [5,6]. Across the USA and Europe, wildfire disturbances have also steadily increased during the past several decades [7,8,9]. This trend is expected to continue in the future as a result of human-caused climatic change with a severe impact on the environment and economy [10,11,12].
Wildfire is an important natural disturbance factor shaping global forest landscapes [13]. Small-scale and medium-sized wildfire is an essential ecosystem process that burns out fuels located at ground levels such as leaf litter and fallen branches [14], shapes forest structure [15,16,17,18], impacts species composition [19,20,21], and promotes forest regrowth and regeneration at the stand level [22,23,24]. Controlled (prescribed) burning, having positive effects as a means of restoration and forest management, is widely recognised around the world [25,26].
On the other hand, large-scale wildfires are a serious problem, destroying the ecological balance of terrestrial ecosystems [27,28], causing the loss of bio resources [29,30,31], and resulting in the massive destruction of life and property [32,33]. Forest fires negatively affect resilience to climate change, causing loss of biodiversity and habitat, reducing the potential value of forest, its productivity, and endangering human life [34]. The wildland fire can also lead to a transition from a conifer-dominated forest to a deciduous-dominated, mixed forest, or even a non-forest ecosystem [35,36]. In this context, comprehensive monitoring of the burnt area is crucial for assessing trends and patterns of forest fire occurrence and identifying drivers inducing them, as well as for prognosis future fire occurrences and patterns. However, for territory of Russian Federation such studies are generally lacking.
Remotely sensed (RS) data offer powerful tools for monitoring post-fire forest patterns, provide quantitative details and insight into post-fire risk mitigation, and facilitate the analysis of historical fire-recovery dynamics on multiple spatial and temporal scales [37]. Several studies can be mentioned on the use of RS to estimate the spatial and temporal dynamics of forest fire patterns on a regional scale over several decades [38,39,40,41]. RS and numerous algorithms have been applied to assess three temporal fire-effects stages: pre-fire conditions, active fire characteristics and post-fire ecosystem responses [42,43,44].
The RS of forest BA mapping is still an active research topic employing advanced techniques that integrate geo-statistics and machine learning methods [37,45]. Many studies of post-fire vegetation responses are based on the discrimination of spectral bands and vegetation indices (mostly NDVI, dNBR, and EVI) by MODIS, Landsat, SPOT, and Sentinel multitemporal imagery in different regions and forest ecosystems of the world [46,47,48,49,50]. Classification of forest succession patterns after the wildfires is also an important research direction, that can be used to predict the dynamics of future forest cover [51,52,53].
Several studies have investigated the dynamics of forest fire behaviour and burnt areas in the different regions of the Russian Federation [14,54,55,56,57,58,59]. The studies have found differences in the sensitivity of forest fire regimes to climate change and fire return interval (FRI) variability all over the Russian Federation territory. In central Siberia, the FRI in pine ecosystems was estimated to be about 50 years, with low severity and a relatively rapid recovery of litter after a fire [60]. The FRI in the southern Siberia ecotone, featuring vegetation of both taiga and steppe, ranges from 25 to 50 years [61,62].
The fire cycles (FC) in Karelia of the north-west Russian Federation increased over the period 1630–1920 (FC=46 years) and then decreased over 1930–2000 (FC= 283 years) [57]. Kukavskaya et al. [17] studied forest disturbances from 1996 to 2015 in Zabaikalsky Krai of the Russian Federation using satellite data and official national fire statistics. Their result shows that about 13% of the total forest area in the region (dominated by Scots pine) burned more than once during the estimated period. A focused study of burnt areas in the Republic Mari El undertaken within the Northern Eurasia Land Cover Dynamics Analysis (NELDA) project (http://www.fsl.orst.edu/nelda/), showed that based on Landsat MSS and TM analysis, approximately one-third (34,228 ha) of the forests that were burned in 2010 were located on pine (Pinus Sylvestris) plantations established after the 1972 wildfire [12]. The analysis of Landsat long-term series for 1984-2020 showed that fires burned more than 38 million ha of middle Amur lowland’s territory of the Russian Federation with high intensity (up to 36) of the FRI [63].
Despite a number of the above-mentioned studies, the spatiotemporal distribution of forest BA in the Volga region of the Russian Federation remains understudied. Therefore, the objectives of this study were to estimate the spatial and temporal BA trend pattern from 2000 to 2022 in the Middle Volga region using remote sensing time series, considering the impact of climatic factors. Specifically, the tasks of this research were: 1) to characterize the dynamic of forest fires on the investigated area; 2) to estimate trends in temporal patterns of forest BA; 3) to analyse the effect of climatic factors on forest fires and the distribution of burnt area. The trend analysis of the Landsat time series products has been performed using an advanced Google Earth Engine (GEE) cloud-based platform, applying JavaScript programming to its API (Application Programming Interface).
2. Materials and Methods
2.1. Study area
The study area is located in the Middle Volga region of the Russian Federation, covering Nizhegorodskaya and Kirovskaya oblasts, as well as the Republics of Mari El, Tatarstan, and Chuvashia (368300N and 1048550W; Figure 1). The region is located in the central part of the East European Plain and is of particular interest because it represents wide areas of natural forests in western Russia that are reported to be a large terrestrial carbon sink [64]. According to the national forest inventory system (https://docs.cntd.ru/document/902268260?marker=6540IN), the northern part of the research area belongs to the south taiga region of the European part of the Russian Federation, while the central and southern parts belong to the area of coniferous-deciduous (mixed) forests of the European part (Figure 1).
The relief of the Middle Volga region ranges from hilly to plains (from 45 to 316 m above sea level), and transitions from the lower to the higher parts are quite gradual. Along the Volga River, the central lowland extends as wide belts with a large number of lakes, marshes, and small rivers. The high right bank rises above the valley of the river in the form of a steep ledge with deep ravines [64].
The region’s climate is considered to be moderate-continental with stable weather in winter and summer, but considerably changing conditions in spring and autumn. The annual average precipitation varies between 450 and 550 mm, of which 250–300 mm falls during the vegetation period (spring and summer). Mean annual temperatures vary from + 2.20C in the north-eastern part of the region up to +3.10C in the south-west [65].
The area is dominated by natural coniferous and mixed broadleaved forests, mainly composed of pine (Pinus sylvestris L.), birch (Betula pendula Roth.), spruce (Picea abies Karst.), lime (Tilia cordata), and aspen (Populus tremula L.). Although pine stands are the predominant forest type of the landscape, especially in the Republic Mari El, regeneration of the birch–aspen species after wildfire is common over the study area. Ecological disturbances in forest stands (windstorms, insect outbreaks, and wildfires) have increased primarily because of climate change [66]. The high share of broadleaves all over the Middle Volga territory is primarily due to the increase of birch trees after the forest fires of 1921, 1972, and 2010 [12].
2.2. Data and method
2.2.1. Remote sensing
A yearly time series (2000-2022) of cloud-free surface reflectance medoid data from Landsat (TM, ETM+, and OLI) was extracted over the investigated area and processed through the JavaScript code editor in the Google Earth Engine (GEE) to map the forest cover and burnt area. GEE performs in the logic of “Big Data” without the need to access a supercomputer [67]. The platform provides access to a multi-petabyte database of remotely sensed imagery, climate-weather, and geophysical datasets with a series of services, such as web applications, machine learning tools, mapping and visualization of geospatial data [68].
Clouds and cloud shadows were automatically detected and removed from Landsat images with the C Function of Mask (CFMASK) algorithm [69]. The selected images were geometrically and atmospherically corrected and converted to surface reflectance using the Landsat Ecosystem Disturbance Adaptive Processing System (LEDAPS) algorithm for TM and ETM+ [70] and the Landsat 8 Surface Reflectance Code (LaSRC) by the USGS for OLI [71]. Since the Landsat 8 OLI has a higher 12-bit radiometric resolution than the previous ETM+ sensor, the ordinary least squares regression reported in Roy et al. [72] was used to harmonize linear differences between the spectral values of both instruments to normalize the reflectance. In order to minimize the effect of phenological changes during the spring-summer period, a total of 2,393 Landsat images, covering 3–4 Landsat scenes (Path122–124, Row 42–43, Figure 2), were acquired in the forest fire season (from 1 May to 30 September) within the whole study period. The time span corresponds to the main dry and wildfire seasons in the Middle Volga region.
The coordinates and dates of forest fire events that occurred between 2000 and 2022 on the investigated territory were extracted from the FIRMS (Fire Information for Resource Management System) (https://firms.modaps.eosdis.nasa.gov) and MODIS (MCD64A1) burned area monthly Global 500 m products (https://developers.google.com/earth-engine/datasets/catalog/MODIS_061_MCD64A1). Specifically, these data were used to assist in separating the area of forest fires from non-fire events by overlaying and comparing them with potential disturbance points. The overall methodology of the whole process and work flow used in this research are shown in Figure 3.
2.2.2. Temperature, precipitation, and wind speed
The simulated climate data for the Middle Volga region over the period 2000–2022 (May to September) were acquired from a number of gridded datasets (Table 1). We used the MOD11A1 and MOD11A2 archive datasets for the estimation of the maximum and average monthly land surface temperature (LST) values in Celsius (0C) at 1-km spatial resolution and 8-day composite (https://ladsweb.modaps.eosdis.nasa.gov/archive/allData). We also used the Global Precipitation Measurement (GPM) IMERG (Integrated Multi-satellitE Retrievals for GPM) Final Precipitation L3 Half Hourly 0.10 x 0.10 V06 (GPM_3IMERGHH) product to determine the gridded monthly average precipitation (Pr) values in the studied region (https://giovanni.gsfc.nasa.gov/giovanni/). The monthly average surface wind speed (Ws, m/s) for the research area was obtained from the MERRA-2 collection (Modern-Era Retrospective Analysis for Research and Applications version 2) produced by NASA Global Modelling and Assimilation Office (GMAO) (https://disc.gsfc.nasa.gov/datasets/M2TMNXFLX_5.12.4/summary).
We also prepared a regular grid with a cell size of 1x1 km covering the BA in the Middle Volga region for each of the estimated 2000–2022 years. In the centre of each cell, the value of each of the climatic parameters was determined, and the area of the burnt forest was estimated. A correlation analyses and multivariate linear regression were applied for each cell’s centre to determine the degree of influence of BA and the climatic parameters (LST, Pt, and Ws). We considered all possible temporal aggregations of the climate variable through the estimated period. The calculated correlation and regression coefficients for each grid cell were analysed on monthly and annual spatial scales. To evaluate the performance of the best-fit regression model, the estimated BA was evaluated against the climatic factors (jointly or separately) by the root mean square error (RMSE), mean square error (MSE), and the coefficient of determination (R2).
2.2.3. LandTrendr algorithm
In order to trace the dynamics of the burnt forest areas, the prepared stacks of Landsat images were analysed using the LandTrendr (LT) algorithm in the GEE platform [73]. The LandTrendr performs a temporal segmentation algorithm and a fitting approach for a single spectral value for each Landsat image pixel in each year to assure a consistent time series and minimise sensor influences. We processed the stack of images in the LandTrendr using a medoid selection process [74], a multi-dimensional analogue of the median, with the buildSRcollection code. For each pixel, the medoid technique was selected from the Landsat TM/ ETM+/OLI data, and spectral values were compared to the median spectral values of that pixel across all visible and infrared bands in all acquired images.
Finally, LT chooses the pixel with a minimum sum of squared differences between observations and the median spectral values (using Euclidean distance), which can reduce data volume and also minimize atmospheric impact [75]. As a result, we received an aggregated stack of Landsat images for a 22-year time series where pixel spectral values were interpolated and the year-to-year noise was reduced. Then, to infer the forest fire connection with other factors (LST, Pt, and Ws), the chosen pixels of the time series were converted to the normalized burn ratio (NBR), which is the most widely used index for the mapping of BA [76]. A spatial filter with a minimum BA unit of 0.5 ha was also applied. Isolated and border pixels were excluded by means of neighbourhood filters with regard to improving the BA spatial consistency. For the creation of NBR mosaics, we filtered Landsat imagery dates according to pre-fire and post-fire events. The BA areas were allocated if they presented at least 3 positive values of the NBR during each year over the investigated territory. These strategies guaranteed the high extraction accuracy of the BA and allowed us to produce NBR time-series data from Landsat images for the 22-year (May–September) period. The LT-derived forest BA were confirmed to coincide with the forest loss in MODIS data for the same year.
A Mann-Kendall (MK) nonparametric statistical test was implemented to estimate the monotonic trend behaviour (p < 0.05) of the LST, Pr, and Ws factors based on the Landsat time series [77,78]. The rate of the change and magnitude of the estimated factor’s trends were assessed by means of the Theil-Sen’s slope estimator, a non-parametric technique for assessing the median slope [79,80]. Both of these tests, which the World Meteorological Organization has recommended for application in climate studies, are widely used in trend analyses [81,82,83].
2.2.4. Reference data and statistical validation
In order to validate the forest BA mapping and trend analysis, we identified 546 forest BA samples from 2000 to 2022 on the basis of high-resolution satellite imagery from publicly available Google Earth and Yandex maps platforms for the investigated territory using the visual interpretation method [84]. Additionally, during the summer period (June–August) in 2011, 2012, 2014, 2017, 2019, 2020, and 2022, the Volgatech team carried out field campaigns on the burnt areas of the Middle Volga region. Sample plots (at least 90 by 90 m) were selected to represent the full range of stand age groups, tree species, and structures typically occurring in the region. Diameter at breast height (DBH) (1.3 m), tree height, char height, and crown length were measured for each tree using a laser clinometer and meter tape as indicators of tree mortality (standing or fallen). During the field campaign, we collected data from 323 sample plots randomly distributed primarily in conifer and broadleaved mixed stands on burnt areas of the investigated territory. For estimation of the woody detritus on sample plots, each stump and log with a diameter exceeding 10 cm and more than 1 minlength was measured [14]. The sample plots were representative of the overall characteristics of the investigated area (forest type, altitude, climate).
The gathered set of sample plots was used as input data for the confusion matrices and to estimate detection accuracy levels of burnt area derived from the Landsat images. Only two classes (burnt area and non-burnt area) were considered in the confusion matrix. The accuracy assessment of the BA maps was based on the comparison of proportions for each pixel detected in LT as burnt or unburnt in the Landsat images and the prepared reference data. Four accuracy metrics derived from confusion matrices were calculated to validate the BA detection: the user’s accuracy (UA), the commission error (CE), the producer’s accuracy (PA), and the omission error (OE) [85]. We also computed the overall accuracy (OA) and F-score, which estimates the test’s accuracy.
3. Results
3.1. Accuracy assessment
The NBR LandTrendr data from 2000–2022 based on Landsat time series imagery were used to analyse the spatial distribution of BA in the Middle Volga. Figure 4 shows the spatial distribution of the BA in the region, and Table S1 (supplementary information) shows the error matrix derived from the reference set of samples. For the BA statistical validation, we used the visual interpretation of 869 (7,901 pixels) test sites to allow for evaluation of the UA, PA, overall accuracy, and F-score between the Landsat time series and reference set of samples. The accuracy of the BA mapping was high, with an overall accuracy of 84.5% for the 22 years (see Table S1 in supplementary information). The user’s and producer’s accuracies were also above 80%, while the F-score value was 82%. Our results of the LandTrendr mapping analyses indicate that they were consistently accurate and reliable, and the final BA map can be used for the subsequent analysis with the climatic factors.
3.2. Spatial and temporal distribution of BA
We observed that BA may occur all over the study region, with some burnt areas spatially located in the western and central parts of the Middle Volga forests. Over the past 22 years, the total forest BA was about 280 thousand ha, which constitutes 1.7% of the land surface area or 4.0% of the total forested area (6,881 mln. ha) in the studied territory of the Middle Volga region. There was a significant inter-annual variation among the 318 identified BA all over the investigated forest area, which ranges between 0.075 and 244 thousand ha (Figure 4а). As it can be seen from Figure 4, there are BAs in all oblasts and republics of the region, while most of them are concentrated in the forest cover of the Republic Mari El and Nizhegorodskaya oblast. The smallest identified wildfire in the Middle Volga region damaged the forest area of 0.5 ha, while the largest identified BA was 86.6 thousand ha in the Nizhegorodskaya oblast (Figure 5b).
The largest forest BA of 244,2 thousand ha was observed on the investigated territory after the disastrous wildfires of 2010 (Figure 6a), which significantly affected their distribution during the study period. In this respect, to estimate the spatial and temporal distribution of the BA during the years with relatively few wildfires, some calculations and figures in the study were carried out without this anomalous year (Figure 6b–d).
The annual average BA in the region was 12.2 thousand ha. The overall polynomial trend (R2= 0.65) indicates that averaged BA after 2010 wildfires is increasing by 1.970 thousand ha/year (Figure 6b). The second and third largest forest BA were detected in 2002 and 2021-2022, with areas of about 5.1 thousand ha and 18.4 thousand ha, respectively. Both of these highest BA peaks followed a decade-long period of relatively infrequent wildfires. This is especially true for the 2021 forest fires, when only 5.325 thousand ha (0.08% of the forested area) burned between 2010 and 2020. The smallest BA of 76 ha was observed in the region in 2008.
The BA data analysis indicates that most forest fires in the Middle Volga region occurred in the summer dry season between June and August, when the monthly average precipitation was < 50 mm, the average wind speed was 5 m/s, and the average temperature was 26.4°C. The largest forest BA was observed in July, with an average of 21.232 thousand ha (Figure 6c–d) or 1.5 thousand ha (without abnormal wildfires in 2010). The average BA during the vegetation season was 0.256 thousand ha in May, 2.575 thousand ha in June, and 0.656 thousand ha in August.
Most of the wildfires occurred in coniferous and deciduous forest stands, while young forests and shrub-dominated lands were less exposed to fire hazards. Specifically, coniferous forest stands (consisting mainly of middle-aged and mature pine and spruce species) are the most fire-prone ecosystems, accounting for 59.0% (164.9 thousand ha) of the total BA (Figure 5e), whereas deciduous stands (mainly middle-aged and mature birch and populous species) accounts for 25.1% (70.2 thousand ha). The BA of mixed forest stands was 9,6% (about 26,8 thousand ha), while the BA of young forest (including plantations and shrublands) accounted for 6.3% (17.7 thousand ha) (Figure 6e).
3.3. Fire Recurrence
The recurrence of wildfires in some forested areas of the Middle Volga region leads to their disturbance. In the analysed region, there were around 279.524 thousand ha (4%) of forests that burned at least once between 2000 and 2022. The total unburnt area of 96% varied significantly all over the investigated region in the 22-years study period. The fires occurred in the Republic Mari El and Nizhegorodskaya oblast on 7.8% and 4.9% of the forested area, respectively. The Chuvashia Republic is characterised by high forest fragmentation. As a result of this fragmentation, the cumulative BA covers 3.2% of the forested area with very low connectivity. Furthermore, it has little fire recurrence, whereas most of the BA featured none over the investigated 22 years.
The analysis of forest fire frequency between 2000 and 2022 (Figure 4) indicates that fire occurrences in the region are mainly irregular, with the highest wildfire frequency of 7.3 over a 22-year period. The maximum fire recurrence (three times) during the study period was identified in a small area of 363 ha, or 0.1% of the overall BA, in the forests of Nizhegorodskaya oblast (see Figure 4 b). Only 8,593 ha (3%) of BA were detected two times in the same area over the 22-year period (see Figure 4c–d), and these wildfires predominantly occurred in the Mari El and Nizhegorodskaya oblast. The analysis of BA occurrence within the research area boundaries shows that the highest fire activity mainly affected the territory of coniferous-deciduous (mixed) forests (99.5%) of the European part of the Russian Federation. The coolest fragment of the South Taiga region was disturbed by wildfires mainly in 2010 on a small area (0.5 %) in the Kirov region of the Middle Volga region. Most of the recurrence wildfires occurred in coniferous and deciduous forest areas, while mixed stands showed fewer repeated BA.
3.4. Effect of climatic factors on BA
3.4.1. Spatiotemporal trend analyses
Based on the Mann-Kendall τ (tau) correlation coefficient and Theil-Sen’s slope (TSS) analysis, the trend of the climatic parameters on a pixel scale was analysed for the forest area during the vegetation season in the Middle Volga region over the period 2000-2022 (Table 2). Figure 7 shows the monotonic trends of tau and TSS in the Landsat time series for the mean LST, Pr and Ws, highlighting areas with an increasing trend (in red) and a decreasing trend (in blue).
With a slope of – 0.27 in Pr, the eastern part of the investigated area, characterised by infrequent wildfire occurrences, shows the largest decreasing trend (Figure 7b, Table 2). Increasing trends in LST occur in central and western parts of the region (Mari El and Nizhny Novgorod), corresponding to the main forest BA. Similar to LST, the effect of precipitation on BA is generally positive all over the investigated territory, as shown in Figure 7b. Increased precipitation in the area (mainly the eastern part of Mari El and the western part of Tatarstan) reduces forest fire occurrences. The magnitudes of Ws are generally high in the eastern and central forested parts of the region and low in the west (Figure 7c). On the whole, the contribution of LST to BA in Middle Volga on the seasonal scale is more significant than Pr and Ws.
3.4.2. Regression analyses of climate data and BA
The correlation analyses results (Figure 8) indicated that climatic factors played a relatively important role in the BA trend during the investigated period. Overall, the change in the temperature (LST) was more significant for BA than the variability in precipitation. In order to estimate the impacts of past meteorological trends (mean temperature, precipitation, and wind speed), we also built a multivariable regression model describing the climate - forest BA interactions over the period 2000–2022. The best equation with a higher fit of combined climatic factors considered (P-value < 0.05) was the one using the monthly mean of LST, Wt and Pr averaged over the estimated period (May to September):
The R2 statistic indicates that the model as fitted explains 36% of the variability in BA. The regression produced a model showing that LST and Ws during the summer season significantly influenced the BA distribution (Figure 8). Specifically, in May and July, the spatial correlation between BA and Ws was higher (R2=0.48) in the western and central parts of the region (Figure 8). In autumn (September), there was a positive correlation between LST and BA (R2= 0.58), while the effects of Pr and Ws were weak (< 0.28) and insignificant. Meanwhile, in July, the Pr and Ws were also considered important variables. The main driving climatic factors for BA were different during the vegetation season, and therefore it is challenging to determine a single one as the main contributor to the forest fires in the region.
4. Discussion
The study provided a trend analysis of the spatial and temporal patterns of forest burnt areas in the Middle Volga region of the Russian Federation based on Landsat time series images for the period 2000–2022. We have taken advantage of using the LandTrendr algorithm in the GEE cloud computing environment to estimate the degree of climatic factors (LST, Pt, and Ws) influence on the BA distribution and forest fire recurrence on a large spatiotemporal scale. Our results confirmed a high potential for using the GEE platform to consistently and cost-effectively estimate BA on large forest lands since the platform provides easy access to a large number of satellite data resources. The GEE also offers many useful ready-made products, machine learning algorithms, and the possibility of simple programming in a JavaScript environment [67,68].
The accuracy of the produced maps was assessed using a confusion matrix and several indices on the basis of reference data from the public available Google Earth and Yandex Maps platforms, and the ground sample plots were randomly stratified all over the investigated BA. Without field survey data, BA detection is usually performed with the use of available empirical literature sources, which may result in less reliable outcomes in the context of comprehensive LandTrendr analysis. In this sense, in our research, the field survey (on-ground) data were very useful to identify small BA that were not recognised from the Landsat imagery data alone. The overall accuracy was higher than 84%, and the F-score value was 82%, which shows reliable results of the proposed algorithm for detecting burnt and unburnt forest areas in the investigated region.
In the study, we detected more forest BA (fires > 0.5 ha) than from the MCD64A1 product due to the higher spatial resolution provided by the Landsat imagery in GEE compared to the MODIS (fires > 25 ha). We found that during the 22-year period, the total forest area in the Middle Volga region disturbed by wildfires was approximately 280 thousand ha (4.0% of the total forested area), with a particularly large proportion of burnt coniferous stands (59% of the total BA). There is a large variability in the relative contributions of different republics and oblasts within the investigated territory of the Middle Volga region to the overall amount of BA, and the vast majority of them occur in the Republic Mari El and Nizhegorodskaya oblast.
Generally, fire occurrences in the forest area were mainly irregular, with the highest frequency in 2002, 2010, and 2021 (Figure 6 a-b). The forests of the South Taiga region were significantly less affected by the wildfire. About 3% of BA were twice affected by the wildfires over the 22-year period, mainly in the coniferous (primarily Scots pine) plantation forests. These young dense stands are extremely vulnerable to burning as they readily support fire from the ground into the crowns through ladder fuels of the lower branches [12]. According to the national post-fire management plans, pine species are favourable due to their natural tendency to release seeds after wildfire and in terms of preferential industrial wood production. However, the regeneration of coniferous stands in the Middle Volga region increases the danger of wildfires, which poses a direct threat to local communities and property.
The importance of climatic factors in the estimation of BA with the use of satellite imagery was also well regarded in other regions of the world [38,40,86,87,88]. Our results show that in the long-term Landsat trend analysis of climatic factors (LST, Pr and Ws), the Theil-Sen’s slope estimate and Mann-Kendall tau test were found to be suitable indicators to predict the occurrence and spread of wildfires on a vast territory of the Middle Volga region. According to the LandTrendr and regression analyses performed in the research, the estimated climatic factors had a significant influence on the wildfires (burnt areas) in the region at the 95% confidence level. The most important was LST, which has a more consistent correlation with forest BA compared with the other two climatic factors. During the spring-autumn seasons, increasing trends in LST occur mainly in the central and western parts of the region (the Republic Mari El and Nizhegorodskaya oblast), dominated by coniferous and deciduous forest stands.
The Ps is also an important factor, followed by LST to evaluate the spatiotemporal distribution of BA in terms of the correlation coefficient and trend analyses during the burning seasons (see Figure 7 and Figure 8). Since the 21st century, precipitation has shown a decreasing trend on the majority of BA in the Middle Volga region. The central and south-western forest areas are more prone to drought than the north-western parts of the region. Therefore, if these climatic trends continue in the future, high temperatures and poor rainfall during the spring-summer season can easily cause wildfires. The wind speed factor, showing an increasing spatio-temporal trend all over the forest area, was also positively correlated with BA. The significant positive correlations between Ws and BA mainly occur in May and July. Strong wind and higher LST in spring and summer also reduce the moisture content of the forest floor combustibles, which in turn increases the probability and duration of fire outbreaks. Eventually, these three climatic factors (LST, Pr and Ws) represent an important point towards understanding the climate change impacts on the increased fire activity over the past two decades.
Although important results were obtained in this study, further research may improve and expand the analyses carried out. In addition to climatic aspects, forest BA could also be affected by other driving factors, such as topography, structure of forest stands, composition of undergrowth, soil moisture, forest litter, and socio-economic data of the region corresponding to each satellite imagery. Due to the lack of valid ground-truth data in remote forest areas of the Middle Volga region, as well as the limited capacity of temporal, spectral and spatial resolution of Landsat imagery [89], some small BA were not detected in the estimated time-series data. A possible alternative to overcome these shortcomings could be the combination of the Landsat and Sentinel imagery [90,91,92], the application of the more sensitive spectral indices, and supplementary field survey data. Future research in the field of BA should also aim at improved attribution algorithms and alternative scenarios of climate change for future forest management policies, land use, and resilience aspects that more explicitly consider the prevention or adaptation of forest ecosystems to the changing environment.
We suggest that our methodological approach can be applied to forest BA mapping and the estimation of climatic factor trends in other coniferous-deciduous forest regions of the Russian Federation due to the high detection accuracy in such diverse and extended landscapes as the Middle Volga region. Maps, regression models, and trends of climatic factors at a spatial resolution that are relevant to forest management and monitoring can be used by local authorities and decision-makers in strategic planning aimed at preventing or mitigating the risk of wildfires occurrences. The regions that are prone to widespread forest fires, such as the Republic Mari El and Nizhegorodskaya oblast, should be given higher priority when fulfilling fire protection activities.
5. Conclusions
This research showed that long-term trend analysis of the pre-processed NBR Landsat time series with the use of the LandTrendr algorithm in the Google Earth Engine platform is a practical means to detect and map the location and magnitude of the temporal dynamics of the forest burnt area on the example of the Middle Volga region of the Russian Federation. Our study has provided essential characteristics and patterns of BA from 2000 to 2022 on regional and seasonal scales in the Middle Volga region and analysed interactions with its climatic factors. The high overall accuracy (> 84.0%) achieved in the research indicates that deep learning algorithms can be cost-effectively and successfully applied to the time series remote sensing data for analyses of forests affected by wildfires on a large spatiotemporal scale. We demonstrated that there was an increasing trend of forest BA annually from 2000 to 2022 across the Middle Volga region. Most forest BAs are found in the central and western parts of the investigated region, with a particularly large proportion in coniferous ecosystems (59%). This study suggests that positive spatio-temporal trends of LST and Ws factors and negative Pr are related to the forest BA in the region. These three climatic factors are good indicators for projecting the occurrence and dynamics of wildfires during the late spring-summer period. The findings can facilitate management decisions in projecting cost-effective strategies for the prevention of forest fires under the conditions of climate change.
Supplementary Materials
The following supporting information can be downloaded at the website of this paper posted on Preprints.org.
Author Contributions
Conceptualization, E.K., O.V., J.S., and J.W.; methodology, E.K., O.V., J.S., and J.W.; software, S.L., D.D., A.G., and Y.W.; validation, E.K., O.V., S.L., D.D. and L.T.; formal analysis, E.K., O.V., J.W., and S.L; investigation, O.V., S.L., D.D., A.G., L.T., and Y.W.; resources, S.L, A.G., L.T., D.D. and Y.W.; data curation, S.L., D.D., A.G. and L.T; writing—original draft preparation, E.K., O.V.; writing—review and editing, E.K., J.S., O.V., and J.W.; visualization, D.D., A.G., S.L, and Y.W.; supervision, E.K.; project administration, E.K., J.S., and J.W; funding acquisition, E.K. All authors have read and agreed to the published version of the manuscript.
Funding
The reported study was funded in the framework of Russian Science Foundation grant No. 22-16-00094, https://rscf.ru/project/22-16-00094/
Institutional Review Board Statement
Not applicable.
Informed Consent Statement
Not applicable.
Data Availability Statement
The data presented in this study is available in the article. More information is available on request from the corresponding authors.
Acknowledgments
The authors are grateful to the anonymous reviewers for their valuable feedback and guidance in improving the initial version of this manuscript in multiple ways.
Conflicts of Interest
The authors declare no conflict of interest. The funders had no role in the design of the study; in the collection, analyses, or interpretation of data; in the writing of the manuscript; or in the decision to publish the results.
References
- Turco, M.; Abatzoglou, J.T.; Herrera, S.; Cvijanovic, I. Anthropogenic climate change impacts exacerbate summer forest fires in California. PNAS 2023, 120, e2213815120. [Google Scholar] [CrossRef] [PubMed]
- Li, Y.; Wu, Z.; Xu, X.; Tong, X.; Liu, J. Forest disturbances and the attribution derived from yearly Landsat time series over 1990–2020 in the Hengduan Mountains Region of Southwest China. For. Ecosyst. 2021, 8, 73. [Google Scholar] [CrossRef]
- Špulák, P. Wildland fires in the Czech Republic—Review of Data Spanning 20 Years. ISPRS Int. J. Geo-Inf. 2022, 11, 289. [Google Scholar] [CrossRef]
- Molina-Terren, D.M.; Xanthopoulos, G.; Diakakis, M.; Ribeiro, L.; Caballero, D.; Delogu, G.M.; Viegas, D.X.; Silva, C.A.; Cardil, A. Analysis of forest fire fatalities in Southern Europe: Spain, Portugal, Greece and Sardinia (Italy). Int. J. Wildland Fire 2019, 28, 85–98. [Google Scholar] [CrossRef]
- Federal State Statistic Service. Statistika okruzhayushchej prirodnoj sredy i prirodopol'zovaniya (in Russian). 2011, 6, 150. Available online: https://rosstat.gov.ru (accessed on 04 December 2023).
- Federal State Statistic Service. Statistika okruzhayushchej prirodnoj sredy i prirodopol'zovaniya (in Russian). 2018, 6, 127. Available online: https://rosstat.gov.ru (accessed on 04 December 2023).
- Cohen, W.B.; Yang, Z.; Stehman, S.V.; Schroeder, T.A.; Bell, D.M. , Masek, J.G.; Huang, C.; Meigs G.W. Forest disturbance across the conterminous United States from 1985–2012: The emerging dominance of forest decline. For. Ecol. Manage. 2016, 360, 242–252. [Google Scholar] [CrossRef]
- Iglesias, V.; Balch, J.K.; Travis, W.R. U.S. fires became larger, more frequent, and more widespread in the 2000s. Science Advances 2022, 8, eabc0020. [Google Scholar] [CrossRef]
- Parente, J.; Tonini, M.; Stamou, Z.; Koutsias, N.; Pereira, M. Quantitative assessment of the relationship between Land Use/Land Cover Changes and wildfires in Southern Europe. Fire 2023, 6, 198. [Google Scholar] [CrossRef]
- Kalogiannidis, S.; Chatzitheodoridis, F.; Kalfas, D.; Patitsa, C.; Papagrigoriou, A. Socio-psychological, economic and environmental effects of forest fires. Fire 2023, 6, 280. [Google Scholar] [CrossRef]
- Lindner, M.; Maroschek, M.; Netherer, S.; Kremer, A.; Barbati, A.; Garcia-Gonzalo, J.; Seidl, R.; Delzon, S.; Corona, P.; Kolström, M.; Lexer, M.J.; Marchetti, M. Climate change impacts, adaptive capacity, and vulnerability of European forest ecosystems. For. Ecol. Manage. 2010, 259, 698–709. [Google Scholar] [CrossRef]
- Loboda, T.; Krankina, O.; Savin, I.; Kurbanov, E.; Joanne, H. Land Management and the impact of the 2010 extreme drought event on the agricultural and ecological systems of European Russia. In Land-Cover and Land-Use Changes in Eastern Europe after the Collapse of the Soviet Union in 1991; Gutman, G., Volker, R., Eds.; Springer International Publishing: Switzerland AG, 2017; pp. 173–192. [Google Scholar]
- FAO; UNEP. The State of the World’s Forests 2020. In Forests, Biodiversity and People; FAO: Rome, Italy, 2020; p. 214. [Google Scholar]
- Kurbanov, E.; Vorobyev, O.; Leznin, S.; Polevshikova, Y.; Demisheva, E. Assessment of burn severity in Middle Povozhje with Landsat multitemporal data. Int. J. Wildland Fire 2017, 26, 772–782. [Google Scholar] [CrossRef]
- Churchill, D.J.; Jeronimo, S.M.A.; Hessburg, P.F.; Cansler, C.A.; Povak, N.A.; Kane, V.R.; Lutz, J.A.; Larson, A.J. Post-fire landscape evaluations in Eastern Washington, USA: Assessing the work of contemporary wildfires. For. Ecol. Manag. 2022, 504, 119796. [Google Scholar] [CrossRef]
- Souza-Alonso, P.; Saiz, G.; García, R.A.; Pauchard, A.; Ferreira, A.; Merino, A. Post-fire ecological restoration in Latin American forest ecosystems: Insights and lessons from the last two decades. For. Ecol. Manag. 2022, 509, 120083. [Google Scholar] [CrossRef]
- Kukavskaya, E.A.; Buryak, L.V.; Shvetsov, E.G.; Conard, S.G.; Kalenskaya, O.P. The impact of increasing fire frequency on forest transformations in southern Siberia. For. Ecol. Manag. 2016, 382, 225–235. [Google Scholar] [CrossRef]
- Zúñiga-Vásquez, J.M.; Villanueva-Díaz, J.; Cerano-Paredes, J.; Quiñonez-Barraza, G. Impact of fire history on the structure of a temperate forest in Northern Mexico. Fire 2023, 6, 19. [Google Scholar] [CrossRef]
- Fan, Z.; Song, A.; Dong, L.; Alexander, H.D.; Yang, S.; Cheng, N.; Jonathan, L.; Pitchford, J.L. Fire effects on post-invasion spread of Chinese tallow (Triadica sebifera) in wet pine flatwood ecosystems in the southeastern United States. For. Ecol. Manag. 2021, 500, 119658. [Google Scholar] [CrossRef]
- Merriam, K.E.; Meyer, M.D.; Coppoletta, M.; Butz, R.J.; Estes, B.L.; Farris, C.A.; North, M.P. Reestablishing natural fire regimes to restore forest structure in California’s red fir forests: The importance of regional context. For. Ecol. Manage. 2022, 503, 119797. [Google Scholar] [CrossRef]
- Bergeron, Y.; Gauthier, S. , Flannigan, M., Kafka, V. Fire regimes at the transition between mixed wood and coniferous boreal forest in Northwestern Quebec. Ecology 2004, 85, 1916–1932. [Google Scholar] [CrossRef]
- Scheper, A.C.; Verweij, P.A.; van Kuijk, M. Post-fire forest restoration in the humid tropics: A synthesis of available strategies and knowledge gaps for effective restoration. Sci. Total Environ. 2021, 771, 144647. [Google Scholar] [CrossRef]
- Rossi, F.S.; de Santos, G.A.A. Fire dynamics in Mato Grosso State, Brazil: the relative roles of gross primary productivity. Big Earth Data 2020, 4, 23–44. [Google Scholar] [CrossRef]
- Hao, B.; Xu, X.; Wu, F.; Tan, L. Long-term effects of fire severity and climatic factors on post-forest-fire vegetation recovery. Forests 2022, 13, 883. [Google Scholar] [CrossRef]
- López-Cruz, S.d.C.; Aryal, D.R.; Velázquez-Sanabria, C.A.; Guevara-Hernández, F.; Venegas-Sandoval, A.; Casanova-Lugo, F.; La O-Arias,M. A.; Venegas-Venegas, J.A.; Reyes-Sosa, M.B.; Pinto-Ruiz, R.; et al. Effect of prescribed burning on tree diversity, biomass stocks and soil organic carbon storage in tropical highland forests. Forests 2022, 13, 2164. [Google Scholar] [CrossRef]
- Bataineh, M.; Portner, B.; Pelkki, M.; Ficklin, R. Prescribed fire first-order effects on oak and maple reproduction in frequently burned upland oak–hickory forests of the Arkansas Ozarks. Forests 2022, 13, 1865. [Google Scholar] [CrossRef]
- Han, Z.; Geng, G.; Yan, Z.; Chen, X. Economic loss assessment and spatial–temporal distribution characteristics of forest fires: empirical evidence from China. Forests 2022, 13, 1988. [Google Scholar] [CrossRef]
- Kitzberger, T.; Tiribelli, F.; Barberá, I.; Gowda, J.H.; Morales, J.M.; Zalazar, L.; Paritsis, J. Projections of fire probability and ecosystem vulnerability under 21st century climate across a trans-Andean productivity gradient in Patagonia. Sci. Total Environ. 2022, 839, 156303. [Google Scholar] [CrossRef] [PubMed]
- Ponomarev, E.; Zabrodin, A.; Ponomareva, T. Classification of fire damage to boreal forests of Siberia in 2021 based on the dNBR index. Fire 2022, 5, 19. [Google Scholar] [CrossRef]
- Castro, I.; Stan, A.B.; Taiqui, L.; Schiefer, E.; Ghallab, A.; Derak, M.; Fulé, P.Z. Detecting fire-caused forest loss in a Moroccan protected area. Fire 2022, 5, 51. [Google Scholar] [CrossRef]
- Fairman, T.A.; Bennett, L.T.; Nitschke, C.R. Short-interval wildfires increase likelihood of resprouting failure in fire-tolerant trees. J. Environ. Manag. 2019, 231, 59–65. [Google Scholar] [CrossRef]
- Vadrevu, K.P.; Eaturu, A.; Badarinath, K. Fire risk evaluation using multicriteria analysis—A case study. Environ. Monit. Assess. 2010, 166, 223–239. [Google Scholar] [CrossRef] [PubMed]
- Duff, T.J.; Penman, T.D. Determining the likelihood of asset destruction during wildfires: modelling house destruction with fire simulator outputs and local-scale landscape properties. Saf. Sci. 2021, 139, 105196. [Google Scholar] [CrossRef]
- FAO. Global Forest Resources Assessment 2020: Main Report; FAO: Rome, Italy, 2020; p. 184. [Google Scholar]
- Barrett, K.; Baxter, R.; Kukavskaya, E.; Balzter, H.; Shvetsov, E.; Buryak, L. Postfire recruitment failure in Scots pine forests of southern Siberia. Rem. Sens. Environ. 2020, 237, 111539. [Google Scholar] [CrossRef]
- Parente, J.; Tonini, M.; Stamou, Z.; Koutsias, N.; Pereira, M. Quantitative assessment of the relationship between land use/land cover changes and wildfires in Southern Europe. Fire 2023, 6, 198. [Google Scholar] [CrossRef]
- Kurbanov, E.; Vorobev, O.; Lezhnin, S.; Sha, J.; Wang, J.; Li, X.; Cole, J.; Dergunov, D.; Wang, Y. Remote sensing of forest burnt area, burn severity, and post-fire recovery: a review. Rem. Sens. 2022, 14, 4714. [Google Scholar] [CrossRef]
- Somnath, B.; Bikash, R.P.; Gareth, R.; Arvind, C.P.; Prasenjit, A.; Jadunandan, D. Spatio-temporal characterization of landscape fire in relation to anthropogenic activity and climatic variability over the Western Himalaya, India. GIScience Remote Sens. 2021, 58, 281–299. [Google Scholar]
- Qiu, J.; Wang, H.; Shen,W. ; Zhang, Y.; Su, H.; Li, M. Quantifying forest fire and post-fire vegetation recovery in the Daxin’anling area of northeastern China using Landsat time-series data and machine learning. Remote Sens. 2021, 13, 792. [Google Scholar] [CrossRef]
- Wang, X.; Di, Z.; Li, M.; Yao, Y. Satellite-derived variation in burned area in China from 2001 to 2018 and its response to climatic factors. Remote Sens. 2021, 13, 1287. [Google Scholar] [CrossRef]
- Koutsias, N.; Karamitsou, A.; Nioti, F.; Coutelieris, F. Assessment of fire regimes and post-fire evolution of burned areas with the dynamic time warping method on time series of satellite images—setting the methodological framework in the Peloponnese, Greece. Remote Sens. 2022, 14, 5237. [Google Scholar] [CrossRef]
- Alayan, R.; Rotich, B.; Lakner, Z. A Comprehensive framework for forest restoration after forest fires in theory and practice: A systematic review. Forests 2022, 13, 1354. [Google Scholar] [CrossRef]
- Giglio, L.; Loboda, T.; Roy, D.P.; Quayle, B.; Justice, C.O. An active-fire based burned area mapping algorithm for the MODIS sensor. Remote Sens. Environ. 2009, 113, 408–420. [Google Scholar] [CrossRef]
- Xofis, P.; Buckley, P.G.; Takos, I.; Mitchley, J. Long term post-fire vegetation dynamics in north-east Mediterranean ecosystems. The case of mount Athos Greece. Fire 2021, 4, 92. [Google Scholar] [CrossRef]
- dos Santos, S.M.B.; Duverger, S.G.; Bento-Gonçalves, A.; Franca-Rocha, W.; Vieira, A.; Teixeira, G. Remote sensing applications for mapping large wildfires based on machine learning and time series in northwestern Portugal. Fire 2023, 6, 43. [Google Scholar] [CrossRef]
- Koutsias, N.; Karamitsou, A.; Nioti, F.; Coutelieris, F. Assessment of fire regimes and post-fire evolution of burned areas with the dynamic time warping method on time series of satellite images—setting the methodological framework in the Peloponnese, Greece. Remote Sens. 2022, 14, 5237. [Google Scholar] [CrossRef]
- Morresi, D.; Marzano, R.; Lingua, E.; Motta, R.; Garbarino, M. Mapping burn severity in the western Italian Alps through phenologically coherent reflectance composites derived from Sentinel-2 imagery. Rem. Sens. Environ. 2022, 269, 112800. [Google Scholar] [CrossRef]
- Li, X.; Zhang, H.; Yang, G.; Ding, Y.; Zhao, J. Post-fire vegetation succession and surface energy fluxes derived from remote sensing. Remote Sens. 2018, 10, 1000. [Google Scholar] [CrossRef]
- Meneses, B.M. Vegetation recovery patterns in burned areas assessed with Landsat 8 OLI imagery and environmental biophysical data. Fire 2021, 4, 76. [Google Scholar] [CrossRef]
- Maillard, O. Post-fire natural regeneration trends in Bolivia: 2001–2021. Fire 2023, 6, 18. [Google Scholar] [CrossRef]
- Li, X.; Jin, H.; He, R.; Wang, H.; Sun, L.; Luo, D.; Huang, Y.; Li, Y.; Chang, X.; Wang, L.; Wei, C. Impact of wildfire on soil carbon and nitrogen storage and vegetation succession in the Nanweng'he National Natural Wetlands Reserve, Northeast China. ; CATENA 2023, 221, 106797. [Google Scholar] [CrossRef]
- Bryukhanov, A.V.; Panov, A.V.; Ponomarev, E.I.; Sidenko, N.V. Wildfire impact on the main tree species of the Near-Yenisei Siberia. Izv. - Atmos. Ocean Phys. 2018, 54, 1525–1533. [Google Scholar] [CrossRef]
- Li, X.; Zhang, H.; Yang, G.; Ding, Y.; Zhao, J. Post-fire vegetation succession and surface energy fluxes derived from remote sensing. Remote Sens. 2018, 10, 1000. [Google Scholar] [CrossRef]
- Kukavskaya, E.A.; Shvetsov, E.G.; Buryak, L.V.; Tretyakov, P.D.; Groisman, P.Y. Increasing fuel loads, fire hazard, and carbon emissions from fires in central Siberia. Fire 2023, 6, 63. [Google Scholar] [CrossRef]
- Bondur, V.G.; Gordo, K.A.; Voronova, O.S.; Zima, A.L.; Feoktistova, N.V. Intense wildfires in Russia over a 22-year period according to satellite data. Fire 2023, 6, 99. [Google Scholar] [CrossRef]
- Kharuk, V.I.; Dvinskaya, M.L.; Ranson, K.J. Fire return intervals within the northern boundary of the larch forest in Central Siberia. Int. J. Wildl. Fire 2013, 22, 207–211. [Google Scholar] [CrossRef]
- Ryzhkova, N.; Pinto, G.; Kryshen', A.; Bergeron, Y.; Ols, C.; Drobyshev, I. Multi-century reconstruction suggests complex interactions of climate and human controls of forest fire activity in a Karelian boreal landscape, North-West Russia. For. Ecol. Manag. 2020, 459, 117770. [Google Scholar] [CrossRef]
- Barrett, K.; Baxter, R.; Kukavskaya, E.; Balzter, H.; Shvetsov, E.; Buryak, L. Postfire recruitment failure in Scots pine forests of southern Siberia. Remote Sens. Environ. 2020, 237, 111539. [Google Scholar] [CrossRef]
- Sun, Q.; Burrell, A.; Barrett, K.; Kukavskaya, E.; Buryak, L.; Kaduk, J.; Baxter, R. Climate variability may delay post-fire recovery of boreal forest in southern Siberia, Russia. Remote Sens. 2021, 13, 2247. [Google Scholar] [CrossRef]
- McRae, D.J.; Conard, S.G.; Ivanova, G.A.; Sukhinin, A.I.; Baker, S.P.; Samsonov, Y.N.; Blake, T.W.; Ivanov, V.A.; Ivanov, A.V.; Churkina, T.V. , et al. Variability of fire behavior, fire effects, and emissions in scotch pine forests of central Siberia. Mitig Adapt Strat Glob Change 2006, 11, 45–74. [Google Scholar] [CrossRef]
- Furyaev, V.V. Pyrological regimes and dynamics of the southern taiga forests in Siberia. In Fire in ecosystems of boreal Eurasia. Forestry sciences; Goldammer, J.G., Furyaev, V.V., Eds.; Springer: Dordrecht, 1996; Volume 48. [Google Scholar]
- Chu, T.; Guo, X.; Takeda, K. Remote sensing approach to detect post-fire vegetation regrowth in Siberian boreal larch forest. Ecol. Indic. 2016, 62, 32–46. [Google Scholar] [CrossRef]
- Ostroukhov, A.V. Assessing the extent of landscape fires in the Middle Amur Lowland using long-term satellite data time series. Sovremennye problemy distantsionnogo zondirovaniya Zemli iz kosmosa 2022, 19, 164–175. [Google Scholar] [CrossRef]
- Kurbanov, E.A.; Post, W.M. Changes in area and carbon in forests of the Middle Zavolgie: a regional case study of Russian forests. Climatic Change 2002, 55, 157–171. [Google Scholar] [CrossRef]
- Kurbanov, E. Carbon in pine forest ecosystems of Middle Zavolgie, Russia. In Technical Report 2; European Forest Institute: Finland, 2000. [Google Scholar]
- Lerink, B.; Hassegawa, M.; Kryshen, A.; Kovalev, A.; Kurbanov, E.; Nabuurs, G.J.; Moshnikov, S.; Verkerk, P.J. Climate-smart forestry in Russia and potential climate change mitigation benefits. In Russian Forests and Climate Change. What Science Can Tell Us 11; Leskinen, P., Lindner, M., Verkerk, P.J., Nabuurs, G.J., Van Brusselen, J., Kulikova, E., Hassegawa, M., Lerink, B., Eds.; European Forest Institute: Finland, 2020; pp. 73–103. [Google Scholar]
- Tamiminia, H.; Salehi, B.; Mahdianpari, M.; Quackenbush, L.; Adeli, S.; Brisco, B. Google Earth Engine for geo-big data applications: A meta-analysis and systematic review. ISPRS J. Photogramm. Remote Sens. 2020, 164, 152–170. [Google Scholar] [CrossRef]
- Gorelick, N.; Hancher, M.; Dixon, M.; Ilyushchenko, S.; Thau, D.; Moore, R. Google Earth Engine: Planetary-scale geospatial analysis for everyone. Remote Sens. Environ. 2017, 202, 18–27. [Google Scholar] [CrossRef]
- Foga, S.; Scaramuzza, P.L.; Guo, S.; Zhu, Z.; Dilley, R.D.; Beckmann, T.; Schmidt, G.L.; Dwyer, J.L.; Joseph Hughes, M.; Laue, B. Cloud detection algorithm comparison and validation for operational Landsat data products. Remote Sens. Environ. 2017, 194, 379–390. [Google Scholar] [CrossRef]
- Vermote, E.; Justice, C.; Claverie, M.; Franch, B. Preliminary analysis of the performance of the Landsat 8/OLI land surface reflectance product. Remote Sens. Environ. 2016, 185, 46–56. [Google Scholar] [CrossRef] [PubMed]
- Claverie, M.; Vermote, E.F.; Franch, B.; Masek, J.G. Evaluation of the Landsat-5 TM and Landsat-7 ETM+ Surface Reflectance Products. Remote Sens. Environ. 2015, 169, 390–403. [Google Scholar] [CrossRef]
- Roy, D.P.; Kovalskyy, V.; Zhang, H.K.; Vermote, E.F.; Yan, L.; Kumar, S.S.; Egorov, A. Characterization of Landsat-7 to Landsat-8 reflective wavelength and normalized difference vegetation index continuity. Remote Sens. Environ. 2016, 185, 57–70. [Google Scholar] [CrossRef] [PubMed]
- Kennedy, R.E.; Yang, Z.; Gorelick, N.; Braaten, J.; Cavalcante, L.; Cohen, W.B.; Healey, S. Implementation of the LandTrendr Algorithm on Google Earth Engine. Remote Sens. 2018, 10, 691. [Google Scholar] [CrossRef]
- Flood, N. Seasonal composite Landsat TM/ETM+ images using the Medoid (A multi-dimensional median). Remote Sens. 2013, 5, 6481–6500. [Google Scholar] [CrossRef]
- Cohen, W.B.; Yang, Z.; Healey, S.P.; Kennedy, R.E.; Gorelick, N. A LandTrendr multispectral ensemble for forest disturbance detection. Remote Sens. Environ. 2018, 205, 131–140. [Google Scholar] [CrossRef]
- Key, C.H.; Benson, N.C. Landscape assessment: Remote sensing of severity, the normalized burn ratio. In FIREMON: Fire effects monitoring and inventory system; USDA Forest Service, Rocky Mountain Research Station, Fort Collins: Denver, CO, USA, 2006; pp. 305–325. [Google Scholar]
- Mann, H.B. Nonparametric tests against trend. Econometrica 1945, 13, 245–259. [Google Scholar] [CrossRef]
- Kendall, M.G. Rank correlation methods; Charles Griffin: Oxford, England, 1955. [Google Scholar]
- Sen, P.K. Estimates of the regression coefficient based on Kendall’s tau. J. Am. Stat. Assoc. 1968, 63, 1379–1389. [Google Scholar] [CrossRef]
- Theil, H. A rank-invariant method of linear and polynomial regression analysis. In Henri Theil’s contributions to economics and econometrics; Springer, 1992; pp. 345–381. [Google Scholar]
- Gocic, M.; Trajkovic, S. Analysis of changes in meteorological variables using Mann-Kendall and Sen's slope estimator statistical tests in Serbia. Global and Planetary Change. 2013, 100, 172–182. [Google Scholar] [CrossRef]
- Frazier, R.J.; Coops, N.C.; Wulder, M.A.; Hermosilla, T.; White, J.C. Analyzing spatial and temporal variability in short-term rates of post-fire vegetation return from Landsat time series. Remote Sens. Environ. 2018, 205, 32–45. [Google Scholar] [CrossRef]
- Yuan, J.; Bian, Z.; Yan, Q.; Gu, Z.; Yu, H. An approach to the temporal and spatial characteristics of vegetation in the growing season in Western China. Remote Sens. 2020, 12, 945. [Google Scholar] [CrossRef]
- Hansen, M.C.; Potapov, P.V.; Moore, R.; Hancher, M.; Turubanova, S.A.; Tyukavina, A.; Thau, D.; Stehman, S.V.; Goetz, S.J.; Loveland, T.R. , et al. High-resolution global maps of 21st-century forest cover change. Science 2013, 342, 850–853. [Google Scholar] [CrossRef]
- Congalton, R.G.; Green, K. Assessing the accuracy of remotely sensed data: principles and practices, 3rd ed.; CRC Press, Taylor Francis Group: Boca Raton, FL, USA, 2019. [Google Scholar]
- Xu, Y.; Lin, Z.; Wu, C. Spatiotemporal variation of the burned area and its relationship with climatic factors in Central Kazakhstan. Remote Sens. 2021, 13, 313. [Google Scholar] [CrossRef]
- Perevedentsev, Y.; Sherstyukov, B.; Gusarov, A.; Aukhadeev, T.; Mirsaeva, N. Climate-induced fire hazard in forests in the Volga federal district of European Russia during 1992–2020. Climate 2022, 10, 110. [Google Scholar] [CrossRef]
- Canadell, J.G.; Meyer, C.P. (Mick); Cook, G.D.; Dowdy, A.; Briggs, P.R.; Knauer, J.; Pepler, A.; Haverd, V. Multi-decadal increase of forest burned area in Australia is linked to climate change. Nat Commun. 2021, 12, 6921. [Google Scholar] [CrossRef] [PubMed]
- Zhu, Z.; Wulder, M.A.; Roy, D.P.; Woodcock, C.E.; Hansen, M.C.; Radeloff, V.C.; Healey, S.P.; Schaaf, C.; Hostert, P.; Strobl, P. , et al. Benefits of the free and open Landsat data policy. Remote Sens. Environ. 2019, 2019. 224, 382–385. [Google Scholar] [CrossRef]
- Vanderhoof, M.K.; Hawbaker, T.J.; Teske, C.; Ku, A.; Noble, J.; Picotte, J. Mapping wetland burned area from Sentinel-2 across the Southeastern United States and its contributions relative to Landsat-8 (2016–2019). Fire 2021, 4, 52. [Google Scholar] [CrossRef]
- Roy, D.P.; Huang, H.; Boschetti, L.; Giglio, L.; Yan, L.; Zhang, H.H.; Li, Z. Landsat-8 and Sentinel-2 burned area mapping – A combined sensor multi-temporal change detection approach. Remote Sens. Environ. 2019, 231, 111254. [Google Scholar] [CrossRef]
- Howe, A.A.; Parks, S.A.; Harvey, B.J.; Saberi, S.J.; Lutz, J.A.; Yocom, L.L. Comparing Sentinel-2 and Landsat 8 for burn severity mapping in Western North America. Remote Sens. 2022, 14, 5249. [Google Scholar] [CrossRef]
Figure 1.
Study area location in western Russian Federation on the Landsat scenes.
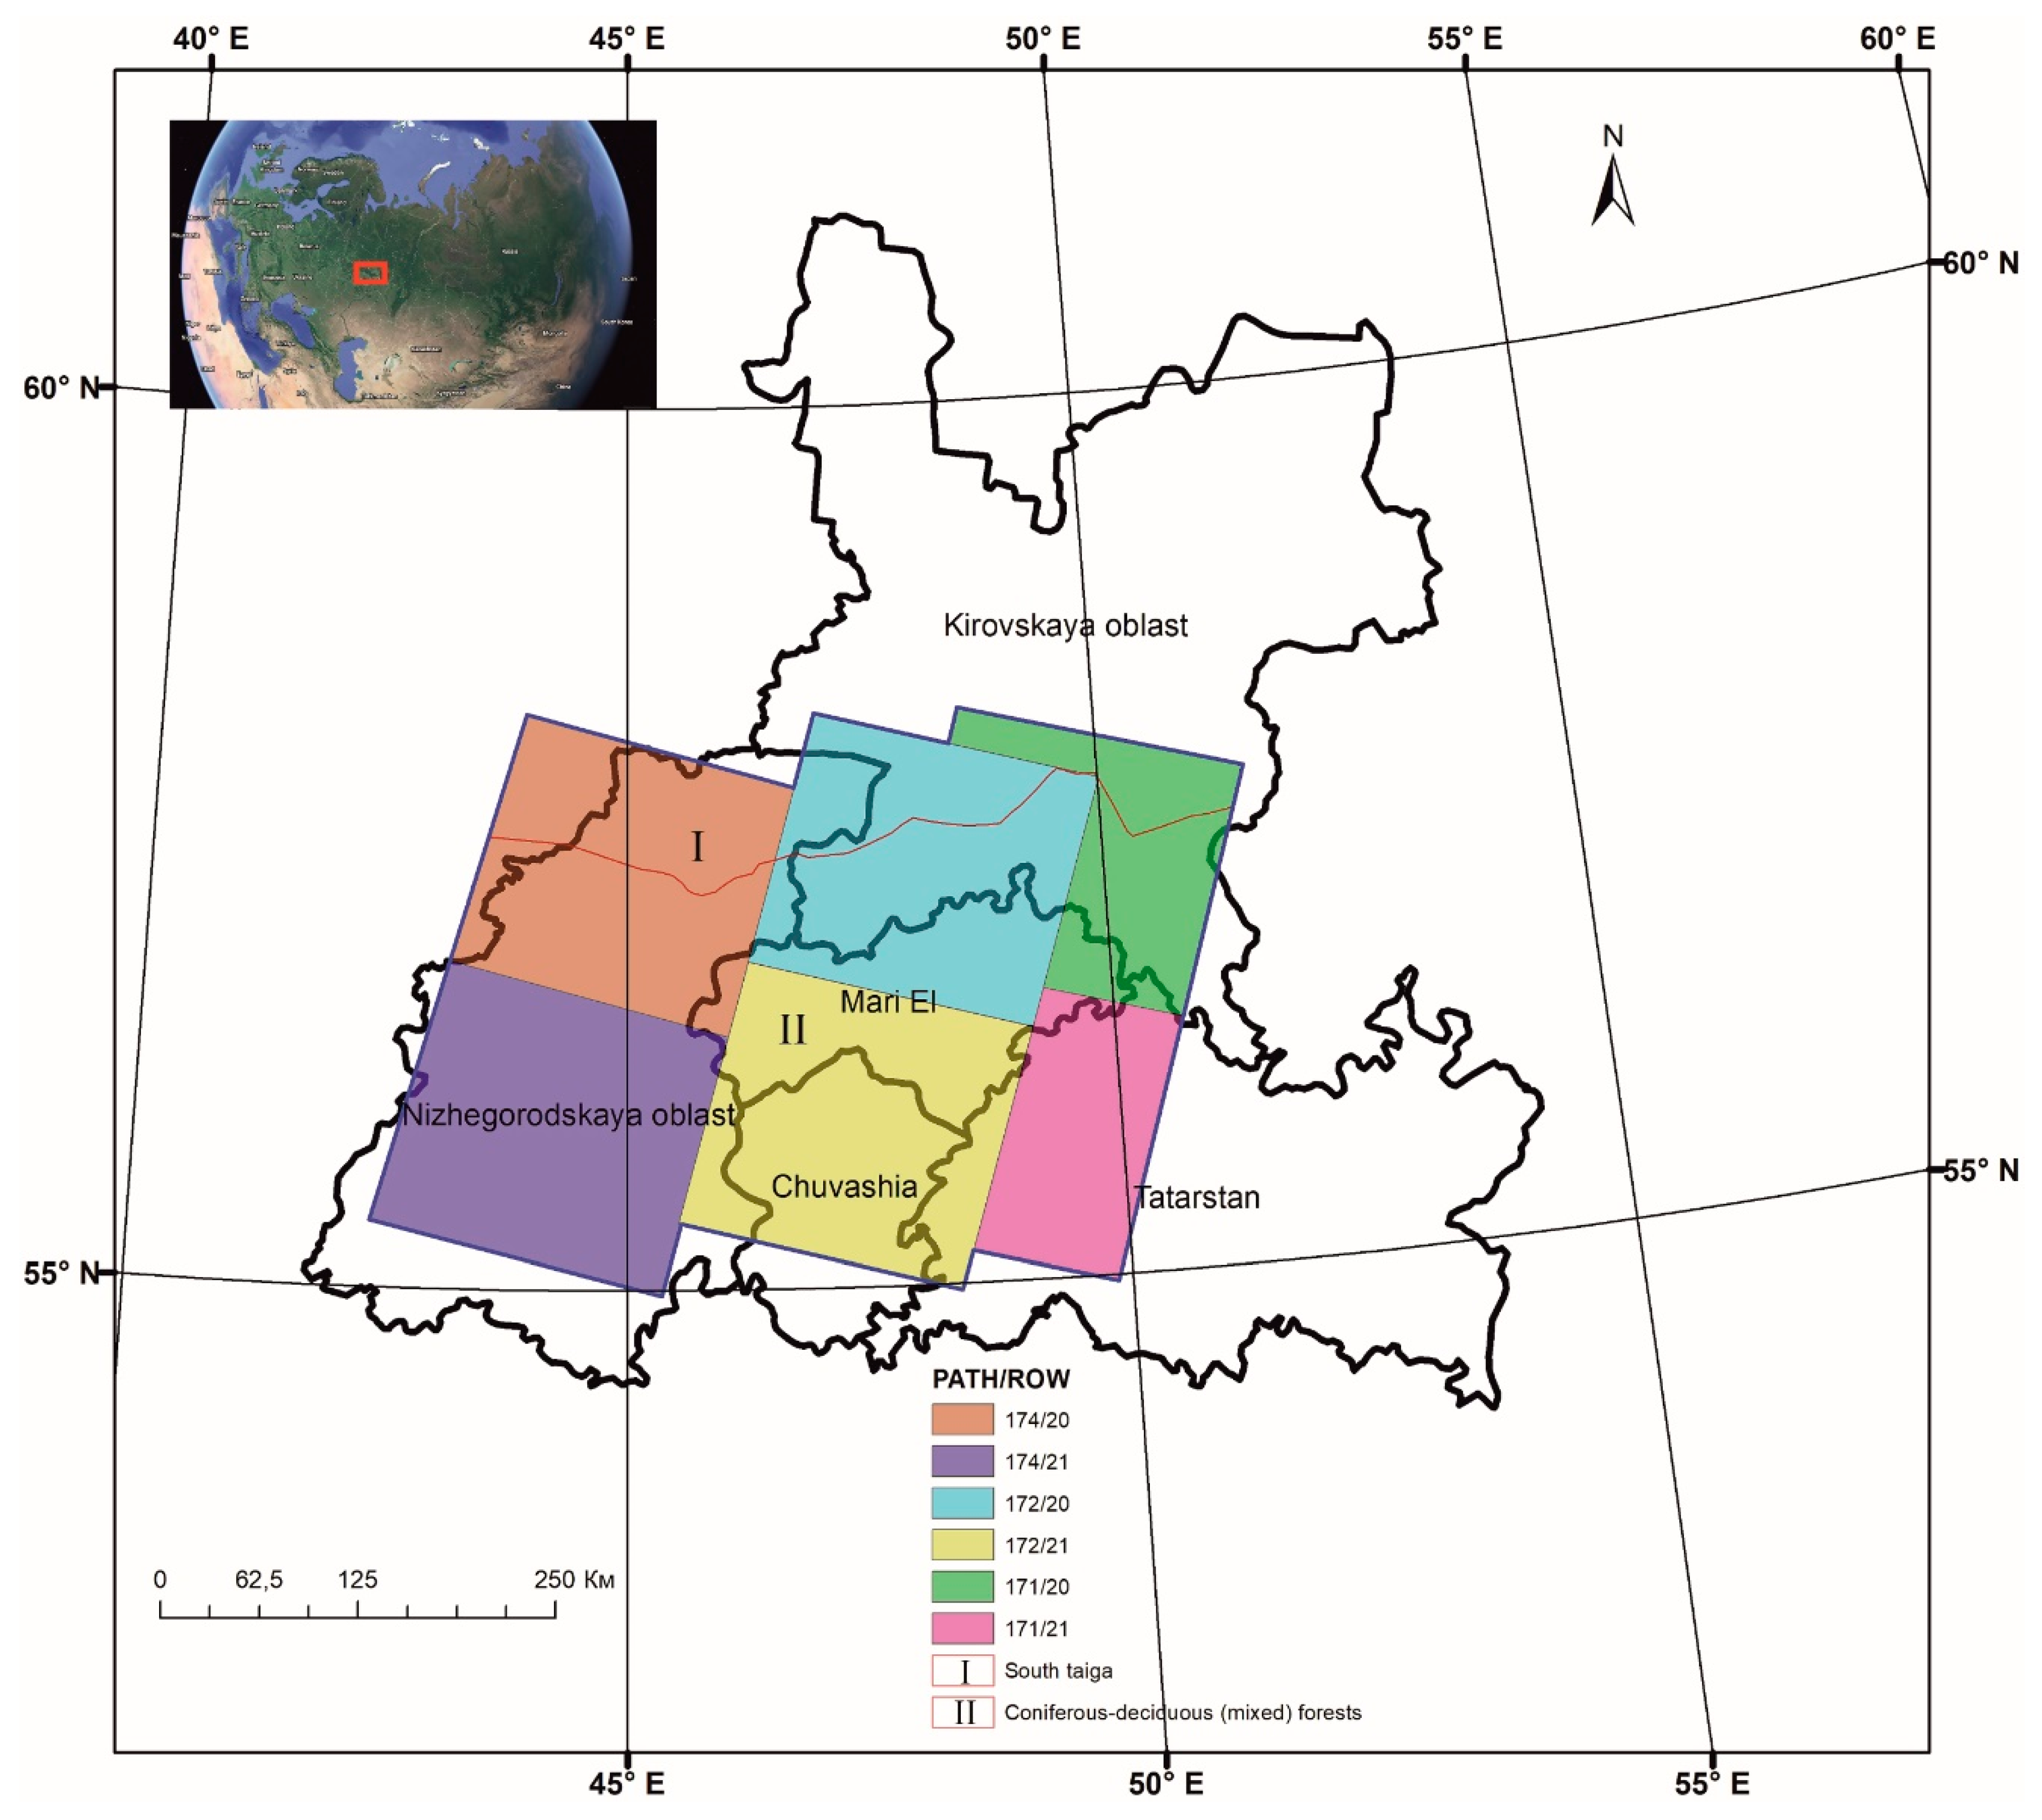
Figure 2.
Annual number of Landsat (TM/ETM+/OLI) scenes observations over the period May–September 2000–2022.
Figure 2.
Annual number of Landsat (TM/ETM+/OLI) scenes observations over the period May–September 2000–2022.
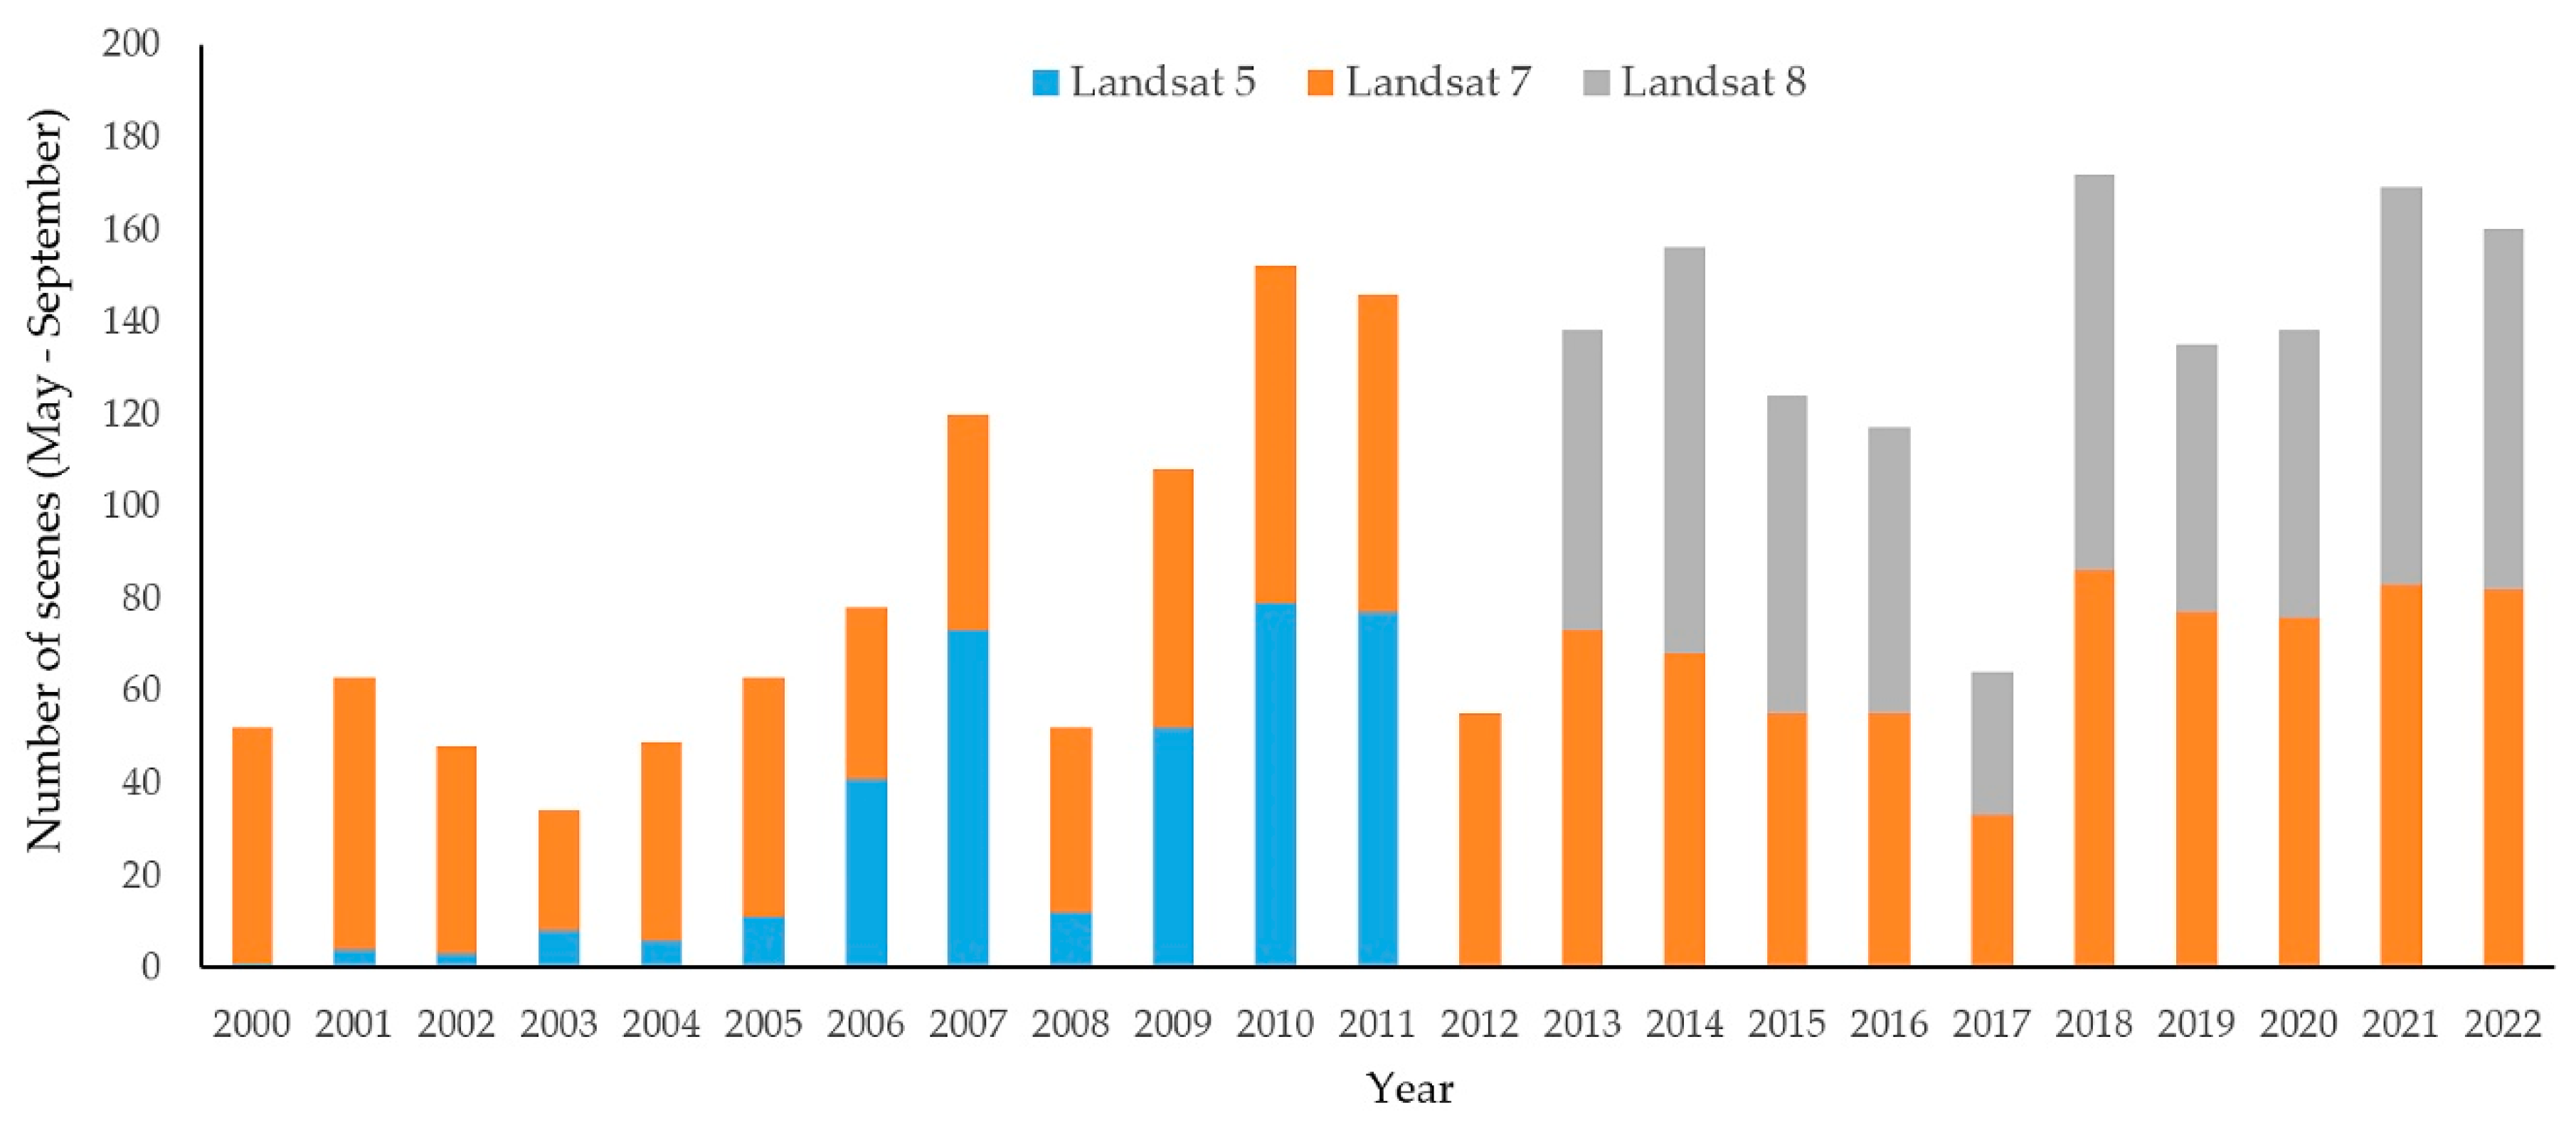
Figure 3.
Flow chart of the research.
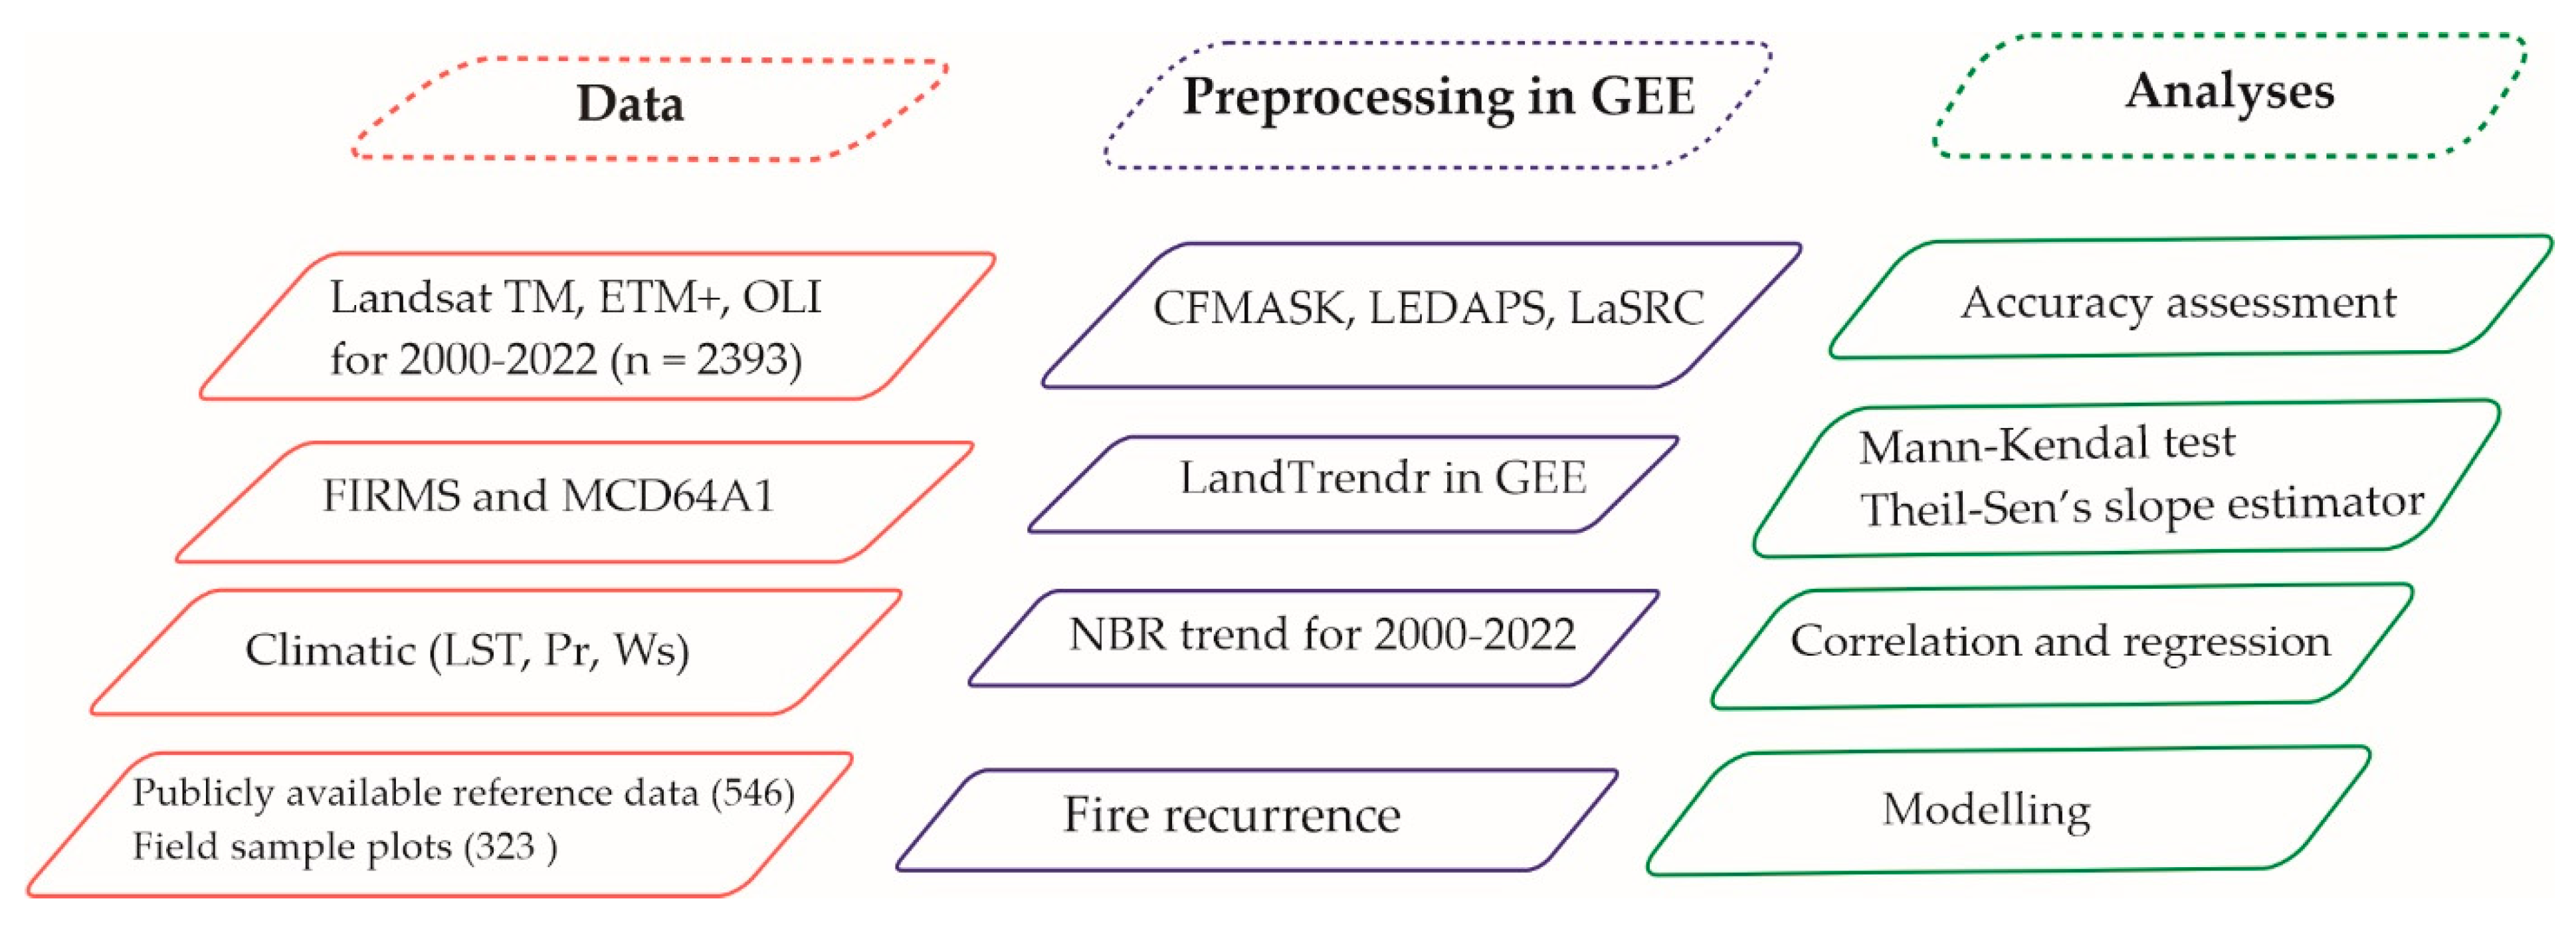
Figure 4.
Spatial distribution of cumulative forest BA from 2000 to 2022: (a) overall Middle Volga region; (b) three times burnt in Nizhegorodskaya oblast; (c) two times burnt in Nizhegorodskaya oblast and Mari El; (d) two times burnt in the Republic Mari El. The pixel size has been exaggerated for visualization proposes.
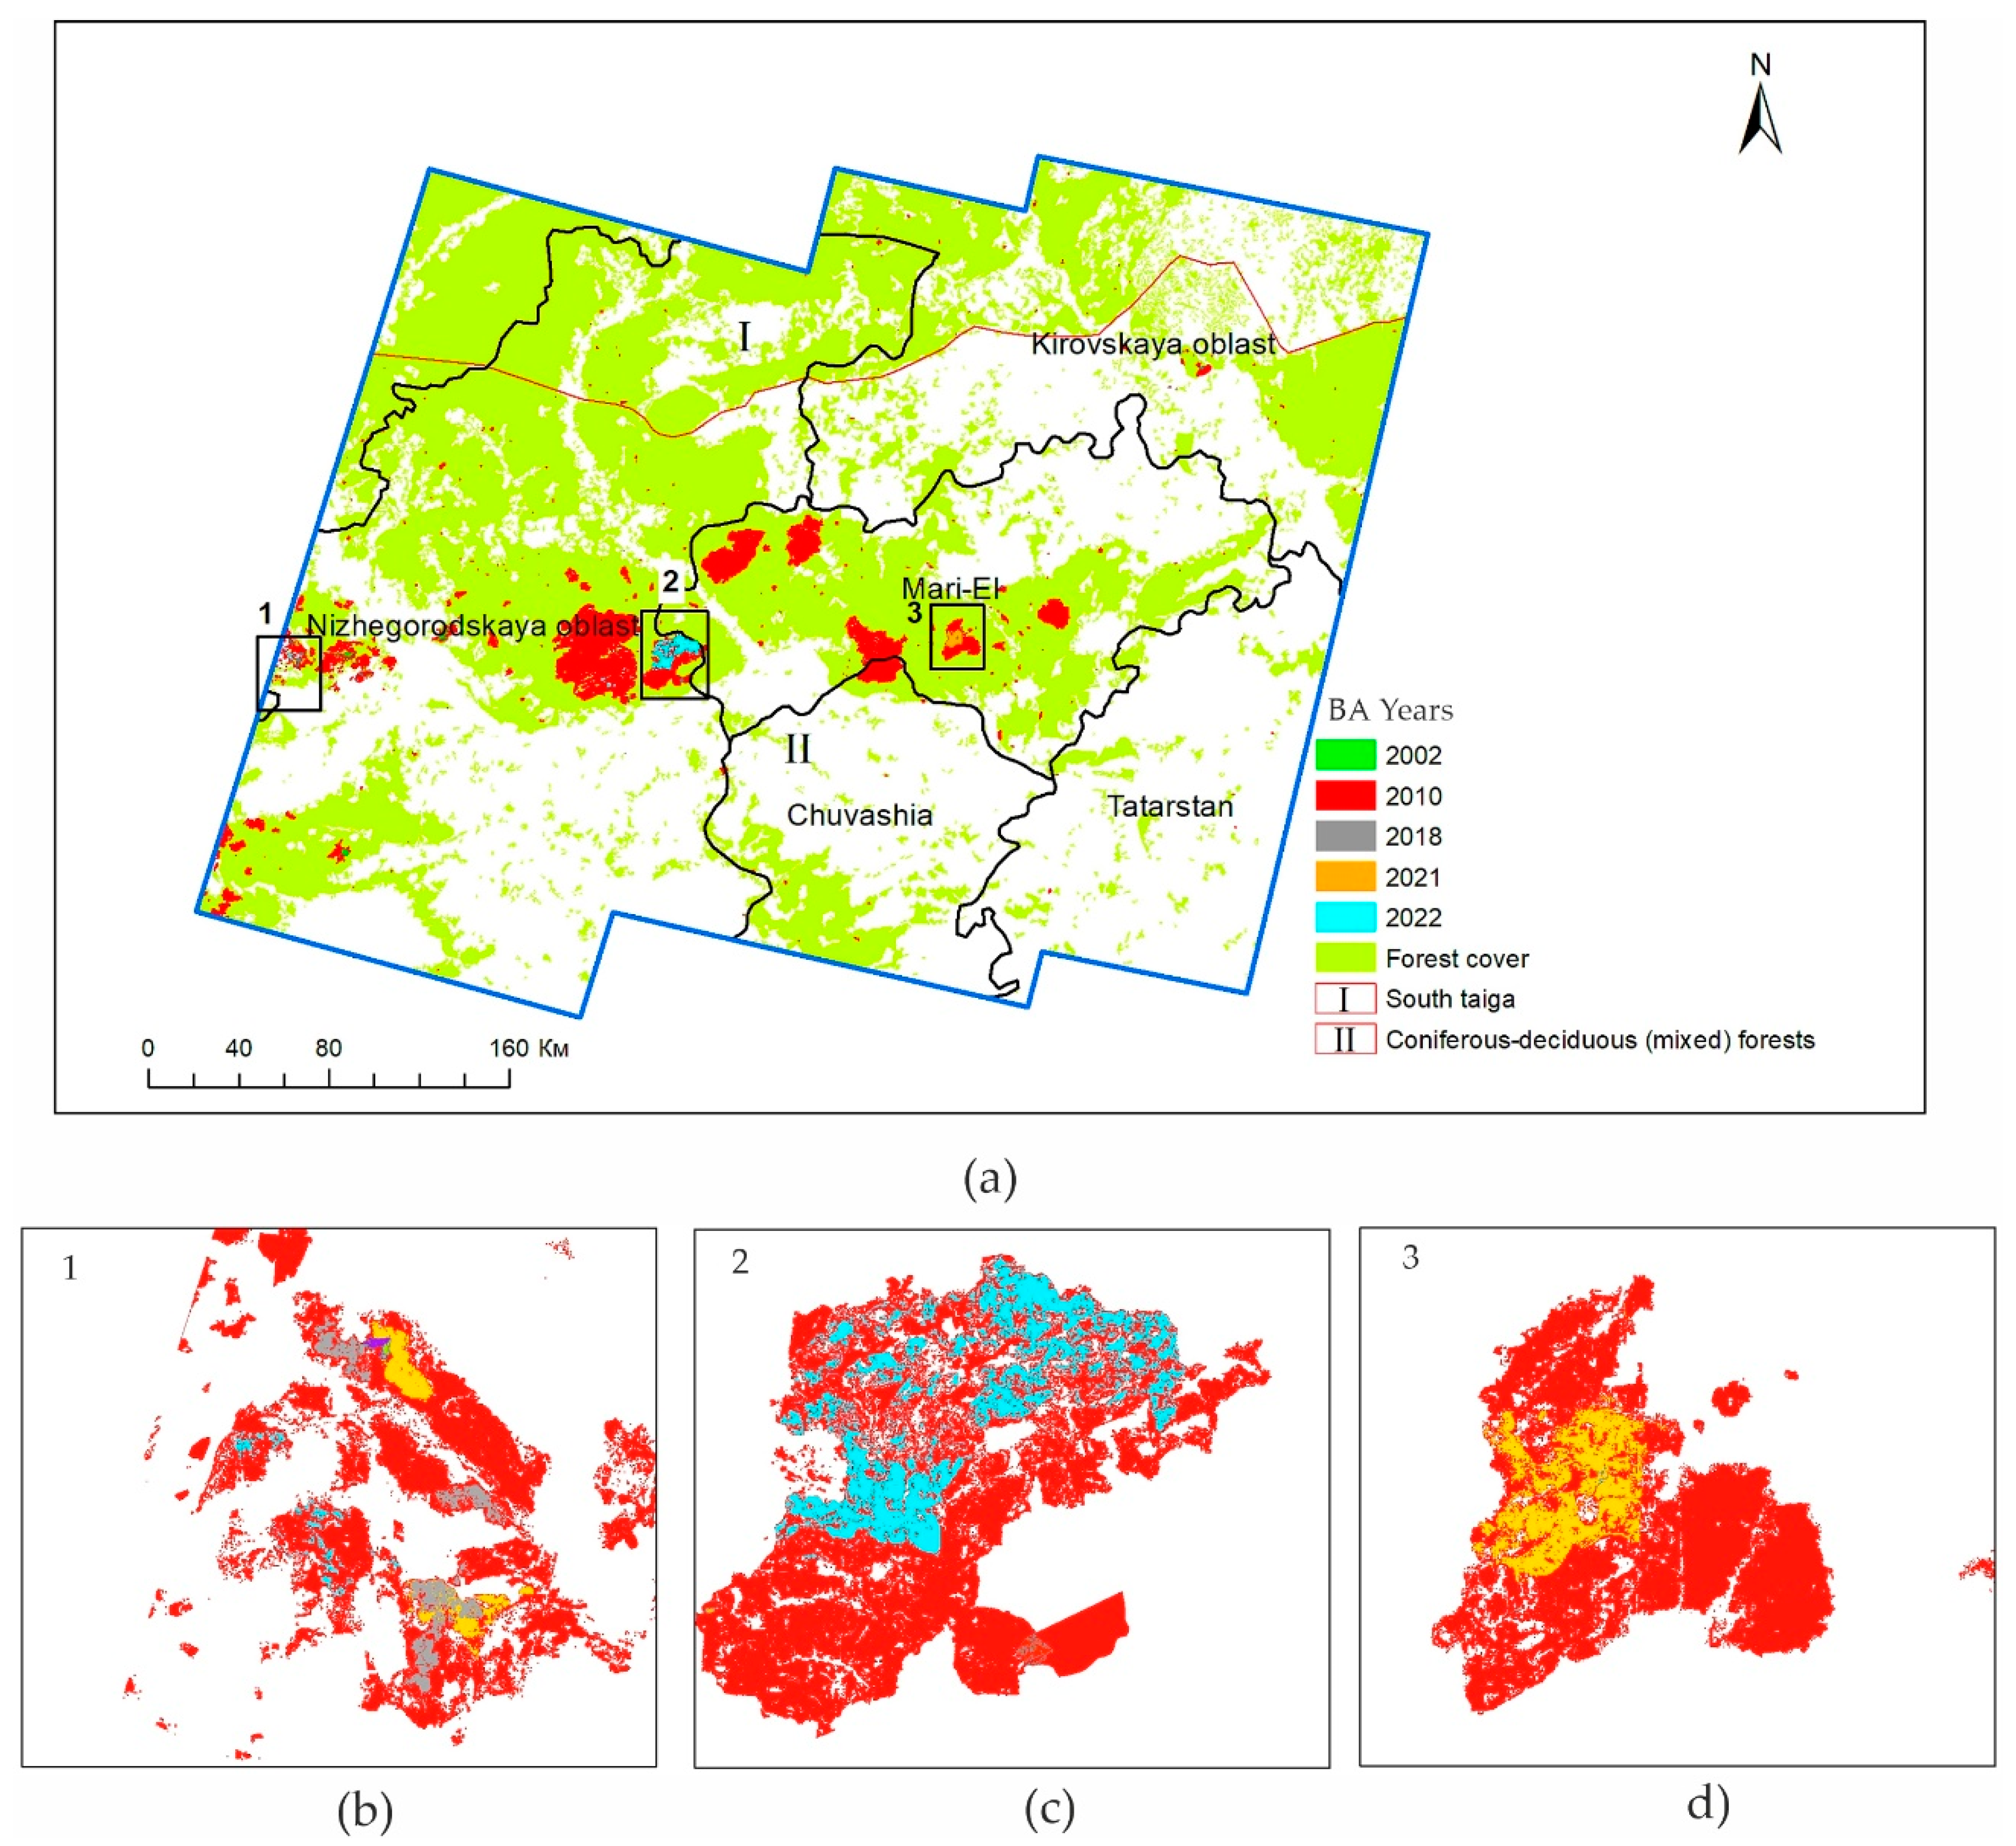
Figure 5.
NDVI of the forest cover in Nizhegorodskaya oblast on the Landsat 5 TM images: September 2009; (b) October 2010 (after the wildfire).
Figure 5.
NDVI of the forest cover in Nizhegorodskaya oblast on the Landsat 5 TM images: September 2009; (b) October 2010 (after the wildfire).
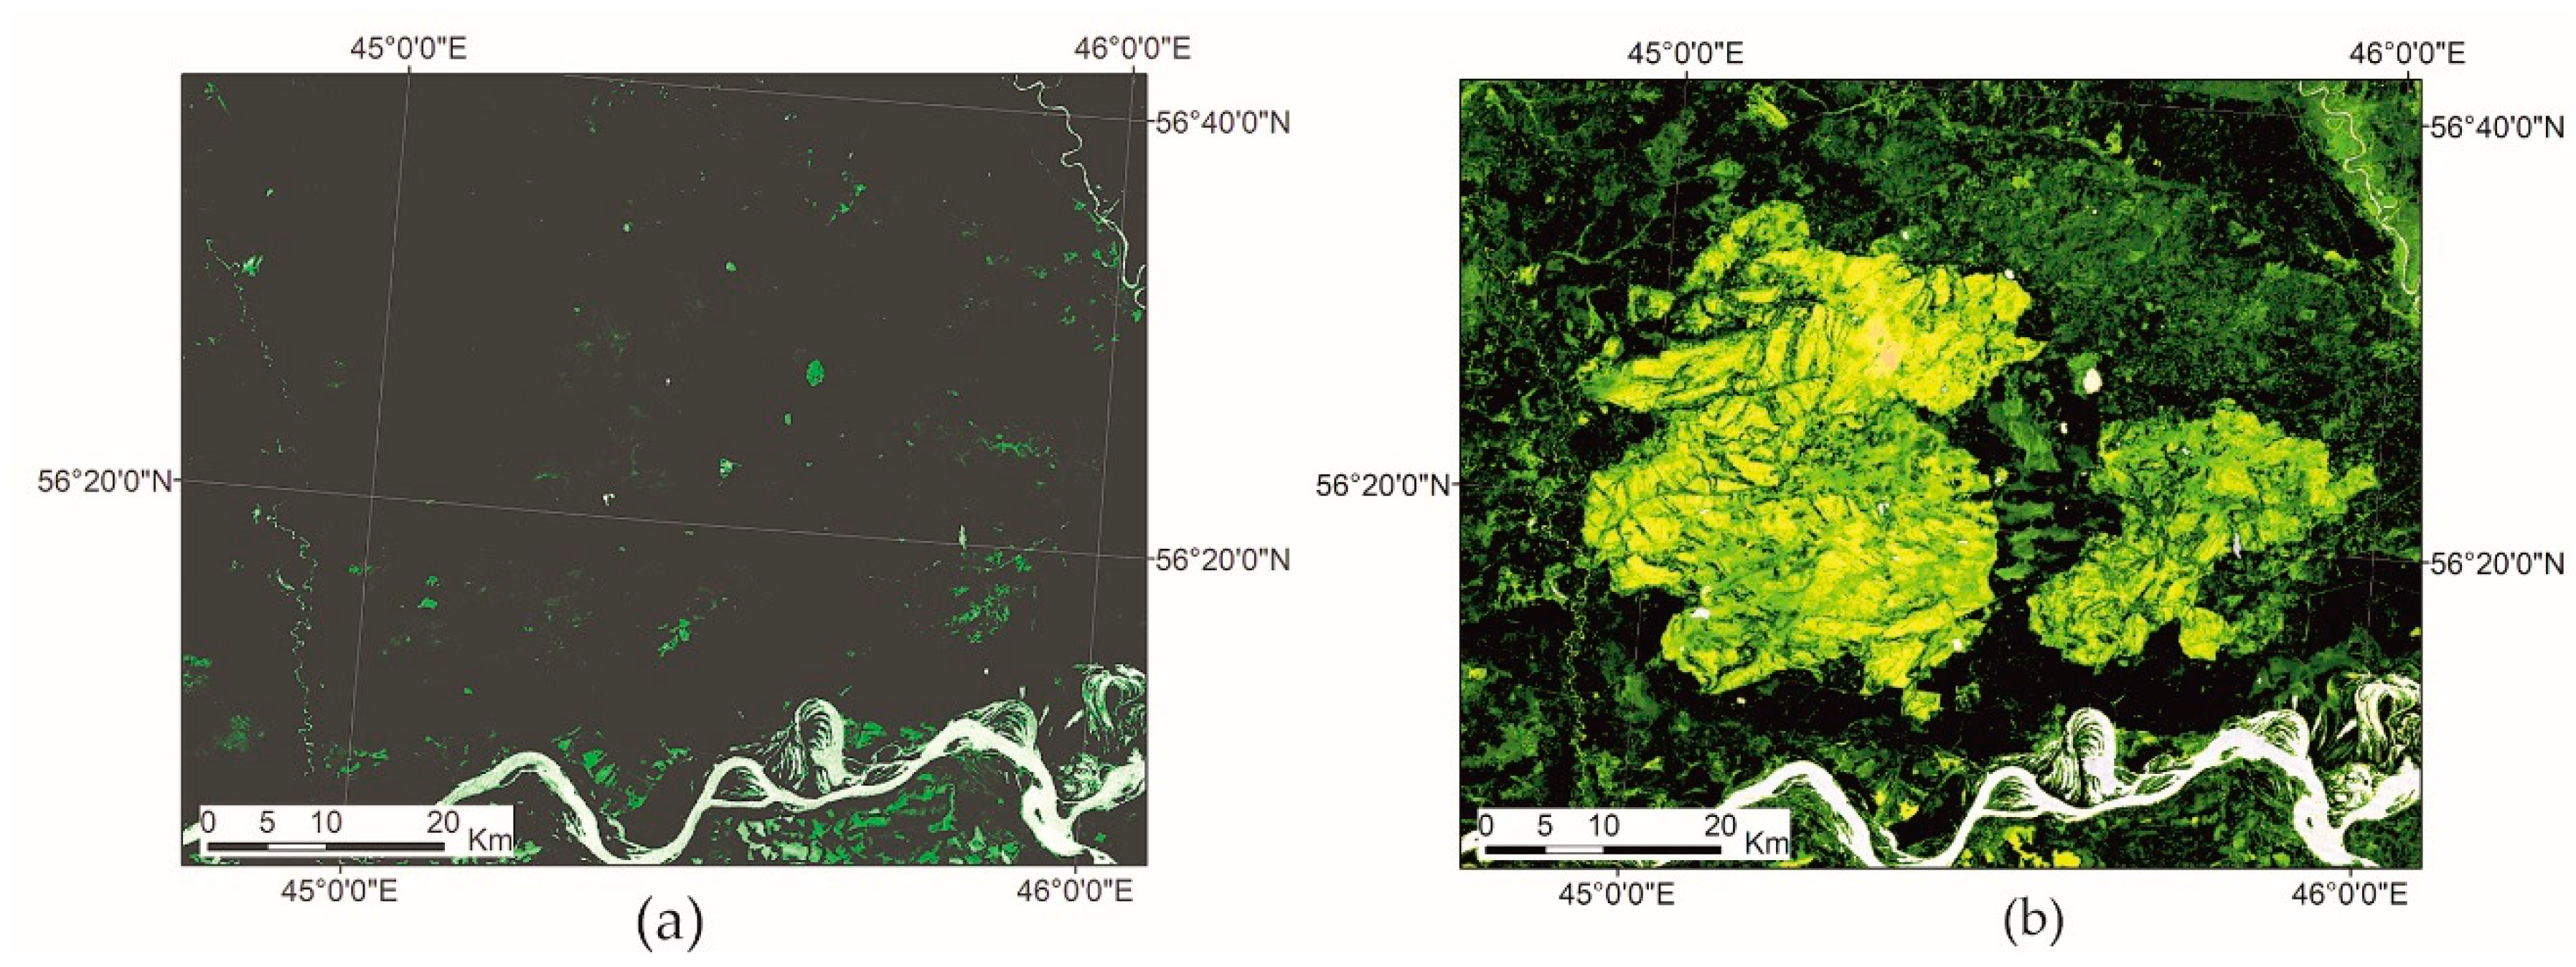
Figure 6.
Dynamics of forest burnt area in the Middle Volga region from 2000 to 2022: (a) cumulative BA including maximum data during severe wildfires of 2010; (b) cumulative BA excluding the data of 2010 wildfires; (c) the mean monthly forest BA with data of 2010 wildfires; (d) the mean monthly BA without data of 2010 wildfires; (e) cumulative BA according to the forest classes.
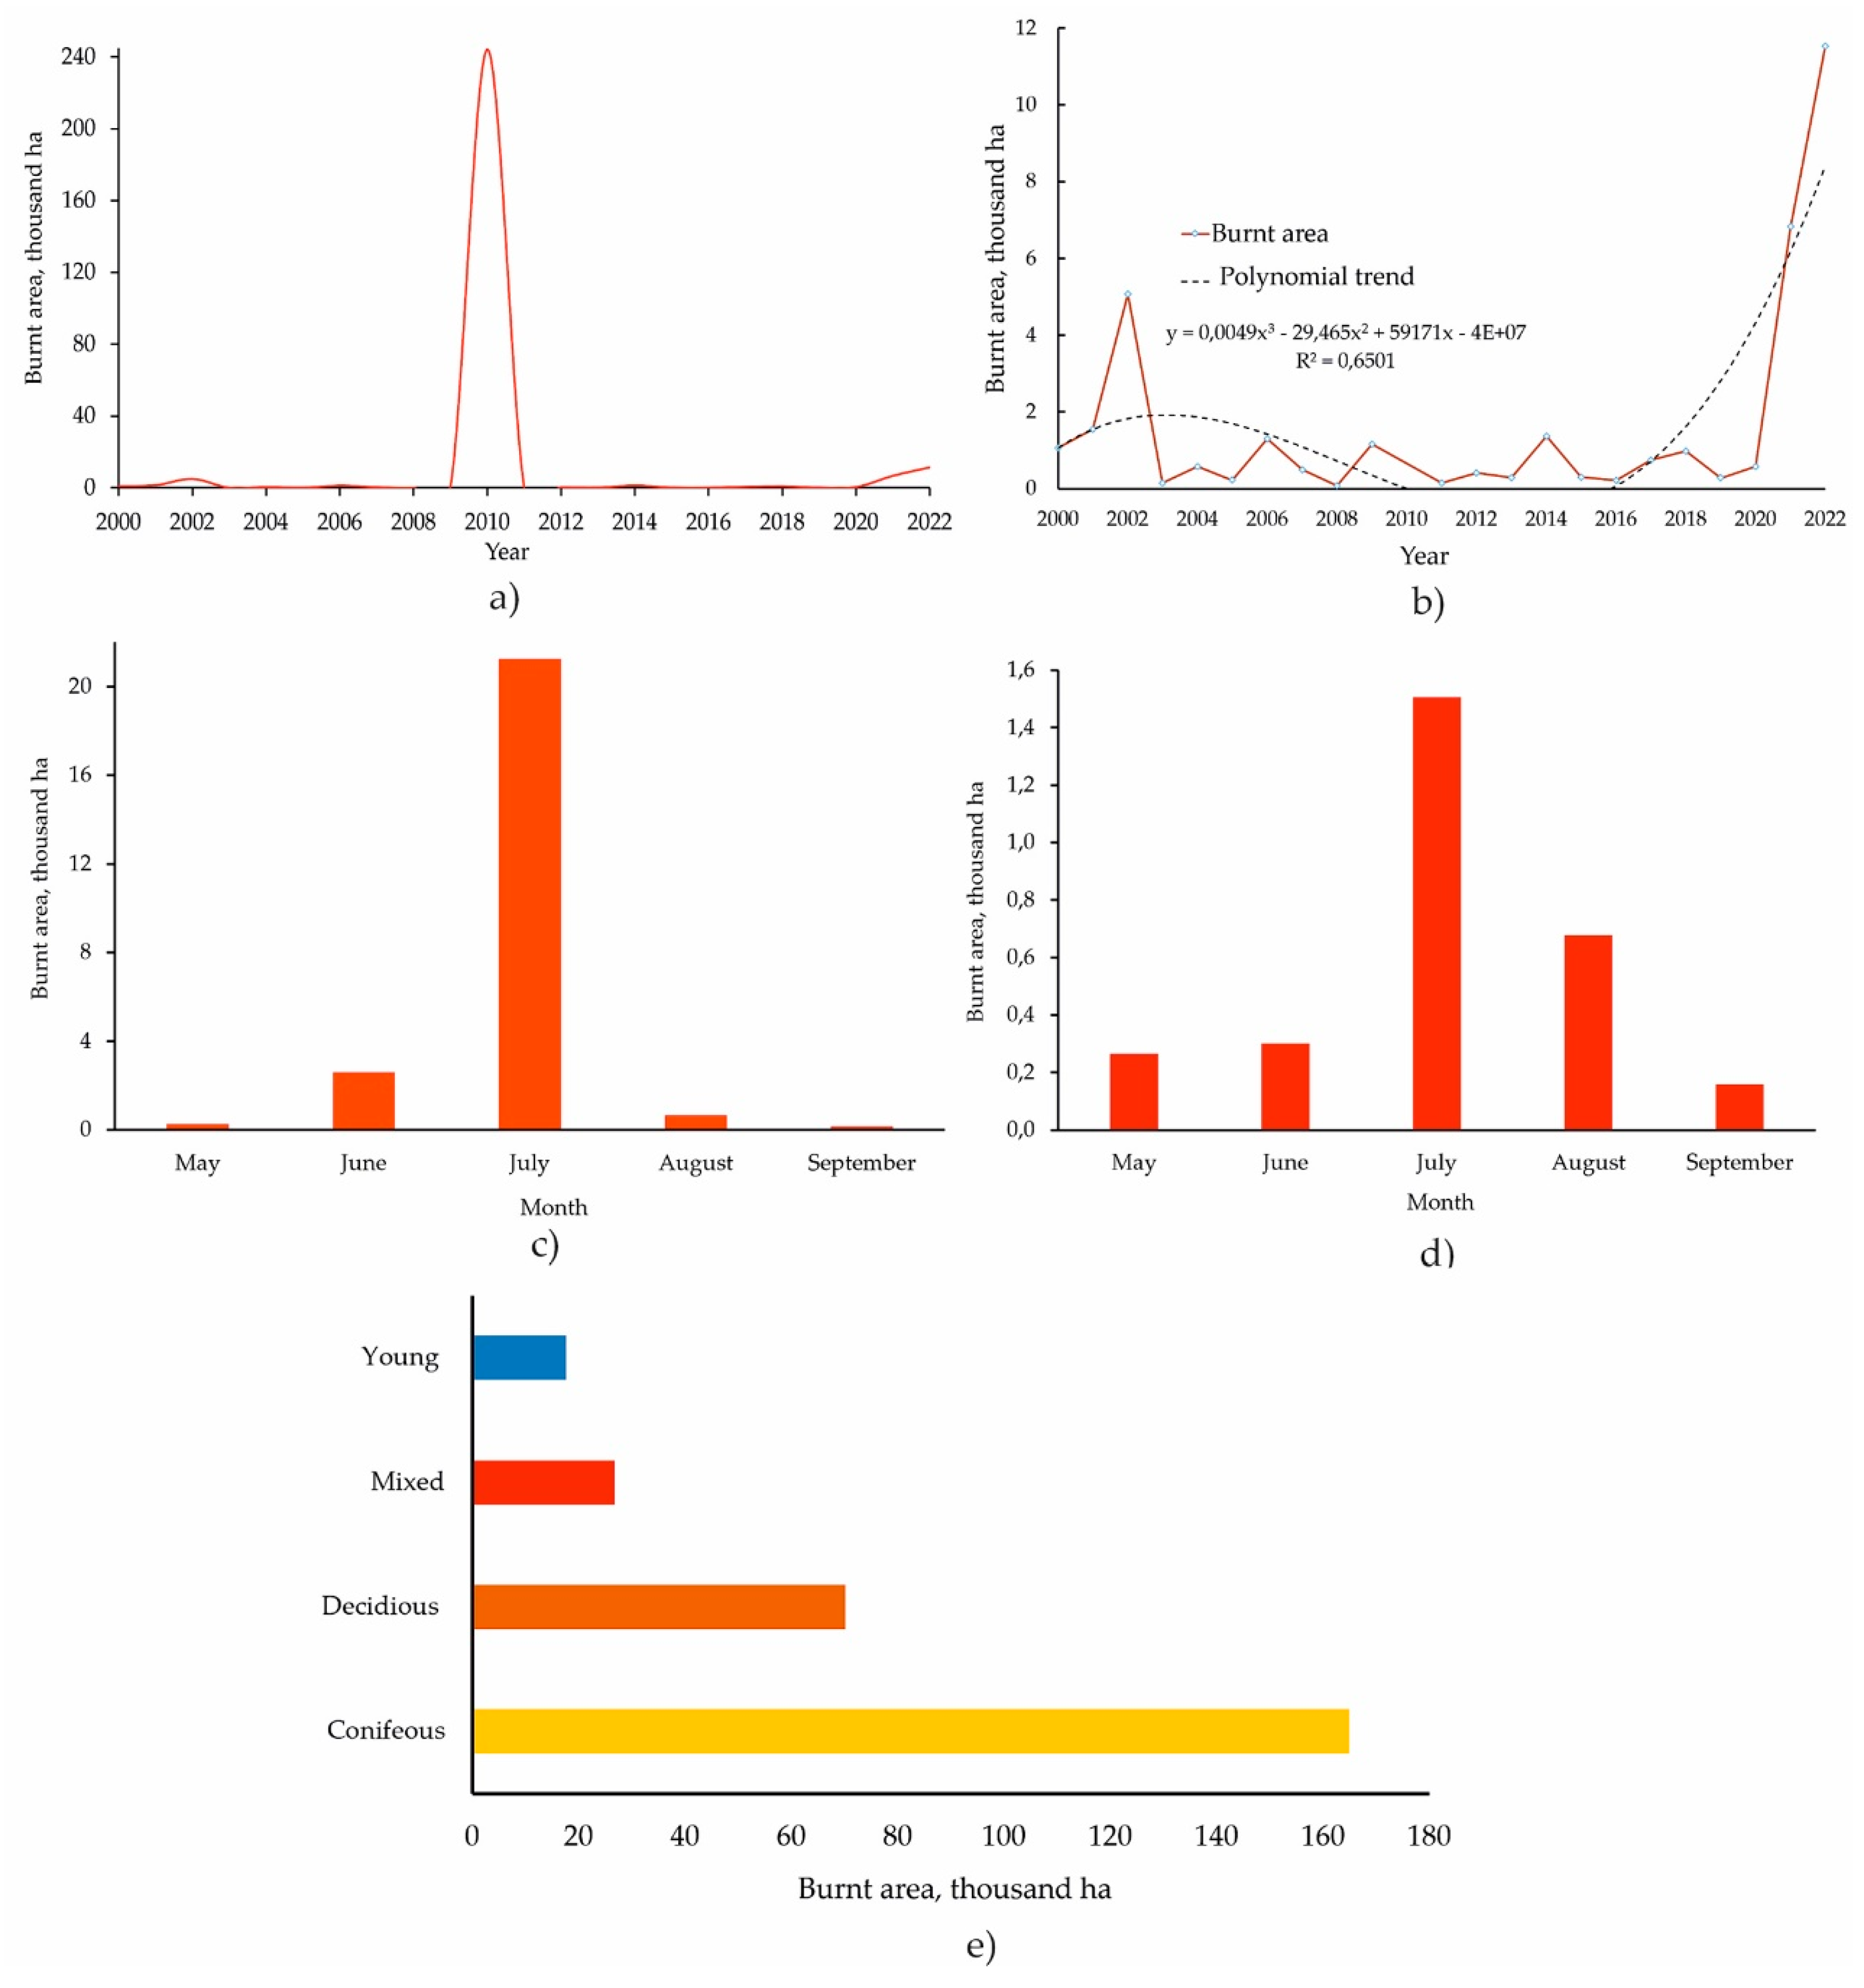
Figure 7.
Mann-Kendall tau (Strength) and Theil-Sen’s slope (magnitude) trend analysis for climatic factors in the Middle Volga region with BA from 2000 to 2022: (a) Land surface temperature; (b) Precipitation; (c) Wind speed.
Figure 7.
Mann-Kendall tau (Strength) and Theil-Sen’s slope (magnitude) trend analysis for climatic factors in the Middle Volga region with BA from 2000 to 2022: (a) Land surface temperature; (b) Precipitation; (c) Wind speed.
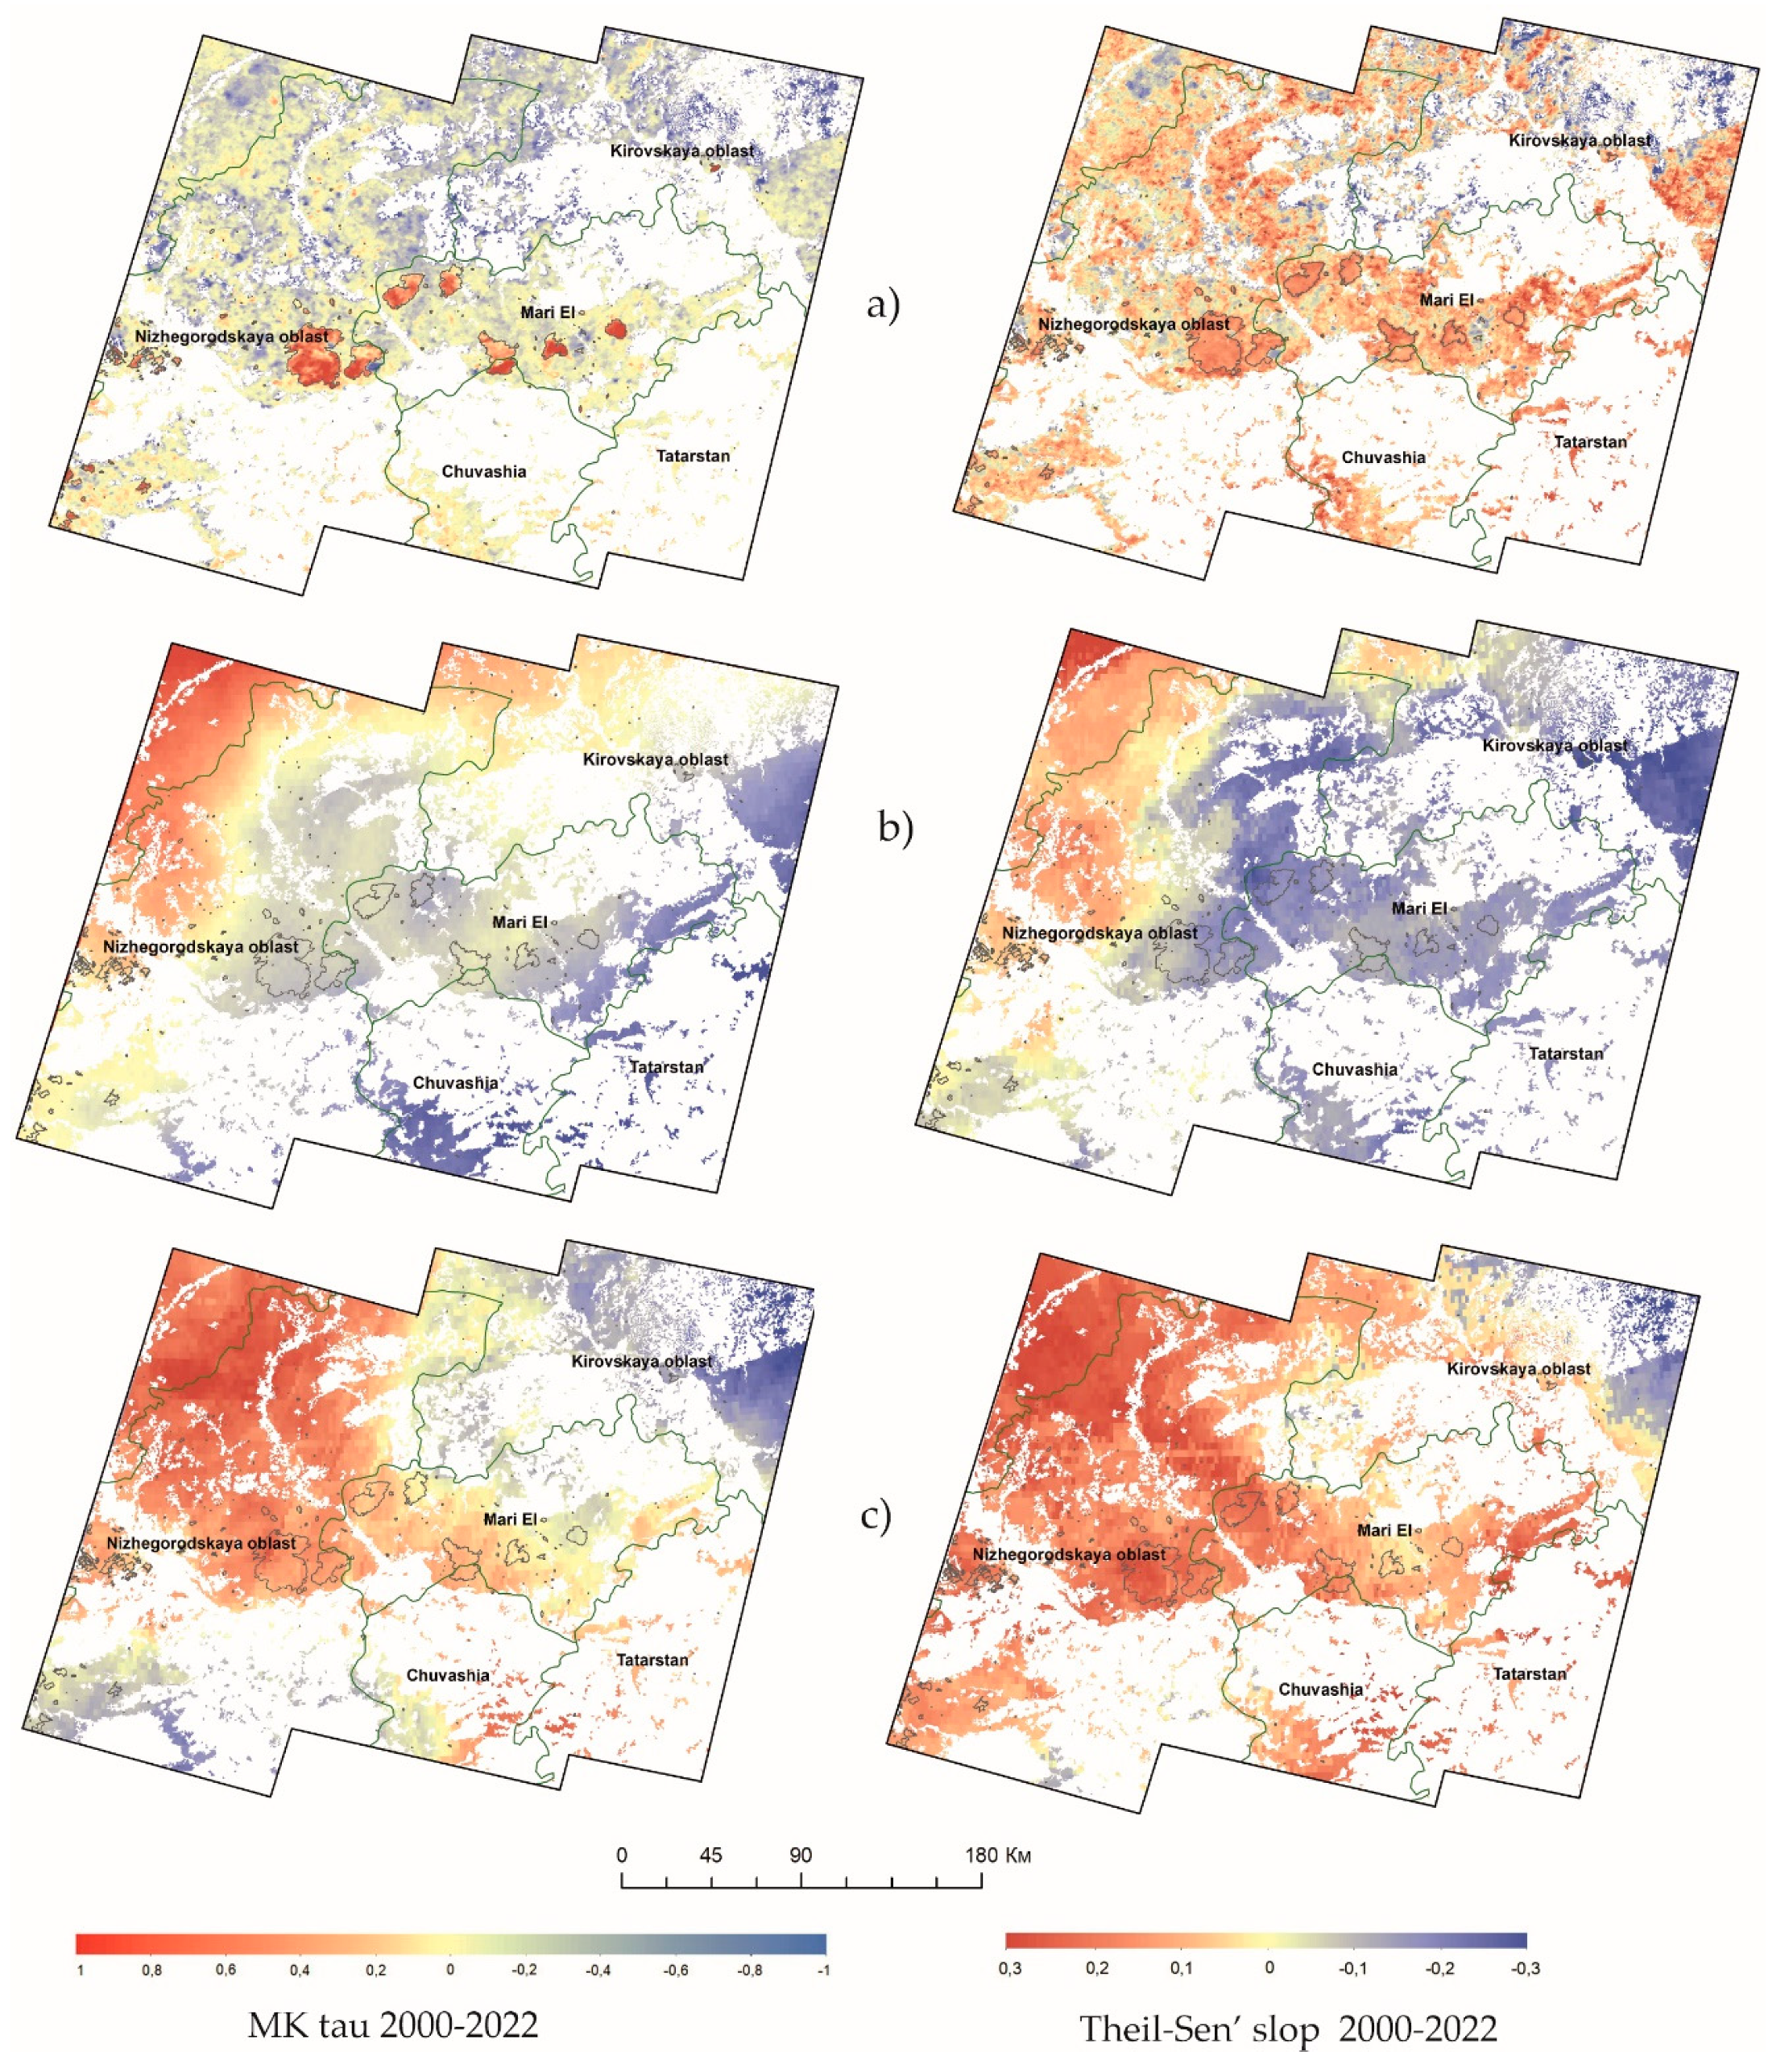
Figure 8.
Correlation coefficients between BA and climatic factors during 2000-2022 spring-autumn seasons, * indicates passing the significance test (p < 0.05).
Figure 8.
Correlation coefficients between BA and climatic factors during 2000-2022 spring-autumn seasons, * indicates passing the significance test (p < 0.05).
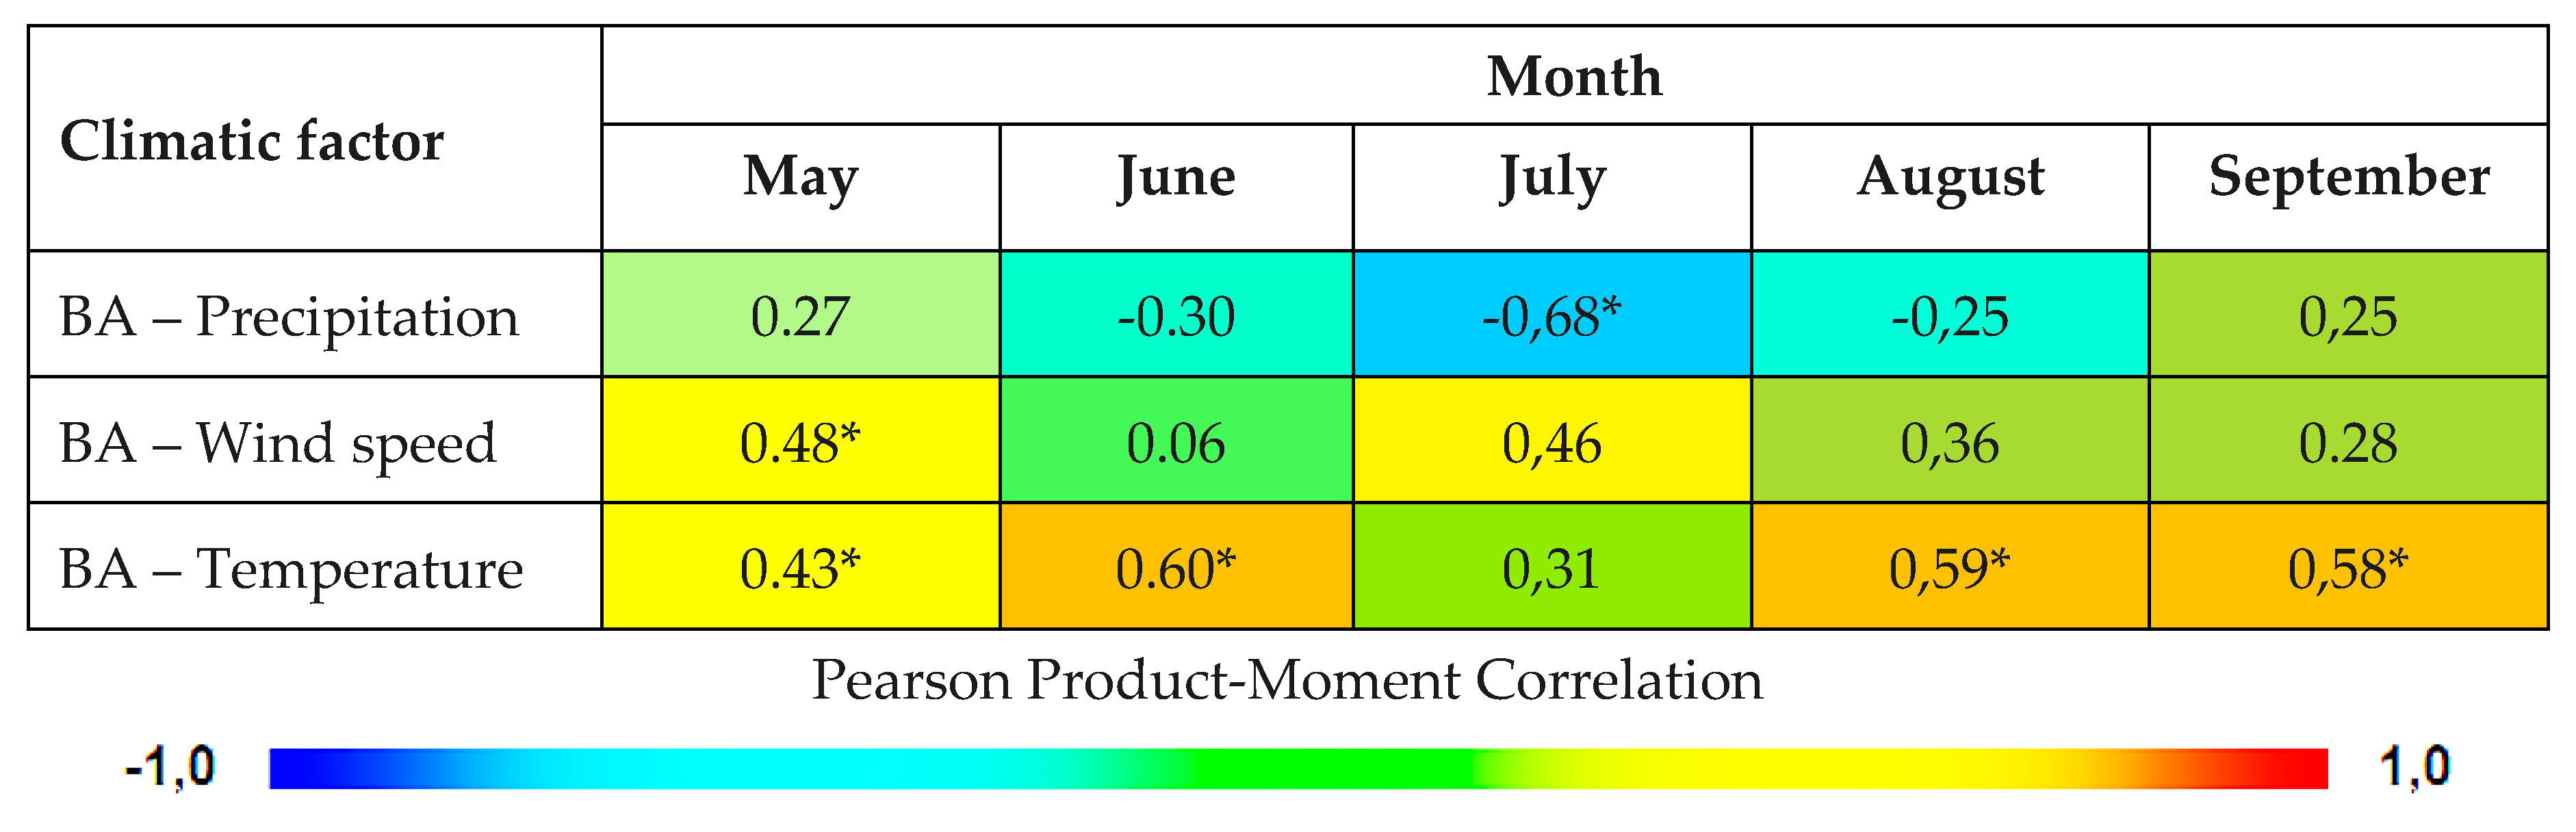

Table 1.
Data employed for burnt area estimation and climatic factors monitoring in the Middle Volga region from May to September 2000-2022.
Table 1.
Data employed for burnt area estimation and climatic factors monitoring in the Middle Volga region from May to September 2000-2022.
| No | Purpose | Data, Product ID | Scale | Source |
|---|---|---|---|---|
| 1 | BA Mapping | Landsat time series | 30 m | https://earthengine.google.com/ |
| 2 | MODIS MCD64A1 | 500 m | ||
| 3 | FIRMS | https://firms.modaps.eosdis.nasa.gov | ||
| 4 | Land surface temperature, Maximum temperature |
8 days composite MOD11A1 MOD11A2 | 1 km | https://ladsweb.modaps.eosdis.nasa.gov/archive/allData |
| 5 | Precipitation | GPM_3IMERGHH | 0.10 x 0.10 | https://giovanni.gsfc.nasa.gov/giovanni/ |
| 6 | Wind speed | MERRA-2 GMAO | 0.50 x 0.6250 | https://disc.gsfc.nasa.gov/datasets/M2TMNXFLX_5.12.4/summary |
| 7 | Validation, accuracy assessment | Google Earth Yandex maps |
10-30 m |
www.googleearth.com https://yandex.ru/maps |
| 8 | Field plots of Volgatech | 90x90 m |
Table 2.
Trends of climatic factors in the Middle Volga region over the period 2000–2022 at 95% confidence level.
Table 2.
Trends of climatic factors in the Middle Volga region over the period 2000–2022 at 95% confidence level.
| Parameter | Trend | Tau (τ) | Theil-Sen’s slope | p-value |
| Temperature | Increasing | 0,05 | 0,014 | 0,02 |
| Precipitation | Decreasing | – 0,29 | – 0,27 | 0,05 |
| Wind | Increasing | 0,03 | 0,09 | 0,03 |
Disclaimer/Publisher’s Note: The statements, opinions and data contained in all publications are solely those of the individual author(s) and contributor(s) and not of MDPI and/or the editor(s). MDPI and/or the editor(s) disclaim responsibility for any injury to people or property resulting from any ideas, methods, instructions or products referred to in the content. |
© 2024 by the authors. Licensee MDPI, Basel, Switzerland. This article is an open access article distributed under the terms and conditions of the Creative Commons Attribution (CC BY) license (https://creativecommons.org/licenses/by/4.0/).
Copyright: This open access article is published under a Creative Commons CC BY 4.0 license, which permit the free download, distribution, and reuse, provided that the author and preprint are cited in any reuse.


