Submitted:
10 November 2025
Posted:
11 November 2025
You are already at the latest version
Abstract
Materials that store a significant amount of heat in a narrow temperature range by phase change solid-liquid or solid-solid are called Phase Change Materials (PCMs). Many PCMs are members of homologous groups of materials with similar composition and properties. Often, similarities are due to a common molecular composition with a repeating unit, e.g. for n-alkanes H-(CH2)n-H. Typical is an n related trend in the melting temperature. Based on observations on solvents, the question arises if such a trend also exists in eutectic binary mixtures with one component fixed while the other, from a homologous series, is varied. For verification, literature data were collected, specifically experimental data, each set with at least three variations from a single source. Eight data sets were collected, covering eutectic binary mixtures of n-alkanes, n-alkanols, and n-alkanoic acids. With one exception, all data sets show a systematic trend in the melting temperature and the composition. It is shown that the trends can be understood from thermodynamic theories of mixtures (Schröder – van Laar equation) combined with typical trends within homologous series. The findings offer new options in PCM development as well as the selection of PCM for specific application temperatures.
Keywords:
PCM
; phase change
; material
; temperature
; enthalpy
; homologous series
; adjustable
; repeating unit
; eutectic
; mixture
1. Introduction
Materials that store a significant amount of heat in a narrow temperature range by phase change solid-liquid or solid-solid are called Phase Change Materials (PCMs), often also latent heat storage materials (even if a temperature change is involved). In addition, suitable materials should also be technically and economically viable, e.g., sufficiently available, affordable, long-term stable, compatible, and safe. Due to their ability to store a large amount of heat in a narrow temperature range, PCMs are preferably used for heat storage with high storage density (per mass or volume) in a narrow temperature range, and for passive temperature stabilization (temperature control).
PCMs can be pure substances (elements and compounds) as well as non-pure substances (mixtures). Both have distinct advantages as well as potential drawbacks. Pure substances, like water and n-alkanes, commonly change phase at a phase change temperature Tpc. Their number, and thus also the choice of Tpc, is limited. Non-pure substances, like water-salt, water-alkanol, and alkane-alkane mixtures, offer a much larger choice. Mixing also affects other technical and economical properties. If a component is abundant and at low cost it makes the mixture easier available and more affordable. With regard to long-term stability, mixtures, by their nature, possibly decompose by phase separation. The main focus of PCM R&D is, due to the usually higher storage density, on the phase change solid-liquid, commonly called melting. A peritectic mixture is a mixture where the transition is between a single solid and a solid and a liquid (peritectic transition) before becoming completely liquid. Thus, phase change solid-liquid in peritectics occurs in a temperature range and possibly with decomposition by phase separation. In contrast, a eutectic mixture is a mixture where the transition is between two or more solid phases and a liquid phase (eutectic transition). The solid phases (usually) crystallize simultaneously from the liquid. Thus, eutectics have a solid-liquid phase change temperature Tsl, also called eutectic temperature Te, and (usually) no decomposition by phase separation. Due to their long-term stability, pure substances (no risk of phase separation) and eutectic mixtures (little risk) are in the focus of solid-liquid phase change PCM development and selection.
In the past decades, hundreds, if not thousands of materials were identified that are potentially useful as PCM. This increased the options to choose materials for an application temperature significantly. However, if the options are from different material classes, often with different crucial material properties (e.g., availability, affordability, long-term stability, compatibility, safety), finding the best is difficult. Moreover, if looking for PCM with a different phase change temperature for the same application, especially if for the same material composite or encapsulation, it is desirable to avoid repeating the process. For this, a group of PCMs is needed with different phase change temperature to cover a broader temperature range in small increments, behaving similar in other key properties.
A solution are the members of a homologous series. In general, ‘homologous’ expresses that a number of things have a common origin and are similar. In Chemistry, ‘homologous’ is commonly used for a group of materials with similar composition and properties. The term is sometimes used for the elements of a group in the Periodic System of Elements (PSE) that are different in their atomic composition. More common is the use for compounds that are different in their molecular composition. Specifically in organic chemistry, ‘homologous’ is used for a series of compounds with a ‘repeating unit’ in the molecular composition. The simplest example of a homologous series are the n-alkanes (linear alkanes), having the general chemical formula H-(CH2)n-H with the repeating unit CH2. Other homologous series derived from the n-alkanes share the backbone with the repeating unit and have an additional functional group at one end. Among them are, e.g., the n-alkanols (also called fatty alcohols) with the functional group -OH and the general chemical formula H-(CH2)n-OH, and the n-alkanoic acids (also called fatty acids, members of the carboxylic acids) with the functional group -COOH and the general chemical formula H-(CH2)n-COOH. Each homologous series has its distinct physical and chemical properties, often with an n related trend. Figure 1 gives an overview on the solid-liquid phase change temperature Tsl, commonly also called melting temperature, and the molar solid-liquid phase change enthalpy ΔslHm versus n (number of C atoms) for some members of the homologous series of the n-alkanes, n-alkanols, and n-alkanoic acids (data source: Mehling and White [1]). It must be noted that in organic chemistry it is common to denote with n the number of C atoms, and that n is then equal to the number of repeating units CH2 in the case of the n-alkanes and n-alkanols, but larger by 1 for the n-alkanoic acids as the functional groups has one C atom. As Figure 1 shows, each of these homologous series has a trend in Tsl and ΔslHm to rise with increasing n, with deviations. Specifically, each allows to ‘adjust’ Tsl in steps of roughly 5°C to 10°C by adjusting n. Additional options, with the functional group at both ends, are the α,ω-diols and α,ω-dicarboxylic acids.
Soodoo et al. [2] plotted Tsl and ΔslH versus n (number of C atoms) besides for n-alkanes, n-alkanols, and n-alkanoic acids, also for esters, ethers, sulfones, amides, and amines. Other homologous series exist among the polymers, specifically the homopolymers. For example, PolyEthylene (PE) has the general chemical formula H-(CH2)n-H, like n-alkanes, but with very large n. Another example is PolyEthyleneGlycol (PEG), which has the chemical formula H-(O-CH2-CH2)n-OH. Hence, PEG has C2H4O monomers as repeating unit for the homologous series. Generally, PEG is labeled PEG X where X is value of the molar mass in g/mol, e.g., PEG 800 for 800 g/mol. Commonly the term PEG is used for molar masses larger than about 200 g/mol, which corresponds roughly to n = 5 as the molar mass of a monomer is (2∙12+4∙1+16) g/mol = 44 g/mol. Figure 2 gives an overview of some Tsl and ΔslH for X up to 20000 (n about 450), collected by Mishra et al. [3]. Typically, in a homologous series Tsl tends to rise with n and the same holds for the mol specific ΔslHm (Figure 1), however the mass specific ΔslH (Figure 2) tends towards a constant value.
As the examples show, PCM from homologous series, in principle, allow to ‘adjust’ Tsl by adjusting n, thus to cover a broader temperature range in small increments. Else, they usually have the same or at least similar physical and chemical properties, e.g., compatibility or safety. However, members of the discussed homologous series are not always technically and economically viable as PCM. For example, among the n-alkanes, n-alkanols, and n-alkanoic acids, not all members are easily available and at acceptable cost. Further on, all are combustible, and not thermally stable beyond 400°C. This holds for all organic materials. As a result, it is desirable to find additional options.
Up to now, the term ‘homologous’ series is in Chemistry only used for elements and compounds, thus pure substances, and not in connection with mixtures. In PCM R&D, mixtures of members of many homologous series have been investigated intensively, e.g., n-alkane – n-alkane mixtures and n-alkane – n-alkanol mixtures, but not systematically. Especially, up to now the results have been discussed individually, without looking for systematic trends. In a very different area however, that of solvents, water-PEG mixtures have been studied systematically and Jablonski [4] noted a systematic shift of the eutectic temperature and composition with PEG molar mass (Figure 3). From the perspective of PCM R&D, this corresponds to ‘adjustable’ Tsl, here Te, observed in binary mixtures of water, a fixed component, and PEG with varying molar mass, thus members of a homologous series as varied component. Notable is that eutectic mixtures as PCM have the advantage of a phase change temperature and not a range, usually no phase separation, and that with water as fixed component a significant fraction is cheap and abundant.
As a consequence, several questions arise. The goal of this work is to answer them. First, is the case of the eutectic water – PEG mixtures useful as PCM for heat storage? Second, are there other, similar mixtures based on other homologous series that show the advantage of ‘adjustable’ Tsl, useful as PCM? Third, is the observed effect just occasional, or has it a physical and chemical basis to be understood?
2. Materials and Methods
2.1. Materials
Based on the observations of Jablonski [4], the investigation here is limited to binary mixtures that have a eutectic composition, and with the material of one component fixed while the other component is from a homologous series and varied. To answer the previously stated questions, the following binary mixtures were selected. For the first question, water - PEG mixtures with varying PEG are used. For the second question, as n-alkanes, n-alkanols, and n-alkanoic acids are homologous series and already used as pure substance PCMs, they are also used here to look for promising binary mixtures. This results in three options using a single homologous series, e.g., n-alkane - n-alkane mixtures with the first n-alkane fixed and the other varied, and three options using different ones, e.g., n-alkane - n-alkanol mixtures.
2.2. Methods
Binary mixtures with eutectic composition are in the focus of PCM R&D for decades, and for the materials selected literature on mixtures with information on composition, melting temperature, and melting enthalpy, is abundant. Thus, for this early-stage investigation, to cover a range of options published information is used. In a literature study, publications on the selected mixtures were identified. They were then screened regarding three criteria. The first criterion is that data for at least three members of the homologous series should be available to see if there is a trend. The second criterion refers to the accuracy of data. As data predicted from theory have additional sources of uncertainty, only experimental data were used. Yet, experimental data often have an unclear or even low accuracy. Faden et al. [5] analyzed literature data for octadecane (n = 18), and found even for high purity samples (≥ 99%) Tsl values from the extrapolated onset that vary by 2.9 K. Thus, to see trends in Tsl, no reviews with collected data are used but only single sources, thus with a consistent experimental method throughout. The third criterion refers to the reliability of data. To ensure that data really refer to eutectics, only publications were considered that experimentally verified the type of transition. After the relevant literature sources were identified, the data corresponding to each set of binary mixtures were extracted, tabulated, and then plotted.
2.3. Units and Notation
The units and notation required refer to composition, phase change temperature, and enthalpy. Generally, in PCM R&D as well as in other literature in Physics and Chemistry, different ways are used, some not standard. Here, as far as possible, all data are given in a standard and consistent way.
The composition of mixtures of components, denoted by i, can be done in different ways. Sometimes the composition is given by the ratio of the components. However, commonly it is given by the fraction of the total, denoted by tot, as the mass fraction wi=mi/mtot or the molar fraction xi=ni/ntot. Here n is the amount of substance. Often % values are used. Generally, for binary mixtures a statement of the fraction for one component is sufficient; the other can be calculated. In this work, w or x is used, depending on the data source.
The enthalpy, according the International Union of Pure and Applied Chemistry, IUPAC [6], should be denoted by H, its changes by Δ, and subscripts to Δ should be used to denote a process. For molar values IUPAC recommends a subscript m. While for the phase change solid-liquid, meaning melting or fusion, IUPAC recommends fus for fusion, common literature also uses f, m, or sl. To avoid confusion with molar, and to allow denoting also solid-solid transitions if needed, solid-liquid is here denoted sl. Thus, the solid-liquid phase change enthalpy is denoted by ΔslH, and its molar value by ΔslHm. Mass specific values are given e.g. in J/g, amount specific (molar) values e.g. in J/mol. For mixtures the use of mass specific values is commonly preferred. The solid-liquid phase change temperature is denoted Tsl. It is given in K or in °C, where the value in K is that in °C plus 273.15.
3. Results
3.1. Mixtures of Water with PEG
Based on Figure 3, showing a shift of the eutectic temperature with varying PEG molar mass, the first questions is if this case is useful as PCM for heat storage. This requires to look at the resulting eutectics, specifically their melting temperature Tsl and enthalpy ΔslH, and furthermore their phase change behavior in general.
All relevant data were extracted (Table S1, SI) from the work of Jablonski [4], and are plotted in Figure 4. The data comprise PEG 300, 400, 600, 900, 1500, 20000, and 35000, corresponding to about n=7 to 795. As already visible in the schematic phase diagram of water – PEG mixtures in Figure 3, the data for the eutectic compositions show with increasing PEG molar mass a shift of the eutectic Tsl to higher values, and for the fraction w of PEG a shift to lower values. For the lowest PEG molar masses, the difference between Tsl is larger than 10 K, however the corresponding values of n suggest that smaller differences are possible with other n. The melting enthalpy ΔslH is, where values are available, in a range that is still interesting for PCM. And the weight fraction w of PEG is in a range where about half of the eutectic mixtures is water, which reduces the cost of the mixtures. This makes the mixtures interesting as PCM. However, besides the positive impression from material data, there are also negative issues. Looking at the phase change behavior, Jablonski [4] as well as Huang and Nishinari [7] report difficulties doing calorimetric measurements due to glass formation and recrystallization on heating. Further on, in the low molar weight range no eutectic is observed at all (Figure 4). At large molar weight, where Tsl of the pure PEG is not changing (Figure 2), the Tsl shift effect in the eutectic mixtures ceases (Figure 4). Accordingly, water - PEG mixtures are sometimes subdivided into three regions. The first is low PEG molar mass where no eutectic is observed but instead glass formation. The second is where a eutectic is observed and Tsl changes with molar mass. The third is where a change does not cause a change in Tsl anymore, at large molar mass. There is also some interesting information on the composition of the eutectics. As shown in the phase diagram (Figure 3), the eutectic is composed of a water phase and a second phase, the latter is in some sources describe it as pure PEG while in others it is described as PEG with small amounts of water.
In summary, despite that eutectic water - PEG mixtures have many advantages for use as PCM, the phase change behavior might cause problems. Therefore, more R&D to gain detailed information is needed. Generally, the systematic shift of the melting temperature Tsl is demonstrated for binary mixtures of water and PEG with systematically changing molar mass, thus members of a homologous series.
The next, crucial question is thus if there are other material classes that in binary mixtures offer the advantage of “adjustable” Tsl.
3.2. Mixtures of n-Alkanes with n-Alkanes
The n-alkanes are investigated for use as PCM at least since the 1980s. They are also the simplest example of a homologous series, having the chemical formula H-(CH2)n-H. In literature, n denotes the number of C atoms, here also equal to the number of CH2 units. Binary mixtures of n-alkanes with other n-alkanes are well investigated. Already in 1998 Bo et al. [8] investigated binary mixtures of tetra-, penta-, and hexadecane (n=14, 15, 16). With regard to the goal of the investigation here, the focus is now on eutectic binary mixtures with both components from the same material class: one component being a fixed n-alkane and the other being a varying member of the homologous series of n-alkanes.
Many n-alkanes show not only a solid-liquid phase change but also one or several solid-solid phase changes. These cause small deviations in the general trend of Tsl, and larger ones in ΔslH (Figure 1). Consequently, the phase diagrams of binary mixtures of n-alkanes can be rather complex. Mondieig et al. [9] investigated binary mixtures of n-alkanes, including their crystal structure. Specifically, they covered mixtures of n=8 to 28 with a difference Δn=n-n’ of components being 1 or 2. For binary mixtures of n=16 to 23 with n’=n+1 only the first three show eutectics. For n’=n+2, odd n with n=17 to 25 show no eutectic, while even n = 8, 14, 16 and 18 show a eutectic. Hence, it seems that if n and n’ are too similar and/or if n is too large then no eutectic exists. This can be expected, because for a solid eutectic to form on cooling from the liquid it is necessary that the components separate, which they probably don’t if they are chemically too similar.
Więckowski et al. [10] investigated binary mixtures of n-alkanes, specifically of fixed n=14 mixed with varied n=17, 19, and 21 (thus Δn≥3). They determined the phase diagrams, and plotted the liquidus lines (Figure 5). In contrast to Figure 3 the pure fixed component n=14 is on the right, the pure varied component n=17, 19, and 21 on the left. Figure 5 shows the existence of a eutectic in all mixtures, with a systematic increase of its Tsl with increasing n of the varied component, while the molar fraction x of the varied component decreases (depicted is the fraction of the fixed component, which increases).
The data of the eutectic compositions, as determined by Więckowski et al. [10], were extracted (Table S2, SI). To allow a comparison of all observed trends the fraction of the varied component (here molar) was calculated from the original, given for the fixed component. Figure 6 shows all data in a single plot. It shows, as with a common homologous series, that the eutectic binary mixtures of an n-alkane, here n=14, with other members of the same homologous series, here n=17, 19, and 21, show a systematic trend in Tsl. All trends are the same as for water – PEG binary mixtures: with increasing n, Tsl of the eutectic increases, the same holds for ΔslH, while the fraction of the varied component decreases.
3.3. Mixtures of n-Alkanols with n-Alkanols
Like n-alkanes, n-alkanols (fatty alcohols) show not only a solid-liquid phase change but also different solid-solid phase changes, which are related to small deviations of the general trend of Tsl, and larger deviations in ΔslH (Figure 1). Consequently, the phase diagrams of binary mixtures of n-alkanols can be rather complex. Ventola et al. [11] studied 10 systems of n-alkanols: for Δn=1 the combinations 15/16 until 19/20, for Δn=2 the combinations 15/17 until 18/20, and for Δn=4 the combination 16/20. As in the case of binary mixtures of n-alkanes, the presence of solid-solid transitions leads to complex phase diagrams such that eutectics need to be verified.
Li et al. [12] investigated binary mixtures of n-alkanols, specifically of fixed n=12 with varied n=14, 16, and 18 (thus Δn≥2). Their calculated phase diagrams show for all three combinations a eutectic, but for the first combination they observed no eutectic in their DSC measurements. Thus, the data collected comprise only two eutectics (Table S3, SI). Nevertheless, the results confirm again the existence of eutectics, and the values plotted in Figure 7 show the expected increase of their Tsl with increasing n of the varied component, while the fraction of the varied component decreases.
3.4. Mixtures of n-Alkanoic acids with n-Alkanoic Acids
Zhou et al. [13] investigated 10 binary mixtures of n-alkanoic acids (fatty acids) with n=10, 12, 14, 16, and 18. Specifically, they calculated the eutectic composition, its melting temperature and melting enthalpy. Afterwards, the composition was adjusted by measuring a variation of compositions, and the final values of the eutectic determined. The data allow a comparison of a series of mixtures with fixed n=10 and n=12. The data were collected (Tables S4 and S5, SI) and are plotted in Figure 8 and Figure 9. The results confirm again the existence of eutectics, and show the expected increase of their Tsl with increasing n of the varied component, while the fraction of the varied component decreases. It is noteworthy that in the case with n=12 fixed, the varied component covers not only larger but also smaller n. Regarding the melting enthalpy ΔslH, not all mixtures show a systematic trend.
3.5. Mixtures of n-Alkanoic acids with n-Alkanes
Więckowski and Królikowski [14] investigated mixtures of fixed decanoic acid, n=10, with varied n-alkanes, namely n-tetradecane, n-pentadecane, n-hexadecane, and n-heptadecane, thus n=14, 15, 16, and 17. They theoretically predicted the liquidus curves and eutectic points, and verified them experimentally. The data collected (Table S6, SI) are plotted in Figure 10. The results show again the existence of eutectics, an increase of their Tsl with increasing n of the varied component, while the fraction of the varied component decreases. The melting enthalpy ΔslH shows no trend at all.
Bidiyasar et al. [15] investigated mixtures of a fixed n-alkane, namely eicosane (n=20), with varied n-alkanoic acids, namely dodecanoic acid (lauric acid), tetradecanoic acid (myristic acid), and hexadecanoic acid (palmitic acid), thus for n=12, 14, and 16. They studied models to theoretically predict thermal properties of binary eutectic mixtures and used examples to verify their work experimentally. The data collected (Table S7, SI) are plotted in Figure 11. The results show again the existence of eutectics, an increase of Tsl with increasing n of the varied component, while the fraction of the varied component decreases. Regarding the melting enthalpy ΔslH, a systematic trend to increase is observed.
3.6. Mixtures of n-Alkanols with n-Alkanes
Więckowski and Królikowski [14] investigated mixtures of fixed 1-decanol, n=10, with varied n-alkanes, namely n-tetradecane, n-pentadecane, n-hexadecane, and n-heptadecane, thus n=14, 15, 16, and 17. They theoretically predicted the liquidus curves and eutectic points, and verified them experimentally. The collected data (Table S8, SI) are plotted in Figure 12. The results show again the existence of eutectics. However, in this case no clear trend for Tsl with increasing n of the varied component is observed in the data. Due to the small differences in Tsl and the unknown uncertainty of the experimental data, which could be of a similar size, it is however not clear if there is no trend in reality or if it is just not observed in the data. The fraction of the varied component decreases again systematically, while the melting enthalpy ΔslH shows no systematic trend.
3.7. Mixtures of n-Alkanols with n-Alkanoic Acids
Kumar et al. [16] investigated mixtures of fixed 1-dodecanol, n=10, with varied n-alkanoic acids with n=12, 14, and 16. They theoretically predicted the eutectic points, and verified them experimentally. The collected data (Table S9, SI) are plotted in Figure 13. The results show again the existence of eutectics, with increasing n of the varied component a systematic increase of Tsl, decrease of the fraction of the varied component, and increase of ΔslH.
4. Discussion
Mixtures, specifically eutectic binary mixtures, are intensively investigated as PCM for decades. Theoretical models to predict phase diagrams are studied, and experimental values listed, e.g., in reviews. Until now, their property values have been viewed isolated, and not analyzed for systematic trends. In the area of solvents, Jablonski [4] systematically studied water-PEG mixtures and noted a systematic shift of Tsl of the eutectics with PEG molar mass (Figure 3). This promises a new option to adjust Tsl for PCM development and selection, in addition to using pure members of homologous series. As a consequence, several questions arise and are now discussed based on the results in Section 3.1.
4.1. Mixtures of Water with PEG
Section 3.1 investigated the observation by Jablonski [4] on eutectic water – PEG mixtures in detail. All relevant information from the original source was collected and the data are plotted in Figure 4. While Jablonski [4] already plotted the individual values of Tsl and w, Figure 4 also includes ΔslH and moreover used not the molar mass of the PEG but instead the number of monomers n as basis. Figure 4 shows the trends that were noted by Jablonski, specifically for n=14 to 455 with increasing n a trend for Tsl to rise, and for the fraction w of the varied component in the eutectic, PEG, to decrease. In addition, it also shows that at larger n the rise of Tsl ends, corresponding to molar masses of PEG where the pure PEG has also no more rise in its values of Tsl and ΔslH (Figure 2). And at small n there is a third region where no eutectic exists. This allows to draw some conclusions on the potential of mixtures for PCM with adjustable Tsl. In general, eutectic water – PEG mixtures can be seen as an example of eutectic mixtures of a fixed component, here water, with a varied component from a homologous series, here PEG. The results show, for the water – PEG mixtures, the option to adjust Tsl by adjusting n, but that the effect is limited to a composition range. These results encourage to investigate other, similar mixtures.
4.2. Other Mixtures with a Fixed Component and a Varied Component from a Homologous Series
The next, crucial question was thus if there are other, similar mixtures based on other homologous series that show the advantage of ‘adjustable’ Tsl, potentially useful as PCM. As other homologous series the n-alkanes, n-alkanols, and n-alkanoic acids were selected. This results in six general options: three options using a single homologous series, e.g., n-alkane – n-alkane mixtures with the first n-alkane fixed and the other varied, and three options with different homologous series, e.g., n-alkane – n-alkanol mixtures. Because this is an early-stage investigation it is based solely on published information. In a literature study, publications on such binary mixtures containing the needed information on composition, melting temperature, and melting enthalpy, were identified. They were screened for those that have data for at least three members of the homologous series to see if there is a trend, the data to be experimental data, and with an experimental verification that the transition is eutectic. After the literature was identified, the data corresponding to each set of binary mixtures were extracted, tabulated (SI), and plotted in Section 3.2 to 3.7. The data show for all options investigated, except mixtures of n-alkanols with n-alkanes (Figure 12 and Table S8 SI), a systematic increase of Tsl with increasing n (number of C atoms in the variable component). Thus, the observation on eutectic water – PEG mixtures that Tsl rises systematically with the molar mass of PEG is not a coincidence. The different examples suggest that a systematic change of Tsl is rather typical for mixtures with a fixed component and a varied component from a homologous series. Moreover, in all investigated options the change of Tsl is less than 3°C between individual mixtures. This observation would not be possible with data from different sources, as e.g. found in reviews; only single sources with the same experimental method throughout, as used here, allow it (Section 2.2). Alike the trend for Tsl to rise with n, the fraction of the varied component w or x has a systematic trend to decrease. The melting enthalpy ΔslH, however, rises in several cases, in other cases increases and decreases. As Figure 1 shows, the pure components in a homologous series already have a general trend in ΔslH but with significant deviations. Thus, the trends seem to be typical, but occasionally with exceptions.
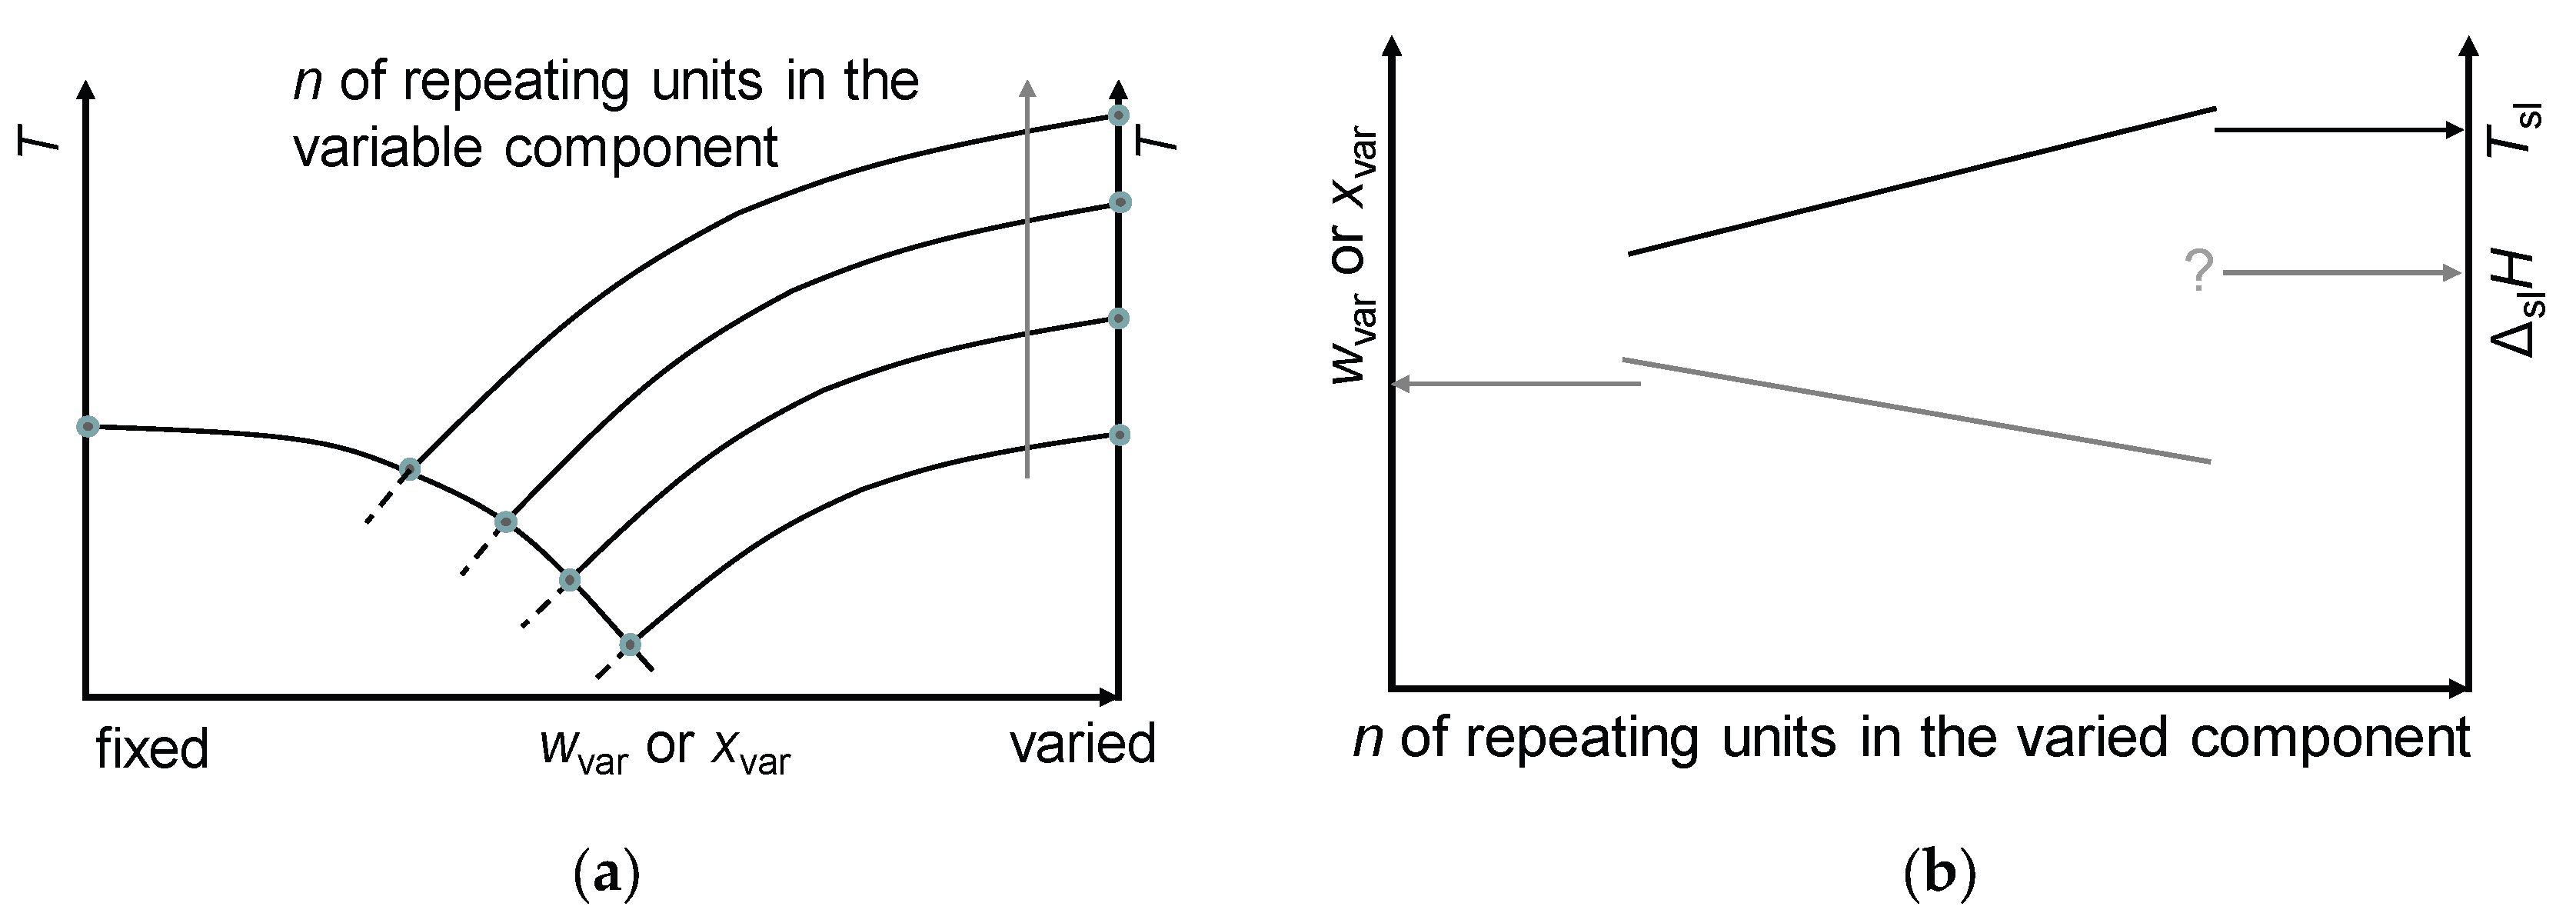
In summary, mixtures of a fixed component and a varied component from a homologous series typically show the trends sketched in Figure 14. The systematic trend in Tsl, in many cases differing by only a few K, makes them very promising for ‘adjustable’ PCM. As in the investigated examples all ΔslH are larger than 150J/g, and all components are already useful as PCM, it can be concluded that all mixtures are also useful as PCM.
4.3. Investigation of the Physical and Chemical Basis
The systematic trends with increasing number n of the repeating unit (Figure 14) of the melting temperature Tsl to increase, and the fraction of the variable component to decrease, are not occasional. In the cases tested they are almost always observed (Section 3). Consequently, it must be assumed that there is a common physical and chemical basis. For the application of the trends in future R&D, specifically to select optimized materials for the components, it is essential to understand this basis.
Works that combine theoretical predictions and experimental verification connect experimental results with the physical and chemical basis of the observed systematic trends. For example, in Section 3.2 on eutectic binary mixtures of n-alkanes with n-alkanes, Więckowski et al. [10] used several theoretical models to calculate phase diagrams and compared them with experimental data. Figure 5 shows that the systematic trend in Tsl and x already exists in the predicted phase diagrams. It is thus straight forward to analyze the theoretical models to find the basis of the trends. As mixture, the simplest case is a binary eutectic system with both components completely miscible in the liquid and immiscible in the solid with no compound formation. For an ideal system (ideal solubility), the liquidus curves in a temperature-composition phase diagram (Figure 14) can e.g. be determined by the Schröder – van Laar equation (Kahwaji and White [17])
Here xi is the mol fraction of the compound i at temperature T, R the gas constant (8.3145 J K−1 mol−1), and Tsl,i and ΔslHm,i the solid-liquid phase change temperature and molar enthalpy of the pure compound i. Reorganizing Equation 1 gives
For a pure compound xi = 1, ln(1) = 0, and for the temperature of the liquidus curve T holds T = Tsl,i. Mixing with another substance results in xi < 1, ln(xi) < 0, and therefore T < Tsl,i. Accordingly, in a phase diagram the temperatures of liquidus curves decrease inwards. The eutectic is located where both liquidus curves meet. If one component is varied such that its pure substance Tsl is higher (Figure 14), then its liquidus curve moves to higher T, and consequently Tsl of the eutectic mixture increases while the fraction of the varied component wi or xi decreases. The variation of a pure substance Tsl to higher values is typical for members of a homologous series (Figure 1 and Figure 2) with increasing number n of repeating units, thus the observed trends in Tsl and xi or wi of the eutectic with n (Figure 14) result. The inclination of the liquidus curve of the fixed component affects the observed trends. The same holds if ΔslHm,i of the varied component changes with n as well. Commonly, ΔslHm,i rises in a homologous series with n (Figure 1), which in Equation 2 slows down the left side becoming negative, which in turn slows down T to decrease; thus, the liquidus curve becomes flatter. Consequently, an increase of ΔslHm,i in a homologous series with n increases the changes forming the trends (Figure 14). If ΔslHm,i decreases the trends might get reversed. As Figure 1 shows, homologous series can show significant deviations from the overall typical trends. This is especially the case at small n, or between n being even or odd (Figure 1, Soodoo et al. [2], Mehling and White [1]), more precise depending on the presence of solid-solid transitions (Mehling et al. [18]). Then also deviations in the derived trends of eutectic binary mixtures with a component from that homologous series result. However, the observed overall trends seem to be quite robust. For eutectic binary mixtures of n-alkanes with n-alkanes, Więckowski et al. [10] determined the phase diagrams for all data points in Figure 6. All phase diagrams show complex structures due to solid-solid transitions. For eutectic binary mixtures of n-alkanoic acids with n-alkanoic acids, Costa et al. [19,20] determined phase diagrams of some of the data points in Figure 8 and Figure 9, and they show somewhat complex structures due to solid-solid transitions too. Thus, the identified trends do not only exist in simple eutectics.
Due to the above discussion, the question arises why the existence of general systematic trends was not discovered earlier. Many researchers tested eutectic mixtures with one component fixed and the other a varied member from a homologous series as PCM, and their data show trends, as the literature used as data basis for Section 3.1 to 3.7 shows. Królikowski et al. [21], who systematically studied eutectic mixtures of two ionic liquids ([(i-Quin)2C6][2Br] and [(i-Quin)2C10][2Br]) with members of the homologous series of the n-alkanediols (1,6-hexanediol, 1,8-octanediol, 1,10-decanediol, or 1,12-dodecanediol), even mention a systematic trend in Tsl of the eutectic to rise with n, the number of C atoms in the n-alkanediols. However, neither the data of the fraction x of the n-alkanediol nor the data of the eutectic ΔslH show a continuous trend. As the collected literature shows, in general the focus was on the development of new PCM, to have more options of Tsl if selecting a PCM, and the improvement of theoretical models to predict properties of eutectic mixtures and whole phase diagrams. Despite that data showing trends are available, the crucial question if trends are typical for such eutectic mixtures was not discussed yet. Especially, an analysis of a broader range of options of such eutectic mixtures, with one component fixed and the other a varying member from a homologous series, which is critical to see if trends are typical or not, was not done before.
5. Conclusions
5.1. Applications of Systematic Trends
It is necessary to stress the importance of the findings for PCM development and selection again. That eutectic mixtures with one component fixed and the other a varying member from a homologous series have typical systematic trends in Tsl and w or x has two crucial consequences:
- Regarding PCM selection, the use of eutectic mixtures with one component fixed and the other a varying member from a homologous series allows to vary and adjust Tsl, due to the discovered systematic trends, while other properties stay rather constant. The latter is the crucial difference to other mixtures. For example, for pure n-alkanes microencapsulation is an established process, widely used for thermal management in clothes, and composites with graphite are used for thermal management, e.g. of batteries. In both cases the compatibility of the materials and processes used with pure n-alkanes is established, and consequently also for eutectic mixtures of them. To adjust Tsl to an application, pure n-alkanes or eutectic mixtures of them are thus the primary choice. While pure n-alkanes have however limited choice of Tsl, e.g., between 0°C and 10°C only 5.9°C and 10°C (Figure 1), their eutectic mixtures already with n=14 as fixed basis offer 2.8°C, 4.1°C, and 5.4°C (Figure 6).
Literature data covering all possible eutectic mixtures does not exist, thus awareness of their existence is insufficient. Here the variation by systematic trends helps too.
- 2.
- Regarding PCM development, a systematic trend in Tsl and in the fraction w or x of eutectics (Figure 14) allows to predict probable Tsl and w or x of new eutectics from a few known ones. For example, knowing Tsl for mixtures of n-alkane n=14 with n=17, 19, and 21 (Figure 6), it is likely that mixtures with other odd n outside that n range have higher Tsl for higher n, and lower Tsl for lower n, or to fill gaps with regard to n. This can be done as well by theoretical models. Theoretical models work for any mixture, can even predict what can be mixed, the phase diagram which allows to assess the phase change behavior, even if a eutectic exists at all. However, specifically regarding Tsl the trends seem to be more precise as some models. Even more, theoretical models require at least knowledge of Tsl and ΔslH of the components, thus literature data or own measurements. However, if a component decomposes before melting, these data cannot be determined at all.
5.2. Future R&D
Based on the previous discussion, future R&D can be split up into three areas.
The first area of future R&D should be to extend the data basis for eutectic mixtures with one component fixed and the other a varying member from a homologous series. This should cover a wider variation of n in the general options already investigated here (water – PEG, and binary mixtures between n-alkanes, n-alkanols, and n-alkanoic acids), specifically identify n ranges where the trends exist, where the trend has outliers or ceases, and where no eutectics exist at all. Further on, this should also include the use of a wider variation of material classes. The results by Królikowski et al. [21] on IL – n-alkane diols (IL = Ionic Liquid) already showed the same trends, and as the discussion in Section 4.3 showed, the trends should not be limited to any specific material classes.
The second area of future R&D should be to extend the understanding of the basis of the observed trends. Section 4.3 discussed simple binary eutectic systems where both components are in the liquid completely miscible and in the solid immiscible with no compound formation. More insight promises the study of more complex systems, and also the use of more detailed theoretical models to predict phase diagrams.
The third area of future R&D should be to study the application of the observed trends, e.g., on the application examples already discussed in Section 5.1. For this, further properties of the eutectic mixtures have to be studied, not only Tsl and ΔslH. An example are PCM composites, e.g., testing the infiltration of a set of eutectic mixtures in a given graphite matrix.
Finally, if the trends are observed in general, as is expected from the results and discussion here, it could also be worth discussing if the term ‘homologous’ should be used in the future in a wider sense, including mixtures.
Supplementary Materials
The following supporting information can be downloaded at the website of this paper posted on Preprints.org, All tables with the collected data.
Funding
This research received no external funding.
Data Availability Statement
The original contributions presented in this study are included in the article/supplementary material. Further inquiries can be directed to the corresponding author(s).
Conflicts of Interest
The authors declare no conflicts of interest.
Abbreviations
The following abbreviations are used in this manuscript:
| PCM | Phase Change Material |
| PSE | Periodic System of Elements |
| PE | PolyEthylene |
| PEG | PolyEthyleneGlycol |
| IL | Ionic Liquid |
| IUPAC | International Union of Pure and Applied Chemistry |
| NRTL | Non-Random-Two-Liquid-modell |
| UNIFAC | UNIversal quasichemical Functional group Activity Coefficients |
References
- Mehling, H.; White, M. A. Analysis of trends in phase change enthalpy, entropy and temperature for alkanes, alcohols and fatty acids. Chemical Physics Impact 2023, 6, 100222. [Google Scholar] [CrossRef]
- Soodoo, N.; Poopalam, K. D.; Bouzidi, L.; Narine, S. S. Fundamental structure-function relationships in vegetable oil based phase change materials: A critical review. Journal of Energy Storage 2022, 51, 104355. [Google Scholar] [CrossRef]
- Mishra, D. K.; Bhowmik, S.; Pandey, K. M. Polyethylene Glycol based form stable composite Phase Change Material: a review. J. Phys.: Conf. Ser. 2020, 1455, 012025. [Google Scholar] [CrossRef]
- Jablonski, P. Kalorimetrische Untersuchungen des Systems Polyethylenglykol/Wasser. PhD Thesis, Fakultät für Naturwissenschaften der Gerhard-Mercator-Universität – Gesamthochschule, Duisburg, 2002. [Google Scholar]
- Faden, M.; Höhlein, S.; Wanner, J.; König-Haagen, A.; Brüggemann, D. Review of Thermophysical Property Data of Octadecane for Phase-Change Studies. Materials 2019, 12, 2974. [Google Scholar] [CrossRef] [PubMed]
- Renner, T. Quantities, Units, and Symbols in Physical Chemistry, IUPAC Green Book, 3rd ed.; Editors Cohen, E.R.; Cvitas, T.; Frey, J.G.; Holmstrom, B.; Kuchitsu, K.; Marquardt, R.; Mills, I.; Pavese, F.; Quack, M.; Stohner, J.; Strauss, H.; Takami, M.; Thor, A.J. RSC Publishing, 2007. [CrossRef]
- Huang, L.; Nishinari, K. Interaction Between Poly(ethylene glycol) and Water as Studied by Differential Scanning Calorimetry. Journal of Polymer Science: Part B: Polymer Physics 2001, 39, 496–506. [Google Scholar] [CrossRef]
- Bo, H.; Gustafsson, M.; Setterwall, F. Paraffin Waxes and Their Binary Mixture as Phase Change Materials (PCMs) for Cool Storage in District Cooling System. Workshop paper, IEA Annex 10, Phase Change Materials and Chemical Reactions for Thermal Energy Storage. First Workshop, 16-17 April 1998, Adana, Turkey.
- Mondieig, D.; Rajabalee, F.; Metivaud, V.; Oonk, H. A. J.; Cuevas-Diarte, M. A. n-Alkane Binary Molecular Alloys. Chem. Mater. 2004, 16, 786–798. [Google Scholar] [CrossRef]
- Więckowski, M.; Krolikowski, M.; Scheller, Ł.; Dzida, M. Alkane-based eutectic phase change materials doped with carbon nanomaterials. Phys. Chem. Chem. Phys. 2023, 25, 16979–16990. [Google Scholar] [CrossRef] [PubMed]
- Ventola, L.; Calvet, T.; Cuevas-Diarte, M. A.; Ramírez, M.; Oonk, H. A. J.; Mondieig, D.; Negrier, P. Melting behaviour in the n-alkanol family. Enthalpy–entropy compensation. Phys. Chem. Chem. Phys. 2004, 6, 1786–1791. [Google Scholar] [CrossRef]
- Li, D.; Lenfant, T.; Landry, V.; Rodrigue, D.; Kaboorani, A.; Wang, X. Development and investigation of biobased binary eutectic phase change materials for low-temperature building applications: 1-Hexadecanol/1-Dodecanol and 1-Octadecanol/1-Dodecanol. Journal of Energy Storage 2024, 103, 114345. [Google Scholar] [CrossRef]
- Zhou, D.; Xiao, S.; Xiao, X.; Liu, Y. Preparation, Phase Diagrams and Characterization of Fatty Acids Binary Eutectic Mixtures for Latent Heat Thermal Energy Storage. Separations 2023, 10, 49. [Google Scholar] [CrossRef]
- Więckowski, M.; Królikowski, M. Designing and Characterization of Low-Temperature Eutectic Phase Change Materials Based on Alkanes. J. Chem. Eng. Data 2022, 67, 727–738. [Google Scholar] [CrossRef]
- Bidiyasar, R.; Kumar, R.; Jakhar, N. Thermal Property Prediction of Eicosane-Fatty Acid Eutectic Phase Change Materials Using the Modified UNIFAC Model for Thermal Energy Storage Technology. Energy storage 2025, 7, e70277. [Google Scholar] [CrossRef]
- Kumar, R.; Vyas, S.; Dixit, A. Fatty acids/1-dodecanol binary eutectic phase change materials for low temperature solar thermal applications: Design, development and thermal analysis. Solar Energy 2017, 155, 1373–1379. [Google Scholar] [CrossRef]
- Kahwaji, S.; White, M. A. Prediction of the properties of eutectic fatty acid phase change materials. Thermochimica Acta 2018, 660, 94–100. [Google Scholar] [CrossRef]
- Mehling, H.; Thoen, J.; Glorieux, C.; White, M.A. High-Accuracy and High-Resolution Calorimetry Revealing New Correlations of Phase Change Enthalpy, Entropy, and Number of Carbon Atoms n in n-Alkanes. Molecules 2025, 30, 1300. [Google Scholar] [CrossRef] [PubMed]
- Costa, M. C.; Sardo, M.; Rolemberg, M. P.; Ribeiro-Claro, P.; Meirelles, A.; Coutinho, J.; Krähenbühl, M.A. The solid–liquid phase diagrams of binary mixtures of consecutive, even saturated fatty acids: differing by four carbon atoms. Chemistry and Physics of Lipids 2009, 157, 40–50. [Google Scholar] [CrossRef] [PubMed]
- Costa, M. C. Rolemberg, M. P.; Meirelles, A.; Coutinho, J.; Krähenbühl, M.A. The solid–liquid phase diagrams of binary mixtures of even saturated fatty acids differing by six carbon atoms. Thermochimica Acta 2009, 496, 30–37. [Google Scholar] [CrossRef]
- Królikowski, M.; Więckowski, M.; Żółtańska, K.; Królikowska, M. Eutectic Phase Change Materials based on novel dicationic Isoquinoliunium Ionic Liquids: Synthesis and Characterization. J. Chem. Eng. Data 2024, 69, 958–972. [Google Scholar] [CrossRef]
Figure 1.
Solid-liquid phase change temperature Tsl (a) and molar solid-liquid phase change enthalpy ΔslHm (b) versus n (number of C atoms) for some n-alkanes ●, n-alkanols ▲, and n-alkanoic acids ♦.
Figure 1.
Solid-liquid phase change temperature Tsl (a) and molar solid-liquid phase change enthalpy ΔslHm (b) versus n (number of C atoms) for some n-alkanes ●, n-alkanols ▲, and n-alkanoic acids ♦.
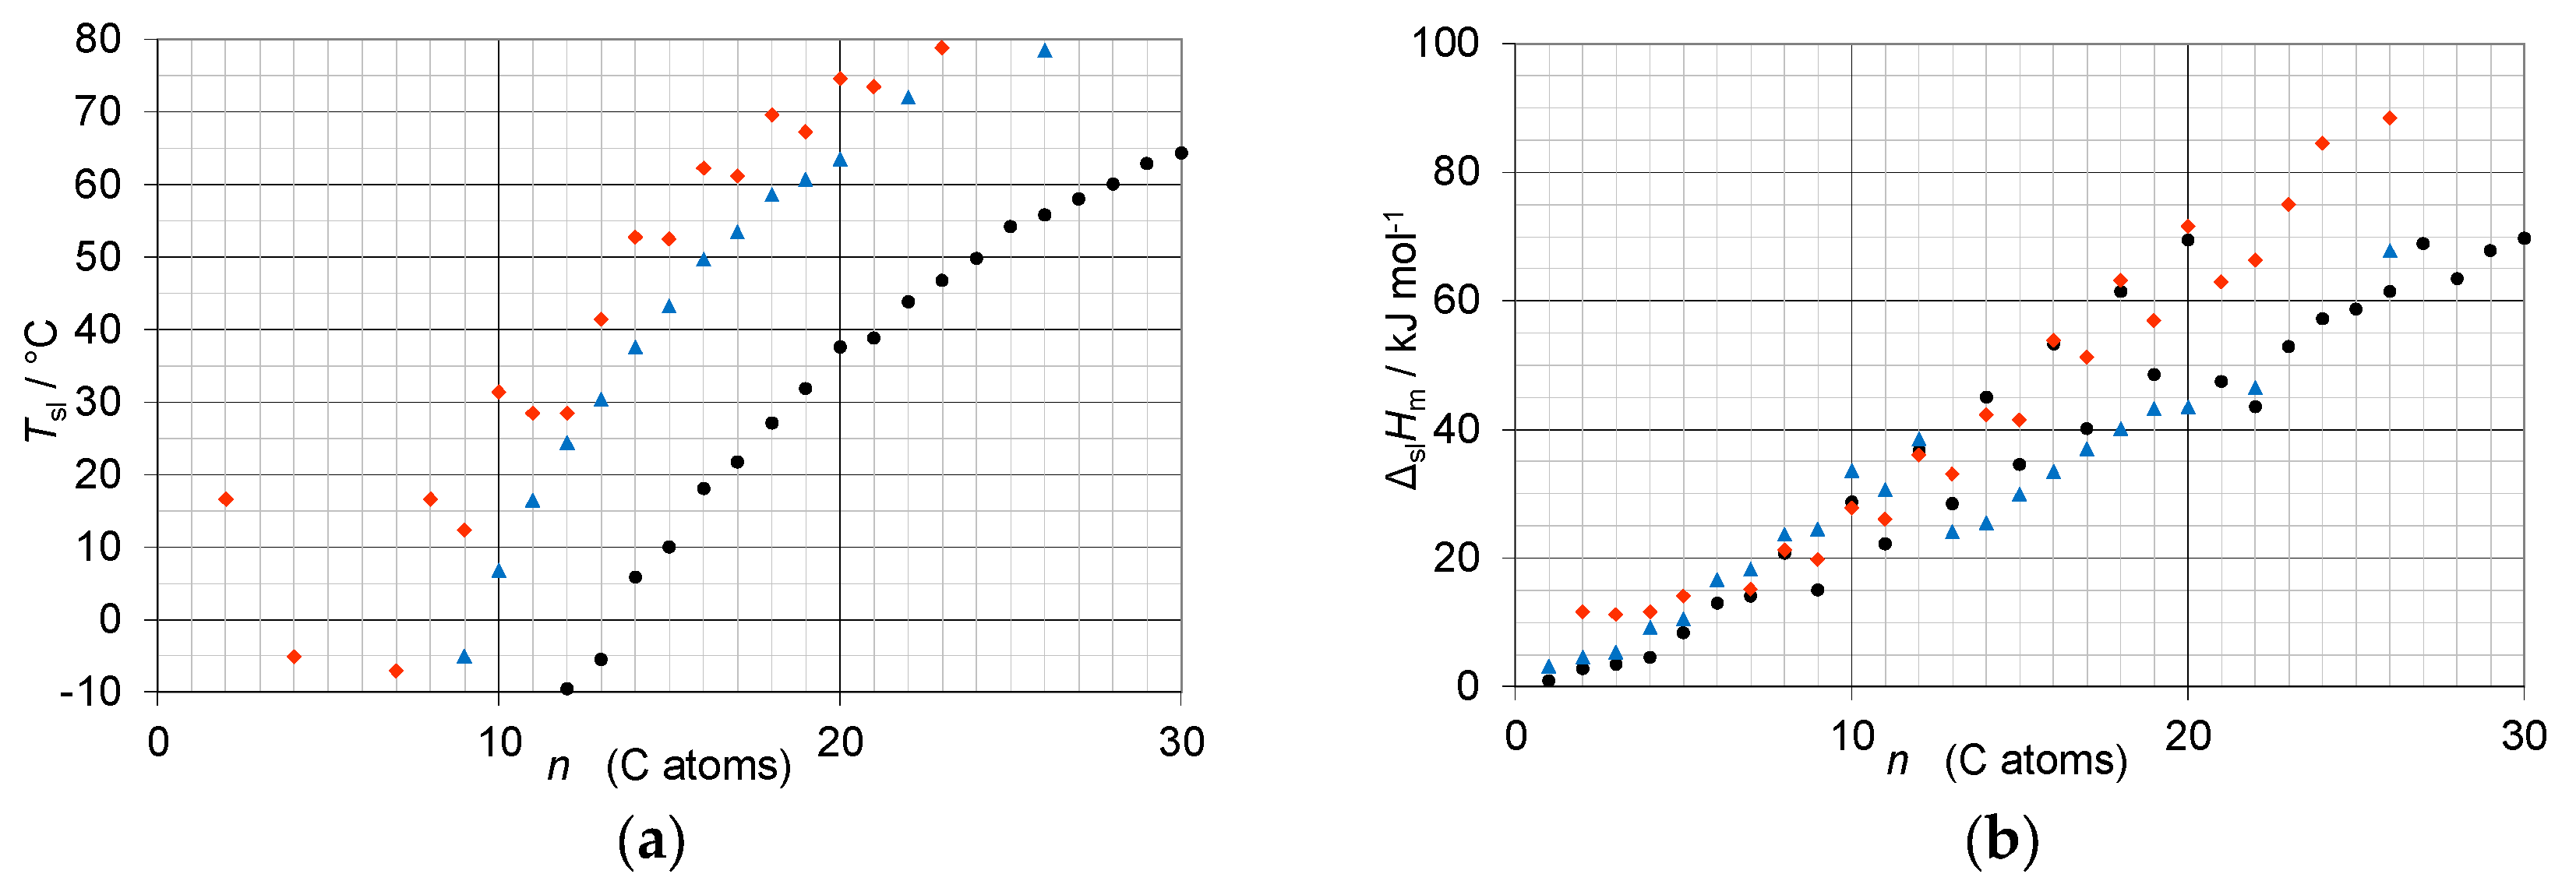
Figure 2.
Solid-liquid phase change temperature Tsl (a) and enthalpy ΔslH (b) for PEGs of different molar mass.
Figure 2.
Solid-liquid phase change temperature Tsl (a) and enthalpy ΔslH (b) for PEGs of different molar mass.
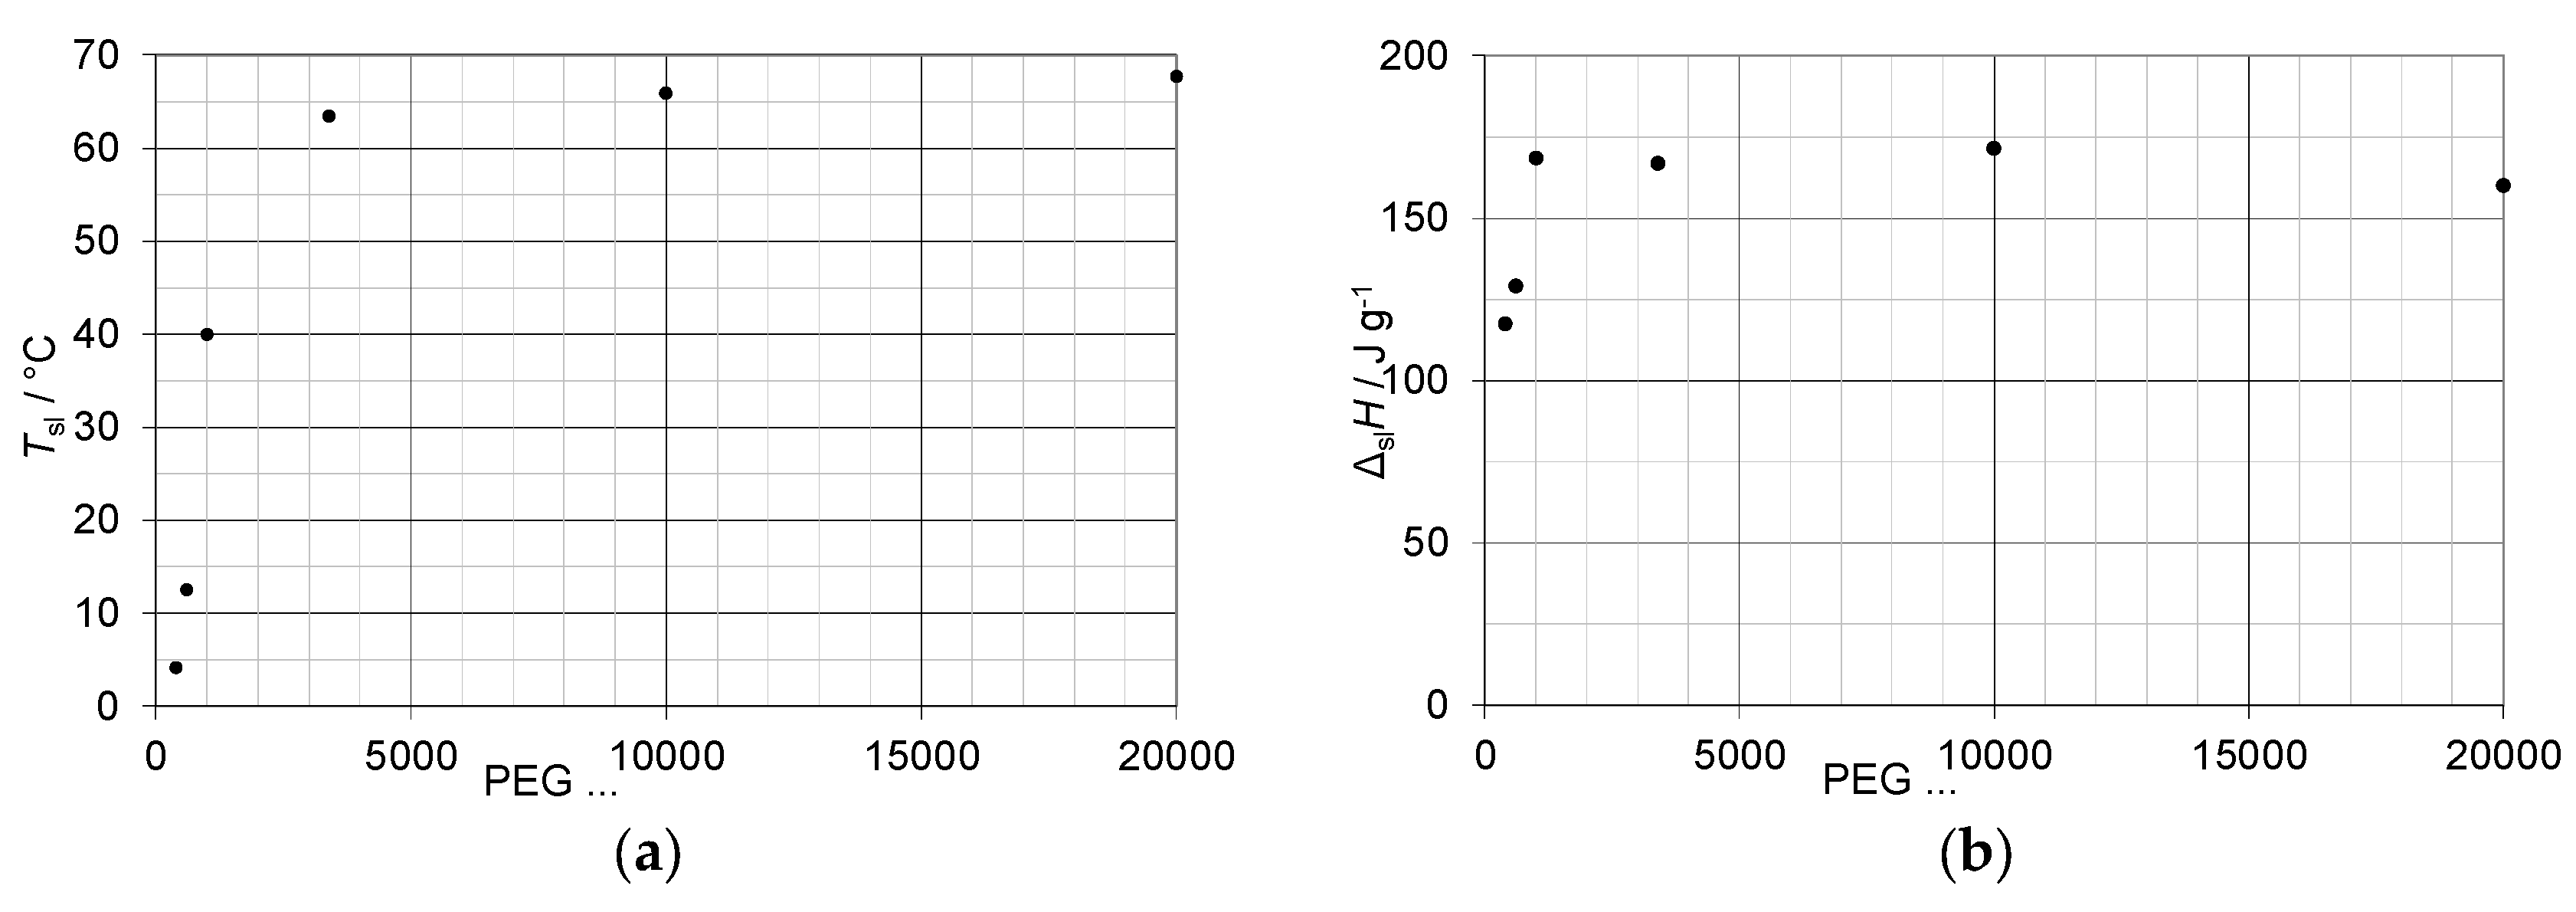
Figure 3.
Schematic phase diagram (a) of water – PEG mixtures for PEG of varying molar mass (adapted from Jablonski [4]). There is a systematic shift of the eutectic point. (b) Shift of the composition and the melting temperature as function of PEG molar mass.
Figure 3.
Schematic phase diagram (a) of water – PEG mixtures for PEG of varying molar mass (adapted from Jablonski [4]). There is a systematic shift of the eutectic point. (b) Shift of the composition and the melting temperature as function of PEG molar mass.
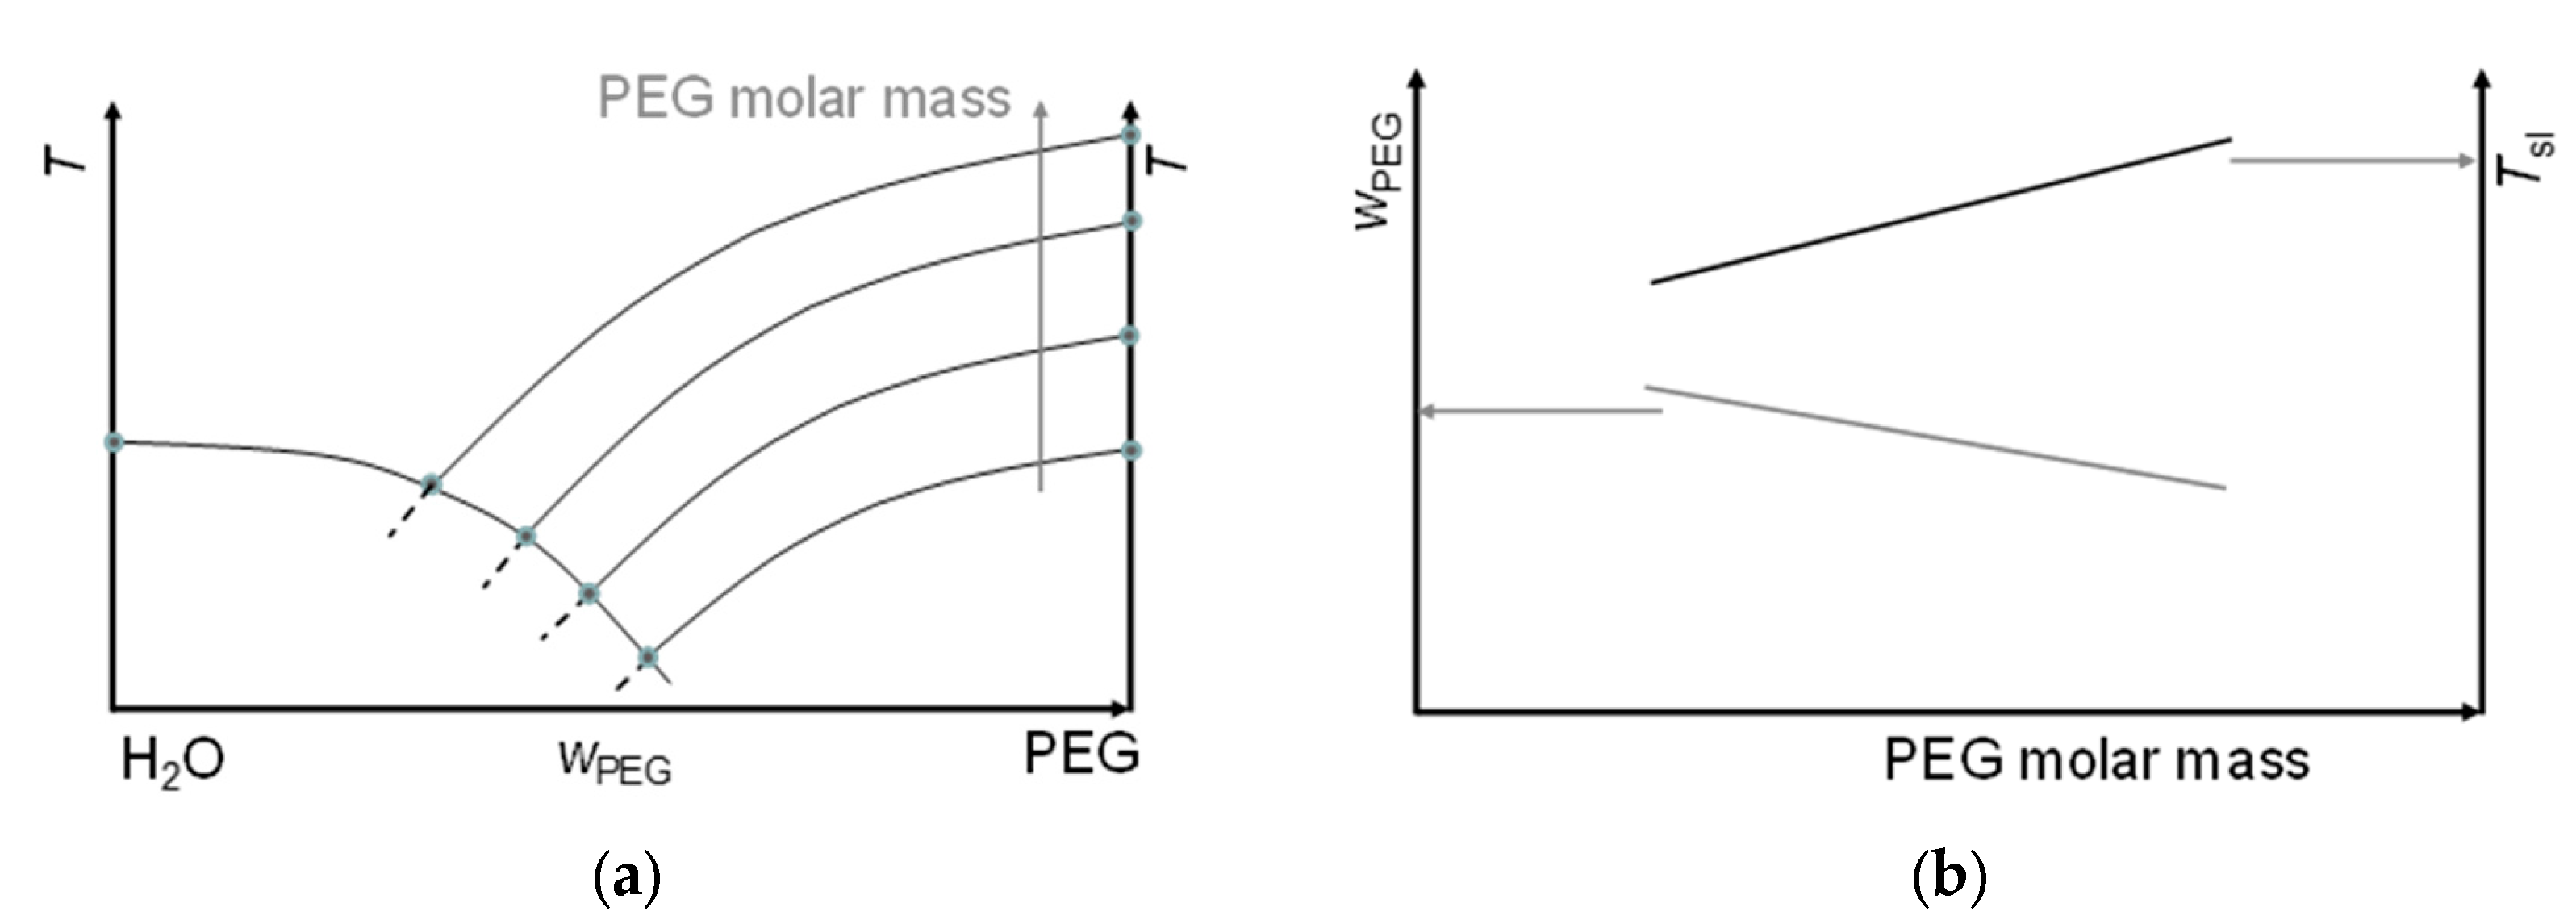
Figure 4.
Data of eutectic mixtures of water with PEG of different molar mass (Table S1, SI): ● w, ■ Tsl, ▲ ΔslH.
Figure 4.
Data of eutectic mixtures of water with PEG of different molar mass (Table S1, SI): ● w, ■ Tsl, ▲ ΔslH.
Figure 5.
Liquidus curves of systems: ● n1=14 – n2=17, ♦ n1=14 – n2=19, ▲ n1=14 – n2=21. Points represent experimental data, solid lines NRTL correlation, dashed lines UNIFAC (Do) prediction, dotted lines ideal solubility (source: Więckowski et al. [10]).
Figure 5.
Liquidus curves of systems: ● n1=14 – n2=17, ♦ n1=14 – n2=19, ▲ n1=14 – n2=21. Points represent experimental data, solid lines NRTL correlation, dashed lines UNIFAC (Do) prediction, dotted lines ideal solubility (source: Więckowski et al. [10]).
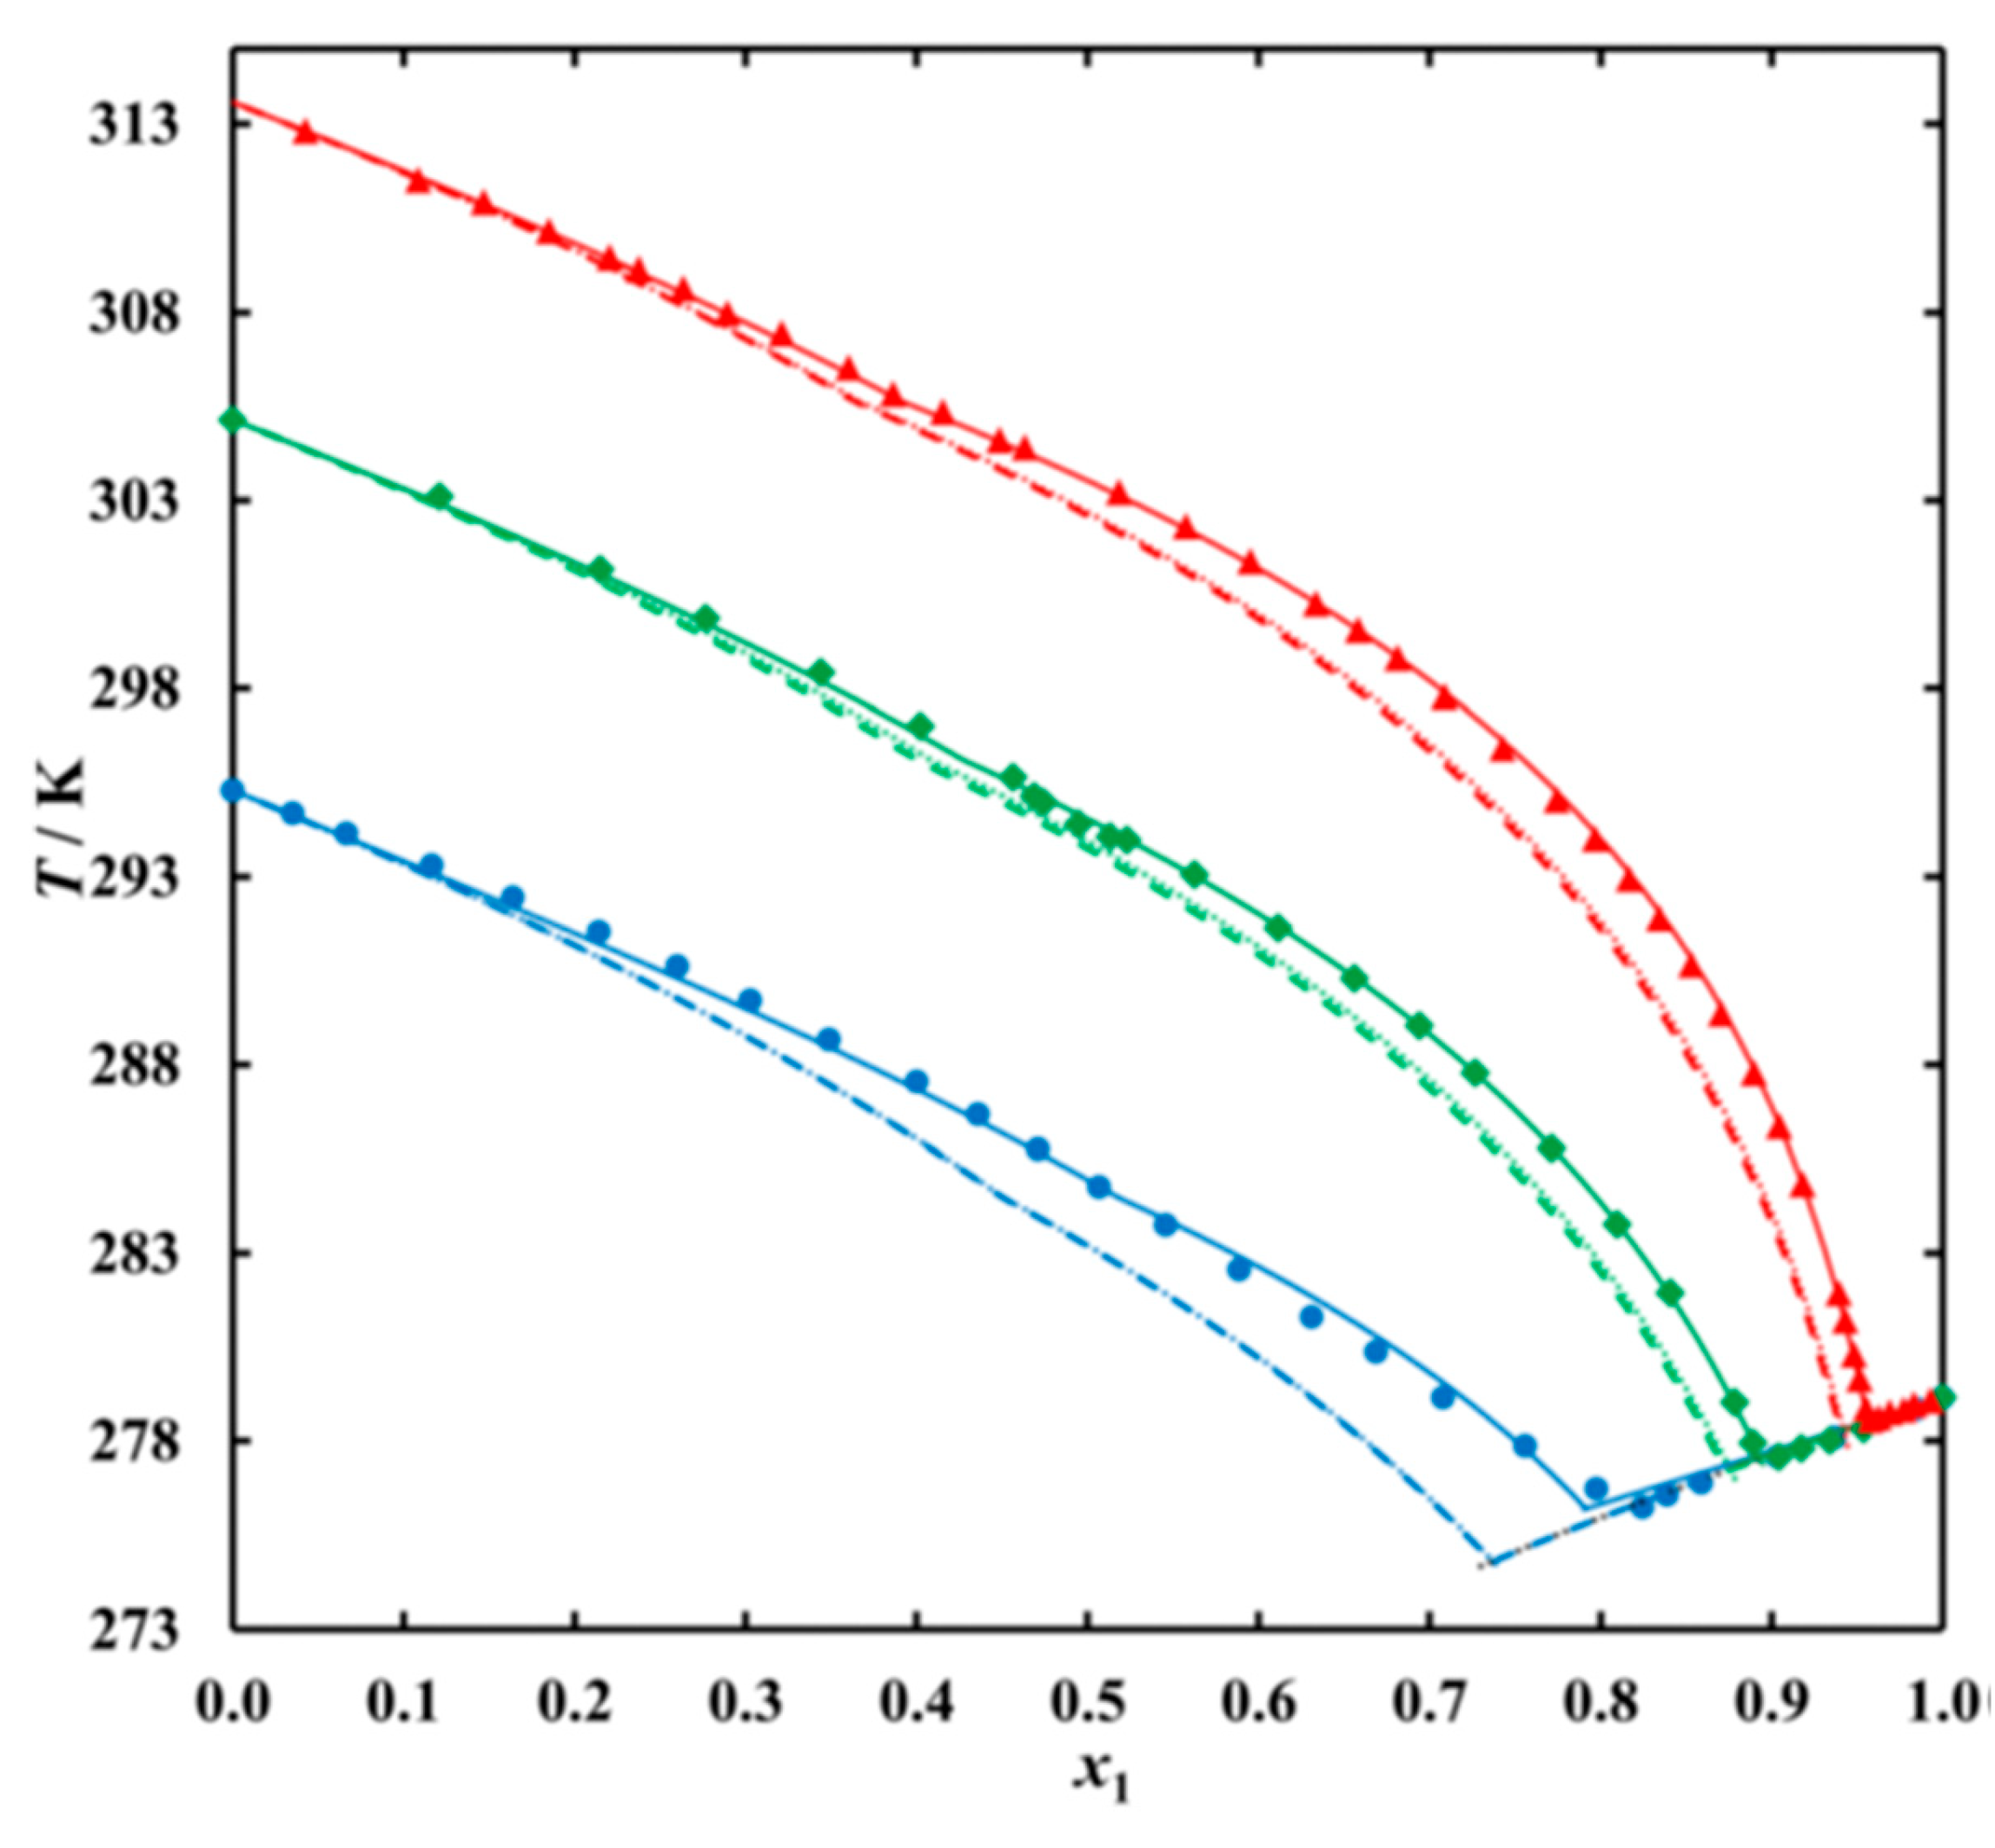
Figure 6.
Data of eutectic mixtures of n-alkane n=14 with other n-alkanes (Table S2, SI): ● x, ■ Tsl, ▲ ΔslH.
Figure 6.
Data of eutectic mixtures of n-alkane n=14 with other n-alkanes (Table S2, SI): ● x, ■ Tsl, ▲ ΔslH.
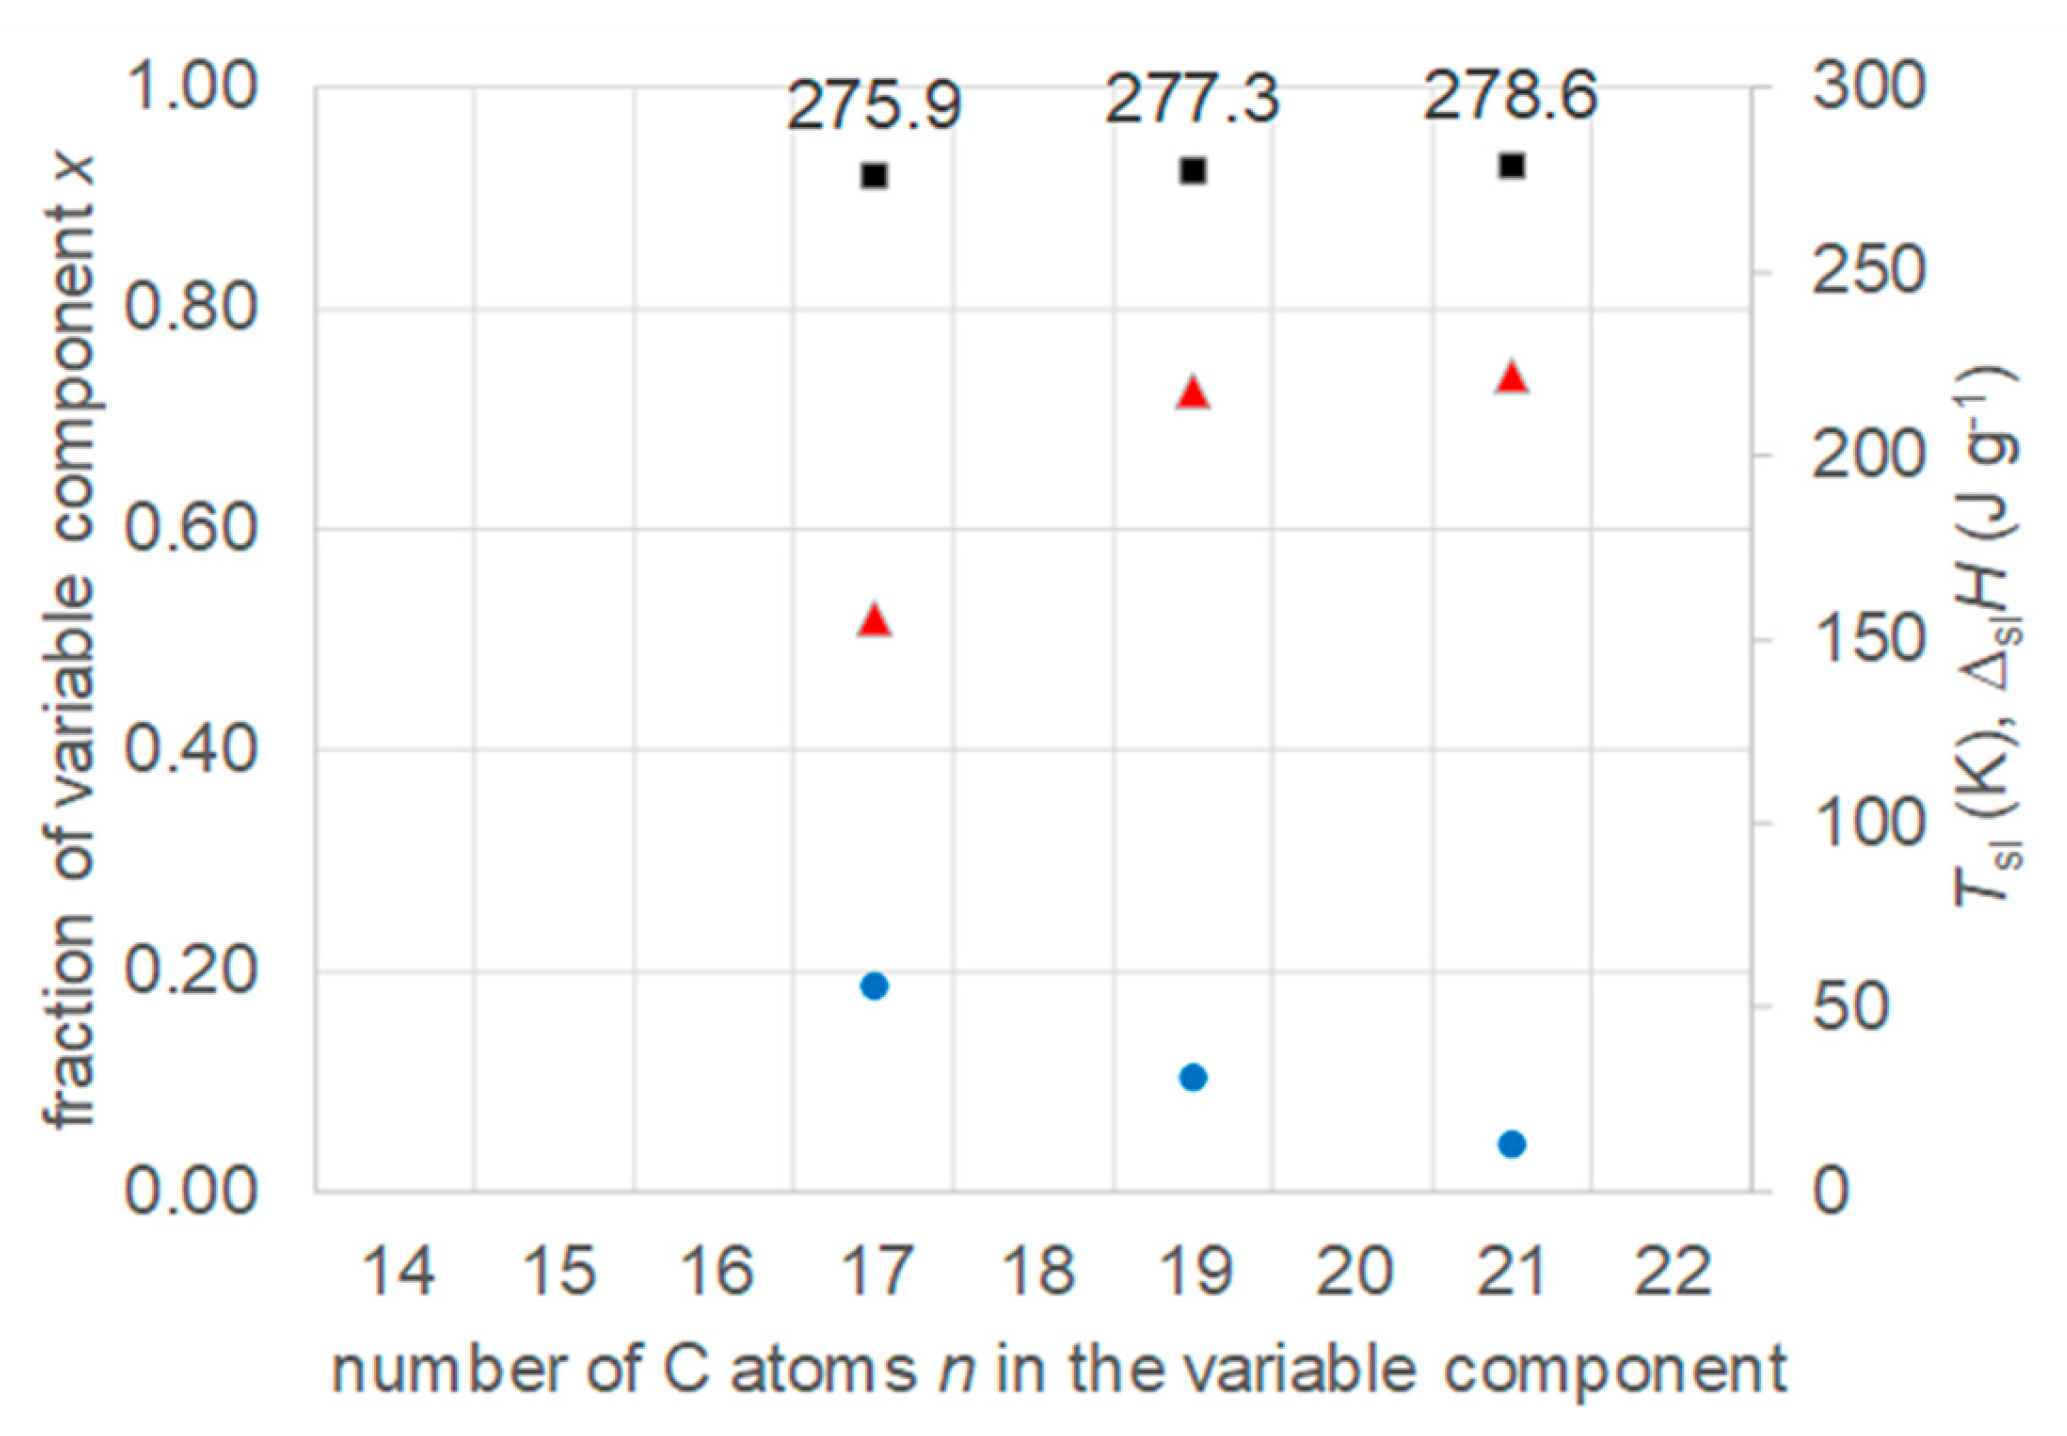
Figure 7.
Data of eutectic mixtures of n-alkanol n=12 with other n-alkanols (Table S3, SI): ● x, ■ Tsl, ▲ ΔslH.
Figure 7.
Data of eutectic mixtures of n-alkanol n=12 with other n-alkanols (Table S3, SI): ● x, ■ Tsl, ▲ ΔslH.
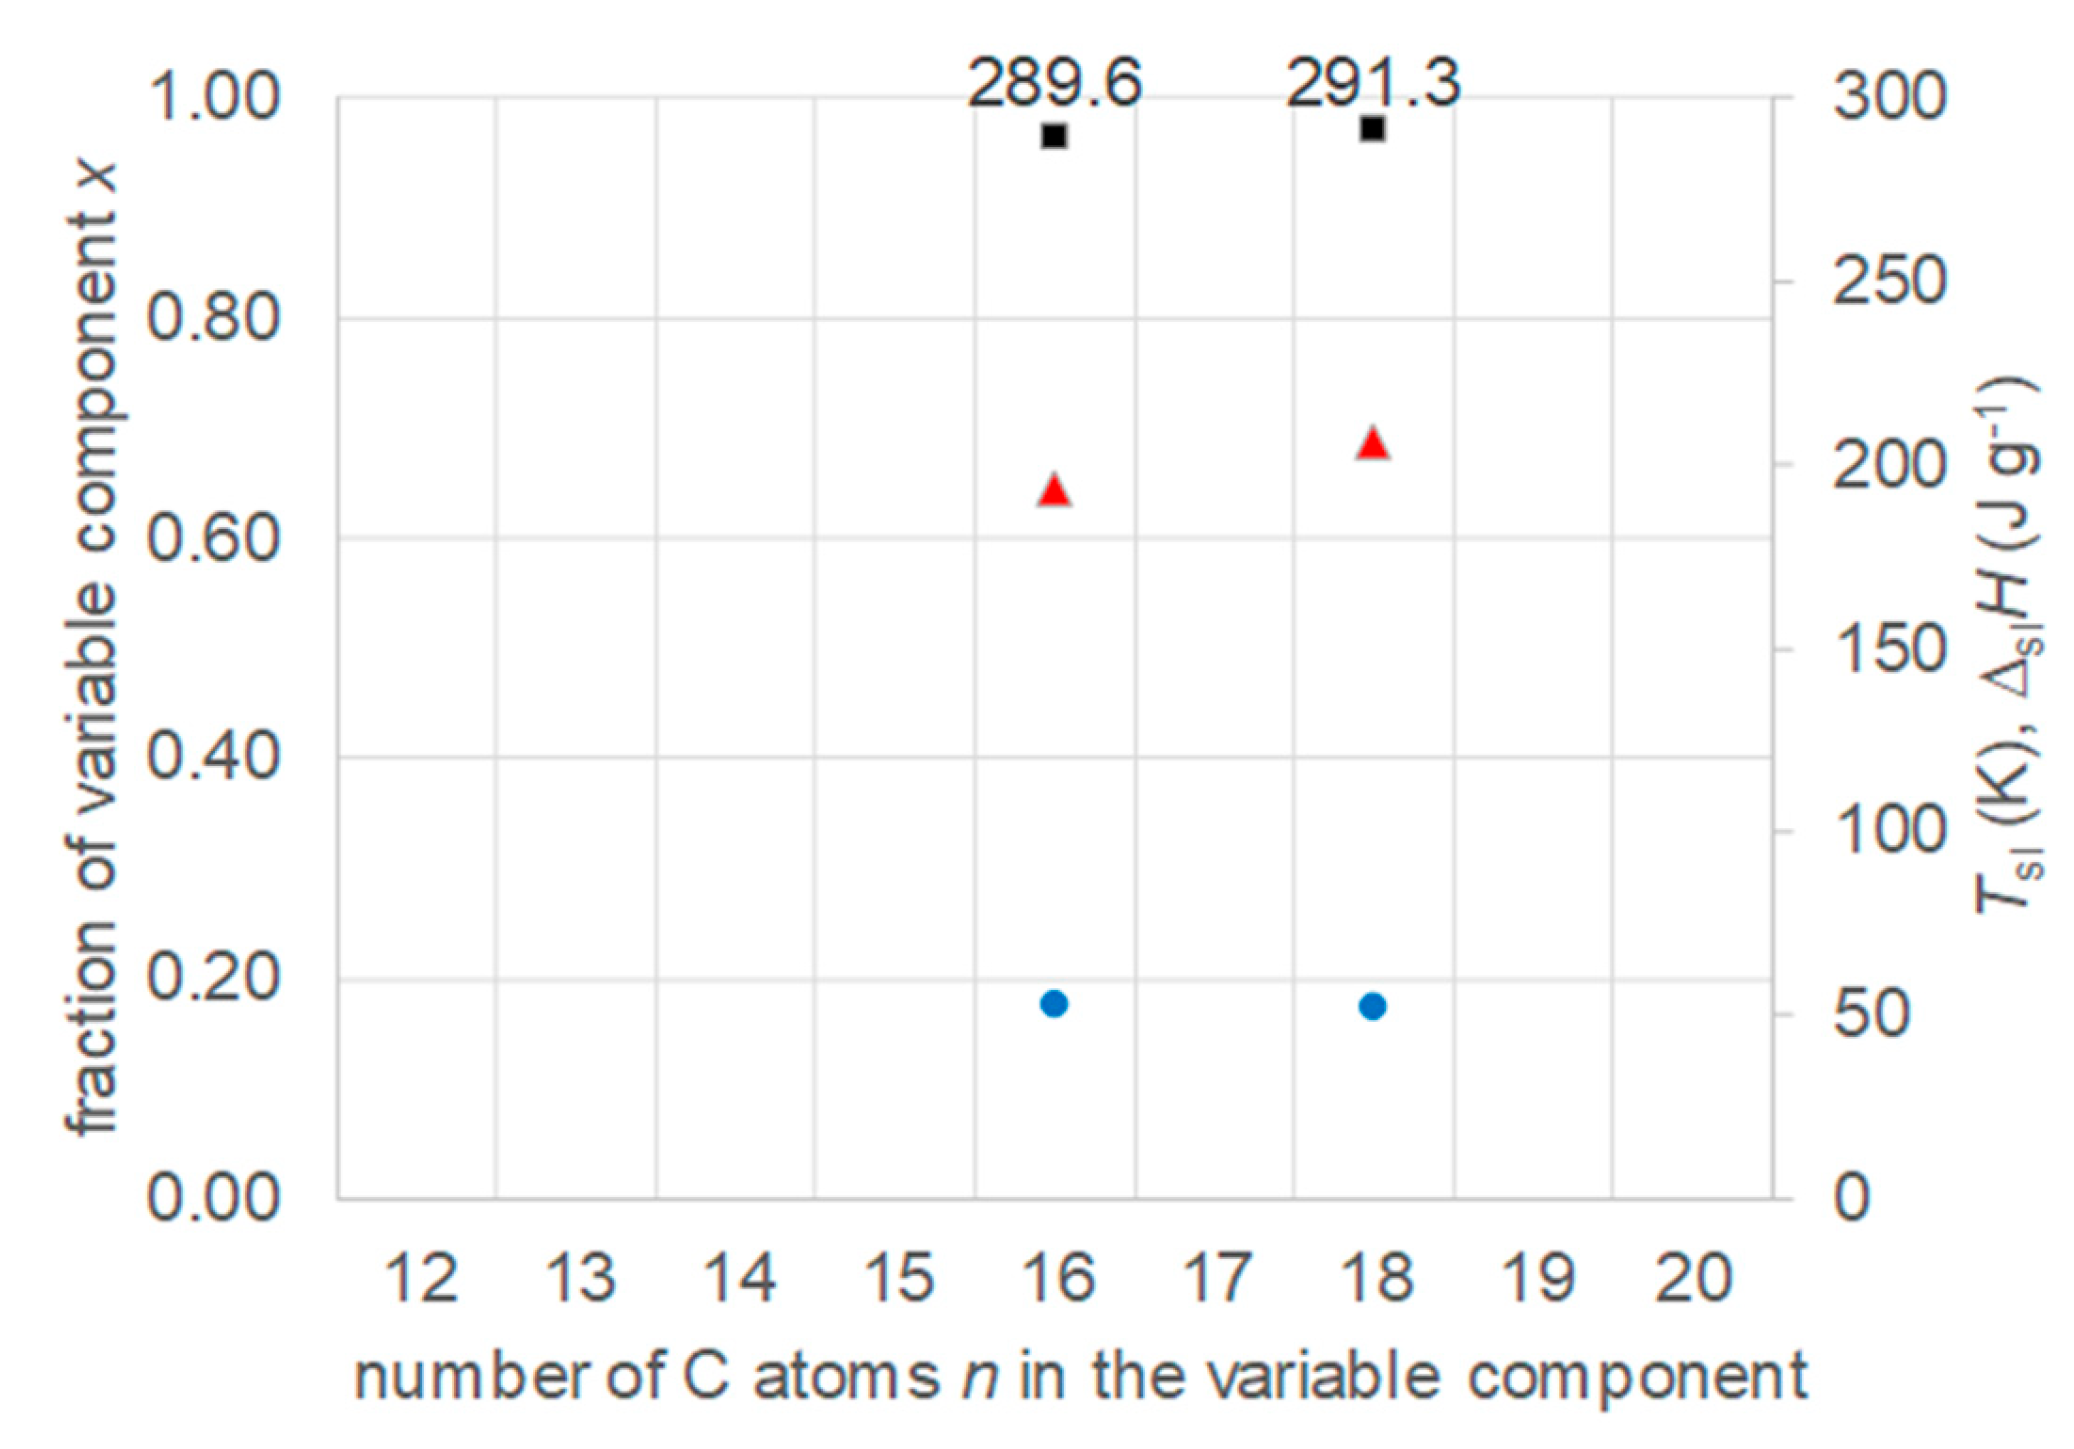
Figure 8.
Data of eutectic mixtures of n-alkanoic acid n=10 with other n-alkanoic acids (Table S4, SI): ● w, ■ Tsl, ▲ ΔslH.
Figure 8.
Data of eutectic mixtures of n-alkanoic acid n=10 with other n-alkanoic acids (Table S4, SI): ● w, ■ Tsl, ▲ ΔslH.
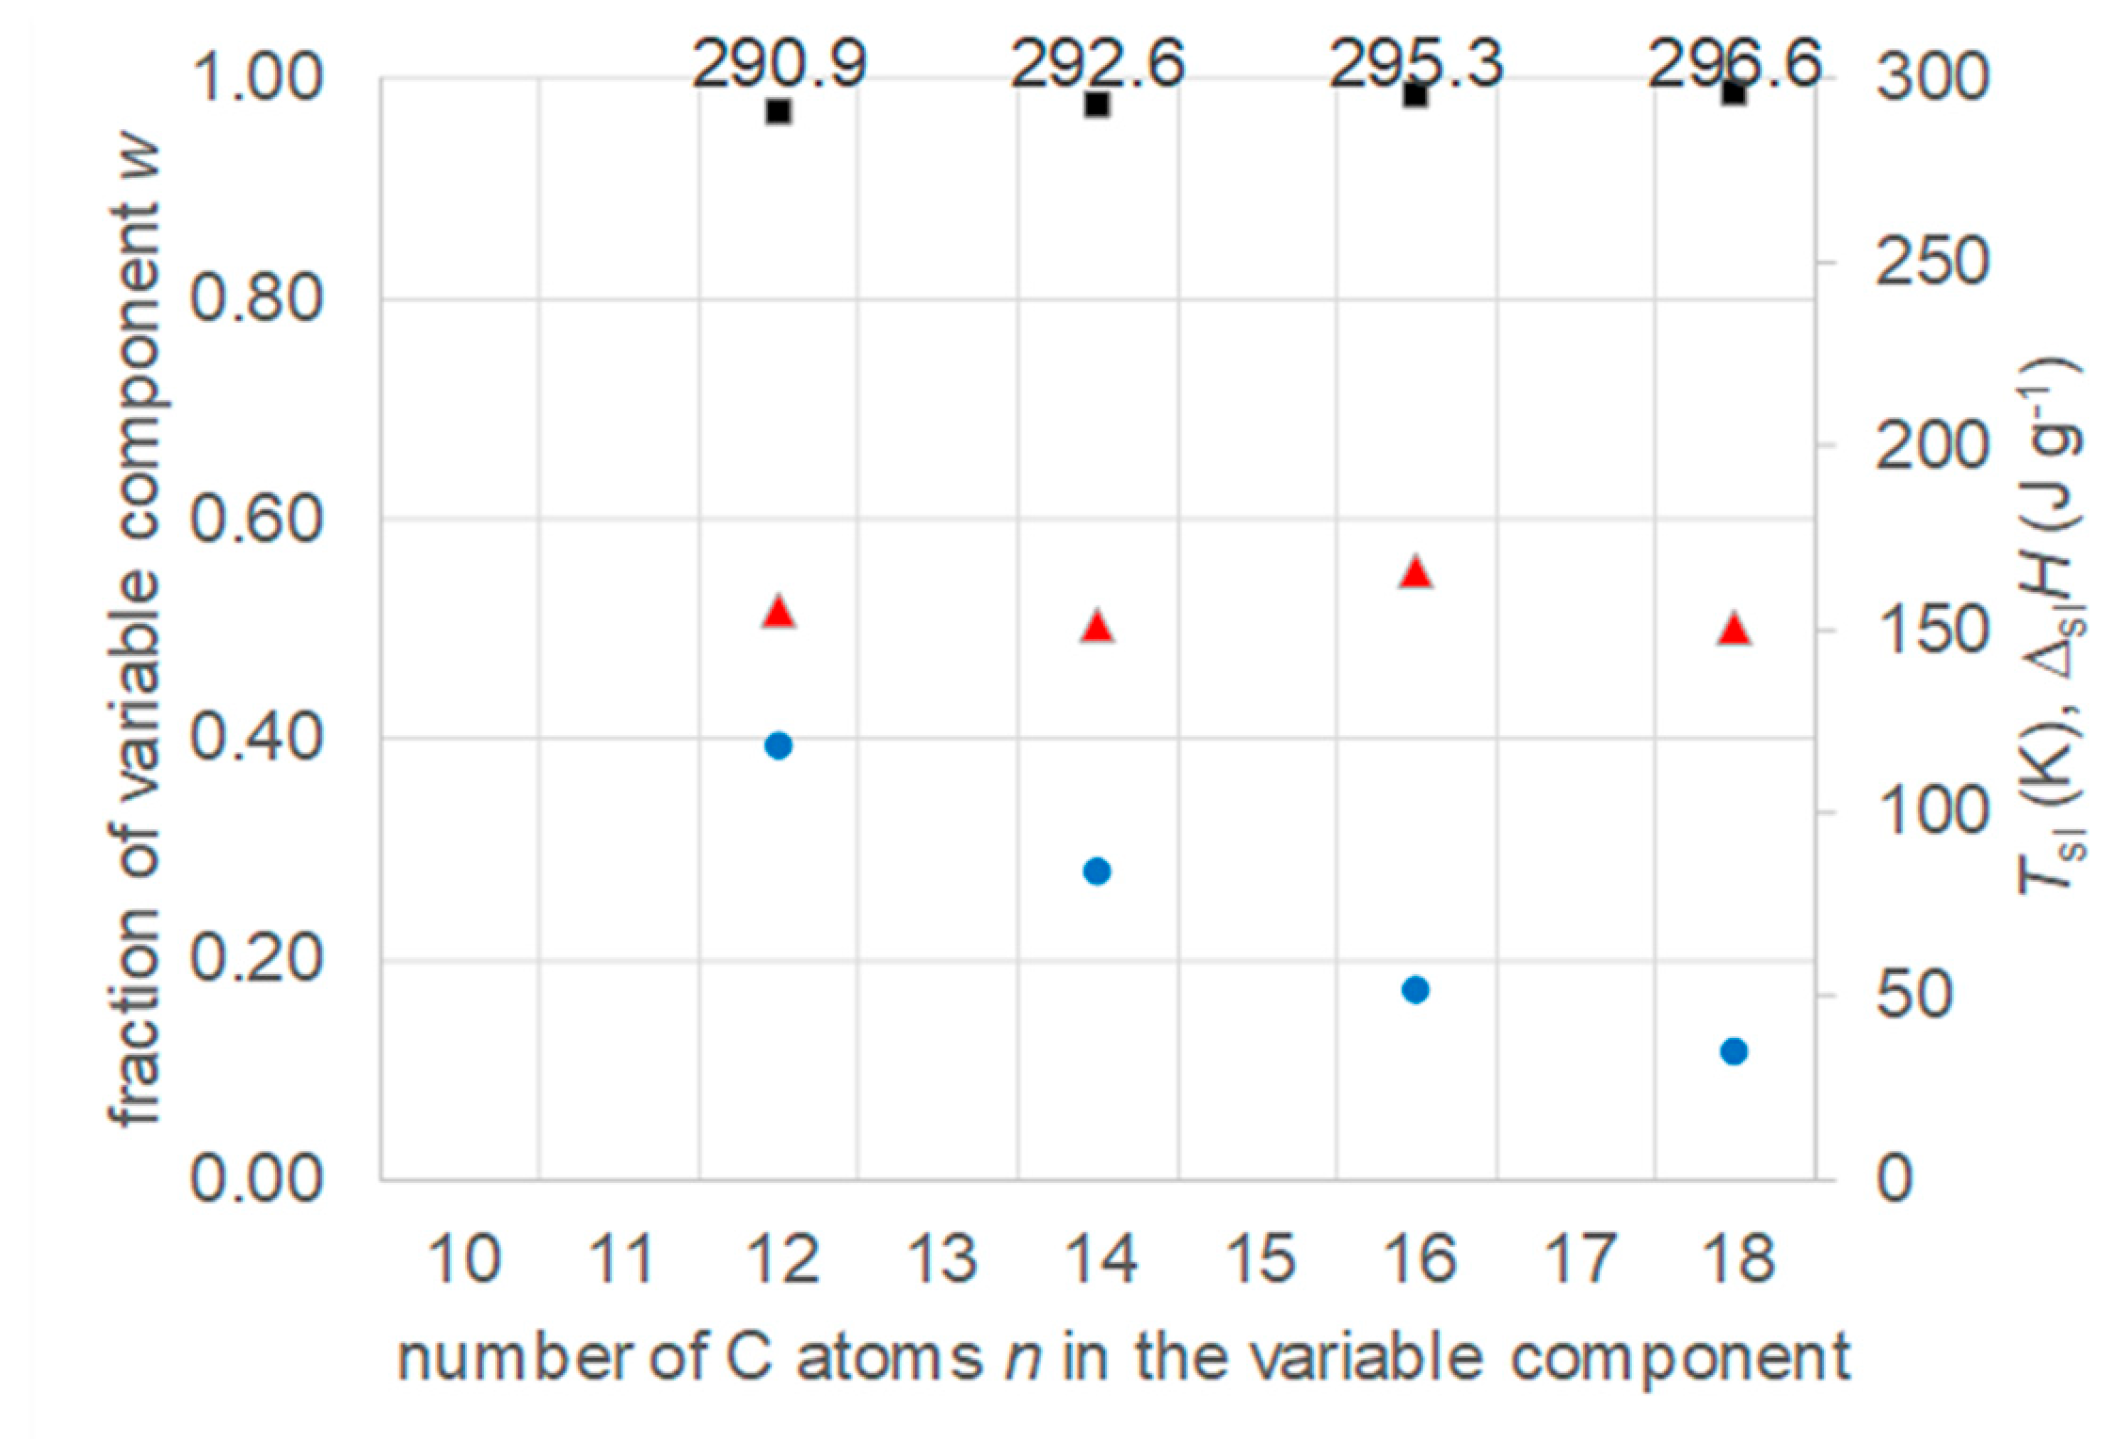
Figure 9.
Data of eutectic mixtures of n-alkanoic acid n=12 with other n-alkanoic acids (Table S5, SI): ● w, ■ Tsl, ▲ ΔslH.
Figure 9.
Data of eutectic mixtures of n-alkanoic acid n=12 with other n-alkanoic acids (Table S5, SI): ● w, ■ Tsl, ▲ ΔslH.
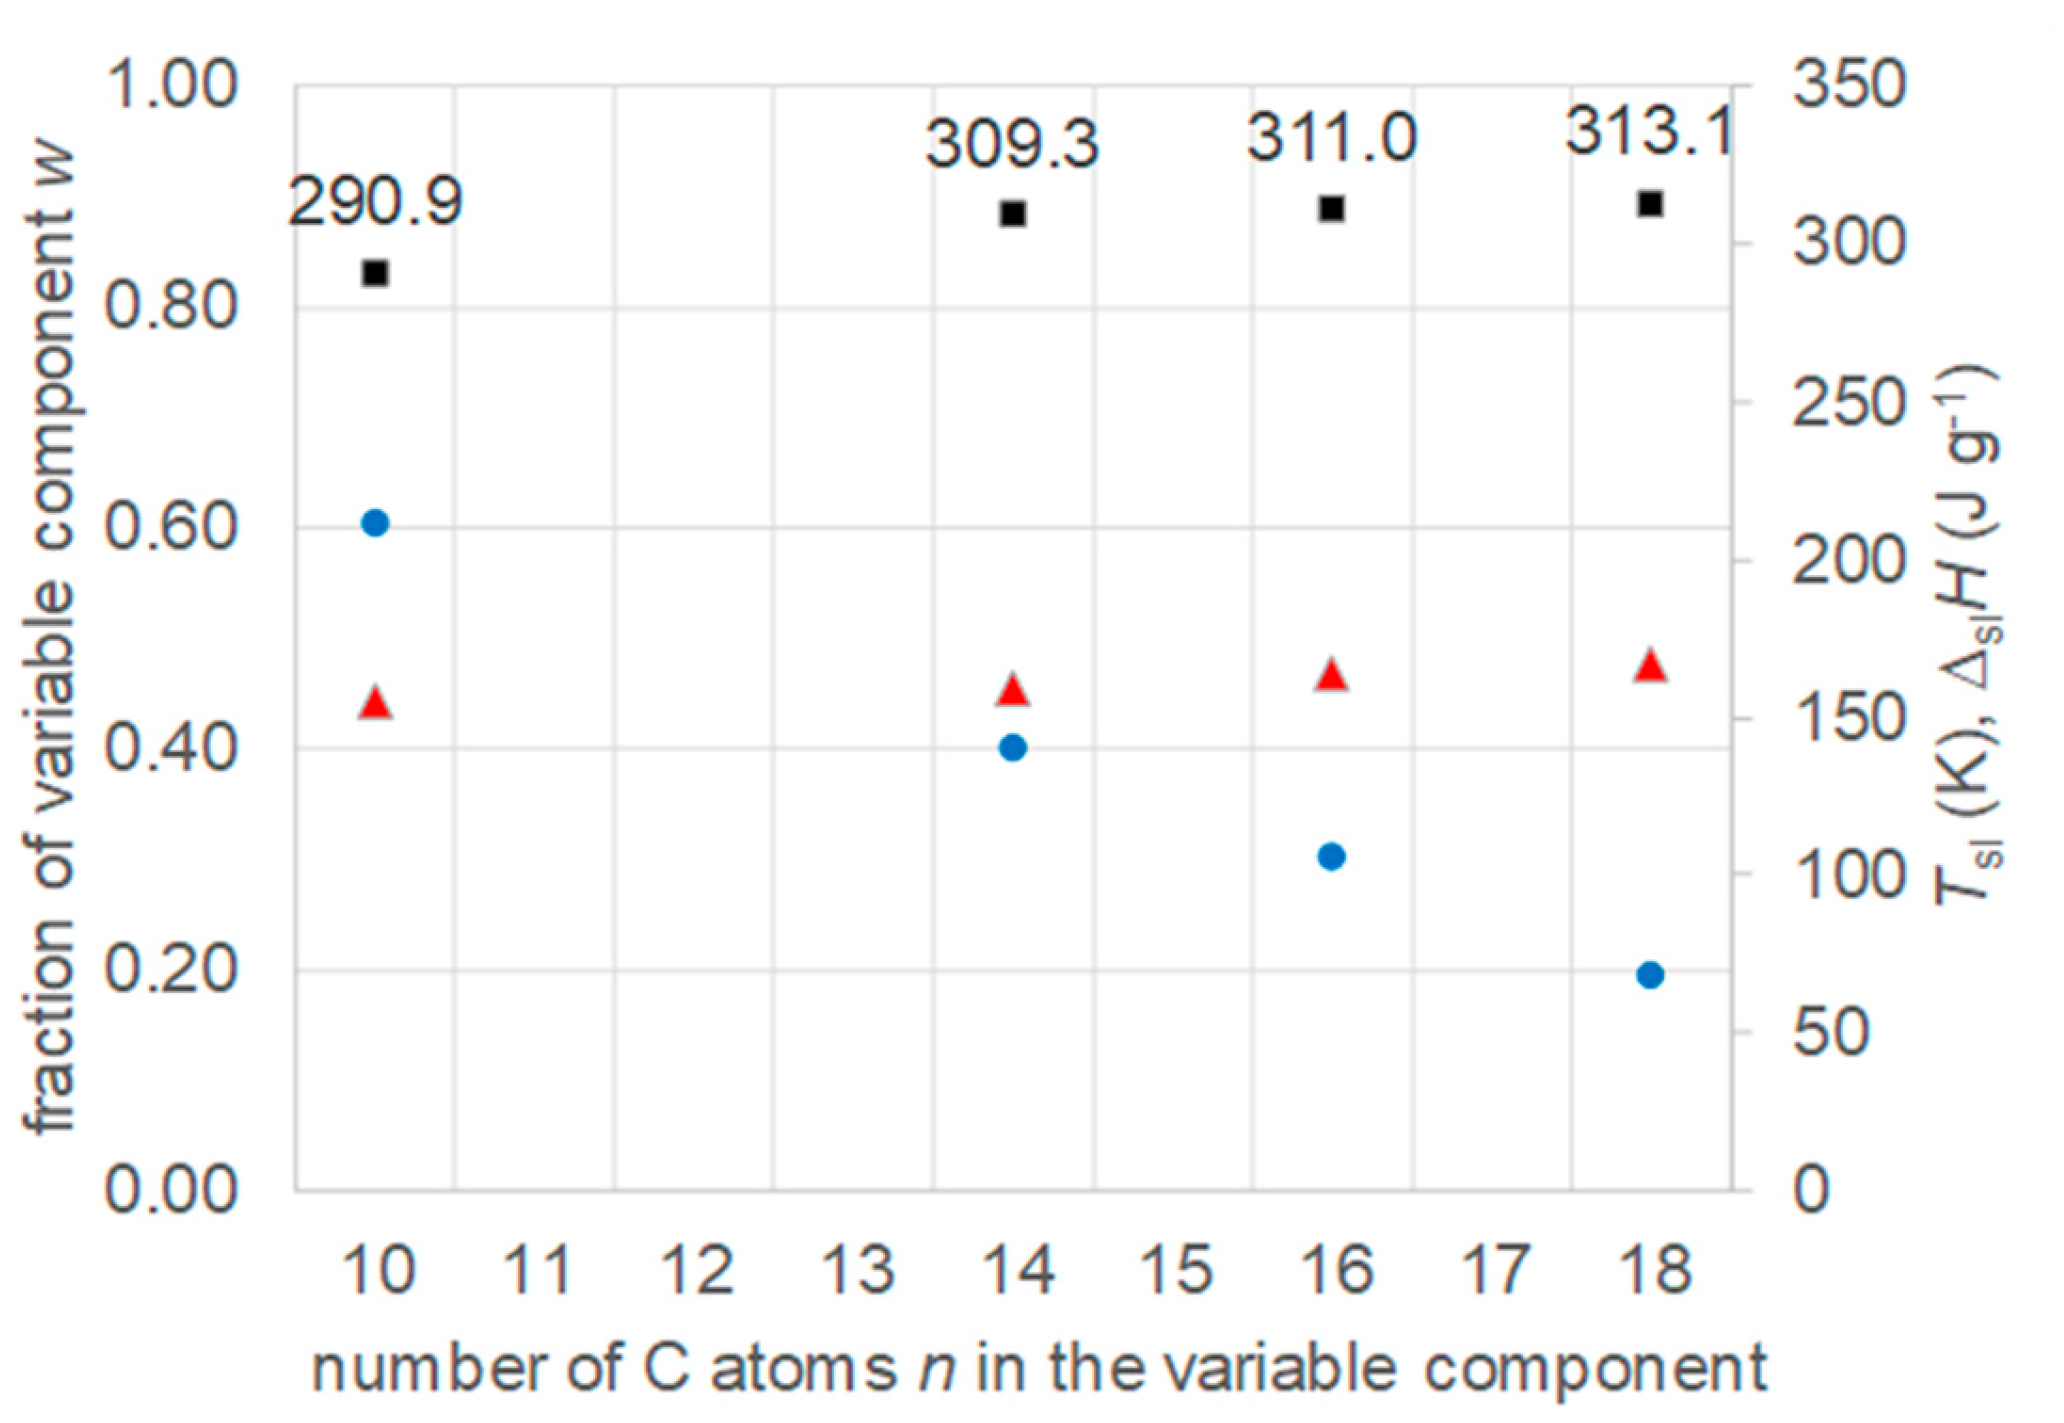
Figure 10.
Data of eutectic mixtures of n-alkanoic acid n=10 with n-alkanes (Table S6, SI): ● x, ■ Tsl, ▲ ΔslH.
Figure 10.
Data of eutectic mixtures of n-alkanoic acid n=10 with n-alkanes (Table S6, SI): ● x, ■ Tsl, ▲ ΔslH.
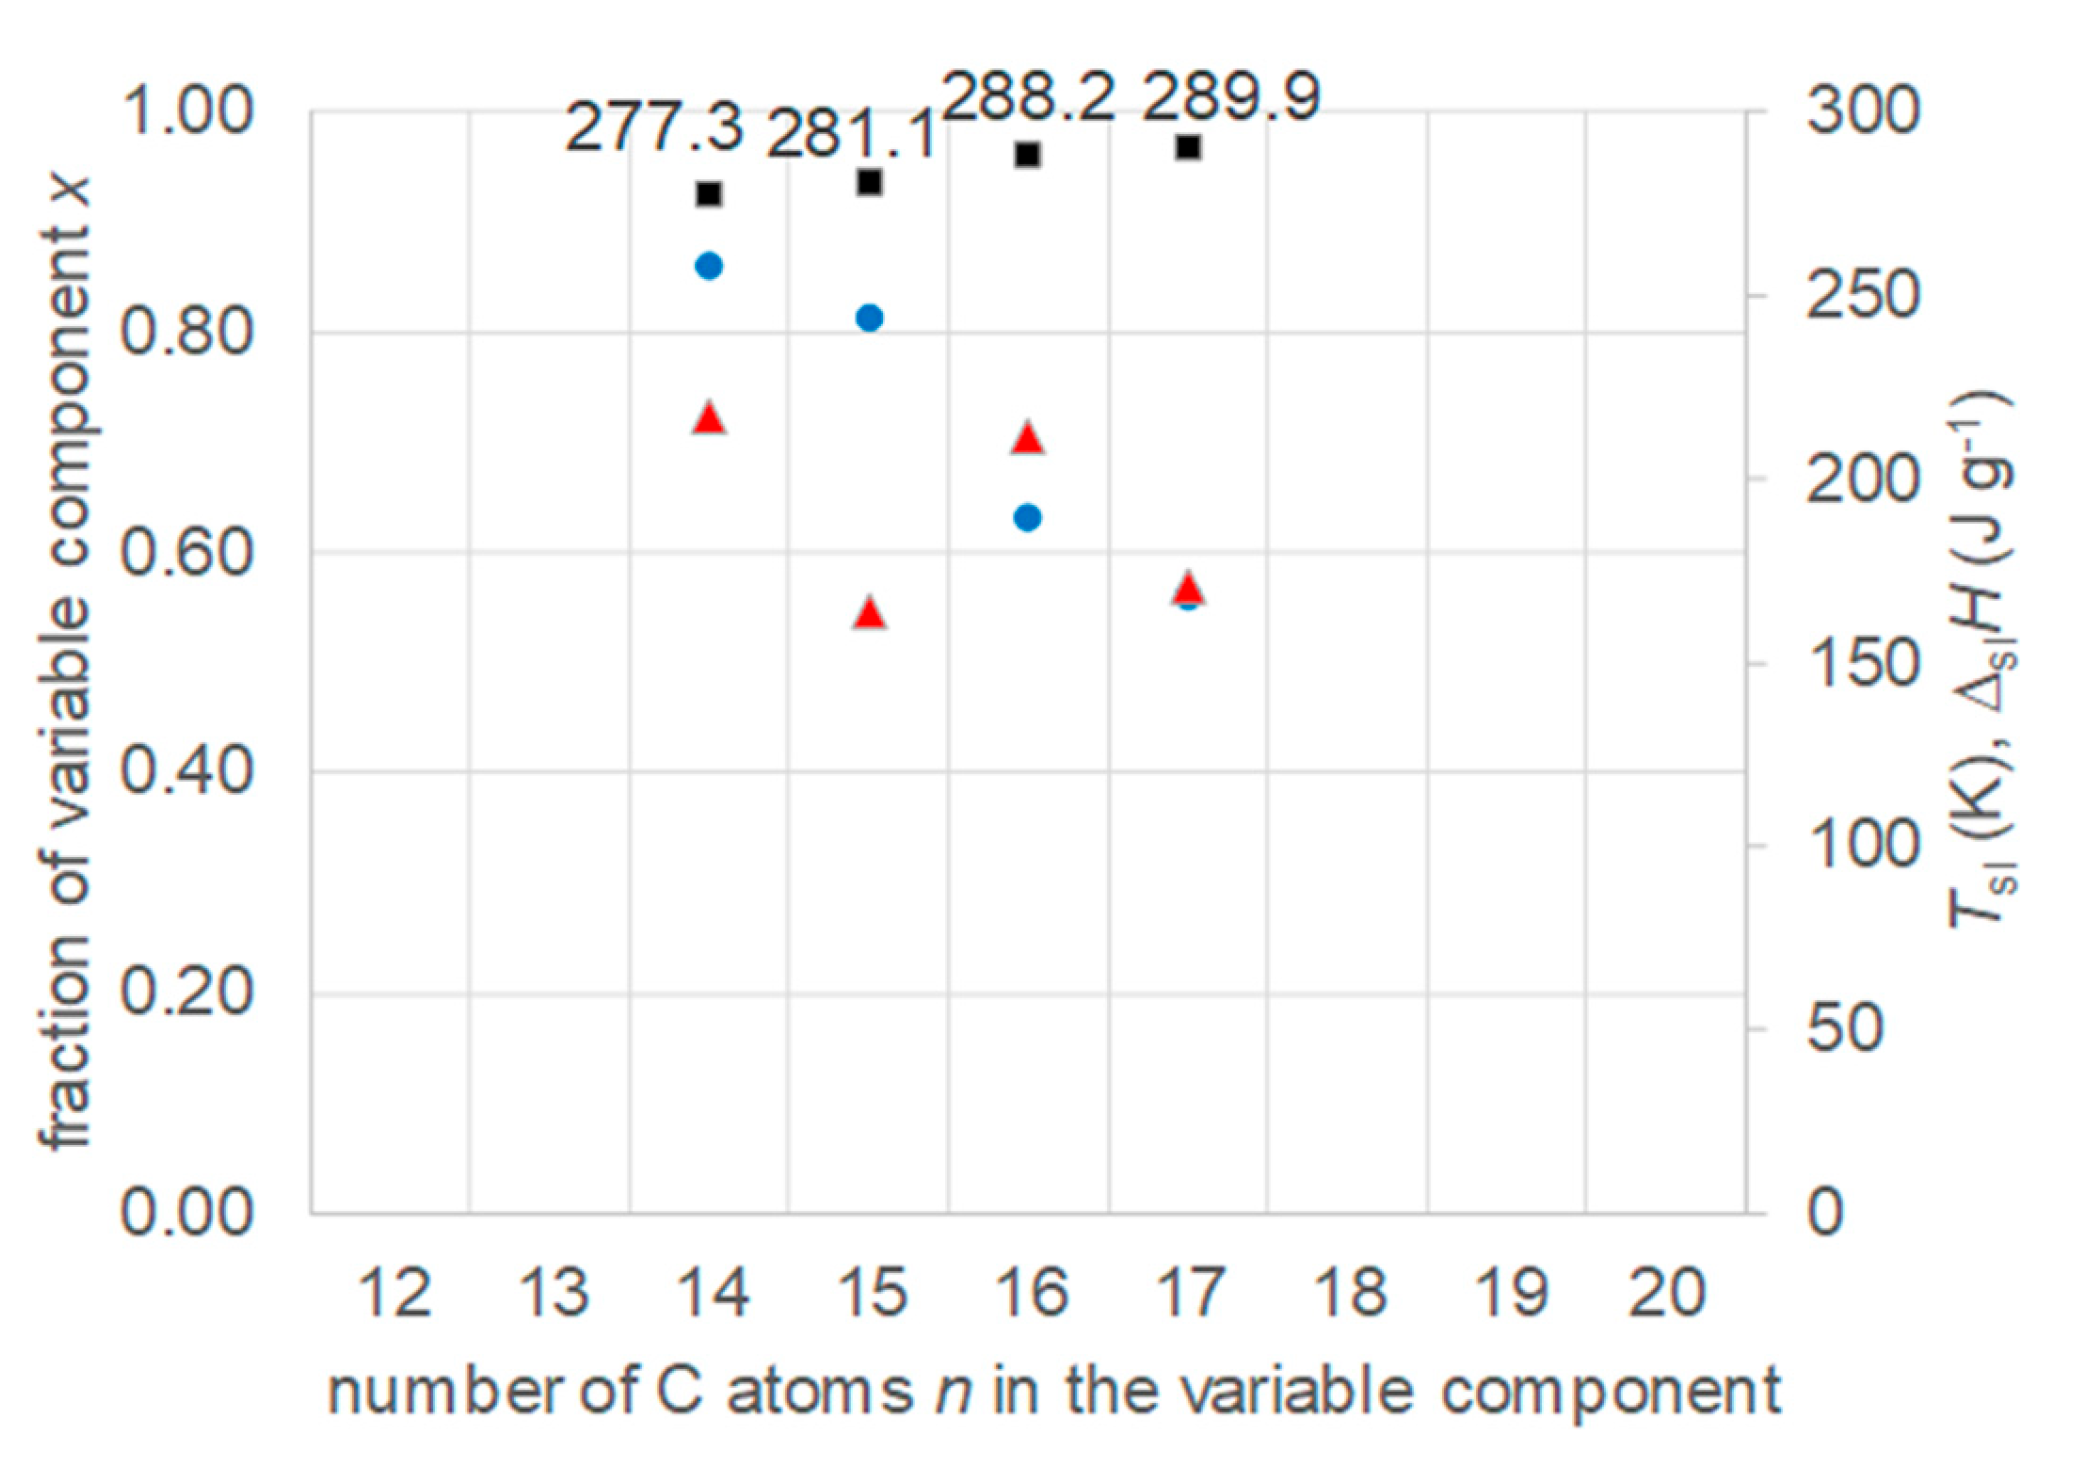
Figure 11.
Data of eutectic mixtures of n-alkane n=20 with n-alkanoic acids (Table S7, SI): ● w, ■ Tsl, ▲ ΔslH.
Figure 11.
Data of eutectic mixtures of n-alkane n=20 with n-alkanoic acids (Table S7, SI): ● w, ■ Tsl, ▲ ΔslH.
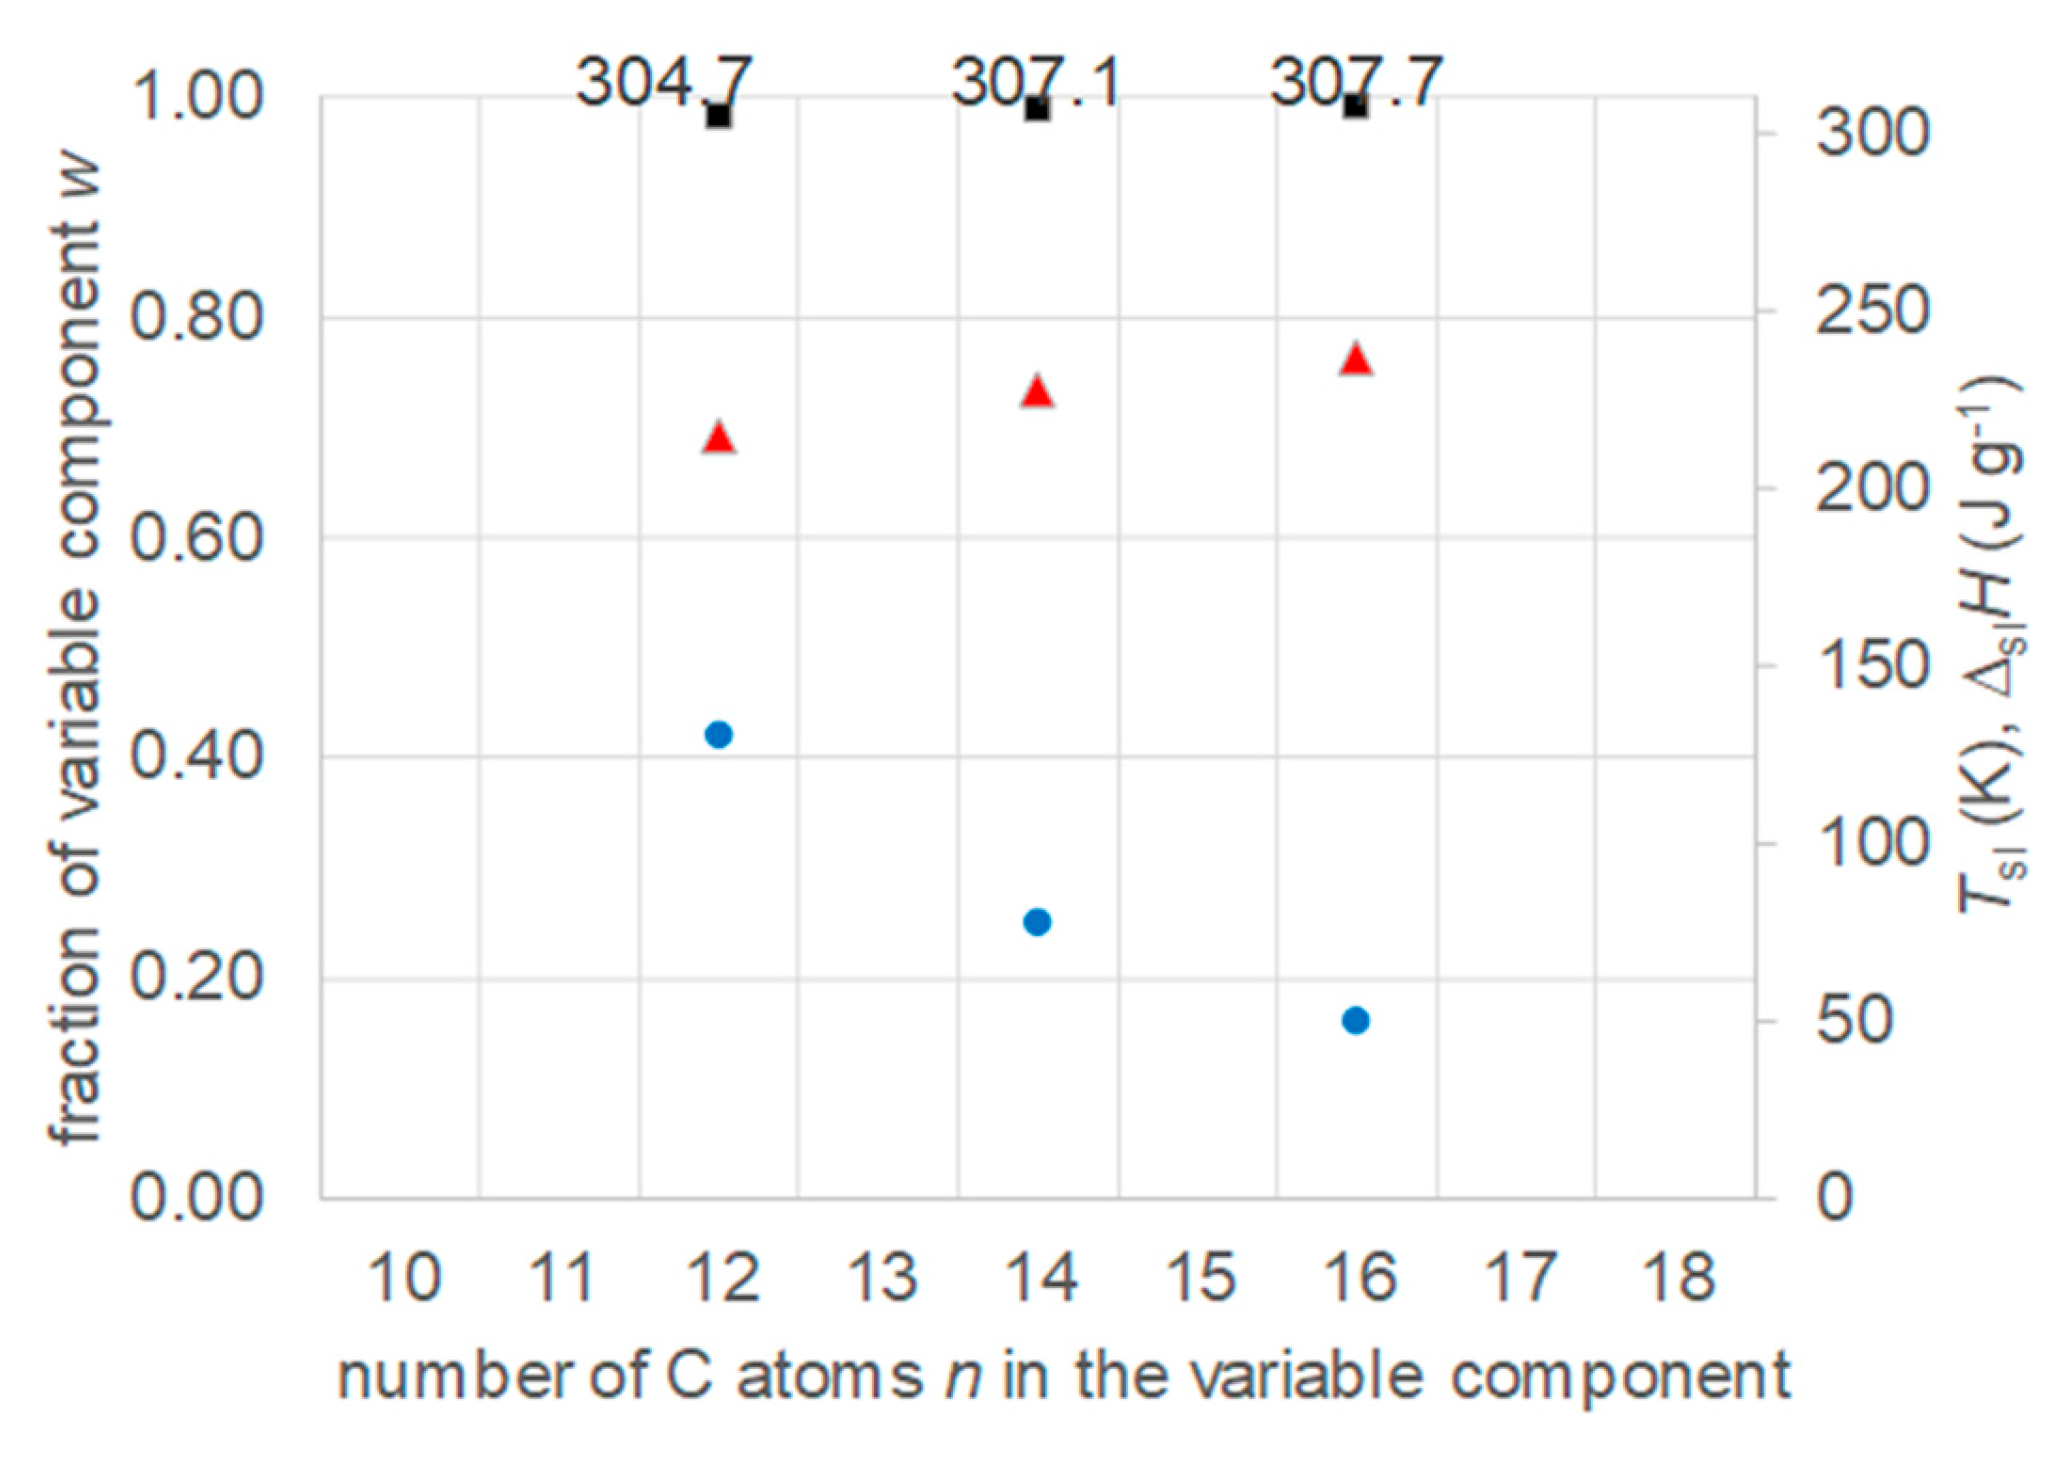
Figure 12.
Data of eutectic mixtures of n-alkanol n=10 with n-alkanes (Table S8, SI): ● x, ■ Tsl, ▲ ΔslH.
Figure 12.
Data of eutectic mixtures of n-alkanol n=10 with n-alkanes (Table S8, SI): ● x, ■ Tsl, ▲ ΔslH.
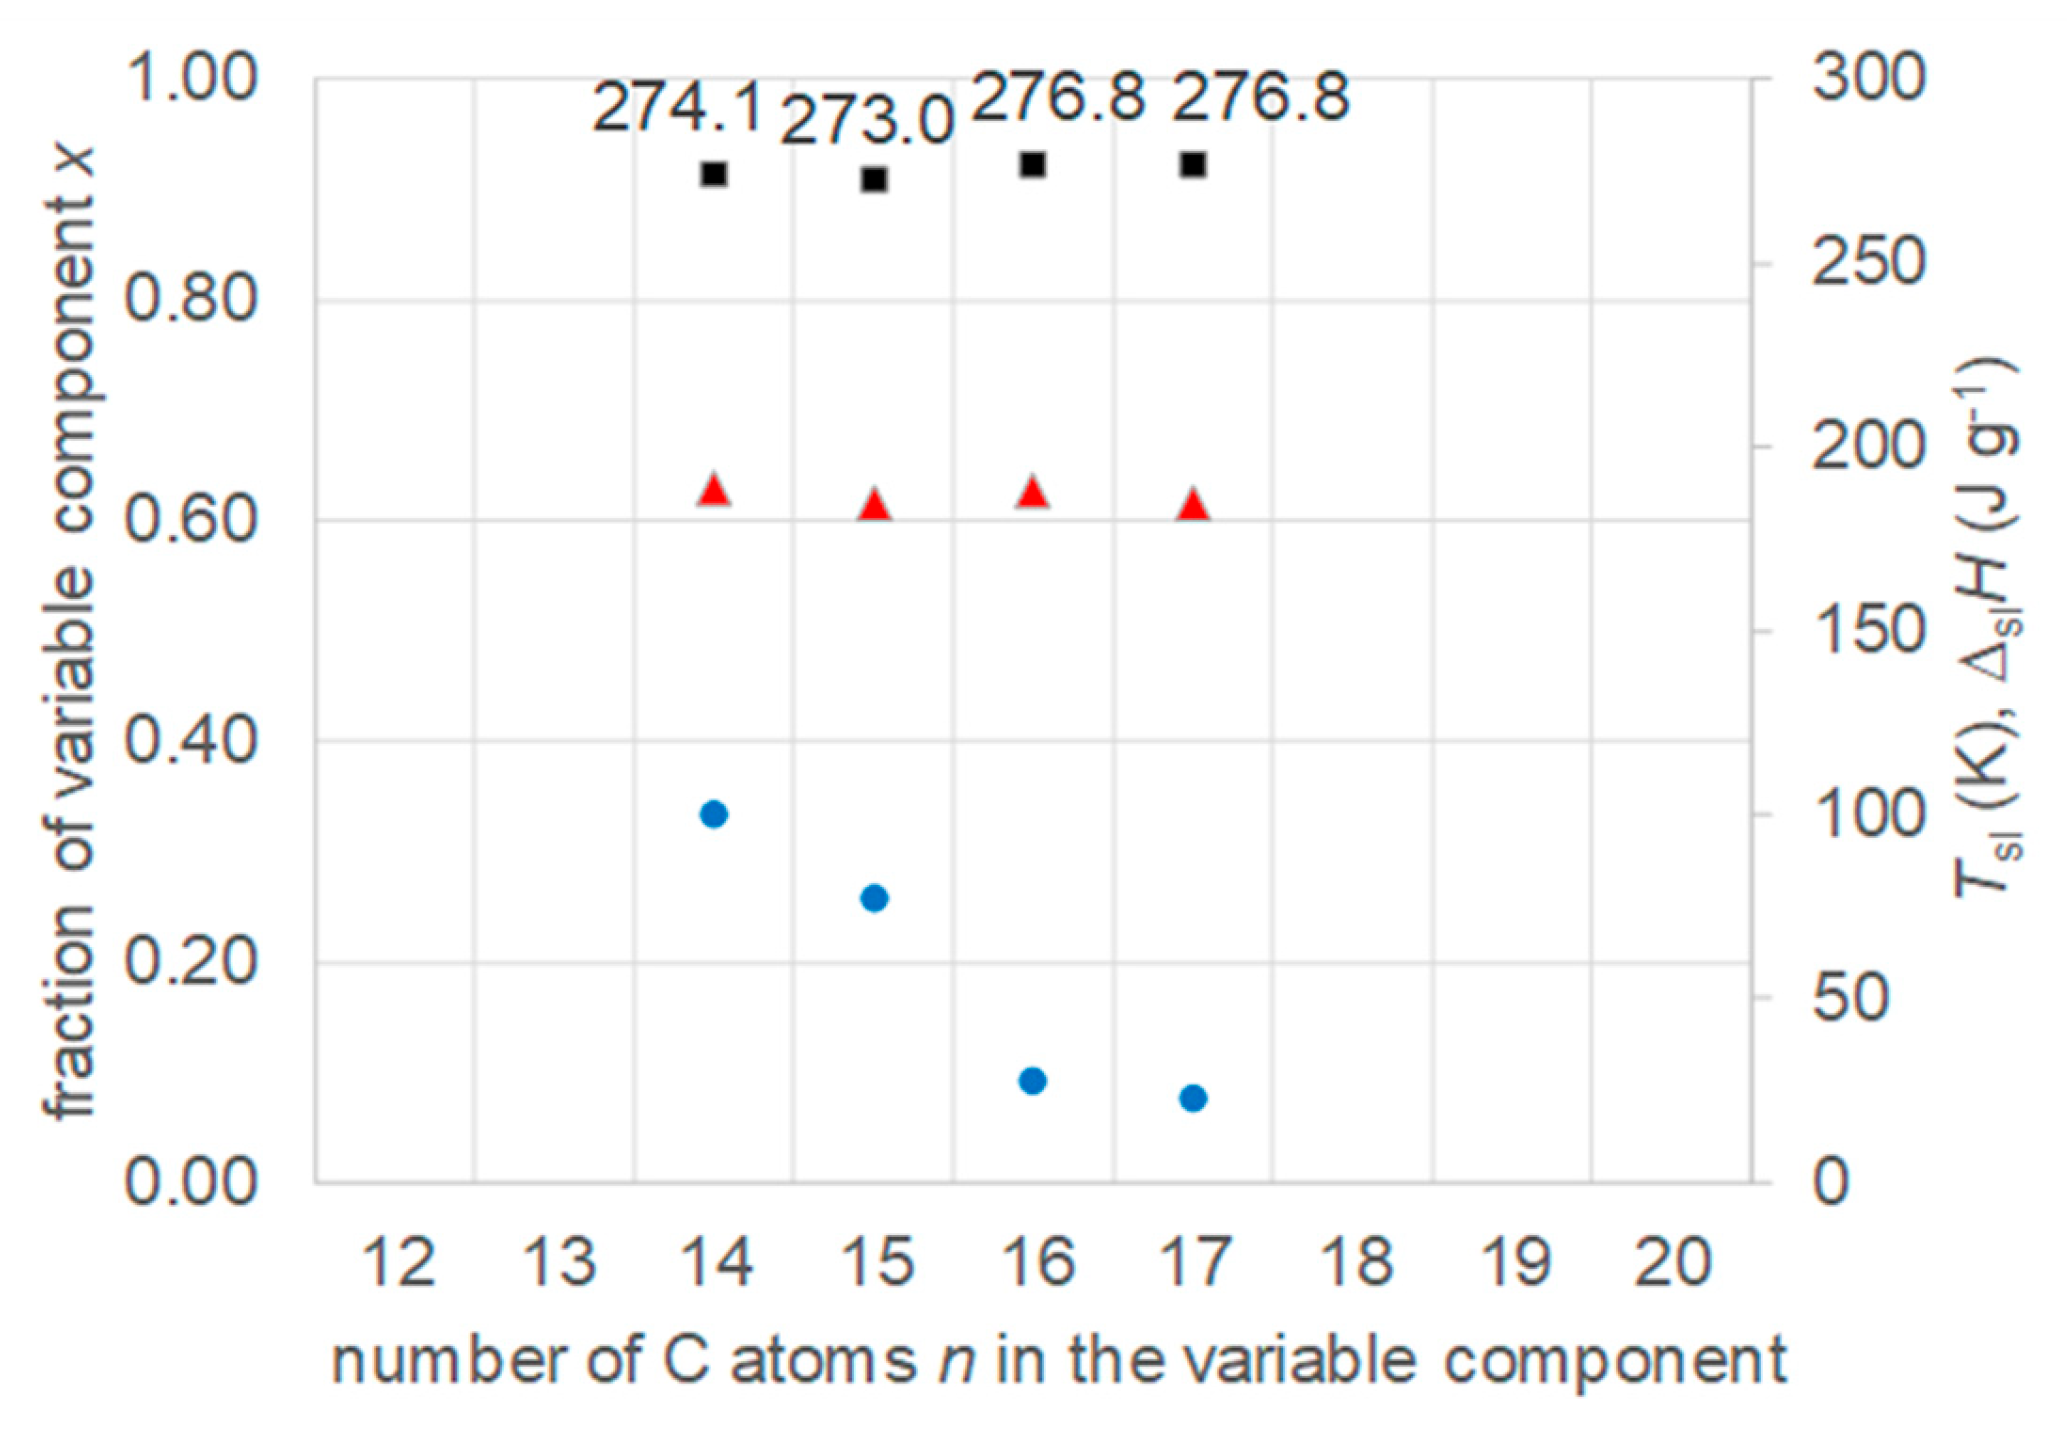
Figure 13.
Data of eutectic mixtures of n-alkanol n=12 with n-alkanoic acids (Table S9, SI): ● w, ■ Tsl, ▲ ΔslH.
Figure 13.
Data of eutectic mixtures of n-alkanol n=12 with n-alkanoic acids (Table S9, SI): ● w, ■ Tsl, ▲ ΔslH.
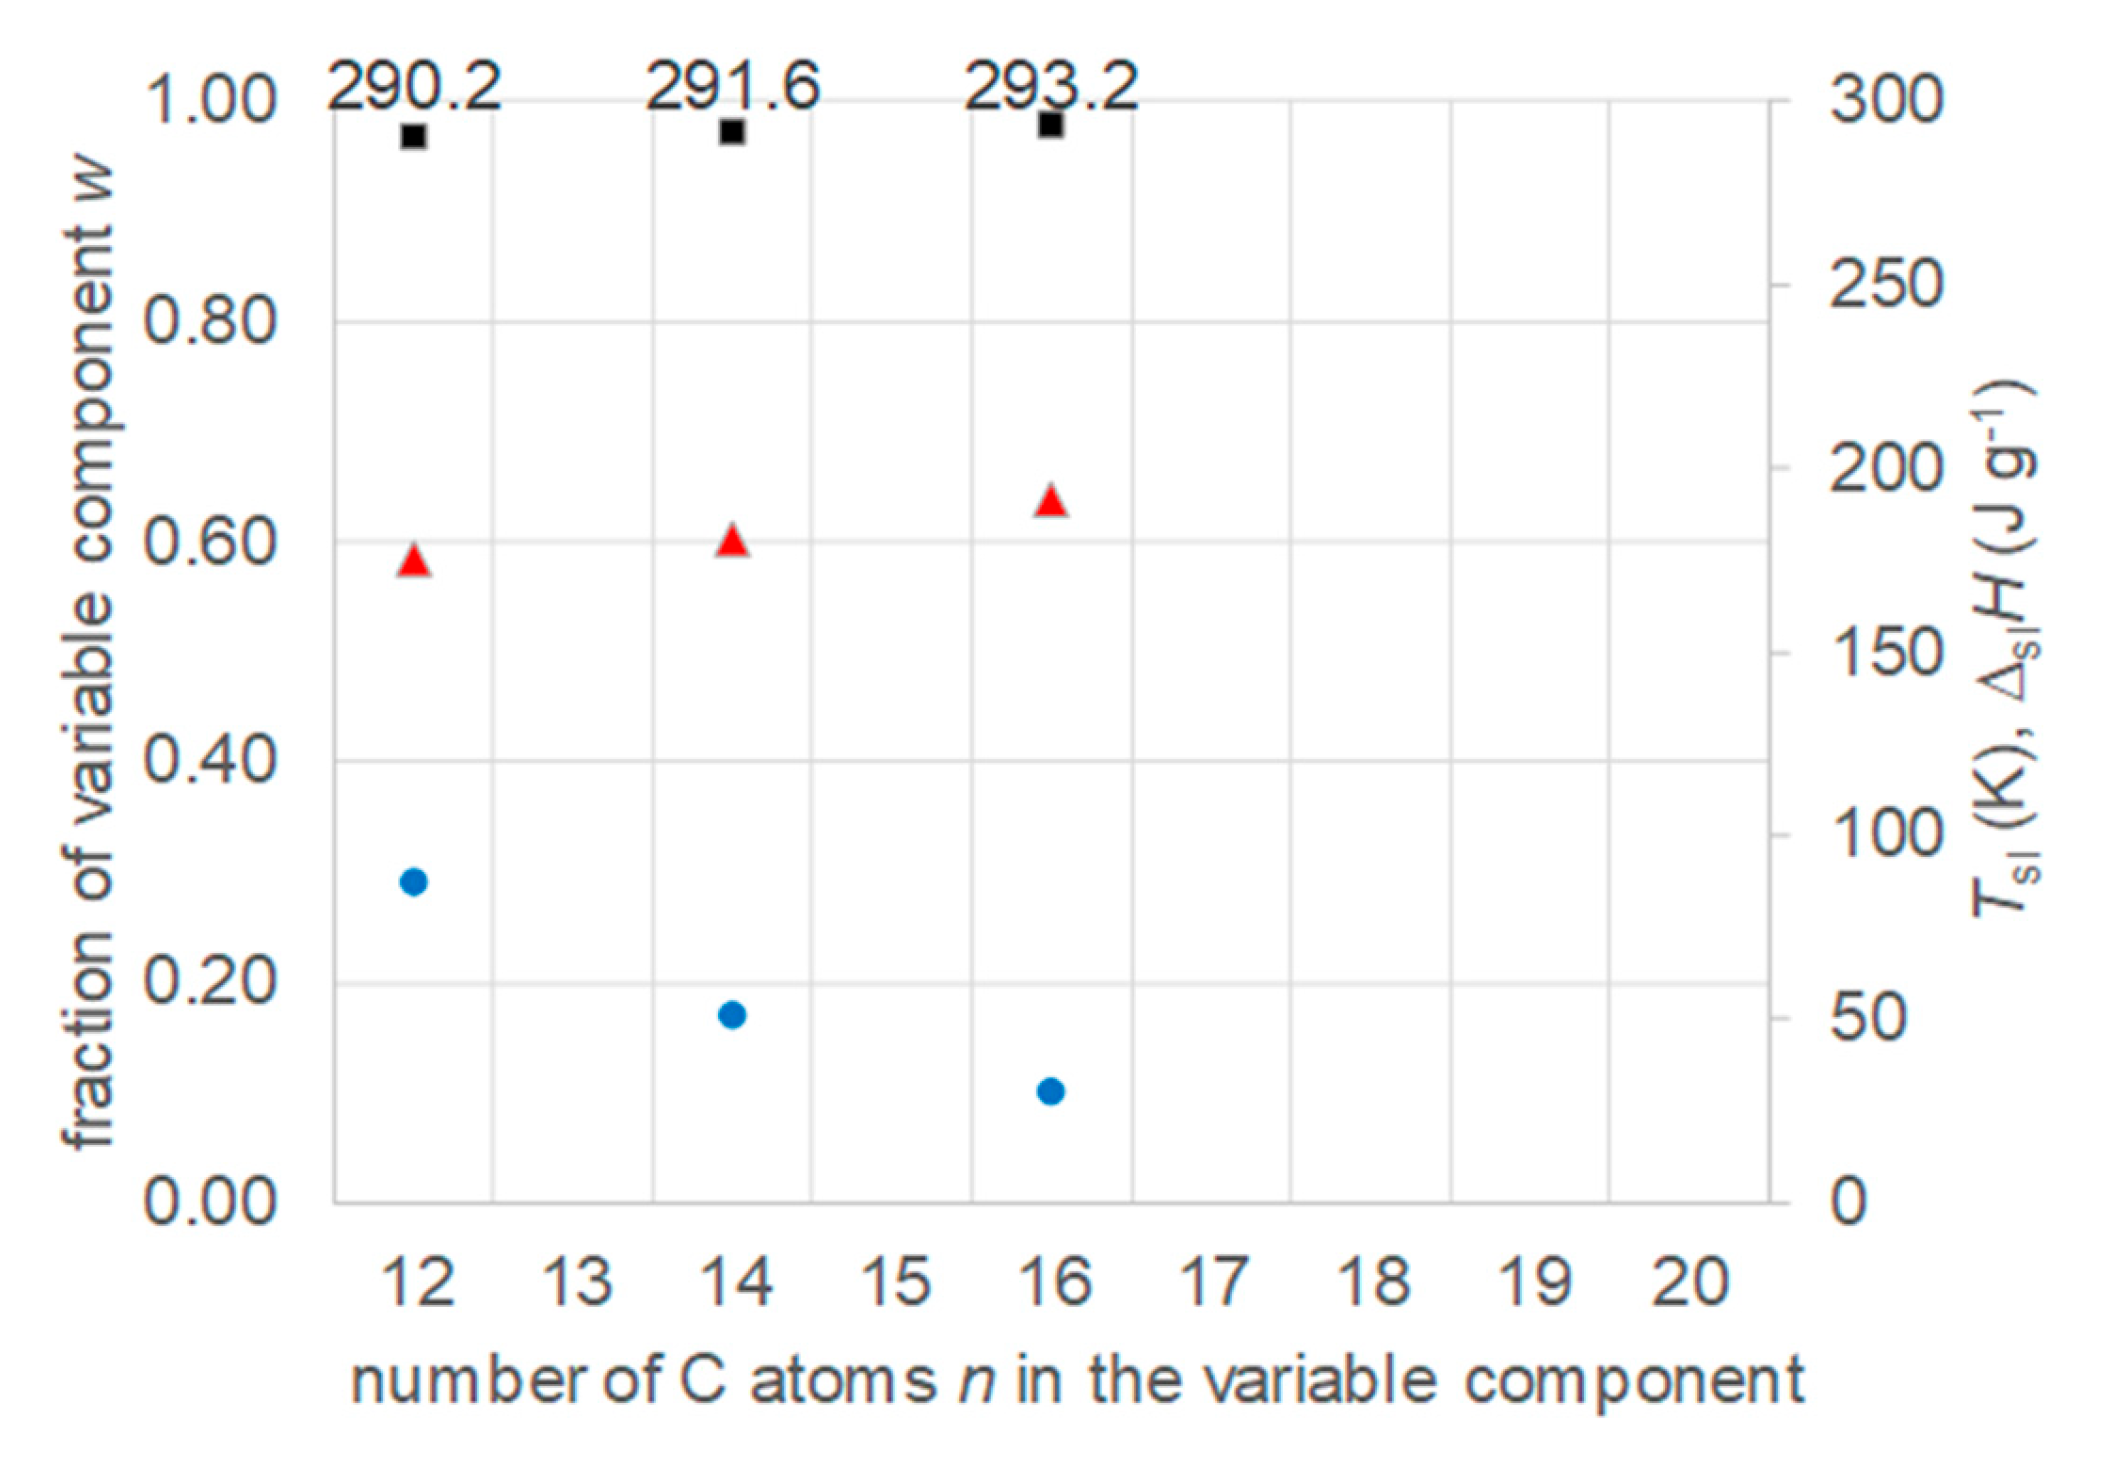
Figure 14.
Systematic trends observed in eutectic mixtures with a fixed component and a varied component, where the varied component is from a homologous series with n repeating units: (a) phase diagram, and (b) crucial properties versus n.
Figure 14.
Systematic trends observed in eutectic mixtures with a fixed component and a varied component, where the varied component is from a homologous series with n repeating units: (a) phase diagram, and (b) crucial properties versus n.
Disclaimer/Publisher’s Note: The statements, opinions and data contained in all publications are solely those of the individual author(s) and contributor(s) and not of MDPI and/or the editor(s). MDPI and/or the editor(s) disclaim responsibility for any injury to people or property resulting from any ideas, methods, instructions or products referred to in the content. |
© 2025 by the authors. Licensee MDPI, Basel, Switzerland. This article is an open access article distributed under the terms and conditions of the Creative Commons Attribution (CC BY) license (http://creativecommons.org/licenses/by/4.0/).
Copyright: This open access article is published under a Creative Commons CC BY 4.0 license, which permit the free download, distribution, and reuse, provided that the author and preprint are cited in any reuse.


