
Submitted:
07 November 2025
Posted:
10 November 2025
You are already at the latest version
Abstract
The increasing frequency and growing impact of cyber attacks have led organizations to adopt proactive defence approaches to cyber security risk mitigation, especially in the case of advanced persistent threats (APTs). The correct identification of the specific malicious actors behind a cyber attack is important for the success of the incident response and for the investigative work of the security operation centre (SOC) team. This research explores the capabilities and limitations of a machine learning (ML) approach to identifying malicious actors and the threats they pose (threat actor attribution) based on the tactics, techniques, and procedures (TTPs ) observed in specific cyber incidents, and on the incident context (the geographical location and industry affiliation of the victims targeted in the attack). A large language model (LLM) was used to extract TPPs from the MITRE database of cyber incidents The experiments included modelling threat actor attribution using five ML algorithms K-Nearest Neighbors (KNN), Decision Trees (DT), Random Forests (RF), Support Vector Machines (SVM), and Naïve Bayes (NB), applying different methods for feature selection and weighting. The results indicated that model accuracy and other performance metrics were significantly improved when the input dataset included both TTP and contextual features. The KNN and SVM models produced the best performance results; the highest classification accuracy achieved was 93.19%. The outcomes of this study may be applied by cyber security professionals to identify malicious actors, estimate the number and types of datapoints that are required to adequately attribute an actor to a cyber-attack, and improve the accuracy of the classification by weighting the input dataset features.
Keywords:
threat actor attribution
; advanced persistent threats
; tactics
; techniques and procedures
; APT
; TTP
; machine learning
; ML
; KNN
; SVM
; RF
; DT
; cyber security
; cyber attack
; cyber incident
1. Introduction
Due to the growing global cyberattack surface comprising organizations and individual entities, the risk and complexity of cyberattacks have increased significantly [1]. The most prevalent cyberattacks include Denial-of-Service (DoS) and malware attacks, phishing, zero-day exploitation, and the identification and exploitation of unpatched vulnerabilities. Investigations of current trends indicate that the frequency and potential impact of these attacks have been increasing over recent years [2,3] while the techniques used by malicious actors to launch in cyber attacks are constantly evolving to improve their success rates[4].
A current trend in proactive defense approaches is the use of threat intelligence as a means of collecting and sharing information relating to cyberattacks, including the specific attack indicators and techniques observed; such actionable intelligence is commonly shared through threat reports by security vendors[5]. This information may often utilize the tactics, techniques and procedures (TTPs) in the MITRE ATT&CK Framework [6,7] ; this provides a standardized format that allows security operation center (SOC) teams to detect and counteract threats targeting their environments. Accurate threat sector attributing has been found particularly important as a means of increasing the efficiency of the cybersecurity response [8].
Threat actor attribution is a cybersecurity defense method that identifies the origin of cyber attacks and classifies or associates attacks with specific malicious actors (threat actors) such as advanced persistent threat (APT) groups. This enables a deeper analysis of the tools and techniques used by threat actors to understand the different attack approaches and how these are tailored to the targeted victims’ location and industry affiliation [9].
1.1. Research Background
1.1.1. Attacks and Threat Intelligence
As a result of the evolving cyber threat landscape, significant cyber incidents with victim governments, multinational corporations, and small businesses continue to occur. Different categories of attackers are involved, including state-sponsored threat actors, financially motivated hacker groups, and hacktivists. Attacker motivation varies from espionage to financial gain, or even cause damage and harm tu human life [10].Security Operation Centre (SOC) teams monitor networks and devices within their organizations’ digital infrastructures and investigate alerts and suspicious activities that may be a part of a cyberattack. This is often performed with the use of Security Information Event Management (SIEM) systems as a centralized platform to perform SOC operations [11].
The MITRE ATT&CK Framework (developed in 2013) classifies the methods and approaches s used in cyberattacks by identifying attack TTPs – activities used at the different stages of an attack [12]. Currently, the database comprises a total of 203 techniques and 453 sub-techniques [13].
Another source of threat intelligence are the ndicators of compromise (IOCs) are also shared by commercial security vendors and industry- an government-based agencies. IOCs provide IP addresses, suspicious file hashes, and domain names which are often associated with specific threat actors [14]. However, IOCs are less effective than TTPs as an approach to improving the effectiveness of the organization’s security controls attacks. While attackers can change their IOCs by using a different IP address or a URL or editing a file to change its hash value, whereas TTPs are often more difficult to alter [15,16]. Gopalakrishna et al. [17] places TTPs at the top of the tactical layer of their ‘Extended Pyramid of Pain’, highlighting their cybersecurity defense potential.
1.1.2. Threat Actors
Identifying and understanding the tactics and techniques used by threat actors in cyberattacks has demonstrated value in improving the design of cybersecurity defense systems [18]. Understanding threat actors’ techniques can enhance their organization’s ability to detect threats and enable a pro-active approach to providing protection against emerging threats [19]. However, the threat actor attribution process of identifying the perpetrator behind a cyberattack is a complex task that may be hard to accomplish. It involves the analysis of pertinent technical data such as IOC and TTP digital footprints, as well as a variety of supporting information, for example, targeted victim prefile including the relevant industry sector and their geographical location [20].
But even if only probable an not completely reliable, threat actor attribution results give equip organizations valuable knowledge about their most relevant adversaries and threats [21]. By attributing a cyberattack to a threat actor, the organizations gain the ability to deter threats by counteracting the relevant TTPs and reduce cyberattack success rates. Additionally, threat actor attribution allows SOC teams to prioritize their response to incidents [22]. .
1.2. Related Research Work
1.2.1. Cybersecurity Data Generation Approaches
The MITRE ATT&CK Framework provides security analysts with the capability to decipher attacks in relation to a comprehensive and standardized catalogue of TTPs. Bhole et al. [23] explored the datasets related to threat actor activities through threat intelligence and real-world incidents that were used to analyze cyber threat groups. The public databases ThaiCERT, Malpedia, ICS-CERT, and the European Repository of Cyber Incidents (EuRepoC) which are compatible with the MITRE ATT&CK’s TTP format and have been used in a number of empirical investigations. However, prior research has also demonstrated that the use of heterogeneous cyber intelligence data sources and hybrid feature sets enhances threat actor attribution. For example, Chen et al. [24] successfully extracted TTPs from threat intelligence reports and used them for APT group clustering based on their attributes and techniques.
Machine Learning Models
To mitigate the challenges posed by manual TTP extraction, Domschot et al. [25] compared various machine learning (ML) techniques to associated specific words with different TTPs and extract relevant TTPs directly from intelligence reports; they achieved an accuracy of 69.8% In a related study, Permana et al. [26] attempted to extract TTP form unstructured data (cyber threat news reports) by parsing and searching for selected matching words. They formatted the in formation gathered using structured threat information expression (STIX). The STIX format is machine -readable and is supported by a number of industry and community platforms [27]. Huang et al. [28] also aimed to address the deficiencies of manual TPP extraction. They developed a deep learnings (DL) model for the efficient extraction and classification of MITRE techniques from unstructured cyber threat intelligence ( CTI ) reports.
DL-based generative artificial intelligence (GenAI) models can extract attack patterns and indicators of attack from threat intelligence data to help cybersecurity teams [29]. For example, Saddi et al. [30] proposed a conceptual GenAI model for automated threat intelligence gathering, updating and analysis. GenAI applications such as a large language model (LLM) can be an effective tool for identifying and extracting TTPs from threat intelligence reports, as shown by Fieblinger et al. [5]. For example, MITRE have enhanced the the accuracy their open-source threat report ATT&CK mapper (TRAM) by deploying an LLM [31]. The use of the commercially available ChatGPT (an LLM) as a tool to analyze security-related information from a variety of sources and identify behaviors and attack patterns has been suggested in more recent research [32,33].
Prompt Engineering for LLMs
The performance of LLM models is sensitive to the quality of the ‘prompting’( structured input provided by the user). By applying prompt engineering (PE) best practices, the use can the model performance, increase the accuracy of the response, and overall, gain a greater control over the process [34]. For example, the LLM can be instructed to double-check its output and to re-attempt the task if there are any inconsistencies [24]. Such PE techniques aim to increase the adequacy an the credibility of the LLM’s responses.
Schmidt et al. [35] recently found that prompt model performance improves when several prompt components are included; this ensures that the LLM have sufficient information to respond with optimized and accurate results. Providing comprehensive prompts means to build a strong instructional foundation for the LLM to follow. In the flipped interaction pattern, the user the user instructs the LLM to asks questions (which the user replies to) and continue till it has enough information to perform the required; in the reflection pattern, the user asks the LLM to provide supporting rationale on how and why it responded with the answer to the prompt. Furthermore, it is suggested by Tripaldelli et al. [36] that specifying he role the LLM (e.g., by stating in the prompt that the LLM is an expert on the subject), or by inclusion of step-by-step instructions on how the LLM should perform its task and the specific output required also results in improved responses to prompts
1.2.2. Theat Actor Attribution Approaches
Threat actor attribution process is a time-consuming and challenging task if conducted manually [37]. Noor et al. [38] suggest that ML modeling for their analysis and attribution to criminal identities based on dataset of TPP features extracted from threat intelligence can produce useful and reliable results to support cyberattack investigation However, research om actor and threat attribution is relatively scarce Abou et al.[39] and Desa et al. [40] have examined work threat actor typologies and classifications, motivation and behavior and have noted that there is still a need to develop reliable methods that can enhance threat actor profiling and cybersecurity management and best practicers.
Data extracted from cyberthreat technical descriptions such as the TPPs and the low- and high-level IOCs in David Bianco’s ‘Pyramid of Pain’ framework [41] have been extensively used in current empirical research [24,42,43,44,45,46,47]. This allow to utilize the collective cybersecurity intelligence knowledge and also, to align threat actor profiling with cybersecurity practicians’ expectations[48]. Several studies have reported high accuracy levels.
For example, Duan et al. [42] gathered indicators ranging from low-level IOCs, such as IP addresses and domain names, to higher-level indicators, including malware and TTPs. For attribution, their study used the information about the country and the industry sector targeted by the attack. The authors identified the belongs-to relationship between their dataset of threat actors and a corresponding incident dataset, in which they utilized a heterogeneous graph technique for mapping nodes to threat actors. The dataset comprised 1027 threat actor nodes; an 80/20 split was used to train, and validate and test the model. The authors compared the performance of eight different learning models against their dataset; the highest precision model achieve 54.42% accuracy in positioning the threat actor within the top five most probable threat actors behind an incident.
Kida et al. [43] explored threat actor attribution with regards to malware that was used in attacks and applied a range of classification algorithms to match an attack to a threat actor: random forests (RF), support vector machines ( SVM,), naïve Bayes (NB), and K-Means Clustering. The authors used d a sample of 3594 malware file hashes mapped to 12 actor threat groups (with an 80/20 split for training and testing). The best performing model achieved 89% accuracy in associate malware hashes with threat actors, the authors were able to perform threat actor attribution with an accuracy performance of 89%.
Xiao et al. [44] used IOCs, malware, and TTPs to derive the datapoints needed for threat actor attribution modeling . The authors developed a baseline for matching threat actors to threat intelligence reports through the use of multilevel heterogeneous graphs. The authors utilized data from 1300 threat intelligence reports associated with 21 threat actors. They extracted features from IOCs, TTPs, and malware and optimized the model to achieve threat actor attribution accuracy of 83.2% (associating a threat actor with a threat intelligence report).
Irshad et al. [45] used IOCs, TTPs, malware, and data about targeted countries, industry sectors and targeted applications for feature extraction and training ML models (RM and SVM). Both algorithms achieved 84% accuracy in identifying the correct threat actor behind an attack. Similarly, a study conducted by Chen et al. [24]on threat actor clustering highlighted the success of attribute analysis of attack indicators such as TTPs and IOCs using decision trees (DT).
To improve their results, Chen et al. [24] used natural language processing (NLP) to extract beavertail characteristic’s form unstructured cyberattack and threat reports. Irshad et al. [46] also explored a hybrid feature set comprising both technical features and behavioral features representing the attack context. The best performing Ml model (long short-term memory- LSTM) achieved prediction accuracy of 97% .
Saha et al. [47] have developed a two-level ML model for automatic APT attribution that first identifies malicious samples in the context of a threat campaign, and then identifies samples that operated by the same threat actor. The model uses input from a range ty of heterogeneous file (both executables and documents) and searches for connections between features. It was s trained on a MITRE reference dataset and a dataset of APT samples belonging to a number of APT threat groups. Somewhat similar, Xiang et a. [37] approach threat attribution by margin a large real-world network behaviors dataset with threat intelligence data and applying a K-means clustering algorithm. . The proposed system (IPAttributor) assesses similarities and links between IP data and applies dynamic weighted threat segmentation to identify attacker entities. The highest reported output accuracy was 88.89%
In addition to the methodologies and algorithms used in the studied above, other pattern or characteristic matching techniques considered in current research include the of neural networks and DL algorithms. The effectiveness of the chosen technique varies depending on the number of attributes of each entry, the structure of the data, and the size of the datasets [49]. For example, Böge et al. [50] developed a e DL bidirectional encoder representations from transformers (BERT) models for entity recognition based on commands that are executed within an attack. The research results supported the applicability of BERT models for threat actor attribution. Zhang et al. [51] use an LLM to construct a schematic representation of an attack’s s technique and model the attack implementation details with a higher layer of granularity compared to features extracted from technical cyberthreat descriptors. The proposed automatic system for threat attribution (APTChaser) exhibited a high mean reciprocal ranking.
1.3. Research Aim, Questions and Contribution
As shown by the review of the extant research, a current problem with threat actor attribution approaches is that the uncertainty about correctly identifying the threat actor group behind a cyberattack is still relatively high. This is due in part to the lack of f reliable technical input to assist the threat actor identification; additionally, the process is complex and time-consuming [52,53].
1.3.1. Research Aim and Question
Building on prior research in threat actor attribution approaches, tools and techniques and considering the importance of TTPs as threat actor indicators, this study explores machine learning (ML)-based methods for effective threat actor attribution. In addition to using TTP data for the extraction of data input features, the study extended the feature space by incorporating input features from other cyber incident characteristics, such as the geographical location and the industry sector of the victim targeted by the cyber attack.
The main purpose of the study was to identify feasible options for creating an effective ML model for threat actor attribution. The main research question of the study was formulated as: ‘What ML models and feature selection methods can be used for effective threat actor attribution?’
1.3.3. Research Contributions
Currently, a total of 203 techniques and 453 sub-techniques are classified in the MITRE ATT&CK Framework [13], with threat actor groups utilizing specific subsets of these techniques and sub-techniques. This study proposes and tests a novel framework for threat actor attribution based caber attack TPPs s and the contextual characteristics of cyber attack target. The results suggest that the feature set used in this study can be used for successful threat actor attribution, , excluding the need to collect data about the indicators at the lower levels of the Pyramid of Pain such as IOCs, domain information,, IP addresses, and hashes .
The rest of the paper is organized as follows. The literature review section explores cyber attacks, threat intelligence, and the current threat actor attribution landscape. The Materials and Methods describes the data sources used in this study including the use of ChatGPT to create a dataset of 783 cyber incident reports , and describes experiment set up. The results and discussion sections present and analyze the s findings of the experiments. . .
2. Materials and Methods
2.1. Cyber Incident Data Source
To build the ML models, it was necessary to create first a suitable dataset of cyber incidents including the threat actors conducting cyberattacks, the MITRE ATT&CK TTPs as observed during the attack, and the victim’s geographical location and industry sctor. Section 1.2 identifies several databases that could be utilized for this research;, based on desired fields available in the database, the amount of records included, the accuracy of its data, and the frequency of updates to its data, the EuRepoC database [54]was selected to build the cyber incident dataset used in this research
The EuRepC was set up by the EuRepoC consortium ( established in 2022)l the aim was to support cybersecurity-related discussions and policy-making by providing a reliable cyber incident database and analytical frameworks. Trustworthy contributors such as European Union (EU) government agencies, including the German Federal Foreign Office and the Danish Foreign Ministry, helped build the database which is available for public use and research [55]. This research used the 4 March 2205 downloadable version of this database (eurepoc_global_dataset_1_3.xlsx) [54].
This data consists of 3414 rows with 85 data points each. Each row contains data related to a specific cyber incident, including the description of the cyberattack, the date of when the attack started and the date the attack ended, the date the attack was added to the database , a description of the attacker (e.g., the name the country of the threat actor and the threat group), a description of the victim (e.g., industry sector and country name, and the cyber incident report or article source URLs. The database record includes as well information about the response to the attack and its impact, the source of the attribution, and the number of threat actpr group attributions for each cyberincident.
The following fields were used to create this study’s dataset of cyber incidents:
- 1.
- incident_id
The incident_id field indicates the specific cyberattack event that occurred.
- 2.
- receiver_country
The receiver_country field specifies the victim’s geographic location.
- 3.
- receiver_category_subcode
The receiver_category_subcode field specifies the victim’s industry sector.
- 4.
- initiator_name
The initiator_name field indicates the threat actor group name. This attribute is an essential datapoint that is used to test and validate the threat actor attribution model proposed in this study. This study focuses on the ‘advanced persistent threat’ (APT) actor groups (group name prefix APT) The groups were selected as APT attacks are among the most dangerous ones in cyberspace. Often, they are hard to detect as the highly skilled malicious actors apply a range of tactics and use different tactics to carry out covert and sophisticated attack campaigns [56] .
- 5.
- number_attributions
The number_attributions field shows how many threat actor groups were attributed to the cyber incident. As the attributions were based on information sourced from sdiffrent channels ( e.g., self-attributions, technical reports conducted by IT companies, political, direct, or anonymous statements in the media, legal action proceedings), some incidents were attributed to multiple threat actors. In this study, we limited the scope to cyberincidents that had been attributed to one threat actor group only (number_attrivutions=1) to avoid ambiguity.
- 6.
- sources_url
The “sources_url” field includes one or more cyber incident links to articles or report links which contain additional information about the specific cyberattack. This field was selected as the study used the articles and the to extract the TTPs associate with the specific cyber incidents.
2.2. LLM-based TTP Extraction Prompt Engineering
This study used an AI-supported TTP data extraction method. In their study of the effectiveness of AI in sentence parsing Sewunetie et al. [57] found that ChatGPT version 3.5 was ca[able of n understanding, parsing, and extracting requested information from input prompts. In this research we used ChatGPT version 4.0 to extract specific TTPs from a reference cyber incident dataset ’s dataset which contained cyber incident report URLs in the field sources_url.
The ChatGPT prompt was engineered specifically to achieve high response accuracy for accuracy of the responses. As shown below, the prompt was very specific and detailed. It instruct ChatGPT to extract TTPs from the sources associated with the specific cybercide, using the TTP definitions in the MITRE ATT&CK Framework.

Table 1.
Example of a ChatGPT prompt engineered to rxtract MITRE ATT&CK Framework TTP information from the report: https://securityaffairs.com/132452/hacking/apt28-hacked-nato-think-tank.html.
Table 1.
Example of a ChatGPT prompt engineered to rxtract MITRE ATT&CK Framework TTP information from the report: https://securityaffairs.com/132452/hacking/apt28-hacked-nato-think-tank.html.
| Prompt component | Description |
| Steps to follows |
Step 1. Visit the report link and read the information presented. Step 2. Identify specific MITRE ATT&CK Framework techniques and sub-techniques found in the body of the report that are explicitly stated or very strongly inferred by the text. Vague inference is not acceptable. Step 3. Extracted techniques and sub-techniques must be completely based on the information found in the report and not based on any external knowledge of the threat actor or the attack. Step 4. Each extracted technique and sub-technique should be supported with evidence in the format of a direct quote from the report for user validation. If the article is not in English, then translate the direct quote to English and do not output the quote in the original language. Only include the direct quote in the Supporting Evidence field in the output format template. Step 5. All techniques and sub-techniques must be based on the information found on https://attack.mitre.org/techniques/enterprise/ and should be able to be justified based on the direct quote and relating to the technique or sub-technique description found on https://attack.mitre.org/techniques/enterprise/. Step 6. Avoid unnecessary enumeration of sub-techniques if they are inferred and not explicitly mentioned. Step 7. Follow steps 1-6 again and verify that the results are the same. If they are not, then repeat 1-6 again until the results are consistent. |
| Output Format | The output must be in the following JSON format: { "incident-techniques": [ "TXXXX", // Technique or Sub-technique Name – Supporting Evidence "TYYYY" // Another Technique or Sub-technique Name – Supporting Evidence ], 'targeted-countries': [ 'Country1', 'Country2' ], 'targeted-industries': [ 'Industry1', 'Industry2' ], 'URL': 'Report URL' } |
| Additional clauses |
Do not include any MITRE ATT&CK Framework techniques or sub-techniques unless they are directly supported by a quote from the report. Do not infer techniques based on the known behavior of a threat actor or group, unless these techniques or sub-techniques are strongly inferred within the report. Each technique or sub-technique must be directly justified by a quote from the report, which must be included word-for-word in the JSON output. If a technique cannot be explicitly tied to a quote, it must be excluded. Do not list techniques based on general attack stages or assumptions; only include those with specific textual evidence. If any technique is included without a matching direct quote from the article, the output is invalid. If the report explicitly lists any MITRE ATT&CK techniques or sub-techniques using MITRE technique IDs (e.g., T1059 or T1566.001), all of these must be extracted into the JSON output. Do not omit any technique listed with a T-ID, even if it is not described in full descriptive text. If a MITRE ATT&CK matrix or table is included in the report, all techniques in that matrix must be extracted and included in the output. Any omission of an explicitly listed technique or sub-technique invalidates the output. Strongly inferred techniques and sub-techniques must be included if they are supported by the report text. Inference is allowed only if it is strongly supported by specific quotes or sentences in the report and can be directly mapped to a MITRE ATT&CK technique. Vague, weak, or assumed inferences must be excluded. Provide the supporting evidence after the JSON output, in addition to it, for manual verification of the techniques. Before responding to this request, ensure that all these instructions, clauses, and format are strictly followed. |
Due to errors and inconsistencies caused by ChatGPT’s learning and adaptation to its own responses, results appear to lose their accuracy over time of using the service, as also noted in [58]. To ensure that ChatGPT strictly followed o the instructions presented to it in the crafted prompt, a ‘restart’ prompt was sent between requests, to ensure that these instructions were followed explicitly: ‘Forget everything you have learnt, clear memory, and start a new instance’.
Overall, ChatGPT extracted TTPs from 783 reports, each representing a cybersecurity incident. The authors analyzed manually the supporting evidence (direct quote) for every technique or sub-technique identified by ChatGPT to ensure that the source report that was accurately associated with the technique or sub-technique and that the direct quote provide clear evidence for it . A ChatGPT response that was found invalid, was removed from the results.
If a ChatGPT response was judged ambiguous by the researcher, the following ‘repeat’ prompt was given to ChatGPT, requesting the model to provide more information: ‘Reevaluate each technique and sub-technique and compare it to the MITRE ATT&CK Framework descriptions and remove any that do not adhere to the provided instructions and criteria’. The aim of this prompt was to make ChatGPT analyze its findings and provide additional justifications or evidence to support techniques it identified and remove techniques that were weakly inferred.
A total of 352 MITRE ATT&CK unique techniques and sub-techniques were extracted. As shown in Figure 1, there was a significant variance is a wide variance in the number of TTPs that ChatGPT was able to extract from each usable report, ranging from one TTP to 35 TTPs extracted from a report.
2.3. Cyber Incident Dataset
To create a cyber incident dataset for training and testing the ML models, we selected APT actors who met the following criterion: to be associated with at least 15 cyber incidents. The selection process resulted in a set A of ten MITRE threat actors; The resulting cyber incident dataset comprised data about 783 incidents A (Table 2).
Each record of the dataset contained the threat actor ID, the targeted countries/ regions, targeted industry sector and subsector (manually extracted and summarized from the EuRepoC cyber incident dataset), and the corresponding TTPs, extracted from the 738 reports associated with each of the cybersecurity incidents (extracted using ChatGPT, as described above). Table 3 describes the variables included in th4 dataset.
To create the study dataset T, then variables described in Table 3 we applied a one-hot encoding , mapping evet variable to a binary value of 0 or 1 [59]. The resulting study dataset T contained 783 data rows representing individual cyber incidents. Each row was labeled with a label form the set A and comprised 471 features columns of binary values. The resulting structured cyber incident dataset T was slightly imbalanced as 52% of the datapoints (the cyber incidents) belonged to three classes only (APT_29 ,APT_144, and APT_28).
2.4. Experiment Design
Five ML algorithms were selected were selected and used to build an Ml multi0class classification model Four of the algorithms (DT, RF, SVM, NB) were used in the related work reviewed in section 2 were selected based on their use in previous published research (refer section 1.2). The fifth ML algorithm (KNN), is a supervised learning algorithm that classifies a new datapoint based on the classification of similar datapoints in the training dataset [60]; it was considered suitable for this research as threat actors are identified based on the TTPs observed during an attack and the similarities between targeted countries/regions and industry sectors.
To deploy and experiment with the ML algorithms, a series Python scripts were created by utilizing the Python scikit-learn open-source ML library in a Python IDE (PyCharm Community Edition 2023.3 [61]). The scripts were written and tested on an Asus ROG Strix G16 Laptop with 64GB of RAM, 13th Gen Intel i7 CPU, Nvidia GeForce RTX 4060 GPU, running on Windows 11 Home Edition.
In all experiments, the input dataset was split into a training dataset (70%) and testing dataset (30%). To ensure consistency across all algorithms regarding splitting the training and testing data, the ‘random state’ value was set to 7 across all models. To reduce overfitting and bias due to the majority of TTPs extracted from a relatively small number cybercide reports, a stratified 10-fold cross-validation method [62] was adopted in all experiments where the input dataset included all TTP features (refer section 3.1 and 3.2). Stratified 3-fold cross-validation was used in the experiments which compared model performance across of specified TTP feature ranges (refer section 3.3).
The performance of the models was evaluated using the performance metrics of precision (PR), recall (RC), F1-score (the harmonic mean of PR and RC), and mean model accuracy (mean AC) and standard deviation (STD).
While the mean AC is an effective indicator of the overall model performance, the F1-score is also a significant performance metric in the context of the experience: both false positives (the threat actor attributed to the incident is not the one behind the incident), and false negatives (the threat actor behind the incident was not recognized) have a significant impact on the operational and managerial decisions made on the basis of the classification output. To account for the unbalanced class size, the weighted values of PR, RC and F1-score were considered.
3. Experiments and Results
In the three subsections following, we provide the results of six of experiments, each series involving a different feature selection method. To illustrate the step-wise approach in training and testing the different ML models, we present performance data perc class for KNN models, and average performance data for all models. The KNN models were tested with three different values of K (1, 2 and 3); in the results below, K was set to 1, as the best performing parameter.
3.1. Threat Actorr Attrubution Using Unweighted Features
In the first two series of experiments, the ML models were trained and tested using all encoded TTP features in the cyber incident dataset T. In the second series, all encoded TPP features and all encoded cyberattack target features (i.e., the data about the targeted country/region, and industry sector and subsector of the attack receiver) were included as input features in the training and testing data sets. Table 4 shows the per-class metrics of the KNN model while Table 5 shows the weighted PR, RC and F-score values for the multi-class classification, and the mean AC and STD achieved by the five models (applying 10-fold cross validation). As seen, all models achieved both higher accuracy and higher F1-score when using all features.
3.2. Threat Actorr Attrubution Uisng Unweighted Features
In the subsequent experiments, several different approach were applied to improver the models’ performance by apply weights to the selected features
3.2.1. Rarity-Based Feature Weights
In this approach, the encoded TTP and attack target features were assigned weights based on their usage frequence in the cyber incident dataset T. The assumption underlying the approach was that the more uncommon a TTP or a characteristic of the targeted cyberattack victim get characteristic was, the higher the weight it should be given when used for threat actor attribution. Table 6 shows the algorithm for calculation rarity-based feature weights.
Similarly to above, two series of experiments were conducted , training and testing all ML models on an input dataset. In the first serie4s, the input file included the TTP-features in the cyber incident dataset T (weighted based on rarity). In the second series, the input file included all features in the dataset T, rarity-based weighted.
Table 7 shows the per-class metrics of the KNN model while Table 8 shows the weighted PR, RC and F-score values for the multi-class classification, and the mean AC and STD achieved by the five models (applying 10-fold cross validation).
As in the previous tests, the mean accuracy of the models was significantly higher when all features were included. While the models’ mean accuracy using weighted and unweighted features was compatible for both types of features selection (TTP features only, and all feature, respectively), the respective weighted F1-scores of the models using all features weighted were higher than the weighted F1-scores of th4 models using all features , unweighted.
3.2.2. Pre-Set Feature Weights
This manually weighting approach explored the impact of a number of combinations of pre-determined weights in the range of 1 to 3 to the different feature categories. It was found through experimentation and testing that the highest accuracy levels were achieved when TTP features s were given a weight of 1, and the attack target features were given a weight of 3. Table 9 shows the algorithm.
Table 10 shows the per-class metrics of the KNN model while Table 11 shows the weighted PR, RC and F-score values for the multi-class classification, and the mean AC and STD achieved by the five models (applying 10-fold cross validation). Overall, these results shoe an improvement in comparison to the previous sets of results. The average F1-score were improved. .
3.2.2. Hybrid Feature Weights
In this last series of experiments with, the TTP features were assigned rarity-based weights (refer section 3.2.1), while the attack target features were assigned fixed when the weights of the attack target features were set to 3 (as this value gave the best accuracy). Table 12 shows the per-class metrics of the KNN model while Table 13 shows the weighted PR, RC and F-score values for the multi-class classification, and the mean AC and STD achieved by the five models (applying 10-fold cross validation).Both the mean accuracy across the models and the averaged F1-score were improved for the KNN, SVN and NB models.
To check the accuracy of the results, the final version of the KNN model was modified to include an interactive data input function to the Python script. The function prompts the user to input TTPs, target country and target industry information using the dataset T format. Once the user enters this information, the model performs the classification threat actor attribution and outputs the predicted threat actor attribution
Using the input function, the model was tested on new samples of cyber incidents incident data (five per each threat actor class). As shown in Table 14, the average classification accuracy achieved was 86.,00% .
An additional experiment was conducted to explore the impact of small-sized classes on the model performance. When the smallest class APT_32 (with the lowest weighted F1-score of at 0.44) was removed to create more balanced input dataset, the model’s mean AC increased slightly to 93.19%.
3.3. Threat Actor Attribution by TTP Ranges
To explore the impact of the high number of TTP feature in the feature set of the feature set of cyber incident dataset T, we split the dataset T into subsets, based on t the number of TTP features with a value of 1 (i.e., the number of TTPs extracted from the respective cyber incident report), and removing the TTP feature columns that had 0 values only. We aggregated the subsets to create input datasets with TTP counts in the ranges shown in the first column of Table 15. Three tests were performed, using the KNN algorithm to build the ML classifier, using: : (i) Unweighted TTP features only (as described in section 3.1); (ii) Rarity-based weighted TTP features only (as described in section 3.2.1; and (iii) Rarity-based TTP features and pre-determined flat weighting of the attack target features (as described in section 3.2.2). Table 15 shows the mean AC for each if the tested ranges, using stratified 3-fold cross-validation.
4. Discussion
This research identified ML algorithms that have shown effectiveness in threat actor attribution. The effectiveness of the respective models was explored and compared using different methods of feature selection and weighting.
4.1. Results Overview
Overall, the NB models performed consistently wore compared to the other four ML algorithms. The highest mean AC was obtained by the KNN algorithm utilizing rarity-based weighted TTP features and predetermined weights for the attack target features. The second-best performing algorithm was SVN with a mean AC=92.20% and weighted F1-score = 94% (the highest across all models). The RF algorithm achieved the highest mean AC of 65.75% and the best F1-score of 69% when using TTP features alone. Using different types of feature weighting did not have an impact on the performance of the RF and DT models.
The KNN model responded most positively to using predetermined weighting, achieving the highest mean AC of 91.95% (with the attack target features weighted three times more than the TTP features). However, the weighted F1-score of the KNN model was relatively low (88%). Lastly, when TTP features were weighted based on rarity and the attack target features were given a flat weighting, the best performing model (KNN) achieved a mean AC of 92.59 and a weighted F1-score of 90% (second highest across all models). The manual verification of the results achieved by the KNN model using hybrid feature weighting indicated that the model was performing well for all classes. Additionally, the user input function provides a means for user testing of the black box ML model thus increasing user confidence in the predicted threat actor attribution.
4.2. ML Models and Feature Selection Methods for Thret Actor Attreubutiin
Returning to the research question guiding the study, it may be concluded that four of the explored ML models (DT, RF. SVN and KNN) can be used to build effective ML models. Regarding the use of TTP features only in the input datasets, the experiments indicated that using the extended feature space including the TTP features which represent the cyber attack methods. and the features characterizing the cyber attack context (geographical location and industry) improved significantly all models’ performance.
In particular, when using TTP features alone, the classification accuracy of the four models varied between 55.16% and 65.75%; the best-performing model (RF) achieved mean AC of 65.75% for both weighted and unweighted TTP features. When the attack target features were added, the classification accuracy varied between 79.30% and 92.59%
The choice of feature weighing method had a significant impact on the performance of the KNN and SVN models only (with the classification accuracy increased from 70.94% and 84.78% to 92.59% and 92.20% for the KNN and SVM models, respectively); the classification accuracy of the DT and RF models was not affected by applying feature weighting (highest AC achieved was 84.92% and 91.82%, respectively).
The highest mean AC values were achieved by KNN and SVM, respectively (applying rarity-based weighting to the TTP features and flat weighting g to the attack target features; the highest F1-scores were also achieved by the same model/ feature selection combination but in reverse order (the F-score of SVN was 94.00% compared to the F-score of KNN which was 90.00% ). These results also indicated the setting the K value to 1 for the KNN algorithm, did not cause significant overfitting. This is important as a real-life cyber data includes information about well known threat actors and about new entrants to the cyber crime scene.
4.3. Cyber Incident Class and Feature Set Size
4.3.1. Class Sample Size
In this study, the study dataset was constructed to include threat actors with more then 15 reported cyber incidents in the MITRE database this resulted in having five ‘large’ classes (sample size between 18 and 58), and five ‘small’ classes (sample size between 82 and 169). This affected the performance of the ML models. For example, the performance metrics of the class that had a number of samples very close to the cutoff point (APT_32, with 18 samples) were consistently the lowest, compared to the other classes.
When the KNN model was tested on new data, the classification accuracy of four of the smaller classes was below the leverage while the classification accuracy od four of the large classes was above the average, reflecting imbalance. However, ,runing the KNN model over a resampled dataset that excluded APT_32 showed only small (0.65%) increase of the classification accuracy.
4.3.2. Feature Set Size
As pointed out earlier, the cyber incident dataset T had a very large feature set as it included all TTPs extracted from the 783 cyber incident reports. Comparing the results from the tests described in section 3.3 it can be seen that the actor attribution accuracy was considerably higher for datasets with a smaller number of TTPs Figure 2). However, the results are inconclusive as the datasets with higher number of TTP feature counts contained a small number of samples.
Further analysis of the permeance of the KNN model across datasets with different number of TTPs indicates that the highest classification accuracy when using TTP features only was archived when the number of TTP features was between 1 and 6 or above 18, wth model performance trend similar for unweighted and weighted TTP features. . This may indicate that the TTP features in these dataset included a higher number of unique TTPs compared to the other datasets, which may have included a higher number of common TTPs. Furthermore, when all features were used and weighted (rarity based for TTP features, flat weighing fit attack target features) the model permeance tended to drop with the increase of the number of TTP features in the set. Ultimately, three model performed with same accuracy for datasets with 18 and more TTP features for all three methods of feature selection and weighting.
The number of TTP features per sample was determined by t the ChatGPT ouput. With effective prompt engineering, providing adequate instructions detailing precisely how to extract the TTPs from each report and including strict criteria to be followed, accurate TTP extraction can be performed. However, mistakes can occur in this process, with ChatGPT often producing vague inferences. It was required to manually verify ChatGPT’s responses to ensure the correctness of the threat extraction. This process may have affected the quality of the threat extraction.
4.4. Comparison with Relateds Work
Table 16 presents a comparison between this study and four related threat actor attribution studies that were reviewed in section 2. Th reported accuracy of the studies varies from 54.42% to 96%. This study compares favorably to the first three e studies in terms of achieved accuracy. While the fourth study has a higher accuracy, it uses more feature categories, making it harder to implement in real-life contexts.
4.5. Study Contributions
This research makes several contributions. First it demonstrates how specific ML algorithms can be used to model threat actor attribution with high accuracy, using TTP data as well as data about the attack context. Second, the study has demonstrated the effectiveness of using an LLM to analyze and extract TTPs from cyber incident reports, following provided TTP specifications. Third, the study has contributed a multi dimensional dataset of 783 samples attributed to 10 threat actors that can be used in related research.
The outcomes of this study may help cybersecurity professionals estimate the number and types of datapoints that are required to adequately attribute a threat actor to a cyberattack and how to improve the accuracy of the classification by ifgting the input dataset features.
4.6. Study Limitations
The study has several limitations. First, only five ML algorithms were used n the experiment. Second, there were a number of limitations related to the study dataset: the numbers of the threat actors in the dataset was relatively small; the number of TTP features with a binary value of 1 (i.e., the TTP features specific to the sample) varied widely, with 69% of the samples in the dataset represented by r six or fewer TTPs; the class size also varied, with the smallest class represented d by 18samples only.
Lastly, even TTPs are at the top of the Pyramid of Pain and are considered as a reliable and stable cyber attack attributes, threat actors may alter their techniques, and new threat actors may appear . To ensure trustworthy threat actor attribution, , the most up-to-date information should be used to train. This study did not consider altered, newly seen existing techniques, or emerging techniques that were yet to be defined by the MITRE ATT&CK Foundation.
4.7. Further Research Directions
There are several aspects of this research that can be fer explored in future research to expand on the capabilities of threat actor attribution. Increasing the number r number of threat actors and cyber incidents and generating a mor balanced dataset may increase the accuracy of the classification and achieve a better understanding of the effect of increasing the number of 1-valued TTP features per sample.
Second, the manual testing conducted within this research can be expanded upon to explore variance in threat actor attribution using this dataset for training and the final KNN model against cyber incidents that were not included within the training dataset and additional real-world incidents, or against further subsets of TTPs from reports already utilized in the training dataset.
Third, future research can explore the impact of inclusion of additional cyber incident attributes from the Pyramid of Pain as a means of reefing the clarification model output , such as IP addresses, hashes, domains, malware, or tools. Another avenue for further research is to investigate the effectiveness of other ML algorithms and improve the classification accuracy by using an ensembles MK model.
Author Contributions
Conceptualization, S.H. and K.P.; methodology, S.H. and K.P.; software, S.H.; validation, S.H.; formal analysis, S.H. ; investigation, S.H. and K.P.; resources, S.H.; data curation, S.H.; writing—original draft preparation, K.P. and S.H; writing—review and editing, K.P..; visualization, S.H.; supervision, K.P.; project administration, K.P. All authors have read and agreed to the published version of the manuscript.
Funding
This research received no external funding.
Data Availability Statement
We are currently considering publishing the data set in dataset repository.
Acknowledgments
During the study, the authors used ChatGPT version 4.0 to for the purposes of generating some of the data used in the study. The process is described in detail is section Materials and Methods. The authors have reviewed and edited the output and take full responsibility for the content of this publication.
Conflicts of Interest
The authors declare no conflicts of interest.
Abbreviations
The following abbreviations are used in this manuscript:
| TTP. | Tactics, Techniques And Procedures |
| APT | Advanced Persistent Threats |
| PE | Prompt Engineering |
| LLM | Large Language Model |
| DL | Deep Learning |
| ML | Machine Learning |
| KNN | K-Nearest Neighbors |
| SVM | Support Vector Machines |
| RF | Random Forests |
| DT | Decision Trees |
| NB | Naïve Bayes |
| SOC | Security Operation Centre |
| IOC | Indicator of Compromise |
| AC | Accuracy |
| RC | Recall |
| PR | Precision |
| GenAI | Generative AI |
References
- Zang, T.; Xiao, Y.; Liu, Y.; Wang, S.; Wang, Z.; Zhou, Y. Defense Strategy against Cyber Attacks on Substations Considering Attack Resource Uncertainty. Journal of Modern Power Systems and Clean Energy 2025, 1-13. [CrossRef]
- Tanner, A.; Dancer, F.C.; Hall, J.; Parker, N.; Bishop, R.; McBride, T. The Need for Proactive Digital Forensics in Addressing Critical Infrastructure Cyber Attacks. 2022 International Conference on Computational Science and Computational Intelligence (CSCI) 2022, 976-982. [CrossRef]
- Falowo, O.I.; Popoola, S.; Riep, J.; Adewopo, V.A.; Koch, J. Threat Actors’ Tenacity to Disrupt: Examination of Major Cybersecurity Incidents. IEEE Access 2022, 10, 134038-134051. [CrossRef]
- Kaloudi, N.; Li, J. The AI-Based Cyber Threat Landscape: A Survey. ACM Comput. Surv. 2020, 53, Article 20. [CrossRef]
- Fieblinger, R.; Alam, M.T.; Rastogi, N. Actionable Cyber Threat Intelligence Using Knowledge Graphs and Large Language Models. 2024 IEEE European Symposium on Security and Privacy Workshops (EuroS&PW) 2024, 100-111. [CrossRef]
- ATT; CK, M. Mitre att&ck framework. MITRE Corporation. Retrieved February 2024, 24, 2024.
- FRAMEWORK, A. ATTACK FRAMEWORK.
- Radoglou-Grammatikis, P.; Kioseoglou, E.; Asimopoulos, D.; Siavvas, M.; Nanos, I.; Lagkas, T.; Argyriou, V.; Psannis, K.E.; Goudos, S.; Sarigiannidis, P. Surveying Cyber Threat Intelligence and Collaboration: A Concise Analysis of Current Landscape and Trends. 2023 IEEE International Conference on Cloud Computing Technology and Science (CloudCom) 2023, 309-314. [CrossRef]
- Hooi, E.K.J.; Zainal, A.; Maarof, M.A.; Kassim, M.N. TAGraph: Knowledge Graph of Threat Actor. 2019 International Conference on Cybersecurity (ICoCSec) 2019, 76-80. [CrossRef]
- Li, Y.; Liu, Q. A comprehensive review study of cyber-attacks and cyber security; Emerging trends and recent developments. Energy Reports 2021, 7, 8176-8186. [CrossRef]
- Mahmoud, R.V.; Anagnostopoulos, M.; Pedersen, J.M. Detecting Cyber Attacks through Measurements: Learnings from a Cyber Range. IEEE Instrumentation & Measurement Magazine 2022, 25, 31-36. [CrossRef]
- Al-Sada, B.; Sadighian, A.; Oligeri, G. MITRE ATT&CK: State of the Art and Way Forward. ACM Comput. Surv. 2024, 57, Article 12. [CrossRef]
- The MITRE Corporation. Techniques - Enterprise | MITRE ATT&CK®. Available online: https://attack.mitre.org/techniques/enterprise/ (accessed on.
- Althamir, M.A.; Boodai, J.Z.; Rahman, M.M.H. A Mini Literature Review on Challenges and Opportunity in Threat Intelligence. 2023 International Conference on Artificial Intelligence in Information and Communication (ICAIIC) 2023, 558-563. [CrossRef]
- Wu, Y.; Liu, Q.; Liao, X.; Ji, S.; Wang, P.; Wang, X.; Wu, C.; Li, Z. Price TAG: Towards Semi-Automatically Discovery Tactics, Techniques and Procedures OF E-Commerce Cyber Threat Intelligence. IEEE Transactions on Dependable and Secure Computing 2021, 1-1. [CrossRef]
- Agarwal, A.; Walia, H.; Gupta, H. Cyber Security Model for Threat Hunting. 2021 9th International Conference on Reliability, Infocom Technologies and Optimization (Trends and Future Directions) (ICRITO) 2021, 1-8. [CrossRef]
- Gopalakrishna, R.; Bhaskaran, R. Position Paper: The Extended Pyramid of Pain: The Attacker's Nightmare Edition. In 2025 IEEE European Symposium on Security and Privacy Workshops (EuroS&PW); IEEE: 2025; pp. 662-670.
- Golushko, A.P.; Zhukov, V.G. Application of Advanced Persistent Threat Actors` Techniques aor Evaluating Defensive Countermeasures. 2020 IEEE Conference of Russian Young Researchers in Electrical and Electronic Engineering (EIConRus) 2020, 312-317. [CrossRef]
- Yulianto, S.; Ngo, G.N.C. Automated Threat Hunting, Detection, and Threat Actor Profiling Using TIRA. 2024 International Conference on ICT for Smart Society (ICISS) 2024, 1-7. [CrossRef]
- Grotto, A. Deconstructing Cyber Attribution: A Proposed Framework and Lexicon. IEEE Security & Privacy 2019, PP. [CrossRef]
- Goel, S.; Nussbaum, B. Attribution Across Cyber Attack Types: Network Intrusions and Information Operations. IEEE Open Journal of the Communications Society 2021, 2, 1082-1093. [CrossRef]
- Avellaneda, F.; Alikacem, E.H.; Jaafar, F. Using Attack Pattern for Cyber Attack Attribution. 2019 International Conference on Cybersecurity (ICoCSec) 2019, 1-6. [CrossRef]
- Bhole, M.; Sauter, T.; Kastner, W. Enhancing Industrial Cybersecurity: Insights from Analyzing Threat Groups and Strategies in Operational Technology Environments. IEEE Open Journal of the Industrial Electronics Society 2025, 1-13. [CrossRef]
- Chen, Z.S.; Vaitheeshwari, R.; Wu, E.H.K.; Lin, Y.D.; Hwang, R.H.; Lin, P.C.; Lai, Y.C.; Ali, A. Clustering APT Groups Through Cyber Threat Intelligence by Weighted Similarity Measurement. IEEE Access 2024, 12, 141851-141865. [CrossRef]
- Domschot, E.; Ramyaa, R.; Smith, M.R. Improving Automated Labeling for ATT&CK Tactics in Malware Threat Reports. ACM Digital Threats 2024, 5, Article 2. [CrossRef]
- Permana, D.R.; Stiawan, D.; Rini, D.P.; Afifah, N.; Ningrum, S.K.; Budiarto, R. An Enhanced Method with Part of Speech Tagging and Named Entity Recognition Techniques Towards Advanced Persistent Threat in Cyber Threat Intelligence: Work in Progress. 2024 11th International Conference on Electrical Engineering, Computer Science and Informatics (EECSI) 2024, 493-498. [CrossRef]
- Ramsdale, A.; Shiaeles, S.; Kolokotronis, N. A comparative analysis of cyber-threat intelligence sources, formats and languages. Electronics 2020, 9, 824.
- Huang, Y.T.; Vaitheeshwari, R.; Chen, M.C.; Lin, Y.D.; Hwang, R.H.; Lin, P.C.; Lai, Y.C.; Wu, E.H.K.; Chen, C.H.; Liao, Z.J.; et al. MITREtrieval: Retrieving MITRE Techniques From Unstructured Threat Reports by Fusion of Deep Learning and Ontology. IEEE Transactions on Network and Service Management 2024, 21, 4871-4887. [CrossRef]
- Atlam, H.F. LLMs in Cyber Security: Bridging Practice and Education. Big Data and Cognitive Computing 2025, 9, 184.
- Saddi, V.R.; Gopal, S.K.; Mohammed, A.S.; Dhanasekaran, S.; Naruka, M.S. Examine the Role of Generative AI in Enhancing Threat Intelligence and Cyber Security Measures. 2024 2nd International Conference on Disruptive Technologies (ICDT) 2024, 537-542. [CrossRef]
- Krašovec, A.; Steri, G.; Karopoulos, G.; Trapani, M. Large Language Models for Cyber Threat Intelligence: Extracting MITRE With LLMs. In Proceedings of the International Conference on Availability, Reliability and Security, 2025; pp. 80-89.
- Gupta, M.; Akiri, C.; Aryal, K.; Parker, E.; Praharaj, L. From ChatGPT to ThreatGPT: Impact of Generative AI in Cybersecurity and Privacy. IEEE Access 2023, 11, 80218-80245. [CrossRef]
- Okey, O.D.; Udo, E.U.; Rosa, R.L.; Rodríguez, D.Z.; Kleinschmidt, J.H. Investigating ChatGPT and cybersecurity: A perspective on topic modeling and sentiment analysis. Computers & Security 2023, 135, 103476. [CrossRef]
- Li, Y.; Shi, J.; Zhang, Z. An Approach for Rapid Source Code Development Based on ChatGPT and Prompt Engineering. IEEE Access 2024, 12, 53074-53087. [CrossRef]
- Schmidt, D.C.; Spencer-Smith, J.; Fu, Q.; White, J. Towards a Catalog of Prompt Patterns to Enhance the Discipline of Prompt Engineering. Ada Lett. 2024, 43, 43–51. [CrossRef]
- Tripaldelli, A.; Pozek, G.; Butka, B. Leveraging Prompt Engineering on ChatGPT for Enhanced Learning in CEC330: Digital System Design in Aerospace. 2024 IEEE Global Engineering Education Conference (EDUCON) 2024, 1-9. [CrossRef]
- Xiang, X.; Liu, H.; Zeng, L.; Zhang, H.; Gu, Z. IPAttributor: Cyber attacker attribution with threat intelligence-enriched intrusion data. Mathematics 2024, 12, 1364.
- Noor, U.; Anwar, Z.; Noor, U.; Anwar, Z.; Rashid, Z. An Association Rule Mining-Based Framework for Profiling Regularities in Tactics Techniques and Procedures of Cyber Threat Actors. 2018 International Conference on Smart Computing and Electronic Enterprise (ICSCEE) 2018, 1-6. [CrossRef]
- Abou El Houda, Z. Cyber threat actors review: examining the tactics and motivations of adversaries in the cyber landscape. In Cyber Security for Next-Generation Computing Technologies; CRC Press: 2024; pp. 84-101.
- Desa, J.M.; Juremi, J.; Jenalis, M.H. Understanding Cyber Threat Actors: A Review on Classification, Motivations, and Behavioral Profiling. In International Conference on Data Engineering and Communication Technology; Springer: 2024; pp. 23-30.
- Abo-Alian, A.; Youssef, M.; Badr, N.L. A data-driven approach to prioritize MITRE ATT&CK techniques for active directory adversary emulation. Scientific Reports 2025, 15, 27776.
- Duan, J.; Yujie Luo; Zhang, Z.; Peng, J. A heterogeneous graph-based approach for cyber threat attribution using threat intelligence. ACM International Conference on Machine Learning and Computing 2024, 87–93. [CrossRef]
- Kida, M.; Olukoya, O. Nation-State Threat Actor Attribution Using Fuzzy Hashing. IEEE Access 2023, 11, 1148-1165. [CrossRef]
- Xiao, N.; Lang, B.; Wang, T.; Chen, Y. APT-MMF: An advanced persistent threat actor attribution method based on multimodal and multilevel feature fusion. Computers & Security 2024, 144, 103960. [CrossRef]
- Irshad, E.; Basit Siddiqui, A. Cyber threat attribution using unstructured reports in cyber threat intelligence. Egyptian Informatics Journal 2023, 24, 43-59. [CrossRef]
- Irshad, E.; Siddiqui, A.B. Context-aware cyber-threat attribution based on hybrid features. ICT Express 2024, 10, 553-569.
- Saha, A.; Blasco, J.; Cavallaro, L.; Lindorfer, M. Adapt it! automating apt campaign and group attribution by leveraging and linking heterogeneous files. In Proceedings of the 27th International Symposium on Research in Attacks, Intrusions and Defenses; 2024; pp. 114-129.
- Saha, A.; Mattei, J.; Blasco, J.; Cavallaro, L.; Votipka, D.; Lindorfer, M. Expert Insights into Advanced Persistent Threats: Analysis, Attribution, and Challenges. In Proceedings of the 34th USENIX Security Symposium (USENIX Sec); 2025.
- Hou, C.; Xie, W.; Li, F.; Meng, X.; Shi, Y.; Liu, Y.; Zhao, Z. Data Pattern Matching Method Based on BERT and Attention Mechanism. 2024 Second International Conference on Networks, Multimedia and Information Technology (NMITCON) 2024, 1-8. [CrossRef]
- Böge, E.; Ertan, M.B.; Alptekin, H.; Çetin, O. Unveiling Cyber Threat Actors: A Hybrid Deep Learning Approach for Behavior-Based Attribution. ACM Digital Threats 2025, 6, Article 2. [CrossRef]
- Zhang, Y.; Yang, P.; Jiang, Z.; Ma, C.; Cui, M.; You, Y. APTChaser: Cyber Threat Attribution via Attack Technique Modeling. In International Conference on Digital Forensics and Cyber Crime; Springer: 2024; pp. 168-185.
- N, S.; Puzis, R.; Angappan, K. Deep Learning for Threat Actor Attribution from Threat Reports. 2020 4th International Conference on Computer, Communication and Signal Processing (ICCCSP) 2020, 1-6. [CrossRef]
- Rani, N.; Saha, B.; Shukla, S.K. A comprehensive survey of automated Advanced Persistent Threat attribution: Taxonomy, methods, challenges and open research problems. Journal of Information Security and Applications 2025, 92, 104076. [CrossRef]
- Zettl-Schabath, K., Bund, J., Müller, M., Borrett, C., Hemmelskamp, J., Alibegovic, A., Bajra, E., Jazxhi, A., Kellenter, E., Sachs, A., Shelley, C. Global Dataset of Cyber Incidents (1.3.2). 2025. [CrossRef]
- European Repository of Cyber Incidents. About us - EuRepoC: European Repository of Cyber Incidents. Available online: https://eurepoc.eu/about-us/ (accessed on.
- Syed, A.; Nour, B.; Pourzandi, M.; Assi, C.; Debbabi, M. Comprehensive Advanced Persistent Threats Dataset. IEEE Networking Letters 2025.
- Sewunetie, W.T.; Kovács, L. Exploring Sentence Parsing: OpenAI API-Based and Hybrid Parser-Based Approaches. IEEE Access 2024, 12, 38801-38815. [CrossRef]
- Church, K. Emerging trends: When can users trust GPT, and when should they intervene? Natural Language Engineering 2024, 30, 417-427.
- Dahouda, M.K.; Joe, I. A Deep-Learned Embedding Technique for Categorical Features Encoding. IEEE Access 2021, 9, 114381-114391. [CrossRef]
- Qian, C. Web Malicious Request Identification Based on k-Nearest Neighbor Algorithm. 2024 7th International Conference on Computer Information Science and Application Technology (CISAT) 2024, 131-135. [CrossRef]
- JetBrains. PyCharm: The only Python IDE you need. Available online: https://www.jetbrains.com/pycharm/ (accessed on.
- Rahman, A.; Hassan, I.; Ahad, M.A.R. Nurse Care Activity Recognition: A Cost-Sensitive Ensemble Approach to Handle Imbalanced Class Problem in the Wild. ACM International Joint Conference on Pervasive and Ubiquitous Computing 2021, 440–445. [CrossRef]
Figure 1.
Number of extracted TTPs vs number of reports. The x-axis represents the number of extracted TTPs from a single cyber incident report, and the y-axis represents the total number of reports that produced each number of TTPs.
Figure 1.
Number of extracted TTPs vs number of reports. The x-axis represents the number of extracted TTPs from a single cyber incident report, and the y-axis represents the total number of reports that produced each number of TTPs.
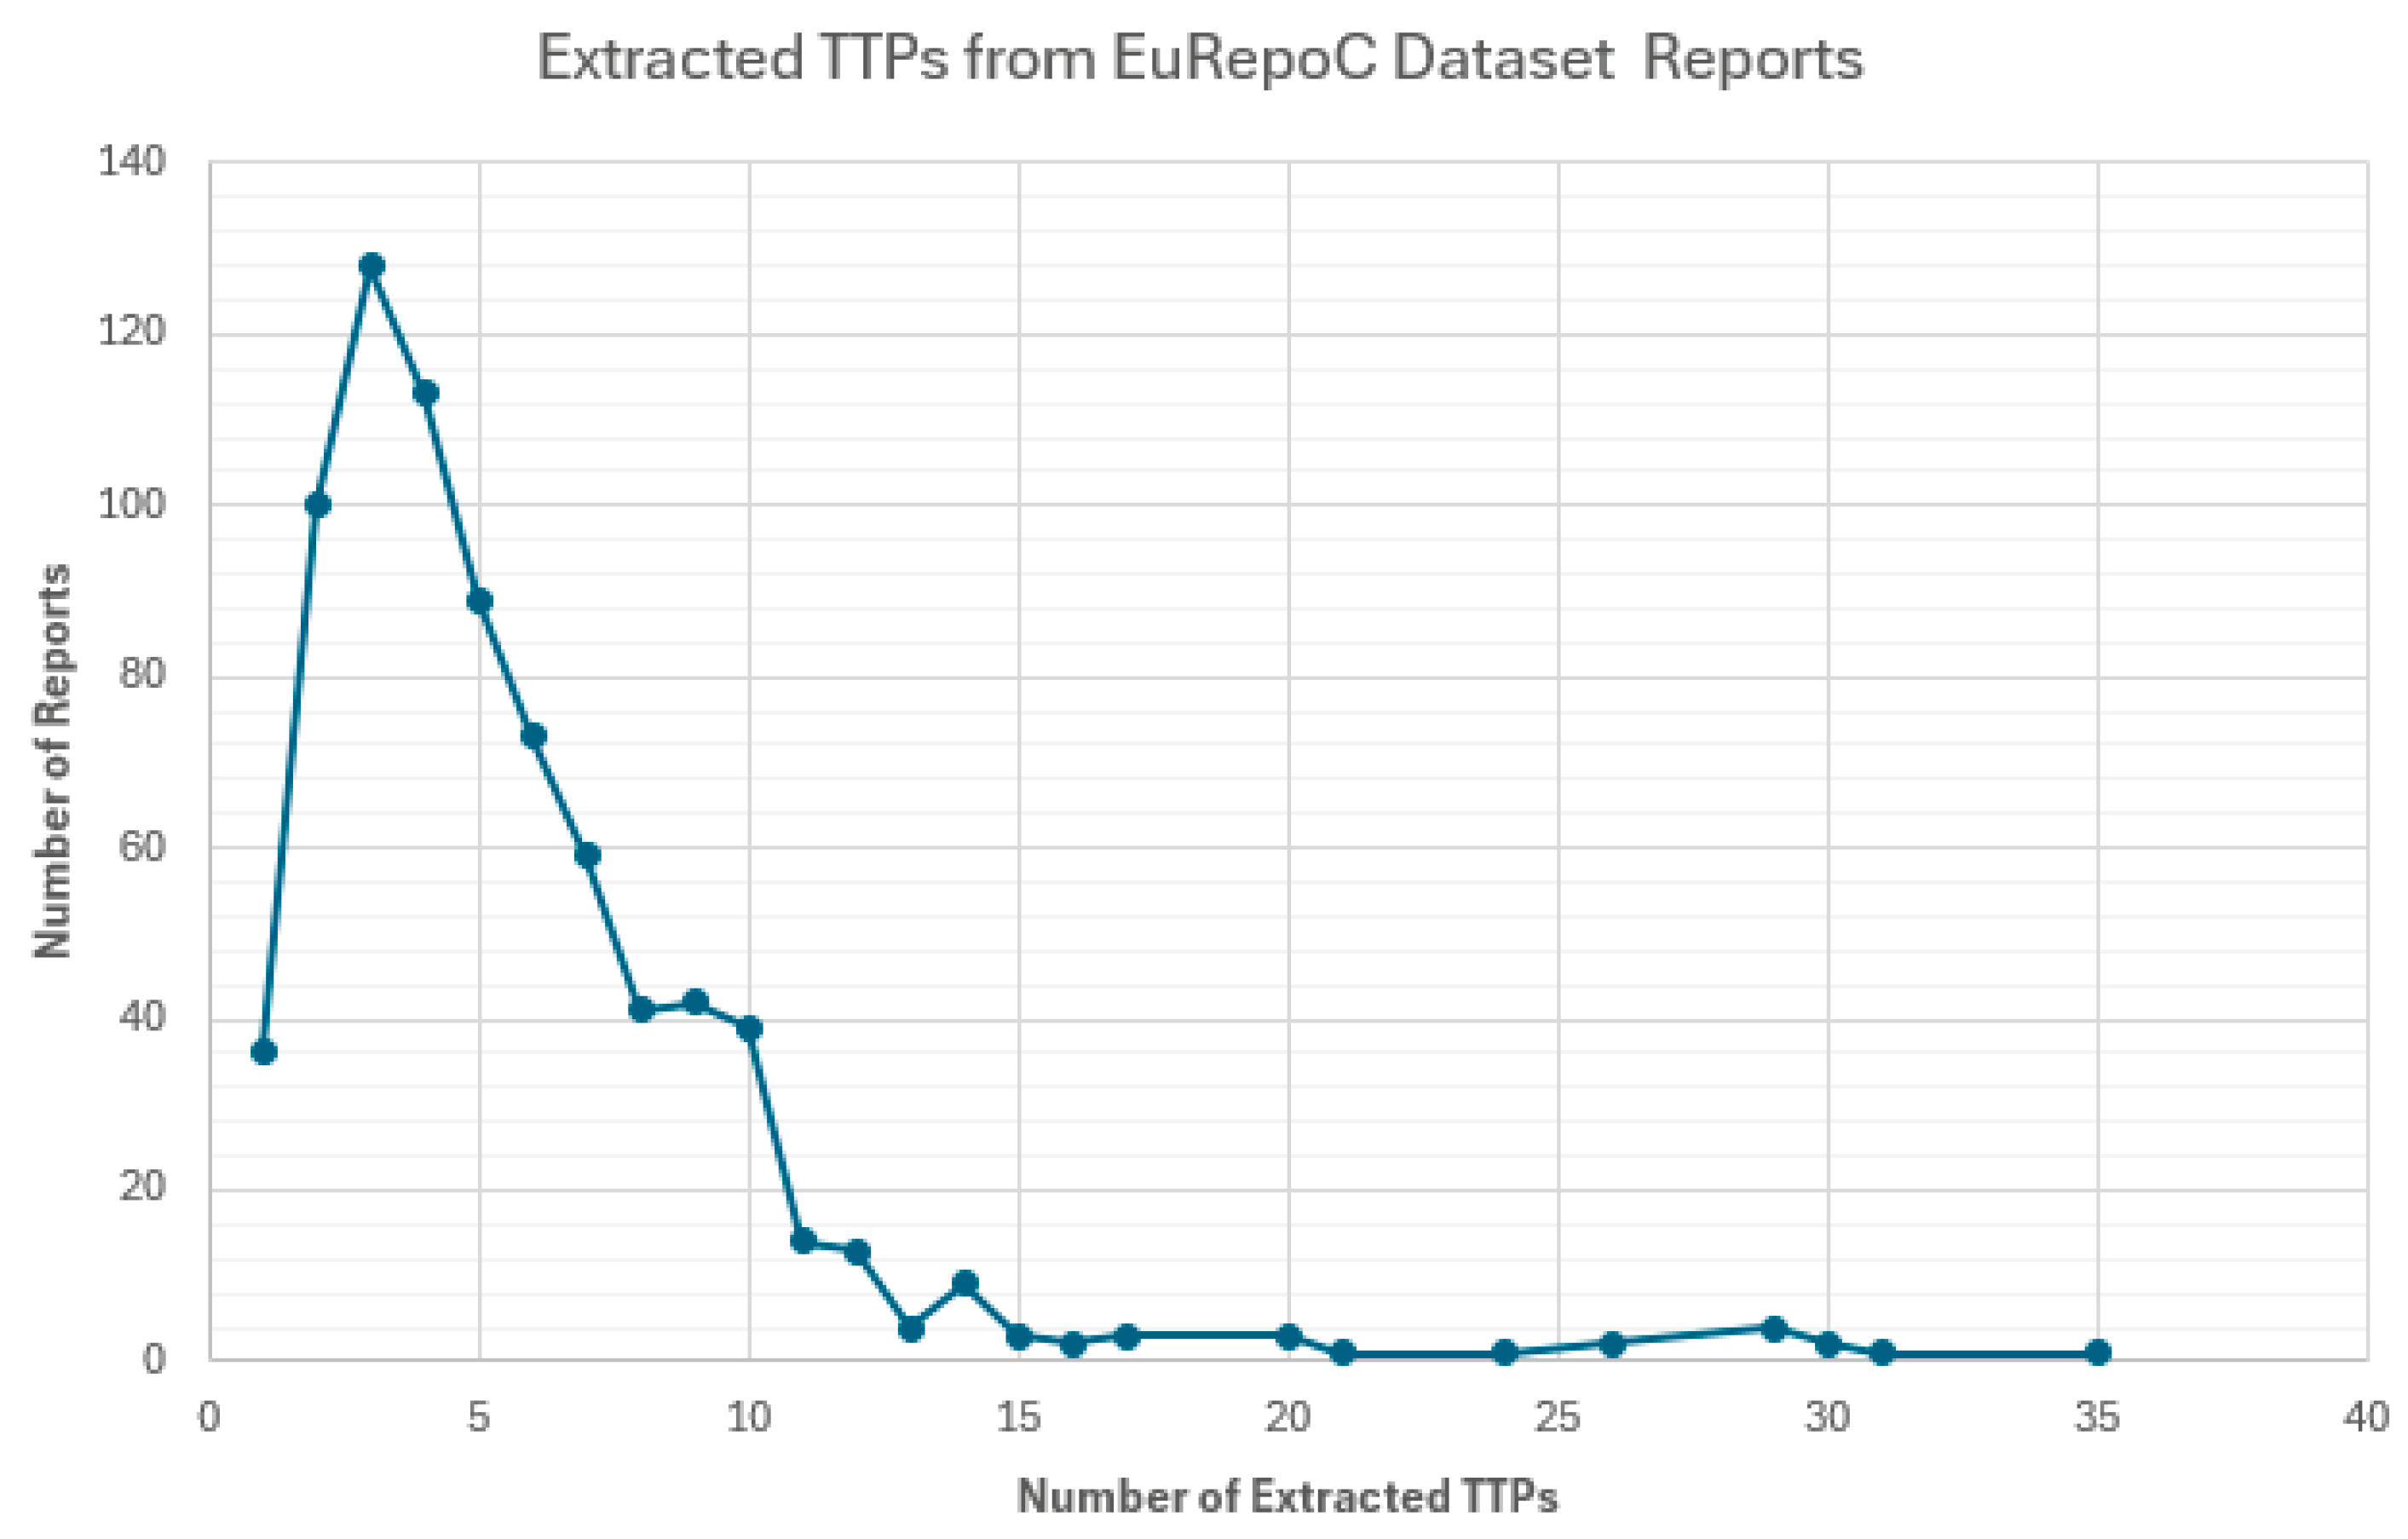
Figure 2.
Mean attribution accuracy levels for ranges of TTP features. Note. The x-axis represents ranges of number of TTP features corresponding to TTPs extracted from cyber incident reports. The e y-axis represents the threat actor attribution mean accuracy levels using KNN with three different types of feature selection.
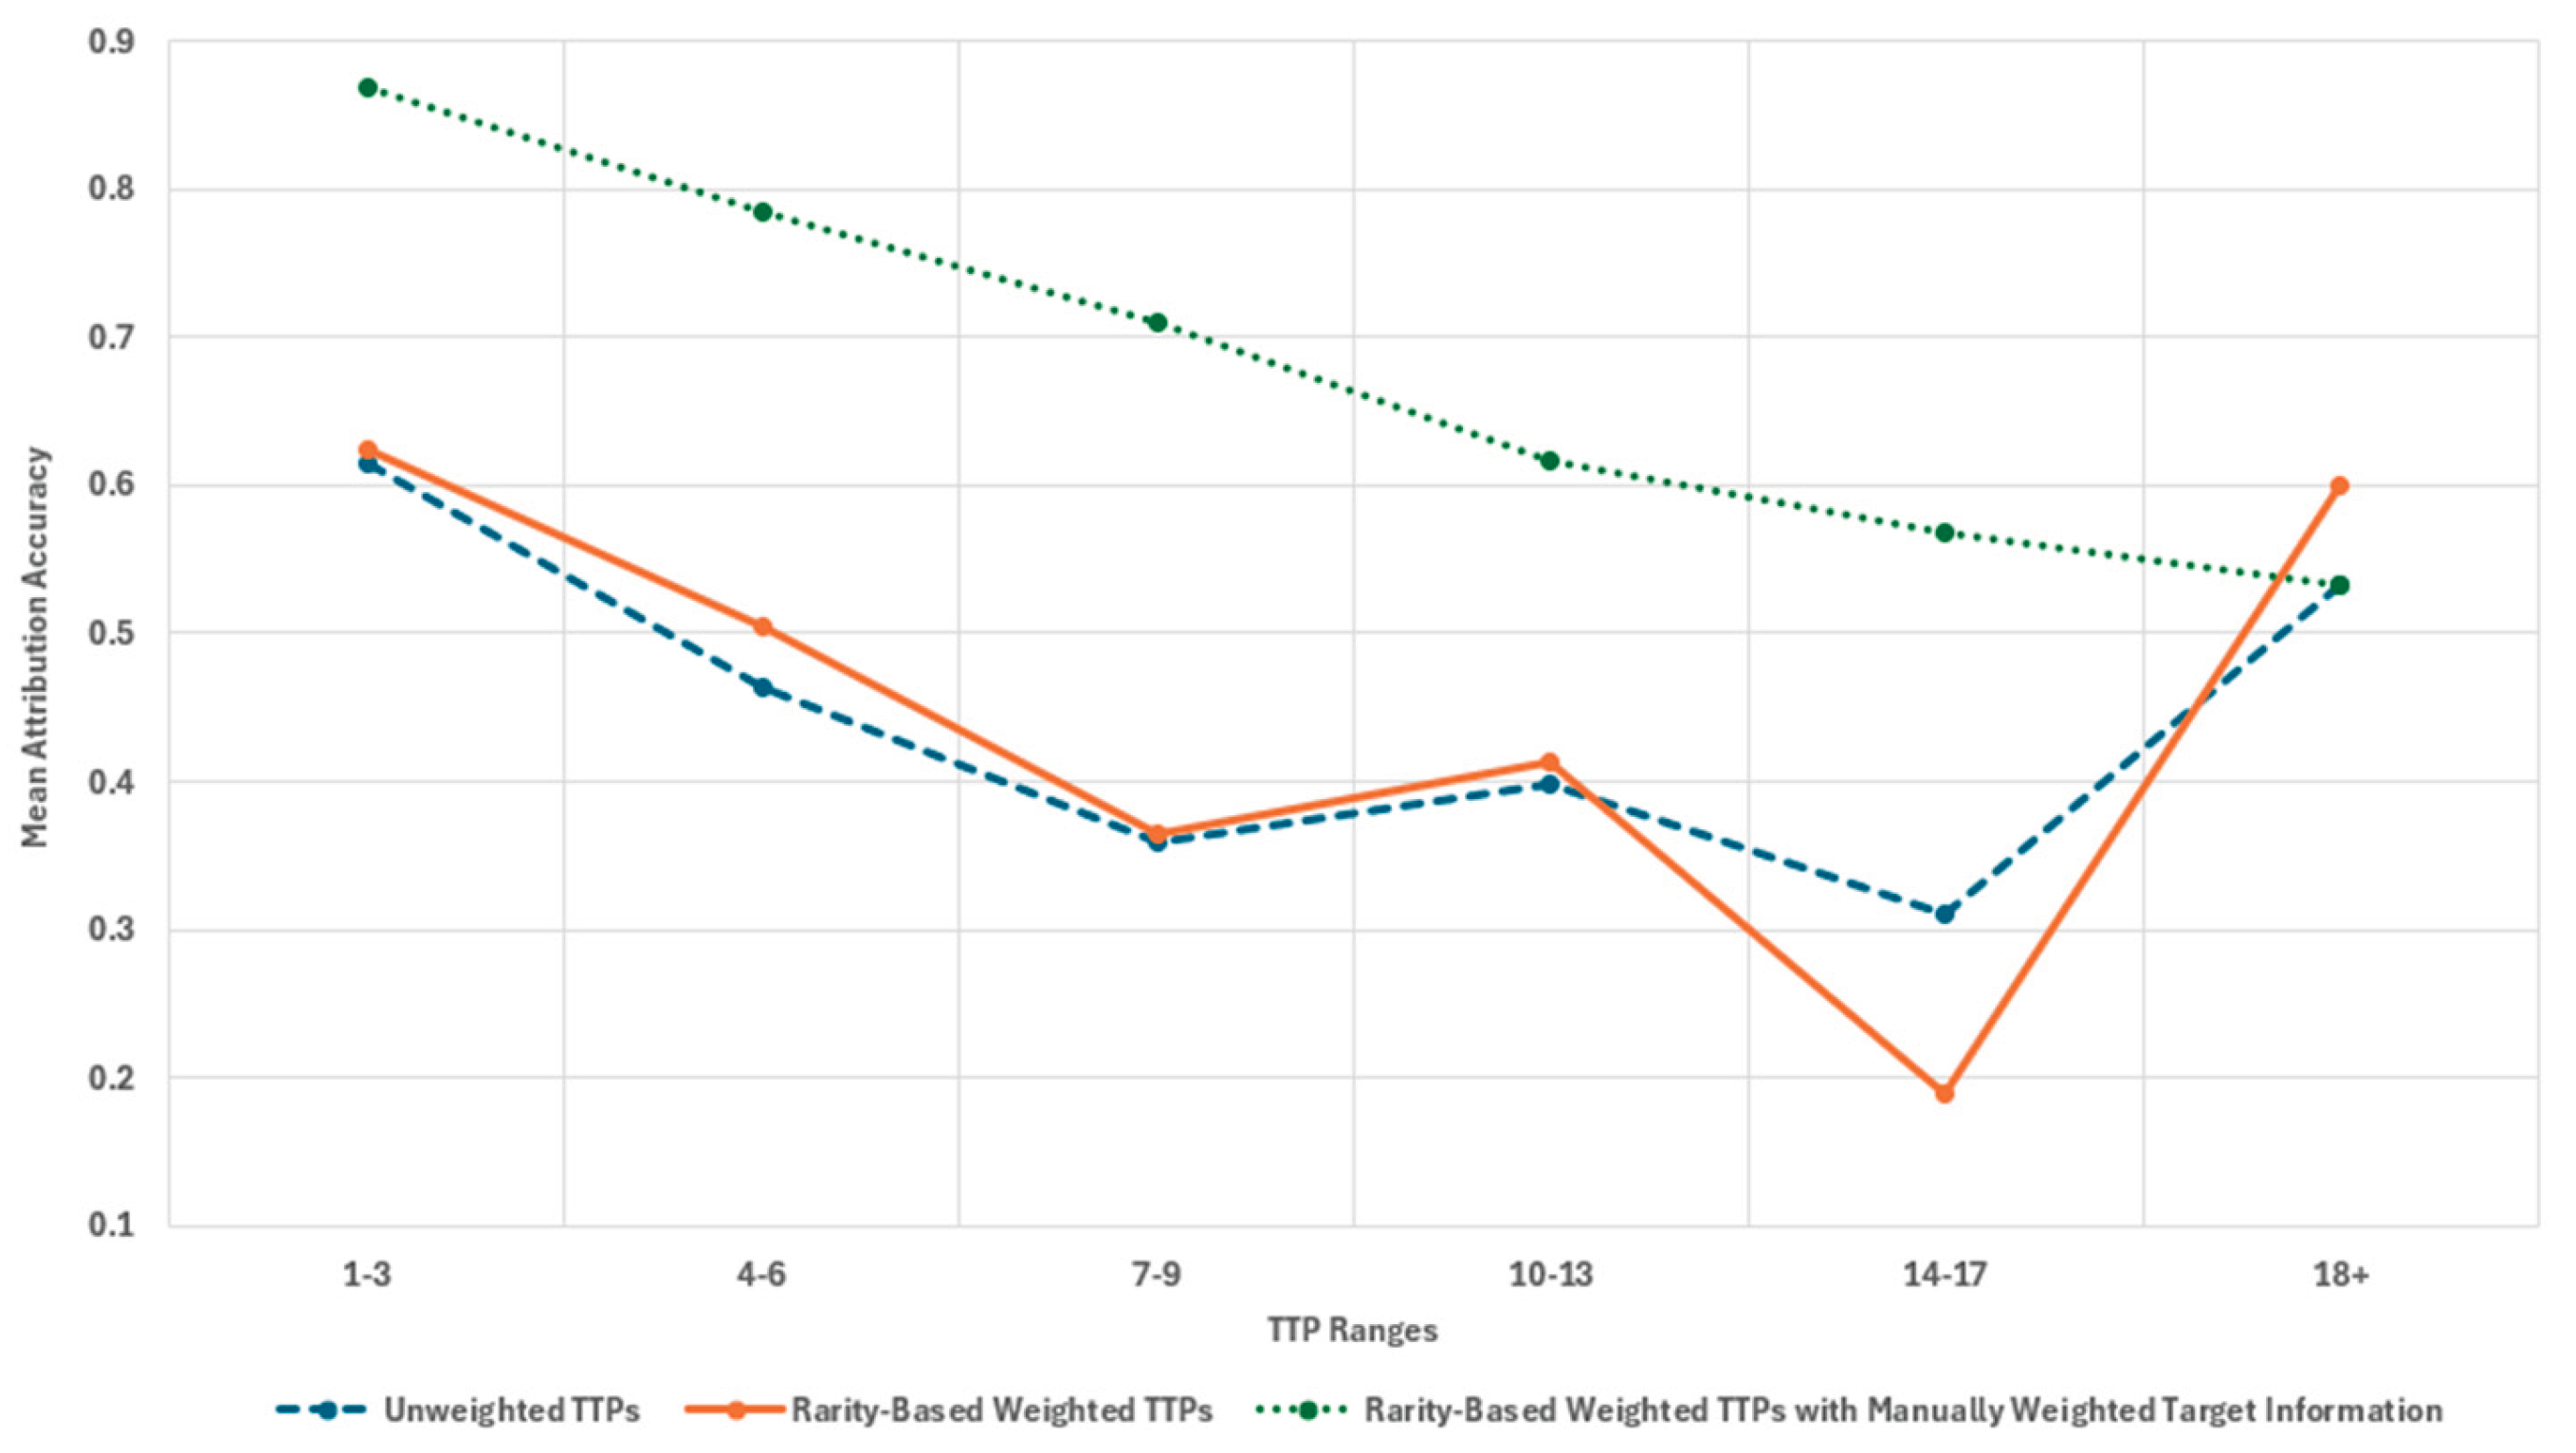
Table 2.
Threat actors and the number of attributed incidents in the study dataset.
| Threat Actor ID | Number of Attributed Incident |
| APT_32 | 18 |
| APT_27 | 32 |
| APT_37 | 46 |
| APT_34 | 56 |
| APT_41 | 58 |
| APT_45 | 82 |
| APT_35 | 87 |
| APT_28 | 112 |
| APT_44 | 123 |
| APT_29 | 169 |
Table 3.
Cyber incident dataset variables.
| Cybersecurity incident variables | Number of unique values |
| APT threat actor | 10 |
| TTPs | 352 |
| Targeted countries/regions | 84 |
| Targeted industry sectors and subsectors | 35 |
Table 4.
KNN model performance (per class) using unweighted features.
| Acor class | PR | RC | F1-score | |||
| TTP Features Only | All Features | TTP Features Only | All Features | TTP Features Only | All Features | |
| APT_27 | 0.62 | 0.60 | 0.50 | 0.60 | 0.56 | 0.60 |
| APT_28 | 0.46 | 0.63 | 0.60 | 0.87 | 0.52 | 0.73 |
| APT_29 | 0.74 | 0.83 | 0.81 | 0.92 | 0.77 | 0.87 |
| APT_32 | 0.50 | 0.10 | 0.33 | 0.33 | 0.40 | 0.50 |
| APT_34 | 053 | 0.85 | 0.47 | 0.65 | 0.50 | 0.73 |
| APT_35 | 0.66 | 0.77 | 0.79 | 0.10 | 0.72 | 0.87 |
| APT_37 | 0.40 | 0.10 | 0.27 | 0.73 | 0.32 | 0.85 |
| APT_41 | 0.32 | 0.75 | 0.60 | 0.60 | 0.41 | 0.67 |
| APT_44 | 0.74 | 0.87 | 0.72 | 0.93 | 0.73 | 0.90 |
| APT_45 | 0.75 | 0.87 | 0.32 | 0.46 | 0.45 | 0.60 |
Table 5.
ML model performance metrics using unweighted features (in percentage).
| ML Algorithm | Weighted PR | Weighted RC | Weighted F1-score | Mean AC | STD | |||||||||
| TTP Features Only | All Features | TTP Features Only | All Features | TTP Features Only | All Features | 10-forld Cross Validation | ||||||||
| TTP Features Only | All Features | TTP Features Only | All Features | |||||||||||
| KNN | 63.00 | 81.00 | 61.00 | 80.00 | 61.00 | 79.00 | 55.29 | 79.94 | 4.77 | 4.71 | ||||
| DT | 60.00 | 85.00 | 59.00 | 83.00 | 59.00 | 83.00 | 55.68 | 84/92 | 4/78 | 3.14 | ||||
| RF | 72.00 | 91.00 | 69.00 | 90.00 | 69/99 | 90.00 | 65.75 | 91.822 | 5.77 | 2.94 | ||||
| SVM | 61.00 | 84.00 | 59.00 | 83.00 | 59.00 | 84.79 | 55.91 | 84.79 | 7.76 | 5.11 | ||||
| NB | 55.00 | 77.00 | 55.00 | 75.00 | 51.00 | 75.00 | 59.30 | 69.86 | 5.29 | 5.68 | ||||
Table 6.
Assigning rarity-based weightings.
| Step | Description |
| Input and Output 1 | Input: Dataset D containing one-hot encoded features for threat activity; target variable y = APT identifier (apt_num). Output: Weighted and standardized feature matrix X′ ready for KNN classification. |
| Load dataset | Read the file 'One-Hot_Encoded_Threat_Data.csv' into the dataframe D. |
| Feature group extraction | (a) Identify columns in D beginning with the following prefixes: - 'ttps_' → TTP-related features - 'receiver_country_' → country-related features - 'receiver_category_' → sector-related features - 'receiver_subcategory_' → industry-related features (b) Combine all identified columns to form the complete feature set F. |
| Rarity-based weight calculation | (a) For each feature f in F, count the number of unique APT identifiers for which f = 1. Denote this count as c_f (feature usage frequency). (b) Determine c_max, the maximum of all usage counts. (c) Assign an amplified rarity-based weight w_f to each feature according to the formula: w_f = ((1 / c_f) / (1 / c_max))^3 if c_f > 0, else 0. (d) Apply this weighting procedure separately to each group of features (TTP, country, sector, and industry). |
| Rarity-based weight application | (a) Extract the feature matrix X and label vector y from D. (b) Standardize all features in X using Z-score normalization. (c) For each column f in X, multiply all standardized values by the corresponding weight w_f. (d) The resulting matrix X′ represents the weighted and standardized feature set. Data |
Table 7.
KNN model performance(per class) using rarity-based feature weightings.
| Acor class | PR | RC | F1-score | |||
| TTP Features Only | All Features | TTP Features Only | All Features | TTP Features Only | All Features | |
| APT_27 | 0.71 | 0.86 | 0.50 | 0.60 | 0.59 | 0.71 |
| APT_28 | 0.49 | 0.66 | 0.60 | 0.83 | 0.54 | 0.74 |
| APT_29 | 0.79 | 0.92 | 0.79 | 0.90 | 0.79 | 0.91 |
| APT_32 | 1.00 | 0.67 | 0.33 | 0.33 | 0.50 | 0.44 |
| APT_34 | 0.56 | 0.82 | 0.53 | 0.82 | 0.55 | 0.82 |
| APT_35 | 0.64 | 0.83 | 0.75 | 1.00 | 0.69 | 0.91 |
| APT_37 | 0.36 | 0.88 | 0.27 | 0.93 | 0.31 | 0.90 |
| APT_41 | 0.30 | 0.88 | 0.70 | 0.70 | 0.42 | 0.78 |
| APT_44 | 0.77 | 0.86 | 0.79 | 0.84 | 0.78 | 0.85 |
| APT_45 | 0.87 | 0.88 | 0.46 | 0.75 | 0.60 | 0.81 |
Table 8.
ML model performance metrics using rarity-based feature weightings (in percentage).
| ML Algorithm | Weighted PR | Weighted RC | Weighted F1-score | Mean AC | STD | |||||||||
| TTP Features Only | All Features | TTP Features Only | All Features | TTP Features Only | All Features | 10-forld Cross Validation | ||||||||
| TTP Features Only | All Features | TTP Features Only | All Features | |||||||||||
| KNN | 68.00 | 64.00 | 64.00 | 83.00 | 64.00 | 83.00 | 55.16% | 3.86 | 79.30 | 3.96 | ||||
| DT | 60.00 | 85.00 | 59.00 | 83.00 | 59.00 | 83.00 | 55.68% | 4.78 | 84.92 | 3.14 | ||||
| RF | 72.00 | 91.00 | 69.00 | 90.00 | 69.00 | 90.00 | 65.75% | 5.77 | 91.82 | 2.94 | ||||
| SVM | 64.00 | 84.00 | 60.00 | 83.00 | 81.00 | 83.00 | 54.77% | 6.38 | 82.87 | 3.98 | ||||
| NB | 49.00 | 78.00 | 44.00 | 77.00 | 43.00 | 77.00 | 38.80% | 7.31 | 73.81 | 5.55 | ||||
Table 9.
Assigning flat weights.
| Step | Description |
| Input and Output | As in Table 5. |
| Load dataset | As in Table 5. |
| Feature group extraction | As in Table 5 |
| Feature matrix standardization | (a)Apply z-score normalization to all columns in X using a standard scaler: X_scaled = Standardize(X) (b) Ensure each feature has zero mean and unit variance before weighting. |
| Apply manual flat weights | (a) Define weighting rules: - TTP-related features: weight = 1 - Contextual features (country, sector, industry): weight = 3 (b) For each feature f in F, apply the corresponding multiplier to the standardized matrix: If f ∈ contextual features → multiply column X_scaled[:, f] ×= 3 Else → multiply column X_scaled[:, f] ×= 1 (c) Return the resulting manually weighted feature matrix X′. |
Table 10.
KNN model performance(per class) using manually determined flat weighting for all features.
Table 10.
KNN model performance(per class) using manually determined flat weighting for all features.
| Class | PR | RC | F1-score |
| APT_27 | 0.78 | 0.70 | 0.74 |
| APT_28 | 0.73 | 0.90 | 0.81 |
| APT_29 | 0.89 | 0.98 | 0.94 |
| APT_32 | 1.00 | 0.33 | 0.50 |
| APT_34 | 1.00. | 0.88 | 0.94 |
| APT_35 | 0.96 | 1.00 | 0.98 |
| APT_37 | 0.88 | 1.00 | 0.94 |
| APT_41 | 0.67 | 0.60 | 0.63 |
| APT_44 | 0.95 | 0.88 | 0.92 |
| APT_45 | 0.92 | 0.79 | 0.85 |
Table 11.
ML model performance metrics using manually determined flay weighting for all features.
| ML Algorithm | Weighted PR | Weighted RC | Weighted F1-score | Mean AC | STD | ||||
| 10-Fold Cross validation | |||||||||
| KNN | 89.00 | 88.00 | 88.00 | 91.95 | 2.58 | ||||
| DT | 85.00 | 83.00 | 83.00 | 84.92 | 3.14 | ||||
| RF | 91.00 | 90.00 | 90.00 | 91.82 | 2.94 | ||||
| SVM | 91.00 | 90.00 | 90.00 | 90.80 | 3.30 | ||||
| NB | 80.00 | 78.00 | 78.00 | 76.12 | 4.67 | ||||
Table 12.
KNN model performance using rarity-based weightings for TTP features and pre-determined flat weighting for the attack target features.
Table 12.
KNN model performance using rarity-based weightings for TTP features and pre-determined flat weighting for the attack target features.
| Class | PR | RC | F1-score |
| APT_27 | 0.67 | 0.80 | 0.73 |
| APT_28 | 0.87 | 0.90 | 0.89 |
| APT_29 | 0.94 | 0.96 | 0.95 |
| APT_32 | 0.67 | 0.33 | 0.44 |
| APT_34 | 1.00 | 0.94 | 0.97 |
| APT_35 | 0.96 | 1.00 | 0.98 |
| APT_37 | 1.00 | 1.00 | 1.00 |
| APT_41 | 0.73 | 0.80 | 0.76 |
| APT_44 | 0.98 | 0.93 | 0.95 |
| APT_45 | 0.82 | 0.72 | 0.82 |
Table 13.
ML model performance metrics using arity-based weightings for TTP features and pre-determined flat weighting for the attack target features.
Table 13.
ML model performance metrics using arity-based weightings for TTP features and pre-determined flat weighting for the attack target features.
| ML Algorithm | Weighted PR | Weighted RC | Weighted F1-score | Mean AC | STD | ||||
| 10-Fold Cross-validation | |||||||||
| KNN | 91.00 | 91.00 | 90.00 | 92.59 | 2.68 | ||||
| DT | 84.00 | 83.00 | 83.00 | 84.92 | 3.14 | ||||
| RF | 91.00 | 90.00 | 90.00 | 91.82 | 2.94 | ||||
| SVM | 94.00 | 94.00 | 94.00 | 92.20 | 2.60 | ||||
| NB | 83.00 | 82.00 | 82.00 | 78.80 | 4.48 | ||||
Table 14.
Manual testing of the KNN model.
| Threat Actor ID | Classification Accuracy |
| APT_27 | 0.80 |
| APT_28 | 0.80 |
| APT_29 | 1.00 |
| APT_32 | 0.40 |
| APT_34 | 1.00 |
| APT_35 | 1.00 |
| APT_37 | 0.80 |
| APT_41 | 0.80 |
| APT_44 | 1.00 |
| APT_45 | 1.00 |
| Average | 0.86 |
Table 15.
Mean AC across TTP ranges using three KNN models.
| TTP Count Range | Number of Samples in the Input Dataset | Mean AC (3-fold Cross-Validation) | ||
| Unweighted TTP Features Only | Rarity-Based Weighted TTP Features Only | Rarity-Based Weighted TTP features and s with Flat Weighted Attack Target Features | ||
| 1-3 | 265 | 0.615 | 0.623 | 0.868 |
| 4-6 | 274 | 0.463 | 0.504 | 0.785 |
| 7-9 | 145 | 0.359 | 0.365 | 0.710 |
| 10-13 | 68 | 0.399 | 0.413 | 0.617 |
| 14-17 | 16 | 0.311 | 0.189 | 0.567 |
| 18+ | 15 | 0.533 | 0.600 | 0.533 |
Table 16.
Comparison with other relevant work.
| Study | IOC | Malware | TTP | Attack Target Data | ML Algorithms | Highest Threat Actor Attribution Accuracy |
| Duan et al., 2024 | ✓ | ✓ | ✓ | ✓ | Heterogeneous graphs | 54.42% |
| Kida & Olukoya, 2023 | ✓ | RF, SVM, NB. K Means clustering | 89% | |||
| Xiao et al., 2024 | ✓ | ✓ | ✓ | Heterogeneous graphs | 83.2% | |
| Irshad & Basit Siddiqui, 2023 | ✓ | ✓ | ✓ | ✓ | RF, DT, SVM | 96.00% |
| This study | ✓ | ✓ | KNN, DT, RF, SVN, NB | 93.19% |
Disclaimer/Publisher’s Note: The statements, opinions and data contained in all publications are solely those of the individual author(s) and contributor(s) and not of MDPI and/or the editor(s). MDPI and/or the editor(s) disclaim responsibility for any injury to people or property resulting from any ideas, methods, instructions or products referred to in the content. |
© 2025 by the authors. Licensee MDPI, Basel, Switzerland. This article is an open access article distributed under the terms and conditions of the Creative Commons Attribution (CC BY) license (http://creativecommons.org/licenses/by/4.0/).
Copyright: This open access article is published under a Creative Commons CC BY 4.0 license, which permit the free download, distribution, and reuse, provided that the author and preprint are cited in any reuse.


