Submitted:
10 November 2025
Posted:
11 November 2025
You are already at the latest version
Abstract
In light of the increasing complexity and heterogeneity of global compliance regimes, recent research has emphasized the necessity of enhancing organizational compliance capabilities as a strategic lever to mitigate enterprise risk exposure. Kawtar and Khadija highlighted that effective compliance governance correlates positively with operational resilience and regulatory adaptability, particularly in volatile markets. Building upon this foundation, the present study investigates how variations in compliance maturity translate into quantifiable reductions in both the frequency and timing of major risk events within multinational corporations. Drawing on a cross-industry sample of 21 enterprises from the manufacturing, telecommunications, and financial services sectors, a Compliance Maturity Index (CMI) is developed using the two-parameter logistic model within the Item Response Theory framework. Governance configuration paths leading to risk suppression are subsequently identified through fuzzy-set Qualitative Comparative Analysis (fsQCA), and the causal relationships are validated using hierarchical Bayesian Logit models and Cox proportional hazards models, consistent with the causal inference strategy proposed by Bley et al. Empirical analysis reveals that incremental improvements in compliance maturity are associated with a 32% decline in major compliance violations and a 22% increase in third-party partner satisfaction ratings. Among the identified configurations, the most robust governance pathway—characterized by elevated CMI, rigorous external audits, active senior management participation, and comprehensive digital dashboard coverage—exhibits a configuration consistency of 0.86 and coverage of 0.61. This configuration also achieves a pooled hazard ratio of 0.63, indicating delayed onset of compliance failures. These findings underscore the critical role of compliance maturity as a mediating mechanism within risk governance architectures and provide evidence-based guidance for designing resilient compliance strategies in complex operational environments.
Keywords:
compliance maturity
; fsQCA
; hierarchical Bayesian
; event incidence
; governance configuration
1. Introduction
Global compliance regulations have become increasingly stringent in recent years. At the same time, multinational corporations face growing complexity in cross-border operations. Under these conditions, a critical challenge in organizational governance is how to accurately measure compliance capabilities and translate them into tangible risk mitigation outcomes. However, traditional compliance assessments remain limited. They often rely on static scoring methods and fail to account for the dynamic mechanisms through which governance capabilities reduce risk. These approaches also lack systematic analysis of how multiple governance factors interact to form effective configurations. In this context, compliance maturity should no longer be viewed merely as an isolated capability indicator. Instead, it functions as a key intermediary that activates governance performance and strengthens risk control mechanisms. Therefore, there is a growing need for a new analytical framework—one that combines measurability, transferability, and causal interpretability. Such a framework should link governance structures, resource allocation, and risk response strategies. It must also address the limitations of prior research, including fragmented indicators, one-dimensional models, and a lack of configurational thinking. This study responds to that need by proposing an integrated approach that connects compliance maturity with governance pathways and risk outcomes.
2. Research Design
2.1. Research Framework and Hypotheses
To systematically explore how compliance maturity translates into risk reduction through organizational configuration mechanisms, this study constructs a multi-level research framework integrating three phases: measurement construction, configuration identification, and causal evaluation. It emphasizes deriving governance feature combinations from latent variable scales and testing their explanatory power for risk event occurrence rates. First, based on the two-parameter model (2PL) within Item Response Theory (IRT), the Compliance Maturity Index (CMI) is defined. A latent hierarchical sequence is constructed using dual-dimensional parameters of item discrimination and difficulty, while controlling for equivalence differences across industries [1]. Second, fuzzy set qualitative comparative analysis (fsQCA) is employed to determine whether governance variables—including "senior management involvement, collaborative network density, audit intensity, and digital management tools"—form sufficient condition combinations under specific configurations. Finally, a hierarchical Bayesian Logit model is coupled with a Cox proportional hazards model to analyze the relationship between configurations and the frequency/timing of risk events, forming a complete causal inference chain. Based on this logic, the following core hypotheses are proposed: H1: Higher compliance maturity levels lead to more significant risk mitigation; H2: High CMI effectively suppresses risk events only under specific configuration combinations.
2.2. Sample Selection and Data Collection
To ensure the study's scalability and representativeness across horizontal industry comparisons and vertical risk evolution, the sample encompasses three major sectors: manufacturing, telecommunications, and financial services. The final dataset includes annual compliance audit records, governance structure documents, and major risk event notification logs from 21 multinational corporations. The specific industry and geographic distribution is shown in Table 1. The sampling strategy employed a multi-stage nested screening approach. The first stage identified independent operating entities with compliance disclosure obligations over the past five years that had not undergone mergers or acquisitions, using public databases such as UNCTAD and Bloomberg. The second stage integrated industry association data and secondary audit materials to perform structured recoding and supplementation of governance variables. Data collection primarily employed a hybrid approach of "governance questionnaire coding + document mining + risk event chain annotation." Cross-source data standardization was completed prior to CMI construction to ensure item homogeneity in IRT parameter estimation [3]. Sensitive variables such as external audit deficiencies and event trigger times underwent de-identification calibration. Risk event labels were validated through double-blind consistency checks, achieving a κ coefficient of 0.84. To support subsequent modeling, all data were uniformly formatted into a firm-year structure as the foundation for variable operationalization.
2.3. Variable Design and Operationalization
The variable design in this study adheres to the principle of multidimensional hierarchical matching and is operationalized in accordance with the requirements for causal modeling identifiability. The dependent variables focus on two dimensions: the probability of occurrence and the timing of major financial misconduct events, which are used to construct the Logit risk function and Cox proportional hazards model, respectively. Event coding follows the "major violation events (e.g., financial restatements, anti-corruption investigations, audit failures)" standard under the GICS industry classification, assigned as a binary variable and a time variable [4]. Partner satisfaction is incorporated as an external governance perception indicator, derived from the standardized mean of third-party industry ratings and questionnaire scores. The core explanatory variable is the Compliance Maturity Index (CMI), estimated via the IRT-2PL model. This continuous latent variable ranges from 0 to 1, reflecting an organization's overall capability across 15 governance items. Configuration condition variables were designed as fuzzy set variables per fsQCA requirements, including senior management involvement, collaborative network density, external audit frequency, and digital dashboard coverage. All were normalized to 0–1 via quantile calibration. Control variables encompassed firm size (log employee count), industry dummy variables, and regional risk indices, embedded as random effects under hierarchical structures in the multilevel Bayesian model [5].
3. Research Methodology
3.1. IRT-2PL Model Construction
To achieve a structured quantitative representation of corporate compliance governance capabilities, this study constructs a Compliance Maturity Index (CMI) based on the two-parameter logistic model (2PL) within Item Response Theory (IRT). The 2PL model simultaneously estimates item discrimination parameters (α) and difficulty parameters (β), enabling the derivation of each respondent's (enterprise's) position on the latent ability dimension θ within a Bayesian posterior framework [6]. Its core formal expression is as follows:
where denotes the response probability of enterprise j on governance item i, represents the discrimination parameter of item i, is the difficulty parameter, and indicates the compliance capability level of enterprise j. The model construction employs a joint maximum likelihood and expectation maximization estimation strategy. It incorporates DIF (Differential Item Functioning) tests to assess equating bias across industry groups and validates the scale's discrimination power in the medium-to-high capability range through information function distribution curves [7]. Item coding sources were structured extraction from governance documents and expert review. The designed dimensions encompassed four key areas: "Senior Management Involvement," "Process Standardization," "External Oversight," and "Information Transparency," ensuring latent variable θ possesses a governance-semantic interpretive space.
3.2. fsQCA Configuration Analysis
fsQCA employs a direct calibration method to map the multi-path mechanism of "CMI—governance factor configuration—low risk," converting Compliance Maturity Index (CMI), Top Management Involvement (TMI), Collaborative Network Density (CND), External Audit Intensity (EAI), and Digital Dashboard Coverage (DKC) into fuzzy set membership degrees μ ∈ [0,1]. Anchors are jointly determined by sample quantiles and regulatory thresholds, with cross-industry equivalence calibrated using prior IRT-DIF test results [8]. Based on this, a truth table is constructed using case frequency and consistency thresholds to resolve contradictory rows and finite diversity. Intermediate solutions are obtained via directional expectations, forming interpretable simplified terms. Necessary and sufficient condition tests follow standard subset relationship metrics:
where denotes case k's membership in configuration X, denotes its membership in the "low-risk" outcome set, and k is the case index. To facilitate subsequent metrological testing, configuration scores and path dummy variables will be input as hierarchical/interaction terms in hierarchical Bayesian models and as time-varying covariates in Cox models. The analytical workflow and variable interfaces are visualized in Figure 1.
3.3. Hierarchical Bayesian Model
To map "CMI-configurations" to violation occurrence frequency while avoiding small-sample overfitting, a hierarchical Bayesian Logit model was designed. This model partially aggregates at the enterprise and industry levels while explicitly incorporating IRT measurement uncertainty and fsQCA path scores into linear prediction terms [9]. The model structure is:
where denotes the critical violation indicator for firm i in year t; derives from the IRT-2PL posterior (reflecting measurement error via multiple sampling); represents the fsQCA configuration score/virtual term; denotes control variables; , , denote firm, industry, and year random effects, respectively. To achieve partial aggregation across industries, a hierarchical prior is set for the CMI effect:
Coefficients adopt weak prior information (e.g., β ~ N(0,52), σ ~ half-Cauchy(0,2.5)), using HMC/NUTS sampling. Convergence and model validity are ensured via ≤ 1.01, effective sample size, and posterior prediction tests. To interface with Cox models, posterior samples of the linear predictor are input as time-varying covariates.
3.4. Cox Proportional Hazards Model
To further elucidate the mechanism by which compliance maturity and governance configurations influence the "time to occurrence" of non-compliance events, a time-to-event analysis framework based on the Cox proportional hazards model is constructed. This framework focuses on the time-dependent effects of CMI levels and fsQCA path variables within the "high-risk window" [10]. Unlike frequency modeling, this section examines the delayed nature of risk triggering. Therefore, a Cox model using partial likelihood estimation is employed to model the risk trigger rate, expressed as:
where denotes the conditional hazard function for firm i at time t, represents the baseline hazard function, and incorporates time-dependent CMI posterior estimates, configuration state dummy variables, control terms, and firm-level time-varying covariates. To capture intertemporal dependencies, a rolling window interpolation strategy is designed to extract lagged responses for CMI and fsQCA composite measures. The temporal covariate structure, illustrated in Figure 2, employs a bidirectional dynamic covariate injection mechanism to distinguish temporal tension between prior governance improvements and immediate audit exposure.
Additionally, a frailty term vi~Gamma(θ,θ) captures firm-level unobserved heterogeneity, and a joint posterior path with the linear predictor ηit is constructed to integrate causal pathways across models. Ultimately, the model outputs survival functions , risk ratio estimates, and time-dependent sensitivities to support evaluations of CMI improvement trajectories and intervention window strategies.
4. Empirical Analysis
4.1. CMI Measurement Results
Dual-parameter estimation results for 15 governance indicators using the IRT-2PL model show that item discrimination parameters (α) cluster between 0.86 and 2.12, with a mean of 1.41, indicating strong overall scale discrimination. Difficulty parameters (β) range from −0.78 to 1.63, covering the capability spectrum from basic to advanced compliance levels. The item information function distribution shown in Figure 3 indicates that measurement precision peaks within the CMI range of 0.4 to 0.85, meeting the requirements for identifying high-maturity pathways in subsequent models. Cross-industry DIF tests revealed marginal deviations (p<0.05) for only two indicators between manufacturing and financial firms, with all others passing equivalence tests. This ensures CMI's transferability across three industries. Post-hoc estimates show continuous distributions of enterprise CMI scores, with marginal reliability at 0.78—meeting high-dimensional latent variable modeling requirements. Further grouping tests revealed that for each quintile increase in CMI, the annualized occurrence rate of non-compliance events in the corresponding enterprise sample decreased by an average of 32%, while partner satisfaction scores increased by an average of 22%. This provides a stable foundation of explanatory variables for subsequent fsQCA path analysis and Cox risk response modeling.
4.2. fsQCA Analysis Results
Based on fsQCA analysis, three low-risk sufficient condition paths with high consistency and coverage were identified. Path A ("High CMI × Strong External Audit × Senior Management Involvement × Full Digital Dashboard Coverage") demonstrated optimal performance with a consistency of 0.86 and an original coverage of 0.61, indicating its ability to effectively explain the governance mechanism combinations of most low-risk sample enterprises. Path B exhibits "Moderate-High CMI × Extremely High Collaborative Network Density × Moderate Audit Frequency," demonstrating governance capabilities that partially compensate for insufficient CMI under enhanced network embeddedness. Path C is characterized by "High CMI × Low Collaborative Density × Extremely Strong External Audit," revealing the independent robustness of audit intensity in the absence of horizontal governance coordination. All paths passed necessary condition analysis, with high CMI and external audit intensity serving as shared core conditions. This further validates that CMI's indirect impact on risk mitigation requires configuration mediators to take effect. As shown in Figure 5, the path mapping diagram clearly presents the intersection structure and distribution weights of the three configuration types within the sample space, providing a basis for defining path variables in subsequent hierarchical Bayesian and Cox models.
4.3. Risk Impact Effect
After integrating fsQCA paths and CMI indicators into hierarchical Bayesian and Cox models, results show that firms in the "High CMI + Path A" group exhibit significantly lower major violation incidence than other groups. The average Logit regression coefficient is −1.73 (95% CI: −2.41, −1.05), with a combined hazard ratio HR = 0.63, indicating a dual suppression effect of configuration on both risk frequency and velocity. Specifically, in time-to-event analysis, Path A correspondingly delayed the average trigger time for violation events by approximately 8.2 months, demonstrating that high-maturity governance mechanisms possess a risk lag effect. Although Path B exhibited limited control effects on frequency (HR≈0.81), it contributed to extending event timelines, indicating that collaborative networks can mitigate sudden risk fluctuations. Path C exhibits short-term suppression under high-frequency audit constraints, making it suitable for scenarios with dense regulatory triggers. The "Risk Impact Path Distribution Map" in Figure 4 further illustrates the dual-dimensional risk reduction characteristics (frequency-time) across the three paths. Samples for Path A cluster in the low-frequency, long-cycle quadrant, forming a relatively stable risk response structure. This result validates that CMI's risk mitigation effect requires embedding within specific configurations, reinforcing the chained mechanism of "maturity-path-effectiveness."
5. Conclusions
The structural measurement of compliance maturity and configuration-based path identification provide a practical governance framework for multinational enterprises to mitigate risks. By integrating IRT-2PL scale construction, fsQCA pathway identification, and hierarchical Bayesian modeling, this study validates the applicability and robustness of the "maturity-configuration-outcome" causal chain across multiple industries. Pathway A's dual-dimensional reduction capability in frequency and timeliness particularly highlights the mediating value of configuration mechanisms. However, the sample coverage remains imbalanced in terms of industry and geographic distribution, limiting its extrapolation to extreme events or policy disturbance scenarios. The model's depiction of dynamic evolutionary relationships among governance elements also requires further refinement. Future research may incorporate time-series fsQCA or dynamic Bayesian networks to expand path-response evolution modeling. Simultaneously, integrating non-structural variables such as internal incentive mechanisms and governance culture into modeling could enhance the multidimensional interpretive framework for governance configurations and strengthen its guidance for risk management strategies in high-uncertainty environments.
References
- Hu,L. GPU Computing Resource Allocation and Prediction Based on Machine Learning Algorithms. Applied and Computational Engineering 2025, 176, 79–86. [Google Scholar] [CrossRef]
- Bley K, Pappas I, Strahringer S. A Configurational Approach to Maturity Model Development–Using fsQCA to Build a Multiple-Pathway Maturity Model[J]. Communications of the Association for Information Systems 2024, 54, 75–132. [Google Scholar] [CrossRef]
- Li W, Liu R, Sun L, et al. An investigation of employees’ intention to comply with information security system—a mixed approach based on regression analysis and fsQCA[J]. International Journal of Environmental Research and Public Health 2022, 19, 16038. [Google Scholar] [CrossRef] [PubMed]
- Rahman M, M. Data Analytics for Strategic Business Development: A Systematic Review Analyzing Its Role in Informing Decisions, Optimizing Processes, And Driving Growth[J]. Journal of Sustainable Development and Policy 2025, 1, 285–314. [Google Scholar] [CrossRef]
- Kawtar B, Khadija B. The Impact of Risk Management Efficiency on Organizational Performance in State-Owned Enterprises and the Mediating Ef-fect of Supply Chain Maturity: Evidence from Morocco[J]. Qubahan Academic Journal 2025, 5, 405–428. [Google Scholar] [CrossRef]
- Abbasi S, Sıcakyüz Ç, Gonzalez E D R S, et al. A systematic literature review of logistics services outsourcing[J]. Heliyon 2024, 10. [Google Scholar]
- Leoni L, Ferraro S, Cantini A, et al. MaMoReS: a robust tool for evaluating supply chain resilience through systematic literature and network analysis[J]. Applied Sciences 2024, 14, 9568. [Google Scholar] [CrossRef]
- Khan H U, Khan R A, Alwageed H S, et al. AI-driven cybersecurity framework for software development based on the ANN-ISM paradigm[J]. Scientific Reports 2025, 15, 13423. [Google Scholar]
- Lu X, Taghipour A. A Review of Supply Chain Digitalization and Emerging Research Paradigms[J]. Logistics 2025, 9, 47. [Google Scholar] [CrossRef]
- Darbanian F, Brandtner P, Falatouri T, et al. Data analytics in supply chain management: A state-of-the-art literature review[J]. Operations and Supply Chain Management: An International Journal 2024, 17, 1–31. [Google Scholar]
Figure 1.
Configuration Analysis Flow and Causal Path Mapping Diagram.
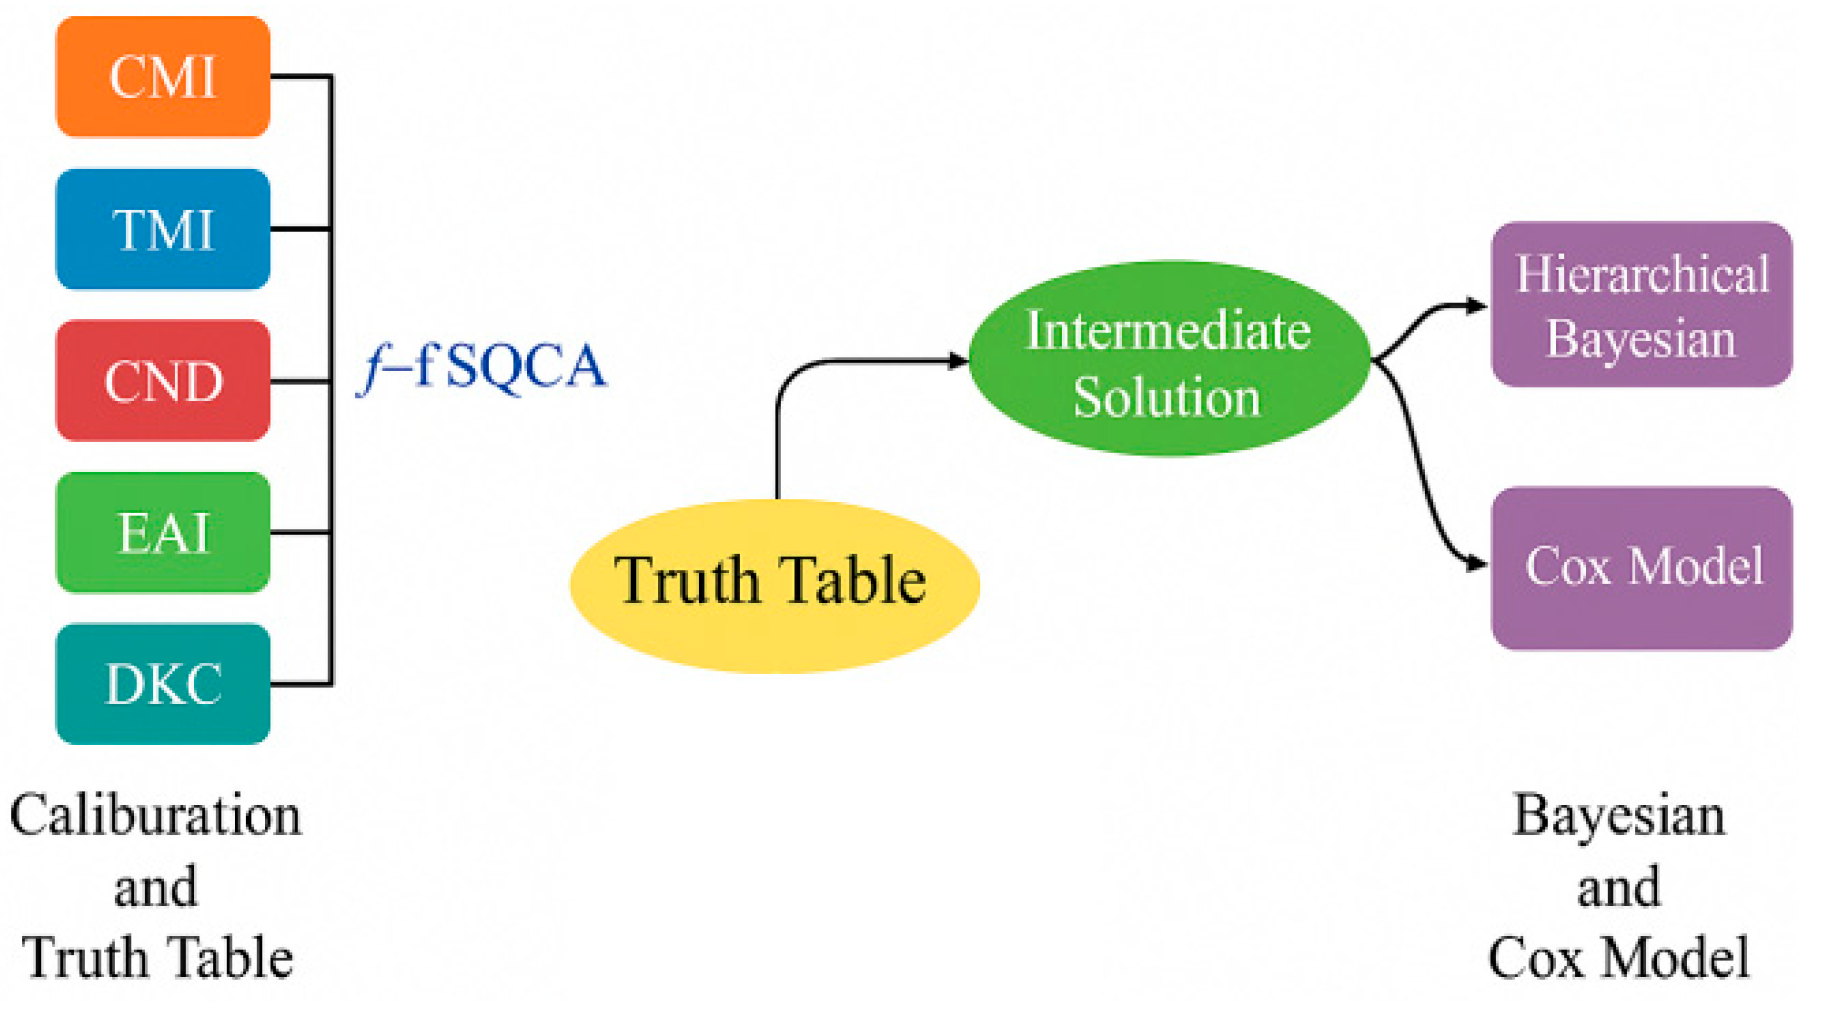
Figure 2.
Cox Modeling Structure Diagram.
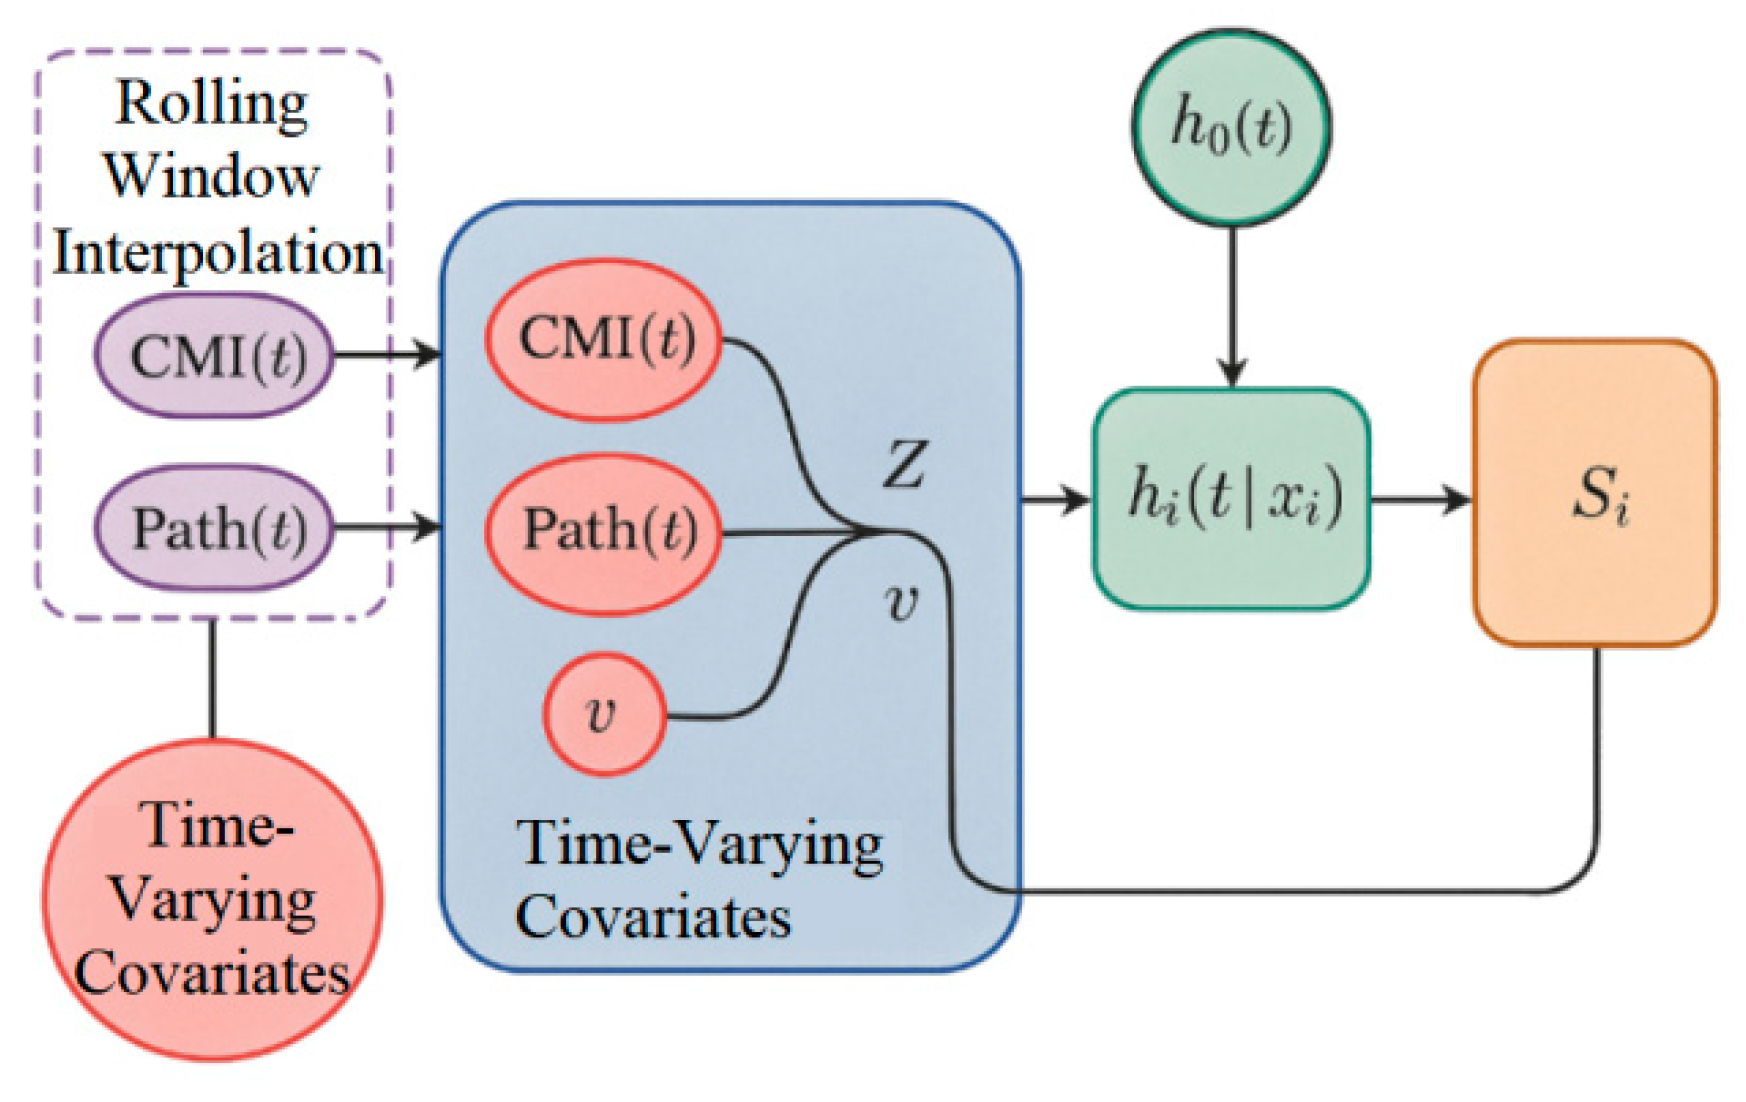
Figure 3.
CMI Item Parameters and Measurement Interval Information Strength Map.
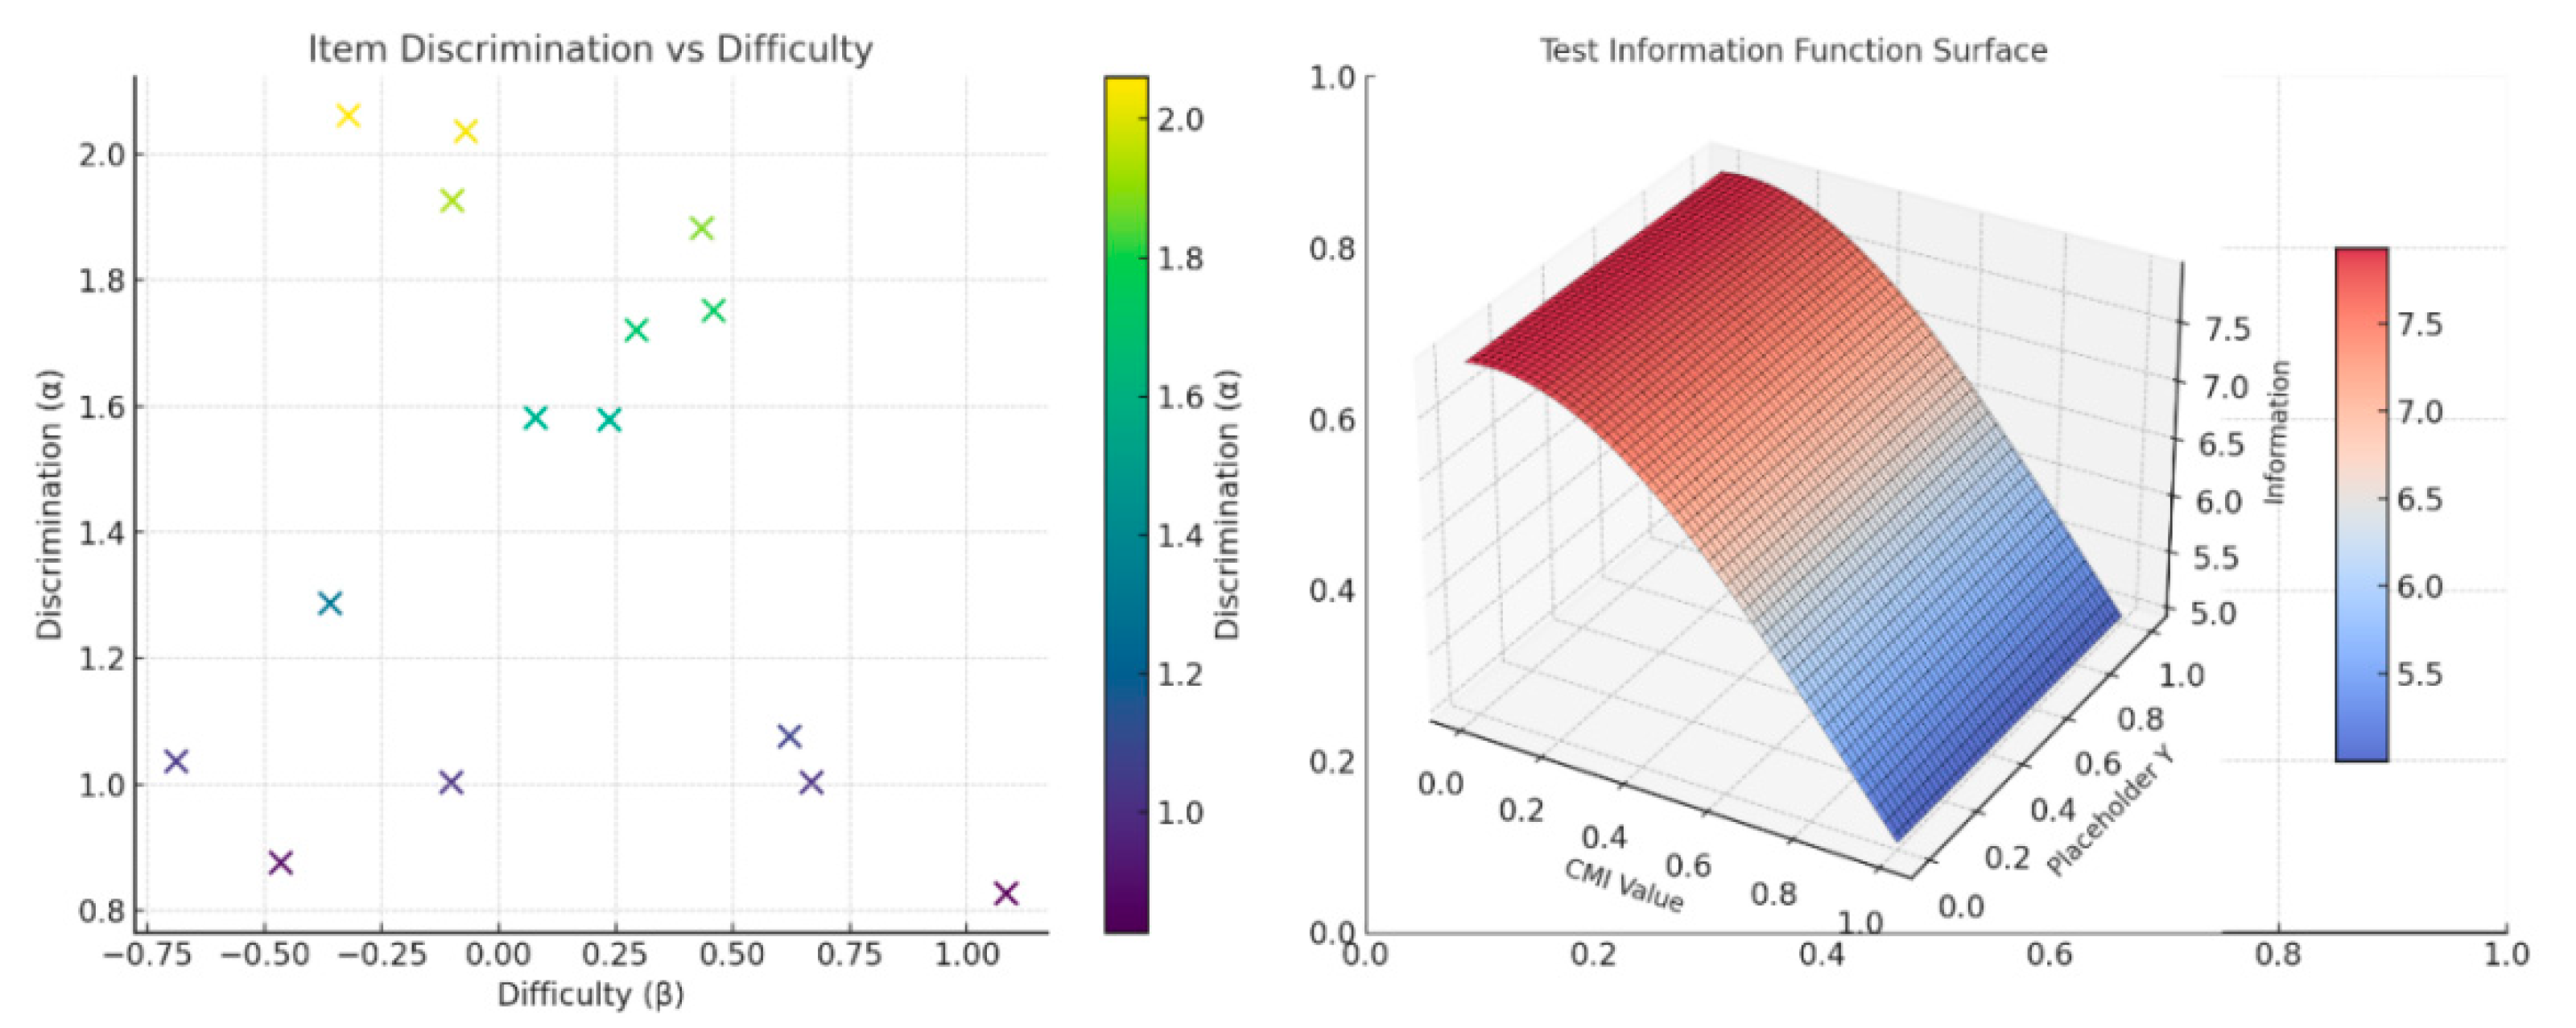
Figure 4.
Dual-Dimensional Risk Mitigation Mapping of Violation Frequency and Trigger Timing Across Three fsQCA Pathways.
Figure 4.
Dual-Dimensional Risk Mitigation Mapping of Violation Frequency and Trigger Timing Across Three fsQCA Pathways.


Table 1.
Distribution of Sample Enterprises by Industry and Data Source Composition.
| Industry Type | Number of Companies | Primary Data Source | Risk Event Sample Size |
| Manufacturing | 8 | Annual reports, compliance audit reports, industry white papers | 53 |
| Telecommunications Industry | 6 | Operator Governance Information Repository, Compliance Announcement Platform | 41 |
| Financial Services | 7 | Financial Regulatory Disclosure System, Corporate Governance Questionnaire | 49 |
Disclaimer/Publisher’s Note: The statements, opinions and data contained in all publications are solely those of the individual author(s) and contributor(s) and not of MDPI and/or the editor(s). MDPI and/or the editor(s) disclaim responsibility for any injury to people or property resulting from any ideas, methods, instructions or products referred to in the content. |
© 2025 by the authors. Licensee MDPI, Basel, Switzerland. This article is an open access article distributed under the terms and conditions of the Creative Commons Attribution (CC BY) license (http://creativecommons.org/licenses/by/4.0/).
Copyright: This open access article is published under a Creative Commons CC BY 4.0 license, which permit the free download, distribution, and reuse, provided that the author and preprint are cited in any reuse.


