Submitted:
13 September 2025
Posted:
15 September 2025
You are already at the latest version
Abstract
Using 42 overseas projects of Company H from 2017 to 2022 as the sample, this study constructs the Project Lifecycle Compliance Index (PLCI) and Cross-Departmental Coordination Index (CPI). It employs a multilevel difference-in-differences (DiD) approach combined with firm/country fixed effects to identify the causal effects of the integrated compliance framework. The Cox proportional hazards model is used to characterize delay risk. Causal Forest analysis further captures country and project complexity heterogeneity effects, while XGBoost + SHAP explains the importance of predictive features for non-compliance. Results indicate: a 37.5% reduction in violation rates, a hazard ratio (HR) for delay probability decreasing to 0.71 (95% CI: 0.62–0.82), an average reduction of 22.3% in delivery delays, and a 31.6% improvement in CPI. This demonstrates that synergistic risk governance and financial compliance significantly enhance cross-border project performance.
Keywords:
project lifecycle
; difference-in-differences
; Cox proportional hazards model
; causal forest
; multinational compliance
1. Introduction
Prior studies have explored the role of compliance and governance mechanisms in mitigating project and financial risks. Li (2025) emphasized that asset-level compliance significantly boosts the effectiveness of financial risk control in complex investment environments. Martin et al. (2025) conducted a comparative study on ESG and financial metrics between China and the UK construction industries, highlighting the relevance of governance quality in performance outcomes. Rely (2025) analyzed how tax consultants and corporate governance jointly shape tax compliance in manufacturing sectors. Oso et al. (2025) proposed a risk-opportunity model for managing uncertainties in cross-border healthcare projects. Khidoyatov (2025) focused on the regulatory structuring of transnational contracts amid shifting legal landscapes. These studies provide valuable insights, yet they often address single dimensions of compliance or operate at firm-level granularity. This research builds upon these foundations by integrating lifecycle compliance and coordination indicators into a unified causal evaluation framework tailored to project-level governance.The objective is to systematically reveal how integrated compliance governance mechanisms contribute to enhancing cross-border project performance across multiple dimensions, including but not limited to delivery delays, violation occurrences, and interdepartmental coordination efficiency.
2. Causal Evaluation Model and Methodology for Cross-Border Project Risk Governance and Financial Compliance
2.1. Research Hypotheses
The core hypothesis posits that introducing a comprehensive compliance governance mechanism will significantly reduce the probability of non-compliance and delay risks in cross-border projects by enhancing the Project Lifecycle Compliance Index (PLCI) and Cross-Departmental Collaboration Index (CPI)[1] .
Hypothesis 1: After the compliance framework is implemented, the compliance performance of the treatment group projects will outperform that of the control group.
Hypothesis 2: This effect will be more pronounced in countries with high institutional friction or in high-complexity projects.
Hypothesis 3: Enhanced cross-departmental coordination mediates the improvement in performance. All hypotheses are tested within a project-country multilevel panel structure.
2.2. Indicator Construction
The Project Lifecycle Compliance Index (PLCI) is constructed based on key compliance indicators (KRIs/KPIs) across project phases, employing a two-parameter item response theory (2PL-IRT) model combined with hierarchical factor analysis for weight estimation. The Cross-Departmental Collaboration Index (CPI) extracts structural features from three process networks—approval, communication, and work orders—and calculates normalized cohesion and intermediary centrality[2] . Table 1 lists the classification of key indicators and variable types.
2.3. Research Methodology
2.3.1. Multilevel Difference-in-Differences (DiD) Model
To identify the net effect of the integrated compliance framework on project non-compliance and delay risks before and after its implementation, To evaluate the comprehensive impacts of compliance governance—not only on project delay risks but also on non-compliance occurrences and coordination effectiveness—this study constructs a multi-level difference-in-differences (DiD) model nested at the country level. The treatment group consists of projects where the framework was implemented, while the control group comprises projects where it was not implemented, with the division based on the month of policy implementation. The model incorporates country fixed effects, year fixed effects, and country-year interaction terms to control for differences in macro-institutional contexts across countries and their dynamic changes. The specifications are as follows:
Where denotes the observed indicator (e.g., non-compliance rate or delay risk) for project in country at time; is the treatment group dummy variable, valued 1 for projects under the compliance framework; is the time dummy variable, valued 1 for post-implementation; represents the country fixed effect; denotes the year fixed effect; indicates the country year interaction term; and is the error term. The core coefficient thus measures the net effect of policy implementation. The modeling structure is illustrated in Figure 1, with projects nested within the country level to ensure the treatment effect is identifiable across countries.
2.3.2. Cox Proportional Hazards Model
To capture the time-sensitive impact of compliance governance on the probability of delivery delays in cross-border projects, the study employs a Cox proportional hazards model. This model estimates the intensity of the compliance framework's influence on delay risk using project duration as the reference. The model specifications are as follows:
where denotes the conditional hazard function for project at time , represents the baseline hazard function under unobserved variables, and denote the project lifecycle compliance index and cross-departmental coordination index respectively, indicates the control variable matrix (e.g., country risk level, project scale), and is the corresponding effect parameter. Parameter estimation employs the biased likelihood method. The model satisfies the proportional hazards assumption as verified by the Schoenfeld residual test. Fragility adjustments are introduced to account for intra-project cluster correlations, enhancing the robustness and interpretability of risk estimates.
2.3.3. Causal Forest Method
The Causal Forest model estimates conditionally heterogeneous responses to compliance interventions in cross-border projects, handling nonlinear treatment effects under high-dimensional covariate structures. The model targets the conditional average treatment effect (CATE) as defined below:
Here, denotes the treatment effect for individual under the feature vector . respectively represent the outcome variables under intervention and non-intervention conditions, including continuous responses such as violation rates and days of delay. constitutes the set of covariates encompassing national institutional friction, project scale, cycle, and CPI levels. The model generates asymptotically unbiased estimates through sample weighting and repeatable partitioning strategies, providing evidence for enhanced treatment effects within high institutional risk groups[3] .
2.3.4. XGBoost+SHAP Interpretation Model
The binary classification model predicting violations employs the XGBoost framework, utilizing weighted boosting trees to optimize the objective function and demonstrating robust performance under imbalanced data conditions. The model loss function is defined as follows:
where denotes the actual label of sample , represents the model's predicted probability, is the log-loss function, and is the regularization term for the th tree. Sample features encompass multidimensional inputs including PLCI, CPI, compliance records, and country governance indicators. Based on the trained model architecture, the SHAP explanation mechanism is introduced to construct Shapley value decomposition paths. This quantifies the marginal contribution of each feature to prediction outcomes, ensuring the violation classification model possesses interpretability and policy adaptability[5] .
3. Empirical Analysis
3.1. Data and Samples
The research sample covers 42 overseas infrastructure projects of Company H from 2017 to 2022, spanning 16 countries and regions. It constructs a three-level nested imbalanced panel data structure: "Country-Project-Month." Raw data sources include internal audit score records, work schedule execution tables, contract change logs, and project ERP systems. Core metrics encompass compliance scores, delay days, budget deviation rates, and violation frequency. Compliance intervention implementation timepoints were determined by policy document annotation dates. CPI calculations leveraged network structure features extracted from process logs of communications, approvals, and work orders. Data preprocessing simultaneously removed missing values and outliers to ensure the integrity and temporal consistency of the model input structure.
3.2. Descriptive Statistics
To comprehensively understand variable characteristics and sample distribution, descriptive statistics were conducted on core independent variables, dependent variables, and control variables. Results are presented in Table 2.
The Project Lifecycle Compliance Index (PLCI) exhibits a mean of 0.514 and a standard deviation of 0.103 within the sample, indicating a certain degree of dispersion in compliance levels across projects. The CPI distribution exhibits a slight left skew, indicating that the majority of projects still concentrate their cross-departmental coordination intensity within the low-to-medium range.Both the skewness and kurtosis of violation frequency and delay risk exhibit right-skewed, long-tailed characteristics, indicating that a small subset of high-risk projects significantly influence the overall distribution shape. Kurtosis, in particular, captures the tail heaviness of the data, further supporting the presence of extreme outlier behaviors. Control variables such as cost deviation and national compliance risk maintain relatively symmetrical and flat distributions, suggesting lower dispersion and fewer extreme values.
3.3. Empirical Findings
3.3.1. Multilevel DiD Results Analysis
The results of the multilevel double difference regression are shown in Table 3. The coefficient for the treatment variable Treatment×Post in the violation rate model is -0.375, significant at the 1% level. This indicates that the implementation of the integrated compliance framework reduces the violation rate per unit time by approximately 37.5%, consistent with the summary statistics. In the delay risk model, the treatment coefficient is -0.285, significant at the 5% level, demonstrating that the policy intervention has a significant positive effect on suppressing project delays. Furthermore, the mean delivery delay in the treatment group decreased from 13.0 days to 10.1 days, representing a reduction of 22.3%. The CPI coefficient is significantly negative, confirming the structural role of the coordination mechanism in risk governance[7] . Figure 2 further illustrates the changes in average non-compliance between the treatment and control groups before and after the policy. The intervention group shows a clear downward trend, validating Hypothesis 1 (the effectiveness of policy intervention).
3.3.2. Cox Proportional Hazards Model Results
The Cox proportional hazards model further validated the mitigating effect of compliance governance on delivery delays.[9] The hazard ratio (HR) for the treatment group was 0.71, with a 95% confidence interval of [0.62, 0.82], as shown in Figure 3, indicating a 28.9% reduction in the probability of delay per unit time. Among the covariates, both PLCI and CPI risk ratios were below 1 (0.68 and 0.75, respectively), indicating that higher project compliance levels and stronger cross-departmental coordination correlate with lower delay risk. Conversely, Cost_Dev% and National_RI exhibited HR values above 1, revealing that cost volatility and institutional uncertainty remain primary sources of delay pressure. These results strongly support Research Hypothesis 2 (PLCI/CPI exert a significant negative effect on delay risk).
3.3.3. Heterogeneity-of-Effects in Causal Forest
The causal forest model identified heterogeneity in policy intervention effects across different contexts, as shown in Table 4.
In the subsample of countries with high governance risk, CATE was -0.412, showing the most significant effect. For long-cycle projects (≥30 months), CATE reached -0.387, while for short-cycle projects it was only -0.196, indicating a marked difference. The greater the investment scale and project complexity, the stronger the marginal effect of compliance interventions. These results fully support Research Hypothesis Three: an integrated compliance framework yields more pronounced governance effects under high institutional friction and project complexity[10] .
3.3.4. XGBoost Violation Prediction
The XGBoost model employs violation occurrence as a binary dependent variable, integrating project characteristics, compliance indicators, and country-level governance variables to construct a machine learning classifier. Results are presented in Table 5.
The model achieved an accuracy of 87.6% on the test set with an AUC of 0.932, demonstrating stable predictive performance. After applying the SHAP interpretation method, PLCI, CPI, and Cost_Dev% emerged as the most interpretable variables, with average Shapley values of 0.148, 0.127, and 0.096, respectively. Figure 4 displays the SHAP feature importance ranking, showing that CPI's marginal explanatory power in violation prediction approaches that of PLCI. This further supports its mechanism role in risk governance and indirectly validates the mediating path hypothesis in Research Hypothesis 3.
4. Conclusions
The systematic introduction of compliance frameworks demonstrates broad-based risk governance effectiveness in cross-border projects, with specific improvements observed in violation reduction, delivery punctuality, and coordination enhancement, with lifecycle indicators and coordination mechanisms playing pivotal roles within multi-layered structures. Multi-model validation enhances robustness and adaptability in identification, while heterogeneity effects reveal amplification mechanisms of intervention policies in high-institutional-friction and complex project environments.This study has achieved significant breakthroughs in method integration and empirical identification. The data panel structure used includes 42 cross-border projects and a total of 1632 monthly observation records. The sample size is highly representative in research on project governance and compliance assessment, and also meets the model estimation requirements of multi-level double difference and survival analysis. Previous studies have also used samples of similar magnitude for causal identification. Therefore, the current sample has sufficient empirical reasoning. However, the study also acknowledges that if the sample further covers more diverse types of countries and institutional change scenarios in the future, it will help enhance the external generalizability of the conclusions.
References
- Li, Y. Asset Compliance Boosts the Effectiveness of Financial Risk Prevention and Control[J]. Economics and Management Innovation, 2025, 2, 76–87. [Google Scholar]
- Martin H, Zhou Y, Raman R. Financial Metrics and Environment, Social, Governance (ESG) Performance: A Cross Border Comparison of China and the UK Construction Industries[J]. Buildings, 2025, 15, 1236.
- Rely, G. The Role of Tax Consultants and Corporate Governance in Improving Tax Compliance of Manufacturing Firms[J]. Jurnal Ilmiah Akuntansi Kesatuan, 2025, 13, 373–384. [Google Scholar]
- Oso O B, Alli O I, Babarinde A O, et al. Navigating cross-border healthcare investments: A risk-opportunity model for emerging markets[J]. Engineering and Technology Journal, 2025, 10, 3805–3832.
- Hu, L. (2025). Hybrid Edge-AI Framework for Intelligent Mobile Applications: Leveraging Large Language Models for On-device Contextual Assistance and Code-Aware Automation. Journal of Industrial Engineering and Applied Science, 3(3), 10-22.
- Khidoyatov, M. Legal Aspects of Structuring Cross-Border Transactions in The Context of Changing International Regulation[J]. The American Journal of Political Science Law and Criminology, 2025, 7, 14–21. [Google Scholar]
- Kaya M, Shahid H. Cross-Border Data Flows and Digital Sovereignty: Legal Dilemmas in Transnational Governance[J]. Interdisciplinary Studies s in Society, Law, and Politics, 2025, 4, 219–233.
- Adeniran I A, Abhulimen A O, Obiki-Osafiele A N, et al. Strategic risk management in financial institutions: Ensuring robust regulatory compliance[J]. Finance & Accounting Research Journal, 2024, 6, 1582–1596.
- Rozman A, G. The power of data: Transforming compliance with anti-money laundering measures in domestic and cross-border payments[J]. Journal of Payments Strategy & Systems, 2024, 18, 253–260. [Google Scholar]
- Sari W, Hussien M. Corporate governance and financial performance in Sharia banks: An analysis in Islamic finance[J]. Cebong Journal, 2024, 3, 75–84.
Figure 1.
Multi-level DiD Modeling Flowchart.
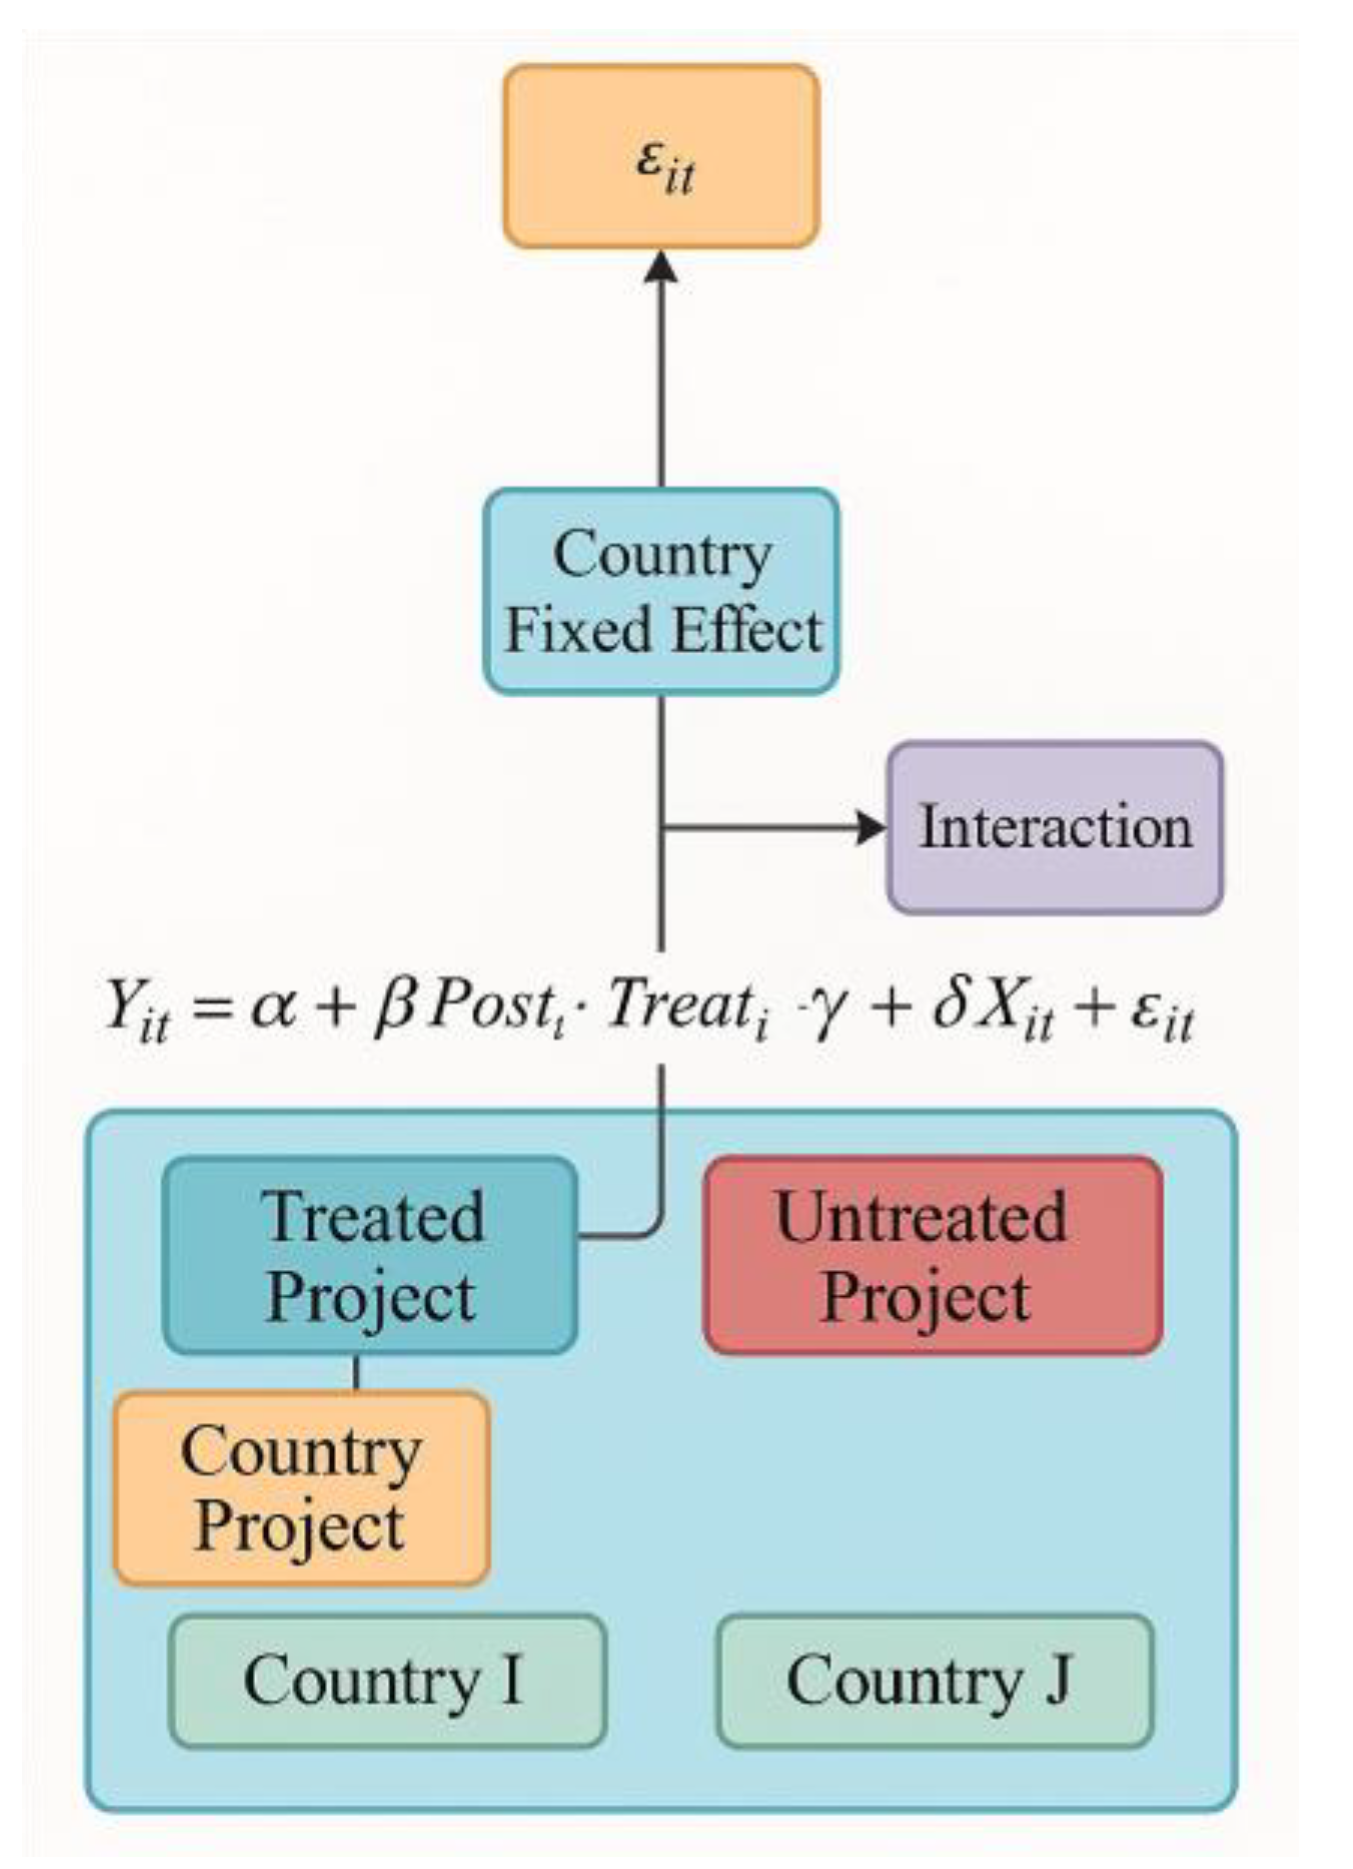
Figure 2.
Trend Chart of Mean Project Non-Compliance Rates.
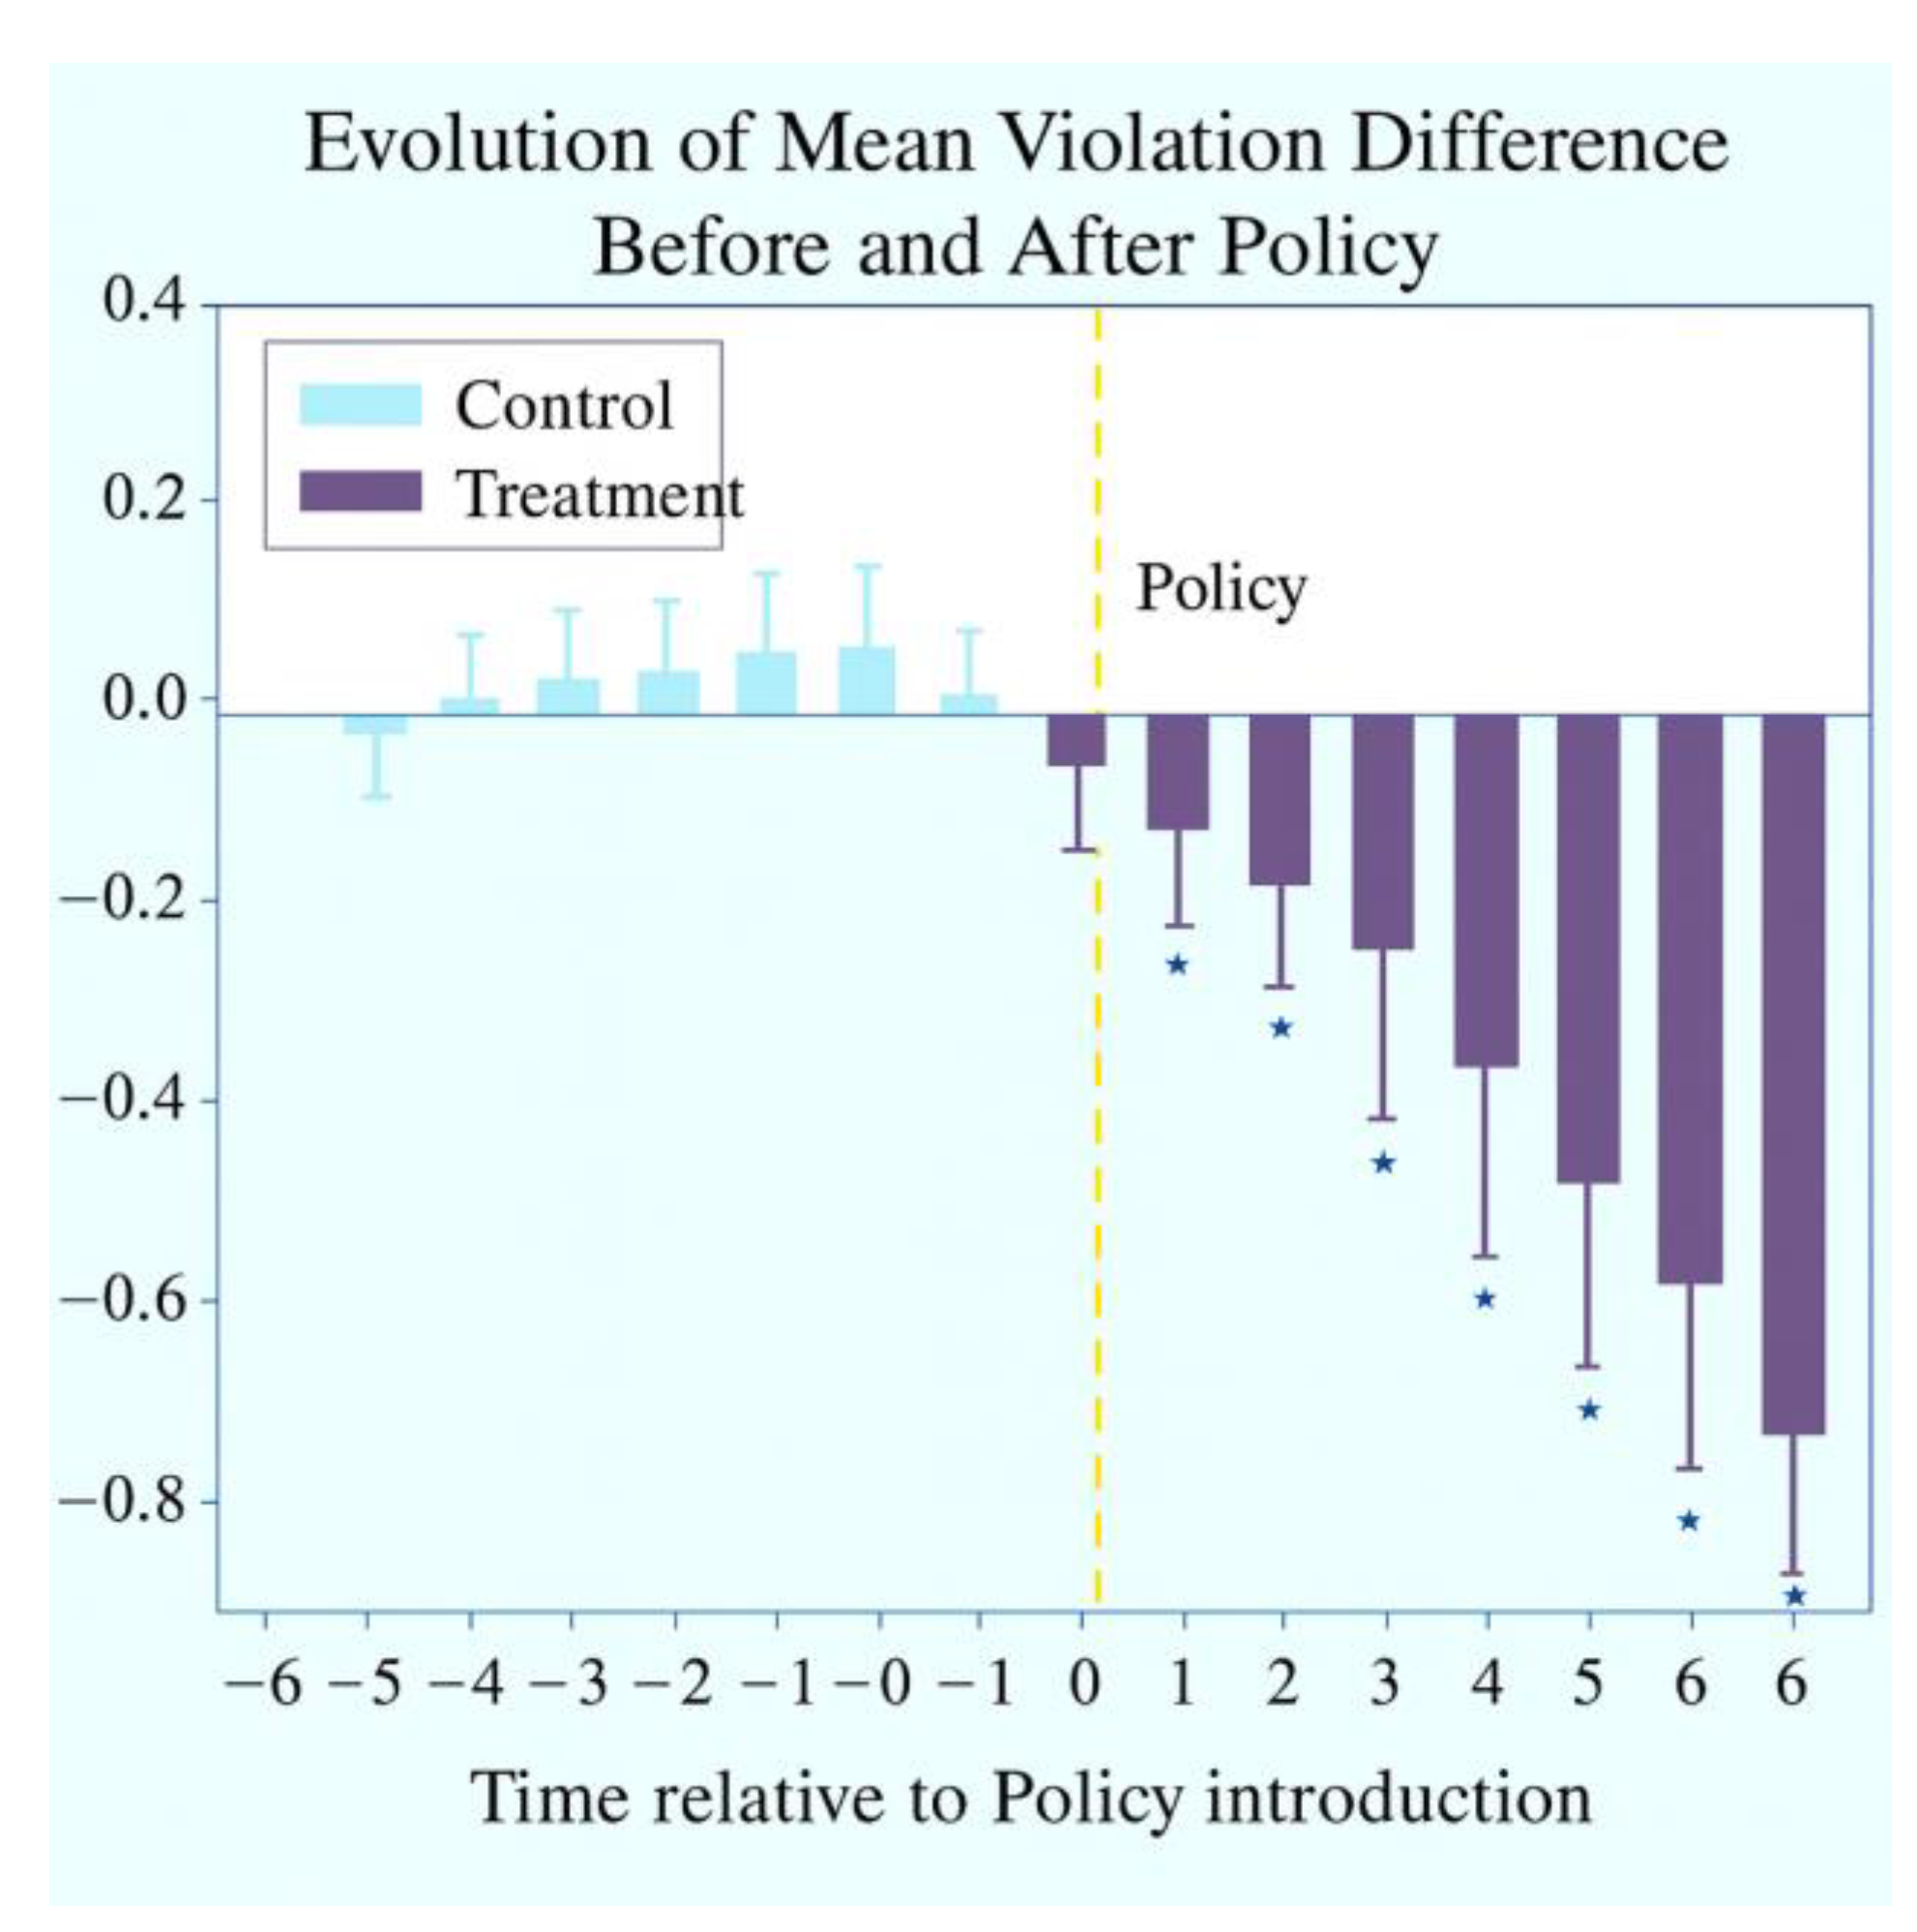
Figure 3.
HR Distribution Chart of Project Delay Risk Factors.
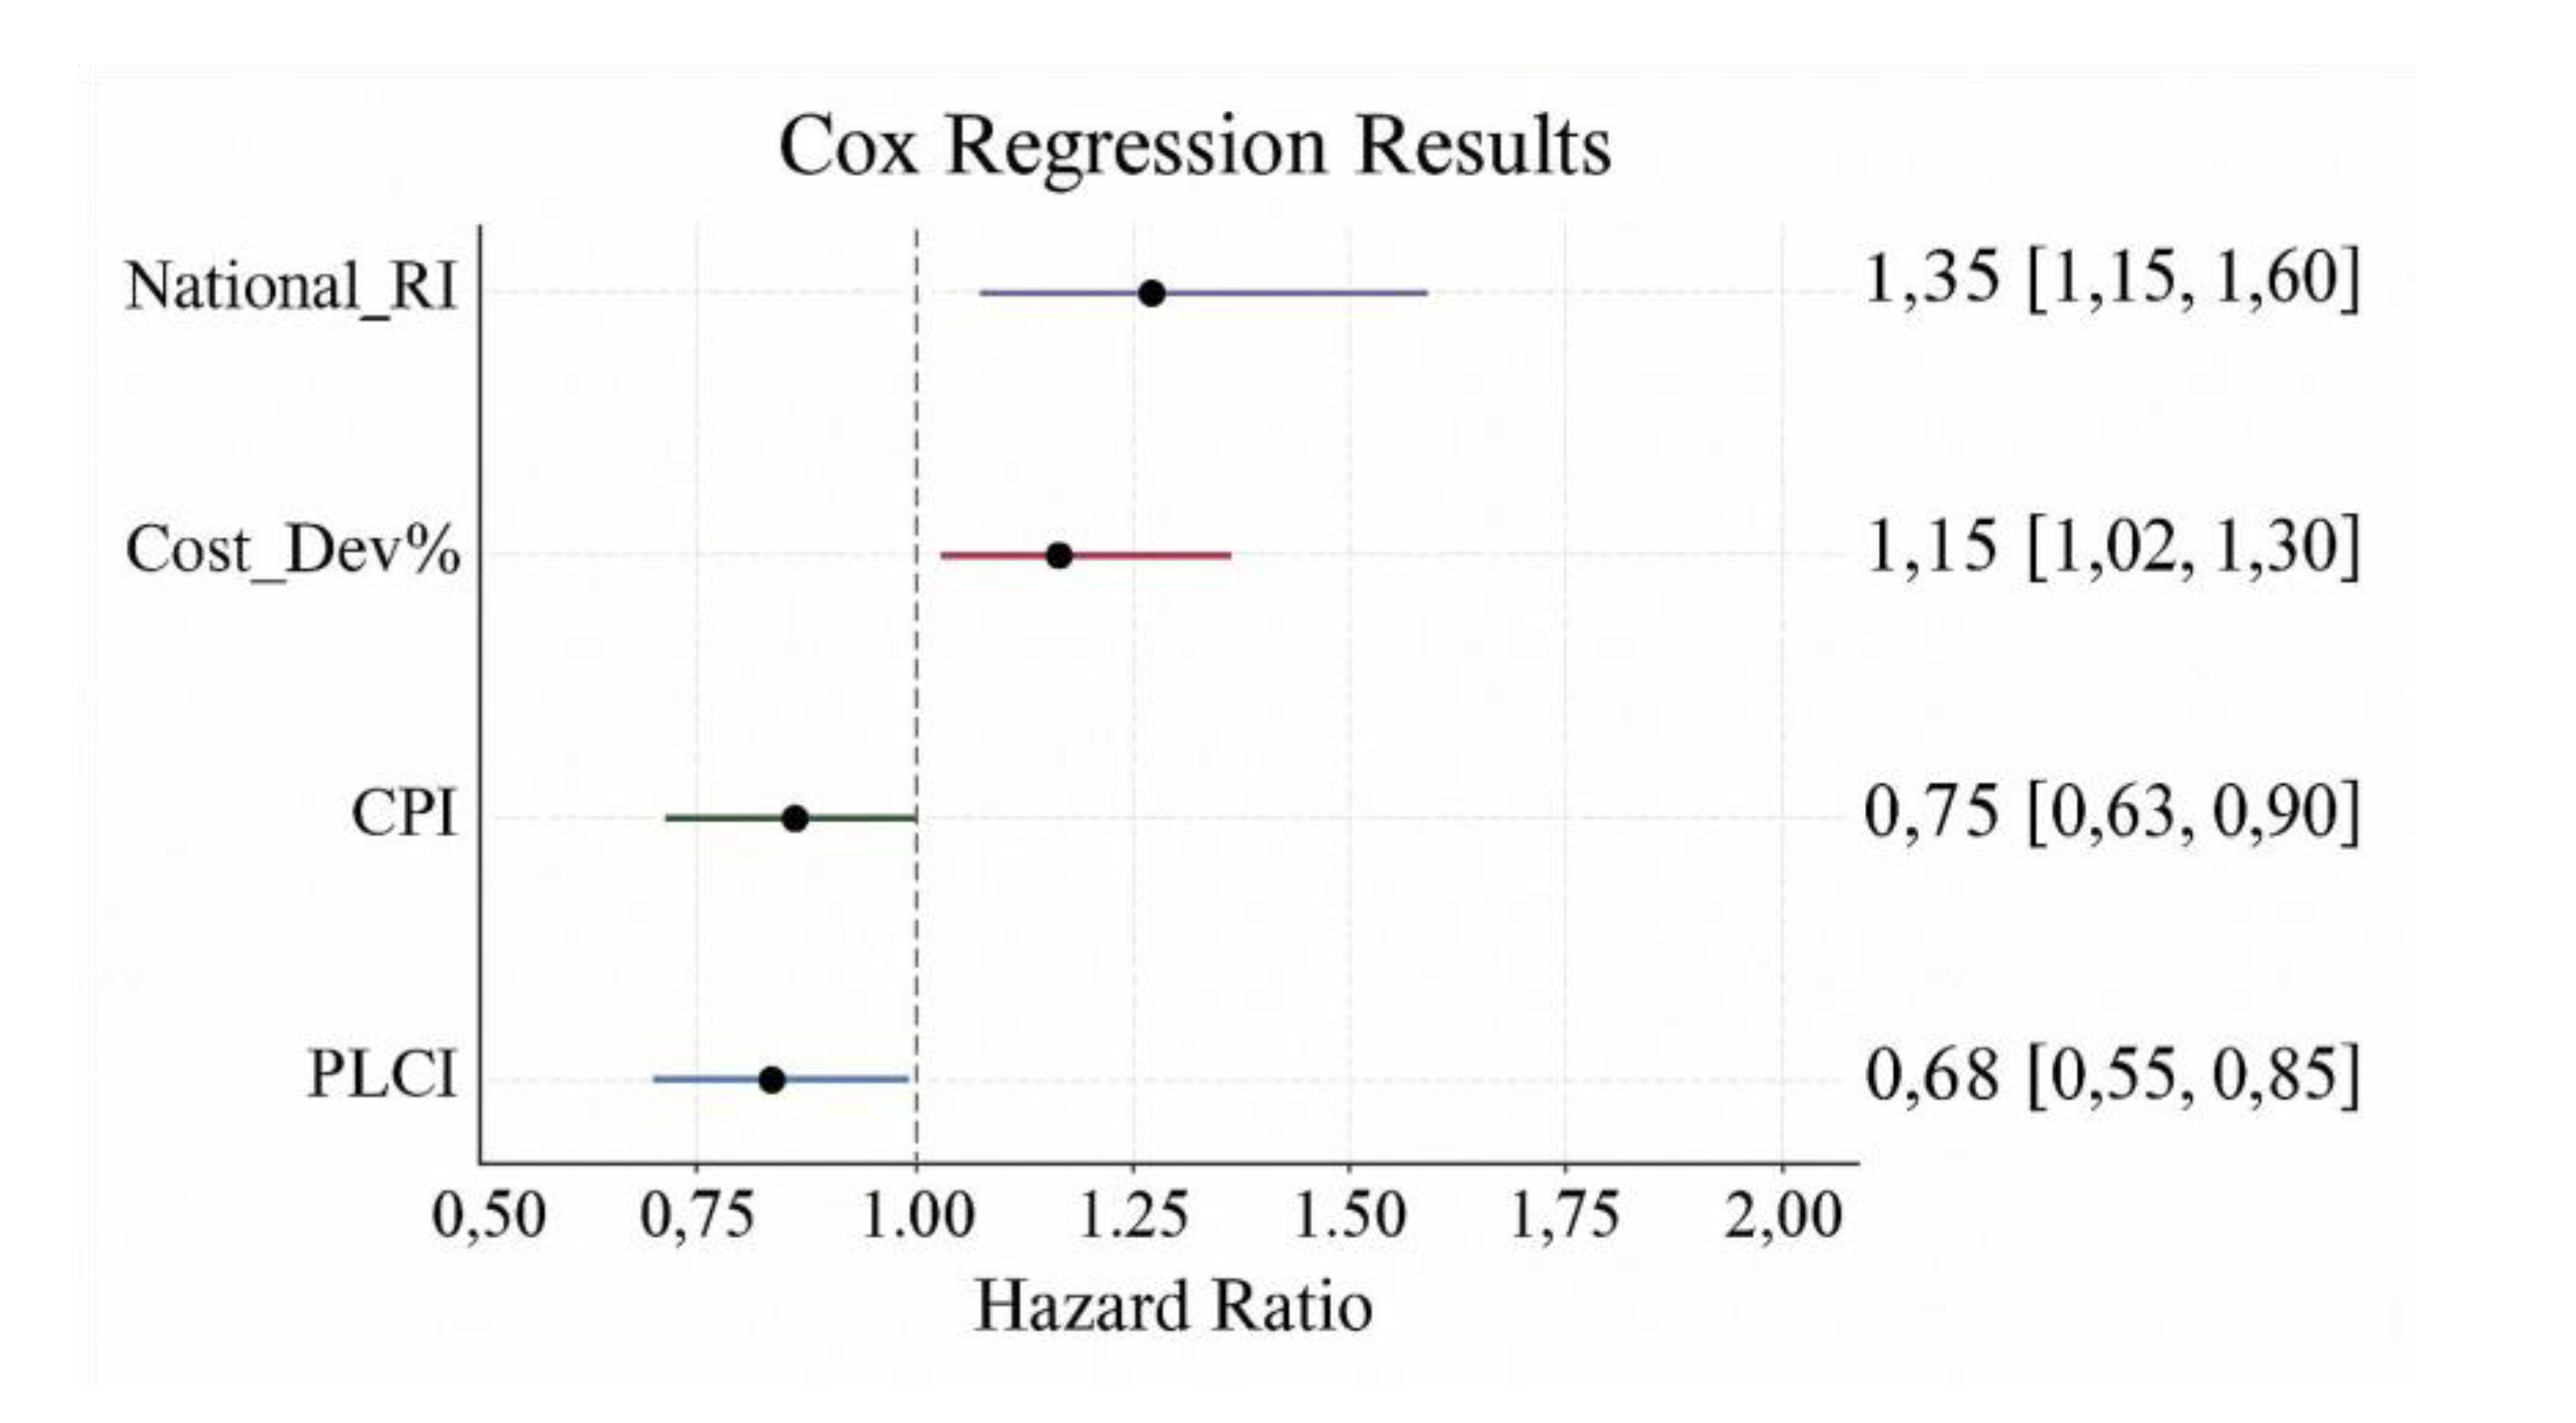
Figure 4.
Core Feature Contribution Ranking in Violation Prediction Model.
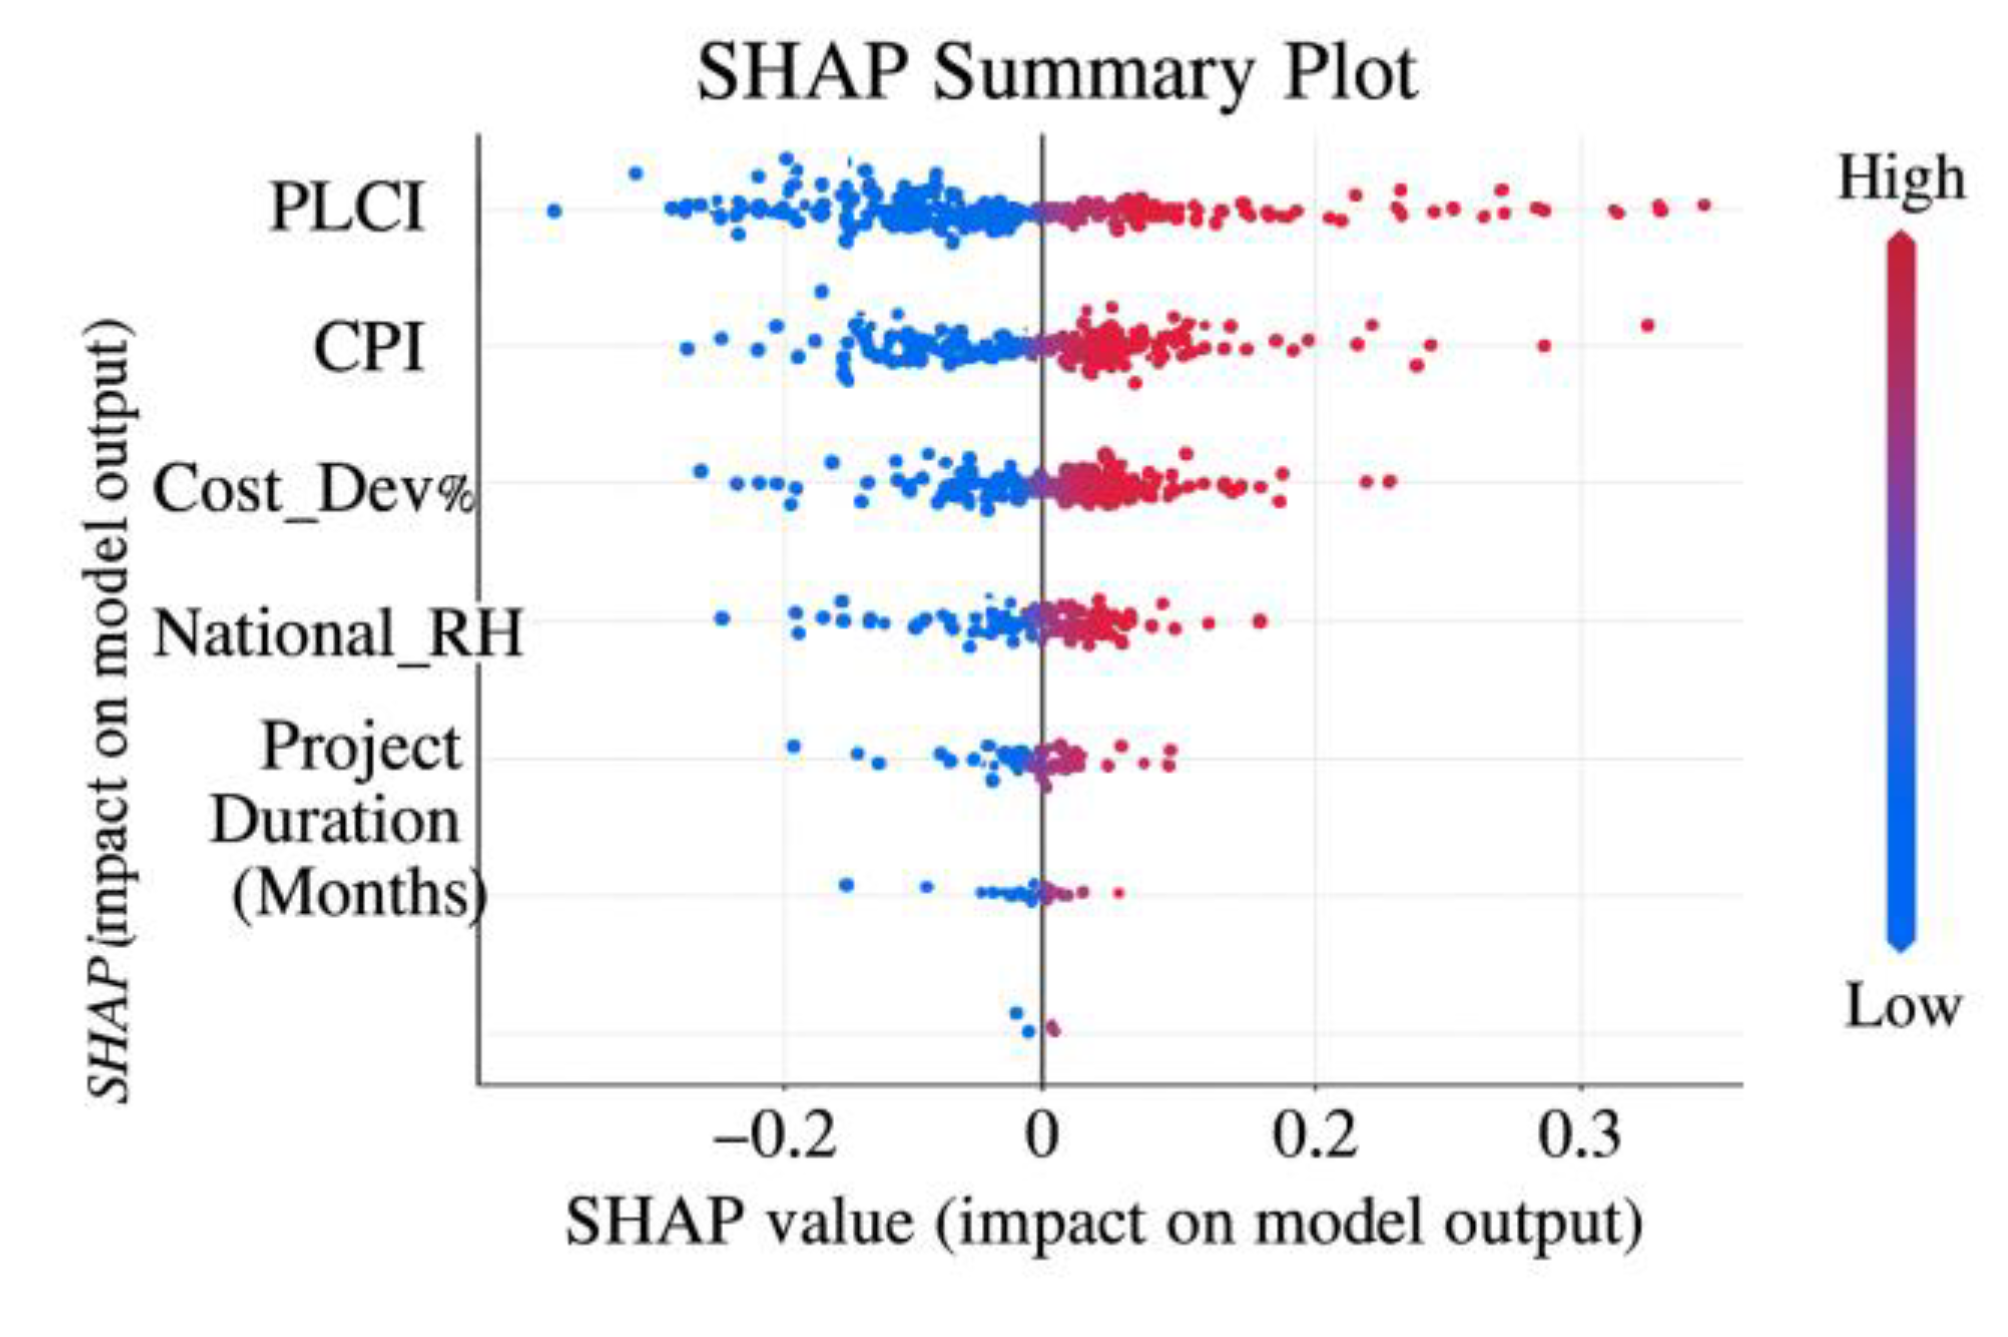

Table 1.
Project Indicator Classification and Variable Table.
| Indicator Name | Variable Type | Indicator Source and Definition | Measurement Method or Description |
| PLCI | Independent Variable | Key compliance metrics during the project cycle (e.g., audit deductions, process deviations) | 2PL-IRT + Hierarchical Factor Scores |
| CPI | Independent Variable | Degree of Network Collaboration Across Communication/Approval/Work Order Processes | Structural centrality + weighted by cohesion |
| Violation | Dependent Variable | Number of violations per unit time (minor + major) | Monthly cumulative count |
| Delay_Risk | Dependent Variable | Delivery Delay Risk (as defined in Cox model) | Estimated Days/HR |
| Cost_Dev% | Control Variable | Percentage Deviation Between Actual and Budgeted Costs | Actual Cost / Budget Cost - 1 |
| National_RI | Control Variable | National Governance/Compliance Risk Level (OECD Index) | Qualitative grouping or continuous variable handling |
| Scale | Control Variables | Total Project Investment or Workforce Size | Millions of USD/Person-months |
Table 2.
Descriptive Statistics Results.
| Variable Name | N | Mean | Standard Deviation | Minimum | Maximum | Median | Skewness | Kurtosis |
| PLCI | 1632 | 0.514 | 0.103 | 0.212 | 0.789 | 0.506 | 0.12 | 2.61 |
| CPI | 1632 | 0.482 | 0.118 | 0.145 | 0.823 | 0.475 | -0.31 | 2.84 |
| Violation | 1632 | 2.317 | 1.426 | 0 | 8 | 2 | 0.87 | 3.91 |
| Delay_Risk | 1632 | 11.62 | 8.93 | 0 | 47 | 9 | 1.23 | 4.22 |
| Cost_Dev% | 1632 | 0.074 | 0.031 | -0.05 | 0.14 | 0.07 | 0.1 | 2.65 |
| National_RI | 1632 | 3.21 | 0.96 | 1 | 5 | 3 | 0.03 | 1.99 |
| Scale (USD M) | 1632 | 84.6 | 35.8 | 15.7 | 198.4 | 79.4 | 0.44 | 2.52 |
Table 3.
Multilevel DiD Model Regression Results.
| Variable | Violation (Violation Rate) | Delay_Risk |
| Treatment × Post | -0.375* | -0.285 |
| PLCI | -0.194** | -0.108* |
| CPI | -0.156** | -0.203** |
| Cost_Dev% | 0.321* | 0.291* |
| National_RI | 0.085 | 0.072 |
| Scale | -0.027 | -0.018 |
| Country Fixed Effects | Control | Control |
| Year Fixed Effects | Control | Control |
| Country × Year Interaction Effect | Control | Control |
| R² | 0.462 | 0.413 |
| N | 1632 | 1632 |
Note: , , , and , respectively, indicate significance at the 10%, 5%, and 1% significance levels.
Table 4.
Causal Forest Estimated Heterogeneous Treatment Effects (CATE).
| Subgroup Dimension | Grouping Condition | Counterfactual Average Treatment Effect (CATE) | Standard Error Std.Err | 95% Confidence Interval CI |
| Country Governance Risk | High | -0.412 | 0.058 | [-0.528, -0.296] |
| Medium | -0.247 | 0.042 | [-0.329, -0.165] | |
| Low | -0.118 | 0.061 | [-0.238, 0.002] | |
| Project Duration (months) | ≥ 30 | -0.387 | 0.049 | [-0.483, -0.291] |
| < 30 | -0.196 | 0.057 | [-0.308, -0.084] | |
| Investment Scale (million USD) | ≥ 100 | -0.341 | 0.052 | [-0.443, -0.239] |
| < 100 | -0.209 | 0.055 | [-0.317, -0.101] |
Table 5.
XGBoost Model Prediction Performance and SHAP Feature Contribution Ranking.
| Indicator Item | Numerical |
| Accuracy | 87.60% |
| AUC (ROC) | 0.932 |
| Precision | 0.861 |
| Recall Rate | 0.883 |
| F1 Score | 0.872 |
Disclaimer/Publisher’s Note: The statements, opinions and data contained in all publications are solely those of the individual author(s) and contributor(s) and not of MDPI and/or the editor(s). MDPI and/or the editor(s) disclaim responsibility for any injury to people or property resulting from any ideas, methods, instructions or products referred to in the content. |
© 2025 by the authors. Licensee MDPI, Basel, Switzerland. This article is an open access article distributed under the terms and conditions of the Creative Commons Attribution (CC BY) license (http://creativecommons.org/licenses/by/4.0/).
Copyright: This open access article is published under a Creative Commons CC BY 4.0 license, which permit the free download, distribution, and reuse, provided that the author and preprint are cited in any reuse.


