Submitted:
08 November 2025
Posted:
10 November 2025
You are already at the latest version
Abstract
The present study proposes a simple and low-cost indirect method for estimating the thickness of plates by measuring the contact time (TC) generated by the impact of a free-falling sphere. The theoretical model has been developed on Tsai approximation of Zener’s theory, which describes the dynamic interaction between the sphere and the plate taking in account the propagation of flexural waves. The methodology was validated through FEM simulations and through an extensive experimental campaign, where the contact times were measured using a simple electrical circuit. The results show excellent agreements between predicted and actual thicknesses, with relative errors below 3% for λ
Keywords:
collisions
; contact time
; impact
; contact model
; freefall
1. Introduction
The study of impact processes, particularly the collision of spheres on plates, is a crucial area of scientific investigation, with significant relevance across various fields, including civil, mechanical, aerospace, and process engineering. These impacts play a vital role in diverse industries, such as chemicals, building, electrical, recycling, and energy. At a microscopic level, collisions are a permanent occurrence during macroscopic technical processes like handling, transportation, processing, and storage of particulate solids, directly influencing both product and process quality. Examples include particle-to-particle and particle-to-wall collisions in impact crushing, apparatus charging, fluidized or spouted beds, and pneumatic conveying [1]. Beyond industrial applications, these phenomena are observed in natural contexts, such as the aggregation of particles in protoplanetary disks, as well as in astronomy and space technology, for instances impacts of spherical objects on spacecraft or collisions among space junk particles [2,3].
The term “impact” describes the process involving the collision of two or more objects. Typically, an impact is limited to collisions where the effect of both colliding bodies must be taken into account. The term “contact impact” is often used to emphasize the dynamic effects in contact phenomena. Contact impact problems are inherently nonlinear, since the actual contact surfaces are all unknown before the problem is solved. Consequently, the mathematical model of contact impact problems involves a system of nonlinear equations. Impact events are fundamentally characterized by changes in the state of motion, impulse, and energy of the colliding bodies, although momentum is conserved throughout. A key aspect of these collisions is energy dissipation, which can occur through several different mechanisms. Often, it is essential to consider the energy dissipated by elastic waves. During an impact, a pressure field develops at the contact area, generating stress waves that propagate inwards from the point of excitation. These elastic waves—including surface and body seismic waves—can transport energy, leading to a loss of kinetic energy from the system. When these waves encounter interfaces, they can be refracted or reflected, potentially returning to the contact area and causing additional energy dissipation. Understanding such energy dissipation mechanism is crucial, as it directly influences the impact behavior. This is often quantified by the so-called coefficient of restitution (CoR) which is recognized as a referred parameter for energy loss due to the motion in normal direction [8]. Several factors govern this behavior, including the material combination of the colliding bodies, their geometrical proportions (such as the ratio of sphere diameter to plate thickness), and the impact velocity. For instance, if enough kinetic energy is absorbed by the plate through elastic waves, the particle may adhere to the plate instead of rebounding [3].
Historically, various models have been developed to describe these complex interactions. The Hertzian impact theory [4] laid a foundational understanding for perfectly elastic collisions, but it generally assumes bodies of infinite dimensions and neglects energy dissipation by elastic wave propagation or viscous effects. In contrast, the Zener [5] model extended Hertz’s theory by incorporating the effect of bending, considering energy dissipation primarily through flexural waves propagating radially from the contact area. This model is particularly relevant for impacts of spheres on large, thin plates where plate bending is significant. Further refinements, such as the Koller model [6], explore further into the details of elastic wave propagation (longitudinal and transversal waves) within plates, especially in the transitional regime between thin and massive plates, where the effects of multiple wave reflections has to be investigated. The Hunter model [7] also addresses energy dissipation due to elastic body and surface waves, transporting energy away from the impact point.
Through these studies, it has become evident that the ratio of sphere diameter to plate thickness and the specific material properties of both the sphere and the plate strongly influences the energy dissipation and the resulting coefficient of restitution. Conversely, the influence of the impact velocity on the coefficient of restitution can be made comparatively negligible under certain conditions.
Impact events can be classified based on the speed at which they occur: low, high, ballistic, and hypersonic. Low-speed impact (<30 m/s) can describe situations such as a falling ball, while high-speed impact (30-250 m/s) can include a bird colliding with an airplane. Ballistic impact events include situations such as a bullet fired from a weapon at speeds greater than 250 m/s. Finally, orbital debris traveling through space at speeds up to 15 km/s is considered a hypervelocity impact event.
In the present paper only low-speed impact problems (< 10 m/s) will be addressed. In particular, an indirect method for measuring the thickness of a plate subjected to an impact with a sphere falling freely from a certain height will be developed, by measuring the so-called “contact time”. Such parameter, that indicates the duration of the contact between two solids, is influenced by several factors such as heat transfer, friction, and wear, and depends on the specific materials and interaction forces. Contact times of colliding particles can be estimated from video analysis [8]. Within FEM simulations, contact laws describe the relationship between force and displacement over time during contact. A typical application is to measure the thickness of a tank or a screen from the outside of the surface (without need to access the inside) with a good degree of accuracy, without the use of sophisticated or expensive instrumentation, but only using a striker equipped with an inexpensive accelerometer: essentially, it is a low-cost tester to measure thicknesses, usable even in hazardous environments subject to limitations. The only physical effect is sonic, based on the “noise” produced by the impact on the surface to be measured. This methodology has already produced similar low-cost and reliable instruments, developed by the some authors of this paper, in the field of analysis and monitoring of frescoes in cultural heritage environment [9].
The technique developed in the present paper is based on a recently approximation of Zener’s impact theory proposed by Tsai [10], which allows us to solve (in a closed form) the Zener nonlinear differential equation of motion. The approximate solution determines the relevant values of collision force, material displacement, velocity, and contact time. Ultimately, by applying an inverse method, it was possible to determine the thickness of the material subjected to impact based on the measured contact time. To this end, Section II develops the analytical theory on which the method is based, while Section III reports on an FEM model developed to verify the predictions of the mathematical model. Section IV describes the measurement of the impact time and the related experimental setup, and finally, Section V analyzes the results and discusses possible improvements and limitations of the method described.
2. Theory of Impacts
Hunter [7] provided the expression for the contact force, generated during the impact of a rigid spherical striker with radius b and mass m1 against a flexible plane surface of a semi-infinite solid, as a function of the relative approach “α” between the striker and the impacted surface [5], in function of the time t:
where
ν1, ν, and E1 , E are Poisson’s ratios and elasticity moduli of the impacting sphere and the impacted object, respectively. The relative approach α(t) represents the measure of the penetration of the sphere during the impact (Figure 1b).
When the sphere makes contact with the surface, α(0)=0, and then it increases with deformation. After the contact time Tc, α(t) returns to zero when the sphere detaches the surface. In particular, the trend of α(t) follows a typical curve of the elastic impact:
- 1.
- Start of impact: at t=0, we have α(0)=0;
- 2.
- Compression phase: α(t) increases with surface deformation and the simultaneous generation of contact force Fc;
- 3.
- Point of maximum compression: α(t) reaches a maximum value αmax when the relative velocity between the sphere and the surface goes to zero;
- 4.
- Decompression phase: α(t) decreases as the sphere releases elastic energy and begins to rebound;
- 5.
- End of impact: at t=Tc we have α(Tc)=0 i.e. the sphere detaches from the surface.
The contact force expression presented in (1) is an extension of the well-known Hertz contact theory, originally developed for the static contact of curved bodies [3,11]. While (1) was derived for plates with semi-infinite thickness, it is also valid for thick plates or slabs, where the time required for elastic waves to reflect from the lower surface back to the impact area is significantly longer than the contact duration.
However, as the plate thickness or impedance decreases, the contact force between the sphere and the plate diverges significantly from the predictions of Hertz theory [4]. In the case of a sphere impacting a thin plate, the force-time history is determined by combining (1) with the plate’s equation of motion [13,14]. Zener [5] derived the resulting nonlinear differential equation for a large plate, where reflections from the plate’s boundaries return to the impact area only after the contact has ended. In order to introduce dimensionless variables, it is useful the transformations
where t is the time, T is a constant with dimensions of time: and TH is the duration of the impact predicted by Hertz theory for infinitely rigid surface and is given by where v0 is the impact velocity and αm is the maximum value of the relative displacement α, and is given by . Following Zener, the nondimensionalized solution of the (1) is given by :
with the boundary conditions:
Equation (4) depends on a dimensionless constant λ, called the “inelasticity parameter” (eq. 20 in [1]):
with c’ the propagation velocity of quasi-longitudinal waves in thin plates (eq. 21 in [1]), m1 is the mass of the spherical striker, and Z is the acoustic impedance of the plate in the impacting position, given by:
with D the flexural rigidity and is defined, as usual, by , ρ the density and h the thickness of the plate.
The numerical solution of (4) is shown in Figure 2 (dashed curves) for some values of the inelasticity parameter (λ=0, 0.25, 0.5, 1.0, 1.5). The approximate solution of the (4) is derived by Tsai [10] for . In particular, the approximation with n=0.18 was chosen, which minimizes the error between the approximated curves and the numerical solution of equation (4) to approximately 7%.
where
is descripted by Muller [2]. The equation (7) is graphed in Figure 2, with continuous curves, for the same λ values used previously. Using (3) and (5), the equation (1) can be write as:
and then,
The force-time history obtained from (4) and (7) are plotted for various values of the inelasticity parameter λ in Figure 2: in cases where λ is very small, the contact-time history resembles the square of a half-period sine wave [13]. As the value of λ increases, the impact force amplitude decreases and the duration of contact is longer in the second half of the contact period.
As can be seen in the figure, the approximation used models the trend of the curves well at least up to λ=1.5. Our model starts with the equation (10), where we can note that the force-time history is equal to zero for t=0 (τ = 0) or when t=TC . In this last case,
Then, the eq. (11) is verified by , and if we use (8), we obtain:
on the other hand from (5) using the definition of TH, and (6), we can write:
and substituting D, and isolating h, we finally obtain:
Definitely, if we know TC (contact time) and v0 (impact velocity), m1 (mass), b, ν1, E1 for the striker-sphere, and ν, E, and ρ for the plate, we can obtain the thickness h of the plate.
As can be seen from (14) , the inelasticity parameter λ is inversely proportional to the second power of plate thickness. Besides, for a given impact velocity the impact force amplitude increases nonlinearly with plate thickness and mass of the striker, reaching its maximum value predicted by Hertz theory for a plate of semi-infinite thickness [15]. The maximum value of the normalized impact force decays exponentially with λ as shown in Figure 2.
The equations used to calculate the thickness h of a plate, knowing the contact time TC and the mechanical characteristics of the plate and the striker-sphere are summed in (15).
We can use the given relations to a case reported in literature, in particular the measure of Figure 3 in Akay’s experiment [15]. We have a 1.905 cm diameter acrylic ball with an impact velocity of 0.62 m/s (Table 2 in [15]) impacting on a steel plate, and it is possible to estimate the contact time in Figure 9 as TC=150 μs. Using some classical characteristics of the two materials, as in Table 1, we calculate h=1.56 mm, while in [15] it is 1.59 mm: consider that the material characteristics are not given in [15], so we relied on values found in the literature that may vary from experimental reality. There is excellent agreement between the calculated thickness and the experimental measurements reported in Akay’s experiment. Moreover λ=1.44, so also the Tsai’s condition is verified (λ<1.5).
On the other hand, this condition is quite good for our application: in the case of λ = 1.5 the thickness is less than 1 mm, and so the measure is not possible to run, for obvious reasons of fragility of the plate. If the elastic modulus of the plate is unknown, it is possible to determine it by the measure of the contact time TC and knowing the force-time history.
If we indicate with A1 the area under the (F,t) diagram, from the first impact instant and the maximum of the curve F, it is possible to demonstrate [16] that:
where b, E1, m1, ν1 are, respectively, the radius of curvature, the elastic modulus, the mass and the Poisson’s ratio of the spherical mass which strike the surface of the material to be analyzed; ν was the Poisson’s ratio of the analyzed material, and E* is given by:
3. FEM Model
To investigate the impact dynamics and contact behavior, a finite element model (FEM) of the sphere-plate system was developed. The model accounts for the material properties, geometry, and boundary conditions of both the impacting sphere and the steel plate, enabling the simulation of contact time and stress distribution during the impact event. In the context of the experiment, the contact time TC represents the duration of the physical interaction between the sphere and the plate. During this interval, the plate undergoes a forced deformation that induces vibration. The direct estimation of the contact time TC can be measured by plate displacement and deformation, while velocity and acceleration are obtained by differentiating the displacement response, but experimental tests can be affected by significant uncertainty, due to the very short duration of the phenomenon and the limitations of acquisition systems with adequate temporal resolution.
To validate the theoretical formulations of TC, a finite element model of the pendulum–plate system was developed in a drop-test configuration. The numerical model focuses on the vibrational response of the plate subjected to an impact.
In the simulations, a steel sphere (mass 3.6 g) impacted plates made of steel (AISI-SAE 1008/1010, thickness 2.56 mm) and aluminum (Al 1050, 2.96 mm thickness and aluminum alloy, 3.0 mm thickness), released from a height of 150 mm (h0) with a 90° release angle, including gravity. The mechanical properties of the materials are summarized in Table 1. An initial impact velocity of Vi=1.71 mm/s was assigned to the sphere at the collision point. The contact pair was established between the sphere and its projection surface on the plate, as interface contact area. A contact friction coefficient (µ = 0.1) was applied on the normal direction [17]. A fixed support boundary condition (zero displacement and zero slope/rotation at the boundary) was applied to the plate perimeter. The finite element models were discretized using 3D solid elements. Particular attention was paid to mesh refinement in the impact zone, in order to ensure numerical stability of the time step and accurate representation of the rapidly evolving contact interaction, as shown in Figure 3.
For the steel plate model, the discretization consisted of approximately 23,000 nodes and 19,000 elements, with an average element size of 1.0 mm. Local refinement was applied at the plate–sphere interface to better capture stress gradients and velocity changes. The aluminum plate models required a finer mesh due to the higher compliance of the material and the plate geometries. In both cases, a combination of sweep and quad-dominant meshing was adopted, with local element sizes reduced to 0.5 mm in critical regions to ensure proper resolution of stress waves.
Across all models, mesh quality checks (aspect ratio, curvature capture, and element smoothing) were applied to maintain solution accuracy. The difference in mesh density among the cases reflects the balance between computational cost and the need to correctly represent the thin-plate geometry and the high-frequency content of the impact response.
The onset of contact can be identified by the instant when the plate velocity changes from zero to a nonzero value and the contact energy becomes significant. The results show that the directional velocity of the plate along the impact axis evolves from null values (pre-impact phase) to negative values (downward motion during contact), and then changes sign during rebound. The velocity sign reversal, as shown in Figure 4, is interpreted as the effective end of the contact interval. For the steel plate, the simulated TC is in close agreement with theoretical predictions. For the aluminum plates, simulated TC values are higher, consistent with the higher compliance of the material. The numerically obtained TC aligns with the nonlinear models shown, while providing insight into the complete kinematic and energetic evolution of the striker–plate interaction. FEM simulation therefore represents a valuable complementary tool to the theoretical framework presented in Section II: by simulating the impact and extracting the contact time, it is possible to apply the analytical approach to infer plate thickness and elastic properties, even when direct physical measurement is not feasible.
4. Impact Time Measurement
In order to develop a measure of impact time, the steel, brass, and aluminum plates (15 x 30 cm) were clamped at the edges using rectangular sandwich bolted together. The structure was designed to tension the inserted metal plates and thus create a sort of “drum.”. They were placed in a baffle, as shown in the schematic of the experimental apparatus in Figure 5 and Figure 6.
The plates were impacted at their midpoints by a steel ball of 1.0-cm diameter. The steel sphere was hollow and had a threaded interior, allowing a thin, flexible electric conductor wire of negligible thickness to be connected to it. For this reason, the steel sphere was characterized separately, weighing it on a precision scale in such a way as to disregard the density-volume relationship, which in this case was not valid due to the presence of the internal threaded hole. For the investigation of the normal (low-velocity) impact behavior, the entire measuring structure, including the steel ball, was inserted into an electrical circuit of the type shown in Figure 7 in order to obtain an electrical “contact” signal on an scope between the ball impacting the plate and the plate itself, so as to measure the contact time with extreme precision. During each test, the sphere is dropped from a height h0 such that it starts to fall freely without any initial velocity and rotation. The steel sphere is released using an electromagnet (em), controlled by a switch operated by the researcher, so as not to influence the fall of the sphere in any way by introducing rotations and initial moments.
Upon dropping, the sphere falls freely until impacting on the surface of the plate arranged orthogonal to the trajectory of the falling sphere. In order to measure the contact time we used, as said, a scope to display the signal during contact between the sphere and the plate: definitely, the sphere acts as a switch. To ensure that no short-circuit occurs between the negative and the positive pole, an ohmic resistor (R) had been included in the switching circuit (see Figure 7). The experimentally measured contact time corresponds to the time during which the applied voltage is recorded at closed circuit by the scope (see Figure 8). Followed by the first impact, the sphere rebounds until reaching a maximum rebound height. Further, the sphere begins to fall again and a subsequent impact occurs on the plate. The process continues with several impacts of the sphere on the plate until the sphere has left the plate or remains motionless. To obtain accurate and reproducible results, such that measurements of the impact event is precise, in addition to the meticulous attention given to the mechanical design, construction, alignment and calibration of test rig, many tests had been carried out per series of measurements.
5. Results and Discussion
The experimental measurements and theoretical predictions of contact time were analyzed to evaluate the accuracy of the proposed indirect method for estimating plate thickness. Table 2 summarizes the experimental values of TC, the actual plate thickness (hreal), the estimated thickness using equation (14) (hestimated), the corresponding inelasticity parameter λ from equation (12), and the percentage error between the real and estimated thickness.
The comparison between experimental and estimated values demonstrates the effectiveness of the method in a variety of plate materials and thicknesses. For most cases, the estimated thickness differs by less than 3% from the actual measured thickness, which is an excellent level of precision for a low-cost, non-invasive measurement technique. For instance, in the case of the steel plate, the actual thickness was 2.56 mm, while the estimated value was 2.58 mm, corresponding to a negligible error of +0.78%. Similarly, for aluminum Type 2 with a thickness of 3.00 mm, the method achieved an error of only +0.66%. These results confirm the strong correlation between the contact time and plate thickness, validating the theoretical framework based on the Tsai approximation of the Zener model. The best performance was observed for steel and aluminum plates with medium thickness (h>2 mm and λ<1.5). In these conditions, the assumptions of the theoretical model are fully satisfied, and the sphere-plate system behaves close to the ideal conditions assumed in the derivation. Conversely, higher errors were observed for very thin plates, such as brass CW508L/CZ108 and aluminum Type 2 with h=1.50 mm and h=1.08 mm, where the error reached +18.6% and +16.66%, respectively. These deviations are primarily due to the increased flexibility and fragility of thin plates, which amplify edge effects and boundary condition sensitivities. In these cases, the inelasticity parameter exceeded the limit of validity for the Tsai approximation (λ<1.5), introducing non-linearities that were not fully captured by the model. Furthermore, localized plastic deformations may have occurred during the impact, violating the purely elastic assumption of the theoretical framework.
The inelasticity parameter λ plays a crucial role in interpreting the results. As shown in Table 2, cases with λ<1.5 exhibited reliable and consistent estimations, while those with λ>1.5 tended to deviate significantly. This confirms the theoretical prediction that the approximation is only valid within a specific range of λ. For example, in Akay’s reference experiment, where λ=1.44, the estimated thickness was 1.56 mm compared to the actual 1.59 mm, with a relative error of -1.88%. This excellent agreement validates both the mathematical approach and its practical application. However, for brass CW508L, where λ=2.85, the model largely underestimated the complexity of the system, leading to a higher discrepancy.
The relationship highlights how small variations in λ strongly affect the estimated thickness for thin plates. Therefore, accurate measurement of contact time is critical to minimize propagated errors, especially in the transitional regime between thin and thick plates.
The finite element model (FEM) provided a complementary verification of the theoretical predictions. Simulated contact times were in close agreement with experimental data, particularly for steel and aluminum plates. For the steel plate, FEM simulations yielded a TC almost identical to the experimentally measured, confirming the validity of the theoretical assumptions for stiff materials. For more compliant materials, such as aluminum, the simulations predicted slightly higher contact times due to the greater flexural deformation of the plate. These differences highlight the influence of material compliance on the energy dissipation mechanisms and validate the need for a non-rigid plate model such as the Zener formulation. The FEM simulations provided further insights into the physical mechanisms governing the impact process. In particular, the simulations confirmed that the end of the contact interval corresponds to the reversal of the plate’s velocity along the impact axis. Moreover, the propagation of flexural waves, clearly visible in the simulation results, supports the theoretical premise that energy dissipation through elastic wave generation plays a central role in extending the contact time relative to the Hertzian ideal case. The good agreement between FEM-predicted and experimentally measured TC values reinforces the validity of the numerical model and demonstrates its potential as a complementary tool for refining the analytical approach.
However, the precision of the method depends on several factors. First, the boundary conditions may introduce variability in plate behavior due to clamping imperfections, especially for thin and flexible plates. Besides, sphere release mechanism can introduce any initial rotation or lateral motion of the sphere, and so it could alter the impact dynamics and measured contact time. The material characterization by an accurate knowledge of the mechanical properties (E, ν, ρ) is essential for applying equations (12) and (14). Uncertainty in these parameters directly affects the accuracy of thickness estimation. Higher values of λ amplify non-linearities associated with wave propagation and multiple reflections within the plate, which are not fully accounted for by the simplified analytical solution. Hence, when λ exceeds 1.5, the method’s performance declines significantly.
In particular, the method assumes purely elastic behavior, which may not hold for thin plates or high-velocity impacts where plastic deformation occurs. For very small thicknesses (h<1.0 mm), the fragility of the plate and the violation of the λ<1.5 condition limit the applicability of the approach. The accuracy strongly depends on precise measurement of contact time and knowledge of material properties. These findings are consistent with previous studies on impact dynamics, which have highlighted the limitations of simplified models when dealing with highly compliant structures.
The results of this study confirm the feasibility of using contact time measurements to indirectly estimate the thickness of metallic plates impacted by a spherical striker. The experimental data, supported by theoretical modeling and FEM simulations, demonstrate that the method provides highly accurate estimations for a range of materials and geometrical configurations, particularly when the assumptions of the underlying model are satisfied. A key finding is the strong correlation between the inelasticity parameter λ and the reliability of thickness estimation. For cases where λ<1.5, the approximation proposed by Tsai and implemented in this study accurately captures the sphere–plate interaction dynamics. In these conditions, the predicted thickness values are very close to the actual measurements, with errors generally below 3%. This level of agreement validates the theoretical framework based on the Zener model and confirms its suitability for practical applications such as non-destructive testing (NDT) of structural components.
From a practical perspective, the experimental setup developed in this study offers a simple and low-cost alternative to conventional thickness measurement techniques. Unlike high-speed imaging or laser-based systems, the electrical circuit used to measure contact time is straightforward to implement and provides microsecond resolution without complex instrumentation. This makes the approach particularly attractive for industrial applications where rapid and non-invasive assessment is required, such as monitoring the integrity of tanks, pipelines, or inaccessible structural elements.
Overall, this study demonstrates that contact time is a reliable and sensitive parameter for characterizing sphere–plate interactions and for estimating plate thickness in a non-destructive manner. The combined use of analytical modeling, experimental validation, and numerical simulation provides a comprehensive understanding of the process and highlights both the strengths and limitations of the proposed method. Future work should focus on extending the model to incorporate viscoelastic or plastic effects, as well as exploring the influence of environmental variables such as temperature and surface roughness. Such developments would broaden the applicability of the technique and further enhance its utility for real-world engineering and diagnostic applications.
Acknowledgment
The authors would like to thank prof. Riccardo Borghi for his valuable help in reviewing the physical theory on which this paper is based and for his useful advice on improving the presentation; dr. Gaia Caliano for reviewing the figures in the paper and collaborating on the creation of the experimental measuring device.
References
- P. Müller, R. Böttcher, A. Russell, M. Trüe, J. Tomas, “A novel approach to evaluate the elastic impact of spheres on thin plates”, Chemical Engineering Science, num. 138 (2015), Pages 689–697.
- P. Müller, R. Böttcher, A. Russell, M. Trüe, S. Aman, J. Tomas, “Contact time at impact of spheres on large thin plates”, Advanced Powder Technology, Volume 27, Issue 4, 2016, Pages 1233-1243.
- R. Boettcher, A. Russell, P. Mueller, “Energy dissipation during impacts of spheres on plates: Investigation of developing elastic flexural waves”, International Journal of Solids and Structures, num. 106–107 (2017), Pages 229–239.
- H. Hertz, “Ueber die Berührung fester elastischer Körper”, J. Reine. Angew. Math. 92 (1882), Pages 156–171.
- C. Zener, “Intrinsic inelasticity of large plates” Phys. Rev. 59, 669-673 (1941).
- M.G. Koller, H. Kolsky, “Waves produced by the elastic impact of spheres on thick plates”, International Journal of Solids and Structures, Vol. 23, Issue 0, 1987, Pages 1387-1400.
- S. C. Hunter, “Energy absorbed by elastic waves during impact,” J. Mech. Phys. Solids 5, 162-171 (1957).
- A. Haron, K. A. Ismail, “Coefficient of restitution of sports balls: A normal drop test”, In IOP conference series: materials science and engineering, Vol. 36, No. 1, p. 012038. IOP Publishing 2015, http//doi.org/10.1088/1757-899X/36/1/012038.
- G. Caliano, F. Mariani, P. Calicchia, “Picus: A pocket-sized system for simple and fast non-destructive evaluation of the detachments in ancient artifacts, Applied Sciences (Switzerland) vol. 11 num. 8, 2021;. [CrossRef]
- Tsai, P.-K.; Li, C.-H.; Lai, C.-C.; Huang, K.-J.; Cheng, C.-W. “Approximation Solution for the Zener Impact Theory”, Mathematics 2021, 9, 2222.
- A. E. H. Love, A Treatise on the Mathematical Theory of Elasticity (Dover, New York, 1944), 4th ed.
- W. Goldsmith, Impact (Edward Arnold, London, 1960), pp. 82-144.
- K. Karas, “Platten unter seitlichem Stoss,” Ingenieur Archiv. 10, 237 250 (1939).
- W. Goldsmith, T. W. Lin, and S. Chulay, “Plate impact and perforation by projectiles,” Exp. Mech. 5, 385-404 (1965).
- A. Akay and M. Latcha, “Sound radiation from an impact-excited clamped circular plate in an infinite baffle”, J. Acoust. Soc. Am. 74 (2), August 1983.
- A. Grazzini, “Sonic and Impact Test for Structural Assessment of Historical Masonry”, Applied Science 9, no. 23: 5148. [CrossRef]
- Y. Wang, , Q. Peng, , H. Song, , Y. G. Wei, , & X. Liu, “Semi-analytical model for elastoplastic impact of sphere on plate”, International Journal of Impact Engineering, no. 198, 2025, http//doi.org/10.1016/j.ijimpeng.2025.105229.
Figure 1.
In (a) the conceptual scheme of the free fall impact of a spherical striker against a plane surface; in (b) the rigid sphere impacting the thin flexible surface supported on a rigid substrate, with the indication of the relative approach “α” between the striker and the impacted surface.
Figure 1.
In (a) the conceptual scheme of the free fall impact of a spherical striker against a plane surface; in (b) the rigid sphere impacting the thin flexible surface supported on a rigid substrate, with the indication of the relative approach “α” between the striker and the impacted surface.
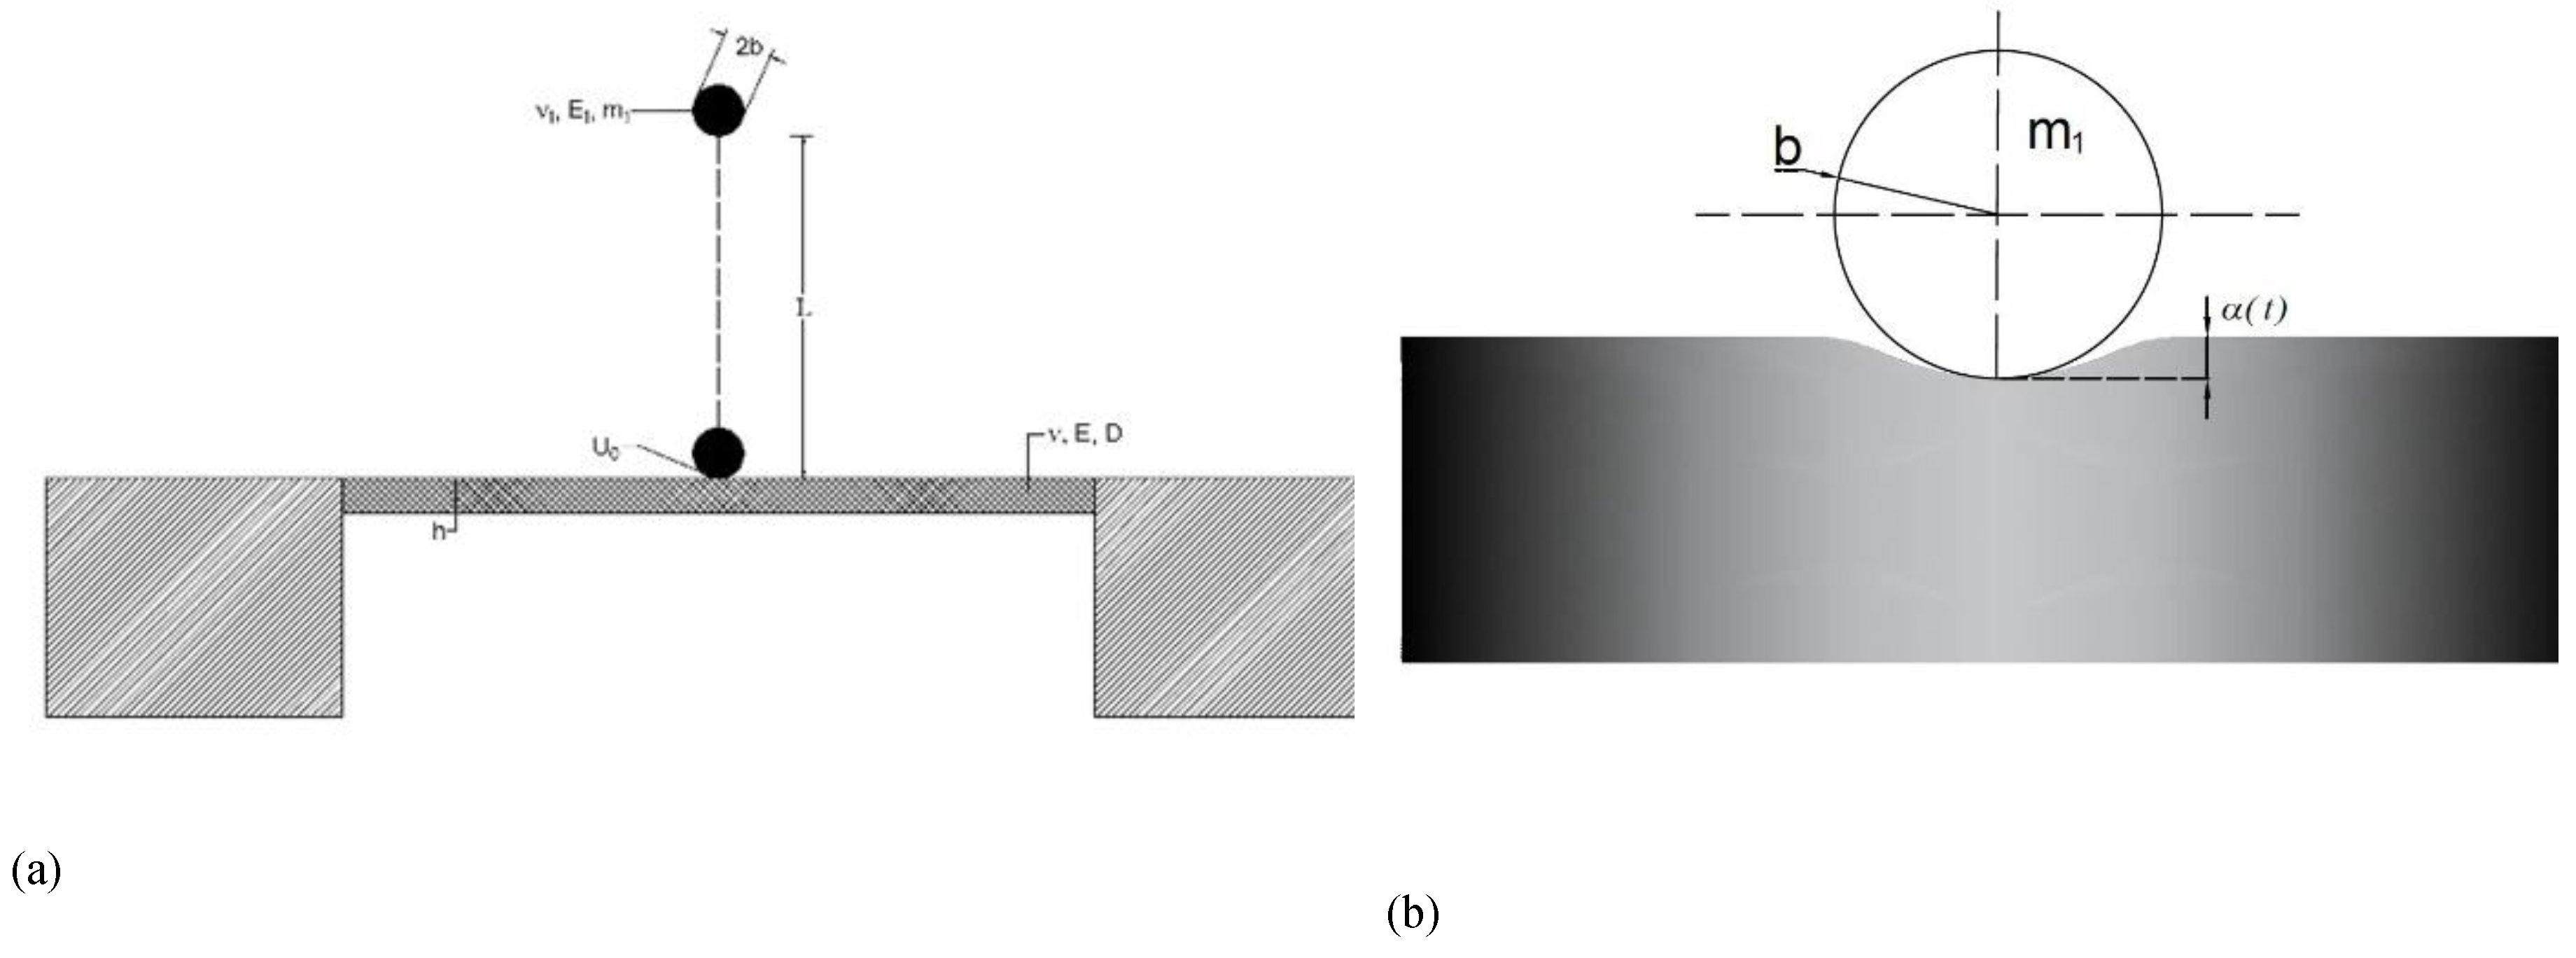
Figure 2.
Comparison between the numerical solution of the differential equation (4), dashed line, and the approximation described by equation (7), solid line, as λ varies.
Figure 2.
Comparison between the numerical solution of the differential equation (4), dashed line, and the approximation described by equation (7), solid line, as λ varies.
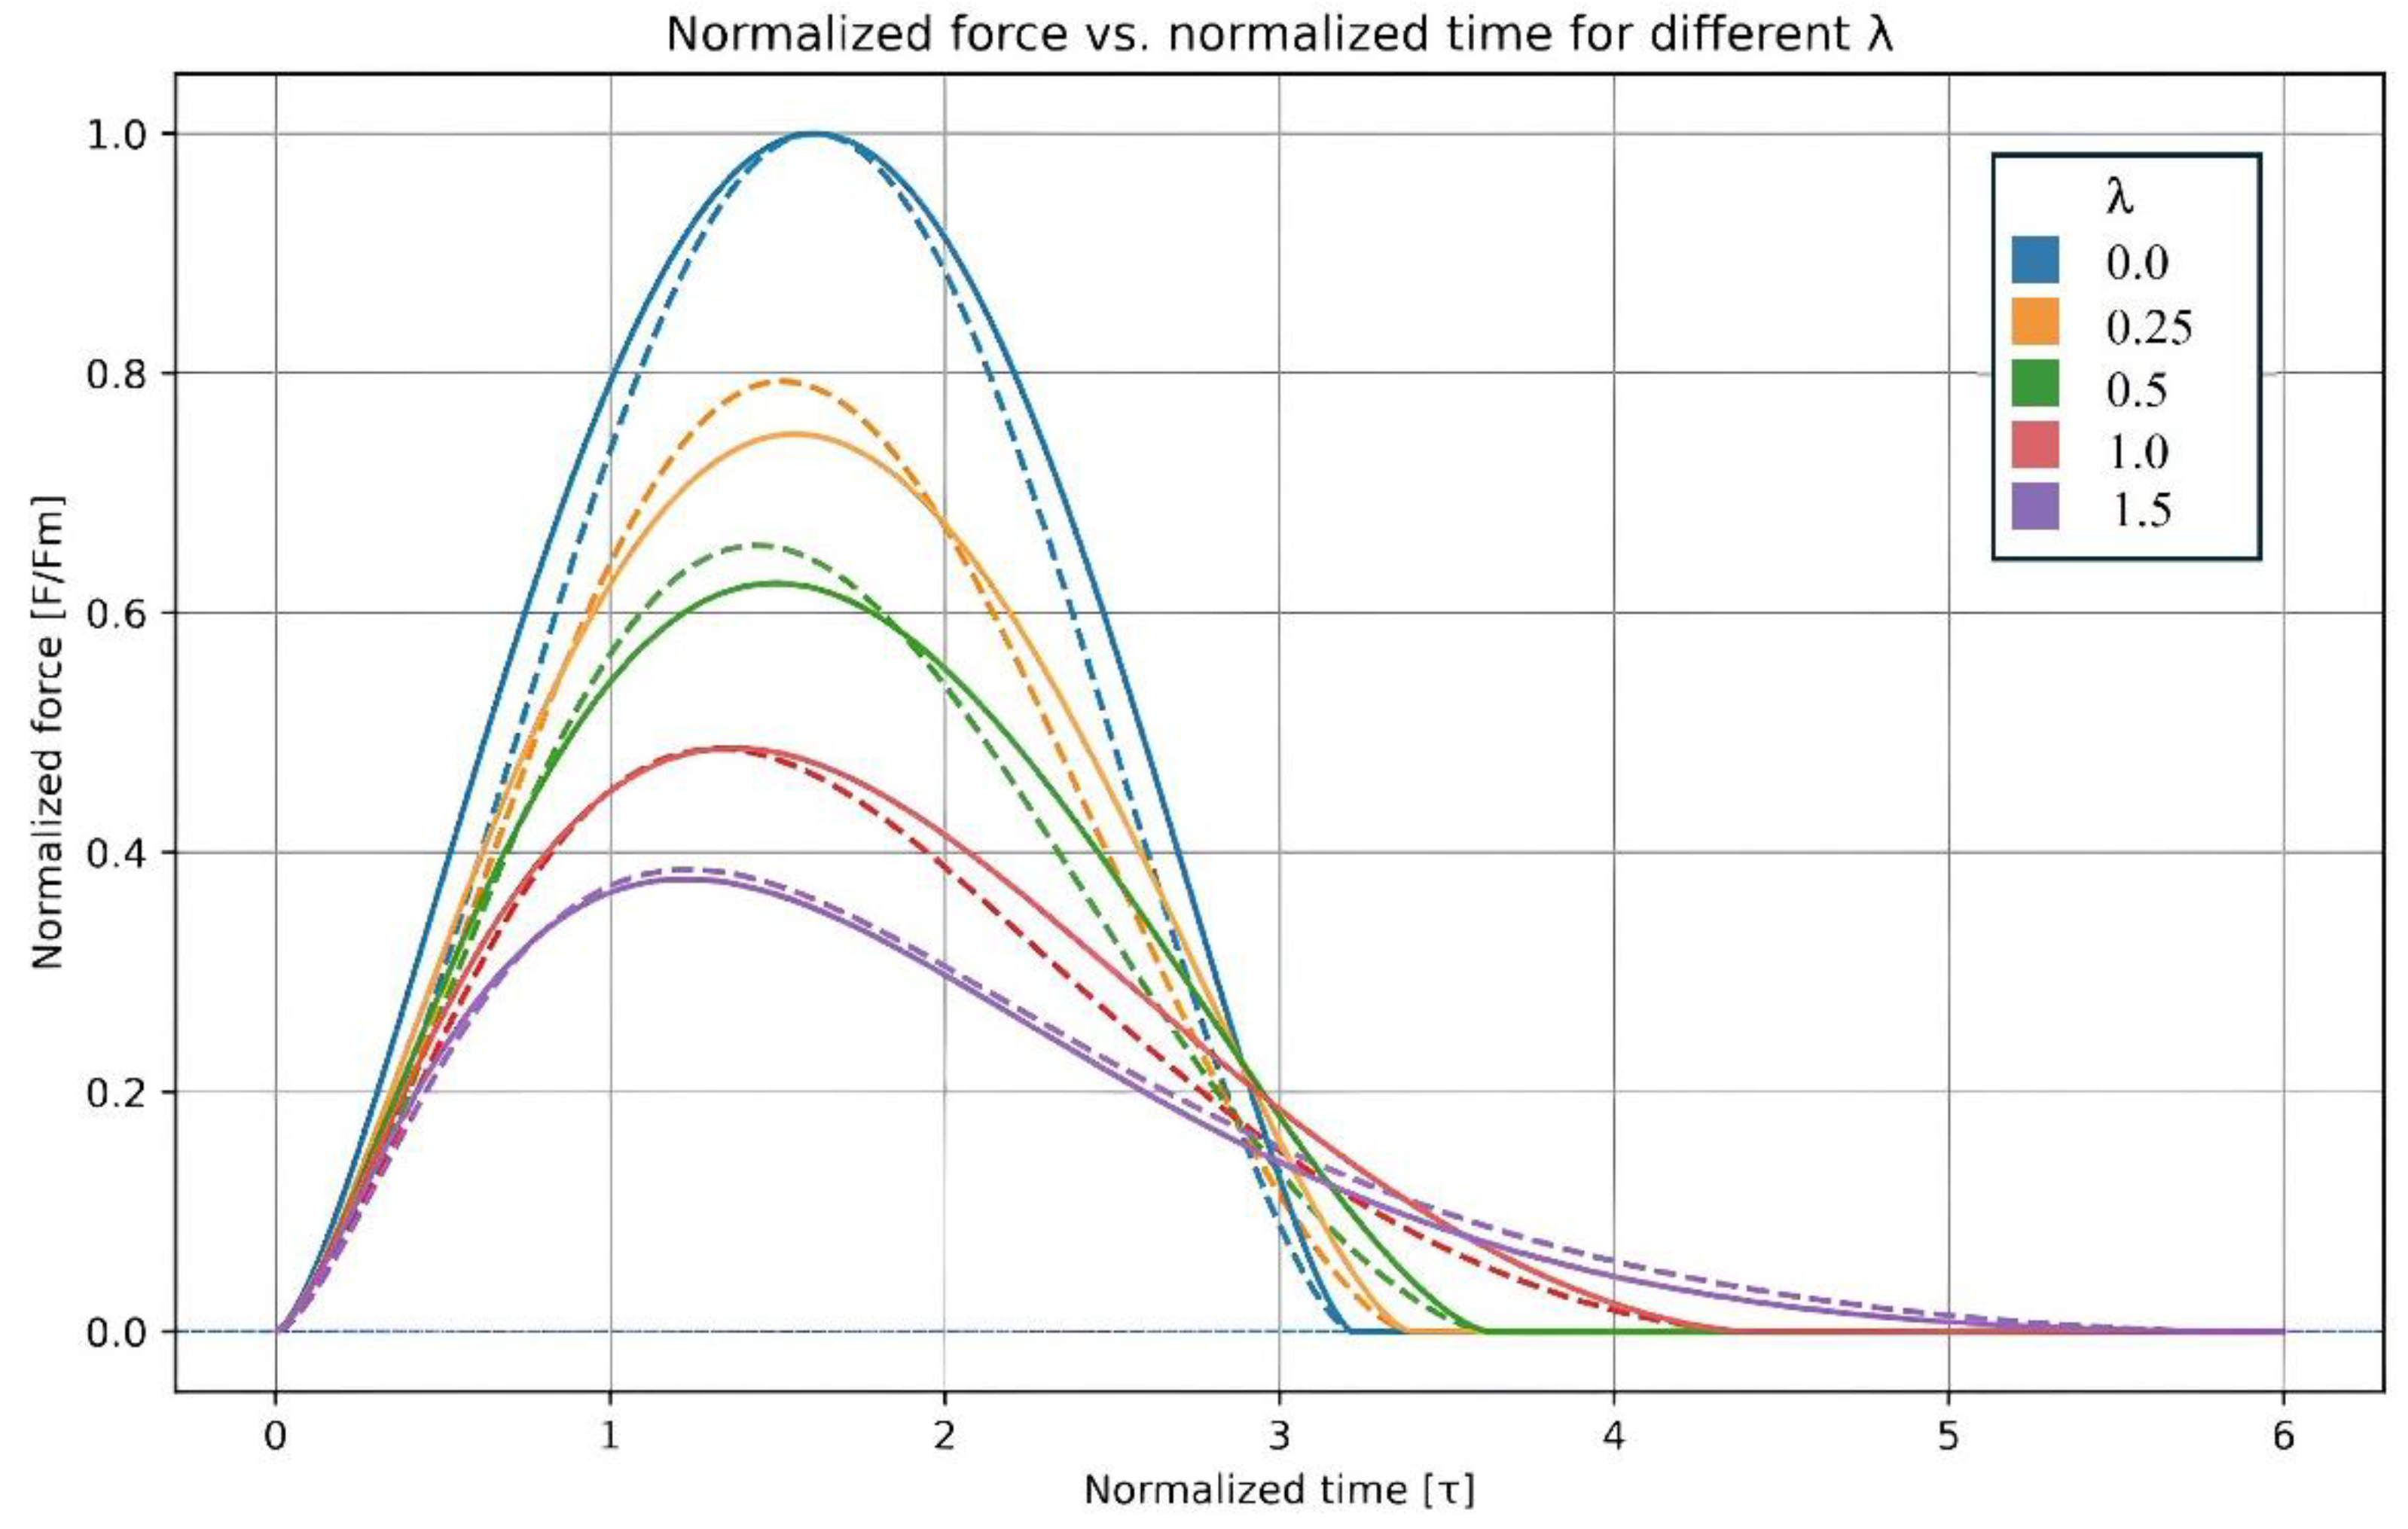
Figure 3.
Finite element mesh of the sphere–plate system adopted in the Explicit Dynamics simulations. A local refinement was introduced in the impact region to capture the stress gradients and contact evolution.
Figure 3.
Finite element mesh of the sphere–plate system adopted in the Explicit Dynamics simulations. A local refinement was introduced in the impact region to capture the stress gradients and contact evolution.
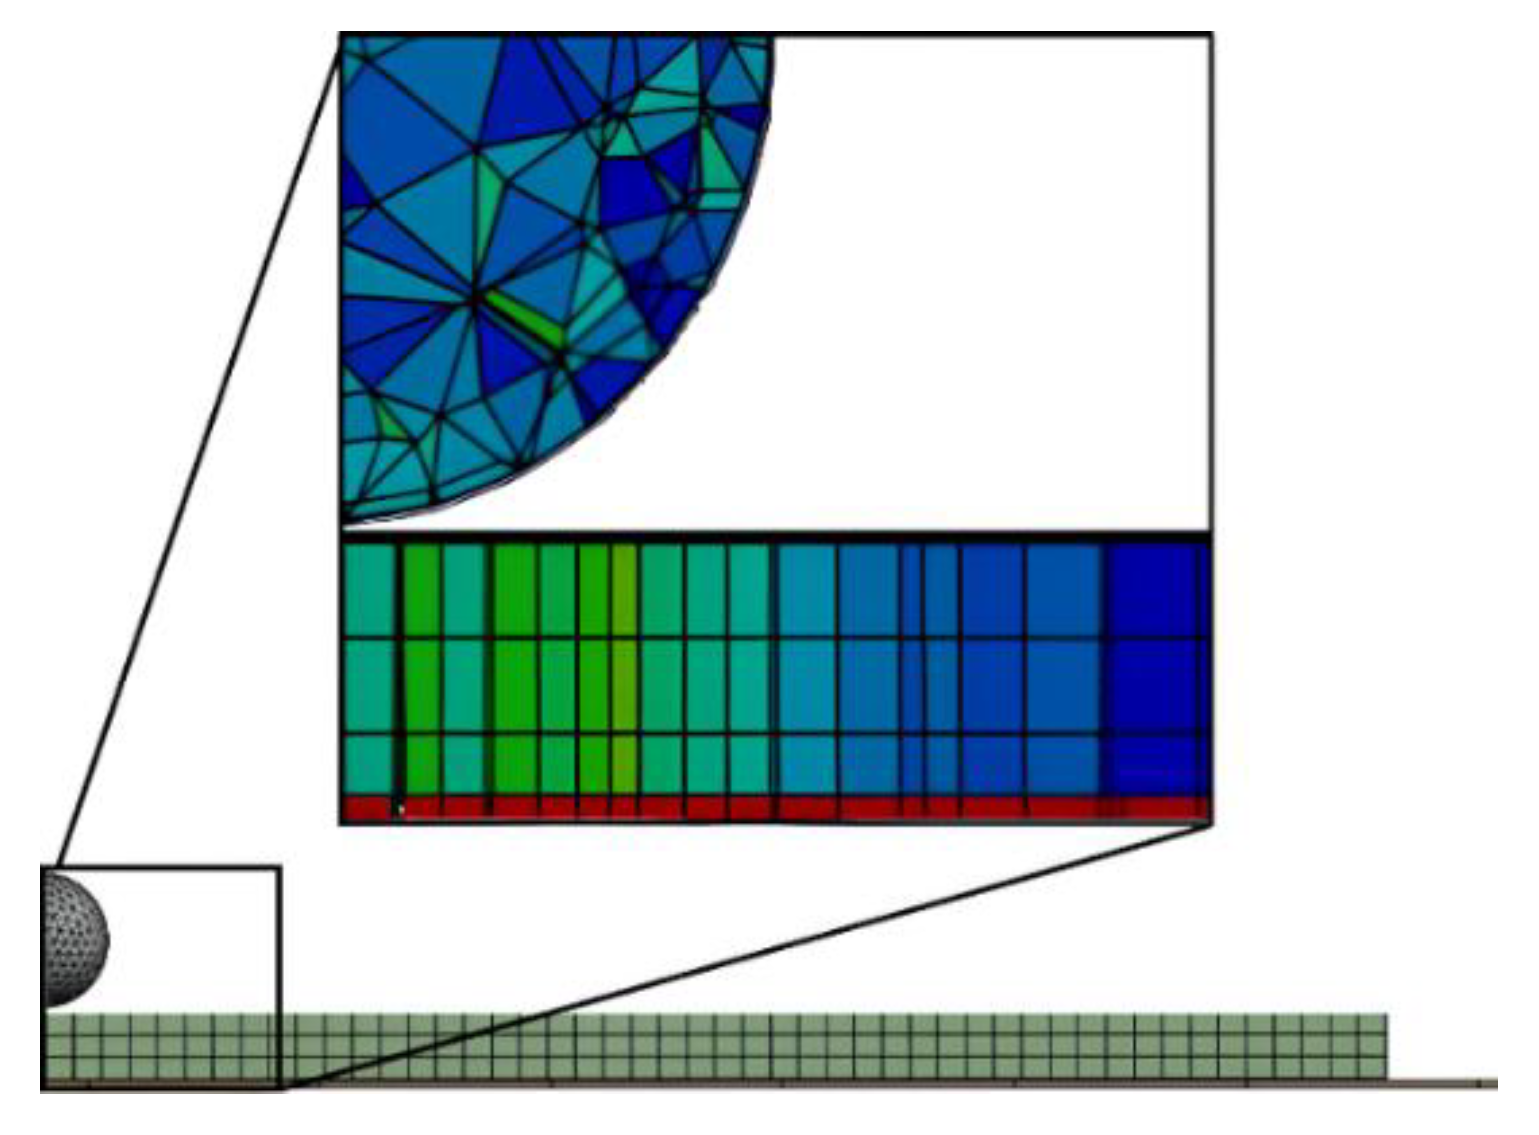
Figure 4.
Directional velocity of the plate along the impact axis obtained from FEM simulation. The contour plot (left) shows the deformation wave pattern at the moment of maximum interaction, while the velocity–time curve (right) highlights the contact interval. The velocity sign reversal at the first local minimum identifies the effective end of the contact duration between the sphere and the plate.
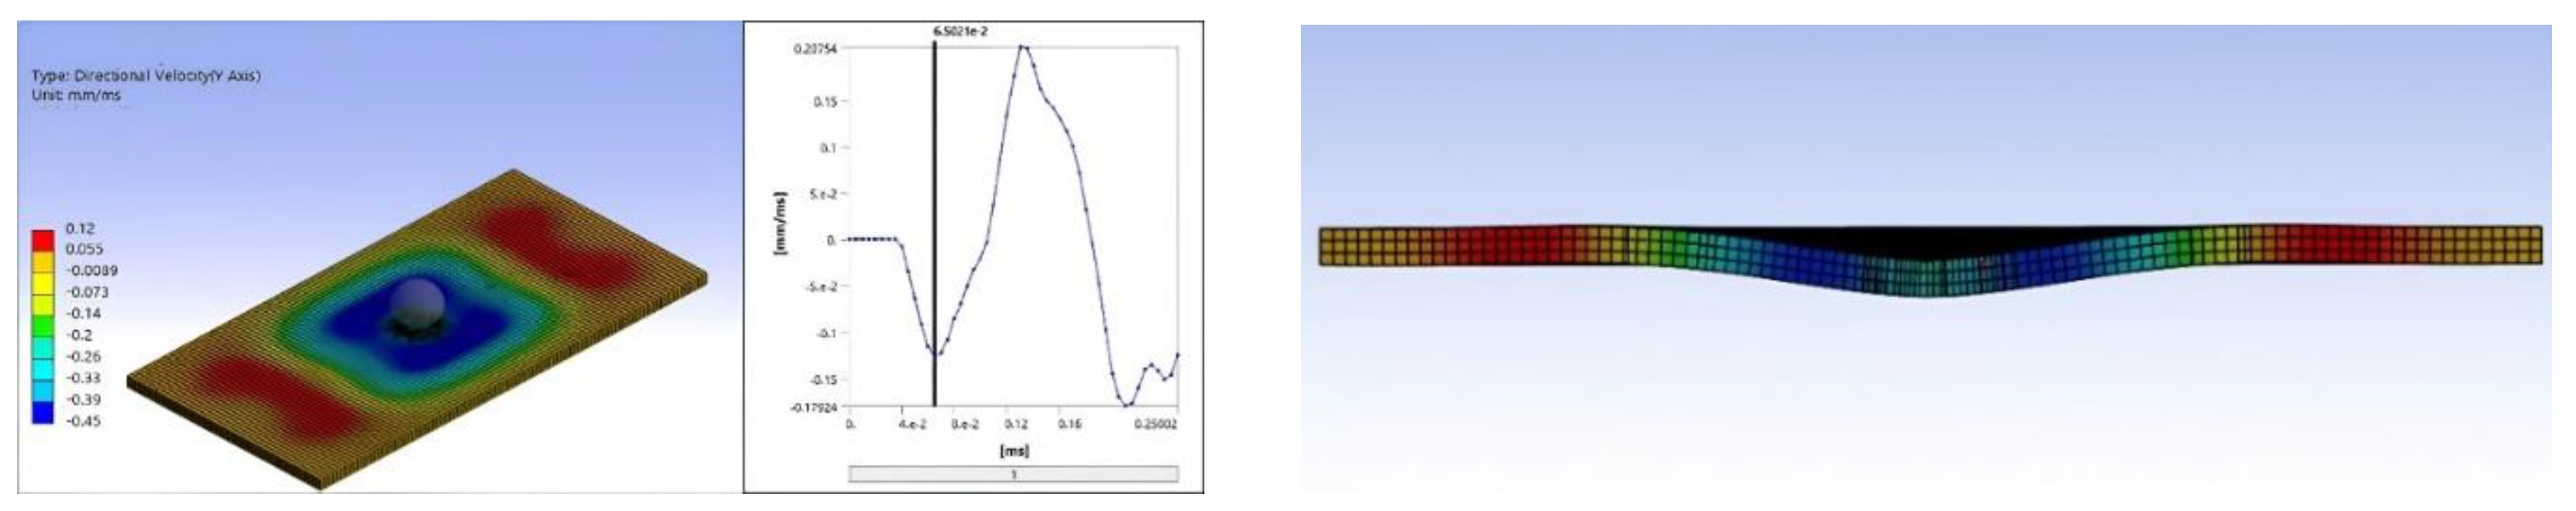
Figure 5.
The structure designed to put in tension the metal plates under test.
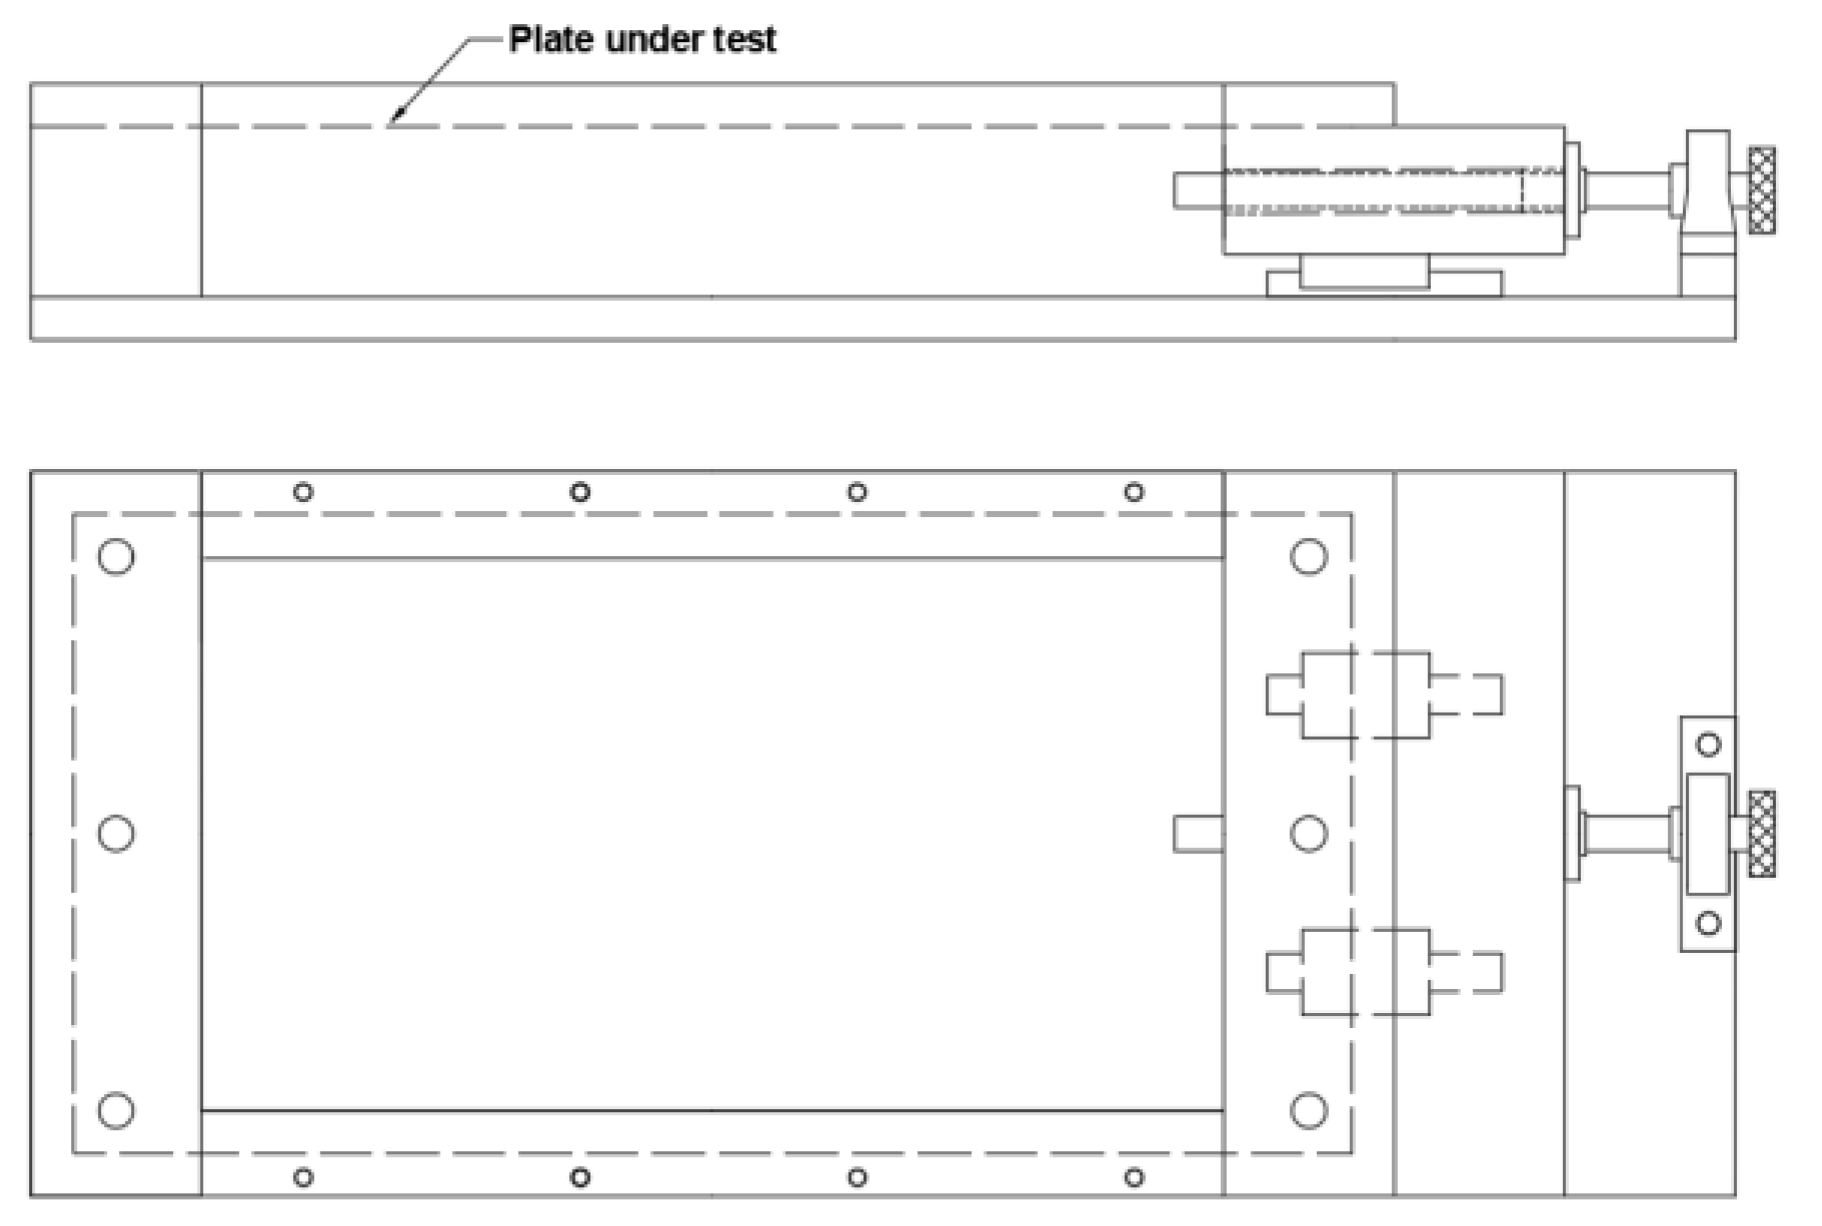
Figure 6.
The photos show the experimental setup used to measure the impact time.
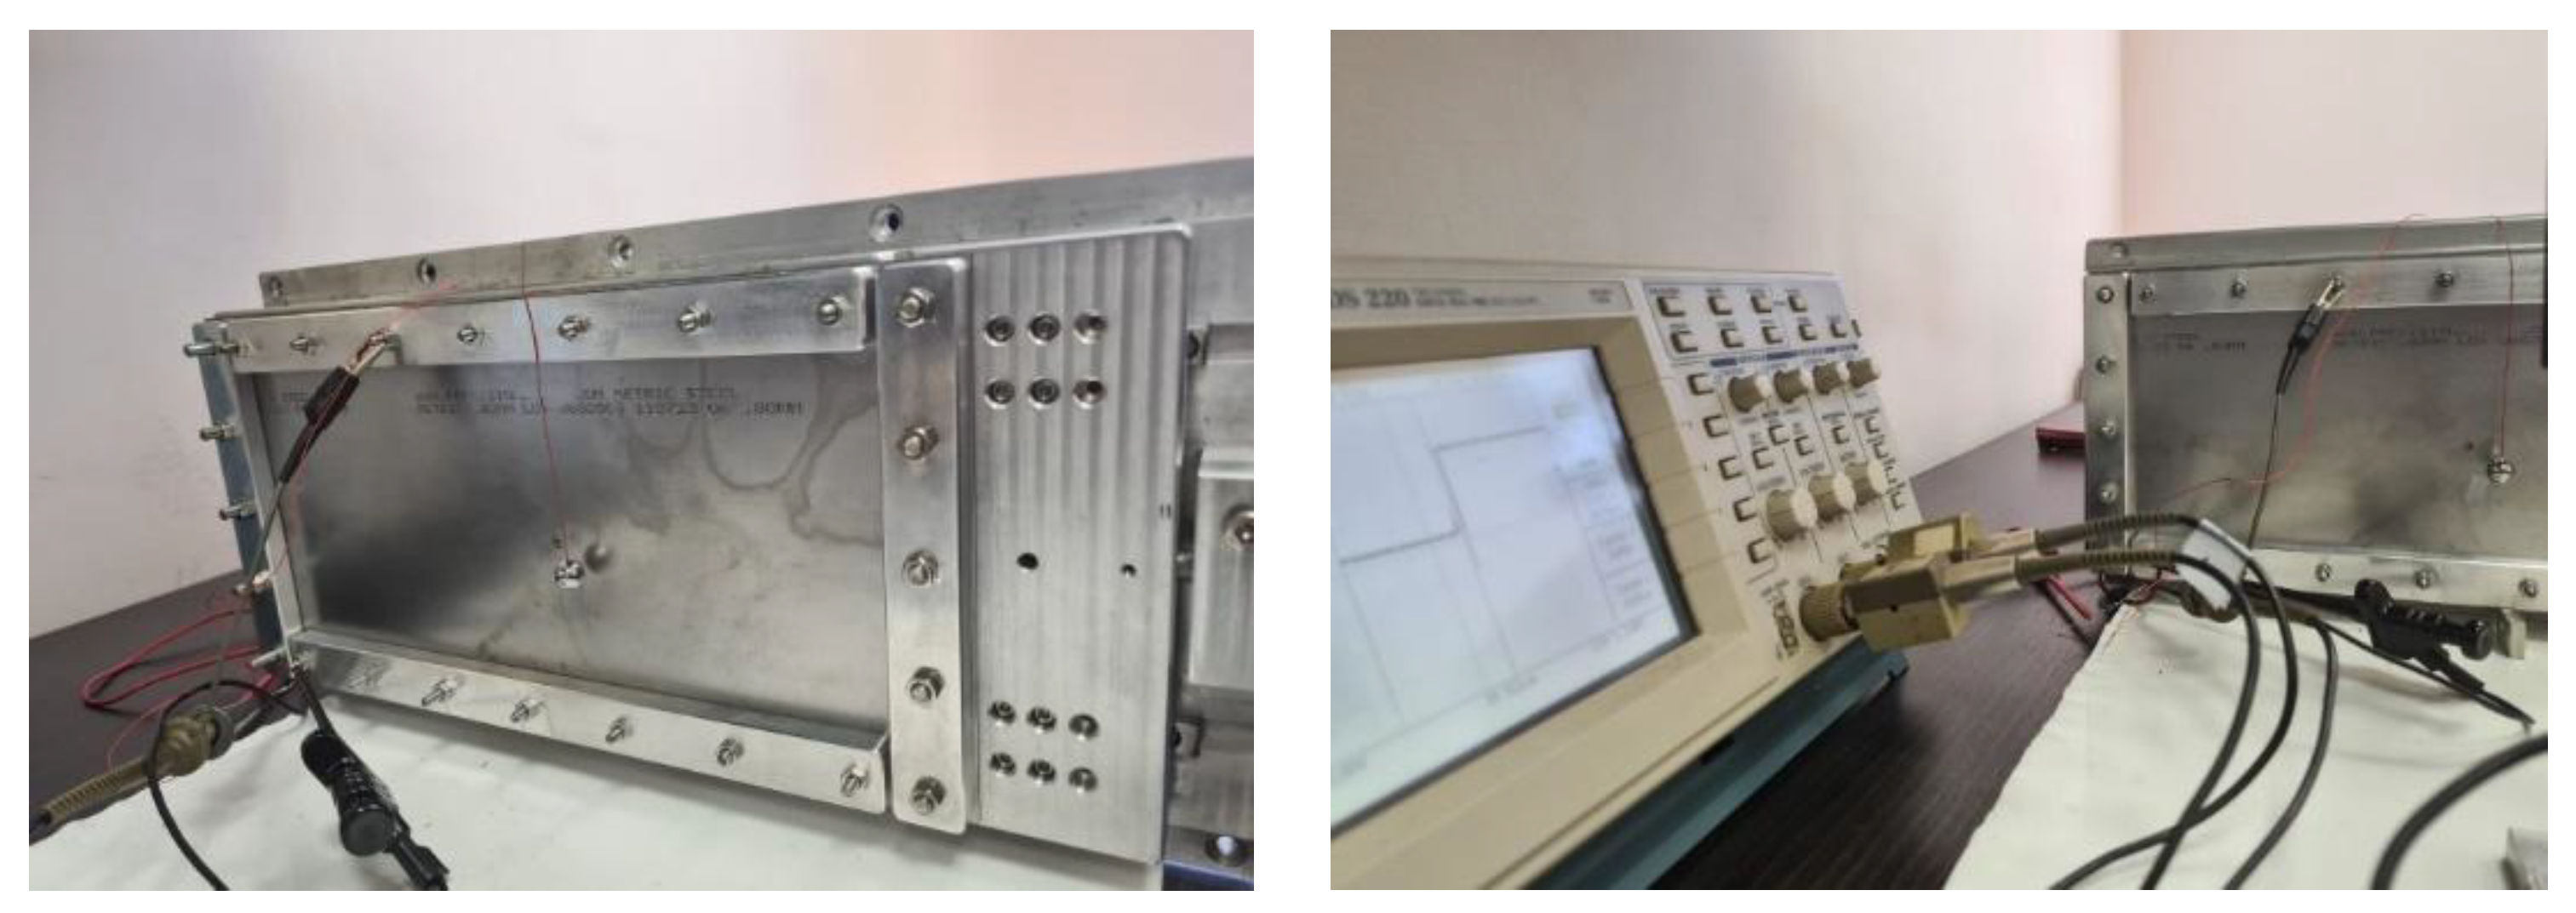
Figure 7.
The schematic of the experiment to measure the impact time (electrically) between the striker-sphere and the plate using a scope.
Figure 7.
The schematic of the experiment to measure the impact time (electrically) between the striker-sphere and the plate using a scope.
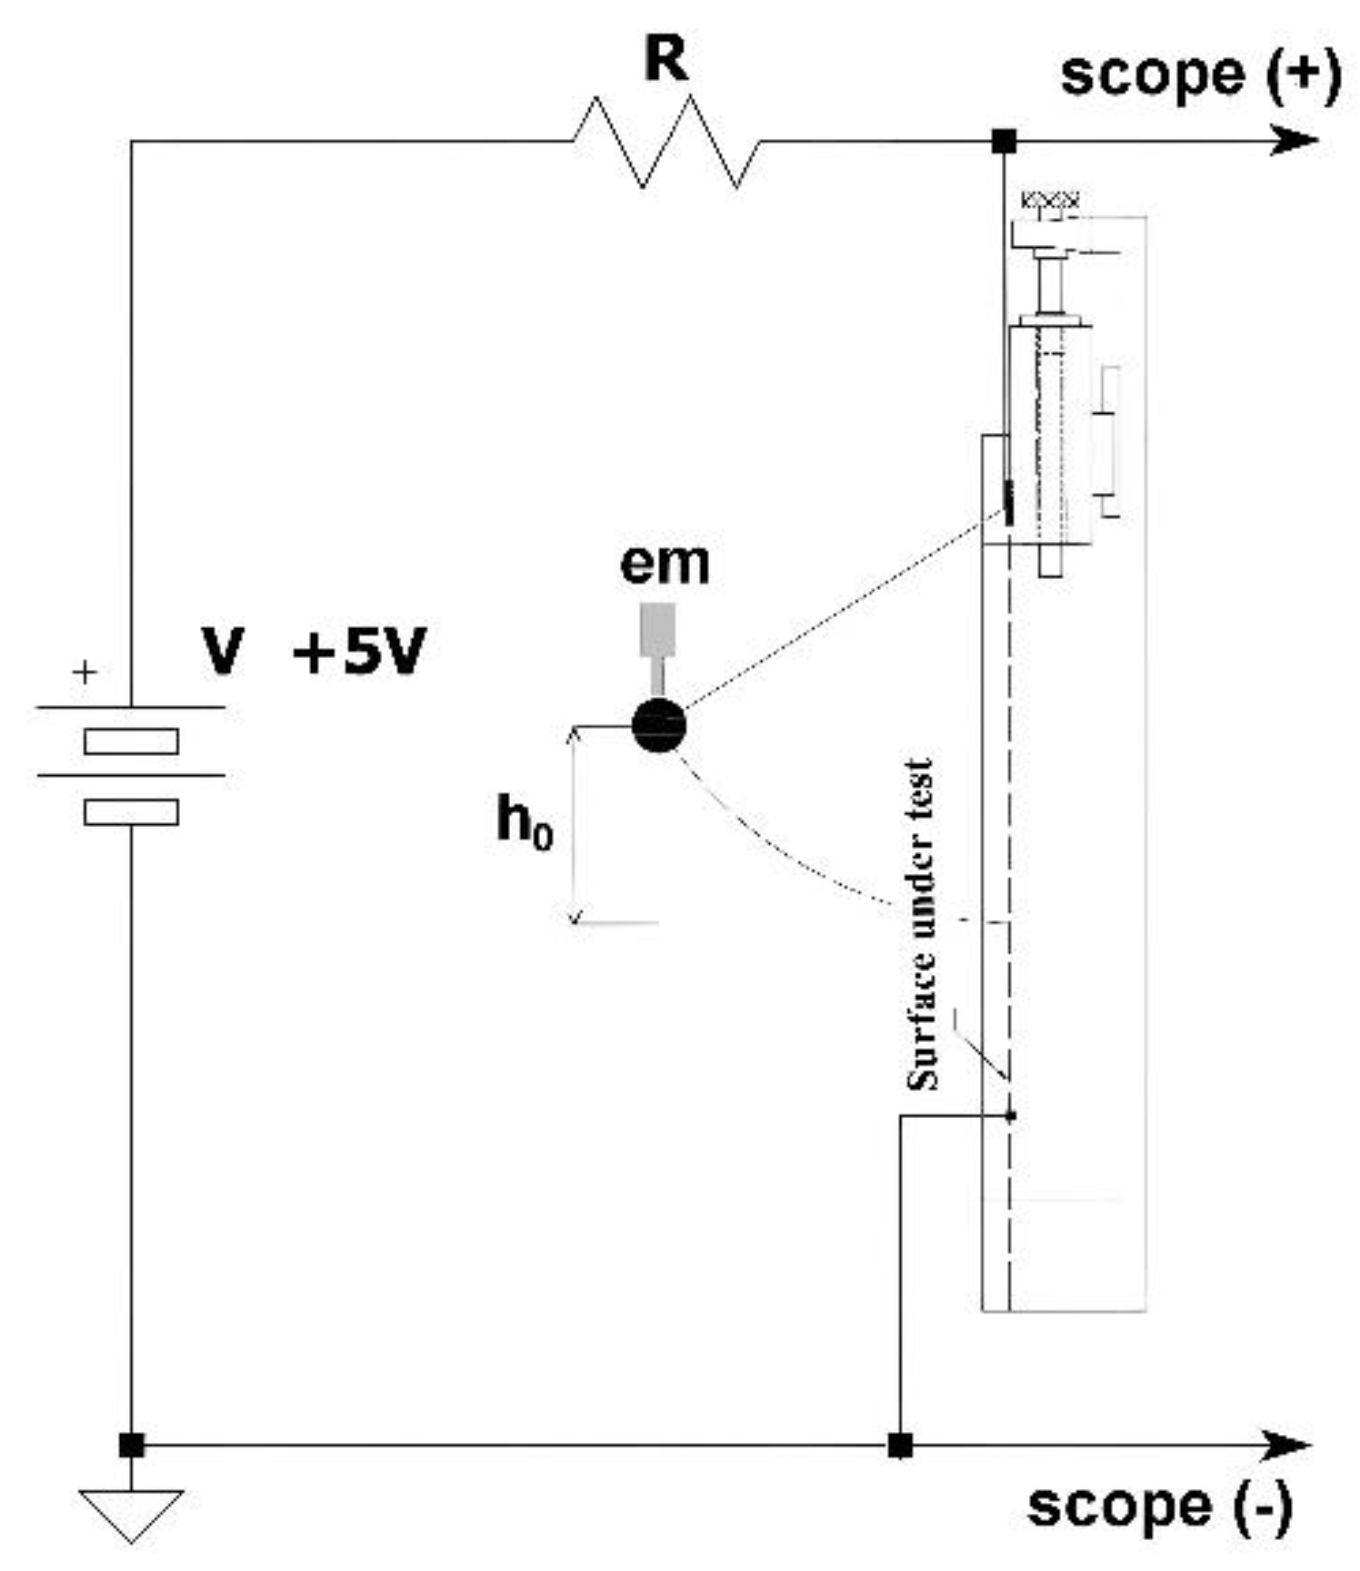
Figure 8.
Oscilloscope recording of the signal during the impact event. The test was conducted on an Aluminum Type 2 plate, 3 mm thick, with a measured impact duration of 50.3 µs.
Figure 8.
Oscilloscope recording of the signal during the impact event. The test was conducted on an Aluminum Type 2 plate, 3 mm thick, with a measured impact duration of 50.3 µs.
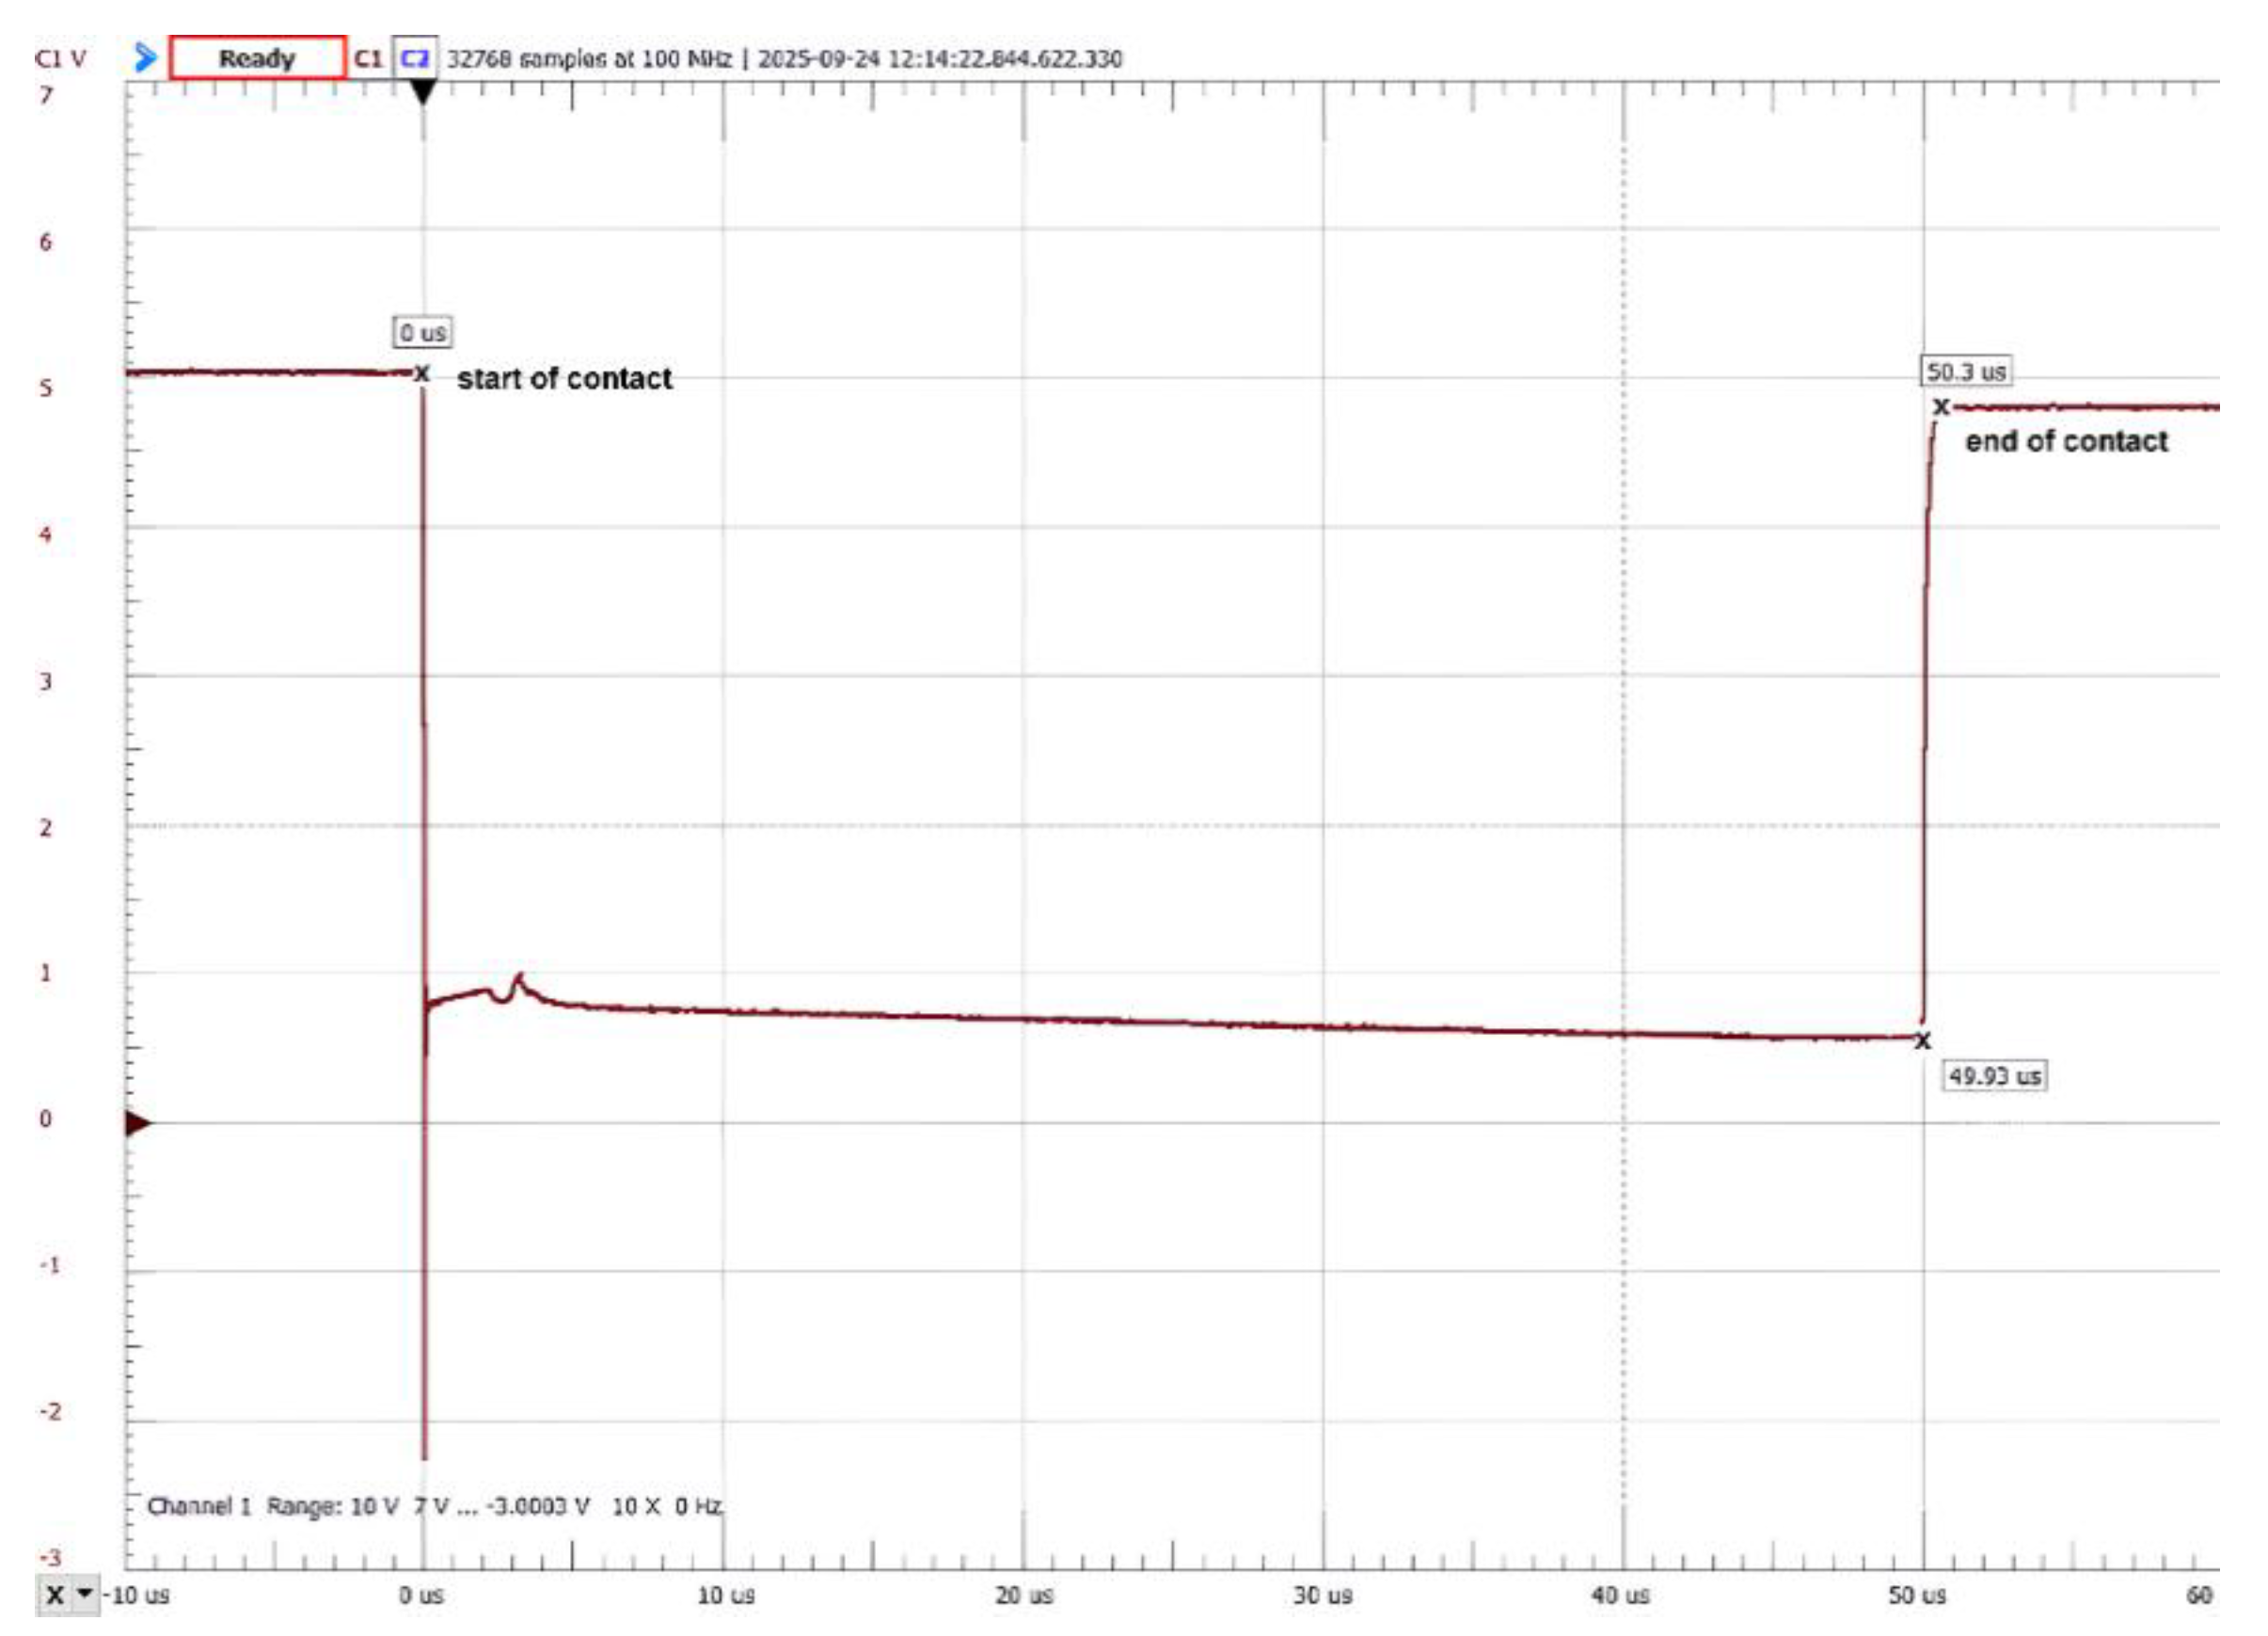

Table 1.
Material’s characteristics.
| Plate | |||||
| ρ [kg/m3] | E [GPa] | ν | |||
| Akay’s exp. [15] | 7830 | 207.5 | 0.29 | ||
| Steel plate | 7500 | 205 | 0.3 | ||
| Aluminium 1050/Al99.5 | 2700 | 69 | 0.33 | ||
| Aluminium Type 2 | 2700 | 79 | 0.35 | ||
| Brass CW508L/CZ108 | 8495 | 106 | 0.33 | ||
| Brass Type 2 | 8400 | 100 | 0.33 | ||
| Impact sphere (ball) | |||||
| ρ [kg/m3] | E [GPa] | ν | |||
| Acrylic (Akay’s exp. [15]) | 1190 | 3.3 | 0.37 | ||
| Steel | 7900 | 193 | 0.3 | ||
Table 2.
Measured Impact Time.
| Tc [μs] | hreal [mm] | hestimed by(19) [mm] | λestimed by (17) | e % | |
| Akay’s exp. [15] | 150 | 1.59 | 1.56 | 1.44 | -1.88 |
| Steel plate | 35.2 | 2.56 | 2.58 | 0.61 | +0.78 |
| Aluminium 1050/Al99.5 | 55 | 2.96 | 2.90 | 1.05 | -2.02 |
| Aluminium Type 2 | 200.8 | 1.50 | 1.78 | 2.71 | +18.6 |
| Aluminium Type 2 | 49.96 | 3.00 | 3.02 | 0.94 | +0.66 |
| Brass CW508L/CZ108 | 216 | 1.08 | 1.26 | 2.85 | +16.66 |
| Brass Type 2 | 37.6 | 4.00 | 4.02 | 0.28 | +0.5 |
Disclaimer/Publisher’s Note: The statements, opinions and data contained in all publications are solely those of the individual author(s) and contributor(s) and not of MDPI and/or the editor(s). MDPI and/or the editor(s) disclaim responsibility for any injury to people or property resulting from any ideas, methods, instructions or products referred to in the content. |
© 2025 by the authors. Licensee MDPI, Basel, Switzerland. This article is an open access article distributed under the terms and conditions of the Creative Commons Attribution (CC BY) license (http://creativecommons.org/licenses/by/4.0/).
Copyright: This open access article is published under a Creative Commons CC BY 4.0 license, which permit the free download, distribution, and reuse, provided that the author and preprint are cited in any reuse.


