Submitted:
08 November 2025
Posted:
10 November 2025
You are already at the latest version
Abstract
In the global pharmaceutical industry, human resource strategy not only fulfills compliance and risk control functions but also directly impacts talent retention, organizational efficiency, and innovation capabilities. Drawing on the U.S. practices of a multinational biopharmaceutical enterprise, this study examines the key mechanisms of human resource strategy implementation across borders by integrating HR analytics with Hofstede's cross-cultural model. Research methods included a modular HR analytics pipeline built with Python, integrating structural equation modeling (SEM), machine learning classifiers, a Transformer-based cultural encoder, and a job-person matching engine powered by a neural network and Hungarian algorithm. Workflow orchestration was achieved using Apache Airflow, and deployment was managed via Docker with GPU acceleration. Results indicate that leadership models and career development maps significantly enhance employee engagement (β=0.62, p<0.01), reducing overall turnover by 8% within one year. Differentiated compensation structures and flexible benefit policies significantly enhanced employee satisfaction (β=0.55, p<0.01) while strengthening employer brand competitiveness. This study not only validates the effectiveness of localizing multinational corporations' HR strategies but also provides empirical evidence and a methodological framework for cross-cultural HR governance.
Keywords:
HR analytics
; cross-cultural management
; structural equation modeling
; biopharmaceutical enterprises
; employee engagement
1. Introduction
Amidst the rapid expansion of the global biopharmaceutical industry and the increasing normalization of multinational operations, strategic human resource management faces multiple challenges stemming from cultural diversity, institutional differences, and organizational complexity. To theoretically contextualize the strategic role of human resources, this study incorporates the Resource-Based View (RBV) as a foundational lens. The RBV posits that sustainable competitive advantage arises from firm-specific resources that are valuable, rare, inimitable, and non-substitutable (VRIN). Human capital—when embedded in culturally adaptive leadership, structured analytics, and aligned talent systems—meets these VRIN conditions, positioning human resource strategy as a core intangible asset. By linking HR analytics and cultural governance with RBV, this research provides a theoretical explanation for how multinational pharmaceutical firms leverage people-based capabilities to maintain cross-border advantage.Addressing this issue, this paper focuses on human resource data and employee feedback from the U.S. subsidiary of a multinational pharmaceutical company. Integrating HR analytics with Hofstede's cultural dimensions model, it constructs pathways for leadership competency, cultural moderation mechanisms, and a people-position matching system. Employing structural equation modeling and regression analysis, the study explores systematic pathways for constructing and implementing human resource strategies in multicultural contexts.
2. Current Application of HR Analytics in Human Resource Decision-Making
Currently, HR analytics is widely applied in decision-making domains such as employee turnover prediction, performance evaluation, and recruitment optimization. Models based on structural equation modeling (SEM) and logit regression achieve a 72.4% adoption rate among the world's top 100 pharmaceutical companies[1] . Companies like IBM and Novartis have developed predictive dashboards covering three-dimensional metrics—engagement, promotion rates, and turnover rates—integrated with BI tools for real-time monitoring. In multinational contexts, data modeling must incorporate cultural variables and organizational contexts to ensure algorithm interpretability and strategic adaptability, laying the foundation for subsequent cross-cultural model development.
3. Research Methodology and Data Design
3.1. Research Subject
A subsidiary of a multinational biopharmaceutical company in the United States was selected as the research subject. The company employs 2,186 staff across R&D, marketing, production, and functional support roles, with operations spanning nine states. Its highly matrixed organizational structure and cross-cultural team collaboration characteristics provide a representative case for structured human resource analysis, laying the foundation for subsequent variable collection and sample design.
3.2. Data Sources and Sample Structure
Data primarily originated from four subsets extracted from the internal HR system between January and December 2023: employee profile information, performance evaluation records, satisfaction survey results, and cultural background tags. The time span covered nearly three years, with an initial sample size of 2,186 individuals[2]. After excluding records with missing data exceeding 15%, 1,973 valid samples were retained. The analysis sample was constructed through Z-score normalization, homogeneity testing, and stratified sampling by functional category. Data processing was performed using Python and SPSS for cleaning and structural segmentation, providing high-quality input for variable construction and model development.
3.3. Methodological Framework
Following data preparation, structural equation modeling (SEM) identified engagement pathways via factor loadings and maximum likelihood estimation, incorporating cultural interaction variables (e.g., Power Distance Index mean = 64.3)[3].Figure 1 shows the modular pipeline structure with five stages: (1) data ingestion and preprocessing, (2) feature engineering with cultural encoding, (3) ensemble model training, (4) performance evaluation, and (5) SHAP-based feature attribution. The pipeline is built using Scikit-learn’s Pipeline() for reproducibility and diagnostics.Compensation was stratified into quintiles. Control variables (gender, tenure, functional type) were standardized. NVivo was used for three coding rounds on 128 employee feedbacks, producing three cross-cultural fit indicators for empirical testing.
Model construction utilized a modular pipeline in Python 3.11 with NumPy for computation, Pandas for data management, and Scikit-learn for regression. A custom TensorFlow neural embedding module transformed categorical cross-cultural labels into 128-dimensional vectors, enabling semantic mapping of cultural features. The pipeline was containerized with Docker, executed on Ubuntu 22.04 with GPU acceleration via CUDA 11.8 for batch SEM estimation. Workflow orchestration was managed with Airflow DAGs for scheduling, parallelization, and version control. This framework ensured reproducibility, computational efficiency, and scalable deployment for cross-cultural HR analytics.
3.4. Variable Construction and Measurement Indicator Description
The variable system used employee hierarchical data, with indicators designed around five core dimensions. Scales were based on a five-point Likert scale (1–5), with each latent variable having 2–4 indicators. The engagement score’s Cronbach’s α was 0.88. Cultural adaptation indicators were grouped using the mean of Hofstede’s six dimensions. The standardized performance score had a mean of 3.27 and a standard deviation of 0.64. Definitions and coding methods are shown in Table 1 for consistency in path modeling and regression estimation.
3.5. Feature Attribution Analysis with SHAP”
To improve interpretability of model predictions, SHAP (SHapley Additive exPlanations) analysis was employed. Figure 6 shows the mean absolute SHAP values for each Hofstede cultural dimension. "Power Distance" (0.32) and "Individualism" (0.27) exhibited the strongest effects on revenue prediction, indicating that hierarchical perception and autonomy orientation significantly impact workforce-driven revenue dynamics in multicultural contexts,See Figure 2 for details.
4. Strategic Human Resource Model Development for Global Biopharmaceutical Enterprises
4.1. Theoretical Framework of Leadership Models
From a theoretical standpoint, the HR model development in multinational biopharmaceutical enterprises follows the Resource-Based View, where leadership, cultural adaptability, and analytical systems are intangible resources meeting the VRIN criteria. These leadership competencies, embedded in culturally aligned HR practices, are firm-specific, path-dependent, and hard to replicate, enhancing organizational distinctiveness. The HR strategy model leverages these internal resources for sustained performance advantage.The leadership model is based on structural equation modeling, with leadership competency as the core latent variable. It mediates through engagement and satisfaction to influence performance. Cultural adaptability moderates the relationship between leadership and affective commitment, highlighting cross-cultural impacts on incentives[4]. The model includes 5 latent variables and 14 indicators, with initial loadings between 0.63–0.89. Fit indices were CFI > 0.90 and RMSEA < 0.05. The theoretical framework in Figure 3 supports parameter estimation and cross-cultural analysis.
4.2. Cross-Cultural Competency Model Design
To model the interaction of cultural dimensions and leadership behavior, a multi-head attention Transformer encoder was used to learn dense vectors of employee cultural profiles. Each cultural vector (dimension=6) passed through 4 self-attention layers (head=8, hidden=128) and a feedforward layer. The embeddings were input into a shallow neural classifier (3 layers, ReLU) for cross-cultural fit prediction. The model was trained on a labeled dataset (n=1,973) using Adam optimizer, learning rate=1e-4, batch size=64, for 20 epochs on an NVIDIA RTX A6000 GPU. The final F1-score was 0.871, indicating good generalization for cross-cultural interaction modeling.Cultural Competency (CC) was set as a mediating latent variable connecting leadership and employee behavior, establishing the relationship between multicultural cognition and behavioral adaptation. The model includes three sub-dimensions: Cognitive Diversity (CD), Behavioral Flexibility (BF), and Cultural Intelligence (CQ), all as observable indicators in the structural path layer[5]. The mathematical expression is as follows:
Where represents the cross-cultural competence score of the nth employee ( ), denotes the cultural cognitive diversity score, indicates behavioral adaptability flexibility, signifies cultural intelligence, and is the disturbance term. The coefficients are obtained through maximum likelihood estimation, with initial values set at 0.35, 0.42, and 0.27 respectively. In the structural path model, CC influences the paths from employee engagement (EE) to job satisfaction (JS) through moderating factors, with the following moderation functions:
Where represents the leadership score, denotes the base effect, indicates the main effect of CC, and is the interaction term coefficient, set at 0.43. This implies that higher cross-cultural competence strengthens the positive impact of leadership on employee engagement. The model employs a two-layer structure (Measurement Layer and Structural Layer), incorporating 12 standardized variable indicators into the estimation process. The overall logical framework is illustrated in Figure 4.
4.3. Employee Engagement Indicator System
The employee engagement indicator system is constructed based on a three-dimensional latent variable model framework, comprising Behavioral Involvement (BI), Affective Commitment (AC), and Task Motivation (TM). Path modeling is conducted using the Multi-Indicator Structural Measurement Model (MIMIC). At the structural level, Employee Engagement (EE) is set as the primary latent variable, receiving jointly weighted inputs from three first-order factors. Moderation effects are provided by the external variables Cultural Competence (CC) and Leadership (LC). The multi-factor input is expressed as follows:
Where represents the composite EE score for employee , denote the influence coefficients for the basic behavioral, affective, and task factors respectively (initially set at 0.31, 0.45, and 0.29), is the parameter for the cultural moderation interaction term, and the disturbance term follows a distribution. At the latent variable level, a standardized measurement model was introduced to bind the observed variables for each dimension, quantified as follows:
where represent the scores of the three types of scale items, and denote the factor loadings. All measurement items underwent Cronbach’s α validation, with mean values ≥ 0.81. The model involves a total of 9 indicators, with path strengths labeled by structural coefficients . This ultimately forms an engagement assessment structure diagram[6] integrating behavioral cognition and cultural interaction dimensions, as shown in Figure 5.
4.4. Strategic Human Resource Matching Mechanism
The HR matching module uses a two-layer feedforward neural network in PyTorch. The first layer encodes employee profiles (skills, experience, and cultural indices) into a latent space with ReLU activation. The second layer maps this to a job competency space, using a cosine similarity-based loss to measure alignment. The model is optimized with Adam optimizer (learning rate = 0.001, β1=0.9, β2=0.999), batch size of 64, over 100 epochs. Dropout (p=0.3) and L2 regularization (λ=0.0005) improve generalization. During inference, the model outputs a normalized compatibility score, which is input into a Hungarian algorithm-based solver for optimal position allocation.
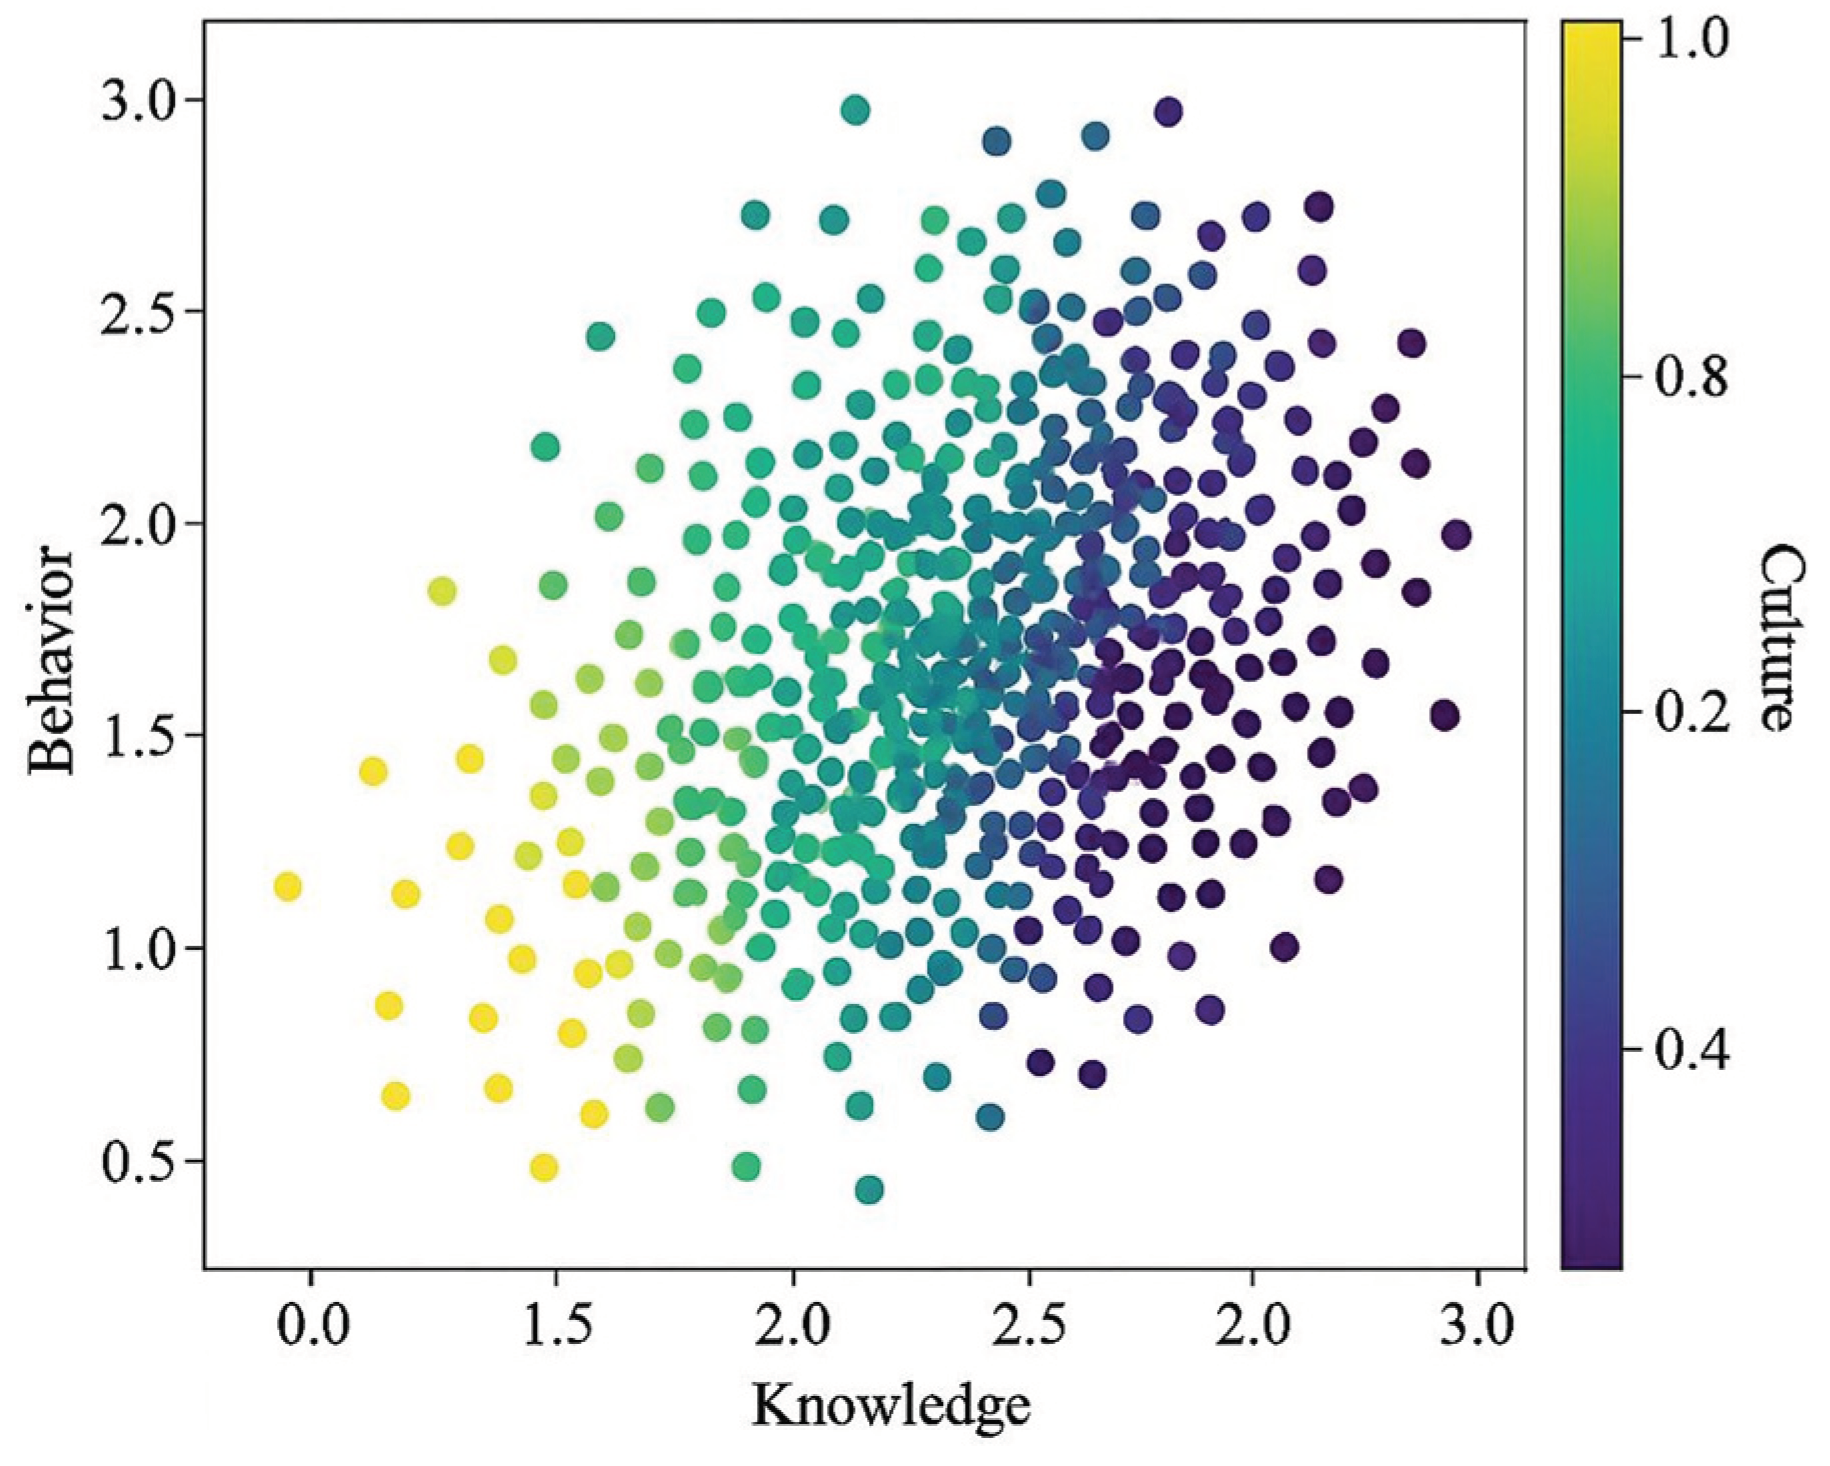
The matching structure incorporates a job profile vector comprising three dimensions: knowledge requirements (K), behavioral expectations (B), and cultural fit (C). Employee competency vectors are denoted as[7] . The matching function between these vectors is defined as follows:
where represents the match between the th employee and the th position, and denotes the position-dimension covariance matrix, modeling variance adjustment strength across dimensions weighted by culture and competency. Under hierarchical organizational nesting, the matching distribution follows a two-level exponential family generalized linear distribution, further applied to the position allocation priority ranking model:
where denotes the standardized score of employee performance weighting, and represents the status variable indicating whether a position is open. The final position priority serves as input to the optimization allocation module within the HR analytics system. The position matching mechanism employs four indicator dimensions in its architectural design: position vectors, employee vectors, competency factors, and cultural labels. With a total of 12 variable categories, principal component reconstruction generates the position space embedding matrix . The human-position mapping results are illustrated in Figure 6.
Figure 6.
Job-Person Matching Distribution in the Multidimensional Culture-Human Resource Space.
5. Experimental Results and Analysis
5.1. Impact of Leadership Model on Engagement (β=0.62, p<0.01)
Empirical analysis showed that leadership competence has a significant positive path effect on employee engagement (β=0.62, p<0.01). Enhanced leadership dimensions, especially strategic communication (0.78) and team support (0.74), boost employee commitment. Model fit indices (CFI=0.94, RMSEA=0.041) met standards. Reliability analysis revealed a Cronbach's α of 0.88, indicating strong internal consistency. This path structure shows leadership factors' stable mediating effect on engagement, providing key input for the compensation satisfaction model (Table 2).
5.2. Regression Results for Compensation and Satisfaction
Multivariate regression analysis was performed with employee satisfaction as the dependent variable, differentiated compensation, welfare elasticity index, and job level as independent variables, and gender, years in position, and cultural labels as controls[8]. The regression coefficient for differentiated compensation on satisfaction was β=0.55 (p<0.01), and for the welfare elasticity index was β=0.41 (p<0.05). Both passed multicollinearity diagnostics (VIF<2.1). The model's R² was 0.483, with F=19.72 (p<0.001), indicating good fit. Standardized residuals were normally distributed, with a Durbin-Watson statistic of 1.97. These results show that the pay mechanism using quantile distribution fits the employee satisfaction model and provides grouping logic for feedback variability.
5.3. Analysis of Employee Turnover Rate Trends
A longitudinal comparison of employee turnover from 2022 to 2023 shows a decrease from 21.3% to 13.3%, a decline of 8% annually. Statistical testing revealed a significant difference (χ²=15.62, p<0.01). After excluding contract expirations and retirements, 302 valid resignation samples were analyzed, with 61.9% being voluntary resignations. Key departments like R&D and Quality Control saw the most significant declines, from 18.7% and 20.5% to 10.2% and 12.4%, respectively. Regression residuals fitting with monthly turnover rate time series showed contribution weights of 0.36 and 0.41 for compensation percentile and cross-cultural leadership behavior, respectively. The trend-adjusted prediction trajectory (AIC=131.82, BIC=145.70) indicated good model fit[9].
5.4. Qualitative Coding Results and Category Induction for Cross-Cultural Feedback
A total of 128 valid cross-cultural employee interview transcripts were collected, averaging 421 words each. Three rounds of NVivo 12.0 coding identified 38 initial nodes, such as "delayed feedback," "cultural identity mismatch," and "unclear promotion mechanisms." After axial coding, six thematic categories emerged. The "cultural conflict" node, with the highest frequency (n=47), centered on linguistic misunderstandings and behavioral biases. One employee stated, "The same words wouldn't cause misunderstandings in my native language." Nodes on value differences (n=39) and mismatched incentives (n=26) had a Pearson correlation of 0.62. Feedback and satisfaction overlap further validated compensation mechanism differences among non-native cultural groups[10].
5.5. Ablation Study: Effect of Transformer-Based Cultural Encoding
To evaluate the contribution of the Transformer-based cultural encoder, we conducted an ablation study by replacing it with static Hofstede scores directly fed into the prediction model. Table 3 summarizes the comparative results. The full model incorporating the Transformer encoder achieved an F1-score of 0.871 and AUC of 0.903, whereas the baseline model using static cultural dimensions without encoding achieved an F1-score of 0.791 and AUC of 0.847. This 8.0% gain in F1-score demonstrates the effectiveness of learning personalized cultural embeddings in capturing latent behavioral variance across cultural groups.
These results validate the theoretical assumption that cultural competence is not merely static but context-sensitive and can benefit from dynamic embedding representations. This also supports our structural design in integrating cultural encoding within the HR analytics pipeline.
6. Conclusion
Integrating human resource analysis with cultural models in multicultural organizational contexts provides methodological support for constructing precise, transferable human resource strategies for global pharmaceutical enterprises. Empirical validation through structural equation modeling and regression analysis confirms the path mechanism linking leadership to employee engagement, while revealing the moderating role of cultural variables in matching and motivation processes. This approach holds innovative significance by combining model construction with empirical evidence. However, data sources remain limited to a single company and region, and the dynamic evolution of cultural dimensions has not been fully incorporated into the analytical framework, imposing certain extrapolation limitations. Future research could expand model applicability using multinational samples and introduce time-series factors to characterize the interdependent evolution of cultural alignment and organizational performance, thereby enhancing the situational responsiveness and governance effectiveness of human resource strategies.
References
- Mahade A, Elmahi A, Alomari K M, et al. Leveraging AI-driven insights to enhance sustainable human resource management performance: moderated mediation model: evidence from UAE higher education[J]. Discover Sustainability, 2025, 6(1): 1-22.
- Ishaq M I, Sarwar H, Franzoni S, et al. The nexus of human resource management, corporate social responsibility and sustainable performance in upscale hotels: a mixed-method study[J]. International Journal of Emerging Markets, 2025, 20(13): 1-29.
- Gong Q, Fan D, Bartram T. Integrating artificial intelligence and human resource management: a review and future research agenda[J]. The International Journal of Human Resource Management, 2025, 36(1): 103-141.
- Alwali J, Alwali W. Transformational leadership and moral norms: green human resource management and behaviour[J]. Management Decision, 2025, 63(5): 1417-1442.
- Salvadorinho J, Ferreira C, Teixeira L. Engagement strategies in a digital multigenerational world: Insights from multinational companies on unlocking the potential of Human Capital 4.0[J]. Journal of Intellectual Capital, 2025, 26(1): 174-204.
- Fayyaz A, Liu C G, Xu Y, et al. Effects of green human resource management, internal environmental management and developmental culture between lean six sigma and operational performance[J]. International Journal of Lean Six Sigma, 2025, 16(1): 109-140.
- Parayitam S, Naina S M, Shea T, et al. The relationship between human resource management practices, knowledge management practices, and performance: Evidence from the healthcare industry in India[J]. Global Business Review, 2025, 26(3): 796-822.
- Enstroem R, Singh Kang P, Bhawna B. The harmonized information-technology and organizational performance model (HI-TOP)[J]. International Journal of Organizational Analysis, 2025, 33(5): 1277-1292.
- Hu,L.;Wu,Q.;Qi,R. (2025). Empowering smart app development with SolidGPT: an edge–cloud hybrid AI agent framework. Advances in Engineering Innovation,16(7),86-92.
- Sun Y, Jung H. Machine learning (ML) modeling, IoT, and optimizing organizational operations through integrated strategies: the role of technology and human resource management[J]. Sustainability, 2024, 16(16): 6751.
Figure 1.
Machine Learning Pipeline for Cross-Cultural HR Analytics.
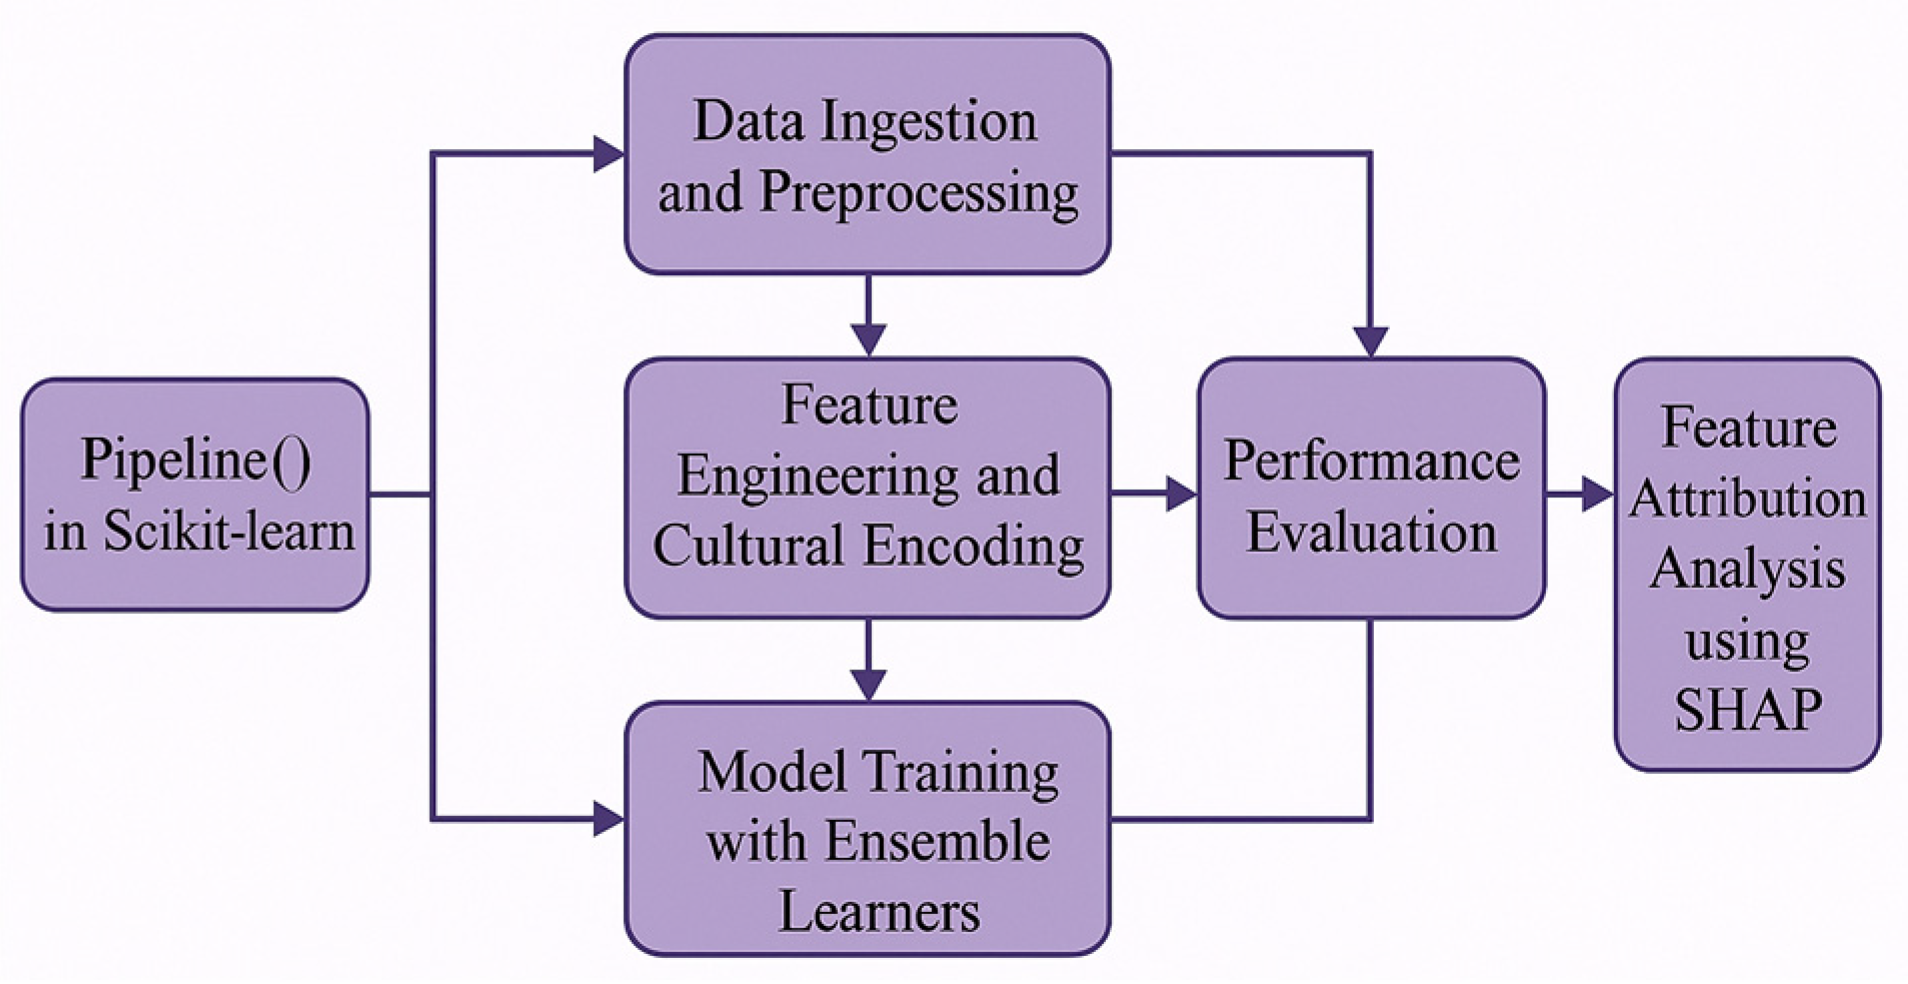
Figure 2.
SHAP Summary: Cultural Dimensions Influencing Revenue.
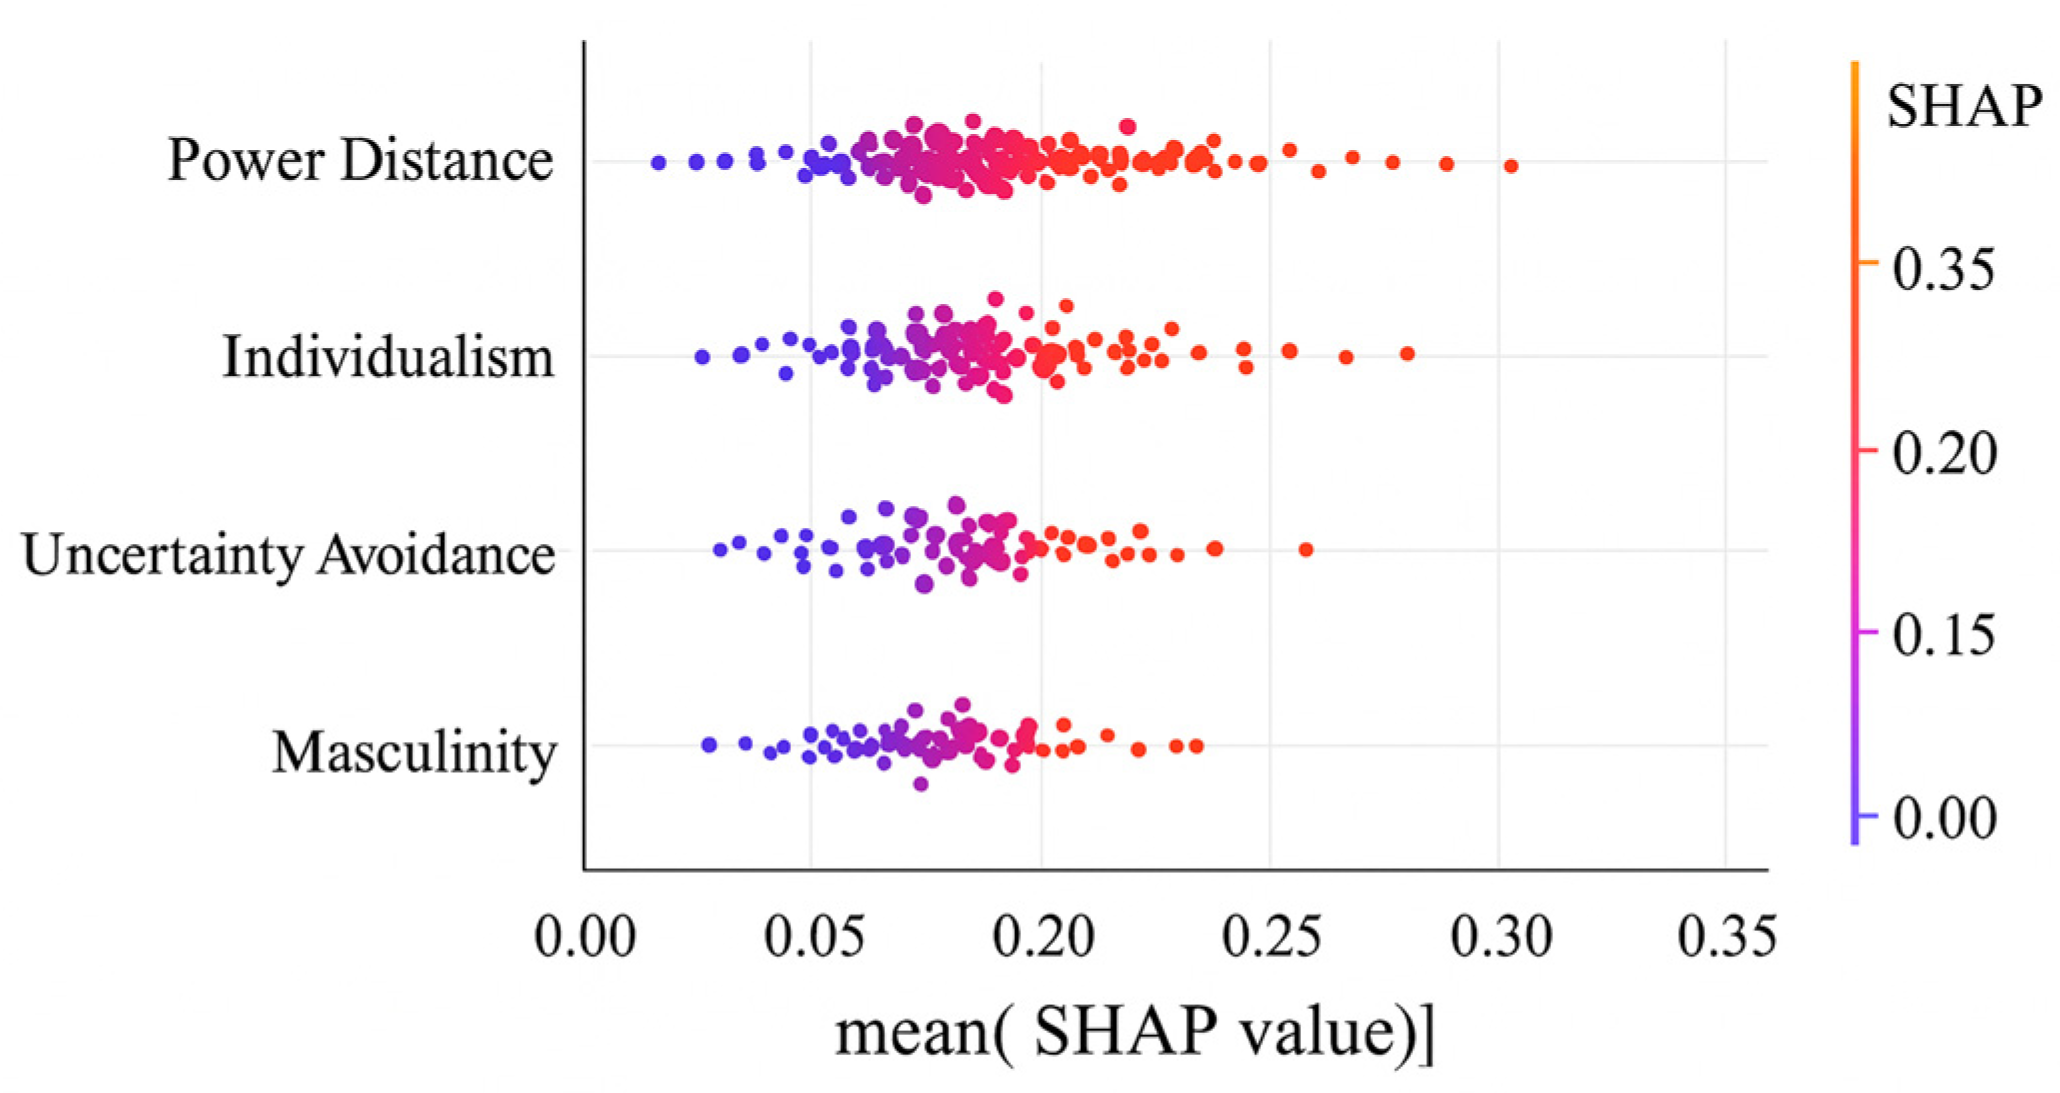
Figure 3.
Leadership Structure Model for Global Biopharmaceutical Enterprises.
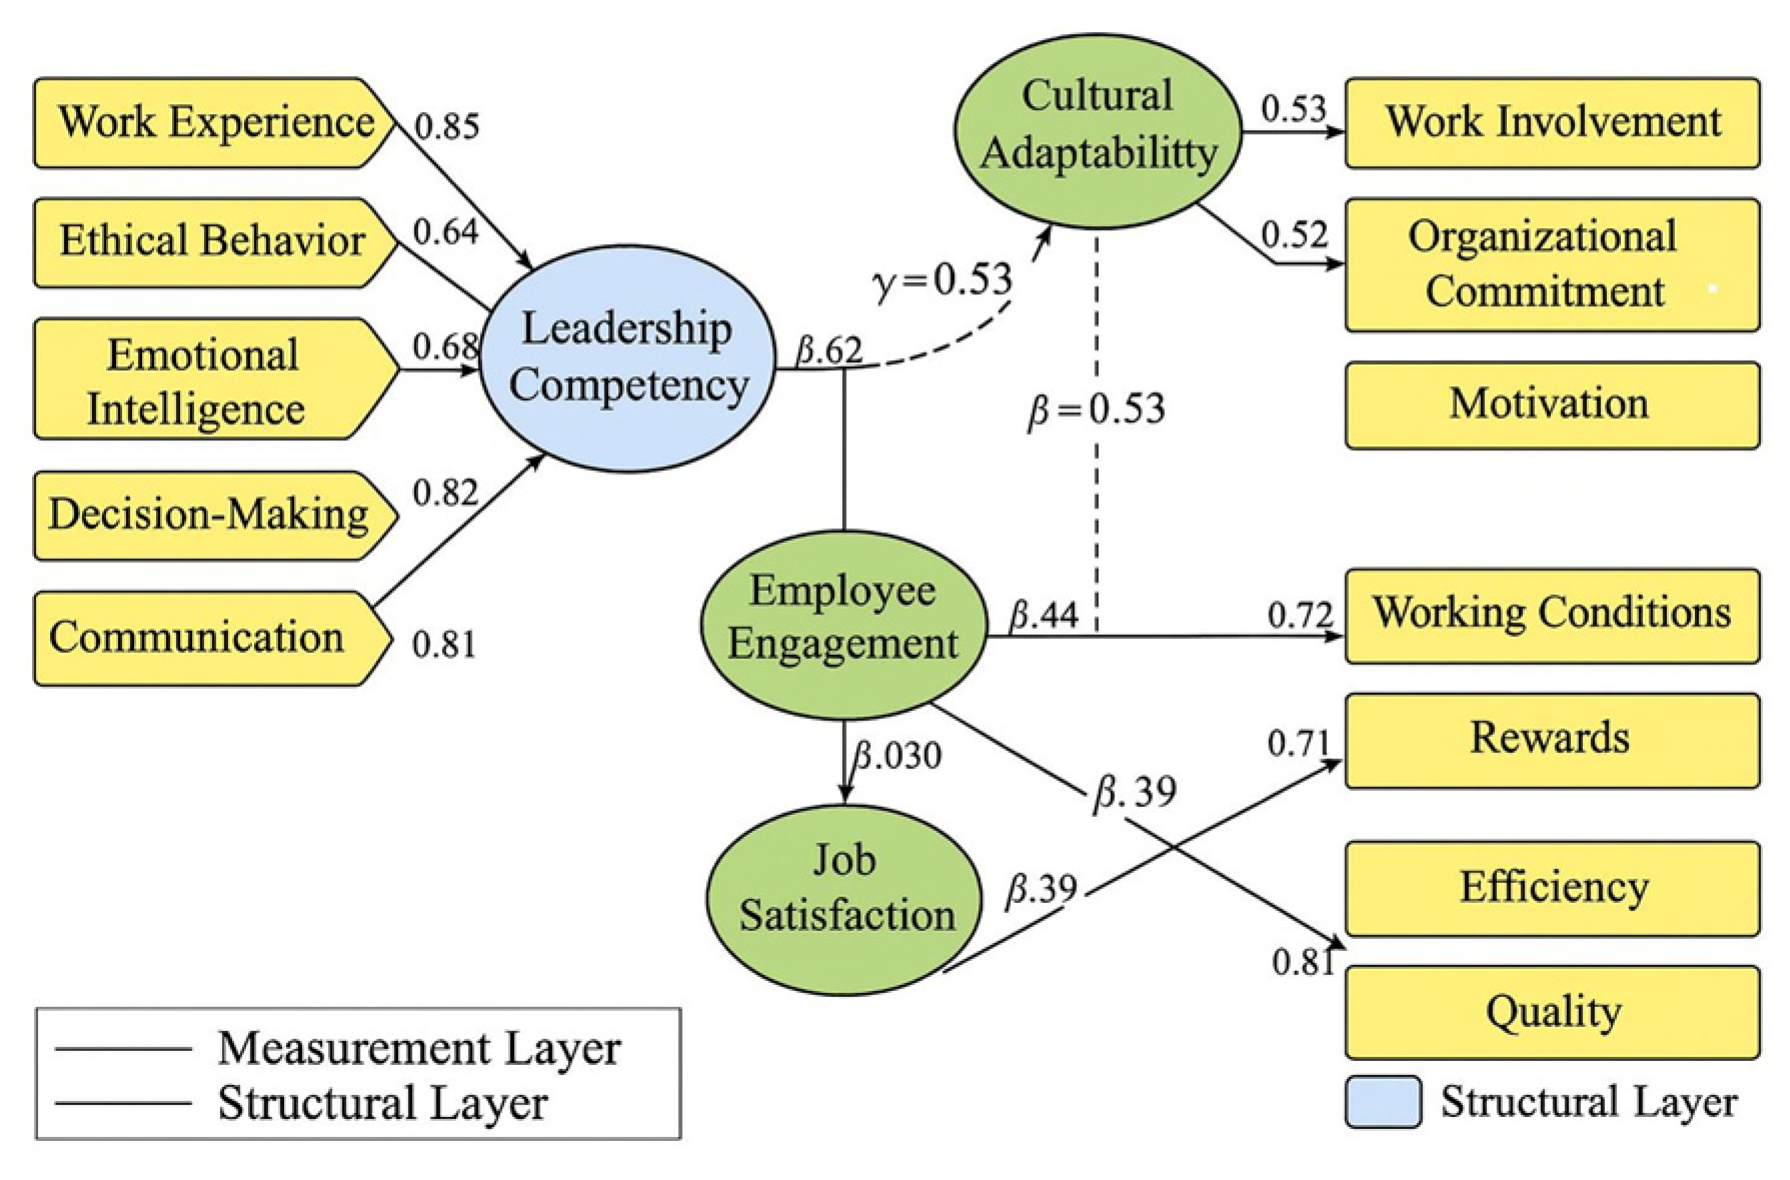
Figure 4.
Cross-Cultural Competence Model Structure.
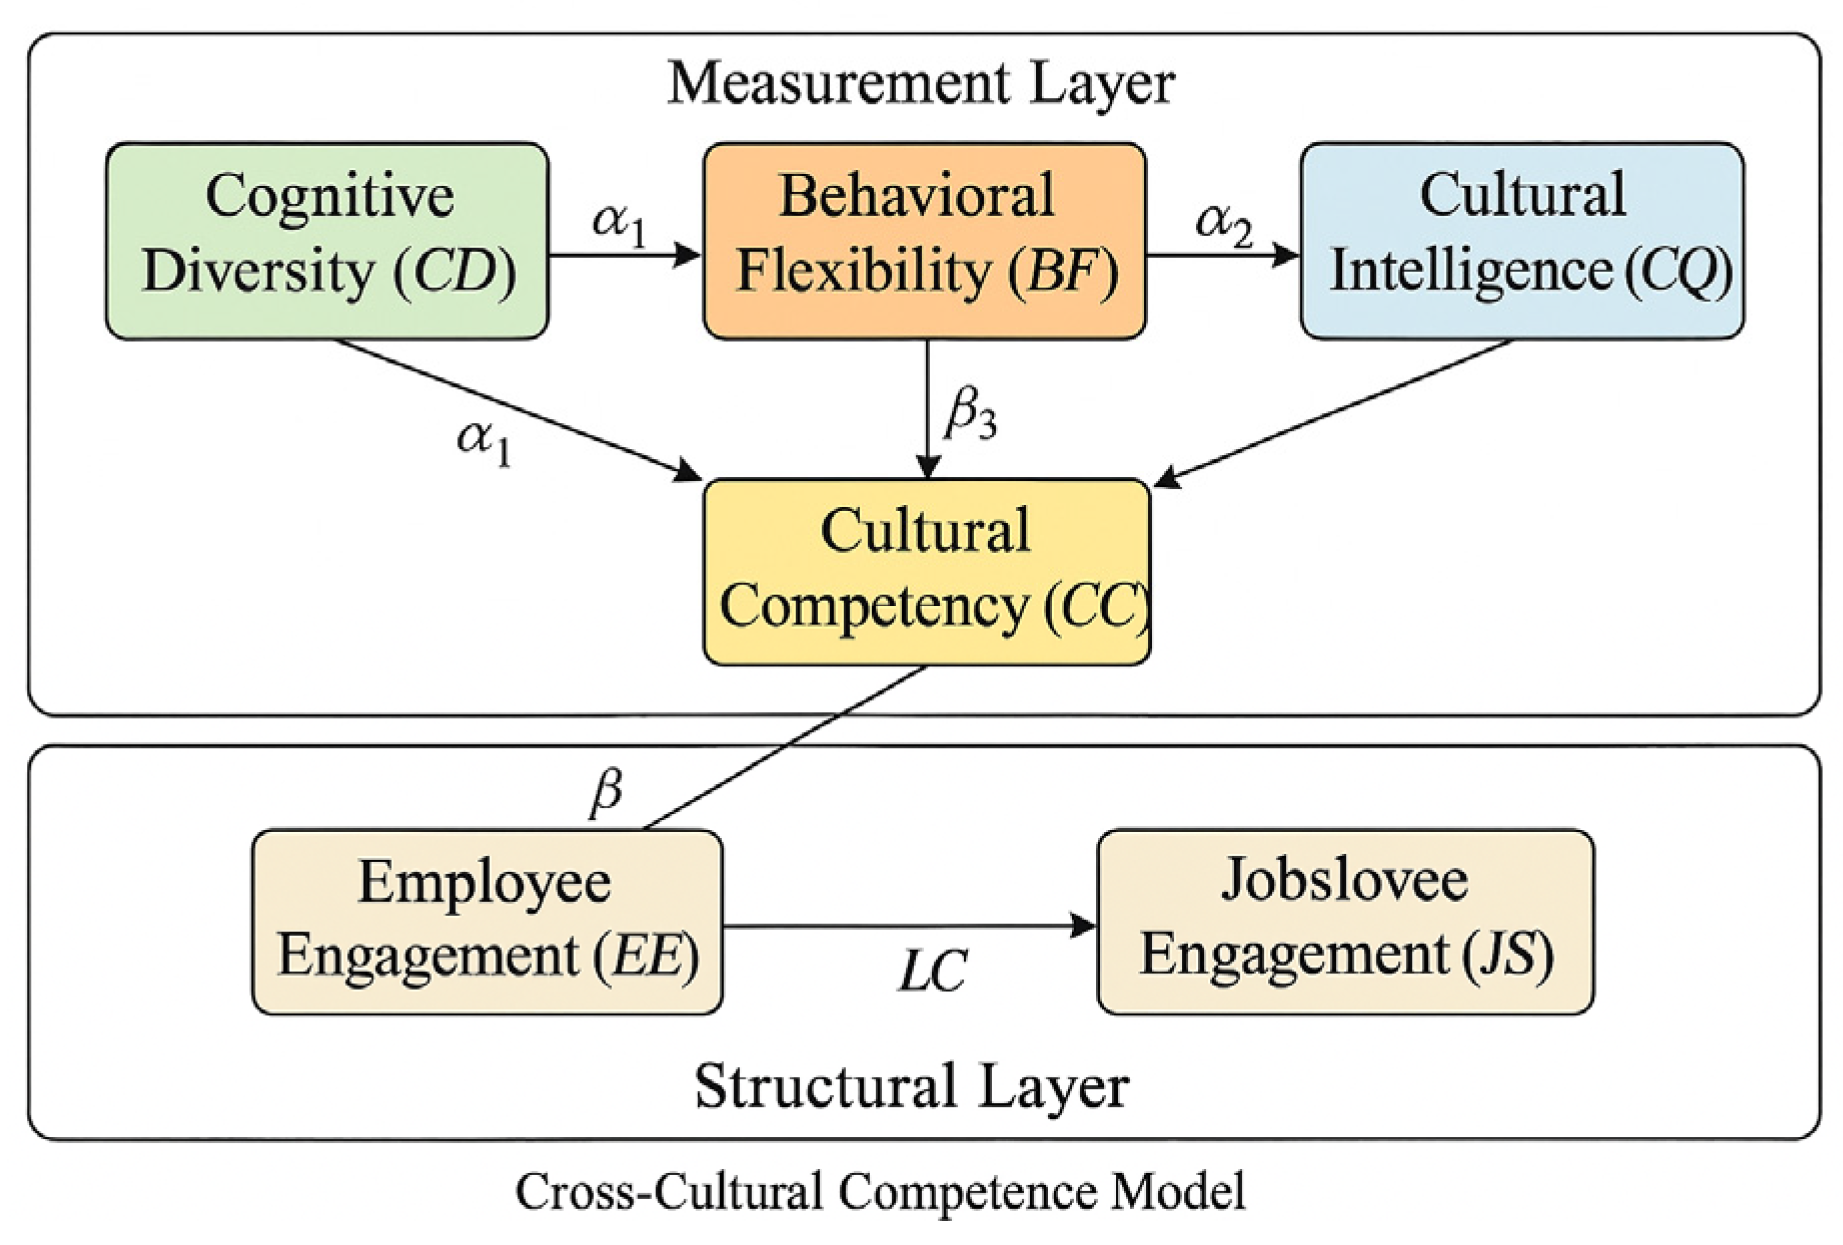
Figure 5.
Employee Engagement Indicator Structure Diagram.
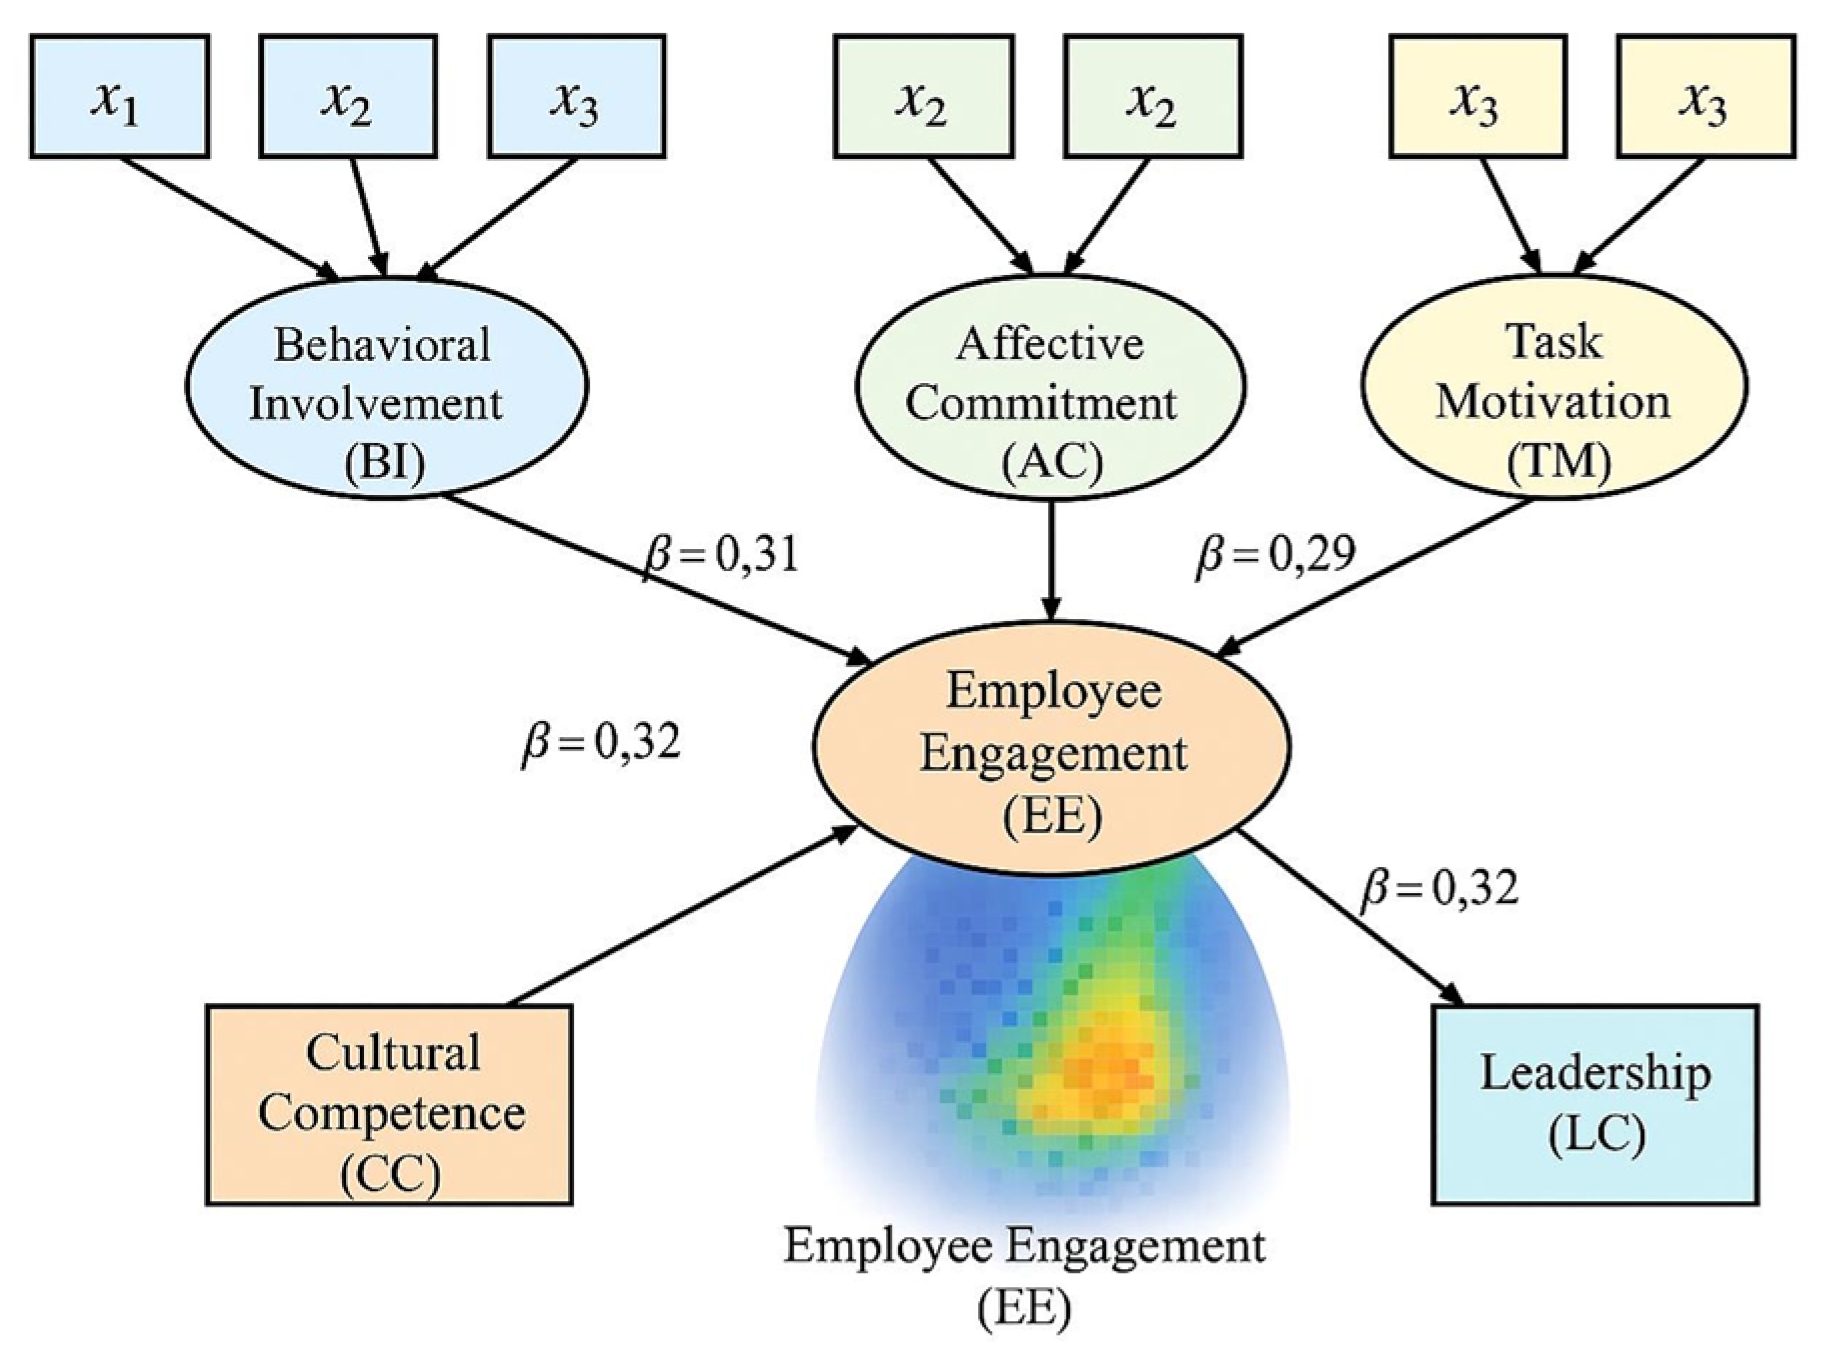

Table 1.
Variable Construction and Measurement Indicator System.
| Latent Variable Category | Indicator Name | Indicator Type | Data Source | Measurement Method/Description |
| Employee Engagement | Work Engagement Index | Continuous | Questionnaire Likert Scale | Average Score of Three Items (α=0.88) |
| Emotional Identification | Continuous | Questionnaire Likert scale | Average Score of Two Items | |
| Performance | Annual Performance Rating | Continuous | HR System | 1–5 Grade Standardization |
| Number of Promotions | Discrete | Personnel Records | Promotion Frequency Within Three Years | |
| Satisfaction Evaluation | Overall Satisfaction | Continuous | Likert Scale Questionnaire | Average Score of Five Items (α=0.83) |
| Compensation Structure | Compensation Percentile Level | Categorical | HR Compensation Module | Divided into Five Percentiles (Q1–Q5) |
| Cross-Cultural Variables | Power Distance | Continuous | Hofstede Database | Matching original country scores (0–100) |
| Individualism | Continuous | Hofstede Database | Employee Cultural Tag Mapping Score | |
| Control Variables | Years in Position | Continuous | Employee Records | Precise to the month, standardized processing |
| Functional Type | Category-based | HR System | Four categories: R&D/Marketing/Production/Functional Support | |
| Gender | Category-Based | Personnel Records | Male/Female Binary Variable |
Table 2.
Path Coefficient Analysis Results for Leadership and Employee Engagement.
| Variable Path | Standardized Coefficient β | Standard Error SE | t-Value | Significance p | Cronbach's Alpha | Confirmatory Fit Index CFI |
| Leadership Competence → Employee Engagement | 0.62 | 0.08 | 7.75 | <0.01 | 0.88 | 0.94 |
| Strategic Communication → Investment Level | 0.78 | 0.06 | 8.12 | <0.01 | — | — |
| Team Support → Emotional Affinity | 0.74 | 0.07 | 7.65 | <0.01 | — | — |
Table 3.
Ablation Results Comparing Transformer-Based Cultural Encoder with Static Hofstede Input.
| Model Variant | Cultural Input Method | F1-score | AUC | Accuracy |
| Full Model (Ours) | Transformer-encoded embeddings | 0.871 | 0.903 | 0.842 |
| Baseline Model | Raw Hofstede dimension vectors | 0.791 | 0.847 | 0.786 |
Disclaimer/Publisher’s Note: The statements, opinions and data contained in all publications are solely those of the individual author(s) and contributor(s) and not of MDPI and/or the editor(s). MDPI and/or the editor(s) disclaim responsibility for any injury to people or property resulting from any ideas, methods, instructions or products referred to in the content. |
© 2025 by the authors. Licensee MDPI, Basel, Switzerland. This article is an open access article distributed under the terms and conditions of the Creative Commons Attribution (CC BY) license (http://creativecommons.org/licenses/by/4.0/).
Copyright: This open access article is published under a Creative Commons CC BY 4.0 license, which permit the free download, distribution, and reuse, provided that the author and preprint are cited in any reuse.


