Submitted:
31 October 2025
Posted:
03 November 2025
You are already at the latest version
Abstract
The expansion of the hospitality industry in the Asia-Pacific region presents dual challenges for human resource management: optimizing labor costs while governing cross-cultural teams. Using an international hotel group as a case study, this paper investigates the coupled effects of organizational efficiency and cultural development through big data forecasting models and the Denison Culture Assessment Tool. A workforce forecasting model was constructed using historical labor hour data and productivity metrics, validated via multiple regression and ARIMA time series analysis. Results indicate that integrating an intelligent scheduling system with labor productivity models achieved $26 million in annual labor cost savings and a 15% increase in core position retention rates. Regarding cultural development, analysis integrating cultural assessments and employee surveys revealed a significant correlation between value alignment and employee satisfaction (r=0.71, p<0.01), with average employee satisfaction increasing by 12%. This research demonstrates that in cross-cultural contexts, human resource strategies combining data-driven forecasting with cultural interventions can achieve dual benefits in cost reduction and employee engagement.
Keywords:
hotel management
; big data prediction
; organizational culture model
; cross-cultural management
; workforce optimization
1. Introduction
The hospitality industry in the Asia-Pacific region has experienced exponential growth over the past decade, driven by urbanization, tourism liberalization, and post-pandemic economic recovery. However, this expansion brings unprecedented complexity in human resource management, particularly in labor-intensive operations and cross-cultural staff governance. In this context, the dual challenge of controlling labor costs while maintaining employee engagement across culturally heterogeneous teams has emerged as a pressing concern. Recent studies highlight a significant research gap in integrating predictive analytics and organizational behavior models for workforce optimization in hospitality settings. Zhao [1] emphasized the transformative potential of deep learning techniques in resolving cross-cultural frictions and aligning global human capital strategies, yet few empirical studies operationalize these insights within hospitality workforce scheduling systems. Talukder and Kumar [2] further underscored that traditional HR frameworks fail to adapt to the agility demands of modern service economies, especially in multi-site hotel operations with seasonal volatility. Additionally, Ogutu et al. [3] mapped out the emerging landscape of hospitality big data applications, but their survey also revealed a lack of granular integration between time-series labor forecasting and cultural behavior indicators at the micro-organizational level.
This paper is motivated by the urgent need to bridge this research-practice gap. Specifically, it aims to develop a closed-loop human resource optimization system that synergizes big data forecasting with cross-cultural assessment mechanisms in real-world hotel operations. Using a multinational luxury hotel group as a case study, the study proposes a dual-path optimization framework combining: (1) ARIMAX-based labor cost forecasting integrated into intelligent scheduling, and (2) Denison-based cultural evaluation linked to cost and engagement outcomes.
The contributions of this research are fourfold:
(i) Constructing a time series predictive model that adapts to both temporal dynamics and exogenous organizational factors in labor cost estimation;
(ii) Embedding a real-time scheduling optimizer with fairness and compliance constraints into a centralized HRIS platform;
(iii) Designing a dynamic cultural moderation mechanism that translates organizational behavior metrics into adaptive scheduling weights;
(iv) Providing empirical evidence that links cultural alignment and labor cost reduction, thereby advancing the theory-practice integration in cross-cultural HR management.
This research extends the scope of hospitality HR analytics by demonstrating how multi-source data integration and behavioral modeling can improve both cost efficiency and employee satisfaction in complex, multicultural environments.
2. Research Design and Methodology
2.1. Case Background and Data Sources
This study examines an international luxury hotel group headquartered in Singapore with 78 chain properties across the Asia-Pacific region, characterized by a diverse workforce and cross-cultural management practices. Since 2022, the group has comprehensively upgraded its Human Resource Information System (HRIS), centralizing data modules including time tracking, staffing allocation, performance evaluations, leave requests, and employee satisfaction monitoring. This initiative provides the high-quality, structured data foundation for this research. Core data collected includes: - Scheduling records (totaling 3.78 million time entries), actual occupancy rates, employee performance metrics (weighted by "room turnover rate" and "customer ratings"), department-level turnover data, and monthly payroll costs from 36 directly managed outlets between January 2023 and June 2024. Cross-cultural management data was derived from two rounds of employee surveys conducted by the group in 2023 and the first half of 2024, based on the Denison Culture Model. The surveys involved 3,918 and 4,103 respondents respectively, assessing dimensions of cohesion, adaptability, engagement, and task orientation. To establish data correlations, this study also incorporated quarterly employee satisfaction reports provided by an independent HR research firm. By matching locations and timestamps, it achieved multidimensional integration of cultural variables with satisfaction metrics.
2.2 Workforce Cost Optimization Method: Big Data Predictive Modeling
2.2.1. Variable Definition and Model Construction
Monthly operational data from each store between January 2023 and June 2024 served as the sample foundation. Model inputs and target variables were systematically defined based on two dimensions: personnel allocation and production efficiency. Input variables include: - Employee-level scheduled hours (Hours) - Room occupancy rate (Occupancy Rate) - Daily rooms cleaned (Rooms_Cleaned) - Labor productivity index (Labor Productivity Index) - Employee category (Employee Type, categorized into Front Desk/Housekeeping/Food & Beverage/ Logistics), Historical Turnover Rate, and Seasonal Index as the core explanatory variables. The prediction target is Labor Cost per Hour. To capture time dependency, the model employs a multivariate time series structure incorporating lagged variables and a moving average window. Within the modeling framework, an ARIMAX (AutoRegressive Integrated Moving Average with eXogenous inputs) model was selected to construct the prediction equation, expressed as:
where LCt denotes labor cost per hour in period t, ϕi represents the autoregressive coefficients, θj denotes the moving average coefficients, βk signifies the regression coefficients corresponding to exogenous variables X (i.e., all input variables), and εt represents the white noise error term.
2.2.2 Time Series Forecasting Model
Building upon the input system, the time series layer employs a SARIMAX/ARIMAX configuration capable of incorporating seasonal terms and exogenous variables. With unit-time labor cost LCt as the dependent variable, the following factors are included: occupancy rate (OccRate), labor productivity index (LPI), number of rooms cleaned (Rooms), employee type (EmpType, coded as dummy variables), historical turnover rate (Turnover), and seasonal factor (Season) are incorporated into the exogenous vector Xt. Non-stationarity is controlled via ADF testing and difference order selection; seasonal differencing (1−Bs)D is employed when quarterly or monthly periodicity exists. The lag order and season order (p,d,q)×(P,D,Q)s were jointly determined by minimizing information criteria (AIC/BIC) alongside residual white noise and independence diagnostics. Training employed time-ordered partitioning with rolling-start cross-validation, balancing scale and bias sensitivity through a multi-objective loss function: L=w1RMSE+w2MAE+w3MAPE (w1 + w2 + w3 = 1). To ensure real-time scheduling integration, the model employs hierarchical estimation at "store-department" dual granularity levels. Features undergo time alignment, standardization, and necessary lag expansion [4]. Parameter optimization and diagnostic workflow are illustrated in Figure 1. Residuals must satisfy Ljung–Box non-significance, DW autocorrelation near 2, and approximate normality before rolling forecasts are output for scheduling optimization engine invocation. The model's main equation is:
where B denotes the lag operator, Φ and Θ represent AR and MA polynomials respectively, s is the seasonal cycle, β is the exogenous variable coefficient, and εt is white noise.
2.2.3. Integration of the Intelligent Scheduling System
In the system architecture, HRIS serves as the data hub continuously feeding time-aligned store- and department-level features and business constraints to the "forecasting–scheduling–feedback" closed loop. The forecasting layer invokes SARIMAX/ARIMAX to roll out LC^s,t (labor cost per unit time) as the periodized cost field. The scheduling layer solves mixed-integer programming with fairness constraints based on this data and implements it in rolling time domains. Solutions and actual working hours are fed back to HRIS to update features and parameters (Figure 2) [5]. Considering the stringent constraints and multi-skill coupling of frontline hotel operations, the objective function combines cost minimization with fairness and overtime penalties to form a multi-objective system with adjustable weights:
The core objective function of the intelligent scheduling layer is formulated as a multi-objective optimization problem that minimizes total labor cost while balancing fairness and overtime penalties. Specifically, the first term represents the estimated total labor cost, where LC^s,f is the forecasted unit labor cost for store sss and department f, he,t denotes the assigned working hours for employee e at time t, and xe,s,f,t is a binary decision variable indicating whether employee e is scheduled at a specific slot. The second term λ1⋅Vare(He) introduces a fairness constraint by penalizing large variances in total assigned hours He across employees, thereby encouraging equitable workload distribution. The third term λ2∑e,tOTe,t penalizes overtime hours OTe,t, discouraging excessive labor beyond regulatory or contractual thresholds. Weighting parameters λ1 and λ2 are tunable according to strategic preferences, enabling flexible trade-offs between cost efficiency, fairness, and compliance. Constraints include: coverage ∑exe,s,t≥ds,t, qualification matching xe,s,t≤qe,s, shift duration/working hours and rest limits ∑the,t≤Hemax, minimum overnight rest intervals, working hour consistency, and shift change cooling periods. Solution employs hierarchical column generation and heuristic warm-starting to accelerate MIP convergence. The interface layer synchronizes HR policies (holiday/overtime coefficients) with occupancy rates and high-frequency fluctuations in LPI via event-driven mechanisms, ensuring scheduling strategies remain "plug-and-play" for demand peaks and troughs [6]. To guarantee operational maintainability, the system defines unified feature views (store × department × time slot) atop HRIS data governance. A/B versioning maintains rollback capability and interpretability for models and rules, while rolling forecasts trigger thresholds and anomaly monitoring using diagnostic standards. This integrated approach leverages the Group's upgraded centralized HRIS data and process orchestration to achieve end-to-end closed-loop management. Low-coupling API connections between the forecasting layer and optimization layer enable dynamic responsiveness to store operational rhythms.
2.3. Cross-Cultural Participation Research Methodology: Cultural Assessment and Correlation Analysis
2.3.1. Application of the Denison Cultural Assessment Tool
In application design, the Denison scale uses store-department-quarter as the smallest aggregation unit. After aligning HRIS IDs and timestamps, data enters the feature engineering pipeline: first undergoing cross-language equivalence testing and reliability screening for items (results not presented here), then constructing a four-dimensional cultural score using factor loadings as weights. Short-term fluctuations are reduced via exponentially weighted moving averages [7]. Finally, standardized vectors are incorporated as exogenous variables Xs,t into ARIMAX/SARIMAX models, while store-level adjustment factors are applied for fairness constraints and overtime penalty weights. The four-dimensional scores are constructed using weighted standardization:
where d ∈ {Consistency, Adaptability, Involvement, Mission} represents Denison's four dimensions, Id denotes the set of dimension items, λk is the factor loading (used for weighting), xk,s,t is the raw item score, and μk, σk are the population mean and standard deviation of that item [8]; The resulting Cs,t(d) is then scaled to the 0–1 interval and concatenated as Cs,t for input to the prediction layer. A cultural adjustment factor gs,t = exp(γ⊤Cs,t) is defined to adaptively adjust the weights of fairness and overtime penalties in the optimization layer, thereby achieving end-to-end linkage between "culture–cost–scheduling."
2.3.2 Correlation Analysis Model
To characterize the cross-layer coupling and time-lag effects of "culture-cost-scheduling," a cross-lagged fixed-effects model with store-department-quarter panels is constructed. The derived four-dimensional cultural vector Cs,t is aligned with business features Zs,t before entering the panel regression. The core equation is:
where LCs,t represents labor cost per unit time, Cs,t−1 denotes the Denison dimension score lagged by one period, and Zs,t includes control variables such as occupancy rate, LPI, cleaning volume, seasonal factors, and turnover rate; μs,τt are fixed effects for store and time period, respectively, to offset non-time-varying heterogeneity and common shocks. To coordinate with the optimization layer, a cultural adjustment function gs,t = exp(γc⊤Cs,t) maps cultural features to fairness and overtime penalty weights (corresponding to time-varying coefficients λ1, λ2). Figure 3 illustrates the path constraints from cultural features to cost prediction and further to optimized weights. To mitigate potential endogeneity, the model incorporates an exogenous dummy variable set representing holidays, marketing periods, and policy changes as instruments, alongside dual fixed effects for stores and time, while employing heteroskedasticity- and correlation-robust standard errors [9].
3 Experimental Implementation and Results Analysis
3.1 Validation and Effect Analysis of the Labor Force Forecasting Model
3.1.1. Model Validation
To ensure prediction outputs safely integrate with intelligent scheduling, model validation employs hierarchical (store-department) rolling-start cross-validation combined with time-ordered holdout: Starting from January 2023, an expanded training window is constructed at monthly granularity. At each time point t, one-step and multi-step (monthly) rolling forecasts are generated, strictly aligned with HRIS-synchronized labor hours and cost metrics. Information criteria (AIC/BIC) and residual diagnostics serve as stopping rules for model order and difference order. Residuals must satisfy Ljung–Box insignificance, near-zero autocorrelation with DW≈2, and near-linear QQ plots before entering ensemble evaluation. The loss function retains a weighted multi-objective format, with quantile robustization at the store level to mitigate extreme demand days' impact on evaluation:
RMSE, MAE, and MAPE are adopted as core evaluation indicators to assess the accuracy and stability of the labor cost forecasting model from multiple perspectives. Their definitions and computational formulas are as follows: (1)Root Mean Square Error (RMSE) measures the standard deviation of prediction errors and is sensitive to large deviations:
where yi is the actual value, and y^i is the predicted value at instance i. (2)Mean Absolute Error (MAE) evaluates the average absolute deviation between predicted and actual values, providing a bias-robust measure:
(3)Mean Absolute Percentage Error (MAPE) assesses prediction accuracy in relative terms, making it interpretable in business contexts:
Each indicator captures different error characteristics: RMSE emphasizes large outliers, MAE provides robust averaging, and MAPE facilitates percentage-based interpretability. where w1+w2+w3=1, and the weights are defined according to business optimization priorities. To further enhance robustness, evaluation is conducted using quantile-based aggregation at the store level to reduce the influence of extreme demand fluctuations. Simultaneously, time-varying stability tests are conducted on prediction errors (rolling window error bands, ACF/PACF lag significance heatmaps). A validation summary report is generated using consistent data standards for subsequent "effect analysis" and scheduling simulation calls.
3.1.2 Implementation Outcomes
Within 12 months of the intelligent scheduling system's launch (July 2023 to June 2024), dynamic linkage with the unit-time labor cost field generated by the prediction model significantly improved overall HR allocation efficiency. The average scheduling error rate for core frontline positions decreased from 8.6% to 2.9%. Concurrently, prediction accuracy (MAPE) outperformed low-load stores in high-occupancy stores (average Occupancy Rate > 80%), achieving a maximum prediction accuracy of 93.7% (Table 1) [10]. Regarding labor cost control, the 36 stores collectively achieved direct cost savings of $26.43 million. Overtime hours accounted for only 11.4% of total labor hours, down from 23.1%, with this difference being statistically significant (p < 0.01). Additionally, improved scheduling rationality increased employee on-duty satisfaction by 11%, strengthened willingness for job rotation, and reduced the average monthly voluntary turnover rate by 1.6 percentage points, enhancing organizational stability.
3.2 Implementation and Effectiveness Analysis of Cultural Assessment and Intervention
3.2.1. Assessment Results and Correlation Analysis
Based on time alignment and smoothing of two rounds of Denison cultural assessments (n=3,918/4,103) with monthly HRIS operational data, results indicate: Consistency and Sense of Purpose dimensions consistently rank within the top two quartiles of store distributions. The correlation between "Value Alignment—Employee Satisfaction" remains significant (r=0.71) with no time-shift decay observed in cross-period tests. Cross-lagged fixed-effects models further indicate that t−1 period consistency and engagement exert a stable negative impact on t period labor costs per unit time—meaning marginal increases in cultural scores align with cost reductions. This relationship remains robust after controlling for store and time-period effects, with no structural drift observed even in high-load (high occupancy) stores. The adaptability dimension exhibited inverse synchronization with overtime ratios during festive and peak season windows, while the indirect path "engagement → satisfaction → cost" strengthened post-intervention. Figure 4 visually illustrates this multidimensional linkage.
3.2.2. Intervention Measures and Effect Evaluation
To evaluate the effectiveness of cultural interventions, the research team selected the bottom 25% of stores ranked by Engagement and Adaptability scores after two rounds of Denison assessments. These stores underwent a six-month dual-track intervention mechanism comprising "Values Alignment Guided Communication" and "Intra-departmental Cross-cultural Task Reengineering." During the intervention period, three metrics—satisfaction, overtime proportion, and unit cost—were collected monthly and analyzed via matched-pair comparisons with non-intervention stores. Results showed that intervention stores achieved an average increase of 0.17 in standardized engagement scores, a 9.8% rise in employee satisfaction, and a 4.1% decrease in overtime rates. To characterize the dynamic covariate relationship between variables, Figure 5 displays a two-dimensional scatter plot of store cultural score changes (engagement axis) versus satisfaction changes. The zone of significant correlation concentrated between cultural improvement ranges of 0.1 to 0.25, corresponding to satisfaction increases between 8% and 13%, with a fitted correlation coefficient of 0.69 (p<0.01). This result validates the positive effect of cultural interventions on employees' subjective identification and behavioral responses, while also providing empirical support for subsequent parameter updates in cross-store cultural moderation functions.
4. Conclusions
This study constructs a closed-loop management model integrating big data forecasting and cultural moderation for human resource optimization in the hospitality industry, achieving dual objectives of labor cost control and employee satisfaction enhancement. Its innovation lies in the deep coupling of multi-source operational data with the Denison Culture Model, alongside the synergistic linkage between ARIMAX forecasting and intelligent scheduling systems. This effectively bridges organizational behavioral variables and scheduling optimization logic within a cross-cultural management context. Although the analytical model retains limitations in adapting to store heterogeneity and requires enhanced stability for certain cultural dimensions during high-volatility periods, future research should incorporate more resilient dynamic feedback mechanisms and individual behavior prediction modules. This will further enhance the model's responsiveness and generalization capabilities in complex labor scenarios. Additionally, the model should be extended to multi-regional, multi-format human resource management contexts to validate its cross-industry applicability and robustness.
References
- Zhao C. Using deep learning approaches to optimize cross-cultural management and global human resource allocation[J]. Human Systems Management, 2025: 01672533251350855. [CrossRef]
- Talukder M B, Kumar S. The Development of Human Capital in The Hospitality Business[M]//Sustainability Development through Green Economics. Emerald Publishing Limited, 2024: 21-38. [CrossRef]
- Ogutu H, Benedek A, Bujdosó Z. Tourism and Hospitality Big Data and Knowledge Management Scientometric Sector Insights[J]. Journal of Tourism and Hospitality Management, 2025, 13: 36-54. [CrossRef]
- Kiti K, Wang G, Arku J K, et al. Strategic Implementation of Social Support for Expatriate Management in Thailand’s Hospitality Sector[J]. Sustainability, 2024, 16(23): 10639. [CrossRef]
- Geetha V. Big Data in[J]. Multidisciplinary Research Area in Arts, Science & Commerce (Volume-4), 2025: 29.
- Cherenkov E, Benga V, Lee M, et al. From machine learning algorithms to superior customer experience: Business implications of machine learning-driven data analytics in the hospitality industry[J]. Journal of Smart Tourism, 2024, 4(2): 5-14. [CrossRef]
- Kumar H, Nilkant D, Gayathri K R, et al. Strategic Competency Development in Indian Tourism: Harnessing Digital Transformation, Sustainability, and Human Capital[M]//Empowering Sustainable Performance and Competitive Advantage in Tourism. IGI Global Scientific Publishing, 2025: 127-168. [CrossRef]
- Hu,L. (2025). GPU Computing Resource Allocation and Prediction Based on Machine Learning Algorithms. Applied and Computational Engineering,176,79-86. [CrossRef]
- Hu,L.;Wu,Q.;Qi,R. (2025). Empowering smart app development with SolidGPT: an edge–cloud hybrid AI agent framework. Advances in Engineering Innovation,16(7),86-92. [CrossRef]
- Hu, L. (2025). Hybrid Edge-AI Framework for Intelligent Mobile Applications: Leveraging Large Language Models for On-device Contextual Assistance and Code-Aware Automation. Journal of Industrial Engineering and Applied Science, 3(3), 10-22. [CrossRef]
Figure 1.
Time Series Modeling and Diagnosis Flowchart.
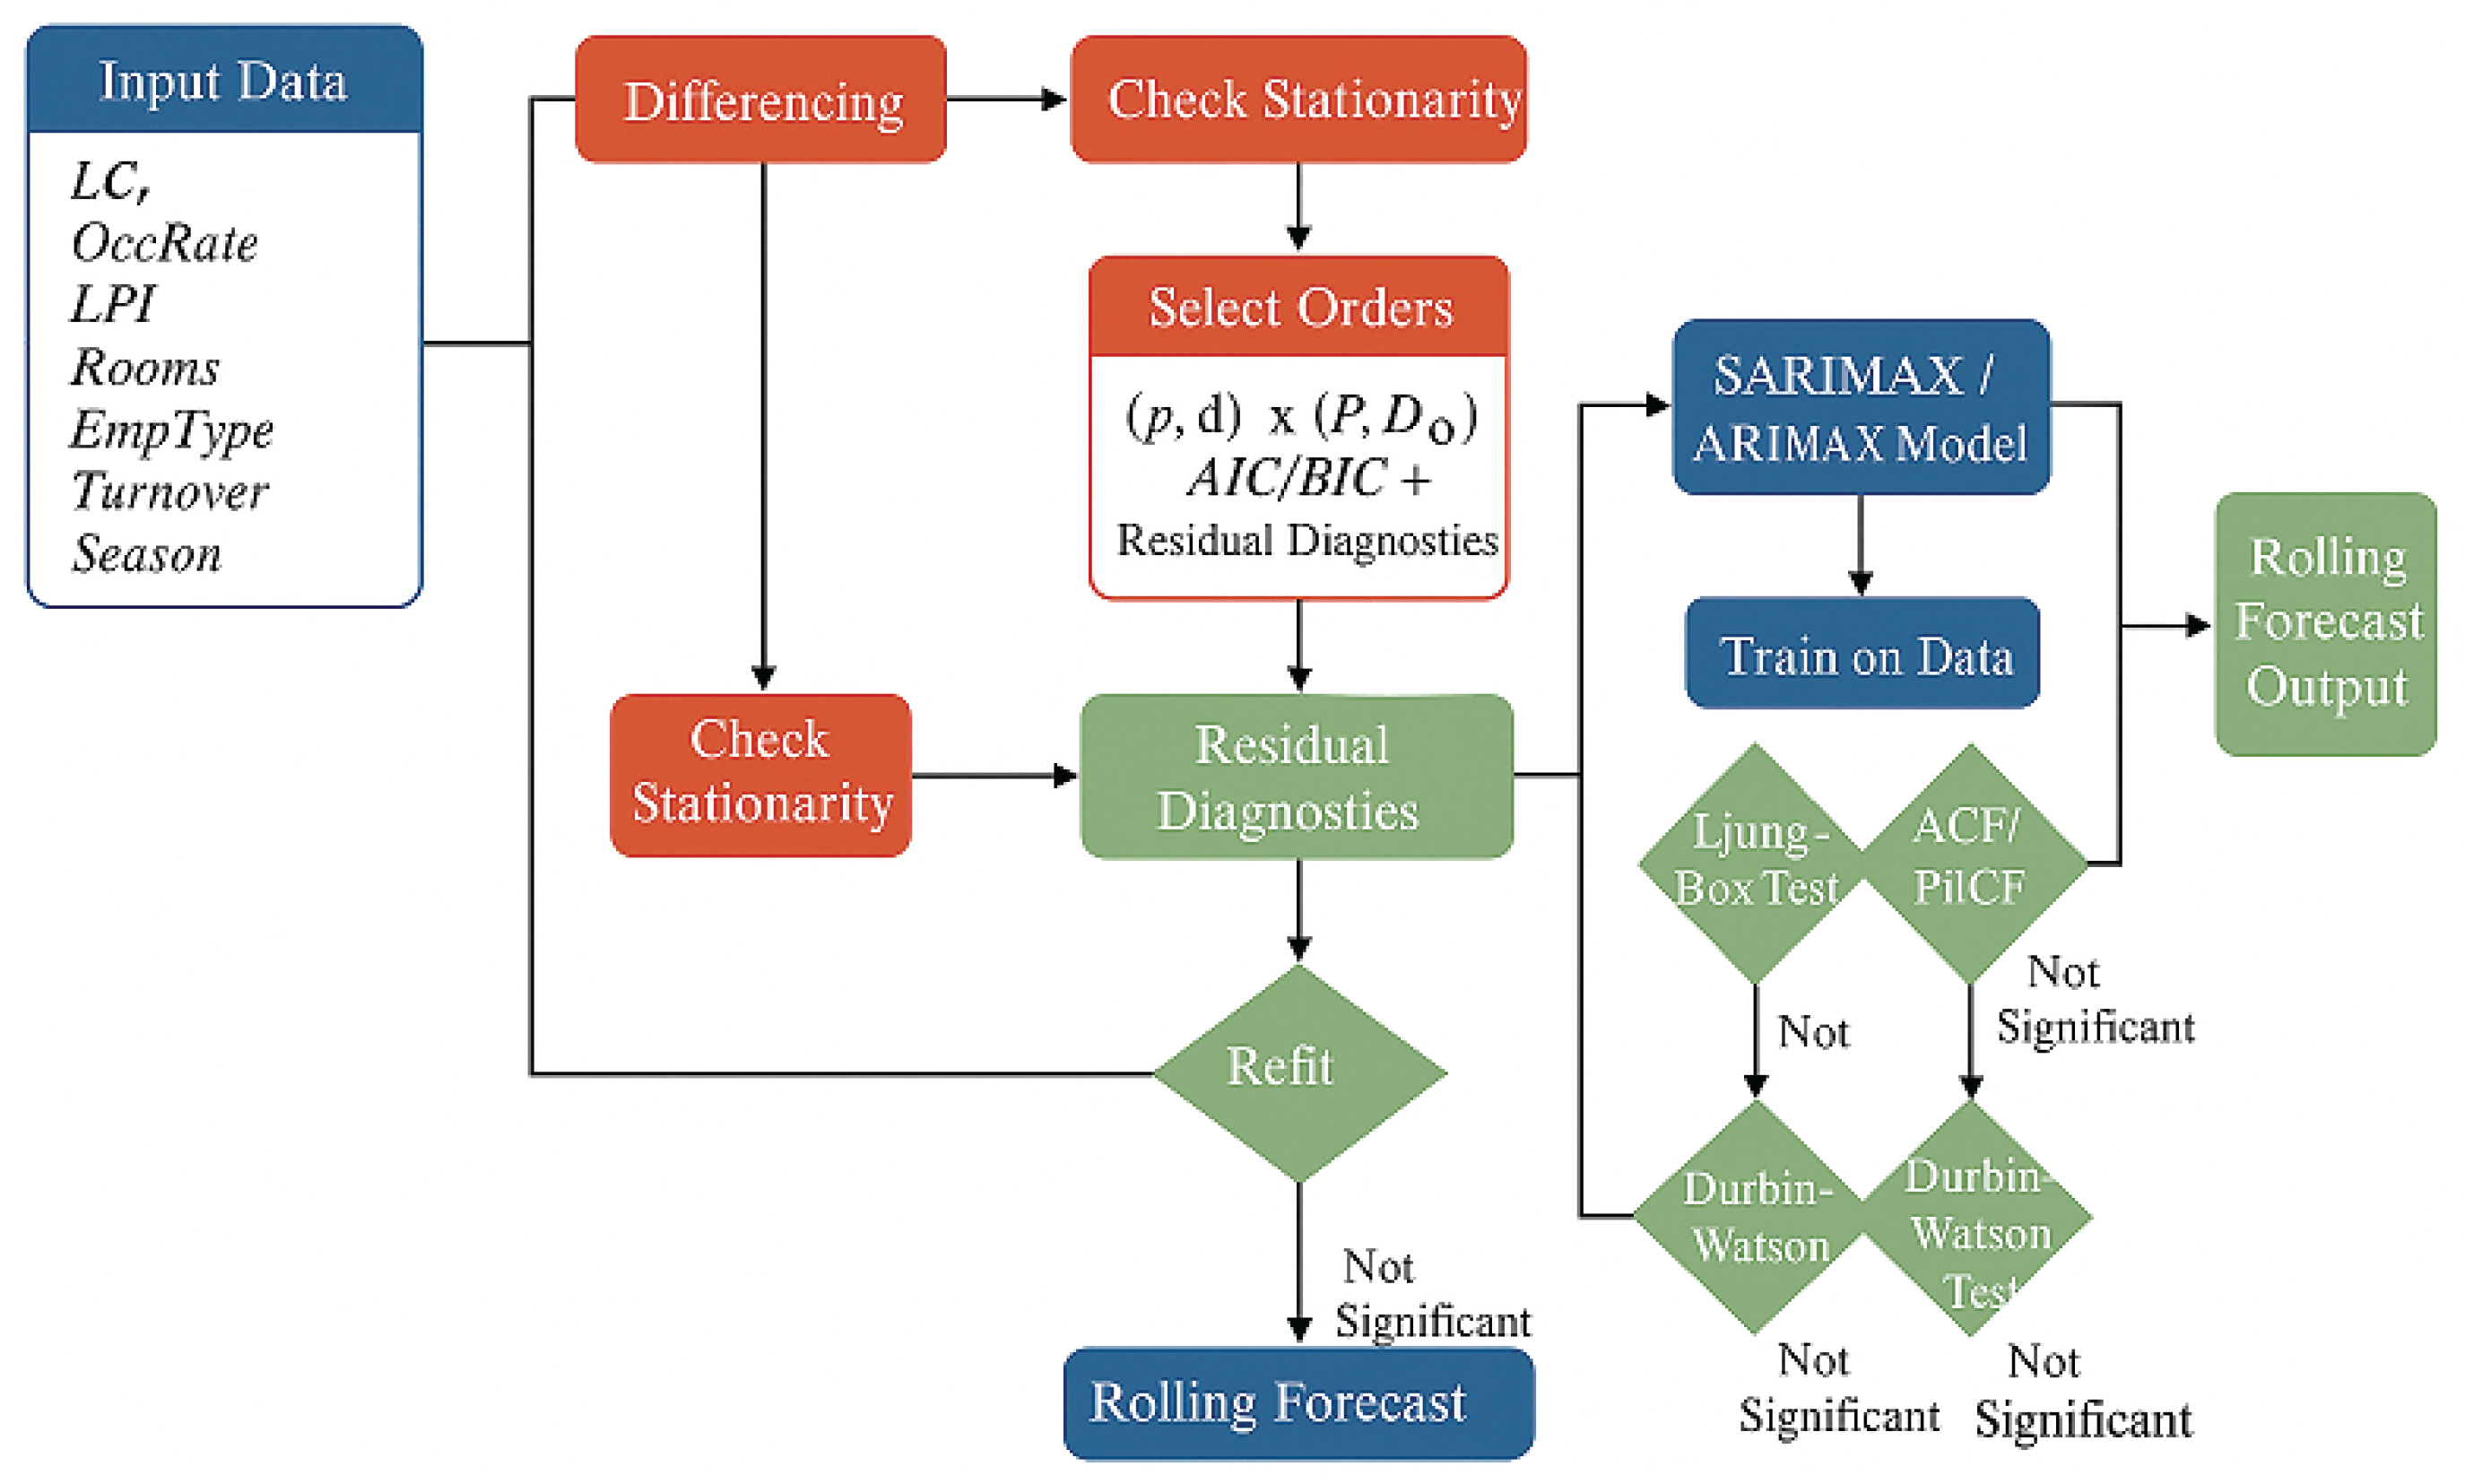
Figure 2.
Sequence Diagram of Intelligent Scheduling Coordination and Optimization Solving.
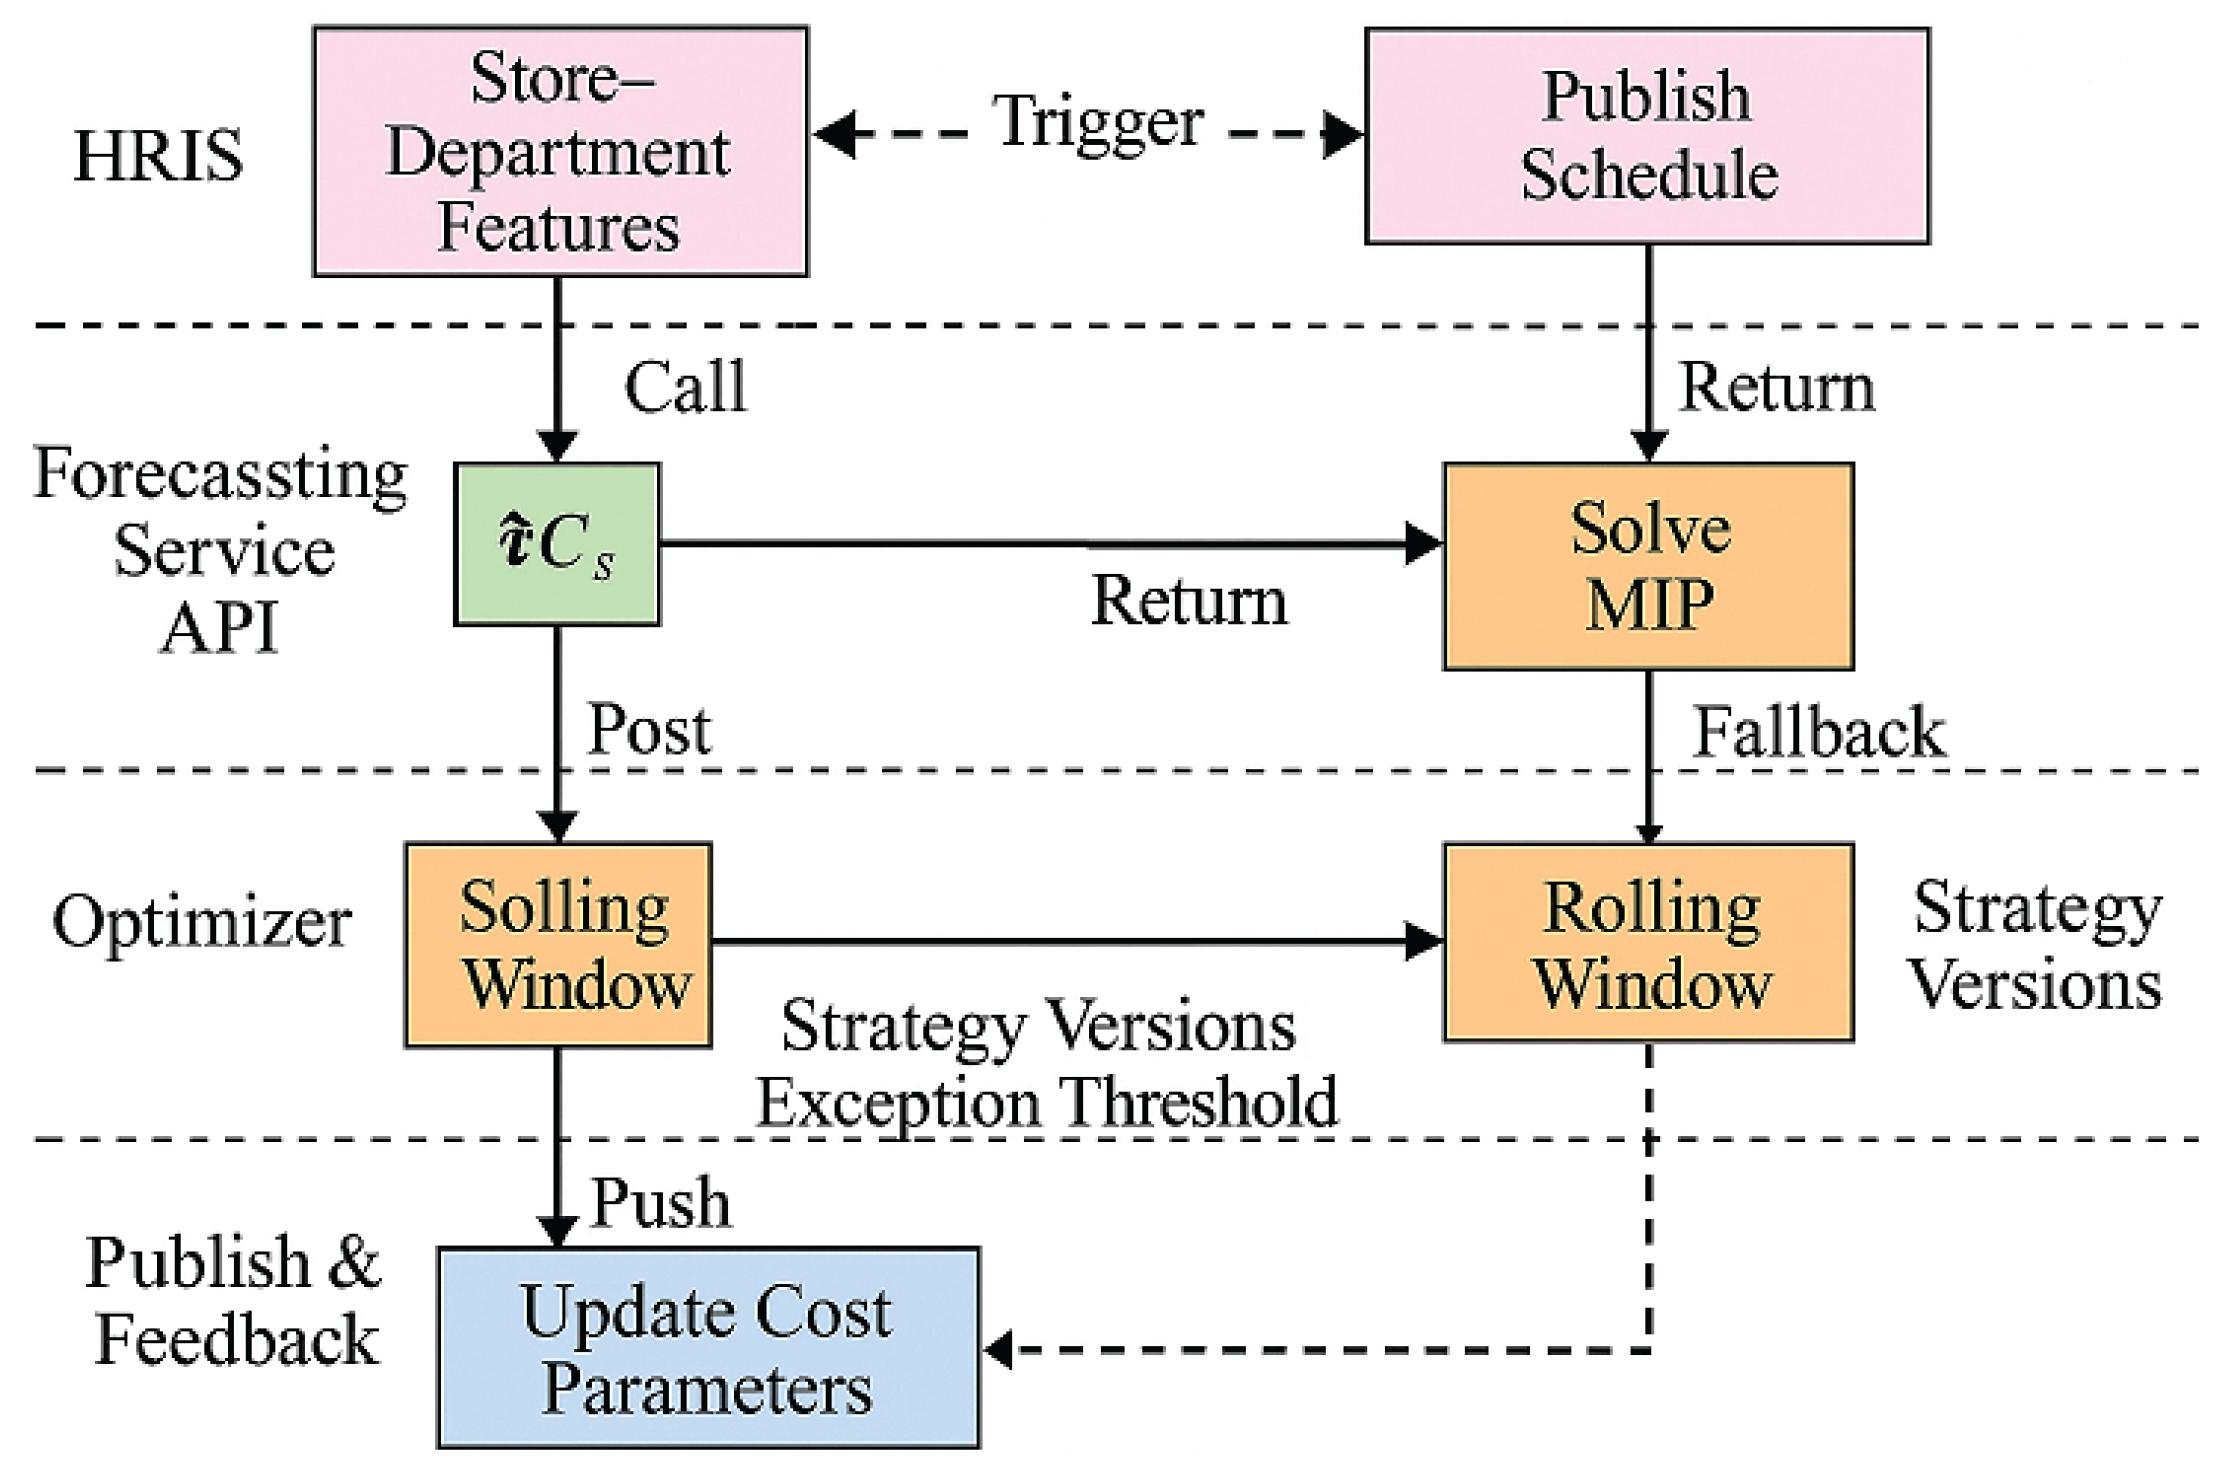
Figure 3.
Cross-lagged and Weight-Adjustment Pathway Diagram for "Culture-Cost-Scheduling".
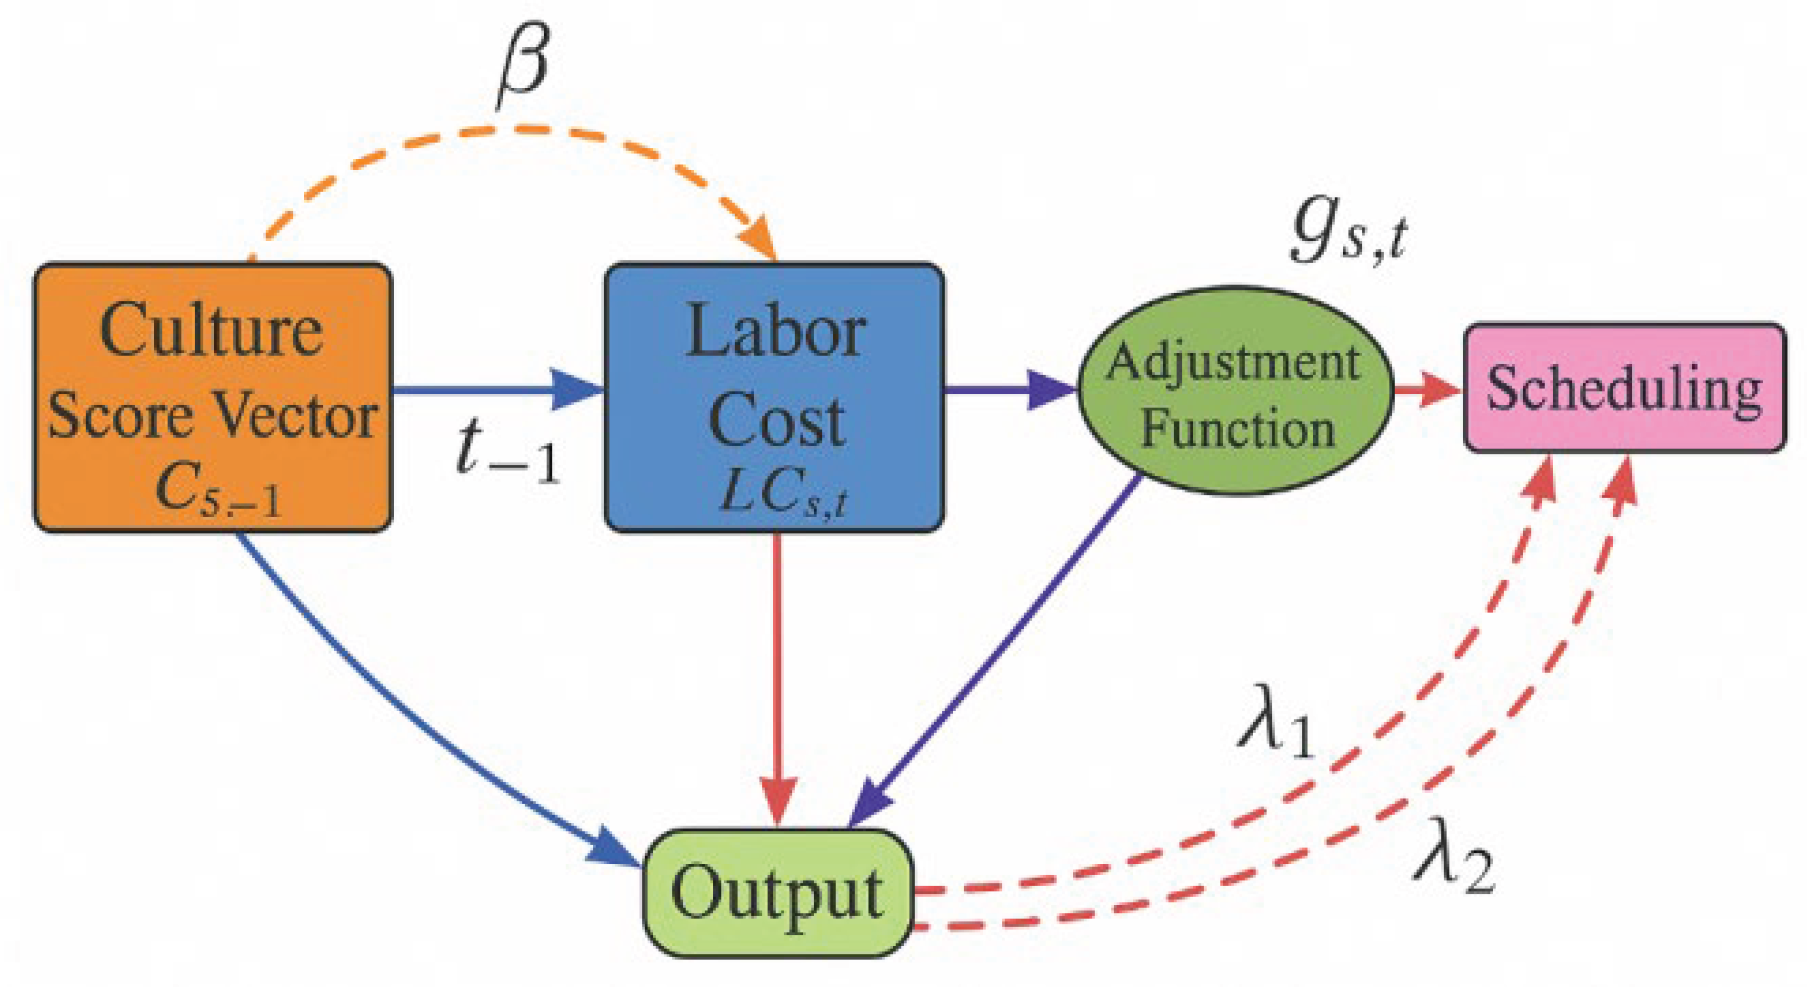
Figure 4.
Sankey Diagram of Culture Dimension–Satisfaction–Cost Pathway.
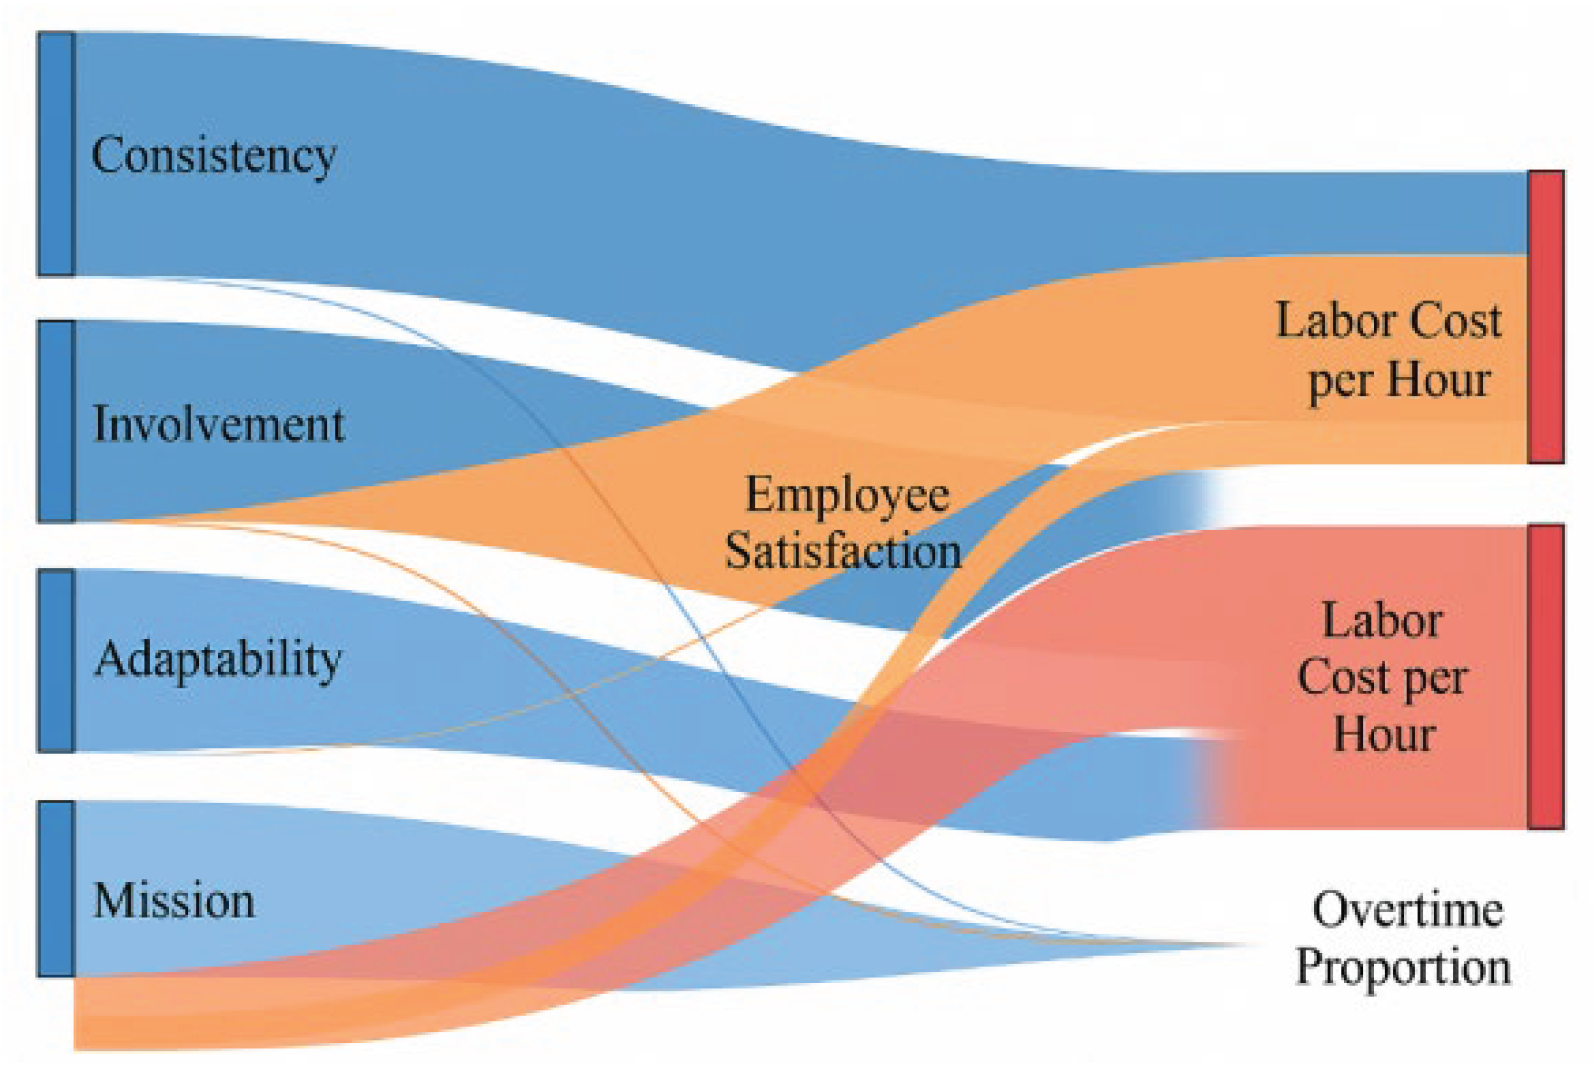
Figure 5.
Synergistic scatter plot of cultural score changes and satisfaction improvement.
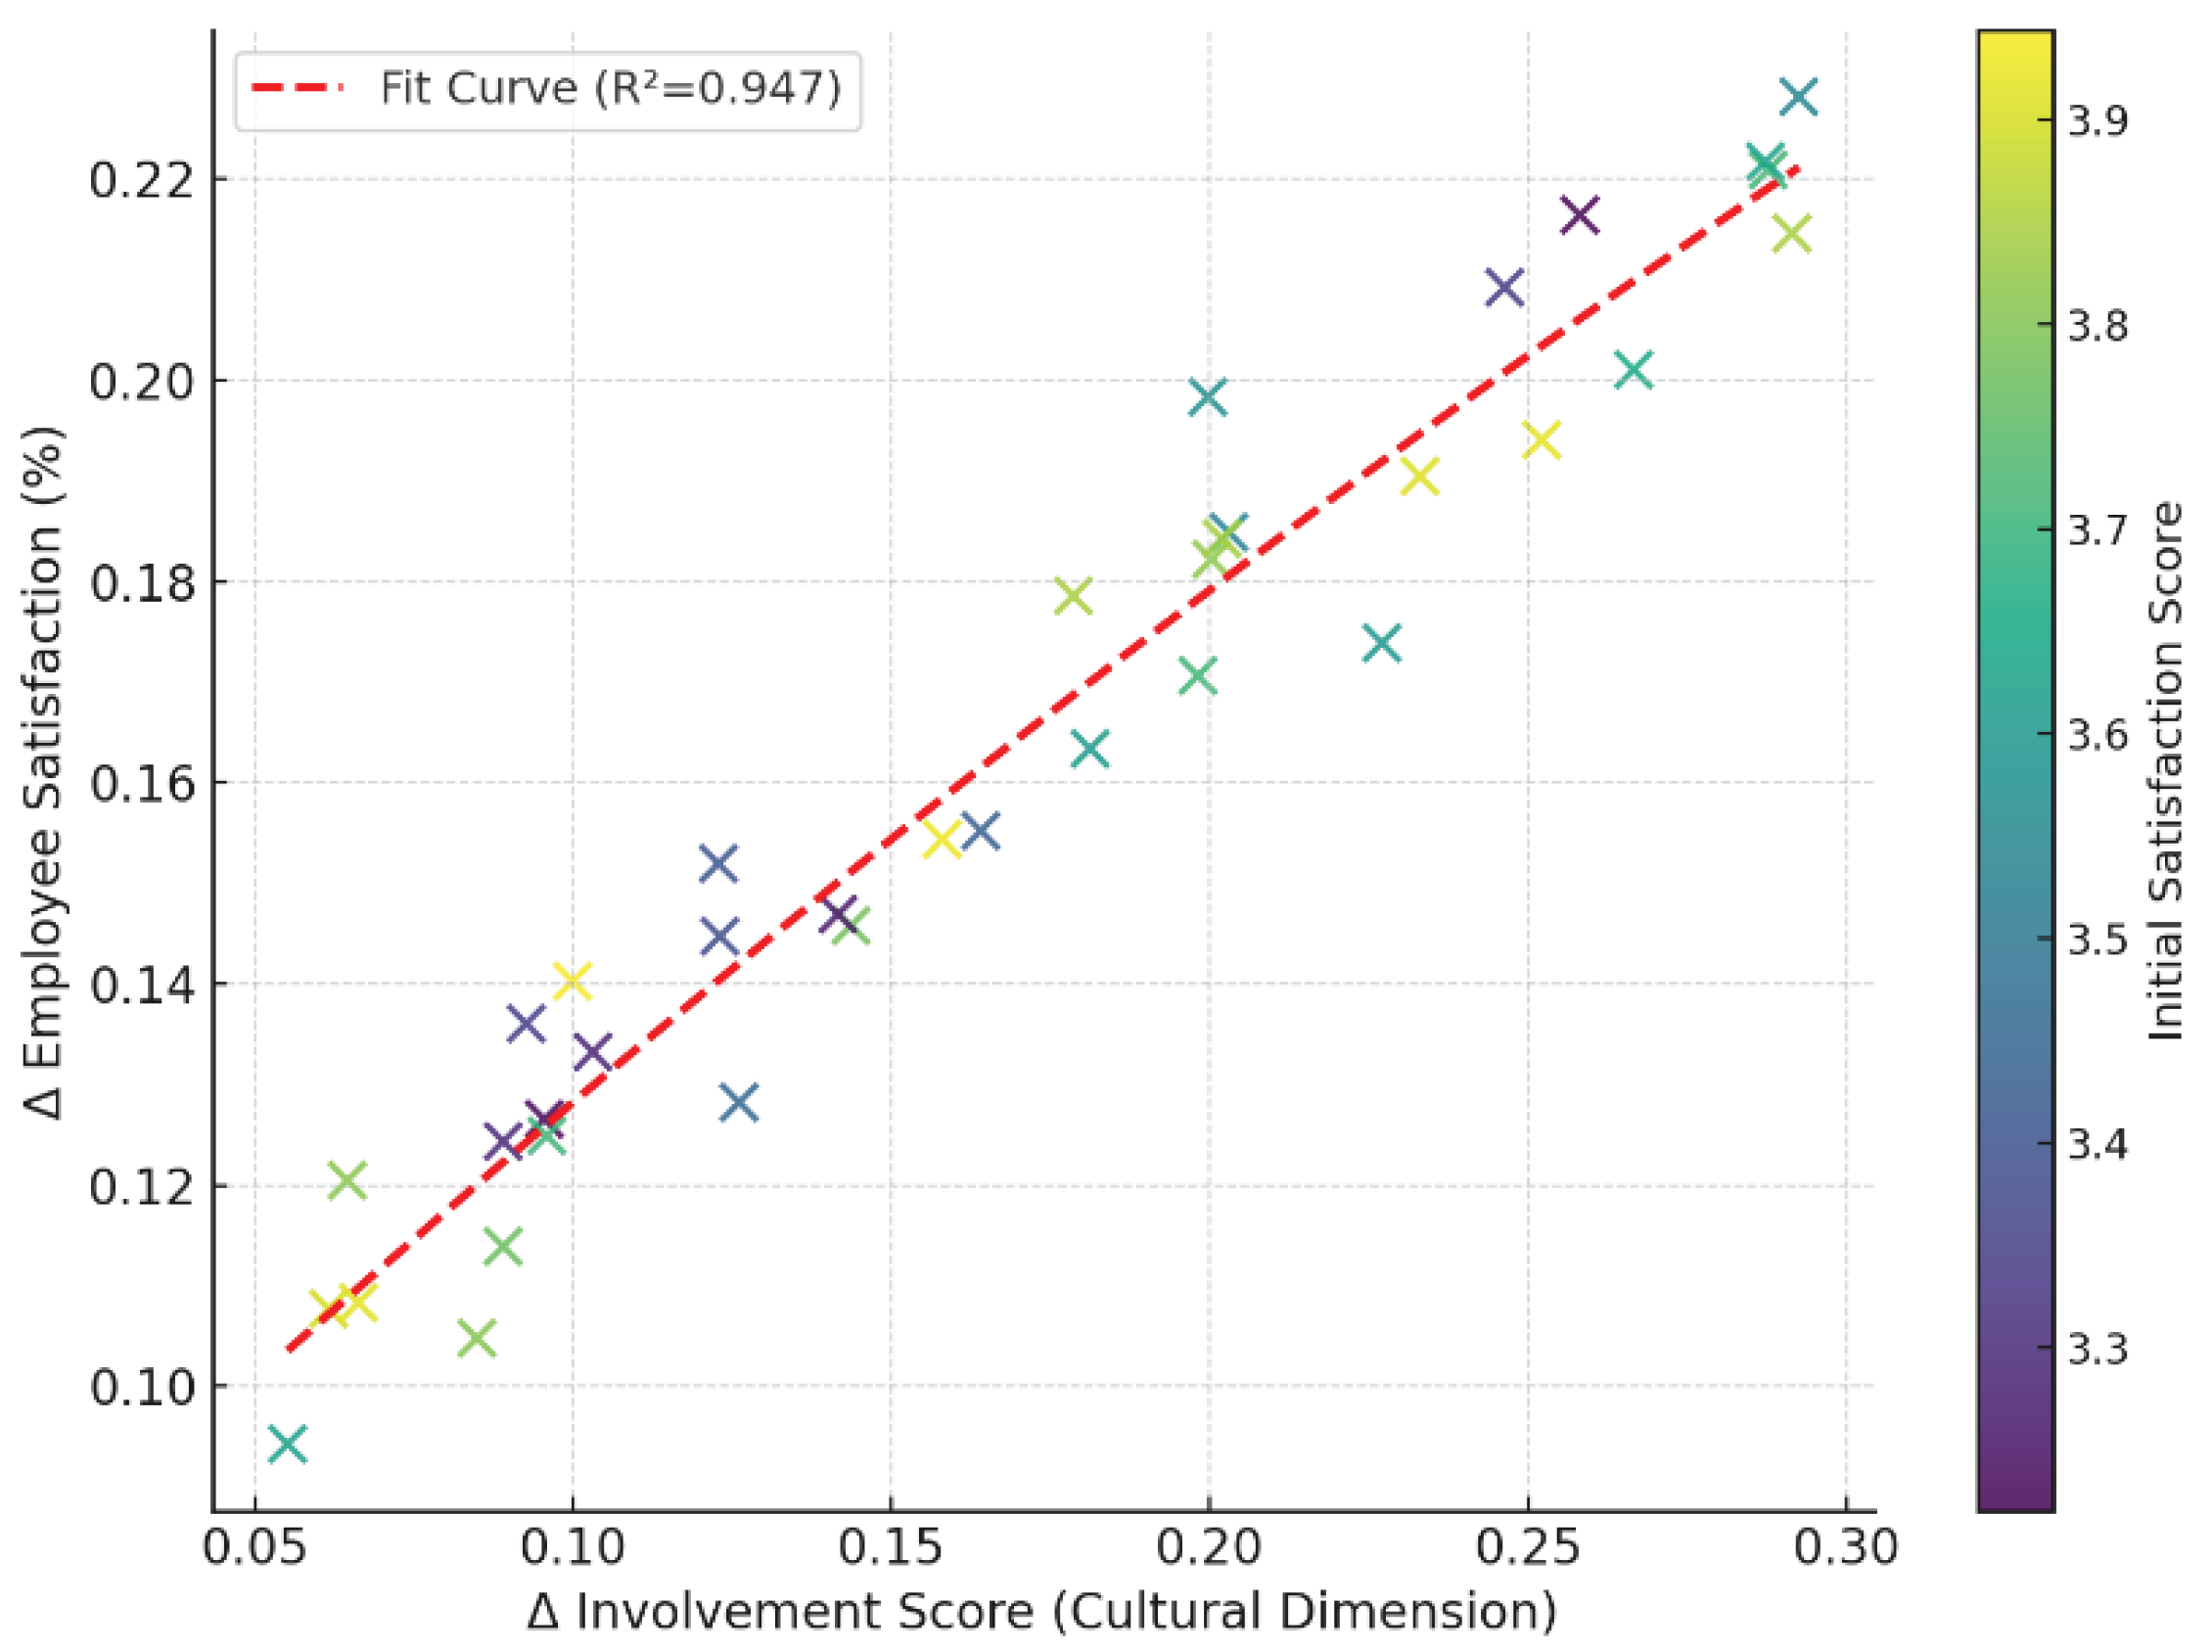

Table 1.
Key Business Metric Changes Following Model Deployment.
| Indicator Category | Pre-Deployment Value | Post-Deployment Value | Change |
| Average Scheduling Error Rate | 8.6% | 2.9% | ↓5.7% |
| Overtime Hours Ratio | 23.1% | 11.4% | ↓11.7% |
| Labor Cost per Employee ($/h) | 16.4 | 14.7 | ↓10.4% |
| Employee satisfaction score | 3.82 (out of 5) | 4.24 (out of 5) | ↑11.0% |
| Monthly average voluntary turnover rate | 5.3% | 3.7% | ↓1.6% |
Disclaimer/Publisher’s Note: The statements, opinions and data contained in all publications are solely those of the individual author(s) and contributor(s) and not of MDPI and/or the editor(s). MDPI and/or the editor(s) disclaim responsibility for any injury to people or property resulting from any ideas, methods, instructions or products referred to in the content. |
© 2025 by the authors. Licensee MDPI, Basel, Switzerland. This article is an open access article distributed under the terms and conditions of the Creative Commons Attribution (CC BY) license (http://creativecommons.org/licenses/by/4.0/).
Copyright: This open access article is published under a Creative Commons CC BY 4.0 license, which permit the free download, distribution, and reuse, provided that the author and preprint are cited in any reuse.


