Submitted:
06 November 2025
Posted:
10 November 2025
You are already at the latest version
Abstract
Background/Objectives: The rising prevalence of antibiotic-resistant bacteria, particularly within biofilms, presents a critical challenge in treating hospital-acquired infections. Staphylococcus aureus is a clinically significant pathogen, notorious for its ability to form biofilms that drastically reduce antimicrobial susceptibility. This study aimed to characterize the metabolic response of S. aureus in both planktonic and biofilm states to under-stand resistance mechanisms better. A key objective was to optimize methodologies for large-scale biofilm production and high-yield RNA extraction, providing a vital tool for subsequent transcriptomic analyses. Methods: To reach our goals, we investigated two strains with differing resistance profiles: a methicillin-sensitive reference strain (ATCC 6538) and a methicillin-resistant clinical isolate (MRSA pHUA585). Biofilm morphology was characterized, and the response to vancomycin was assessed. To facilitate RNA extraction, we optimized a large-scale biofilm production method using a solid membrane support on agar plates, followed by RNA purification via an enhanced phenol/chloroform protocol. Results: Our results revealed distinct biofilm architectures between the strains, with differences in thickness and the distribution of nucleic acids and polysaccharides. Vancomycin exhibited a concentration-dependent inhibitory effect on both, though the response varied, suggesting strain-specific biofilm formation mechanisms and matrix composition. Furthermore, we successfully standardized the scaled-up biofilm production and obtained high-quality RNA. However, under the conditions tested, biofilms from both strains showed low expression of the icaA gene, a key mediator of polysaccharide intercellular adhesion, potentially indicating growth condition dependencies or biofilm maturity state. Conclusions: In summary, this work establishes a methodological foundation for biofilm research and provides crucial insights into the strain-specific phenotypic and potential genetic determinants that underline antibiotic tolerance in S. aureus biofilms.
Keywords:
Staphylococcus aureus (S. aureus) biofilms
; antibiotic profile
; biofilm characterization
; RNA extraction
1. Introduction
Bacterial infections are a public health problem, which has been aggravated by the increase in antibiotic resistance developed by bacteria, as well as by the greater difficulty in treating infections caused by bacteria that form biofilms [1], which are responsible for most clinical infections [2,3] and are more difficult to treat than planktonic bacteria. Staphylococcus aureus is an opportunistic pathogenic Gram-positive bacterium that forms biofilms and is often found in clinical isolates [4,5,6]. Biofilms are surface-associated bacterial communities enclosed in a self-produced extracellular polymeric matrix of polysaccharides, proteins, signaling molecules, extracellular nucleic acids, among others [7], which can develop on different surfaces, whether inert or alive, such as implants, catheters, pacemakers, mechanical heart valves and also in chronic wounds or lungs [4,5,6,8]. Biofilms allow the entrapment of essential minerals and nutrients [9] and provide protection against external agents such as the innate defenses of the host and antimicrobial agents [8,10]. They decrease the susceptibility to antibiotics and other antimicrobial compounds, as the high bacterial density in the biofilms leads to the accumulation of residues and to an altered microenvironment, with reduced pH, low pO2, high pCO2, low hydration, among others, which limits the action of antimicrobial agents [8]. For example, reduced oxygen levels compromise the action of aminoglycosides [11]. In addition, antimicrobial agents diffuse hardly through the extracellular matrix [12,13,14] and biofilms are also responsible for promoting horizontal gene transfer and altered metabolic activity that could affect the response to antibiotics [7,8,15,16]. There is also the formation of persister cells (slow or nongrowing bacteria), especially in the deeper regions of the biofilm, leading to a lower susceptibility to antimicrobial agents, which are more efficient against growing cells [8]. Thus, these bacteria are able to reconstitute the biofilm after stopping therapy.
The formation of biofilms is triggered by the need for bacteria to adapt to environmental conditions [8] and involves an initial reversible attachment of planktonic bacteria to a surface, the growth and maturation of the biofilm within a matrix and finally the detachment and dispersion of the cells that will colonize other surfaces, when nutrients are depleted, or waste products accumulate [7], which makes it hard to efficiently eradicate biofilm-related infections.
Given this complexity associated with complex infections, it is increasingly clear that understanding and combating biofilm-mediated resistance requires a multifaceted methodological approach. Relying on a single model system or analytical technique risks providing an incomplete or misleading information. Methodologies that are effective for assessing planktonic susceptibility, such as broth microdilution, often fail to predict antibiotic efficacy against biofilms [17]. Conversely, models that generate high biomass may select for specific biofilm phenotypes that are not representative of all clinical scenarios [18,19]. Therefore, correlating data from various methods, from high-throughput metabolic assays and advanced microscopy to molecular profiling, is essential to discriminate between different resistance mechanisms and to link biofilm structure with function [4,20].
In this context, the present study employs an integrated methodological strategy to explore biofilm formation and antibiotic response in two S. aureus strains with distinct resistance profiles: a methicillin-sensitive reference strain (ATCC 6538) and a clinical methicillin-resistant isolate (pHUA585). We specifically investigate their response to vancomycin, a relevant antibiotic [21], comparing planktonic susceptibility to tolerance within mature biofilms. A central goal of this work is the optimization of robust methods, including a high-biomass biofilm model and high-quality RNA extraction protocols, to enable a reliable transcriptomic analysis. By applying and correlating these diverse methodologies, we aim to provide a more comprehensive understanding of the phenotypic and genotypic adaptations that underpin biofilm-mediated antibiotic tolerance in S. aureus.
2. Materials and Methods
2.1. S. aureus Clinical Isolate Identification and Antibiotic Susceptibility Profiling
The pHUA585 methicillin-resistant Staphylococcus aureus clinical isolate was collected from a patient and the strain was identified with matrix-assisted laser desorption/ionization time-of-flight (MALDI-TOF) spectrometry using the VITEK MS system (bioMérieux) according with the protocol described by us [22]. Inoculation loops were used to select and smear the isolate onto the sample spots/target slide. Then 1 μL VITEK mass spectrometry α-cyano-4-hydroxycinnamic acid (MS-CHCA) matrix was applied over the sample and air dried (1–2 min). The target slide was loaded into the VITEK MS system to acquire the mass spectra of whole bacterial cell protein (which is mainly composed of ribosomal proteins). After this, the mass spectra acquired for each sample was compared to the mass spectra contained in the database. Finaly the pHUA585 was subjected to an in vitro antimicrobial susceptibility testing by employing the Kirby-Bauer disc diffusion method, following the EUCAST January 2023-defined breakpoints to interpret susceptibility data [23]. For that, bacterial suspensions were prepared in physiological saline solution (0.85% NaCl) and adjusted to a 0.5 McFarland standard, corresponding to approximately 108 CFU/mL. These suspensions were uniformly spread (“carpet cultures”) onto MHA plates. The following antimicrobials were tested: Penicillins (Benzylpenicillin, Oxacillin), Fluoroquinolones (Levofloxacin, Moxifloxacin), Aminoglycosides (Gentamicin), Glycopeptides and lipoglycopeptides (Teicoplanin, Vancomycin), Macrolides, Lincosamides and Streptogramins (Erythromycin), Tetracyclines (Tetracycline), Oxazolidinones (Linezolid), Fusidic acid, Nitrofurantoin, Rifampicin, Trimethoprim-sulfamethoxazole and Mupirocin. As a control, the reference strain S. aureus ATCC 6538 was also tested for susceptibility to some of these antibiotics.
2.2. Culture Conditions and Preparation of Bacterial Suspension
Bacterial stocks were prepared, from overnight cultures on MHA, in MHB with 20% (v/v) glycerol and stored at -80 °C until further use. For each assay, fresh cultures were obtained by streaking from frozen stocks onto MHA and incubating for 18-20 h at 37 °C. To prepare the inoculum for the different assays, the optical density (OD) at 600 nm (OD600 nm) was adjusted to an absorbance of 0.14-0.16 which corresponds to a cell density of 1×10⁸ CFU/mL. The necessary dilutions were made: i) 5×10⁵ CFU/mL in MHB for the growth curves; ii) 1×10⁷ CFU/mL for the RNA extraction assays, iii) and 1×10⁶ CFU/mL for the observation of the biofilms by confocal laser scanning microscopy and reduction of resazurin fluorometric kinetic assay in tryptic soy broth (TSB) (BD), supplemented with 0.25% (w/v) glucose, previously filtered with a filter of 0.20-0.22 μm.
2.3. Determination of Bacterial Growth Curves Using Optical Density (OD) Readings
For each strain of S. aureus, 1×10⁶ CFU/mL suspensions in MHB were inoculated in a 96 U-well plate (Orange Scientific) (final volume of 200 μL), and 100 μL of different concentrations of the antibiotic Vancomycin were added: 0 mg/L, 0.78 mg/L, 1.56 mg/L, 3.12 mg/L, 6.25 mg/L, 12.5 mg/L, 25 mg/L and 50 mg/L.
The final bacterial cell density in each well was 5×10⁵ CFU/mL. Each Vancomycin concentration was tested using technical triplicates. The optical density at 600 nm was measured as a function of time in a microplate reader (SPECTROstar Nano, BMG LABTECH) at 37 °C and set to take measures every 10 minutes for 136 cycles, with 100 flashes per well and cycle. The OD was plotted against time.
2.4. Reduction of Resazurin Fluorometric Kinetic Assay
Bacterial suspensions of each strain with 1×10⁶ CFU/mL in TSB+0.25% (w/v) glucose were added to a 96-well flat-bottomed plate (Costar) (final volume 200 μL per well) and were incubated for 24 hours at 37 °C to form mature biofilms and later evaluate their susceptibility to Vancomycin. After incubation, the medium was removed and different concentrations of Vancomycin were added, prepared from a stock solution of 200 mg/L: 0 mg/L, 3.12 mg/L, 6.25 mg/L, 12.5 mg/L, 25 mg/L, 50 mg/L. The biofilms were incubated for another 24 hours. Each concentration was tested using technical triplicates. After incubation with Vancomycin, a resazurin reduction fluorometric based-assay was performed [12] to determine the effect of Vancomycin treatment on the metabolic activity of 24 h-pre-formed biofilms treated for 24 hours. Resazurin, the active compound in PrestoBlue (Thermo Fisher Scientific) is a blue compound that is reduced by metabolically active cells to resorufin, a pink fluorescent intermediate. The biofilms were rinsed with TSB to remove non-adherent bacteria and resazurin was added at a final concentration of 5% (v/v) in TSB to each of the biofilm samples in the 96-well plate. The production of resorufin was followed every 10 minutes for a total of 4 hours by measuring the fluorescence intensity of resorufin, excitation and emission wavelength were set at 530 and 590 nm, respectively, and the fluorescent intensity was recorded at 37 °C in a microplate reader (FLUOstar Optima, BMG LABTECH). A sample with completely reduced resazurin was used as positive control, obtained by autoclaving the TSB supplemented with 5% (v/v) resazurin for 15 minutes, which was used to perform the equipment gain adjustment (according to the manufacturer’s instructions). The negative control used was a TSB sample with 5% (v/v) resazurin.
2.5. Visualization of Biofilms by Confocal Laser Scanning Microscopy (CLSM)
In an 8-well uncoated chambered coverslips (Ibidi GmbH) (final volume 200 μL per well), 1×10⁶ CFU/mL bacterial suspensions were added in duplicate and incubated at 37 °C for 24 hours for biofilm formation. After incubation, the medium was removed from each of the wells and a 3 μM SYTO 9 solution (Thermo Fisher Scientific) in PBS was added to each well, incubating 30 minutes in the dark at room temperature. After incubation, the unbound dye was removed, and the biofilms were rinsed with PBS. Then, the biofilms were stained with 1 μg/mL WGA-Alexa 633 (Thermo Fisher Scientific) in PBS for 15 minutes in the dark at room temperature and were rinsed again with PBS. After this step, the biofilms were visualized by CLSM using a Leica TCS SP5 inverted microscope with 63× water apochromatic objective (1.2 numerical aperture). The laser lines used were 488 nm Ar+ (emission collected at 500-590 nm) and 633 nm He-Ne (emission collected at 640-795 nm) for SYTO 9 and WGA-Alexa 633, respectively.
Biofilm thickness was determined as previously described [24].
2.6. RNA Extraction Optimization of Planktonic Bacteria and Biofilms
RNA extraction was optimized for planktonic cells in the stationary phase and for biofilm samples. For that, a pre-inoculum was prepared. For planktonic cells in the stationary phase, the cultures were inoculated using the pre-inoculum for an initial OD600 nm of 0.05 and grown for 17 hours at 37 °C and 180 rpm. For the biofilm formation, we optimized a large-scale production in which 30 μL of 1×10⁷ CFU/mL cell suspension of each strain was inoculated in plates with TSA medium on a FILTER-LAB® Gridded MCE Membrane, with pore diameter 0.22 μm and filter diameter 47 mm, and incubated for 48h at 37 °C. After the growth of planktonic cells or biofilms, 20 mL of TM stop buffer (Tris-HCl (Calbiochem) 10 mM pH 7.2, MgCl2 (PanReac) 5 mM, NaN3 (Sigma Aldrich) 25 mM, Chloramphenicol (Sigma) 0.5 g/L) were added to 20 mL of each planktonic culture in a Falcon tube or, for the biofilms, the membranes were transferred to 50 mL Falcon tubes containing the TM stop buffer and were subjected to vigorous vortex to dislocate the biofilms from the membranes. The membranes were then removed from the Falcons. The following steps are common for planktonic cells and biofilms.
The cell suspensions were centrifuged at 4000 rpm for 20 minutes at 4 °C (Eppendorf 5810R) for pellets’ collection and the supernatant was discarded. Cells were resuspended in 600 µL of lysis buffer (Tris-HCl (Calbiochem) 10 mM pH 7.2, MgCl2 (PanReac) 5 mM, 5 U of Turbo DNase (Invitrogen) and 1 mg/mL of lysozyme (Sigma)) and were incubated at 37 °C for 5 min. The suspensions were changed to 2 mL Eppendorf tubes containing 0.5 mL of glass beads (mixture of 2 sizes, ≤106 μm and 425-600 μm in 1:1 ratio), acid washed (Sigma) and 600 μL of acid phenol (Sigma), pH 4.3. Cells were then lysed in the Tissue Lyser (FastPrep) at speed 6 for 45 seconds (twice), keeping the samples in ice during the wait periods. For the DNase treatment, the suspensions were centrifuged at 14000 rpm for 10 minutes at 4 °C. The aqueous phase was taken out into 2 mL Eppendorf tubes and 50 µL of DNase Buffer 10× and 10 U of Turbo DNase (both from Invitrogen) were added. The mixture was incubated at 37 °C for 1 hour.
For the RNA extraction, centrifuge was always operated at 14000 rpm and 4 °C. 1 mL of Trizol (Invitrogen) and 200 µL of CHCl3 (Honeywell) were added to the Eppendorfs and the solutions were agitated vigorously for 2 minutes at room temperature and then centrifuged for 10 minutes. The aqueous phases were taken out to fresh Eppendorf tubes and 200 µL of CHCl3:Isoamyl alcohol (Merck) (24:1) were added. The tubes were again agitated vigorously for 2 minutes at room temperature and then centrifuged for 15 min. The aqueous phases were taken out to fresh Eppendorf tubes and another 200 µL of CHCl3:Isoamyl alcohol (24:1) were added, followed by agitation and 15 minutes centrifugation. The aqueous phases were once again collected and 0.1× volume of Sodium acetate 3 M pH 5.2 and 2.5× volume of cold ethanol 100% were added. RNAs were left to precipitate overnight at -20 °C. In the following day, the suspensions were centrifuged for 45 minutes at maximum velocity and 4 °C and the resulting pellets were washed with ethanol 75%. The samples were centrifuged for 15 minutes at maximum velocity and 4 °C, and the pellets were dried at room temperature for 15 minutes and resuspended in 100 µL of autoclaved Milli-Q H2O. The resulting RNA was stored at -80 °C for 10 minutes followed by defrosting and up and down pipetting for full resuspension and then stored at -20 °C until needed. RNA integrity was assessed by agarose gel electrophoresis and its concentration estimated spectrophotometrically (NanoDrop ND-1000).
2.7. Removal of Contaminating Genomic DNA
To remove the contaminating genomic DNA, RNA samples from biofilms and planktonic cells (4 samples) were treated using Turbo DNase Kit (Invitrogen). To 5 μg of RNA, 2.5 μL of 10× DNase buffer and 0.5 μL of Turbo DNase were added and the volume was completed up to 25 μL with autoclaved Milli-Q H2O. The samples were incubated at 37 °C for 60 minutes, after which 2.8 μL of DNase inactivation reagent was added, incubating for 5 minutes at room temperature. The RNA samples were then centrifuged for 1.5 minutes at 10000×g and the supernatants were collected. The RNA concentration of each sample was measured in the NanoDrop ND-1000.
2.8. cDNA Synthesis
To convert RNA to cDNA, the SensiFAST™ cDNA Synthesis kit (Bioline) was used. For each RNA sample, a solution with 1 μg of RNA, 4 μL of TransAmp 5× buffer, 1 μL of Reverse Transcriptase and autoclaved Milli-Q H2O to complete 20 μL was prepared. The samples were subjected to a vortex and a spin and the following program was performed in the thermocycler (BioRad): 10 minutes at 25 °C (primer annealing), 30 minutes at 42 °C (reverse transcription), 5 minutes at 85 °C (inactivation). cDNA was obtained with a concentration of 50 ng/μL.
2.9. RT-qPCR Calibration Curve
Calibration curves were made for the housekeeping gene (16S rRNA) and for the gene of interest (icaA), which is involved in the control of biofilm production [25,26], both using the cDNA synthesized from the RNA samples taken from the biofilms, in order to evaluate the amplification efficiency for each pair of primers [27,28]. For the preparation of the calibration curve of the 16S rRNA gene, the cDNA sample of the biofilm of the ATCC 6538 strain was used for the dilutions (50 ng/μL) 1:10, 1:30, 1:50, 1:75 and 1:100. For the calibration curve of the icaA gene, four different conditions were tested: the primers designed for this work (icaA_Forward_1 and icaA_Reverse_1, Table 1) were tested with cDNA from S. aureus ATCC 6538 biofilm (two attempts), first with the dilutions 1:10, 1:30, 1:50, 1:75 and 1:100 and after with 1:5, 1:10, 1:20, 1:50 and 1:75, and from S. aureus clinical isolate pHUA585 biofilm for the dilutions 1:1, 1:2, 1:5, 1:10 and 1:15. Another pair of primers was also tested, icaA_Forward_2 and icaA_Reverse_2, which showed good results in [25], and for this pair, the cDNA was from S. aureus pHUA585 biofilm and the dilutions used were 1:1, 1:2, 1:5, 1:10 and 1:15. For the experiment, a qPCR Master Mix solution was prepared with 85 μL of SYBR mix (SensiFAST™ SYBR® No-ROX Kit), 4.25 μL of the Forward primer (10 μmol/μL) and 4.25 μL of the Reverse primer (10 μmol/μL), which are described in Table 1, and 55.25 μL of autoclaved Milli-Q H2O. Each dilution was done in triplicate. For each diluted sample of cDNA, 1.25 μL of cDNA was mixed in RT-qPCR tubes with 8.75 μL of qPCR Master Mix. The negative control used was prepared with 1.25 μL of autoclaved Milli-Q H2O and 8.75 μL of qPCR Master Mix. The RT-qPCR was performed in qTOWER3/G (Analytik Jena) with the program: 95 °C for 2 minutes; 40 cycles of 95 °C for 5 seconds, 60 °C for 10 seconds, 72 °C for 15 seconds; 95 °C for 1 second and a Melting curve for 15 seconds to assess the qPCR specificity.
3. Results
3.1. Clinical Isolate Identification and Antibiotic Susceptibility Testing
Staphylococcus aureus is an opportunistic pathogen often found in clinical isolates whose infections are related to its ability to form biofilms in various surfaces, either abiotic (infections associated with medical devices such as catheters and implants [30]) or biotic (skin, respiratory tract, other tissues [31,32] and chronic wound infections [5,6]). These biofilms protect the cells from external conditions, including antimicrobial treatment [33,34], making it challenging to treat these infections. Here, a S. aureus methicillin-resistant (MRSA) clinical isolate was collected from a patient treated in a Portuguese medical care unit, and the first part of this work focuses on characterizing the isolate according to its antibiotic susceptibility. The isolate was first analyzed by MALDI-TOF spectrometry. It was subsequently assigned the strain code pHUA585, which will be used to identify it in this study. Then, it was tested for its susceptibility to various antibiotics, and the results are presented in Table 2, including the comparison with the susceptibility results for the reference strain S. aureus ATCC 6538. The susceptibilities were interpreted according to EUCAST January2023-defined breakpoints [23].
The antibiotic susceptibility profile of S. aureus ATCC 6538 confirmed its classification as a MSSA strain, as it was susceptible to all antibiotics tested (Table 2). Furthermore, the two strains exhibited distinct antibiotic susceptibility profiles. Strain pHUA585 was resistant to benzylpenicillin, oxacillin, and moxifloxacin, whereas the other strain remained susceptible to these antibiotics. Antibiotic susceptibility testing is a critical tool for bacterial characterization and differentiation. These profiles often serve as a phenotypic fingerprint, helping to distinguish between closely related strains and guiding taxonomic classification. The resistance of pHUA585 to benzylpenicillin and oxacillin (both beta-lactam antibiotics) suggests the possible production of a beta-lactamase enzyme. Notably, its additional resistance to moxifloxacin (a fluoroquinolone) indicates a broader spectrum of resistance, which is clinically significant as it limits therapeutic options. The clear contrast between the resistant pHUA585 and the susceptible reference strain underscores the phenotypic diversity within the sample and highlights the importance of profiling individual isolates.
3.2. Effect of Vancomycin on the Growth Curves of Planktonic Cells
The bacterial growth curve is a fundamental tool for profiling antimicrobial agents, providing critical data on bactericidal versus bacteriostatic mode of action [42]. This approach is widely used to characterize novel compounds, such as quinoline derivatives [43].
Although both bacteria are susceptible to vancomycin in standard planktonic assays, evaluating their growth in its presence remains a critical component of this study. This approach provides a more nuanced understanding of their phenotypic responses beyond a simple susceptible or resistant classification. Importantly, this comparison is essential for contextualizing subsequent biofilm experiments. It is well-established that the biofilm phenotype often exhibits dramatically increased tolerance to antimicrobials, even when the planktonic form is susceptible. By establishing a baseline of planktonic growth inhibition for each strain, we create an essential reference point. This will allow us to directly illustrate the degree of enhanced tolerance conferred by the biofilm mode of growth for each bacteria. Consequently, we can determine not only if both strains form biofilm, but also which one develops a more robust or tolerant biofilm community in the face of antibiotic pressure. Furthermore, Vancomycin was also selected here as a “proof-of-concept” antibiotic due to its widespread use in clinical and academic settings, facilitating easy comparison with other studies.
To characterized Vancomycin response, cells were incubated with different concentrations of the antibiotic and the OD at 600 nm was measured for 24 hours and plotted against time as can be seen in Figure 1a (S. aureus ATCC 6538) and Figure 1b (S. aureus pHUA585).
As expected, both S. aureus strains under study are susceptible to Vancomycin (Table 2), confirming the Kirby-Bauer disc diffusion results.
3.4. Effect of Vancomycin in S. aureus Biofilms Using Reduction of Resazurin Fluorometric Kinetic Assay
The efficacy of Vancomycin against planktonic cells was already demonstrated in several publications [14] and in this work. Testing the activity of antibiotics against mature biofilms is essential, given their notorious resistance to conventional antimicrobial treatment [8,14]. For that, we used PrestoBlue high-throughput cell viability assay based on the principle of cellular metabolism. Its core mechanism is the use of a resazurin-based solution. The active ingredient, resazurin, is a blue, cell-permeable, and non-fluorescent compound. Upon entering a living cell, it acts as a substrate for metabolic enzymes within the cytosol, primarily those involved in reductase reactions (e.g., NAD(P)H-dependent cellular reductases). When these active metabolic enzymes reduce resazurin, it is permanently converted into resorufin, a compound that is highly fluorescent. The key aspect of this assay is that the rate of this conversion is directly proportional to the number of metabolically active (viable) cells in the sample. The more viable cells present, the faster resazurin is reduced, and the stronger the fluorescent signal becomes over a given time.
The PrestoBlue assay is particularly valuable in biofilm research for several reasons that address the unique challenges posed by these structures. Because it is non-toxic and can be used in a continuous, PrestoBlue is excellent for monitoring the kinetics of antibiotic action and other drugs [44]. Thus, it is very helpful to track how quickly an antibiotic shuts down biofilm metabolism, generating robust dose-response and time-kill curves to determine Minimum Biofilm Eradication Concentrations (MBEC). PrestoBlue and other resazurin-based methods are extremely sensitive and can detect a small number of viable cells, which is crucial when testing the efficacy of high-concentration antibiotic treatments aimed at complete eradication [45]. Furthermore, as it is generally non-toxic to cells, it allows for the possibility of continuing the culture after measurement for downstream analyses. Also, it can in part replace the standard Colony Forming Unit (CFU) count which is labor-intensive, time-consuming (requires 24-48 hours for colony growth), and has low throughput. The use of PrestoBlue provides results in a short period of time, is amenable to high-throughput 96-well or 384-well formats, and is not limited to only the cells that can be dispersed and grown on a plate (which can be problematic for robust biofilms). However, there are some drawbacks associated with this methodology. The most important is the potential for over-incubation. If the assay is allowed to proceed for too long, the fluorescent product, resorufin, can be further reduced to a final, non-fluorescent, and colorless compound called dihydroresorufin [46]. This creates a critical problem for data integrity, as the signal does not simply plateau but can actually decrease over time, leading to completely erroneous results.
To mitigate this limitation, we performed a 4-hour kinetic fluorometric assay to measure resazurin reduction by 24-hour pre-formed biofilms following a 24-hour exposure to various concentrations of vancomycin. The reduction kinetics, reflecting the metabolic activity of biofilm cells for strains ATCC 6538 and pHUA585, are shown in Figures 2a and 2b, respectively. For a direct comparison of the antibiotic’s effect, the relative fluorescence intensity was used to directly correlate with cell viability (Figure 2c). For that, we used the value of 10 minutes after resazurin initial conversion. For an assay to be quantitatively valid, the signal must be proportional to the analyte (in this case, the number of metabolically active cells). This proportionality exists only in the linear phase of the reaction. By selecting the 10-minute time point, which our kinetic data confirmed to be within the linear range for all samples, we ensure that our comparisons (Figure 2c) reflect relative differences in viability and that for both bacteria we are far away from the saturation point and the formation of dihydroresorufin.
The resazurin reduction fluorometric kinetic assay showed that Vancomycin acts on biofilms of both strains in a dose-dependent manner, although it is not able to completely destroy the biofilm, even using high antibiotic concentrations, up to 50 mg/L. According to the European Medicines Agency (EMA) guidelines, the recommended dosage for adult patients is 1 g every 12 hours, equivalent to 15 mg/kg, which produces Vancomycin plas-ma concentrations of 50-60 mg/L after the treatment [47].
For lower antibiotic concentrations, the initial fluorescence increase was more pro-nounced, which indicates that the bacteria metabolized resazurin rapidly. As the concentration of Vancomycin increases, the increase in fluorescence is slower, as can be seen by the shift in the slope of the curves, so Vancomycin had limited effect against biofilms which contrast with the results obtained for planktonic bacteria (Figure 1).
It is verified that the antibacterial effect is slightly more significant for the reference strain (Figure 2a) since the variation of the slope of the curve with the increase in antibiotic concentration is less pronounced for the pHUA585 strain (Figure 2b).
The reduced relative fluorescence intensity observed in the MRSA strain at concentrations exceeding 12.5 mg/L corresponds to a slower conversion rate of resazurin to resorufin. This implies a greater proportion of metabolically active cells relative to the reference strain (Figure 2c), demonstrating a lower treatment efficacy.
3.3. Visualization of the Biofilms Morphology by CLSM
Our results for vancomycin anti-biofilm treatment (Figure 2) demonstrated that the antibiotic failed to eradicate biofilms formed by either bacterial strain, with a notably weaker effect against MRSA (pHUA585). Given that both strains were susceptible to vancomycin in planktonic culture (Table 2, Figure 1), we hypothesized that the protective biofilm architecture was responsible for the observed disparity in treatment efficacy.
To test this, we employed confocal laser scanning microscopy (CLSM) to determine whether structural differences in the biofilms could explain viability assay results. CLSM is a non-destructive in situ technique ideal for analyzing biofilm topography using specific fluorescent probes [48,49]. We visualized 24-hour pre-formed biofilms of S. aureus ATCC 6538 and S. aureus pHUA585 by sequential staining with SYTO 9, a green fluorescent nucleic acid dye, and WGA-Alexa 633, which labels specifically the extracellular polysaccharide (Polysaccharide intercellular adhesin, PIA) present in the S. aureus biofilm matrix [50]. Representative images obtained for the biofilms of each strain are shown in Figure 3a. Furthermore, to quantitatively assess morphological differences, we measured biofilm thickness across the xz plane (Figure 3b).
The biofilm architecture differed significantly between the two strains. S. aureus ATCC 6538 exhibited the characteristic “peaks and valleys” morphology (Figure 3a), with heterogeneous thickness and uneven bacterial distribution in the xy plane (Figure 3a). In this strain, polysaccharides were concentrated on the surface, while nucleic acids were embedded deeper within the biofilm. Areas with fewer bacteria (indicated by weaker green staining, see the circles in Figure 3a) were conversely richer in polysaccharides.
In contrast, the S. aureus pHUA585 biofilm displayed a more uniform distribution of both nucleic acids and polysaccharides throughout the xy plane. Furthermore, as shown in Figure 3b, the pHUA585 biofilm was significantly thicker and more homogeneous (average thickness: 22.8 μm) than the ATCC 6538 biofilm (16.6 μm). A dense layer of nucleic acids was observed in the interior of the pHUA585 biofilm, with polysaccharides concentrated at the surface. Also, we observe a higher intensity than what was verified for S. aureus ATCC 6538 which may indicate that PIA content is more abundant.
3.4. RT-qPCR to Confirm icaA Expression
The CLSM results showed us that there are differences in the biofilm morphologies, and it is possible that PIA is more abundant on pHUA585 biofilms. Thus, we decided to try to evaluate the icaA gene because it encodes a membrane protein with enzymatic activity involved in polysaccharide intercellular adhesin (PIA) synthesis and its expression depends on growth conditions [51,52,53], but it is described as being overexpressed in biofilms of the majority of S. aureus strains [51,54], including many MRSA isolates [25,55], although not all strains capable of forming biofilms contain or express the ica operon [25,52,54]. For that, we had to extract first RNA from mature biofilms. The biofilm models used above are formed at a small scale in 96-well plate and 8-well ibidi chambers and thus we could not obtain enough quantity of RNA from these biofilms. Thus, we produced biofilms in a larger scale. In this case, our S. aureus biofilms were formed for the first time on a solid membrane support on agar plates (Figure 4), similar to biofilm models described in [56]. The solid membrane acts as a stable, porous scaffold that provides a large, continuous surface area for colonization. Unlike the confined geometry of a well, this setup allows the biofilm to grow vertically and laterally without spatial constraints, leading to the formation of thick, multi-layered communities. Also, the agar substrate serves as a reservoir of nutrients. Through the porous membrane, the biofilm has continuous, wicking access to these essentials, preventing the nutrient depletion often seen in the stagnant liquid medium of a 96-well plate. This alteration is critical for long-term biofilm maturation.
With the optimized biofilm model, we were able to improve the quantity of nucleic acids that are necessary for further analysis.
Then, we proceeded with RNA extraction protocol using phenol/chloroform for both planktonic cells and biofilms. We had to make some modifications to literature protocols, including making two additions of CHCl3:isoamyl alcohol (24:1) instead of only one addition. The aim here was to prevent RNA contamination with phenol. The extracted RNA was evaluated for its integrity using agarose gel electrophoresis (Figure 5), and the absorbance ratios A260/A280 nm and A260/A230 nm were obtained, as well as the RNA concentrations (Table 3).
We verified that the ribosomal RNAs were not degraded. The A260/A280 nm ratio should be 2.0 for RNA and values lower than this may indicate contamination with proteins or phenol [57]. On the other hand, the A260/A230 nm ratio in pure RNA samples should be between 2.0 and 2.2, and contamination with phenol should decrease this value [57]. The absorbance ratios were within the expected values for pure RNA.
Meanwhile RT-qPCR was used to evaluate the expression of a gene of interest, icaA, expressed in mature S. aureus biofilms, using 16S rRNA (Table 1) as a housekeeping gene, whose expression does not vary between the samples, that is, is equal for planktonic cells and biofilms and also for the two strains [28]. The method used to determine the relative number of copies is 2-ΔΔCT [58].
The calibration curves were performed in order to evaluate the amplification efficiency for each pair of primers. The assay was successfully performed for the calibration curves of 16S rRNA gene using the cDNA from S. aureus ATCC 6538 biofilms. However, for the icaA gene, it was not possible to obtain any good calibration curve, because the gene was very poorly expressed in the biofilm samples of both strains.
The RT-qPCR was performed using a pair of primers designed for this work (icaA_Forward_1 and icaA_Reverse_1, Table 1) to amplify cDNA from S. aureus ATCC 6538 for two different sets of dilutions and from S. aureus pHUA585, with the same pair of primers, but also with a previously described pair of primers (icaA_Forward_2 and icaA_Reverse_2, Table 1) [29] that showed good efficiency in amplifying the target gene. However, we could not obtain any good calibration curve for any of the concentrations, because the expression of icaA in the biofilms was very low (no amplification after 1:10 dilution). With the second pair of primers, there was amplification for every cDNA concentration, but the cycle threshold (CT) was not in the adequate range that corresponds to a good amplification efficiency.
4. Discussion
In the face of the escalating global antimicrobial resistance (AMR) crisis, moving beyond simple bacterial identification to thoroughly characterize their antibiotic profiles both in planktonic and biofilm forms is essential for effective infection control. This process involves two key, interconnected steps: defining the baseline resistance profile (phenotype and genotype) and precisely measuring the response to antibiotic challenge.
In this study, we employed this dual approach by comparing a methicillin-susceptible (MSSA) and a methicillin-resistant (MRSA) strain of S. aureus. We first utilized the Kirby-Bauer disc diffusion method to establish their distinct baseline resistance profiles, confirming the MRSA strain’s resistance to multiple β-lactam antibiotics, as expected (Table 2). Both strains, however, were susceptible to vancomycin. This made vancomycin an ideal candidate to further discriminate their responses to a common stressor across different physiological states. Consistent with the disc diffusion assay, vancomycin was highly effective against planktonic cells of both strains. As shown in Figure 1, treated samples exhibited no increase in optical density at all concentrations tested, indicating potent bactericidal activity against free-floating bacteria.
In contrast, the efficacy of vancomycin was markedly reduced against mature 24-hour biofilms, a finding that aligns with the well-documented tolerance mechanisms of the biofilm mode of growth [4,59]. To dynamically quantify this response, we used the PrestoBlue assay, a resazurin-based method that measures metabolic activity. The results revealed a concentration-dependent inhibition of metabolism. At lower vancomycin concentrations, the rapid conversion of resazurin to fluorescent resorufin indicated sustained metabolic activity (Figure 2). As the antibiotic concentration increased, the metabolic rate slowed, evidenced by a clear shift in the slope of the fluorescence curves. The subsequent decrease in fluorescence intensity at later time points is attributed to the further metabolic processing of resorufin into non-fluorescent dihydroresorufin in viable cells [16,46,60].
Two key findings emerged from this analysis. First, the transition from the planktonic to the biofilm state conferred a significant decrease in vancomycin efficacy for both strains, underscoring the critical challenge biofilms pose to antibiotic therapy. The lower efficacy of antibiotics against biofilms is related to the insufficient diffusion through the matrix, lower or altered metabolic activity, formation of persister cells, but some studies suggest that the interactions of the drug with the matrix constituents and subsequent poor bioavailability also play a role in this [15,61,62].
Second, and more notably, the antibiofilm effect was strain-dependent. The metabolic inhibition was more pronounced in the MSSA reference strain (Figure 2a) than in the MRSA pHUA585 strain (Figure 2b), where the slope of the curve was less affected by increasing vancomycin concentrations. This suggests that the MRSA strain’s biofilm may possess enhanced inherent tolerance. This differential response could be attributed to variations in biofilm architecture, matrix composition, or the expression of specific resistance determinants between MSSA and MRSA strains, factors known to influence antibiotic penetration and efficacy [63,64].
To move beyond metabolic asays and understand the structural basis for the observed tolerance, we employed confocal laser scanning microscopy (CLSM). This technique was critical for discriminating key phenotypic differences in biofilm architecture that bulk assays cannot capture. In the biofilm imaging by CLSM (Figure 3), the extracellular and intracellular nucleic acids are stained by the membrane-permeable marker SYTO 9 [12,50,65,66]. In addition to extracellular DNA, S. aureus biofilm matrix also contains proteins and a content enriched in PIA [67,68,69], which is stained specifically with labelled wheat germ agglutinins [70,71] (such as WGA-Alexa 633 probe), as observed in Figure 3 in red. PIA is composed of high percentage of β-1,6-linked N-acetylglucosamine residues and an anionic fraction with a lower content of non-N-acetylated D-glucosaminyl residues that contains phosphate and ester-linked succinate [67].
The CLSM images revealed a striking contrast in biofilm morphology between the two strains (Figure 3). The MSSA strain formed a thinner and more heterogeneous biofilm characterized by multi-layered cell aggregates and intricate void spaces, while the MRSA (pHUA585) biofilm was significantly thicker, more homogeneous and with possible higher amounts of nucleic acids and PIA. This thicker structure and composition can be a contributor to antibiotic lower tolerance, as it can decrease antibiotic penetration and nutrient and oxygen availability, leading also to protected niches of slow-growing or dormant persister cells [19,72]. For instance, Jefferson et al. [14] reported a low rate of penetration of the fluorescently-labeled antibiotic Vancomycin due to the overproduction of extracellular polymeric substances (EPS) matrix by the MN8m strain used in their work.
To further investigate the molecular basis for the observed differences in vancomycin tolerance, we sought to correlate the phenotypic variations in biofilm architecture with genotypic expression. Specifically, we tried to quantify the expression of the icaA gene, a key component of the icaADBC operon responsible for the synthesis of polysaccharide intercellular adhesin (PIA), also known as poly-N-acetylglucosamine (PNAG) [52].
The success of gene expression studies in biofilms is critically dependent on obtaining high-quality RNA in sufficient quantity. The complex extracellular matrix can impede efficient cell lysis and co-purify substances that inhibit downstream enzymatic reactions. To overcome these challenges, we implemented a robust biofilm model using a solid membrane support on agar plates, which yielded the substantial biomass necessary for molecular analysis (Figure 4). RNA was subsequently extracted using a phenol/chloroform-based method, selected for its ability to provide a comprehensive transcriptome profile, including small RNAs, thereby ensuring high-integrity RNA for sensitive applications [28], This approach was successful, as confirmed by the high-quality RNA yields suitable for RT-qPCR (Table 3, Figure 5).
Surprisingly, despite this optimized RNA extraction, our attempts to quantify icaA gene expression were inconclusive, even with multiple primer sets. Given that icaA is frequently reported as upregulated in S. aureus biofilms [26,51,52,53], its negligible expression in our samples, to the extent that a reliable calibration curve could not be established, suggests that PIA was not a major matrix component under our specific growth conditions. It is well-established that biofilm composition is highly responsive to environmental cues [73]. The ica operon is known to be induced by factors such as high osmolarity, anaerobic conditions, and sub-inhibitory antibiotic concentrations [51,74]. Conversely, our membrane-agar model, utilizing a rich medium like TSB, may have favored an alternative, ica-independent pathway for biofilm development.
This hypothesis is supported by literature indicating that certain strains, including some MRSA isolates, form biofilms on rich media like BHI via fibronectin-binding proteins (FnBPA/B) and the major autolysin (Atl) without significant ica expression [52,75,76].
Therefore, our robust biofilms were likely dependent on a proteinaceous matrix rather than a polysaccharide one. This represents a significant finding, as it highlights that the widely used membrane-agar model can select for specific, and potentially clinically relevant, biofilm phenotypes [77]. Further optimization, such as adjusting the inoculum size or extending the maturation period to 72-96 hours, could also be explored to see if it triggers a shift in matrix composition.
Therefore, while the molecular trigger remains to be fully elucidated, our findings strongly suggest that the robust biofilms formed in our model are primarily PIA-independent, highlighting the critical influence of growth environment on matrix composition and opening new avenues for researching alternative, protein-mediated biofilm mechanisms in S. aureus.
5. Conclusions
In conclusion, this work underscores the critical importance of integrating multiple methodologies and biofilm models to fully capture the complex antibiotic response profiles of distinct S. aureus strains. Our comparative analysis of MSSA and MRSA revealed that while both strains were susceptible to vancomycin in the planktonic state, their responses diverged significantly within biofilms, with the MRSA strain exhibiting superior tolerance. This phenotypic disparity was linked to fundamental differences in biofilm architecture, as visualized by CLSM, with the MRSA strain forming thicker, more complex structures. Furthermore, the choice of biofilm model proved to be a decisive factor, not merely influencing biomass yield but fundamentally shaping the genetic pathway of biofilm development. The inability to detect significant icaA expression in our high-biomass membrane-agar model suggests it selects for a PIA-independent, likely protein-based biofilm matrix, highlighting how different growth conditions can unveil alternate and equally relevant genetic backgrounds for biofilm-mediated resistance. Ultimately, this study demonstrates that a strain’s antibiotic resistance profile is intrinsically linked to its biofilm phenotype, which is itself a malleable trait dictated by the environmental context.
Author Contributions
Conceptualization, VP and SNP; methodology, VR, VP and SNP.; validation, BLB, VR, VP and SNP; formal analysis, BLB, VR, VP and SNP; investigation, BLB, VR, VP and SNP.; data curation, BLB, VR, VP and SNP; writing—original draft preparation, BLB, VP and SNP.; writing—review and editing, BLB, VR, VP and SNP; visualization, BLB, VP and SNP; supervision, VP and SNP; funding acquisition, VP and SNP. All authors have read and agreed to the published version of the manuscript. .
Funding
This work was funded by Fundação para a Ciência e a Tecnologia, Ministério da Ciência, Tecnologia e Ensino Superior (FCT/MCTES, Portugal) through projet Dendricare (2022.036627.PTD). This work was also financed by national funds from FCT in the scope of the projects UIDB/04565/2020 and UIDP/04565/2020 from the Research Unit iBB-Institute for Bioengineering and LA/P/0140/2020 from the Associate Laboratory i4HB-Institute for Health and Bioeconomy. This work was also partially supported by PPBI - Portuguese Platform of BioImaging (PPBI-POCI-01-0145-FEDER-022122) co-funded by national funds from OE - “Orçamento de Estado” and by european funds from FEDER - “Fundo Europeu de Desenvolvimento Regional”.
Institutional Review Board Statement
Not applicable.
Informed Consent Statement
Not applicable.
Data Availability Statement
The datasets generated and/or analyzed during the current study are available from the corresponding authors upon reasonable request.
Conflicts of Interest
The authors declare no conflicts of interest.
Abbreviations
The following abbreviations are used in this manuscript:
| AMR | antimicrobial resistance |
| BHI | brain heart infusion |
| CLSM | confocal laser scanning microscopy |
| EMA | European Medicines Agency |
| EPS | extracellular polymeric substances |
| MALDI-TOF | matrix-assisted laser desorption/ionization time-of-flight |
| MRSA | methicillin-resistant |
| MS-CHCA | mass spectrometry α-cyano-4-hydroxycinnamic acid |
| MSSA | methicillin-susceptible Staphylococcus aureus |
| OD | optical density |
| PIA | polysaccharide intercellular adhesin |
| RPKM | number of reads per kilobase of transcript per million mapped reads |
| sRNAs | small non-coding RNAs |
| TSB | tryptic soy broth |
References
- Wu, H.; Moser, C.; Wang, H.-Z.; Høiby, N.; Song, Z.-J. Strategies for Combating Bacterial Biofilm Infections. Int J Oral Sci 2015, 7, 1–7. [Google Scholar] [CrossRef]
- Malik, A.; Mohammad, Z.; Ahmad, J. The Diabetic Foot Infections: Biofilms and Antimicrobial Resistance. Diabetes & Metabolic Syndrome: Clinical Research & Reviews 2013, 7, 101–107. [Google Scholar] [CrossRef]
- O’Toole, G.; Kaplan, H.B.; Kolter, R. Biofilm Formation as Microbial Development. Annu. Rev. Microbiol. 2000, 54, 49–79. [Google Scholar] [CrossRef]
- Archer, N.K.; Mazaitis, M.J.; Costerton, J.W.; Leid, J.G.; Powers, M.E.; Shirtliff, M.E. Staphylococcus Aureus Biofilms: Properties, Regulation, and Roles in Human Disease. Virulence 2011, 2, 445–459. [Google Scholar] [CrossRef]
- Bhattacharya, M.; Wozniak, D.J.; Stoodley, P.; Hall-Stoodley, L. Prevention and Treatment of Staphylococcus Aureus Biofilms. Expert Review of Anti-infective Therapy 2015, 13, 1499–1516. [Google Scholar] [CrossRef]
- Hall-Stoodley, L.; Stoodley, P.; Kathju, S.; Høiby, N.; Moser, C.; William Costerton, J.; Moter, A.; Bjarnsholt, T. Towards Diagnostic Guidelines for Biofilm-Associated Infections. FEMS Immunol Med Microbiol 2012, 65, 127–145. [Google Scholar] [CrossRef] [PubMed]
- Condinho, M.; Carvalho, B.; Cruz, A.; Pinto, S.N.; Arraiano, C.M.; Pobre, V. The Role of RNA Regulators, Quorum Sensing and c--di--GMP in Bacterial Biofilm Formation. FEBS Open Bio 2023, 13, 975–991. [Google Scholar] [CrossRef]
- Del Pozo, J.L.; Patel, R. The Challenge of Treating Biofilm-Associated Bacterial Infections. Clin Pharmacol Ther 2007, 82, 204–209. [Google Scholar] [CrossRef] [PubMed]
- Costerton, J.W.; Lewandowski, Z.; DeBeer, D.; Caldwell, D.; Korber, D.; James, G. Biofilms, the Customized Microniche. J Bacteriol 1994, 176, 2137–2142. [Google Scholar] [CrossRef] [PubMed]
- Anderl, J.N.; Franklin, M.J.; Stewart, P.S. Role of Antibiotic Penetration Limitation in Klebsiella Pneumoniae Biofilm Resistance to Ampicillin and Ciprofloxacin. Antimicrob Agents Chemother 2000, 44, 1818–1824. [Google Scholar] [CrossRef]
- Tack, K.J.; Sabath, L.D. Increased Minimum Inhibitory Concentrations with Anaerobiasis for Tobramycin, Gentamicin, and Amikacin, Compared to Latamoxef, Piperacillin, Chloramphenicol, and Clindamycin. Chemotherapy 1985, 31, 204–210. [Google Scholar] [CrossRef]
- Pinto, S.N.; Dias, S.A.; Cruz, A.F.; Mil-Homens, D.; Fernandes, F.; Valle, J.; Andreu, D.; Prieto, M.; Castanho, M.A.R.B.; Coutinho, A.; et al. The Mechanism of Action of pepR, a Viral-Derived Peptide, against Staphylococcus Aureus Biofilms. Journal of Antimicrobial Chemotherapy 2019, 74, 2617–2625. [Google Scholar] [CrossRef]
- Ferreira, M.; Pinto, S.N.; Aires-da-Silva, F.; Bettencourt, A.; Aguiar, S.I.; Gaspar, M.M. Liposomes as a Nanoplatform to Improve the Delivery of Antibiotics into Staphylococcus Aureus Biofilms. Pharmaceutics 2021, 13, 321. [Google Scholar] [CrossRef]
- Jefferson, K.K.; Goldmann, D.A.; Pier, G.B. Use of Confocal Microscopy To Analyze the Rate of Vancomycin Penetration through Staphylococcus Aureus Biofilms. Antimicrob Agents Chemother 2005, 49, 2467–2473. [Google Scholar] [CrossRef]
- Mah, T.-F.C.; O’Toole, G.A. Mechanisms of Biofilm Resistance to Antimicrobial Agents. Trends in Microbiology 2001, 9, 34–39. [Google Scholar] [CrossRef]
- Bauer, J.; Siala, W.; Tulkens, P.M.; Van Bambeke, F. A Combined Pharmacodynamic Quantitative and Qualitative Model Reveals the Potent Activity of Daptomycin and Delafloxacin against Staphylococcus Aureus Biofilms. Antimicrob Agents Chemother 2013, 57, 2726–2737. [Google Scholar] [CrossRef] [PubMed]
- Macia, M.D.; Rojo-Molinero, E.; Oliver, A. Antimicrobial Susceptibility Testing in Biofilm-Growing Bacteria. Clinical Microbiology and Infection 2014, 20, 981–990. [Google Scholar] [CrossRef] [PubMed]
- Zhang, Y.; Young, P.; Traini, D.; Li, M.; Ong, H.X.; Cheng, S. Challenges and Current Advances in in Vitro Biofilm Characterization. Biotechnology Journal 2023, 18, 2300074. [Google Scholar] [CrossRef]
- Bjarnsholt, T.; Alhede, M.; Alhede, M.; Eickhardt-Sørensen, S.R.; Moser, C.; Kühl, M.; Jensen, P.Ø.; Høiby, N. The in Vivo Biofilm. Trends in Microbiology 2013, 21, 466–474. [Google Scholar] [CrossRef] [PubMed]
- Bridier, A.; Dubois-Brissonnet, F.; Boubetra, A.; Thomas, V.; Briandet, R. The Biofilm Architecture of Sixty Opportunistic Pathogens Deciphered Using a High Throughput CLSM Method. Journal of Microbiological Methods 2010, 82, 64–70. [Google Scholar] [CrossRef]
- Liu, C.; Bayer, A.; Cosgrove, S.E.; Daum, R.S.; Fridkin, S.K.; Gorwitz, R.J.; Kaplan, S.L.; Karchmer, A.W.; Levine, D.P.; Murray, B.E.; et al. Clinical Practice Guidelines by the Infectious Diseases Society of America for the Treatment of Methicillin-Resistant Staphylococcus Aureus Infections in Adults and Children. Clinical Infectious Diseases 2011, 52, e18–e55. [Google Scholar] [CrossRef]
- Mil-Homens, D.; Martins, M.; Barbosa, J.; Serafim, G.; Sarmento, M.J.; Pires, R.F.; Rodrigues, V.; Bonifácio, V.D.B.; Pinto, S.N. Carbapenem-Resistant Klebsiella Pneumoniae Clinical Isolates: In Vivo Virulence Assessment in Galleria Mellonella and Potential Therapeutics by Polycationic Oligoethyleneimine. Antibiotics 2021, 10, 56. [Google Scholar] [CrossRef]
- The European Committee on Antimicrobial Susceptibility Testing. Breakpoint Tables for Interpretation of MICs and Zone Diameters.
- Marques, M.; Pobre, V.; Costa, S.S.; Pinto, S.N.; Silveira, H. Pseudomonas Mendocina Isolated from Anopheles Midguts Has a Greater Potential to Build Thick Biofilms than Serratia Marcescens. ACS Omega 2025, acsomega.5c01640. [Google Scholar] [CrossRef]
- Haddad, O.; Merghni, A.; Elargoubi, A.; Rhim, H.; Kadri, Y.; Mastouri, M. Comparative Study of Virulence Factors among Methicillin Resistant Staphylococcus Aureus Clinical Isolates. BMC Infect Dis 2018, 18, 560. [Google Scholar] [CrossRef]
- Hoang, T.-M.; Zhou, C.; Lindgren, J.K.; Galac, M.R.; Corey, B.; Endres, J.E.; Olson, M.E.; Fey, P.D. Transcriptional Regulation of icaADBC by Both IcaR and TcaR in Staphylococcus Epidermidis. J Bacteriol 2019, 201. [Google Scholar] [CrossRef]
- Pobre, V.; Arraiano, C.M. Next Generation Sequencing Analysis Reveals That the Ribonucleases RNase II, RNase R and PNPase Affect Bacterial Motility and Biofilm Formation in E. Coli. BMC Genomics 2015, 16, 72. [Google Scholar] [CrossRef] [PubMed]
- Pobre, V.; Arraiano, C.M. Characterizing the Role of Exoribonucleases in the Control of Microbial Gene Expression: Differential RNA-Seq. In Methods in Enzymology; Elsevier, 2018; Vol. 612, pp. 1–24 ISBN 978-0-12-815993-4.
- El--Mahallawy, H.A.; Loutfy, S.A.; El--Wakil, M.; El--Al, A.K.A.; Morcos, H. Clinical Implications of icaA and icaD Genes in Coagulase Negative Staphylococci and Staphylococcus Aureus Bacteremia in Febrile Neutropenic Pediatric Cancer Patients. Pediatric Blood & Cancer 2009, 52, 824–828. [Google Scholar] [CrossRef]
- Wi, Y.M.; Patel, R. Understanding Biofilms and Novel Approaches to the Diagnosis, Prevention, and Treatment of Medical Device-Associated Infections. Infectious Disease Clinics of North America 2018, 32, 915–929. [Google Scholar] [CrossRef] [PubMed]
- McCaig, L.F.; McDonald, L.C.; Mandal, S.; Jernigan, D.B. Staphylococcus Aureus –Associated Skin and Soft Tissue Infections in Ambulatory Care. Emerg. Infect. Dis. 2006, 12, 1715–1723. [Google Scholar] [CrossRef] [PubMed]
- Parker, D.; Prince, A. Immunopathogenesis of Staphylococcus Aureus Pulmonary Infection. Semin Immunopathol 2012, 34, 281–297. [Google Scholar] [CrossRef]
- Brown, M.R.W.; Allison, D.G.; Gilbert, P. Resistance of Bacterial Biofilms to Antibiotics a Growth-Rate Related Effect? J Antimicrob Chemother 1988, 22, 777–780. [Google Scholar] [CrossRef]
- Davies, D. Understanding Biofilm Resistance to Antibacterial Agents. Nat Rev Drug Discov 2003, 2, 114–122. [Google Scholar] [CrossRef]
- Marino, A.; Blanco, A.R.; Ginestra, G.; Nostro, A.; Bisignano, G. Ex Vivo Efficacy of Gemifloxacin in Experimental Keratitis Induced by Methicillin-Resistant Staphylococcus Aureus. International Journal of Antimicrobial Agents 2016, 48, 395–400. [Google Scholar] [CrossRef]
- Wacher--Rodarte, M.D.C.; Trejo--Muñúzuri, T.P.; Montiel--Aguirre, J.F.; Drago--Serrano, M.E.; Gutiérrez--Lucas, R.L.; Castañeda--Sánchez, J.I.; Sainz--Espuñes, T. Antibiotic Resistance and Multidrug--resistant Efflux Pumps Expression in Lactic Acid Bacteria Isolated from Pozol, a Nonalcoholic Mayan Maize Fermented Beverage. Food Science & Nutrition 2016, 4, 423–430. [Google Scholar] [CrossRef]
- Speck, S.; Wenke, C.; Feßler, A.T.; Kacza, J.; Geber, F.; Scholtzek, A.D.; Hanke, D.; Eichhorn, I.; Schwarz, S.; Rosolowski, M.; et al. Borderline Resistance to Oxacillin in Staphylococcus Aureus after Treatment with Sub-Lethal Sodium Hypochlorite Concentrations. Heliyon 2020, 6, e04070. [Google Scholar] [CrossRef] [PubMed]
- Mohamed, M.F.; Abdelkhalek, A.; Seleem, M.N. Evaluation of Short Synthetic Antimicrobial Peptides for Treatment of Drug-Resistant and Intracellular Staphylococcus Aureus. Sci Rep 2016, 6, 29707. [Google Scholar] [CrossRef] [PubMed]
- Gidari, A.; Sabbatini, S.; Schiaroli, E.; Perito, S.; Francisci, D.; Baldelli, F.; Monari, C. Tedizolid-Rifampicin Combination Prevents Rifampicin-Resistance on in Vitro Model of Staphylococcus Aureus Mature Biofilm. Front. Microbiol. 2020, 11, 2085. [Google Scholar] [CrossRef]
- Narayanaswamy, V.P.; Giatpaiboon, S.A.; Uhrig, J.; Orwin, P.; Wiesmann, W.; Baker, S.M.; Townsend, S.M. In Vitro Activity of Novel Glycopolymer against Clinical Isolates of Multidrug-Resistant Staphylococcus Aureus. PLoS ONE 2018, 13, e0191522. [Google Scholar] [CrossRef]
- Wu, P.-P.; He, H.; Hong, W.D.; Wu, T.-R.; Huang, G.-Y.; Zhong, Y.-Y.; Tu, B.-R.; Gao, M.; Zhou, J.; Zhao, S.-Q.; et al. The Biological Evaluation of Fusidic Acid and Its Hydrogenation Derivative as Antimicrobial and Anti-Inflammatory Agents. IDR 2018, Volume 11, 1945–1957. [Google Scholar] [CrossRef]
- Theophel, K.; Schacht, V.J.; Schlüter, M.; Schnell, S.; Stingu, C.-S.; Schaumann, R.; Bunge, M. The Importance of Growth Kinetic Analysis in Determining Bacterial Susceptibility against Antibiotics and Silver Nanoparticles. Front. Microbiol. 2014, 5. [Google Scholar] [CrossRef] [PubMed]
- Qin, L.-L.; Yang, L.; Zhang, Z.-J.; Zhang, L.-J.; Zhang, W.; Jin, Y.-R.; Luo, X.-F.; Li, F.-P.; Zhang, S.-Y.; Bian, Q.; et al. Design, Synthesis, and Biological Evaluation of Novel Quinoline Derivatives against Phytopathogenic Bacteria Inspired from Natural Quinine Alkaloids. J. Agric. Food Chem. 2024, acs.jafc.4c05509. [Google Scholar] [CrossRef]
- Cruz, A.; Barbosa, J.; Bernardes, N.; Avó, B.; Martinho, N.; Godinho-Santos, A.; Pinto, S.N.; Bonifácio, V.D.B. Designing Anticancer Polyurea Biodendrimers: The Role of Core–Shell Charge/Hydrophobicity Modulation. Biomater. Sci. 2025, 10.1039.D5BM01205H. [Google Scholar] [CrossRef]
- Sandoe, J.A.T.; Wysome, J.; West, A.P.; Heritage, J.; Wilcox, M.H. Measurement of Ampicillin, Vancomycin, Linezolid and Gentamicin Activity against Enterococcal Biofilms. Journal of Antimicrobial Chemotherapy 2006, 57, 767–770. [Google Scholar] [CrossRef]
- Natto, M.J.; Savioli, F.; Quashie, N.B.; Dardonville, C.; Rodenko, B.; De Koning, H.P. Validation of Novel Fluorescence Assays for the Routine Screening of Drug Susceptibilities of Trichomonas Vaginalis. Journal of Antimicrobial Chemotherapy 2012, 67, 933–943. [Google Scholar] [CrossRef]
- European Medicines Agency Vancomycin Article-31 Referral Annex III (accessed on 29 June 2023). (accessed on 29 June 2023).
- Neu, T.R.; Lawrence, J.R. In Situ Characterization of Extracellular Polymeric Substances (EPS) in Biofilm Systems. In Microbial Extracellular Polymeric Substances; Wingender, J., Neu, T.R., Flemming, H.-C., Eds.; Springer Berlin Heidelberg: Berlin, Heidelberg, 1999; pp. 21–47. ISBN 978-3-642-64277-7. [Google Scholar]
- Neu, T.R.; Lawrence, J.R. [10] Lectin-Binding Analysis in Biofilm Systems. In Methods in Enzymology; Elsevier, 1999; Vol. 310, pp. 145–152 ISBN 978-0-12-182211-8.
- Cruz, A.; Condinho, M.; Carvalho, B.; Arraiano, C.M.; Pobre, V.; Pinto, S.N. The Two Weapons against Bacterial Biofilms: Detection and Treatment. Antibiotics 2021, 10, 1482. [Google Scholar] [CrossRef]
- Cramton, S.E.; Ulrich, M.; Götz, F.; Döring, G. Anaerobic Conditions Induce Expression of Polysaccharide Intercellular Adhesin in Staphylococcus Aureus and Staphylococcus Epidermidis. Infect Immun 2001, 69, 4079–4085. [Google Scholar] [CrossRef]
- Fitzpatrick, F.; Humphreys, H.; O’Gara, J.P. Evidence for icaADBC -Independent Biofilm Development Mechanism in Methicillin-Resistant Staphylococcus Aureus Clinical Isolates. J Clin Microbiol 2005, 43, 1973–1976. [Google Scholar] [CrossRef]
- Zmantar, T.; Chaieb, K.; Makni, H.; Miladi, H.; Abdallah, F.B.; Mahdouani, K.; Bakhrouf, A. Detection by PCR of Adhesins Genes and Slime Production in Clinical Staphylococcus Aureus. J. Basic Microbiol. 2008, 48, 308–314. [Google Scholar] [CrossRef] [PubMed]
- O’Gara, J.P. Ica and beyond: Biofilm Mechanisms and Regulation in Staphylococcus Epidermidis and Staphylococcus Aureus. FEMS Microbiology Letters 2007, 270, 179–188. [Google Scholar] [CrossRef] [PubMed]
- Kot, B.; Sytykiewicz, H.; Sprawka, I. Expression of the Biofilm-Associated Genes in Methicillin-Resistant Staphylococcus Aureus in Biofilm and Planktonic Conditions. IJMS 2018, 19, 3487. [Google Scholar] [CrossRef] [PubMed]
- Saad, M.G.; Beyenal, H.; Dong, W.-J. Dual Roles of the Conditional Extracellular Vesicles Derived from Pseudomonas Aeruginosa Biofilms: Promoting and Inhibiting Bacterial Biofilm Growth. Biofilm 2024, 7, 100183. [Google Scholar] [CrossRef] [PubMed]
- Matlock, B. Assessment of Nucleic Acid Purity. 2015.
- Livak, K.J.; Schmittgen, T.D. Analysis of Relative Gene Expression Data Using Real-Time Quantitative PCR and the 2−ΔΔCT Method. Methods 2001, 25, 402–408. [Google Scholar] [CrossRef]
- Costerton, J.W.; Stewart, P.S.; Greenberg, E.P. Bacterial Biofilms: A Common Cause of Persistent Infections. Science 1999, 284, 1318–1322. [Google Scholar] [CrossRef]
- Toté, K.; Berghe, D.V.; Maes, L.; Cos, P. A New Colorimetric Microtitre Model for the Detection of Staphylococcus Aureus Biofilms: New S. Aureus Biofilm Model. Letters in Applied Microbiology 2007, 46, 249–254. [Google Scholar] [CrossRef]
- Daddi Oubekka, S.; Briandet, R.; Fontaine-Aupart, M.-P.; Steenkeste, K. Correlative Time-Resolved Fluorescence Microscopy To Assess Antibiotic Diffusion-Reaction in Biofilms. Antimicrob Agents Chemother 2012, 56, 3349–3358. [Google Scholar] [CrossRef]
- Anderson, G.G.; O’Toole, G.A. Innate and Induced Resistance Mechanisms of Bacterial Biofilms. In Bacterial Biofilms; Romeo, T., Ed.; Current Topics in Microbiology and Immunology; Springer Berlin Heidelberg: Berlin, Heidelberg, 2008; Vol. 322, pp. 85–105. ISBN 978-3-540-75417-6. [Google Scholar]
- McGuinness, W.A.; Malachowa, N.; DeLeo, F.R. Vancomycin Resistance in Staphylococcus Aureus. Yale J Biol Med 2017, 90, 269–281. [Google Scholar]
- Atshan, S.S.; Nor Shamsudin, M.; Sekawi, Z.; Lung, L.T.T.; Hamat, R.A.; Karunanidhi, A.; Mateg Ali, A.; Ghaznavi-Rad, E.; Ghasemzadeh-Moghaddam, H.; Chong Seng, J.S.; et al. Prevalence of Adhesion and Regulation of Biofilm-Related Genes in Different Clones of Staphylococcus Aureus. Journal of Biomedicine and Biotechnology 2012, 2012, 1–10. [Google Scholar] [CrossRef] [PubMed]
- Stiefel, P.; Schmidt-Emrich, S.; Maniura-Weber, K.; Ren, Q. Critical Aspects of Using Bacterial Cell Viability Assays with the Fluorophores SYTO9 and Propidium Iodide. BMC Microbiol 2015, 15, 36. [Google Scholar] [CrossRef]
- Pinto, S.N.; Mil-Homens, D.; Pires, R.F.; Alves, M.M.; Serafim, G.; Martinho, N.; Melo, M.; Fialho, A.M.; Bonifácio, V.D.B. Core–Shell Polycationic Polyurea Pharmadendrimers: New-Generation of Sustainable Broad-Spectrum Antibiotics and Antifungals. Biomater. Sci. 2022, 10, 5197–5207. [Google Scholar] [CrossRef] [PubMed]
- Mack, D.; Fischer, W.; Krokotsch, A.; Leopold, K.; Hartmann, R.; Egge, H.; Laufs, R. The Intercellular Adhesin Involved in Biofilm Accumulation of Staphylococcus Epidermidis Is a Linear Beta-1,6-Linked Glucosaminoglycan: Purification and Structural Analysis. J Bacteriol 1996, 178, 175–183. [Google Scholar] [CrossRef] [PubMed]
- Khoramian, B.; Jabalameli, F.; Niasari-Naslaji, A.; Taherikalani, M.; Emaneini, M. Comparison of Virulence Factors and Biofilm Formation among Staphylococcus Aureus Strains Isolated from Human and Bovine Infections. Microbial Pathogenesis 2015, 88, 73–77. [Google Scholar] [CrossRef]
- Abraham, N.M.; Jefferson, K.K. A Low Molecular Weight Component of Serum Inhibits Biofilm Formation in Staphylococcus Aureus. Microbial Pathogenesis 2010, 49, 388–391. [Google Scholar] [CrossRef]
- Strathmann, M.; Wingender, J.; Flemming, H.-C. Application of Fluorescently Labelled Lectins for the Visualization and Biochemical Characterization of Polysaccharides in Biofilms of Pseudomonas Aeruginosa. Journal of Microbiological Methods 2002, 50, 237–248. [Google Scholar] [CrossRef]
- Skogman, M.E.; Vuorela, P.M.; Fallarero, A. Combining Biofilm Matrix Measurements with Biomass and Viability Assays in Susceptibility Assessments of Antimicrobials against Staphylococcus Aureus Biofilms. J Antibiot 2012, 65, 453–459. [Google Scholar] [CrossRef]
- Heydorn, A.; Ersbøll, B.; Kato, J.; Hentzer, M.; Parsek, M.R.; Tolker-Nielsen, T.; Givskov, M.; Molin, S. Statistical Analysis of Pseudomonas Aeruginosa Biofilm Development: Impact of Mutations in Genes Involved in Twitching Motility, Cell-to-Cell Signaling, and Stationary-Phase Sigma Factor Expression. Appl Environ Microbiol 2002, 68, 2008–2017. [Google Scholar] [CrossRef]
- Leech, J.; Golub, S.; Allan, W.; Simmons, M.J.H.; Overton, T.W. Non-Pathogenic Escherichia Coli Biofilms: Effects of Growth Conditions and Surface Properties on Structure and Curli Gene Expression. Arch Microbiol 2020, 202, 1517–1527. [Google Scholar] [CrossRef]
- Rachid, S.; Ohlsen, K.; Witte, W.; Hacker, J.; Ziebuhr, W. Effect of Subinhibitory Antibiotic Concentrations on Polysaccharide Intercellular Adhesin Expression in Biofilm-Forming Staphylococcus Epidermidis. Antimicrob Agents Chemother 2000, 44, 3357–3363. [Google Scholar] [CrossRef] [PubMed]
- O’Neill, E.; Pozzi, C.; Houston, P.; Humphreys, H.; Robinson, D.A.; Loughman, A.; Foster, T.J.; O’Gara, J.P. A Novel Staphylococcus Aureus Biofilm Phenotype Mediated by the Fibronectin-Binding Proteins, FnBPA and FnBPB. J Bacteriol 2008, 190, 3835–3850. [Google Scholar] [CrossRef] [PubMed]
- Houston, P.; Rowe, S.E.; Pozzi, C.; Waters, E.M.; O’Gara, J.P. Essential Role for the Major Autolysin in the Fibronectin-Binding Protein-Mediated Staphylococcus Aureus Biofilm Phenotype. Infect Immun 2011, 79, 1153–1165. [Google Scholar] [CrossRef]
- Quendera, A.P.; Pinto, S.N.; Pobre, V.; Antunes, W.; Bonifácio, V.D.B.; Arraiano, C.M.; Andrade, J.M. The Ribonuclease PNPase Is a Key Regulator of Biofilm Formation in Listeria Monocytogenes and Affects Invasion of Host Cells. npj Biofilms Microbiomes 2023, 9, 34. [Google Scholar] [CrossRef] [PubMed]
Figure 1.
Effect of different concentrations of the antibiotic Vancomycin on the growth curves of (a) S. aureus ATCC 6538 (methicillin-susceptible Staphylococcus aureus, MSSA) and (b) S. aureus pHUA585 (clinical isolate, MRSA). Each OD600 represents means of the three technical replicates. • S. aureus without Vancomycin; • 0.78 mg/L Vancomycin; • 1.56 mg/L Vancomycin; • 3.12 mg/L Vancomycin; • 6.25 mg/L Vancomycin; • 12.5 mg/L Vancomycin; • 25 mg/L Vancomycin; • 50 mg/L Vancomycin.
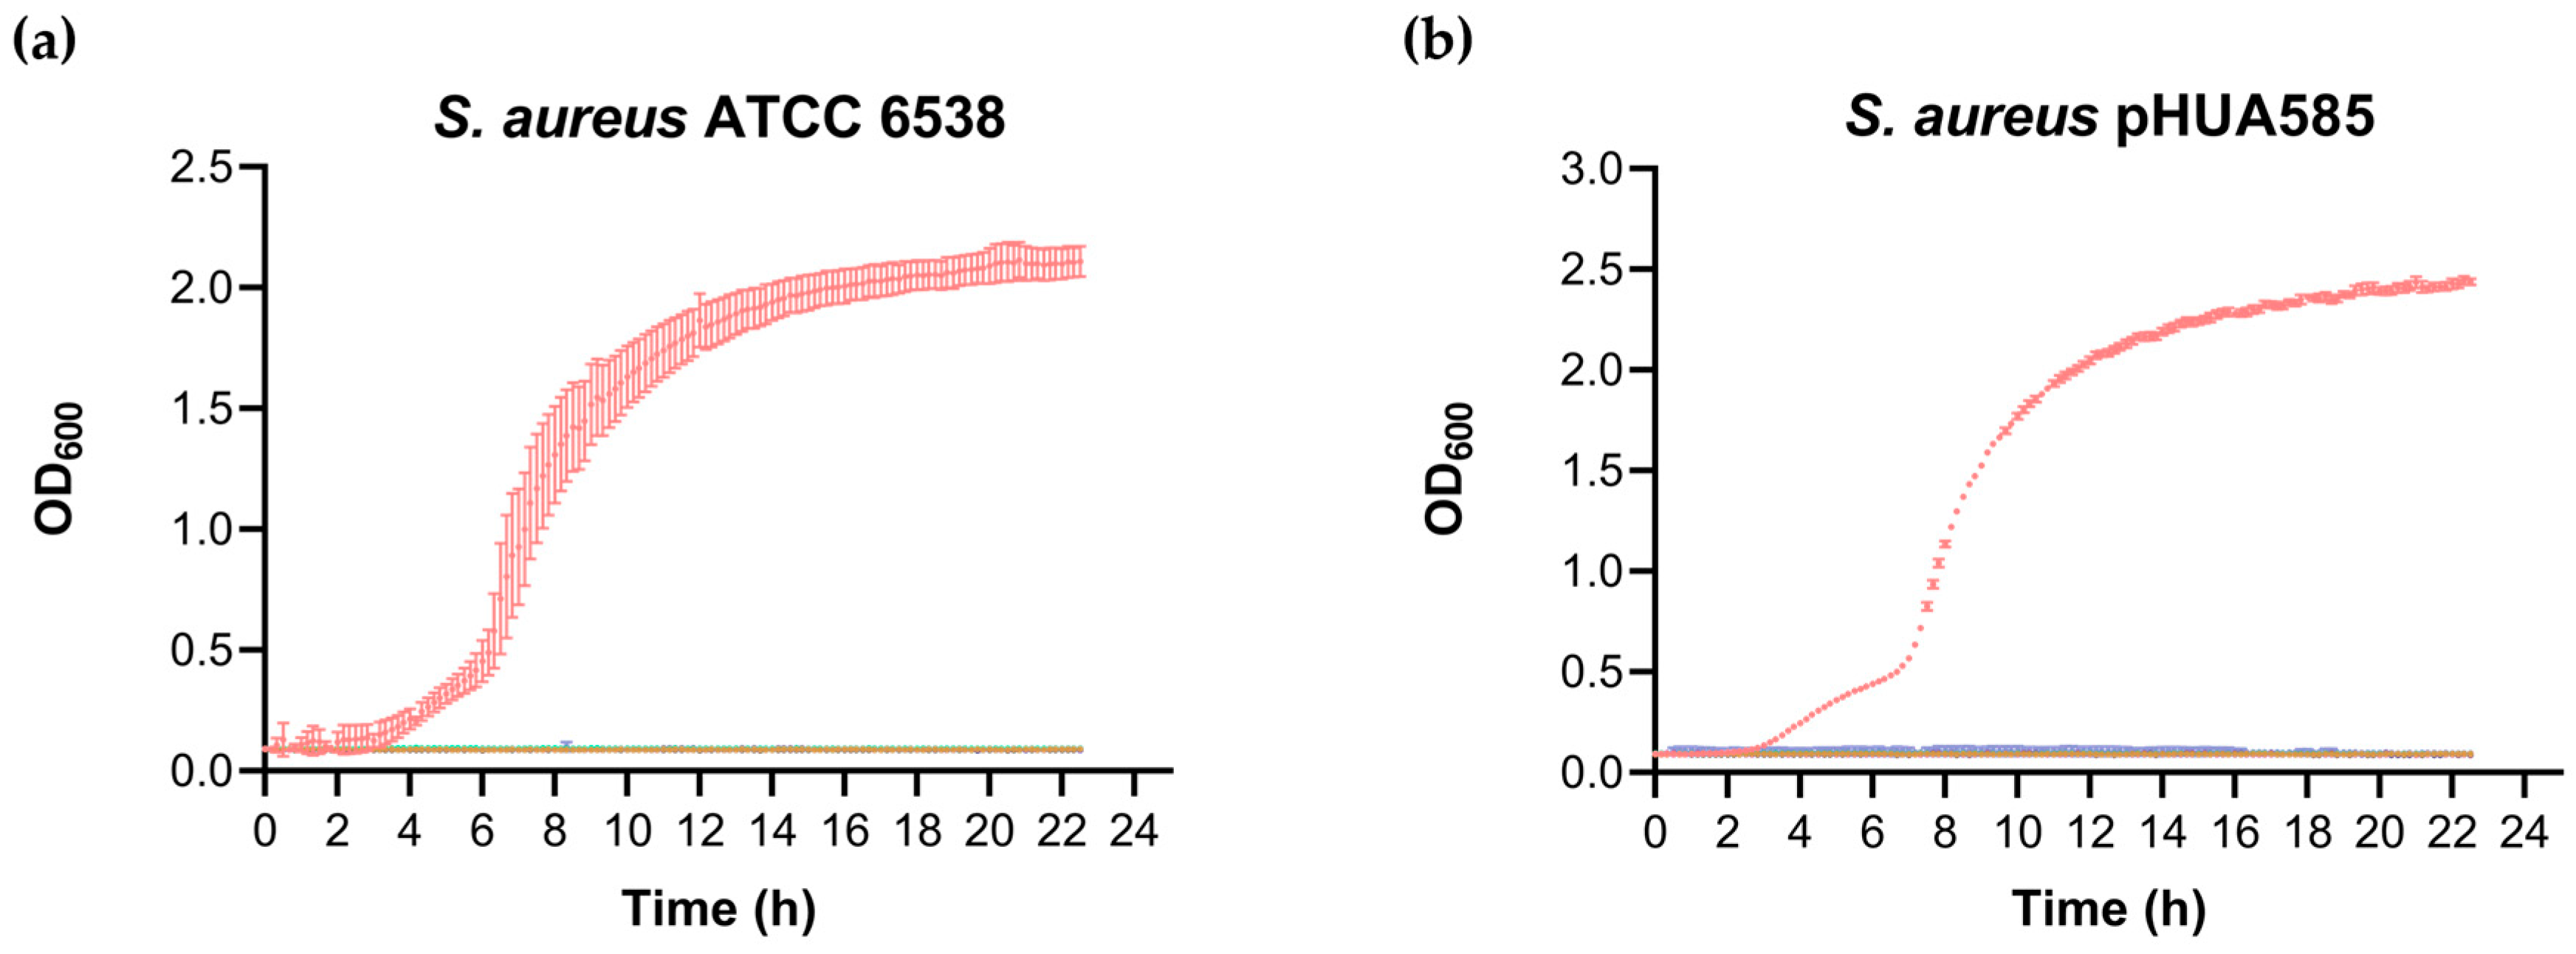
Figure 2.
Effect of Vancomycin on the viability of the (a) S. aureus ATCC 6538 and (b) S. aureus pHUA585 24 h-pre-formed biofilms exposed for another 24 hours to increasing concentrations of antibiotic (• S. aureus without Vancomycin; • 3.12 mg/L Vancomycin; • 6.25 mg/L Vancomycin; • 12.5 mg/L Vancomycin; • 25 mg/L Vancomycin; • 50 mg/L Vancomycin; • oxidized species; • reduced species). The effect was measured using a resazurin reduction fluorometric assay. The positive control is resorufin, a semi-reduced form of resazurin, obtained after autoclaving the TSB supplemented with resazurin. The negative control is TSB supplemented with resazurin. (c) Percentage of bacteria viability within the biofilm after 10 minutes relatively to the untreated sample (█ S. aureus ATCC 6538 biofilm and █ S. aureus pHUA585 biofilm), to compare the effect of each Vancomycin concentration on the two strains of S. aureus.
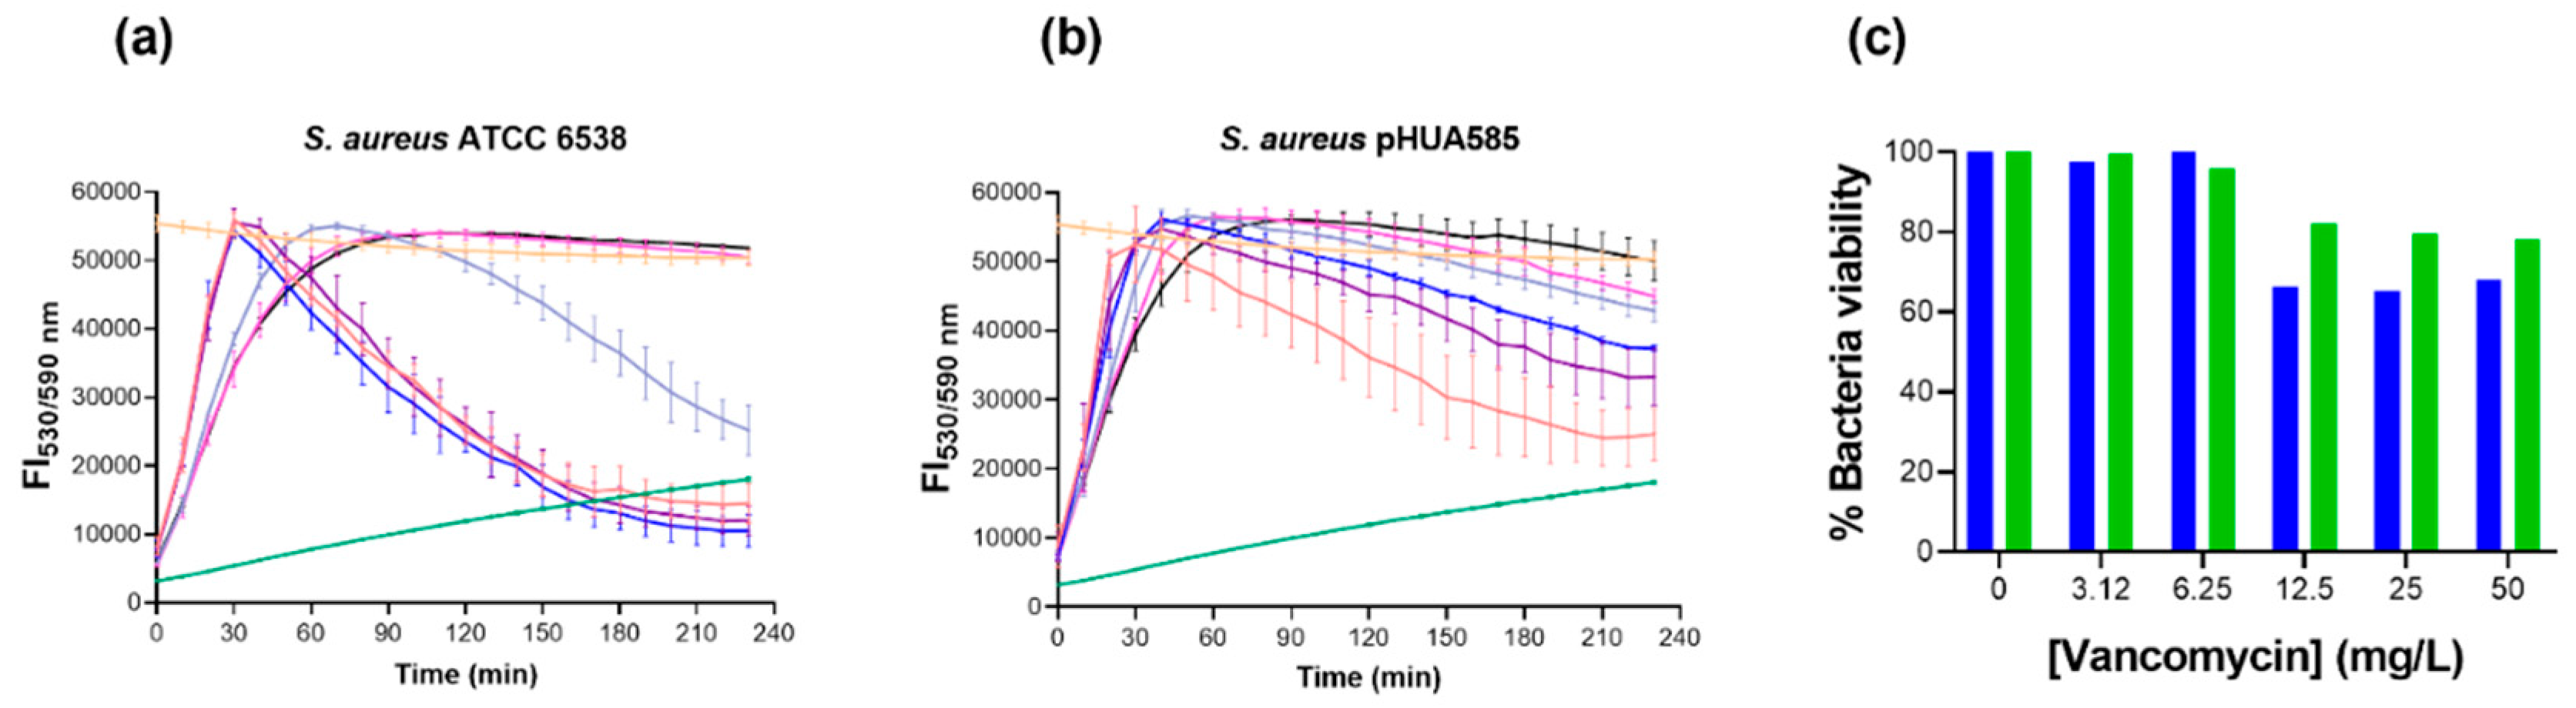
Figure 3.
CLSM-based analysis of the 24 h-biofilms of the strains S. aureus ATCC 6538 (MSSA) and S. aureus pHUA585 (MRSA) grown in TSB supplemented with 0.25% of glucose. (a) Confocal laser scanning microscopy images of 24 h-biofilms that were stained with the nucleic acid-binding dye SYTO 9, green channel, and the S. aureus biofilm polysaccharide intercellular adhesin (PIA) probe WGA-Alexa 633, red channel. The overlay from the xy and xz planes images is also presented and both biofilm components are identified using arrows. The circles in this figure highlight regions of S. aureus ATCC 6538 with lower nucleic acid abundance. Panels (a) show XY images of the biofilm near the coverslip, while the XZ images are orthogonal projections. Figure (b) depicts the biofilm thickness distribution (z, in μm) for each bacterial strain.
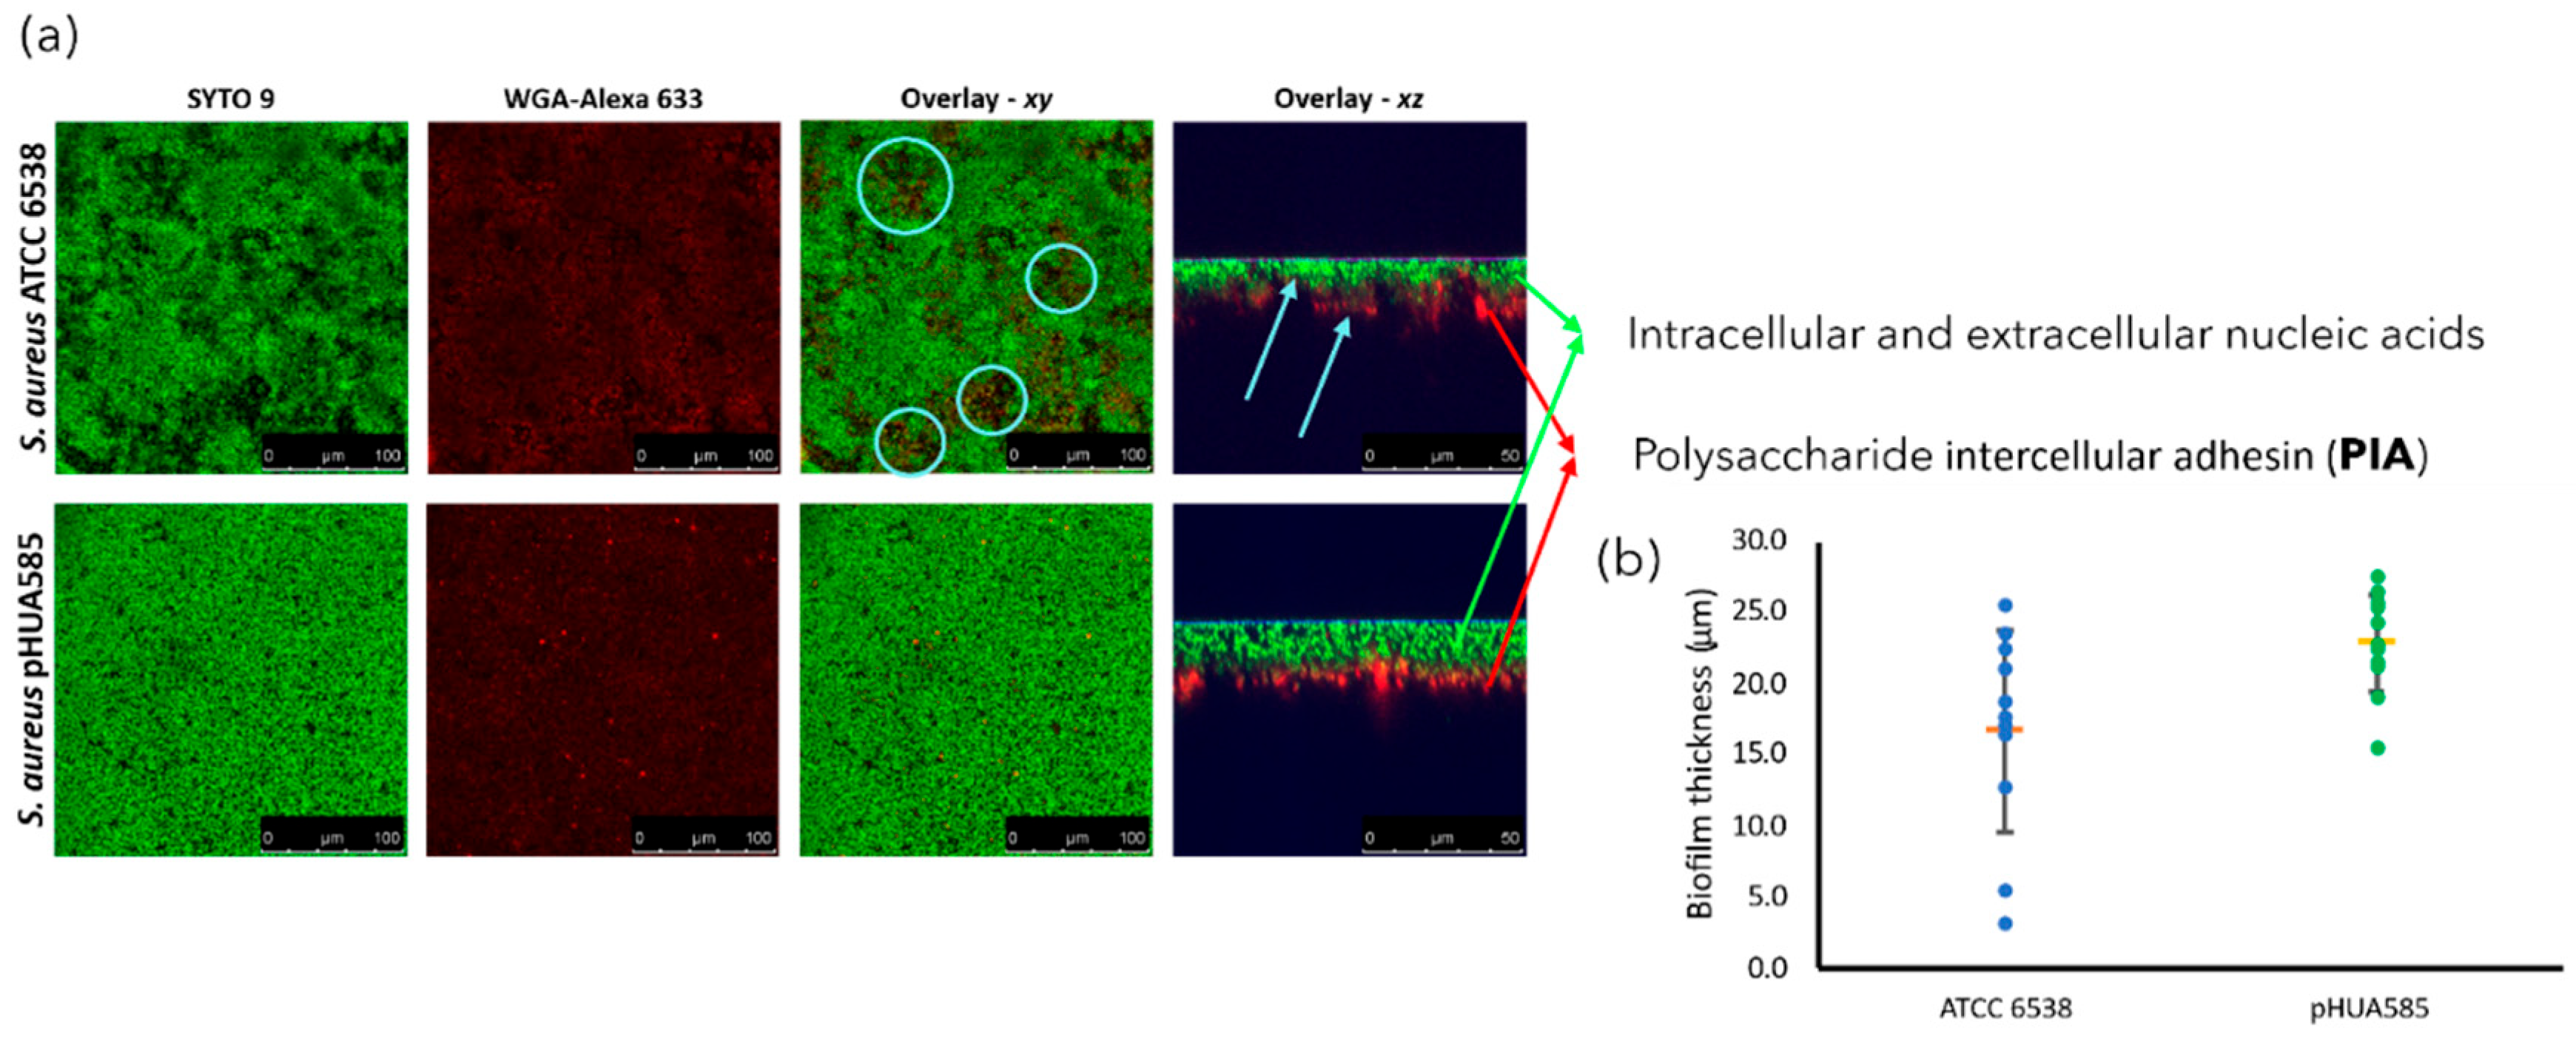
Figure 4.
Representative images of S. aureus biofilms. For larger scale production these biofilms were grown on a solid membrane support on agar plates.
Figure 4.
Representative images of S. aureus biofilms. For larger scale production these biofilms were grown on a solid membrane support on agar plates.
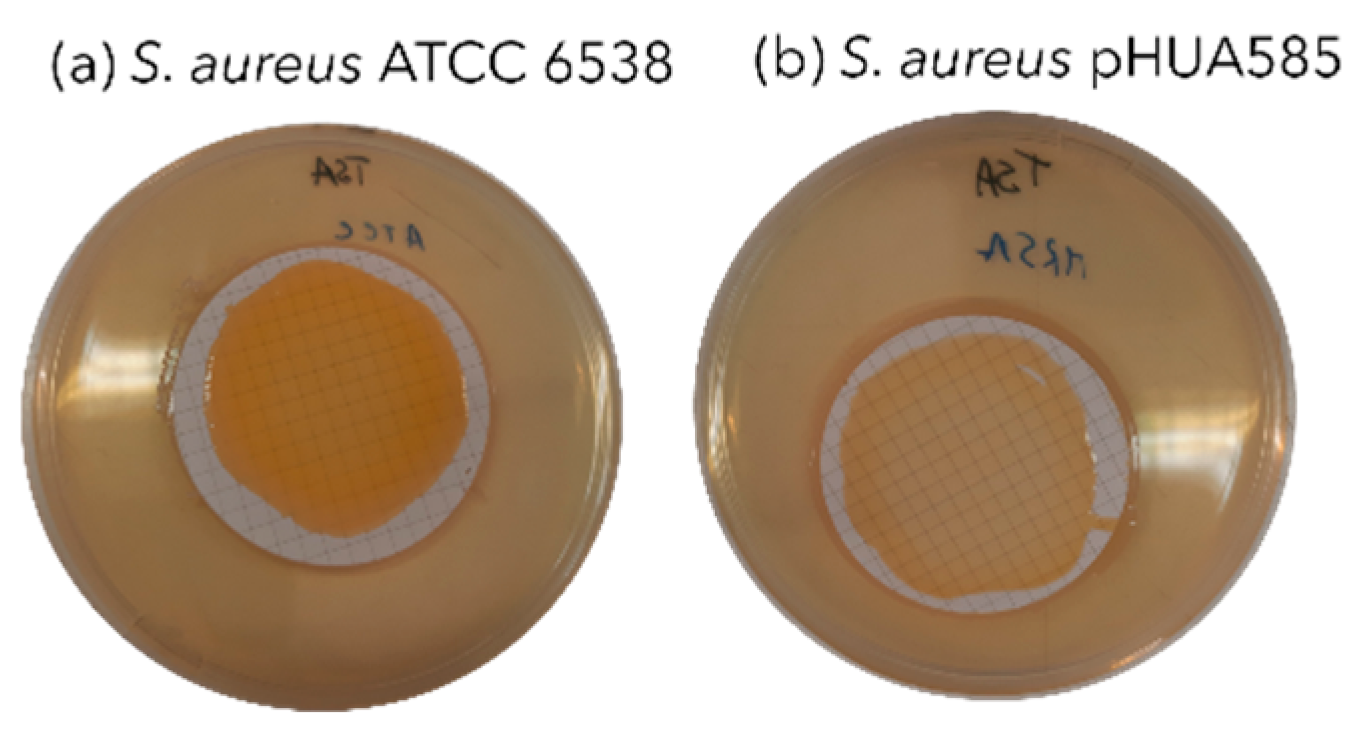
Figure 5.
Agarose gel electrophoresis performed to evaluate the integrity of the extracted RNAs from the S. aureus (a) biofilms and (b) planktonic cells of the strains ATCC 6538 and pHUA585. 23S, 16S and 5S ribosomal RNAs are not degraded.
Figure 5.
Agarose gel electrophoresis performed to evaluate the integrity of the extracted RNAs from the S. aureus (a) biofilms and (b) planktonic cells of the strains ATCC 6538 and pHUA585. 23S, 16S and 5S ribosomal RNAs are not degraded.
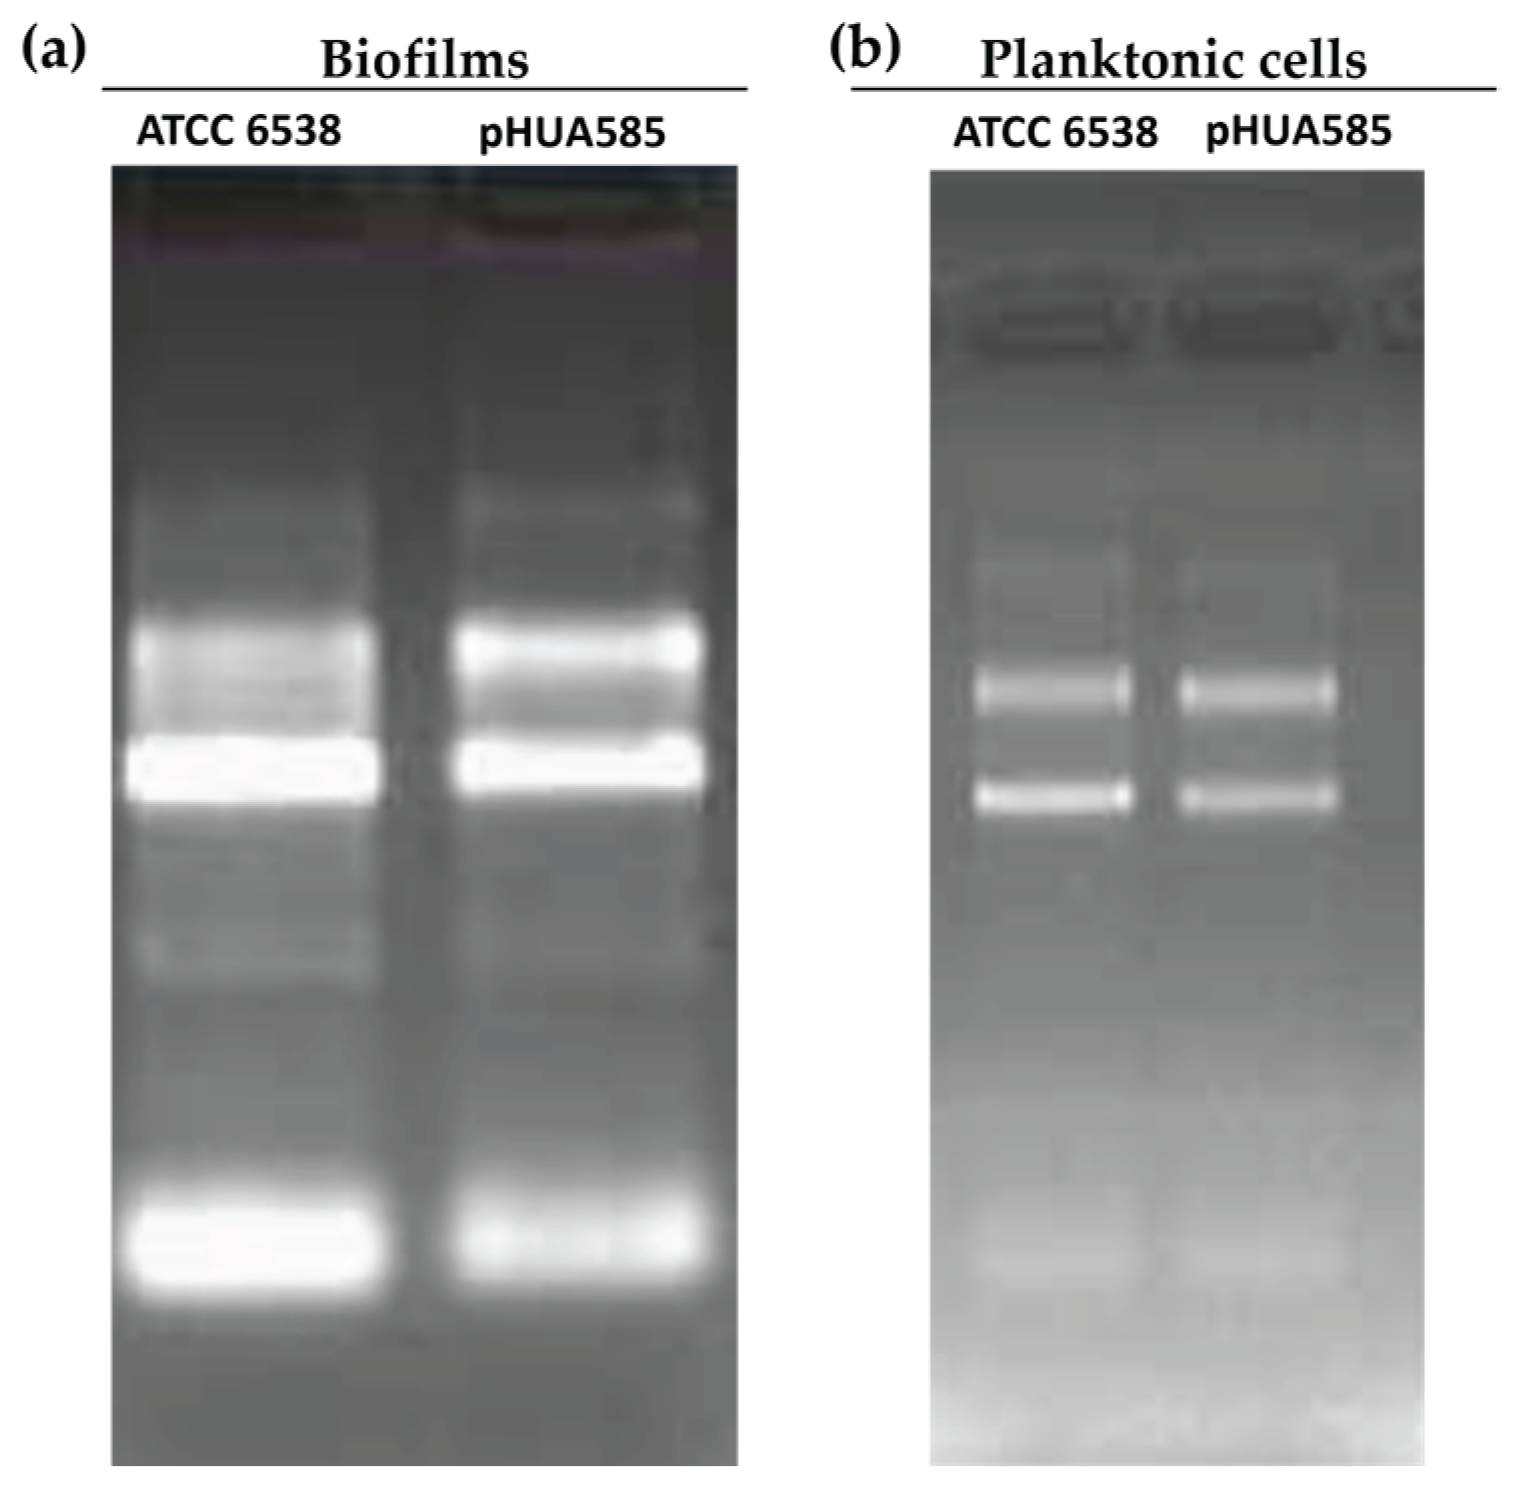

Table 1.
Primers used in RT-qPCR assays for 16S rRNA and icaA genes.
| Target gene | Chain | Sequence (5’-3’) | Reference |
|---|---|---|---|
| 16S rRNA | Forward | 5’ - GTGGAGGGTCATTGGAAACT - 3’ | This work |
| Reverse | 5’ - CACTGGTGTTCCTCCATATCTC - 3’ | ||
| icaA | Forward_1 | 5’ - TTTCGGGTGTCTTCACTCTATTT - 3’ | This work |
| Reverse_1 | 5’ - TGGCAAGCGGTTCATACTT - 3’ | ||
| Forward_2 | 5’ - ACACTTGCTGGCGCAGTCAA - 3’ | [29] | |
| Reverse_2 | 5’ - TCTGGAACCAACATCCAACA - 3’ |
Table 2.
Antibiotic susceptibility of the S. aureus isolate pHUA585, tested in this work, and reference strain ATCC 6538, from susceptibility testing and from the literature, according to the EUCAST January 2023-defined breakpoints.
Table 2.
Antibiotic susceptibility of the S. aureus isolate pHUA585, tested in this work, and reference strain ATCC 6538, from susceptibility testing and from the literature, according to the EUCAST January 2023-defined breakpoints.
| Antibiotic | ATCC 6538 | pHUA585 |
|---|---|---|
| Benzylpenicillin | S | R |
| Oxacillin | S | R |
| Gentamicin | S | S |
| Levofloxacin | I [35] | R |
| Moxifloxacin | S | R |
| Erythromycin | S [36] | R |
| Clindamycin | R [36] | *R |
| Vancomycin | S | S |
| Teicoplanin | S [37] | S |
| Linezolid | S [38] | S |
| Daptomycin | S [39] | S |
| Tetracycline | S [36] | S |
| Mupirocin | S [40] | S |
| Rifampicin | S | S |
| Trimethoprim-sulfamethoxazole | S | S |
| Fusidic acid | S [41] | S |
* = AES modification. S – Sensitive; R – Resistant; I – Intermediate resistance.
Table 3.
RNA concentration (ng/μL) and absorbance ratios A260/A280 nm and A260/A230 nm obtained for both biofilm and planktonic cell samples of S. aureus ATCC 6538 and pHUA585 strains.
Table 3.
RNA concentration (ng/μL) and absorbance ratios A260/A280 nm and A260/A230 nm obtained for both biofilm and planktonic cell samples of S. aureus ATCC 6538 and pHUA585 strains.
| Strain | RNA concentration (ng/µL) | A260/A280 | A260/A230 | |
|---|---|---|---|---|
| Biofilms | ATCC 6538 | 1318.8 | 2.14 | 2.02 |
| pHUA585 | 1005.4 | 2.13 | 1.76 | |
| Planktonic cells | ATCC 6538 | 1349.6 | 2.14 | 2.20 |
| pHUA585 | 1009.0 | 2.22 | 2.03 |
Disclaimer/Publisher’s Note: The statements, opinions and data contained in all publications are solely those of the individual author(s) and contributor(s) and not of MDPI and/or the editor(s). MDPI and/or the editor(s) disclaim responsibility for any injury to people or property resulting from any ideas, methods, instructions or products referred to in the content. |
© 2025 by the authors. Licensee MDPI, Basel, Switzerland. This article is an open access article distributed under the terms and conditions of the Creative Commons Attribution (CC BY) license (http://creativecommons.org/licenses/by/4.0/).
Copyright: This open access article is published under a Creative Commons CC BY 4.0 license, which permit the free download, distribution, and reuse, provided that the author and preprint are cited in any reuse.


