Submitted:
06 November 2025
Posted:
07 November 2025
You are already at the latest version
Abstract
This study presents an analysis of the Infrastructure Leakage Index (ILI) variability for two District Metered Areas (DMAs) in the Silesian Region (Poland), based on 2024 data. The objective was to assess the suitability of the ILI for short-term leakage evaluation and its potential to support operational decision-making. ILI values were calculated for daily, weekly, and monthly intervals using synchronized hourly data from an Advanced Me-tering Infrastructure (AMI) system and water network monitoring platforms. A key ad-vantage of the dataset was the temporal alignment of inflow, outflow, and consumption data at the DMA level.
The study applied statistical measures of variability (standard deviation, variance, coeffi-cient of variation) and graphical methods (histograms, boxplots) to evaluate ILI behavior across time resolutions. The two DMAs were compared to explore the differences in ILI dynamics, range, and identify operational factors influencing leakage levels.
The results confirm that ILI interpretation is highly dependent on temporal resolution. Daily data is more responsive to anomalies and operational events, while monthly data provides more stable values suitable for benchmarking. Despite the aggregation smooth-ing the variability, notable differences in system performance between zones persist. High-frequency AMI data enhances the precision and operational value of ILI analyses.
Keywords:
advanced metering infrastructure
; infrastructure leakage index (ILI)
; water balance
; water loss
; variability analysis
1. Introduction
The Infrastructure Leakage Index (ILI) [1,2] is currently the global standard for assessing water loss levels in water distribution systems.
This indicator has been validated using data from numerous water and wastewater utilities over more than 20 years of application [3,4,5,6,7]. Typically, ILI value is determined for entire water distribution systems over months and years.
In Europe, the Directive (EU) 2020/2184 of the European Parliament and of the Council on the quality of water intended for human consumption [8] requires all Member States to annually determine and report ILI values for each water utility. Similarly, in the United States, the ILI is a core component of the water audit standard developed by the American Water Works Association (AWWA) and presented in the AWWA Manual M36: “Water Audits and Loss Control Programs” [9]. While the AWWA guidance is not legislative, many states, including Georgia (Georgia Water Stewardship Act), Texas (Texas Water Loss Audit Program [10]), and California (Senate Bill 555 [11]), have adopted these guidelines as mandatory.
In Australia, the ILI is included in the National Performance Report (NPR) [12], prepared annually by the Bureau of Meteorology to evaluate utility performance. Other countries, such as New Zealand (via Water New Zealand [13]), South Africa (via the No Drop programme by the Department of Water and Sanitation [14]), Canada (e.g., the City of Guelph [15]), Chile (via standards set by Superintendencia de Servicios Sanitarios – SISS [16]), and Israel (via the national water utility Mekorot [17]), apply ILI-based frameworks in line with international standards.
All of the aforementioned regulations, recommendations, and guidelines stem from an extensive and evolving body of research on the Infrastructure Leakage Index (ILI), developed over a significant period by academic and professional communities across multiple countries. Key areas of scholarly investigation include:
- Forecasting ILI values based on monthly and annual data sources [18];
- Identifying the limitations of using annual average Non-Revenue Water (NRW) values, particularly due to the masking effects of consumption fluctuations and network upgrades [19];
- Estimating the ILI through methodologies based on the analysis and measurement of Minimum Night Flow (MNF) [20];
- Determining the ILI using the Geographic Information System (GIS) tools to support strategic decision-making, spatial identification of leakage hotspots, and realistic estimation of potential financial recovery from leakage control interventions [21];
- Applying environmental valuation frameworks to determine the Economic Level of Leakage (ELL) under arid conditions, as demonstrated in the Al-Qassim region of Saudi Arabia. The model assumes the reduction of real losses to the Unavoidable Real Losses (URL) threshold, equivalent to an ILI value of 1 [22];
- Assessing the impact of pressure management implementation on the ILI as a key performance indicator for water loss control [23];
- Developing robust methodologies for ILI estimation in large-scale, non-homogeneous water distribution systems, incorporating the variability of service connection lengths and average operating pressures, along with conducting sensitivity analyses of the contributing parameters [24].
Water utilities worldwide are increasingly investing in the development of an Advanced Metering Infrastructure (AMI) for water meter reading systems. These systems provide consumption data for each customer at an hourly interval, meaning that utilities receive 720 times more sets of data per day than before.
The data obtained from the AMI systems enables advanced analyses of the water distribution systems’ performance and provide water utilities with a level of insight that allows for optimal management of potable water supply to customers [25]. AMI data supports:
- Hourly water balance calculations within DMAs [26];
- Real-time water consumption monitoring systems at an individual user level, enabling rapid leak detection and prompt operational response within the water distribution network [27];
- Assessment of water losses in distribution networks where the AMI systems enable synchronous readings, i.e., measurements taken simultaneously from all water meters [32];
- Identification of leaks at the customer level [33].
In this context, several important research questions arise:
- Can the analysis of the Infrastructure Leakage Index (ILI) at a District Metered Area (DMA) level serve as a useful tool for assessing current water losses and supporting operational management?
- What is the variability of ILI values when calculated on a daily, weekly, and monthly basis?
- Does the analysis of the ILI at daily, weekly, and monthly resolutions enhance the effectiveness of operational response?
- Do variability parameters of the ILI (calculated for each day, week, and month) differ significantly between DMAs?
- What factors influence the variability of ILI values?
- What new insights can be gained from a daily-resolution ILI analysis, and can this approach be effectively utilized in water loss management?
- For what purposes can the ILI, determined at different temporal intervals, be applied?
- What level of real (physical) water losses corresponds to the calculated ILI values?
The aim of this study is to address the above questions by analyzing the use of high-frequency AMI data in ILI estimation and evaluating the usefulness of temporal resolution as a supporting factor in water loss management strategies.
2. Materials and Methods
2.1. Study Area
The study area is located in Piekary Śląskie, a city situated within one of the most urbanized and industrialized regions of southern Poland (Silesian Voivodeship). Since the 18th century, intensive mining activity has been carried out in this area, resulting in significant anthropogenic transformations of the terrain. These mining-induced changes have considerable implications for the functioning and reliability of the local water supply system.
Water supply services in Piekary Śląskie are provided by Miejskie Przedsiębiorstwo Wodociągów i Kanalizacji Sp. z o.o. (MPWiK), which operates approximately 218 kilometers of water distribution network. In 2024, the Infrastructure Leakage Index (ILI) for the entire water distribution system was recorded at 1.29.
This study focuses on two designated and metered District Metered Areas (DMAs): SW Bata and SW Rozalia, both operated by MPWiK. Their locations are illustrated in Figure. 1.
Each DMA is supplied through a dedicated monitoring point installed at the connection to the main transmission pipeline. These connection points are equipped with pressure-reducing valves with fixed pressure settings, making each DMA an independent Pressure Management Area (PMA).
The key characteristics of the two analyzed zones are presented in Table 1. SW Rozalia is significantly larger than SW Bata, exhibits a lower ILI value, and serves a different customer profile. In the SW Bata zone, there are substantial gaps in the hourly consumption data, and one customer does not provide any data at all. In contrast, in SW Rozalia, a 100% of consumption data is missing for 21 consumers, however, the overall data acquisition success rate remains high at 92.2%.
The inflow points of each DMA are equipped with sensors that record the flow rate and pressure at hourly intervals. Furthermore, all customer water meters are equipped with remote reading modules using the LoRa technology, which transmit hourly consumption data to the MPWiK’s servers automatically, without the need for manual intervention. The data is transmitted once per day.
The availability of such high-resolution datasets enables the determination of hourly water balances for each DMA, along with the calculation of water loss indicators for each hour of the day.
2.2. Methods
The following research agenda was established, employing a range of techniques and analytical methods:
- Estimation of ILI values for the analyzed DMAs based on hourly data for each day, week, and month throughout the year of 2024. The Infrastructure Leakage Index (ILI) values were calculated using high-resolution hourly data, including flow measurements from the inlet points supplying the respective zones and hourly water consumption data from all customers assigned to each DMA.
The Infrastructure Leakage Index (ILI) was calculated according to the following formula:
where:
ILI = CARL / UARL × SCF
CARL – Current Annual Real Losses [m³/day, m³/week, m³/month, m³/year];
UARL – Unavoidable Annual Real Losses [m³/day, m³/week, m³/month, m³/year];
SCF – System Factor Coefficient [-].
The SCF was determined using the following equation:
where:
SCF = (Nc / 5000) ^ a × (P / 50) ^ b
Nc – number of service connections;
P – average operating pressure in the network (AOP) [mH2O];
a, b – the exponents 0.25 and 0.5 are empirical values derived from calibration studies of the UARL equation for systems of different sizes and pressures (https://www.leakssuitelibrary.com/).
The UARL was determined using the following equation:
where:
UARL = (18 × Lm + 0.8 × Np + 25 × Lp) × P
Lₘ – length of mains [km];
Nₚ – number of service connections;
Lₚ – average length of service connections from main to customer’s meter [km];
P – average operating pressure in the network (AOP) [mH2O].
- 2.
- Analysis of the variability of the calculated ILI values using statistical methods for the studied water distribution zones.
- 3.
- Comparative analysis of the variability indicators derived from the analyzed zones.
- 4.
- Assessment of the usefulness of ILI values calculated on daily, weekly, and monthly intervals for operational management of water distribution systems at the DMA level.
- 5.
- Identification and characterization of atypical operating conditions within the DMAs that significantly influence ILI variability or hinder the accurate determination of its value.
3. Results
The chart illustrating the variations in the ILI values for 2024 for SW Rozalia and SW Bata is presented in Figure 2 for daily values, Figure 3 for weekly values, and Figure 4 for monthly values.
The daily values of the Infrastructure Leakage Index (ILI) for SW Rozalia throughout 2024 remained close to 1 and exhibited a stable trend, with two distinct increases corresponding to the occurrence and subsequent repairs of water network failures. The maximum ILI value was recorded on March 11, 2024, reaching 3.96, which significantly deviates from the annual average of 1.35.
In 2024, data regarding the water inflow into the SW Rozalia zone was missing on February 24 and December 28. As a result, these days were excluded from the analysis.
SW Bata exhibited substantially higher daily ILI values, with an annual average of 2.75. Several extreme values were observed throughout the year, namely: 36.70 (February 21, 2024); 11.92 (March 7, 2024); 26.47 (March 16, 2024); 6.63 (April 9, 2024); 7.48 (June 18, 2024); 8.10 (August 16, 2024); 8.59 (August 27, 2024); 5.08 (August 29, 2024); and −25.75 (December 3, 2024).
Selected identified extremes in the SW Bata zone in 2024 are characterized below.
- February 21, 2024 – SW Bata has taken over the water supply for the entire SW Janty zone.
- March 7, 2024 – SW Bata has taken over the water supply for the entire SW Janty zone.
- March 16, 2024 – Extension of the zone to include part of the consumers from SW Janty, without adjusting/assigning their consumption to SW Bata.
- April 9, 2024 – Connection of the SW Bata with the SW Pod Lipami Górka.
- June 18, 2024 – Probable water main failure.
- August 16, 2024 – Missing consumption data from a large water user.
- December 3, 2024 – A failure occurred in the supplier’s network, as a result of which MPWiK interconnected several zones into one, supplied from multiple points, thus making an analysis impossible.
Negative ILI values were excluded from the variability analysis, as they are not considered valid. Accurately determining the ILI during these periods would require an integrated estimation approach accounting for the joint operation of multiple DMAs as a single supply zone.
The weekly values of the Infrastructure Leakage Index (ILI) (Figure 3) exhibit a smoothed profile, with extreme values significantly flattened. For instance, in the case of SW Rozalia, the highest peak observed on March 11, 2024, decreased from 3.96 (daily value) to 2.09 (weekly value). Similarly, in the SW Bata zone, the highest positive extreme was reduced from 36.70 to 23.22.
In the case of a representative event in SW Rozalia—the first extreme observed on March 11, 2024—the data reveals a substantial discrepancy between the ILI values calculated at different temporal resolutions: 3.96 for daily data, 2.09 for weekly data, and 1.99 for monthly data (Figure 4). This variation highlights how the same event, when assessed using daily data, reflects moderate efficiency of the water distribution system, whereas the monthly data suggest good performance [1].
Additionally, the described case highlights the significant impact that water supply network failures can have on the Infrastructure Leakage Index (ILI) value, and underscores the sensitivity of daily ILI calculations to such events. In the analyzed situation involving the first extreme event in the SW Rozalia zone, the increase in the daily ILI from approximately 1.50 to 3.96 was attributable to a pipeline failure with an estimated leakage rate of around 8 m³/h.
During subsequent stages of the analysis, the extreme ILI outliers were excluded. These outliers were attributable to water-balance inconsistencies arising from the merging of zones and missing observations for the zone inflow or consumption.
The histograms and boxplots for SW Rozalia (Figure 5) demonstrate a narrow and symmetric distribution of ILI values across all temporal aggregations.
Daily data shows low dispersion and no significant outliers, suggesting stable short-term performance. Weekly and monthly data exhibits even more compact distributions, with decreasing variability and consistently low leakage indicators.
These visualizations confirm that SW Rozalia is a well-controlled zone, with minimal fluctuations in leakage levels and effective operational management over time.
In contrast, the visualizations for SW Bata (Figure 6) reveal a wider and right-skewed distribution of ILI values, particularly in the daily dataset.
Daily ILI values are more dispersed, with a right-skewed tail and several outliers, indicating short-term leakage spikes or operational anomalies. Weekly and monthly data remains more dispersed than in SW Rozalia, although aggregation reduces the extremes and yields more compact distributions.
This variability pattern suggests that SW Bata experiences unstable leakage conditions, pointing to potential operational inefficiencies or intermittent infrastructure failures that require further investigation.
In the next step, an analysis of the variability of the ILI values calculated for each day, week, and month of the year of 2024 was conducted for the studied zones.
The statistical analysis of the ILI in SW Rozalia across different time resolutions is presented in Table 2. Mean ILI values are consistent (≈1.34), indicating a stable average water loss in the DMA. Median values are slightly lower than the means, suggesting a mild right-skew—occasional higher leakage events. Standard deviation and range decrease with longer aggregation. Interquartile Range (IQR) remains comparable across all levels, showing that the core 50% of values is stable. The daily and weekly ILI values exhibit high variability (CV > 30%), therefore, they should be used carefully—mainly for anomaly detection and short-term diagnostics. The monthly ILI, with a CV below 25%, provides the most reliable basis for system performance evaluation, comparisons between zones, or regulatory reporting.
In SW Bata, the ILI values are high across all time resolutions, indicating a significant level of real losses in the network and moderate system efficiency.
Variability is moderate and decreases with aggregation:
- Daily CV = 27.76% – moderate variability; some sensitivity to short-term events;
- Weekly CV = 24.95% – lower variability; more stable than daily data;
- Monthly CV = 17.19% – relatively low variability; well suited for reporting and performance tracking.
Time aggregation reduces volatility, making monthly data the most appropriate for trend and benchmarking analyses.
Figure 7 shows a comparison of the variability parameters of the ILI indicator, calculated for each day of 2024 for SW Rozalia and SW Bata.
The comparison of the daily Infrastructure Leakage Index (ILI) values between SW Rozalia and SW Bata shows clear differences in level and dispersion.
SW Rozalia exhibits low ILI values (mean 1.36, median 1.25) with moderate relative variability (CV ≈ 35%). The low standard deviation (0.43), narrow range (3.35), and low IQR (0.43) indicate a compact distribution and a generally stable, well-managed zone.
SW Bata, by contrast, displays substantially higher ILI levels (mean 2.88, maximum 7.43), alongside moderate variability (CV ≈ 27.76%). Although its relative variability is lower than in SW Rozalia, the absolute spread is wider (SD 0.80, range 7.01, IQR 0.95), pointing to larger real losses and more frequent high-loss episodes.
In summary, SW Rozalia reflects good operational control at a lower loss level, whereas SW Bata indicates higher real losses and broader day-to-day fluctuations. Targeted leak detection, pressure management, and focused field checks are recommended in SW Bata to reduce losses and improve stability.
The results (Figure 8) show that SW Bata exhibits significantly higher weekly ILI levels than SW Rozalia; both the mean and the median are just over twice those of SW Rozalia, indicating substantially greater real water losses. In terms of variability, SW Bata shows greater absolute dispersion (higher variance and IQR, with a modestly wider range), whereas the coefficient of variation (CV%) is lower than in SW Rozalia, indicating a higher loss level but relatively more stable weekly behavior in proportional terms.
The monthly comparison of ILI values between SW Rozalia and SW Bata (Figure 9) highlights clear differences in network efficiency. SW Rozalia maintains low leakage, with the mean and median below 2 and a CV ≈ 24%, indicating good operational control and stable month-to-month performance. SW Bata shows a higher ILI level than Rozalia (mean ≈ 2.75, median ≈ 2.73, max ≈ 3.59) and a slightly wider absolute spread (higher SD and IQR), yet its relative variability is lower (CV ≈ 17%). This points to a higher baseline of real losses but relatively steady behavior in proportional terms.
While SW Rozalia reflects a well-managed system, SW Bata would benefit from targeted loss-reduction measures and optimization (e.g., pressure management and focused leak detection) to bring its monthly ILI closer to SW Rozalia’s level.
This study examines the temporal variability of the Infrastructure Leakage Index (ILI) in two DMAs—SW Rozalia and SW Bata—using daily, weekly, and monthly aggregations. The coefficient of variation (CV%) is used to assess relative variability (operational stability).
- Daily data – SW Bata shows a much higher ILI level (mean/median ≈ 2 × SW Rozalia) and a wider absolute spread (higher SD, range, IQR). Relative variability is lower in SW Bata (CV ≈ 28%) than in SW Rozalia (≈ 35%), i.e., higher losses but proportionally more stable day-to-day behavior.
- Weekly data – The pattern persists: higher ILI level and larger absolute dispersion in SW Bata, with lower CV than SW Rozalia (≈ 25% vs ≈ 31%). Weekly aggregation smooths the short-term noise in both zones.
- Monthly data – Aggregation further reduces variability. SW Bata retains a higher average ILI than SW Rozalia, while CV remains lower in SW Bata (≈ 17% vs ≈ 24%), indicating a higher baseline of real losses but relatively steady month-to-month behavior.
Overall, SW Rozalia exhibits lower ILI levels but higher relative variability, consistent with good control at a lower loss level yet greater proportional sensitivity to disturbances. SW Bata shows higher real losses and broader absolute dispersion, but lower CV, suggesting a consistently elevated leakage baseline that warrants targeted loss-reduction actions (pressure management, focused leak detection).
Analysis of Hourly Water Balance Components for SW Bata and SW Rozalia in 2024
The analysis of hourly water balance components in the SW Bata (Figure 10) and SW Rozalia (Figure 11) indicates a relatively stable relationship between inflow and consumption throughout most of 2024, with moderate and consistent levels of water loss. The extreme values observed at certain periods (e.g., March, August, and November) do not reflect actual operational conditions – their causes have been described in detail earlier in the article (e.g., temporary network shutdowns, sensor malfunctions, or maintenance works).
When excluding these atypical events, the average water loss levels are approximately 3–5 m³/h in SW Bata and 4–6 m³/h in SW Rozalia, meaning that SW Rozalia consistently exhibits losses higher by about 1 m³/h. Although this difference is not large, it suggests a slightly higher degree of leakage or lower network tightness in SW Rozalia.
From an operational perspective, such loss levels can be considered moderate for medium-sized DMAs. However, on a monthly scale, they still represent significant volumes of water – reaching several hundred cubic meters. In practice, the magnitude of losses observed in both DMAs suggests that standard acoustic leak detection methods may have limited effectiveness in pinpointing leaks in the field, particularly when losses are dispersed or related to background leakage rather than distinct burst events.
4. Discussion
The results presented above provide empirical basis for interpreting the temporal behavior of water losses in both DMAs and for linking the observed hourly losses with the ILI.
The findings demonstrate that the ILI is sensitive to the temporal resolution of the input data. Daily series show higher fluctuation amplitudes and enable detection of short-term anomalies (e.g., leak bursts or configuration changes), which is consistent with prior research [e.g., 29,26]. In particular, the distinct peaks in the daily ILI of SW Bata highlight its sensitivity to short-term disturbances, whereas weekly and monthly aggregations dampen these extremes and produce more stable indicators suitable for benchmarking and long-term assessment [cf. 24,7].
Regarding relative variability, the coefficient of variation (CV%) is higher in SW Rozalia and lower in SW Bata at all time scales, decreasing with greater aggregation in both DMAs. This implies that SW Bata has a slightly higher baseline of real losses but exhibits more stable behavior, while SW Rozalia operates with a lower mean loss level but higher temporal variability.
The hourly water balance analysis enhances this understanding by providing a tangible representation of what a given ILI level means in practice. Translating a relative indicator into actual hourly flow rates of lost water allows for direct visualization of the dynamics of leakage behavior. In this context, SW Bata’s lower and steadier losses align with its lower ILI value, whereas SW Rozalia’s higher and more variable losses are consistent with its higher ILI, confirming that infrastructure condition is the main differentiating factor between the two DMAs.
Moreover, the magnitude of the hourly losses – typically in the range of 3–6 m³/h – illustrates the technical and economic boundaries of leakage control. Such background or diffuse losses are often below the detection thresholds of standard acoustic tools (geophones, correlators, loggers), indicating that further reduction would require significant investment or advanced analytical methods. Hence, hourly data not only supports the quantitative ILI interpretation but also sets realistic expectations for operational fieldwork and cost-effective asset management.
Overall, the integration of high-resolution (hourly) analysis confirms that short-term fluctuations contain valuable diagnostic information. Incorporating this temporal detail into leakage management frameworks enhances the interpretability and operational relevance of the ILI and strengthens its connection to real network conditions.
5. Conclusions
This study highlights the importance of temporal resolution in the interpretation of the ILI and its implications for operational decision-making in water distribution systems.
The results confirm that the ILI is highly sensitive to short-term operational disturbances, anomalies, and leak events when analyzed using high-frequency (daily or hourly) data. While daily and hourly data provides valuable insight into short-duration fluctuations, weekly data offers a balanced view with reduced noise, and monthly data yields the most stable indicators suitable for strategic evaluation and benchmarking.
From a broader perspective, the analysis demonstrates that the ILI is inherently reactive to transient system behavior, particularly in hydraulically unstable zones. Therefore, its interpretation must always consider the chosen aggregation level, and high-frequency monitoring should be supported by robust data validation, trend analysis, and anomaly detection frameworks.
The ongoing development of advanced metering infrastructure (AMI), which provides hourly water consumption data, opens new opportunities for both water loss analysis and distribution network management. High-resolution datasets allow for more precise estimation of actual consumption (Q_real), leading to more accurate and less distortion-prone ILI calculations.
Furthermore, the integration of hourly water balance analysis, as demonstrated for SW Bata and SW Rozalia, bridges the gap between indicator-based and operational perspectives. It enables direct visualization of leakage dynamics, helps assess the technical feasibility of leak localization, and defines the economic limits of further loss reduction. Coupling ILI interpretation with high-frequency water balance analysis thus represents a crucial step toward improving utility efficiency and increasing the responsiveness of water systems to operational incidents.
Author Contributions
Conceptualization, E.K.B. and W.K.; writing—original draft preparation, E.K.B. and W.K.; writing—review and editing, E.K.B., W.K. and B.G. All authors have read and agreed to the published version of the manuscript.
Funding
This research received no external funding.
Data Availability Statement
Restrictions apply to the availability of these data. Data were obtained from MPWiK Piekary Śląskie (Poland) and are available with the permission of MPWiK Piekary Śląskie (Poland).
Conflicts of Interest
The authors declare no conflicts of interest.
Abbreviations
The following abbreviations are used in this manuscript:
| AMI | Advanced Metering Infrastructure |
| AOP | average operating pressure in the network |
| CARL | Current Annual Real Losses |
| DMA | District Metered Areas |
| ELL | Economic Level of Leakage |
| GIS | Geographic Information System |
| ILI | Infrastructure Leakage Index |
| IQR | Interquartile Range |
| MPWiK | Miejskie Przedsiębiorstwo Wodociągów i Kanalizacji Sp. z o.o. w Piekarach Śląskich, Poland (Water and Wastewater Utility in Piekary Śląskie, Poland) |
| PMA | Pressure Management Area |
| SCF | System Factor Coefficient |
| UARL | Unavoidable Annual Real Losses |
References
- Lambert, A.O., Brown, T.G., Takizawa, M., Weimer, D. A Review of Performance Indicators for Real Losses from Water Supply Systems. AQUA 1999, 48(6), pp. 227–237. [CrossRef]
- Hirner, W., Lambert, A. Losses from water supply systems: standard terminology and recommended performance measures, IWA the Blue Pages 2000.
- Winarni, W. Infrastructure Leakage Index (ILI) as Water Losses Indicator. Civ. Eng. Dimens. 2009, 11(2), pp. 126–134. https://doi.org/10.9744/ced.11.2.pp.%20126-134.
- Yilmaz, S., Firat, M., Özdemir, Ö. Using the Infrastructure Leakage Index (ILI) indicator for effective and sustainable leakage management: importance, advantages and challenges. Sigma J. Eng. Nat. Sci. 2022, 40(4), pp. 715–723. [CrossRef]
- Ahopelto, S., Vahala, R. Which Water Loss Indicator is Best for Inter-Utility Comparison and Leakage-Target Setting? SSRN Electron. J. 2023. [CrossRef]
- Mazzolani, G., Ciliberti, F.G., Berardi, L., Giustolisi, O. Assessing Water Performance Indicators for Leakage Reduction and Asset Management in Water Supply Systems, arXiv 2023. [CrossRef]
- Offermann, M., Sosa Solano, B.R., Juschak, M. Study on the Application of the Infrastructure Leakage Index (ILI) in Germany – Calculation Methodology, Analysis, Recommendations, DVGW Research Project W 202310, 2024.
- Directive (EU) 2020/2184 of the European Parliament and of the Council of 16 December 2020 on the quality of water intended for human consumption. Available online: https://eur-lex.europa.eu/eli/dir/2020/2184/oj/eng (Accessed on 27th May 2025).
- American Water Works Association. Manual M36: Water Audits and Loss Control Programs, 4th ed.; Denver, USA, 2016.
- Texas Water Loss Audit Program. Available online: https://www.twdb.texas.gov/conservation/Municipal/waterloss/index.asp (Accessed 27th May 2025).
- Senate Bill No. 555 (California). Available online: https://leginfo.legislature.ca.gov/faces/billNavClient.xhtml?bill_id=202320240SB555 (Accessed 27th May 2025).
- National Performance Report (Australia). Available online: http://www.bom.gov.au/water/npr/framework-review (Accessed 27th May 2025).
- Water New Zealand. Water Loss Guidelines. Available online: https://www.waternz.org.nz/Article?Action=View&Article_id=2542 (Accessed 27th May 2025).
- The No Drop Programme. Driving Water Use Efficiency in the South African Water Sector. Available online: https://www.swpn.org.za/wp-content/uploads/2020/03/No-Drop-Programme-Final.pdf (Accessed 27th May 2025).
- The City of Guelph. Available from: https://guelph.ca/living/environment/water/ (Accessed 27th May 2025).
- Standards set by Superintendencia de Servicios Sanitarios – SISS. Available online: https://cl.boell.org/sites/default/files/2020-08/SERVICIOS%20SANITARIOS.pdf (Accessed 27th May 2025).
- The National Water Utility Mekorot. Available online: https://www.mekorot-int.com/ (Accessed 27th May 2025).
- Kızılöz, B., Şişman, E., Oruç, H.N. Predicting a water infrastructure leakage index via machine learning, Util. Policy 2022, 75, 101357. [CrossRef]
- Pathirane, A., Kazama, S., Takizawa, S. Dynamic analysis of non-revenue water in district metered areas under varying water consumption conditions owing to COVID-19, Heliyon 2024, 10(1), e23516. [CrossRef]
- Polachova, M., Tuhovcak, L. Determination of Infrastructure Leakage Index (ILI) Using Analyses of Minimum Night Flows, Eng. Proc. 2024, 69(1), 211. [CrossRef]
- Nahwani, A., Husin, A.E. Water Network Improvement Using Infrastructure Leakage Index and Geographic Information System, J. Civ. Eng. Archit. 2021, 9(3), 909–914, pp. 909–914. [CrossRef]
- Haider, H. Environmental Valuation for Appraising the Economic Level of Leakage in Arid Environments: A Case of Qassim, Saudi Arabia. In Water Resources Management and Sustainability: Solutions for Arid Regions, Sefelnasr, A., Sherif, M., Singh, V.P., Eds.; Springer: Cham, 2025, pp. 473–493. [CrossRef]
- Yilmaz, S., Firat, M., Ateş, A., Özdemir, Ö. Analyzing the Effect of Pressure Management on Infrastructure Leakage Index in Distribution Systems based on Field Data, Research Square 2021. [CrossRef]
- Lenzi, C., Bragalli, C., Bolognesi, A., Fortini, M. Infrastructure Leakage Index Assessment in Large Water Systems, Procedia Eng. 2014, 70, pp. 1017–1026. [CrossRef]
- Hingmire, S., Paygude, P., Gayakwad, M., Devale, P. Probing to Reduce Operational Losses in NRW by using IoT, SSRG-IJEEE 2023, 10(6), pp. 28–38. [CrossRef]
- Luciani, C., Casellato, F., Alvisi, S., Franchini, M. Green Smart Technology for Water (GST4Water): Water Loss Identification at User Level by Using Smart Metering Systems, Water 2019, 11(3), 405. [CrossRef]
- Alvisi, S., Luciani, C., Franchini, M. Using water consumption smart metering for water loss assessment in a DMA: a case study, Urban Water J. 2019, 16(1), pp. 77–83. [CrossRef]
- Luciani, C., Casellato, F., Alvisi, S., Franchini, M. From Water Consumption Smart Metering to Leakage Characterization at District and User Level: The GST4Water Project, Proceedings 2018, 2(11), 675. [CrossRef]
- Bragalli, C., Neri, M., Toth, E. Effectiveness of smart meter-based urban water loss assessment in a real network with synchronous and incomplete readings, Environ. Model. Softw. 2019, 112, pp. 128–142. [CrossRef]
- Koral W. Analiza danych z systemu stacjonarnego odczytu wodomierzy dla średniej wielkości miasta, INSTAL 2022, 12, pp. 46–52. [CrossRef]
- Gil, B., Koral, W. Analiza krzywych godzinowego zużycia wody na podstawie danych z systemu stacjonarnego odczytu wodomierzy, INSTAL 2021, 12, pp. 29–33. [CrossRef]
- Khaki, M., Mortazavi, N. Water Consumption Demand Pattern Analysis using Uncertain Smart Water Meter Data. In Proceedings of the 14th International Conference on Agents and Artificial Intelligence 3–5 February 2022, 3, pp. 436–443. [CrossRef]
- Randall, T., Koech, R. Smart Water Metering Technology for Water Management in Urban Areas, Water e-Journal 2019, 4(1), pp. 1–14. [CrossRef]
- Dzimińska, P., Stańczyk, J., Drzewiecki, S., Licznar, P. Wykorzystanie systemu rejestracji danych z dużą częstotliwością do analizy nierównomierności zużycia wody, INSTAL 2022, 1, pp. 24–30. [CrossRef]
Figure 1.
Location of the analyzed DMA zones (SW Bata and SW Rozalia) in Piekary Śląskie.
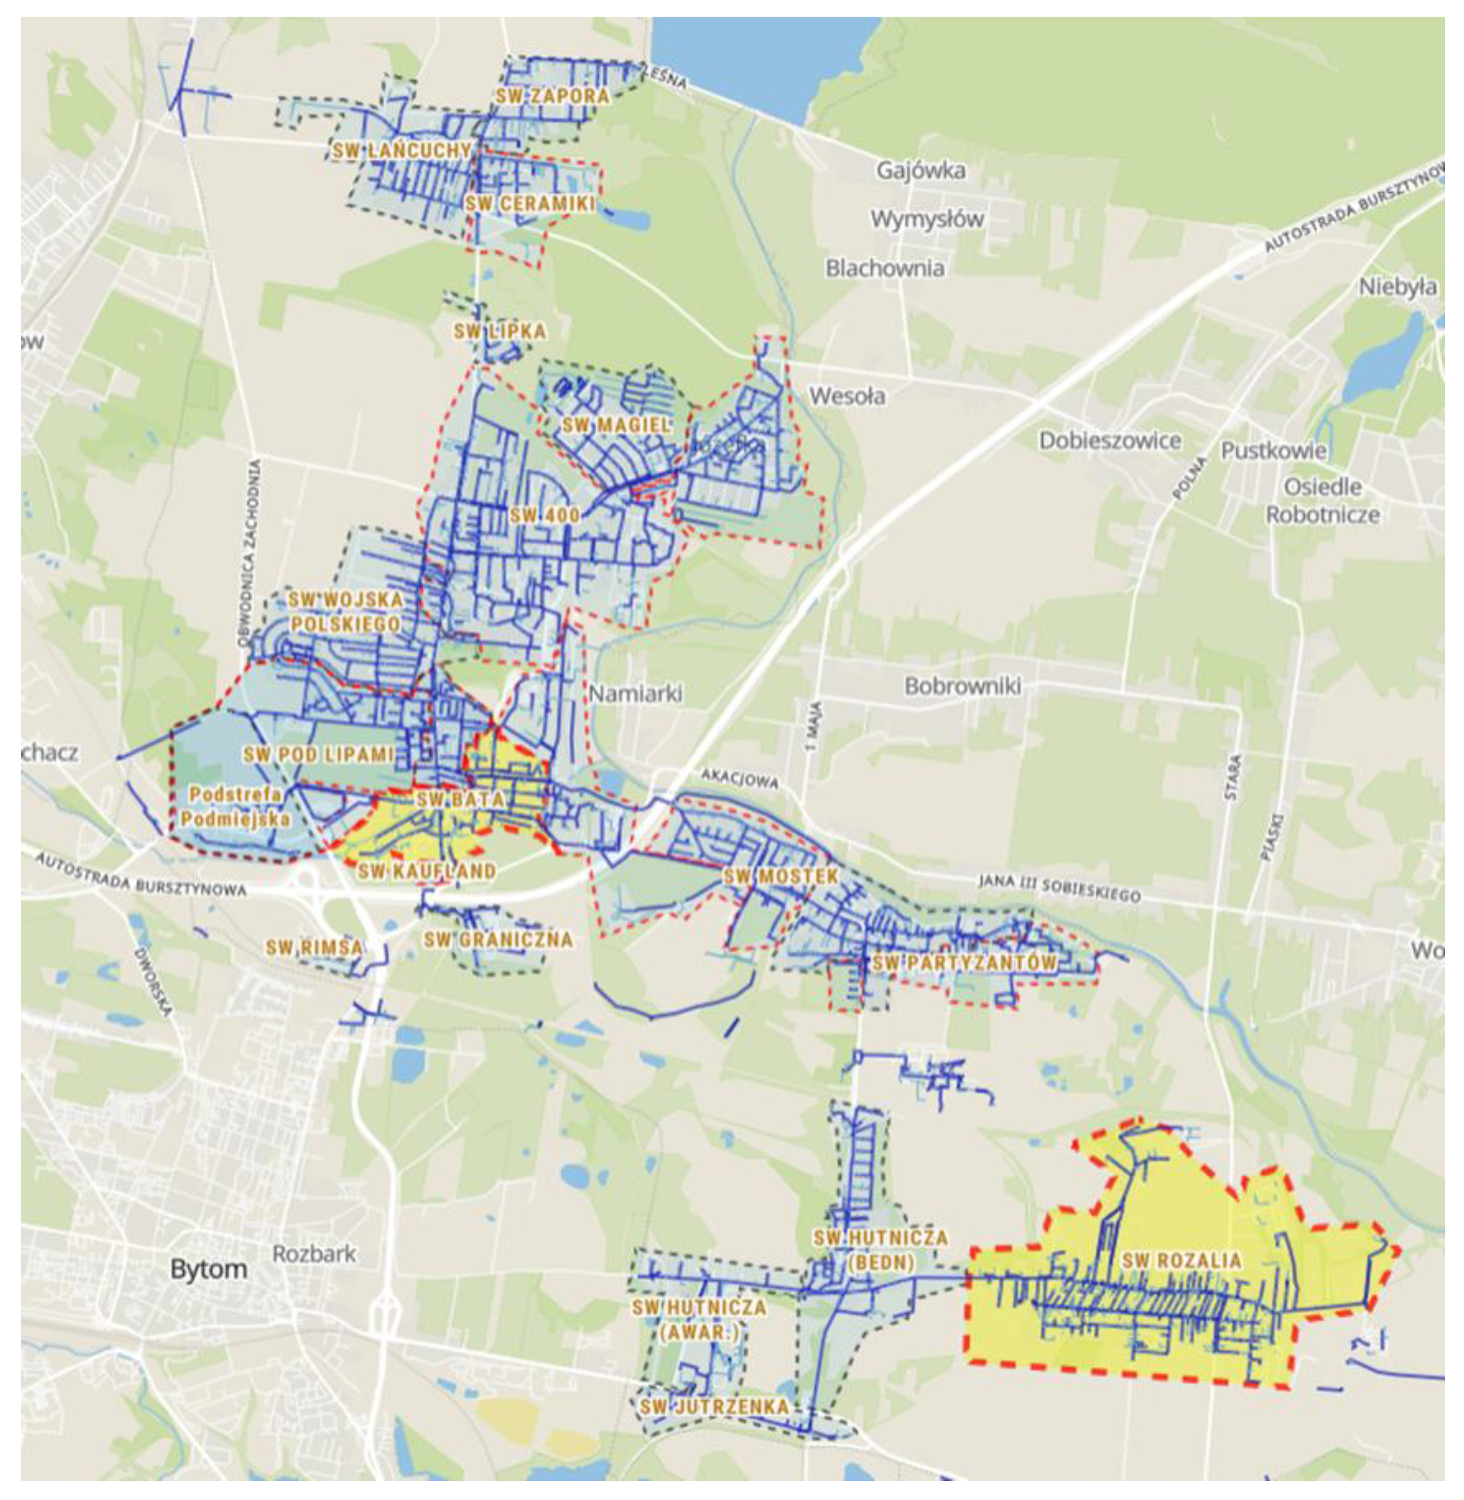
Figure 2.
Daily values of the ILI indicator for SW Rozalia and SW Bata in 2024.
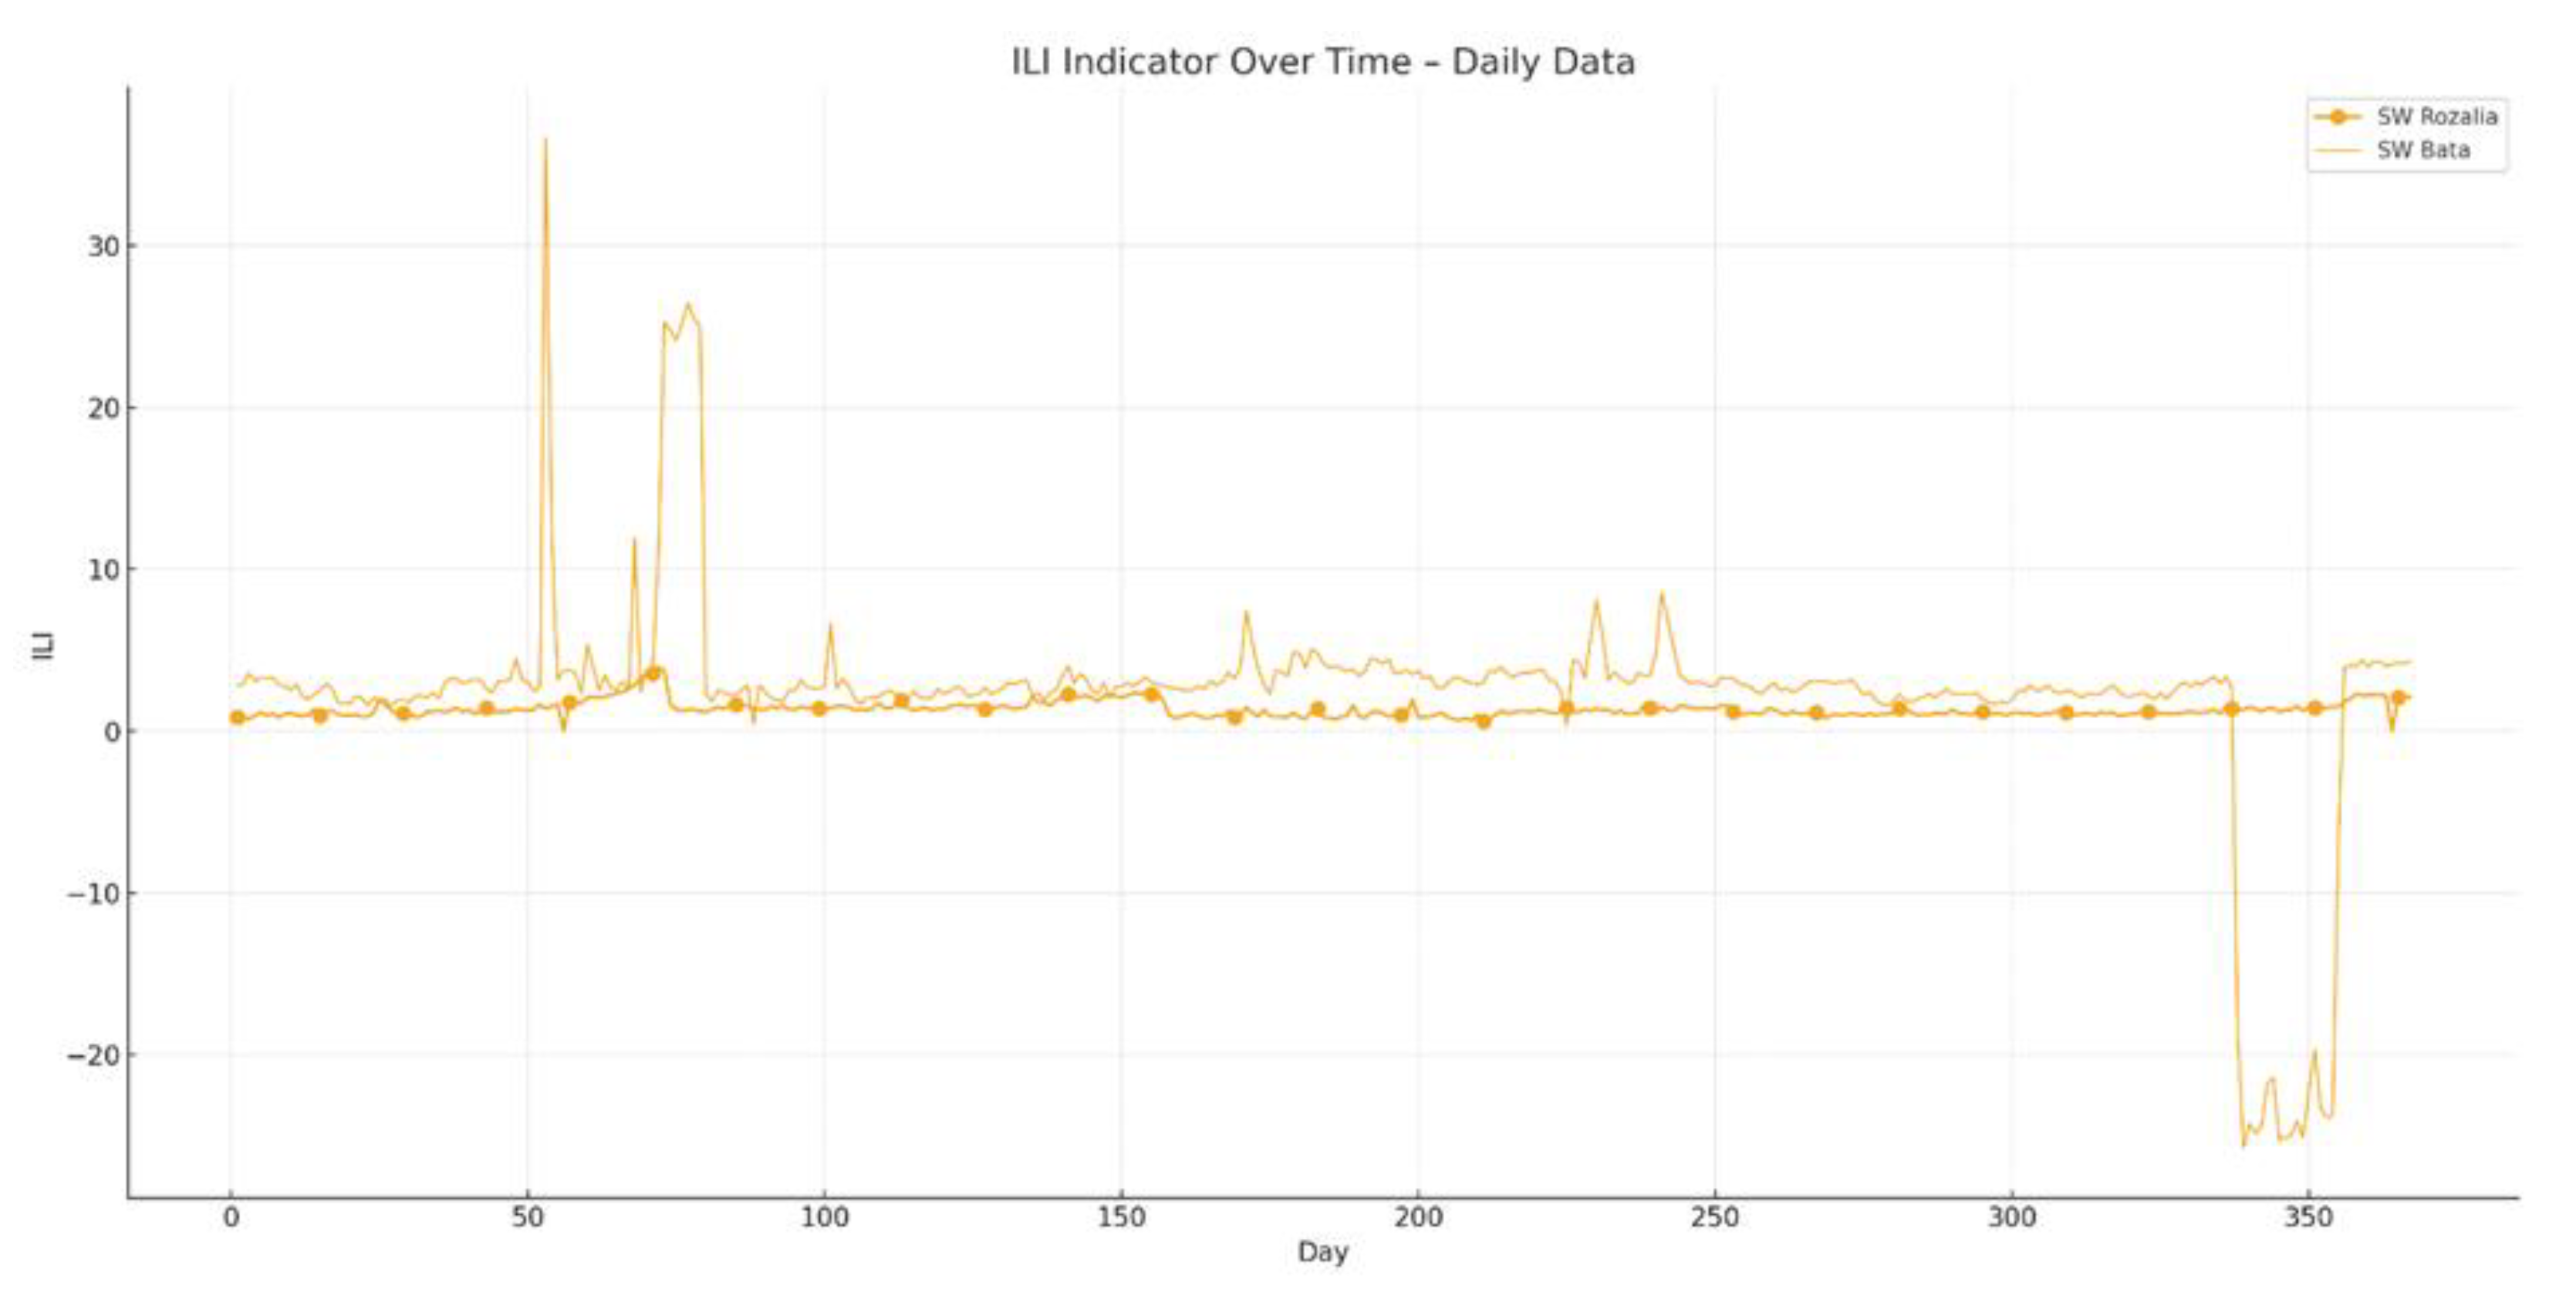
Figure 3.
Weekly values of the ILI indicator for SW Rozalia and SW Bata in 2024.
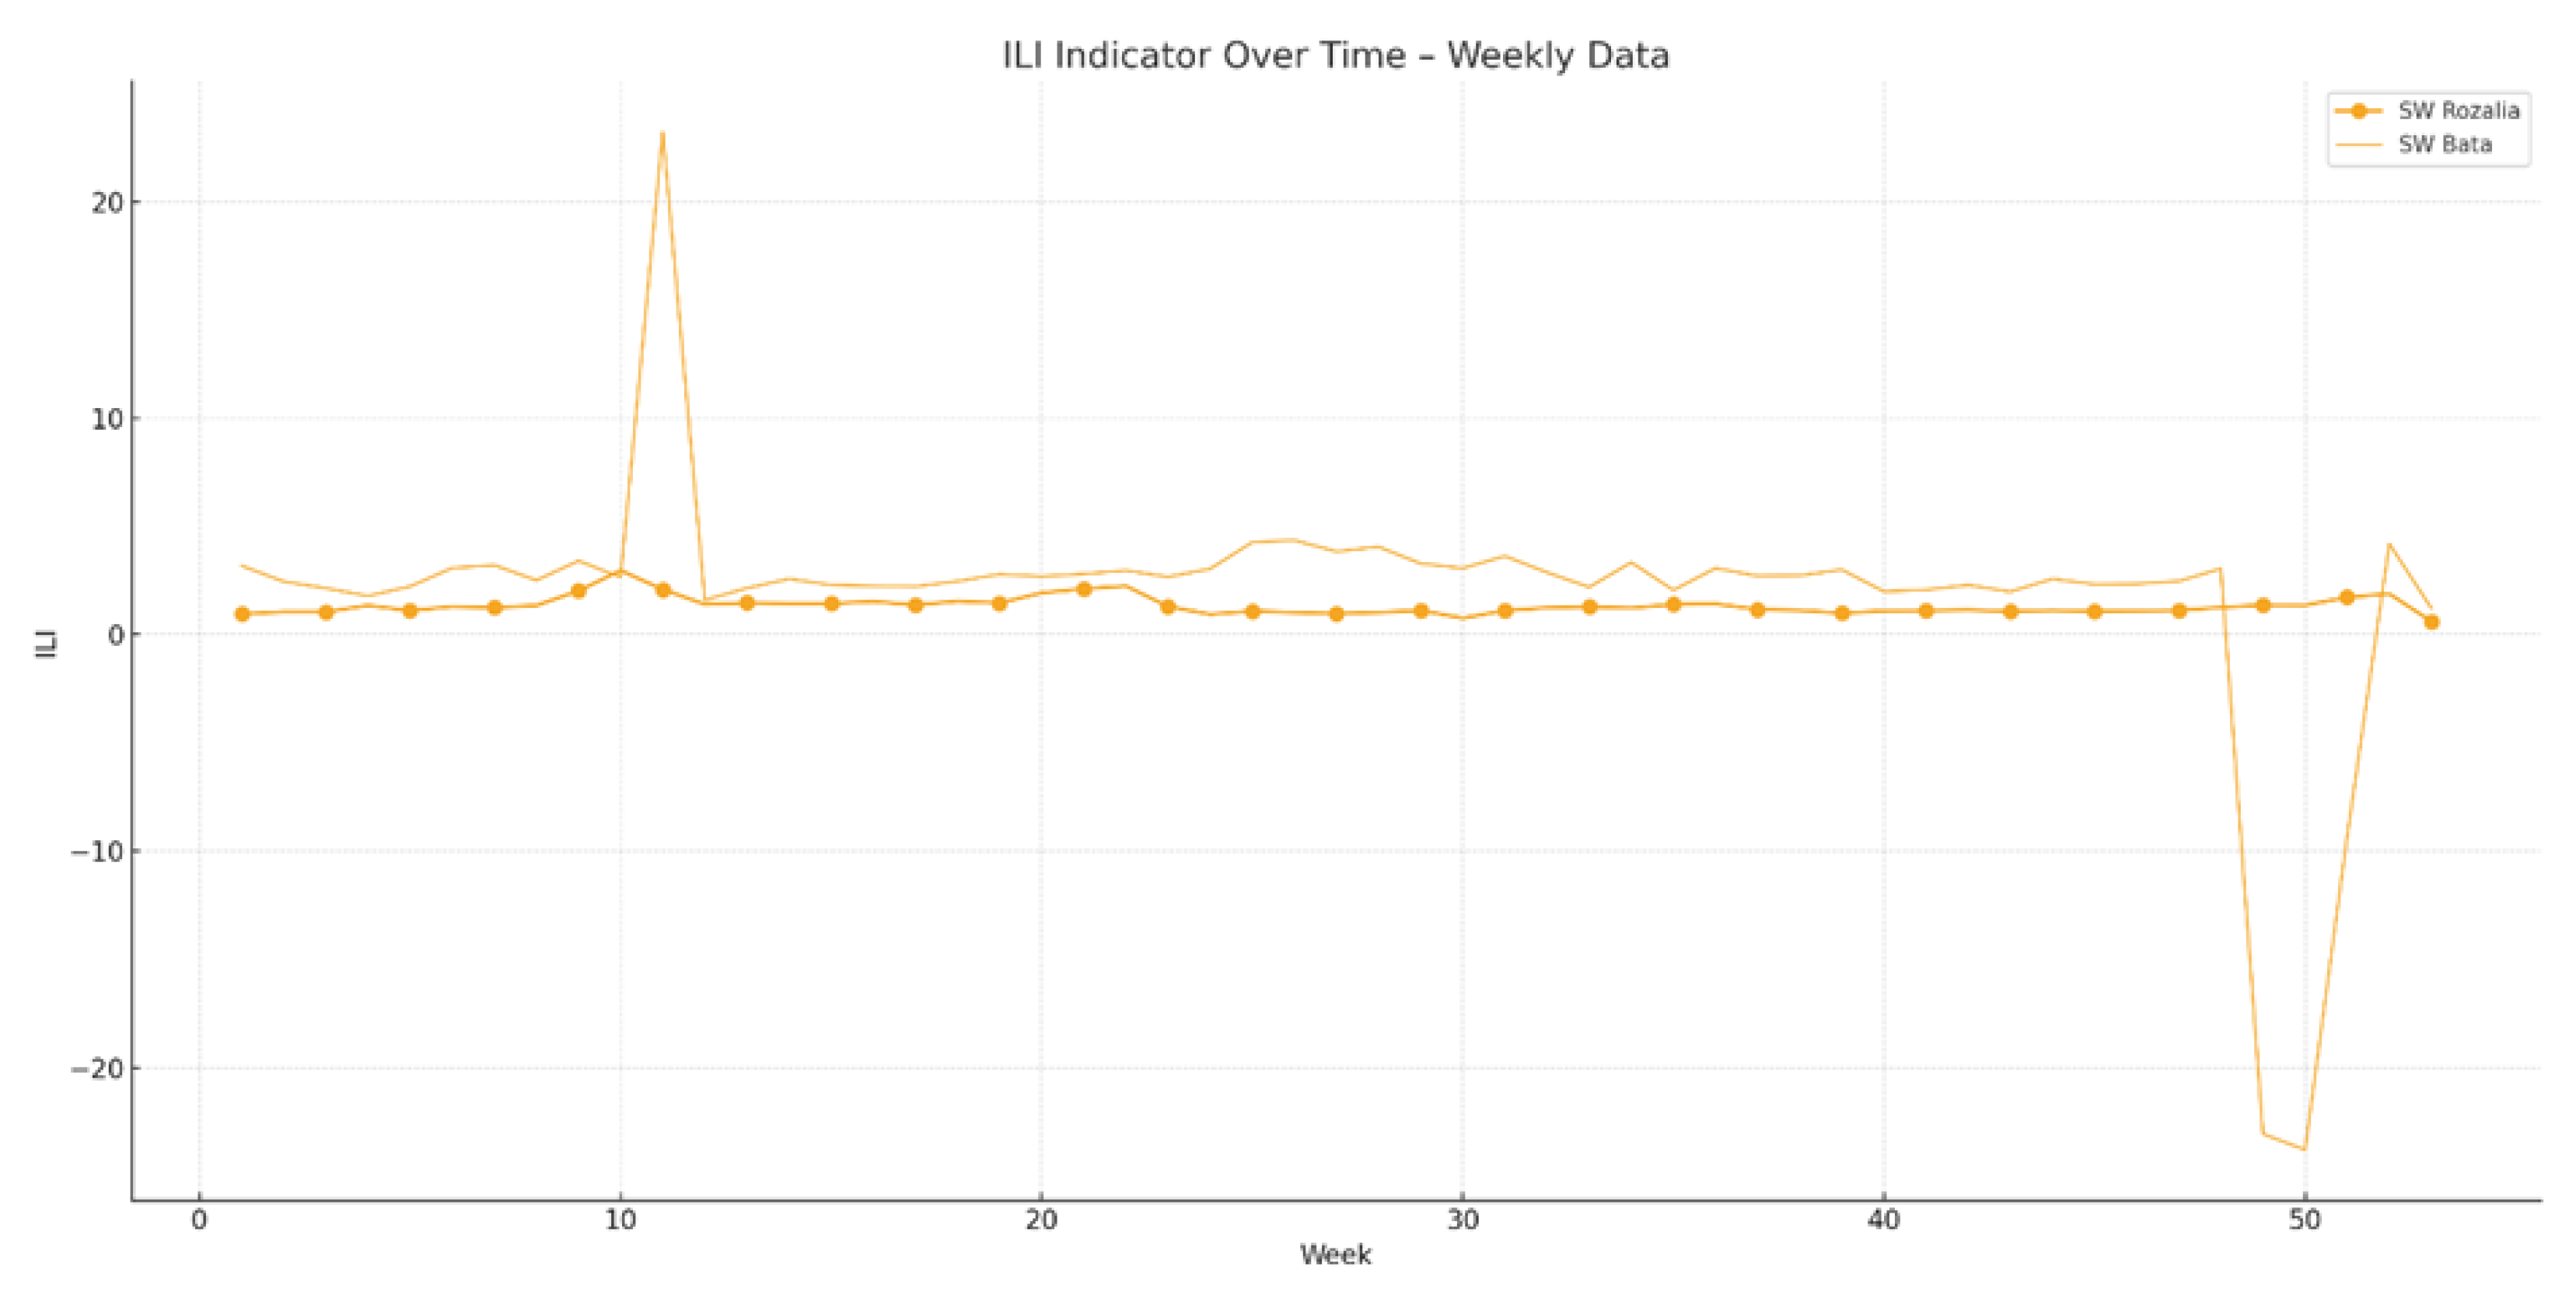
Figure 4.
Monthly values of the ILI indicator for SW Rozalia and SW Bata in 2024.
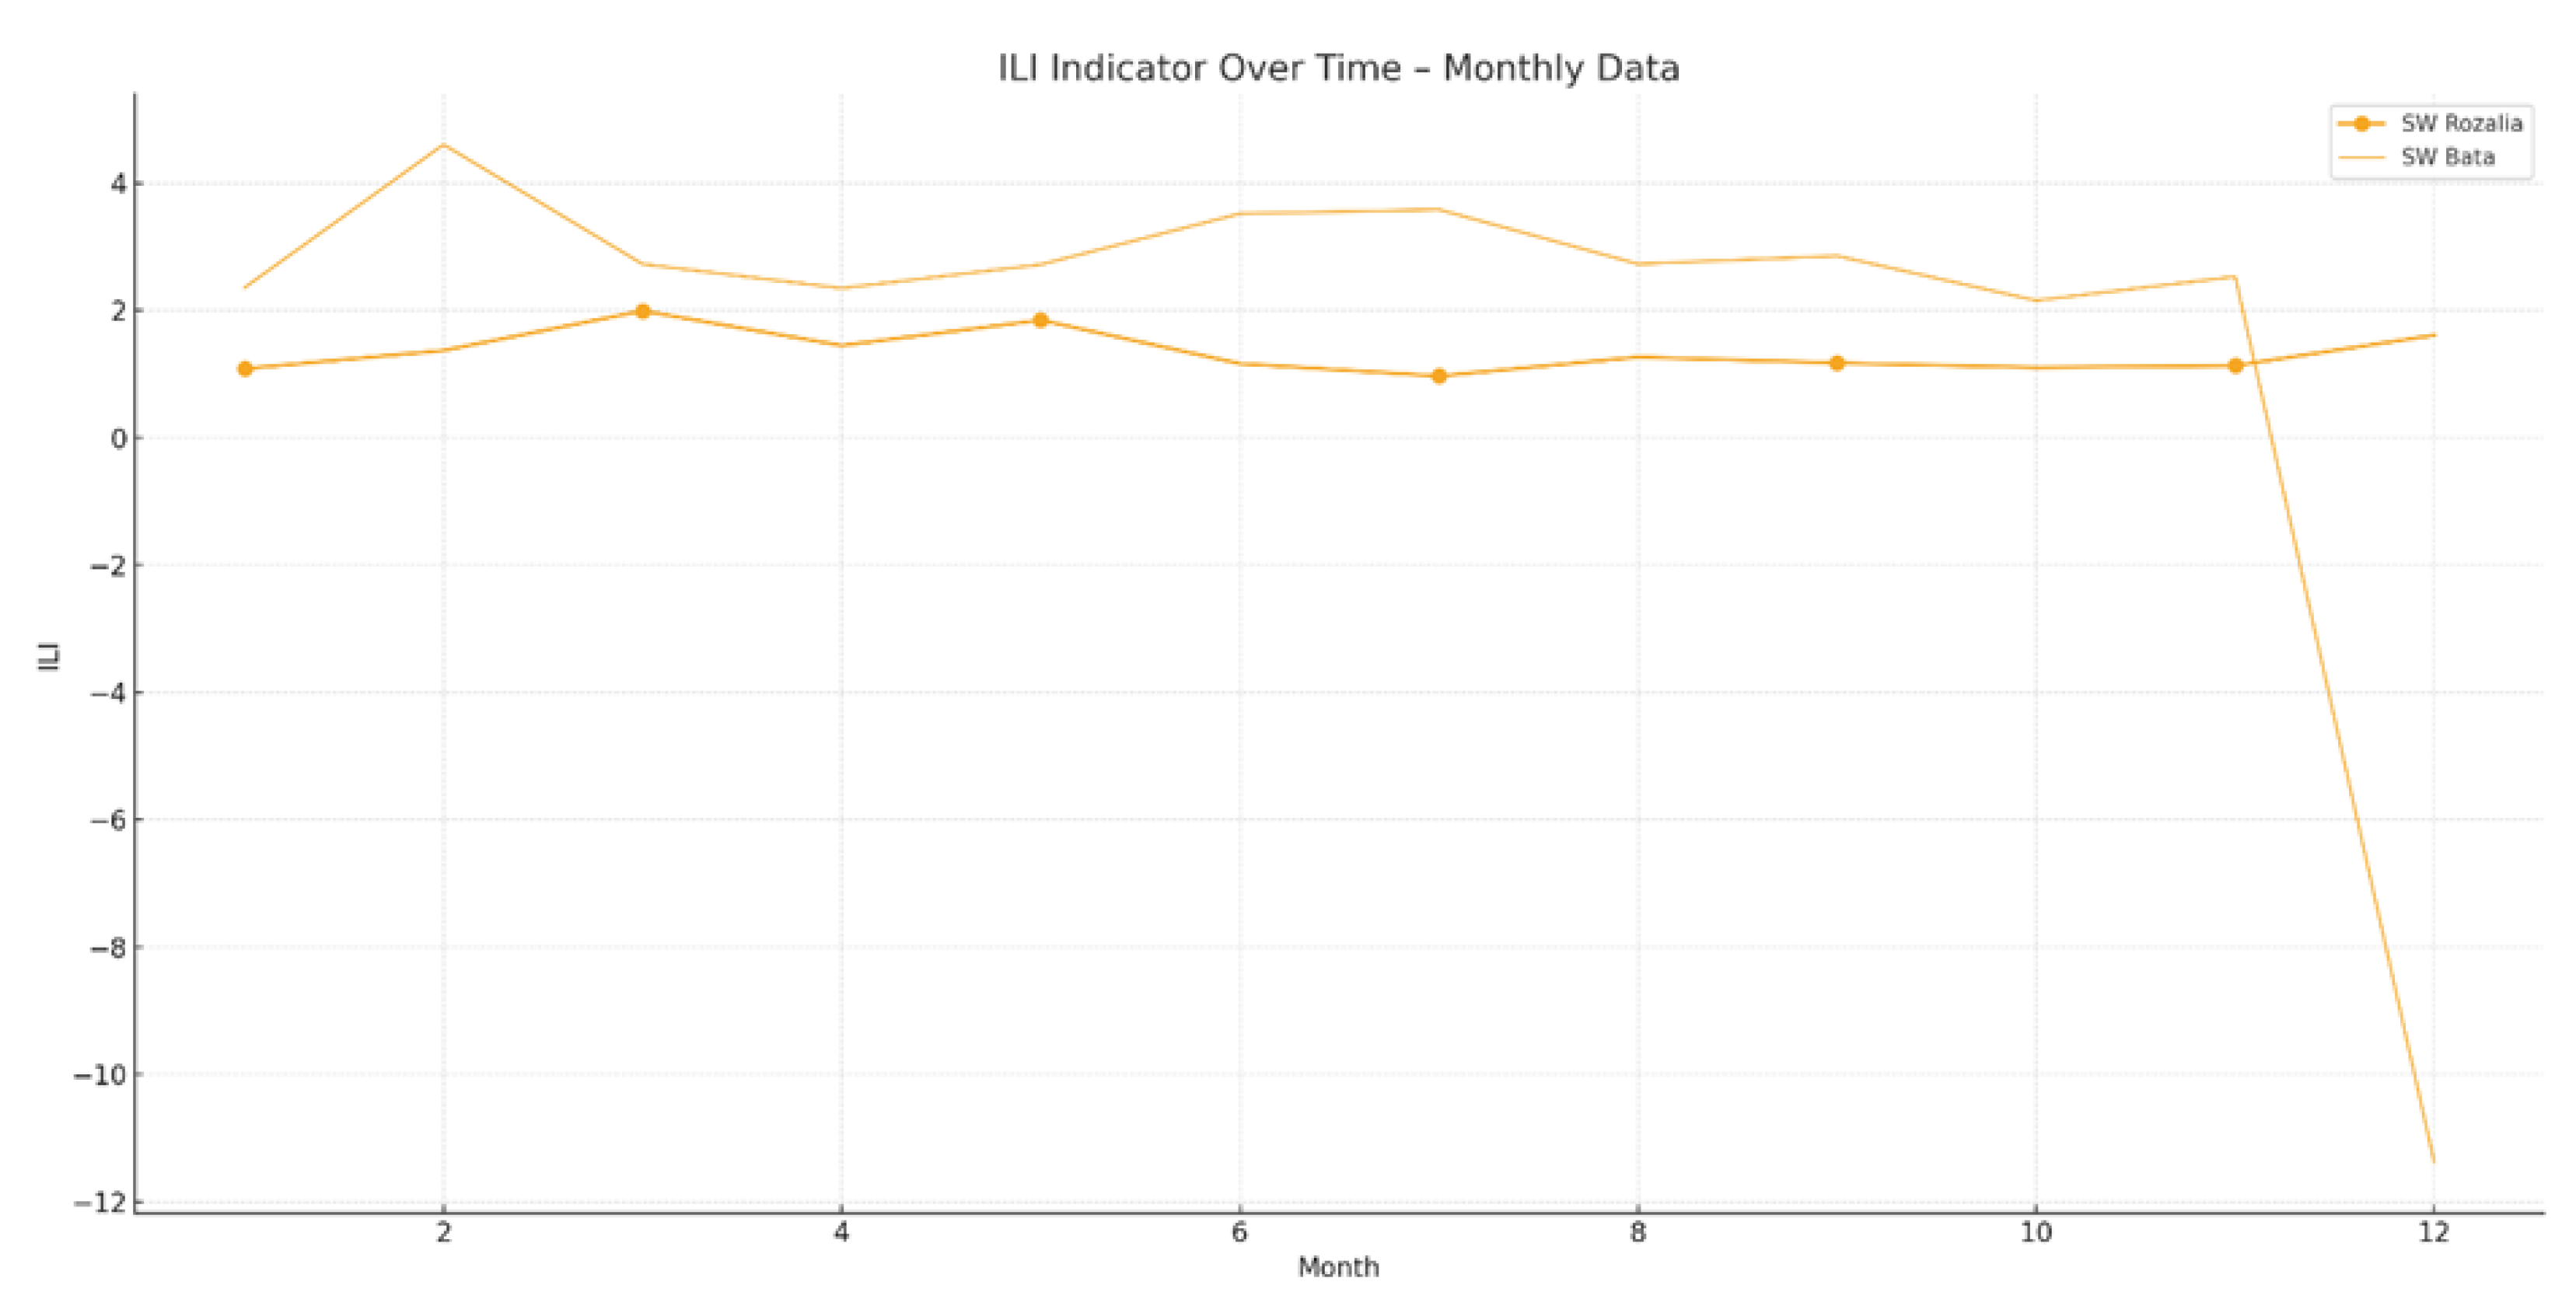
Figure 5.
Histograms and boxplots for SW Rozalia.
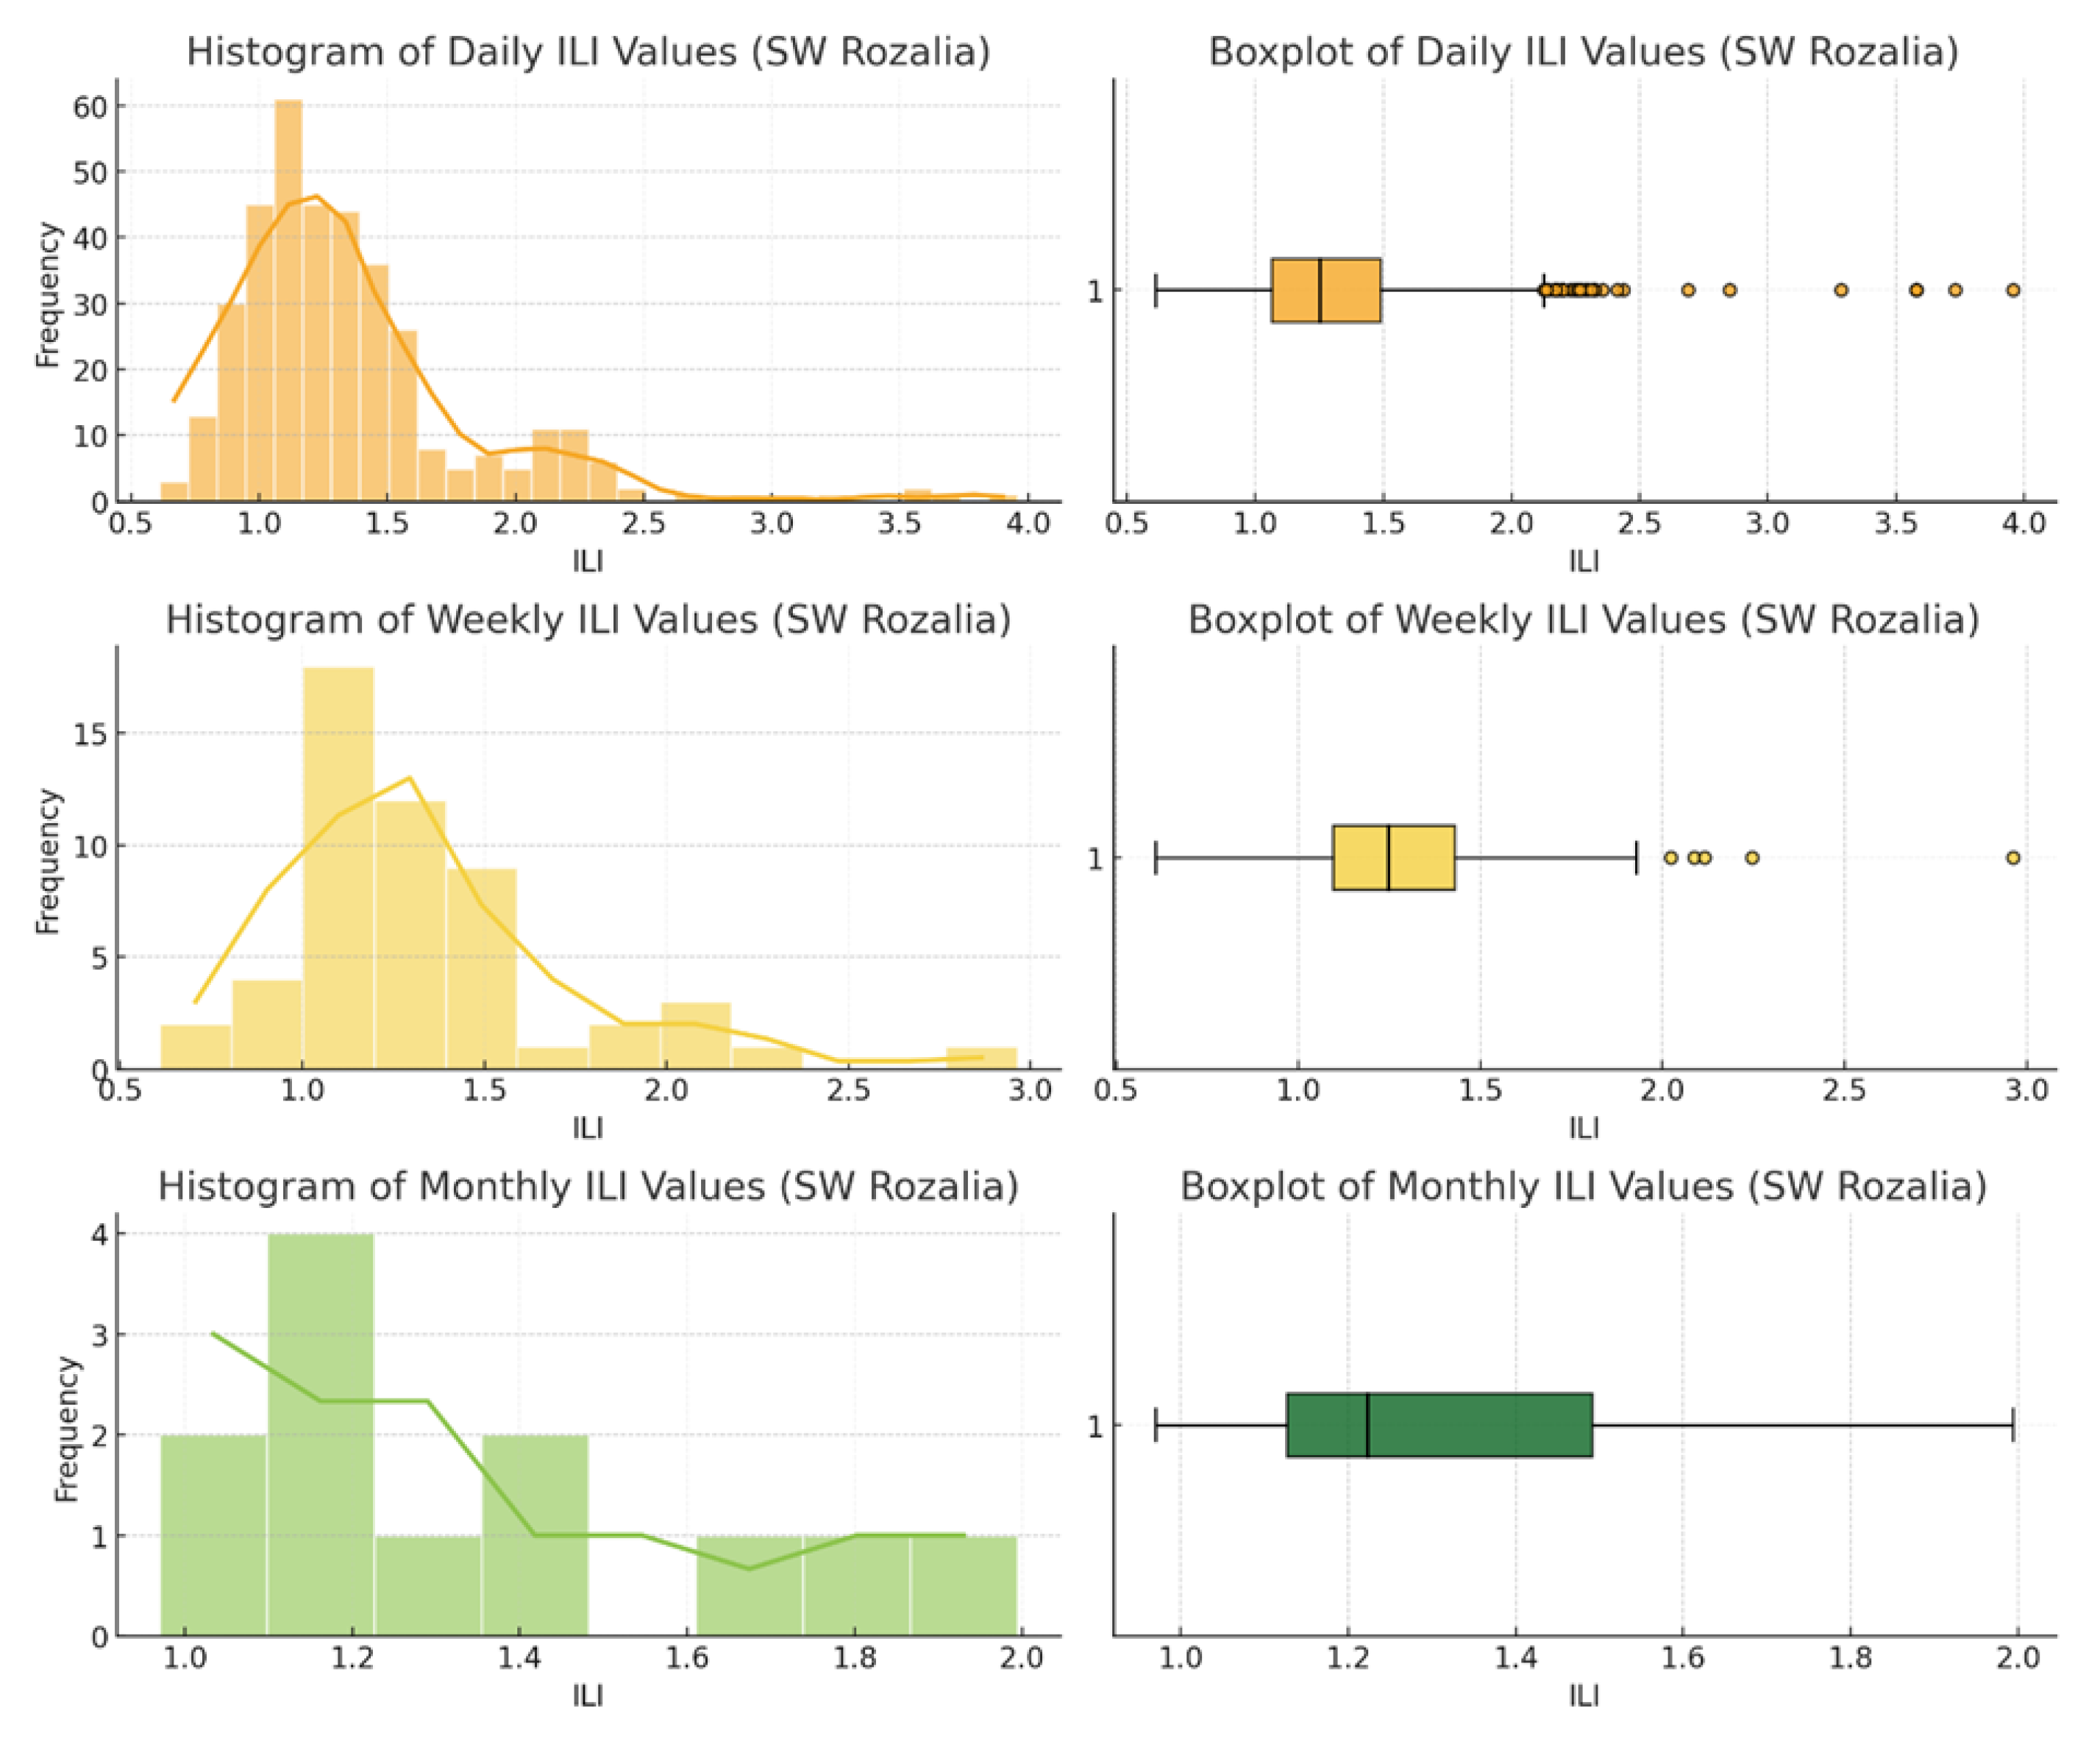
Figure 6.
Histograms and boxplots for SW Bata.
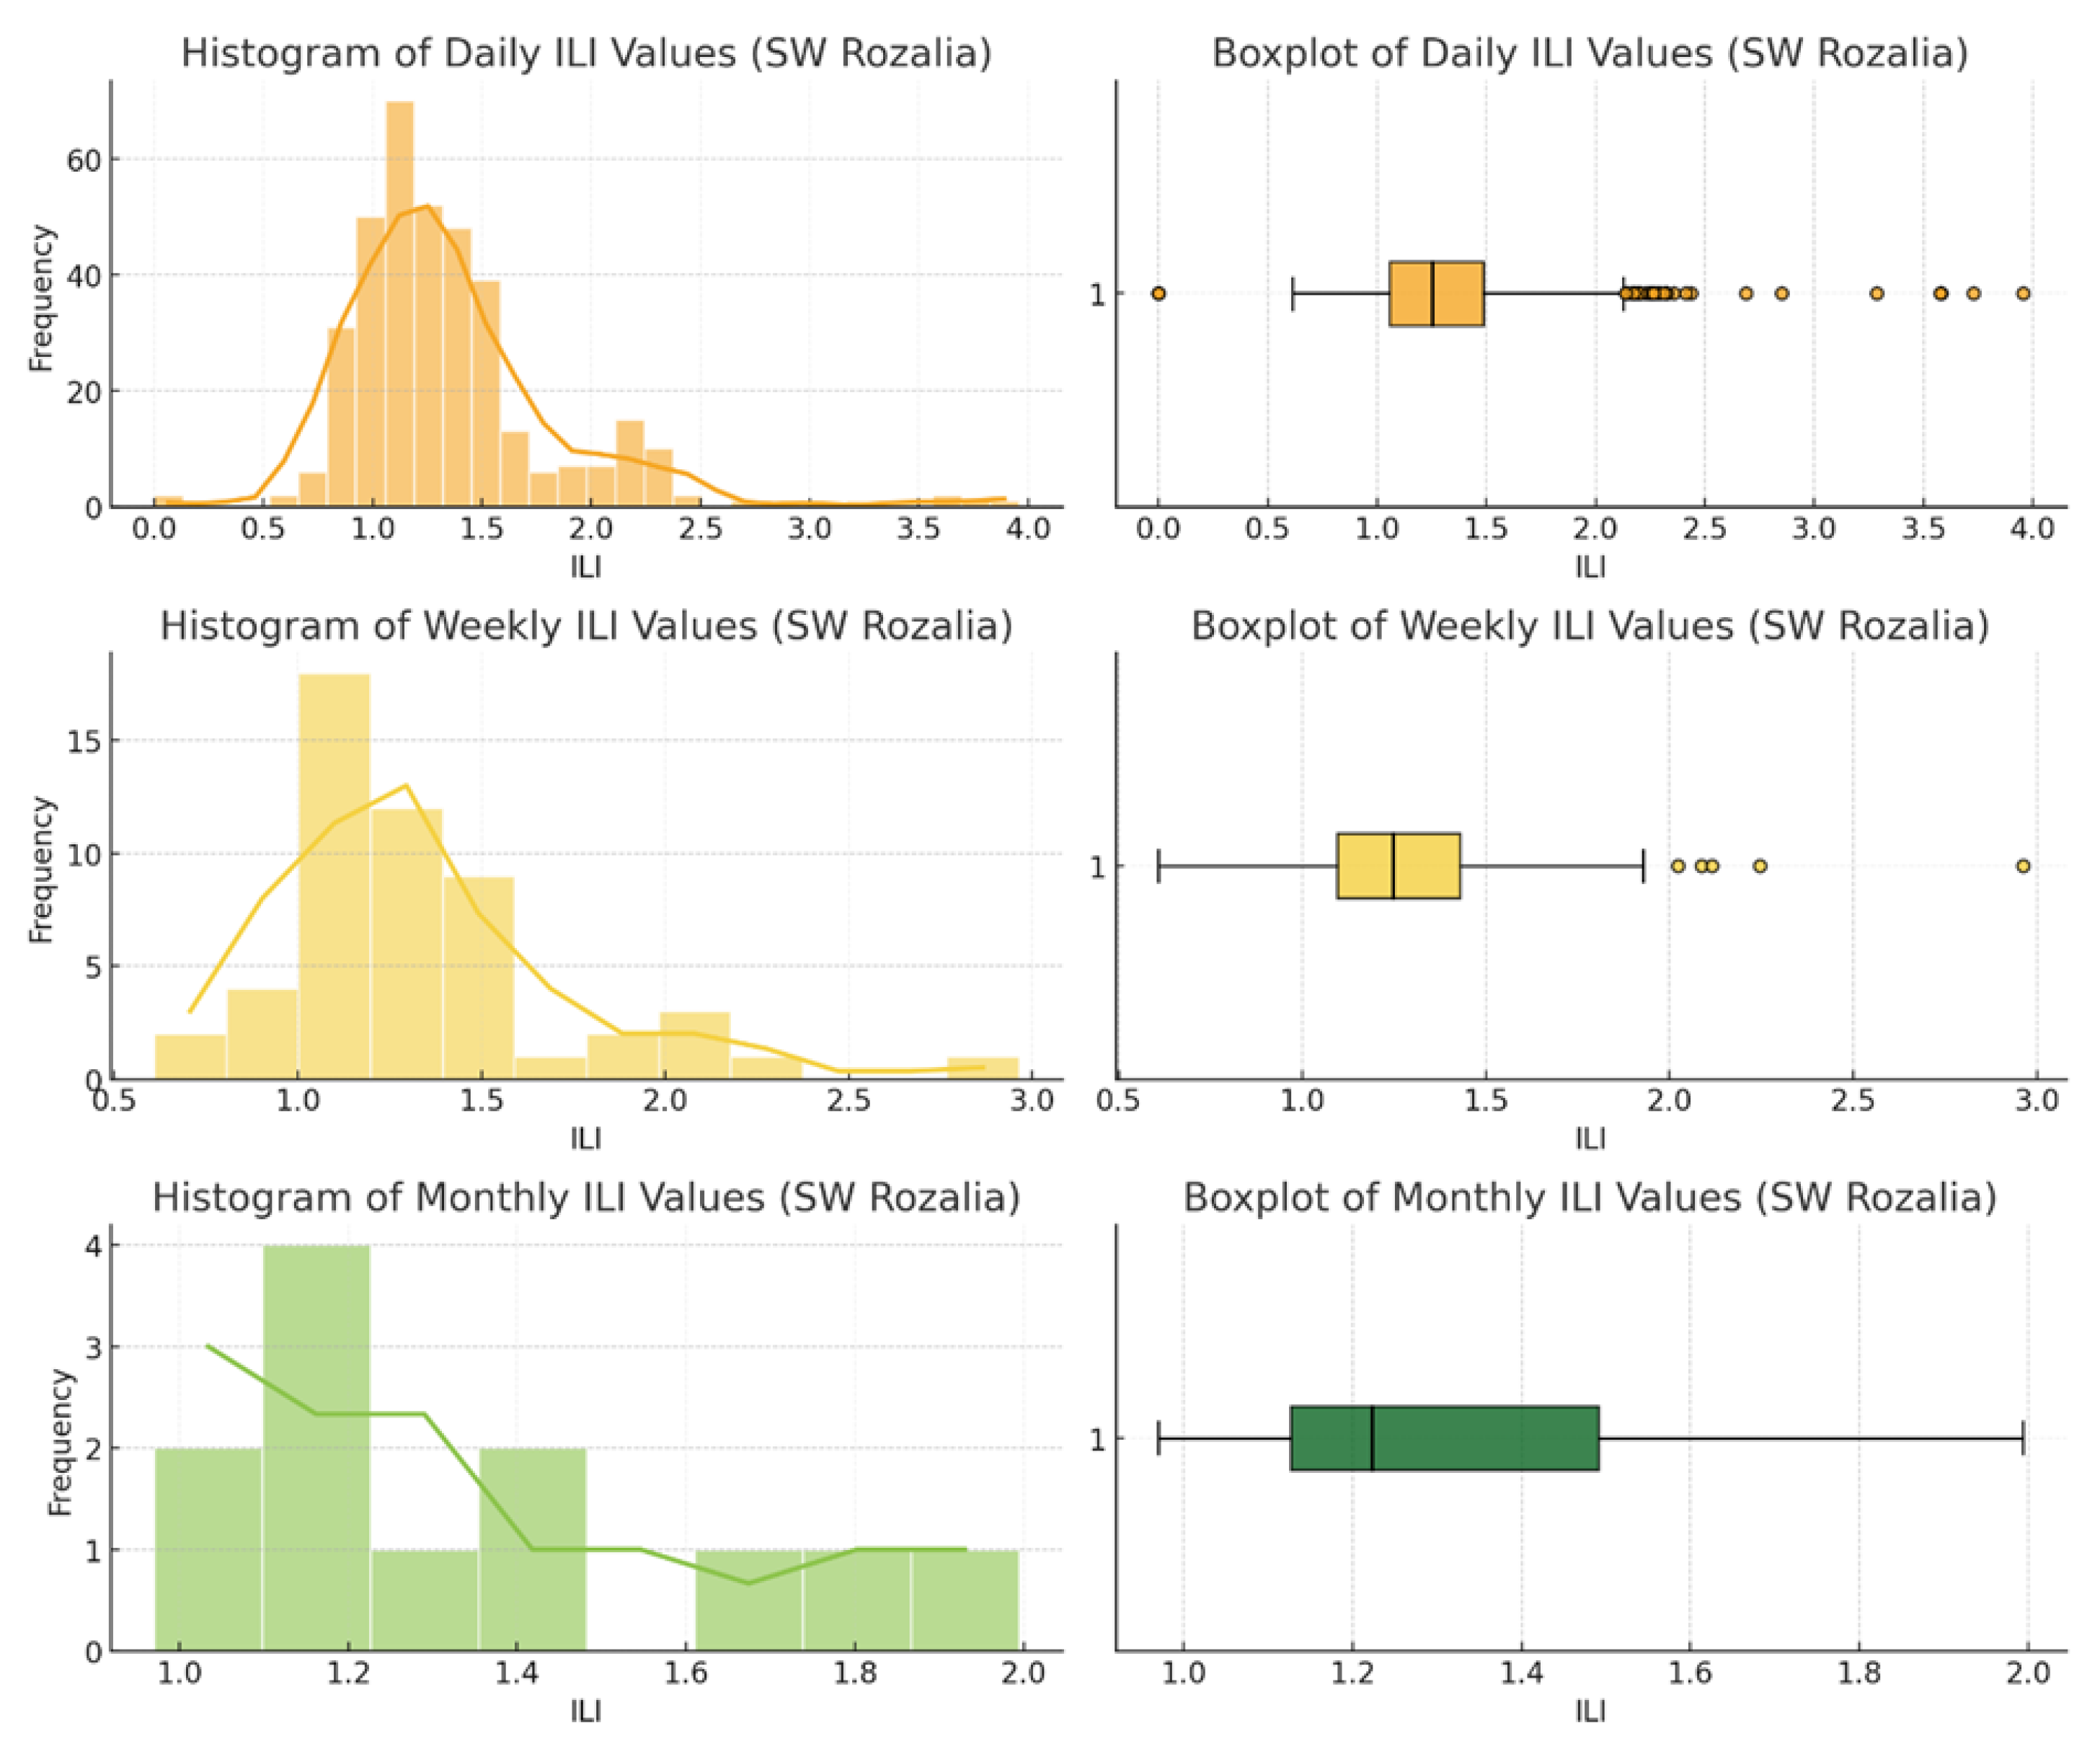
Figure 7.
ILI Indicator – Daily Comparison: SW Rozalia vs SW Bata.
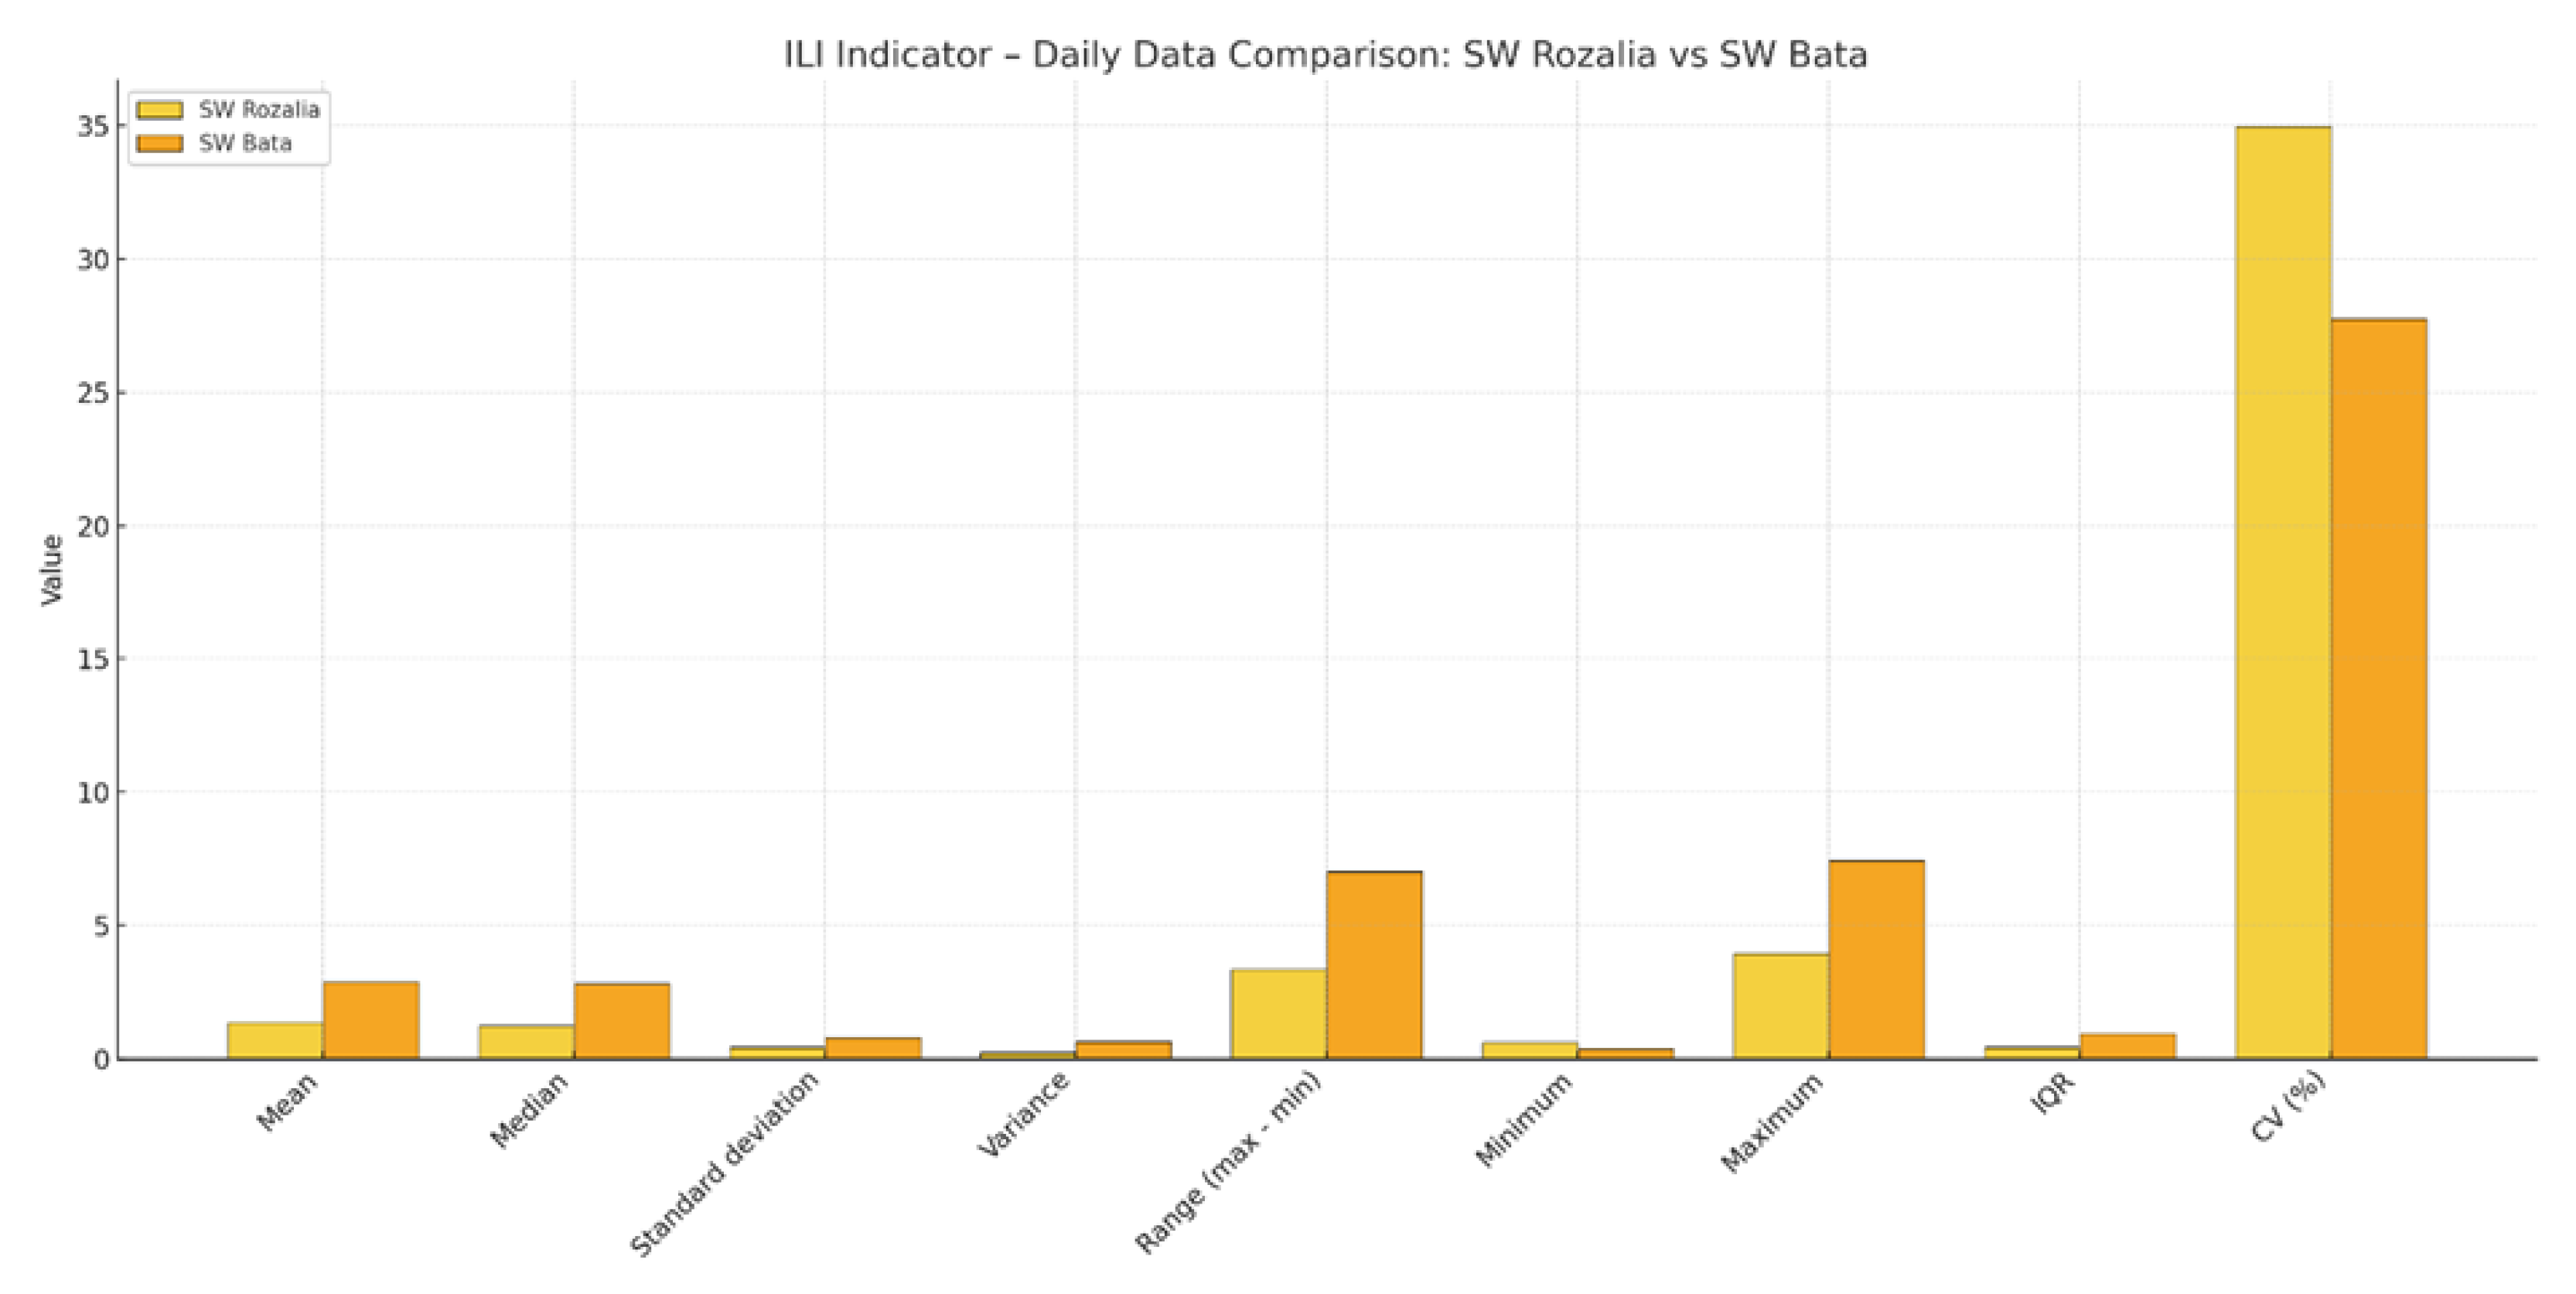
Figure 8.
ILI Indicator – Weekly Comparison: SW Rozalia vs SW Bata.
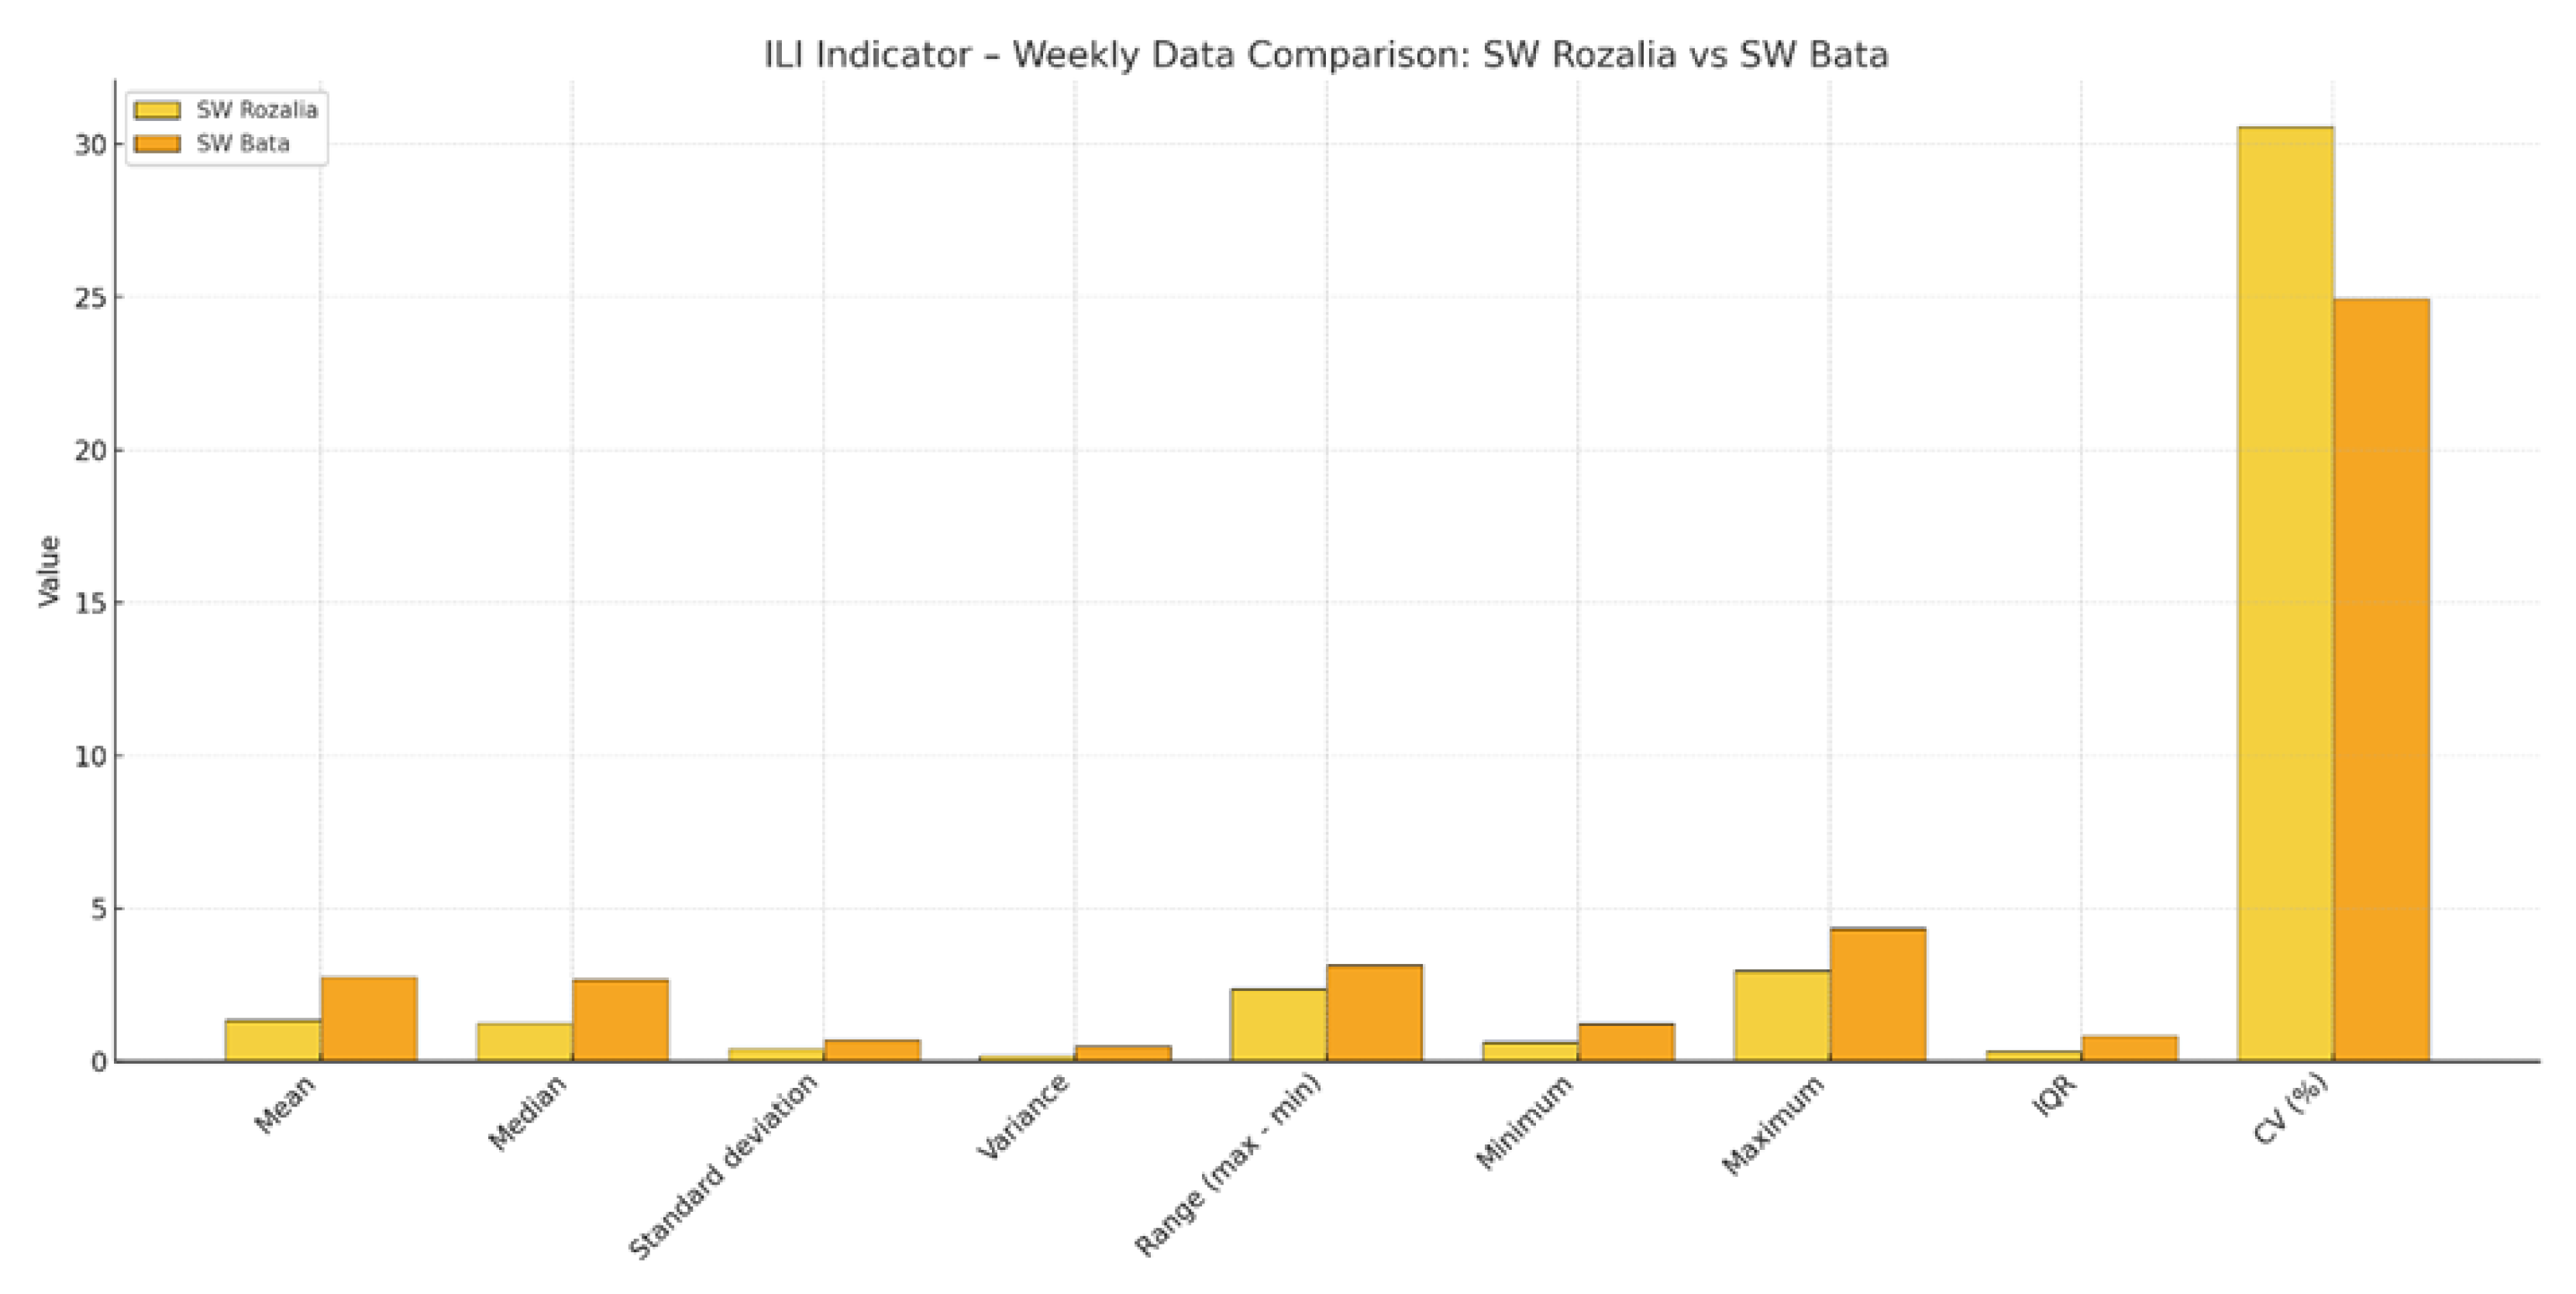
Figure 9.
ILI Indicator – Monthly Comparison: SW Rozalia vs SW Bata.
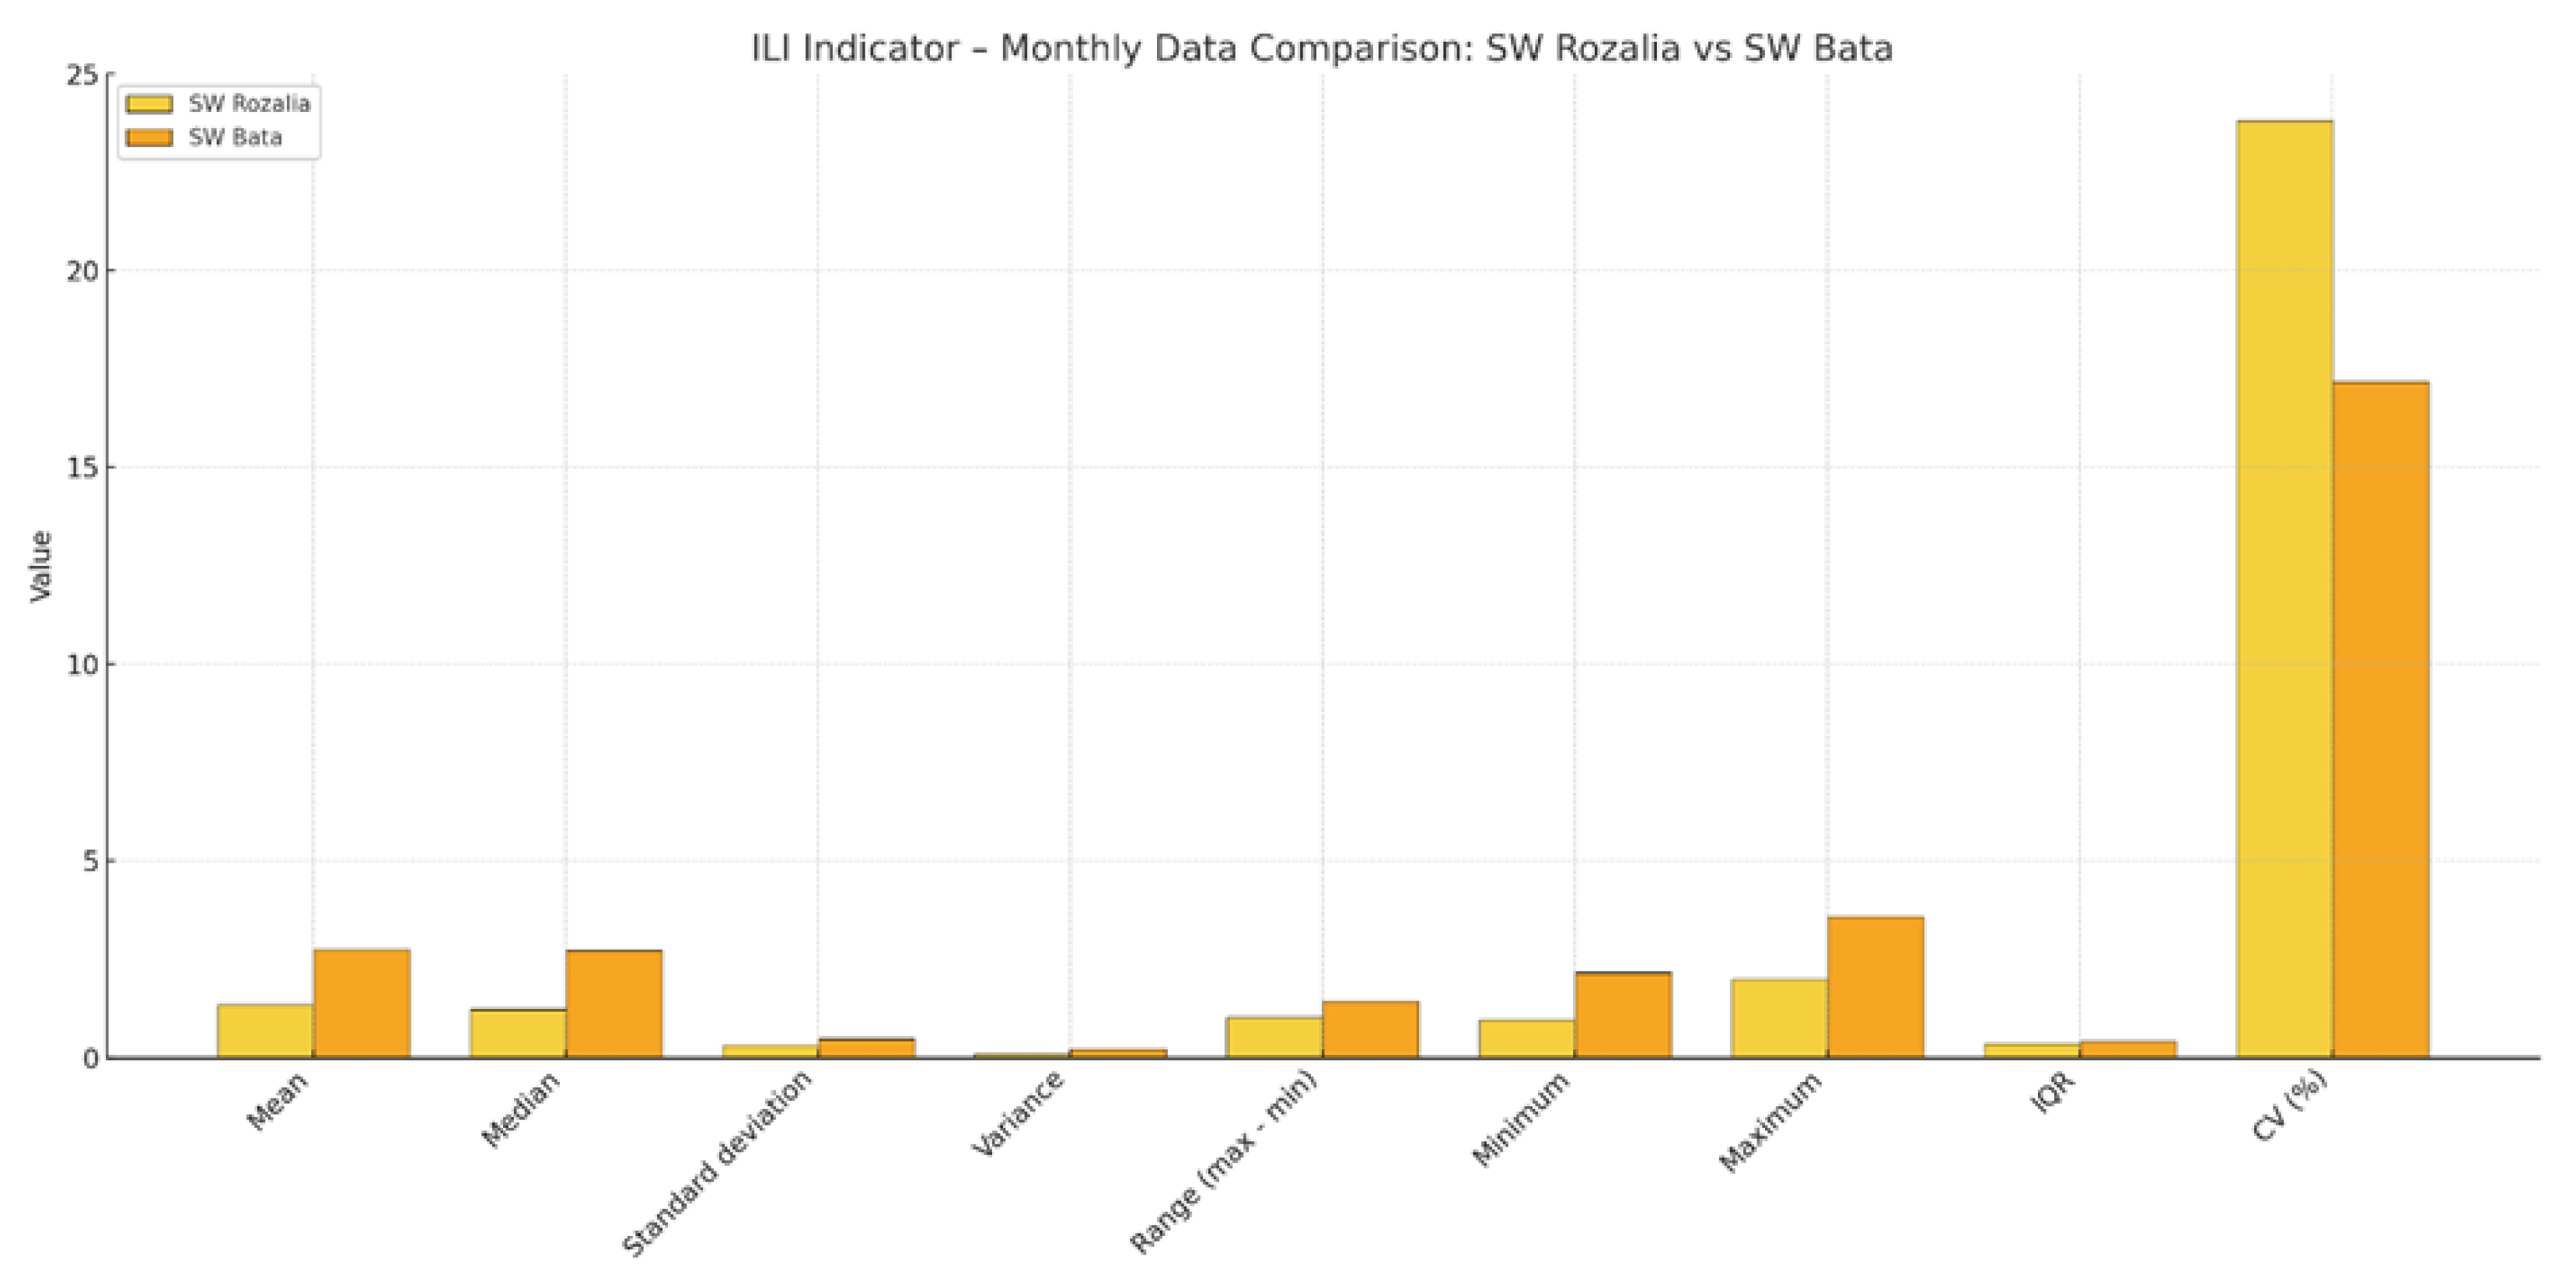
Figure 10.
Hourly components of the water balance in SW Bata in 2024.
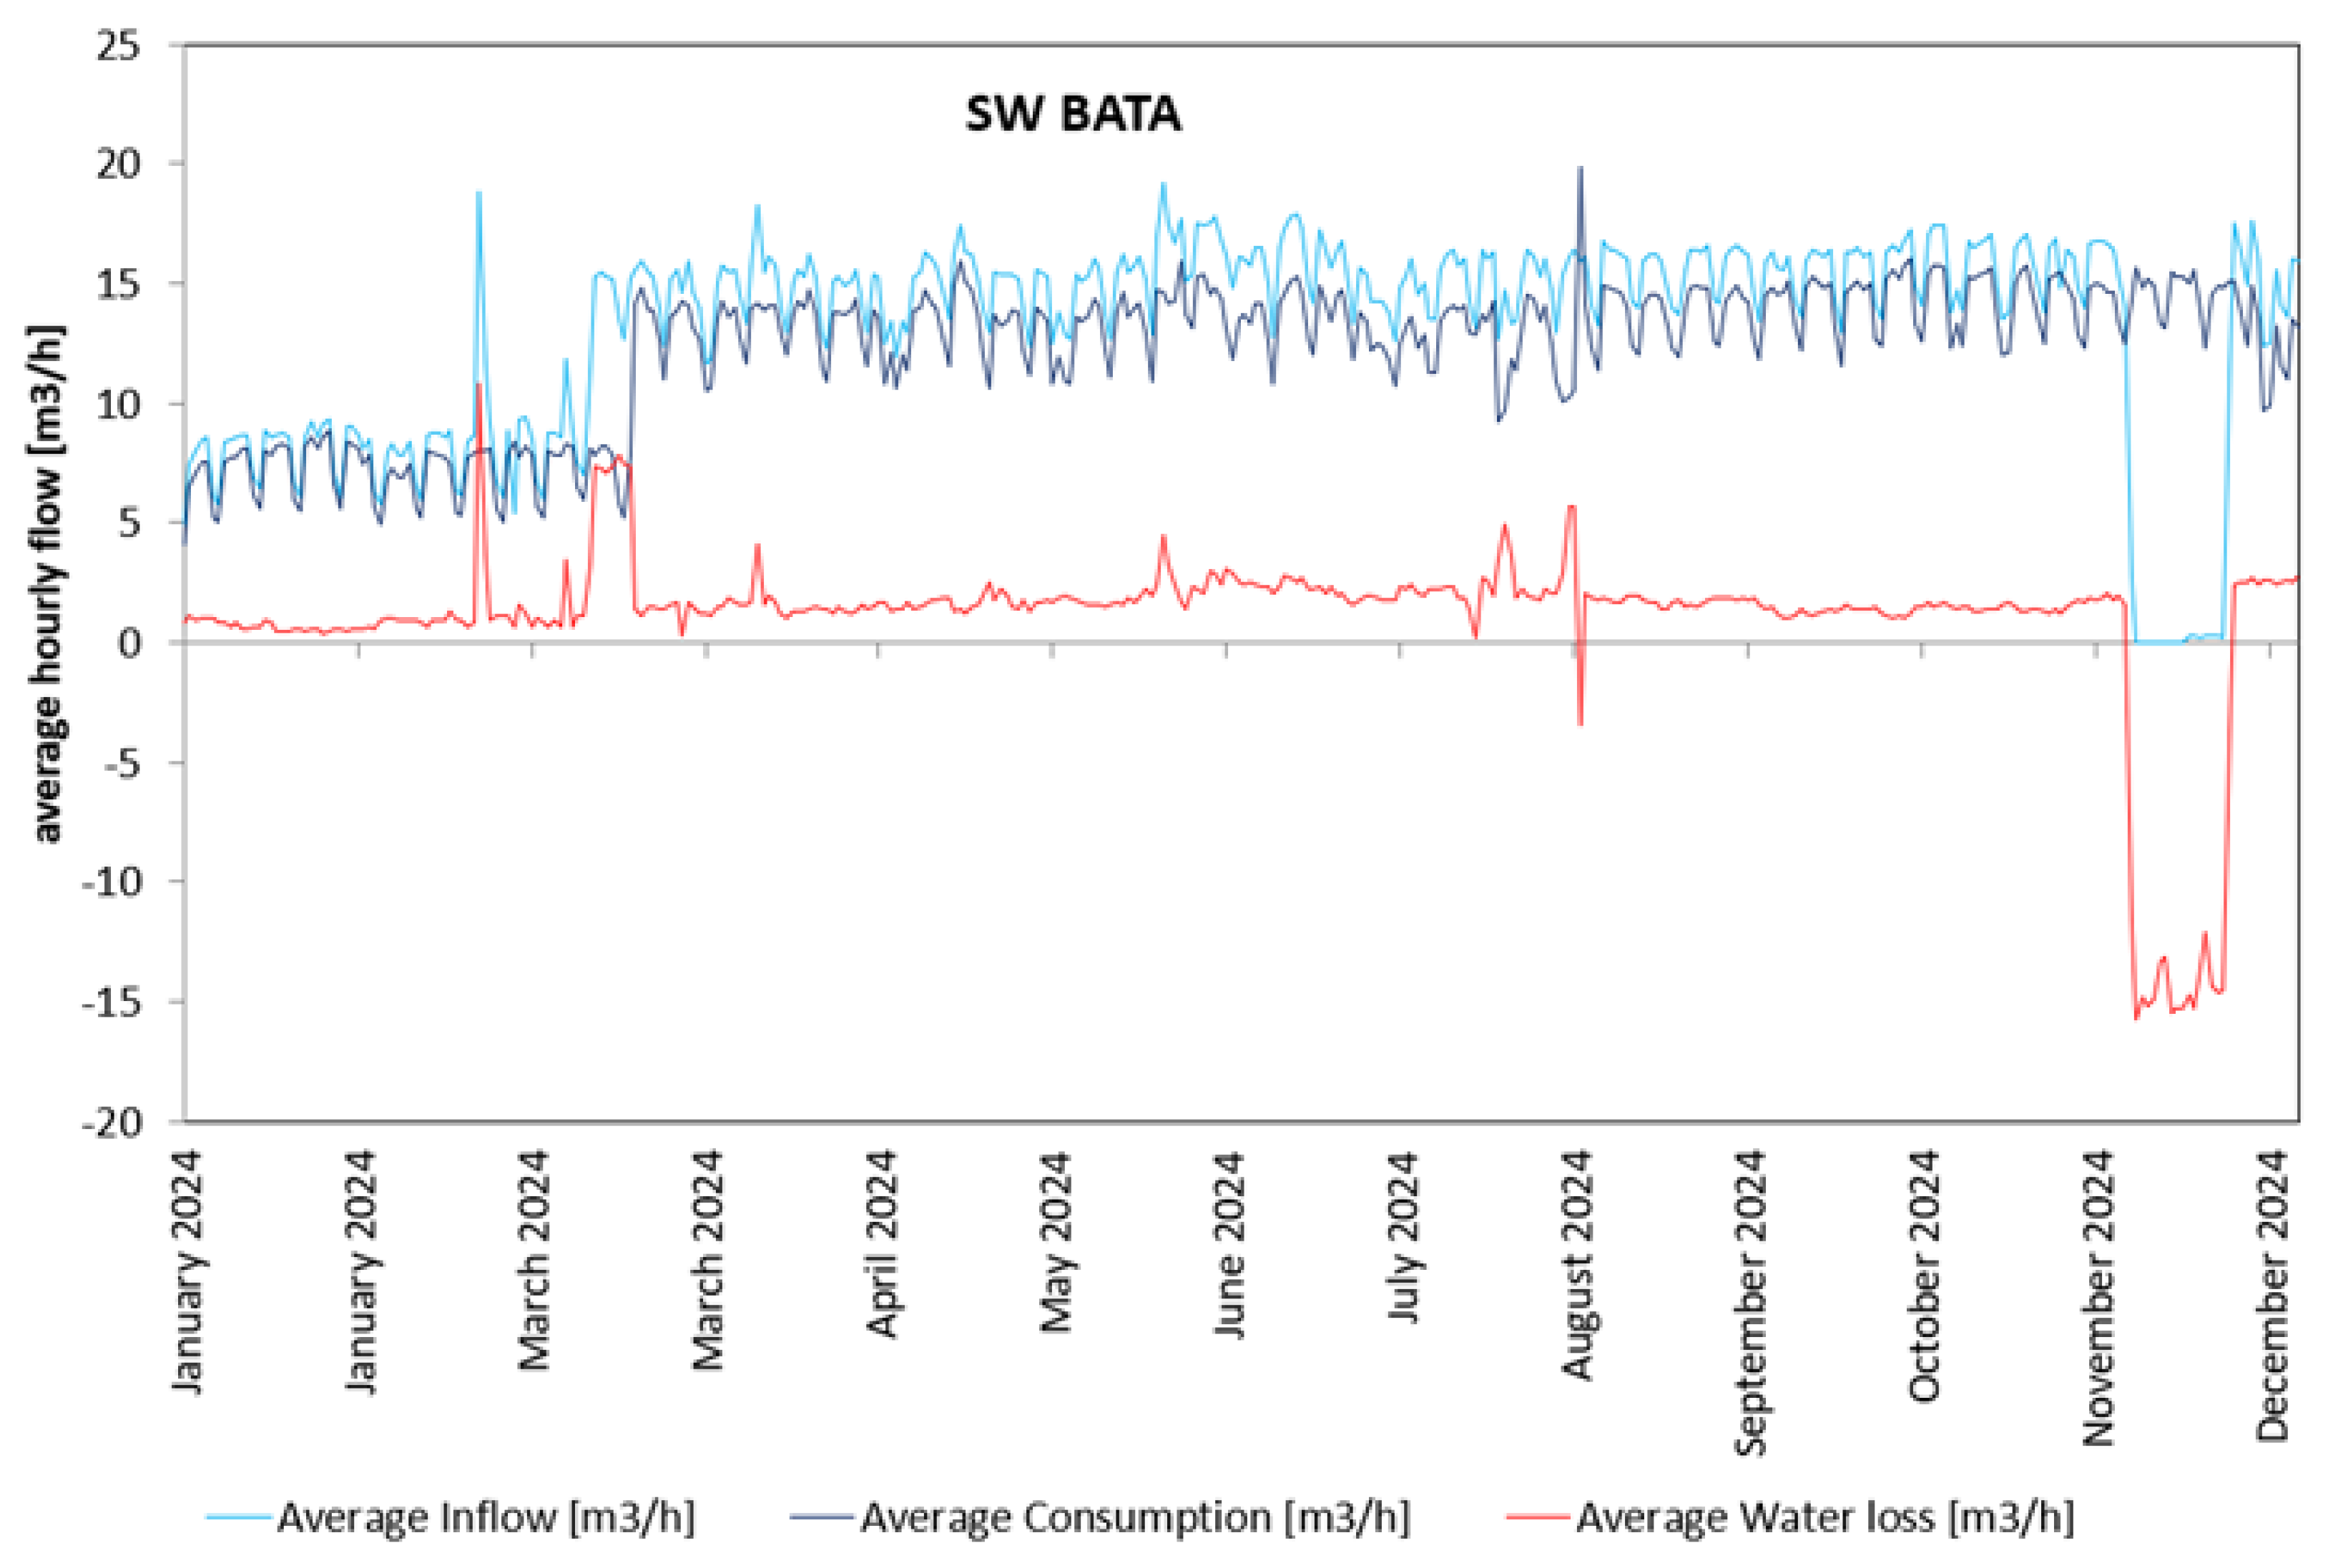
Figure 11.
Hourly components of the water balance in SW Rozalia in 2024.
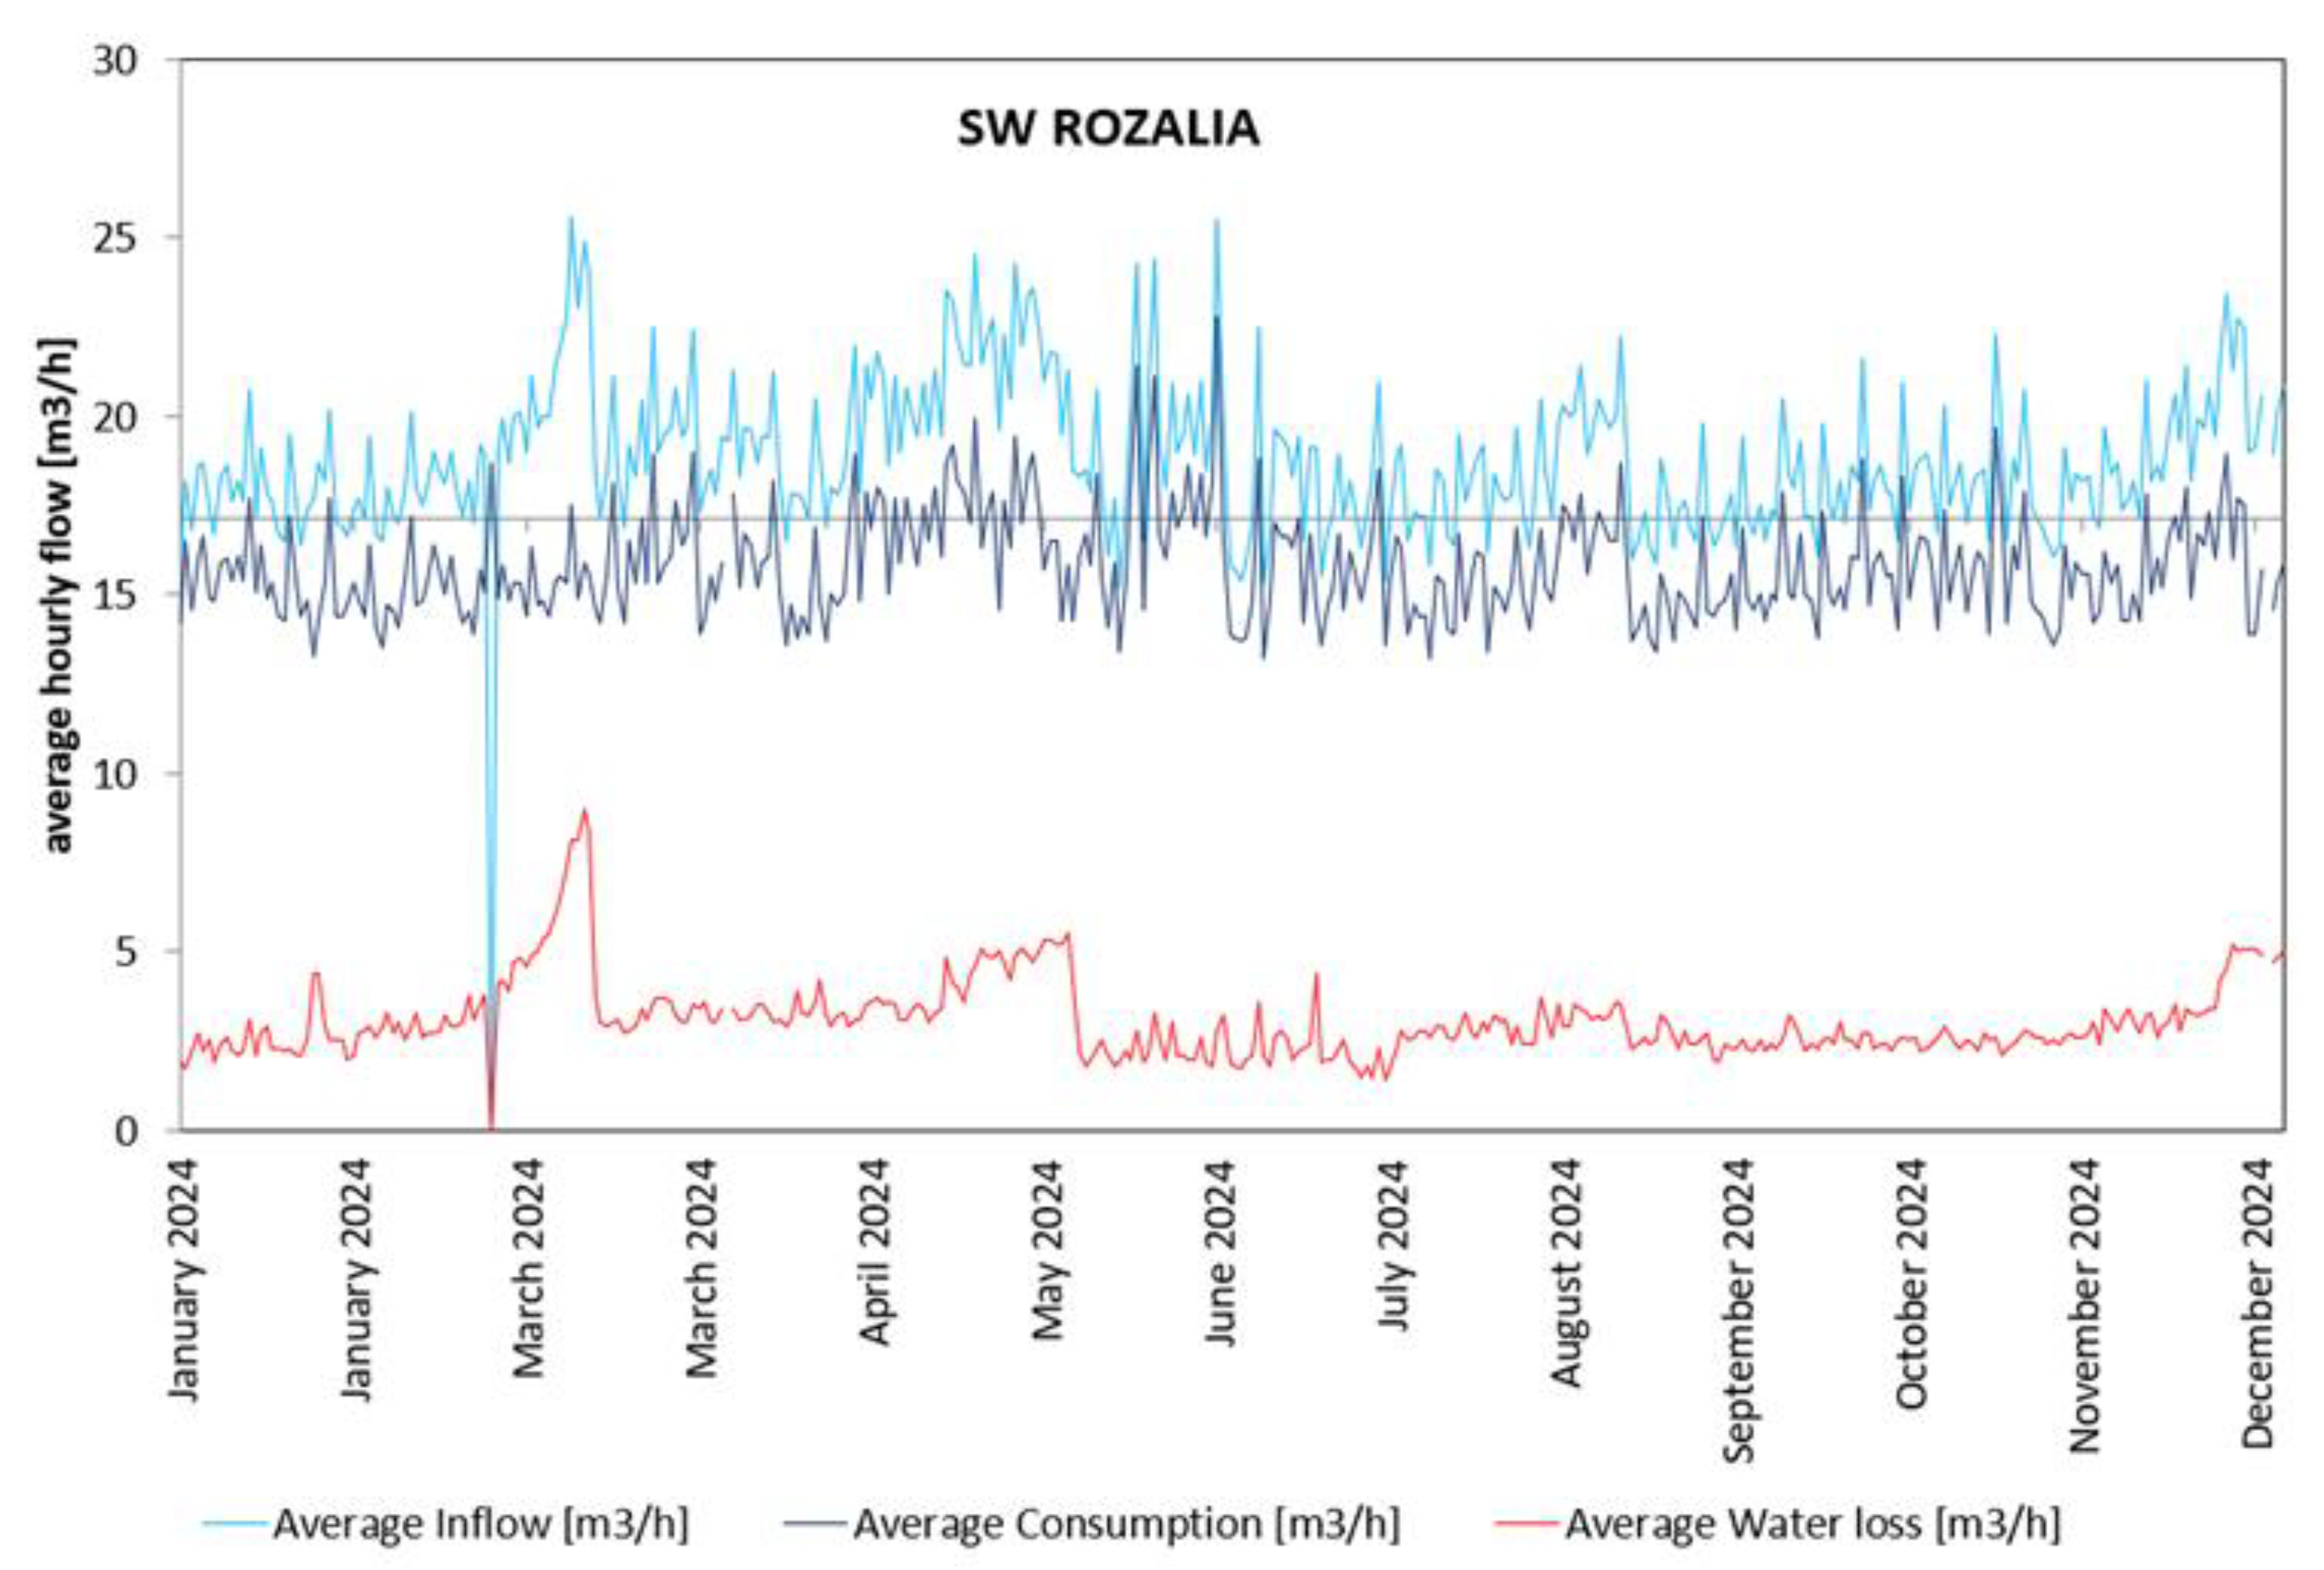

Table 1.
Summary of parameters characterizing the studied zones in 2024.
| Parameter | SW Rozalia | SW Bata |
|---|---|---|
| Customer characteristics | mainly single-family housing, low-rise multi-family buildings (up to 4 floors), school, kindergarten, clinics, small services | hospital, public offices, commerce, education, sports fields (and irrigation), multi-family buildings (up to 4 floors) |
| Number of water customers (main meters) | 1208 | 357 |
| Length of water distribution network (km) | 25 | 4.4 |
| Length of water connections (km) | 12.1 | 2.1 |
| Number of water connections | 1012 | 109 |
| Average pressure (mH2O) | 36.0 | 36.6 before March 7, 2024 and 40.0 after |
| Reading effectiveness of customer meters in 2024 (%) | 92.2% | 87.63% |
| Number of customers with no meter data in 2024 | 21 | 1 |
| SCF Factor | 0.56 but 0.88 was adopted for further calculations* | 0.55 but 0.88 was adopted for further calculations* |
| ILI (2024) | 1.35 | 2.75 |
* In the analyses, SCF = 0.88 was adopted as a value close to the lower limit of the UARL correction range for small DMAs with low pressure. Lower values (e.g., 0.55 and 0.56 obtained from calculations) were not applied in order to avoid overcorrection beyond the calibration range of the formula and to maintain comparability of the ILI indicator. https://www.leakssuitelibrary.com/.
Table 2.
Variability Parameters of the Infrastructure Leakage Index (ILI) for SW Rozalia and SW Bata in 2024.
Table 2.
Variability Parameters of the Infrastructure Leakage Index (ILI) for SW Rozalia and SW Bata in 2024.
| SW Rozalia | SW Bata | |||||
| ILI daily | ILI weekly | ILI monthly | ILI daily | ILI weekly | ILI monthly | |
| Mean | 1.36 | 1.33 | 1.35 | 2.88 | 2.74 | 2.75 |
| Median | 1.25 | 1.25 | 1.22 | 2.81 | 2.67 | 2.73 |
| Standard deviation | 0.43 | 0.41 | 0.32 | 0.80 | 0.68 | 0.47 |
| Variance | 0.23 | 0.17 | 0.10 | 0.64 | 0.47 | 0.22 |
| Range (max − min) | 3.35 | 2.36 | 1.02 | 7.01 | 3.14 | 1.43 |
| Minimum | 0.61 | 0.61 | 0.97 | 0.36 | 1.21 | 2.16 |
| Maximum | 3.96 | 2.96 | 1.99 | 7.43 | 4.35 | 3.59 |
| IQR | 0.43 | 0.33 | 0.36 | 0.95 | 0.82 | 0.42 |
| CV (%) | 34.97 | 30.57 | 23.81 | 27.76 | 24.95 | 17.19 |
Disclaimer/Publisher’s Note: The statements, opinions and data contained in all publications are solely those of the individual author(s) and contributor(s) and not of MDPI and/or the editor(s). MDPI and/or the editor(s) disclaim responsibility for any injury to people or property resulting from any ideas, methods, instructions or products referred to in the content. |
© 2025 by the authors. Licensee MDPI, Basel, Switzerland. This article is an open access article distributed under the terms and conditions of the Creative Commons Attribution (CC BY) license (http://creativecommons.org/licenses/by/4.0/).
Copyright: This open access article is published under a Creative Commons CC BY 4.0 license, which permit the free download, distribution, and reuse, provided that the author and preprint are cited in any reuse.


