Submitted:
05 November 2025
Posted:
07 November 2025
You are already at the latest version
Abstract
The CD74-ROS1 fusion protein is an aggressive oncogenic driver detected in non-small cell lung cancer (NSCLC) patients from stages I-IV. Despite the low occurrence, CD74-ROS1 has a notable clinical value serving as a therapeutic target when the primary treatment plan fails. Upon targeting the cancer cells with ROS1 tyrosine kinase inhibitors (TKIs), resistance occasionally emerges for reasons that are not well-understood. Therefore, analyzing the individual roles of CD74 and ROS1 in the CD74–ROS1 fusion may reveal mechanistic insights that would guide the scientific community to more effective therapies. Here, we describe the development and characterization of carefully engineered CD74-ROS1 variants that allow the analysis CD74 and ROS1 functional roles, at both the mRNA and protein levels. Differential gene expression analysis among the variants under study demonstrated unique gene profiles, which can be explained only by assigning specific functional contributions to each protein partner. In alignment with the mRNA findings, the phospho-kinase array results exposed variant-mediated signaling events that were not previously linked with the functionality of CD74-ROS1. Together, these findings provide a better understanding of CD74-ROS1 role in NSCLC and contribute a list of novel molecular targets for further mechanistic analysis and drug development.
Keywords:
oncogenic fusion
; cluster of differentiation 74 (CD74)
; ROS proto-oncogene 1 (ROS1)
; non-small cell lung cancer (NSCLC)
; CD74-ROS1
; RNA sequencing
; receptor tyrosine kinase (RTK)
; signaling pathway
1. Introduction
Cluster of Differentiation 74 (CD74) is an immunomodulatory protein with cytoplasmic and membrane localizations. Although CD74 is primarily detected in antigen-presenting immune cells, such as dendritic cells, macrophages, and B-cells, under pathological conditions it is also expressed in diverse cell types and tissues [1]. The cytoplasmic CD74, also known as the invariant chain (Ii), localizes in the endoplasmic reticulum (ER) where it associates with major histocompatibility complex II (MHC II) molecules to ensure that exogenous peptides are not prematurely bound. Via the formation of a CD74-MHC II nonameric complex [2], CD74 chaperones MHC II through the antigen presentation pathway to endosomal compartments where its class II-associated invariant chain peptide (CLIP) is displaced, and antigenic peptides are properly loaded onto MHC II. Eventually the MHC II-antigen complex is presented to the plasma membrane where it is recognized by CD4⁺ T cells.
Independent to the cytosolic activity, a small proportion of CD74 translocate to the cell surface, functioning as a type II receptor. The membrane-bound CD74, which is organized as a homotrimer, consists of a disordered N-terminal intracellular domain, a single transmembrane helix, and an extracellular region enclosing the CLIP and “trimeric” domains. Because alternative splicing generates four human CD74 isoforms [3], the amino acid (aa) length of intracellular and extracellular domains vary. Focusing on the extracellular domain of CD74, macrophage migration inhibitory factor (MIF) [4] and D-dopachrome tautomerase (D-DT or MIF2) [5] are the two proteins known to function as ligands for this receptor. Activation of CD74 by its protein ligands achieves intracellular signaling in the presence of the co-receptors, CD44 [5,6], C-X-C chemokine receptor type 2 (CXCR2) [7], CXCR4 [8], or CXCR7 [9,10]. Pathways that become activated include, extracellular signal-regulated kinase (ERK) 1/2 mitogen-activated protein kinase (MAPK) [5,11,12], nuclear factor-kappa B (NF-kB) [13,14], phosphoinositide 3-kinase (PI3K)/ protein kinase B (Akt) [15], Jun N-terminal kinase (JNK) [16], adenosine monophosphate-activated protein kinase (AMPK) [17], and cyclooxygenase-2 (COX-2)/prostaglandin E2 (PGE2) [18], which promote inflammatory states, cell survival, and proliferation. Beyond its role as a cell surface receptor, recent findings showed that the CD74 intracellular domain (CD74-ICD) acts as a transcriptional regulator, partnering with factors like NF-κB and runt-related transcription factor (RUNX) 1/3 to control genes linked to immunity and cell survival [19].
ROS proto-oncogene 1, receptor tyrosine kinase (RTK), also known as ROS1, is a 2347 aa protein with an unknown biological ligand [20] and a poorly understood physiological function [21]. Localized in chromosome 6 (6q22.1), the ROS1 gene encodes a large extracellular N-terminal domain that is composed of fibronectin type III repeats and three β- propeller domains, a single transmembrane domain (TM), and an intracellular C-terminal segment that contains the kinase domain (KD) [22]. While the experimentally solved structure of ROS1 is yet to be reported, homology modeling with Sevenless (Sev)—a Drosophila receptor tyrosine kinase (RTK) [23]—as well as a computed structure model of ROS1 kinase domain [24] suggest that the receptor adopts a homodimeric biological assembly.
The clinical significance of ROS1 primarily rises from its ability to form chimeric fusions with protein partners that are derived from diverse families [25]. The first ROS1 chromosomal rearrangement (FIG-ROS or GOPC-ROS1) was reported in 1987 [26,27] with many more being identified since then. In lung cancer, ROS1 fusions are detected in about 1% - 2% of non-small cell lung cancer (NSCLC) patients [28] and are considered oncogenic drivers. The truncated portion of ROS1 that participates in the formation of oncogenic fusions is thought to be constitutively activated, causing aberrant signaling [22]. Cascades activated by ROS1 include SH2 domain-containing protein tyrosine phosphatase-2 (SHP-2) [29], mitogen-activated protein kinase (MEK)- ERK [30], PI3K-AKT-mammalian target of rapamycin (mTOR) [31], Janus tyrosine kinase (JAK)-signal transducer and activator of transcription (STAT) 3 [32], and vav guanine nucleotide exchange factor (Vav) 3-Rho [33], which collectively contribute to tumor invasion, cell proliferation, as well as cancer metastasis.
The CD74-ROS1 fusion protein is of great interest as it is detected in advanced cases of lung adenocarcinomas where treatment plans become complicated due to resistance to traditional chemotherapies. Seven different variants of CD74-ROS1 were reported in the literature, with instances mainly occurring in NSCLC and one case in inflammatory breast cancer [34]. Therapeutics available for CD74-ROS1 target only the ROS1 kinase activity and include different generations of tyrosine kinase inhibitors (TKIs), like crizotinib [35,36], entrectinib [37], and repotrectinib [38]. While there has been some clinical success with ROS1 inhibitors, TKI resistance often occurs, leaving patients with limited treatment options.
As CD74 is the most common 5’ fusion partner amongst the ROS1 family of fusion proteins [22], this study seeks to characterize the genetic profile and transcriptional signatures of the CD74-ROS1 fusion. To do so, selected CD74-ROS1 variants with strategic modifications were generated and transfected in the lung cancer cell line A549. Our comprehensive analysis, at the mRNA and protein levels, demonstrates variant-dependent signaling that may be used to expose therapeutic vulnerabilities of CD74-ROS1 oncogenic fusion.
2. Results
2.1. Justification for the Generation of CD74-ROS1K439M and CD74∆2-41-ROS1 Variants
This study focuses on the CD74-ROS1 C6-R32 variant, or ‘long’ version of CD74-ROS1 that is associated with short patient progression-free survival (PFS) [39]. The literature reports the detection of CD74-ROS1 C6-R32 fusion in NSCLC patients all the way from stages I to IV [40,41,42,43,44]. Utilizing this fusion, variants were generated to investigate the individual contribution of each fusion partner—CD74 and ROS1—to the oncogenic potency of CD74-ROS1 (Figure 1). First, we generated the CD74-ROS1K439M variant that impacts on the functionality of ROS1. CD74-ROS1K439M features a lysine to methionine point mutation at position 439 (K439M). This variant is modeled after previous studies, which demonstrated that this mutation eliminates the kinase activity of ROS1 [27,45,46,47]. When mapped to the full-length ROS1 protein, Lys439 in CD74-ROS1 corresponds to Lys1980 [48]. This residue plays a critical role in coordinating adenosine triphosphate (ATP) during substrate phosphorylation [48,49].
CD74∆2-41-ROS1 is a variant that has the majority of CD74’s intracellular domain (His2- Glu41) removed. Met1 was retained as the start codon, and the remaining five intracellular residues (Ser42- Arg46) were preserved to prevent a potential disruption of the transmembrane domain. Apart from one study showing that truncation of the CD74 intracellular domain (CD74-ICD) does not impair MIF binding [4], there is limited mechanistic evidence regarding its functional role. Therefore, removing the intracellular domain could be a valid approach to expose unknown functionalities of CD74 (Figure 1). At this point, it is also important to restate the previously described role of CD74-ICD as a transcriptional regulatory molecule [19] contributing to immunity and cell survival. Whether this functionality is retained to the chimeric CD74 is yet to be shown. To initiate our study, the wild-type (WT) CD74-ROS1 C6-R32 fusion, along with CD74-ROS1K439M and CD74∆2-41-ROS1 variants were stably transfected into the A549 lung adenocarcinoma cell line. Notably, this cell line was chosen for its ROS1-fusion negative characteristics [50] and its established use as a cellular model for studying CD74-ROS1 [50,51,52]. Prior to the coding transcriptome analysis, the CD74-ROS1 variants were confirmed at the DNA level (Figure S1-3) and mRNA level (Figure S4), through Sanger sequencing and quantitative reverse transcription polymerase chain reaction (RT-qPCR), respectively.
2.2. Global Analysis of the Differential and Equivalent Gene Expression Between A549 and CD74-ROS1 Variants
Datasets of the wild-type A549 cell line (control) and CD74-ROS1 transfected variants (experimental groups) were analyzed to determine differential gene expression associated with the activity of CD74-ROS1. Principal component analysis (PCA) was subsequently performed to provide a global view of gene expression differences across the biological replicates of the four groups (Figure S5). The anticipated result is that biological replicates from the same group would cluster together. Due to the oncogenic properties of CD74-ROS1, we also expect each group to cluster in distinct positions, separate from the others. This would indicate that the global gene expression profiles—and, by extension, the underlying survival mechanisms—differ between the four groups. Indeed, the biological replicates of A549, CD74-ROS1K439M, and CD74∆2-41-ROS1 cluster together far away from the other groups. This was not the case for CD74-ROS1, which was detected proximal to A549 (Figure S5).
Pairwise differential (Figure 2A) and equivalent (Figure 2B) expression analyses of 23,342 genes revealed distinct expression profiles among the A549 and engineered cell lines. “Differential” genes are those with statistical evidence of a fold-change difference of greater than 1.5, while “equivalent” genes are those with statistical evidence of a fold-change difference less than 1.5. For clarity, genes without statistical evidence of difference or equivalence are considered inconclusive and are not counted within either group. The first pair, A549 and CD74-ROS1, validated the PCA results by showing the smallest number of total differential genes (62 genes, Table S1) and the highest number of total equivalent ones (10,082 genes, Table S2). The 62 differentially expressed genes detected between A549 and CD74-ROS1 are provided (Table S3) and will serve as the basis for the analyses that follow. Between A549 and CD74∆2-41-ROS1, a total number of 549 (Figure 2A_horizontal bar chart, Table S2) and 8,118 (Figure 2B_ horizontal bar chart, Table S3) genes were differentially and equivalently expressed, respectively. A comparison between A549 and CD74-ROS1K439M revealed a greater transcriptional divergence, with 877 genes differentially expressed and 8,559 equivalent. When comparing CD74-ROS1 with CD74∆2-41-ROS1, 433 genes were differentially expressed and 6,996 were equivalently expressed. For the CD74-ROS1 and CD74-ROS1K439M pair a total number of 696 and 8,174 genes were identified to be differentially (Figure 2A_ horizontal bar chart, Table S2) and equivalently (Figure 2B_ horizontal bar chart, Table S3) expressed, respectively.
From the total number of differentially and equivalently expressed genes, we then probed the number of genes that are shared among the several comparisons. A549/CD74-ROS1K439M and CD74-ROS1/CD74-ROS1K439M share the highest number of differentially expressed genes, totaling 320 (Figure 2A_vertical bar chart). Interestingly, 271, 187, 147, and 123 genes, which were identified to be differentially expressed in the corresponding pairs of A549/CD74-ROS1K439M, CD74-ROS1/CD74-ROS1K439M, A549/CD74∆2-41-ROS1, and CD74-ROS1/CD74∆2-41-ROS1 are not shared by any other comparisons (Figure 2A_vertical bar chart). The distinct mechanistic effects of the three experimental groups (CD74-ROS1, CD74-ROS1K439M, and CD74∆2-41-ROS1) on global gene expression becomes evident when comparing A549/CD74-ROS1, A549/CD74-ROS1 K439M, and A549/CD74∆2-41-ROS1. Notably, these three pairs share only 14 differential expressed genes. Moving on, we examined the shared genes that appeared on the equivalently expressed bar chart (Figure 2B_vertical bar chart). A total of 3,954 genes were found to be shared across all comparisons included in our analysis; however, this number decreases significantly in subsequent comparisons. Collectively, these results emphasize that there is a high level of overlap between equivalent genes across all conditions, while the differential genes between conditions tend to be more unique. The variation in the results of these differential expression analyses indicates that the two fusion mutants cause many gene expression changes, which can teach us more about the functionality of CD74-ROS1.
2.3. Multigroup Analysis of the 62 Differentially Expressed Genes (DEGs) Across the Fusion Variants
To gain mechanistic insights associated with the functionality of each protein partner (CD74 and ROS1), we normalized the expression of the 62 genes identified from the pairwise differential analysis between A549 and CD74-ROS1 (fold change > 1.5x) and visualized the data on a heatmap (Figure 3). To ensure transparency, each biological replicate of the four samples was included in this analysis.
Genes with potential mechanistic relevance were defined as those whose expression shifted toward the wild-type A549 profile upon disruption of a specific domain within the CD74-ROS1 fusion protein. Specifically, either deletion of the CD74 intracellular domain (CD74Δ2–41-ROS1 variant) or inactivation of the ROS1 kinase domain (CD74-ROS1K439M variant) reverted the expression of these genes to near wild-type levels, but only in one of the two variants. The lack of effect in the other variant suggests that the gene’s expression is selectively dependent on the function of a distinct domain within CD74-ROS1, highlighting its domain-specific mechanistic role in driving transcriptional changes.
Given the complexity of the heatmap, we further simplified our analysis by categorizing the expression levels of the 62 genes in each of the mutants (CD74Δ2–41-ROS1 and CD74-ROS1K439M) as being more similar to either A549, or CD74-ROS1. We did this by referring to the tests for difference and equivalence, performed between each group pair. For a given gene and mutant, if the p value for “difference” was lower when compared to A549 rather than CD74-ROS1, and the p value for “equivalence” was lower when compared to CD74-ROS1 rather than A549, then the mutant was “assigned” to CD74-ROS1. This means that there is quantitative evidence that the expression of the particular gene in the given mutant is more similar to CD74-ROS1 than A549. In the reverse case, the gene was “assigned” to A549.
Following this approach, the 62 genes were clustered on a new map that allowed for a straightforward evaluation (Figure 4). Both mutants showed expression patterns more similar to CD74-ROS1 for half of the genes (Figure 4, bottom right panel). When comparing similarities to A549, CD74Δ2–41-ROS1 and CD74-ROS1K439M resembled the control cells in the expression of 13 genes (Figure 4, top left panel). While these 44 genes do not attribute an effect that is selective to either CD74 or ROS1 mutations, their analysis stops here. For the remaining 18 genes, 13 and 5 have demonstrated a CD74-mediated (Figure 4, top right panel) and ROS1-mediated (Figure 4, bottom left panel) expression, respectively. The genes that have shown to be directly impacted by the deletion of CD74’s intracellular domain are NTS, IL6, CDH19, LUM, F2RL2, LOC105372424, SPINK6, DOC2B, C4BPB, CRISPLD1, LHFPL4, NRAD1, and LHX8. From those, 9 (NTS, IL6, CDH19, LUM, LOC105372424, SPINK6, C4BPB, NRAD1, and LHX8) underwent downregulation and 4 (F2RL2, DOC2B, CRISPLD1, and LHFPL4) upregulation, mirroring in both cases the gene expression profiles noted in A549 (Figure 3). IL6 gene, which encodes for the proinflammatory cytokine interleukin 6, is the only gene out of the 13 that has a previously described relationship with CD74. According to two independent studies in pancreatic cancer [53] and melanoma [54], inactivation of CD74 by gene silencing is associated with downregulation of IL6 mRNA levels, something that was also observed in our study (Figure 3). What is truly interesting is that the previously published findings refer to intact CD74, while herein we study CD74 as a fusion partner with ROS1. While the role of IL-6 in the survival and proliferation [55] of non-small cell lung cancer cells is known, its interconnection with CD74 is yet to be studied. The 5 genes linked to ROS1 activity are IL1RL1, PTPRD, LINC01895, KCNJ16, and ZEB2 (Figure 3). Upon mutation of the kinase domain, four out of five genes (IL1RL1, PTPRD, LINC01895, and ZEB2) were upregulated and one (KCNJ16) was downregulated. Similar to CD74, the changes in the expression profiles of the five genes resembled A549 findings (Figure 3).
2.4. Exposing the Cellular Signaling of CD74-ROS1 Variants by Phospho-Kinase Analysis
We conducted a proteome profiler human phospho-kinase analysis to provide an unbiased assessment of the signaling pathways influenced by the CD74-ROS1 fusion protein and its two variants. Since individual signaling pathways can be regulated by multiple proteins in diverse ways, we organized our data into three distinct comparison groups. The first group includes A549 cells and CD74-ROS1 expressing cells. This comparison reveals signaling pathways that are either upregulated or downregulated between the control and the primary experimental condition. The second group consists of A549, CD74-ROS1, and CD74Δ2–41-ROS1 cells. This comparison highlights signaling changes driven by the deletion of the CD74 intracellular domain. The third group includes A549, CD74-ROS1, and CD74-ROS1K439M, and is used to identify signaling alterations resulting from inactivation of ROS1 kinase domain. The raw data obtained from these experiments are provided (Figure S6) along with the analysis of the phospho-kinase array signals (Figure 5).
Starting with the comparison between A549 and CD74-ROS1, our findings demonstrate that expression of the oncogenic protein had a net increase on protein phosphorylation, activating multiple pathways that support tumor progression through distinct mechanisms (Figure 5A). Specifically, upregulation of protein phosphorylation was clearly noted for cAMP-response element binding protein (CREB), heat shock protein 27 (HSP27), Jun-proto-oncogene (c-Jun), and to lesser extent for tumor protein p53 (p53) and ribosomal S6 kinase (RSK) 1/2/3 (Figure 5A). Total b-Catenin also increased while phosphorylation of ERK1/2 and total HSP60 were reduced. Phosphorylation of Src was also downregulated but to a lesser extent in comparison to ERK1/2.
Moving on to the second group (A549, CD74-ROS1, and CD74Δ2–41-ROS1), we analyzed the impact of the CD74 mutation on global phosphorylation. Using A549 and CD74-ROS1 as the point of reference, we noted that CD74Δ2–41-ROS1 increased phosphorylation of p53 (Ser15 and Ser46), RSK1/2, RSK1/2/3, and decreased phosphorylation of STAT3, with total HSP60 also being reduced (Figure 5B). Regarding HSP27, expression of CD74Δ2–41-ROS1 had a substantial impact, diminishing the previously observed protein phosphorylation detected in the cases of A549 or CD74-ROS1. A side-by-side comparison of the phosphorylation patterns observed for p53, RSK1/2, RSK1/2/3, HSP27, STAT3, as well as total HSP60 in A549, CD74-ROS1, CD74Δ2–41-ROS1 cells revealed that these results cannot be clearly attributed to a CD74-mediated regulation mechanism. In contrast, such a link appears more evident for ERK1/2, total β-Catenin, and c-Jun (Figures 5B and 6). The fact that mutation of CD74 intracellular domain restored the protein levels back to those observed in the control cells suggests that CD74 exerts its function through these signaling pathways (Figure 5B). Indeed, previous studies have shown the interconnection of CD74 with active β-Catenin [56], and the phosphorylation of ERK1/2 [6], and c-Jun [16].
Analysis of the third group (A549, CD74-ROS1, and CD74-ROS1K439M) exposed the most striking results on global phosphorylation. Inactivation of ROS1 kinase domain resulted in reduction of protein phosphorylation for CREB, ERK1/2, GSK-3α/β, GSK-3β, HSP27, Src, RSK1/2, RSK1/2/3, STAT3, and total HSP60 (Figure 5C). This finding clearly demonstrates the critical role of ROS1 in regulating cell fate, highlighting at the same time the complexity of the employed mechanisms. As illustrated by the bar charts of the last two groups (Figure 5B,C), CREB, GSK-3α/β, and GSK-3β provide evidence of ROS1-mediated phosphorylation (Figure 6). In contrast, phosphorylation of the remaining proteins—HSP27, Src, RSK1/2, RSK1/2/3, STAT3, p53, and total HSP60—appears to be influenced by a more complex interplay of signaling pathways, making it difficult to attribute their results directly to ROS1 activity (Figure 6). While β-catenin, c-Jun, and ERK1/2 signaling also decreased in the kinase-dead CD74-ROS1K439M expressing cells, these aforementioned proteins still appear to be CD74-mediated (Figure 5B,C).
2.5. Functional Insights into CD74-ROS1–Mediated Signaling Pathways
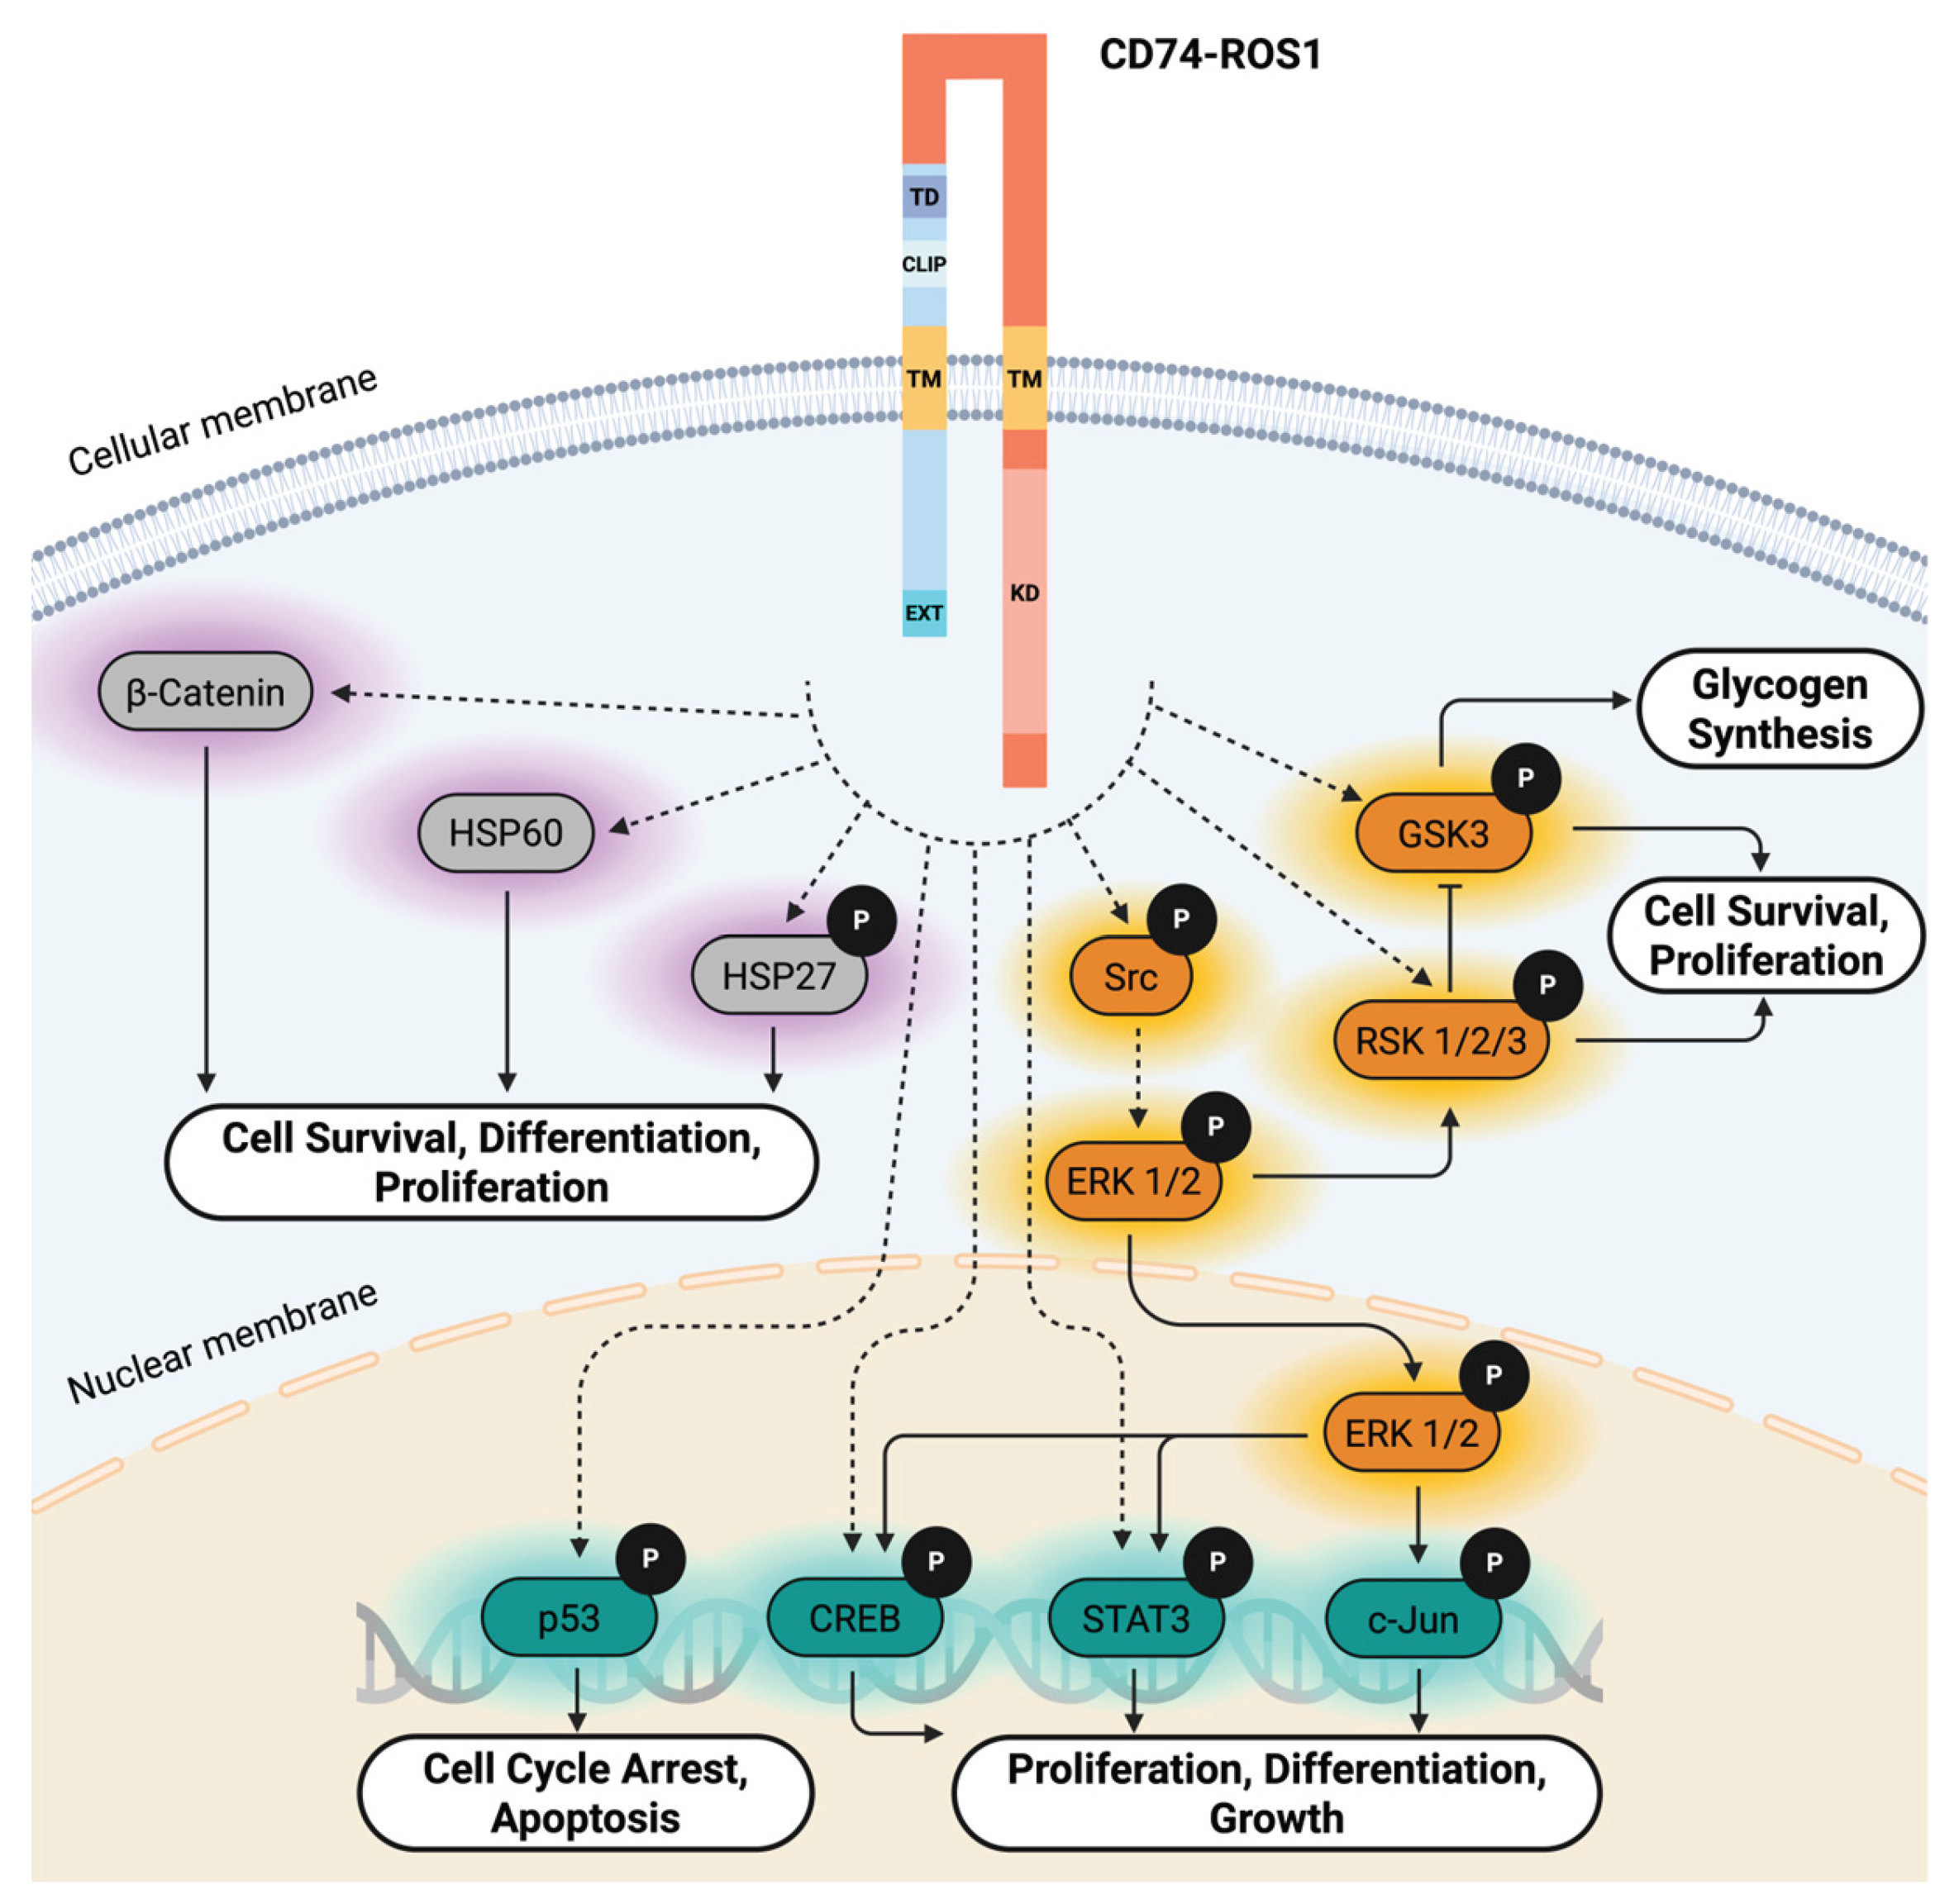
To better understand the impact of CD74-ROS1 activation at a cellular level, we analyzed the functional role of all proteins identified by our phospho-kinase array and compared our findings with previously published data. Of the phosphorylation events observed herein, some are supported by prior studies while others remain novel and unexplored. STAT3 [57] and ERK1/2-related [58] signaling cascades are involved in the regulation of cell proliferation, differentiation, and growth (Figure 7). Previously described ectopic CD74-ROS1 cells have varying degrees of STAT3 and MAPK expression, from moderately engaged to non-existent compared to controls. [59]. A similar trend in ERK1/2 and STAT3 phosphorylation was observed between A549 and CD74-ROS1 cells (Figure 5A).
Among the proteins not previously described to be associated with the activity of CD74-ROS1 are p53, Src, RSK isoforms, HSP27, and HSP60. Starting with p53, this tumor suppressor protein facilitates DNA repair and aids in cell-cycle arrest and cellular apoptosis (Figure 7). In our assay, the presence of CD74-ROS1 caused a mild upregulation in the phosphorylation of p53 (Figure 5A). The minor yet detectable reduction in Src phosphorylation is another signaling event note to be associated with CD74-ROS1 (Figure 5A). Src is known as an upstream mediator of MAPK-ERK1/2 signaling cascades, contributing to cell proliferation (Figure 7) [60]. More precisely, phosphorylation of Y419 converts Src from its inactive to the active state [61]. Phosphorylation of RSK1/2/3 and RSK1/2, which refer to the human isoforms of the RSK protein, were found to be slightly upregulated and downregulated, respectively, in the presence of CD74-ROS1. Phosphoinositide-dependent kinase 1 (PDK1) phosphorylates RSK1 at S221 and RSK2 at S227 [62]. Subsequent ERK activation leads to the autophosphorylation of RSK1 at S380, RSK2 at S386, and RSK3 at S377. These phosphorylation events collectively contribute to cell survival and proliferation (Figure 7) [62]. HSP27 and HSP60 are two heat shock proteins that play important roles in anti-apoptotic signaling, differentiation, and proliferation [63]. Upon expression of CD74-ROS1, total HSP60 and phosphorylation of HSP27 decreases and increases, respectively. Because these aforementioned events, detected by our array (Figure 5A), are not drastic and lack confirmation from the literature, in-depth signaling studies and further investigation are required to experimentally verify the direct or indirect connection with CD74-ROS1.
β-catenin is a key component of the Wnt signaling pathway and plays a central role in regulating cell proliferation and differentiation [64,65] (Figure 7). Although dysregulated in many cancers, the activation of β-catenin by CD74-ROS1 represents an underexplored aspect of its oncogenic signaling, making it a potential area for further mechanistic and therapeutic investigation. In the case of full-length CD74, active (non-phosphorylated) β-catenin expression can be induced in a dose-dependent manner upon stimulation with MIF [56]. In the context of chronic arthritis, it was determined that CD74’s cytosolic N-terminal fragment alone, was not critical for β-catenin activation in osteoclast cells [56]. In our study, we demonstrate that in a similar regard, full-length CD74 of CD74-ROS1, is necessary for increasing β-catenin levels, since removal of CD74’s intracellular domain lowers β-catenin back to baseline (Figure 5B). Lastly, the phosphorylation of c-Jun at S63 observed in the phospho-kinase array is strongly supported to be CD74-attributed, based on experimental evidence showing that MIF activates the JNK/c-Jun pathway via the CD74 axis [16]. In regard to cellular fate, activation of c-Jun mediates cellular growth and proliferation as well as differentiation [16,66] (Figure 7). For the first time, both β-Catenin and c-Jun phosphorylation are correlated to the CD74 half of the CD74-ROS1 fusion, potentially adding to the cellular mechanisms employed by these fusions to promote cancer survival.
Phosphorylation of CREB on S133 has earlier been described in a phosphoproteomics study, which also noted a reduction in phospho-CREB in response to a ROS1 kinase inactivating mutation [67]. These results mirror those observed in our array (Figure 5C). S133 can become phosphorylated by many different kinases including, but not limited to, ERK [68] (Figure 7). As a transcription factor, CREB can contribute to downstream cell proliferation, differentiation and survival as phosphorylated S133 is often overexpressed in tumors (Figure 7) [68]. Glycogen synthase kinase-3 (GSK-3) has two isoforms, GSK-3α and GSK-3β, each of which can regulate glycogen synthase [69]. Different kinases (e.g., RSK2) can phosphorylate at S21 and S9, causing GSK3 inactivation, [70] thus allowing for glycogen synthesis to occur and fuel cellular processes (Figure 7) [69]. A prior study compared phospho-GSK3α/β levels between ROS1 and ROS1 kinase-inactivated cells but discovered no significant difference in expression [67]. By contrast, in our array, we see the KD point mutation does alter GSK-3 expression compared to WT CD74-ROS1 cells (Figure 5C).
3. Discussion
NSCLC is one of the deadliest cancers, and targeted therapies after early detection are the key to making therapeutic breakthroughs for patients before they run out of treatment options. In the clinical setting, CD74-ROS1 fusion is often found in patients at late stages, once standard lines of treatment fail, and the cancer has metastasized. ROS1 TKIs are utilized to specifically target the ROS1 half of the fusion, which is considered to drive the proliferation of cancer cells, but often enough, the patients’ cancer becomes TKI resistant [34]. While there are many different TKIs on the market, the current clinical landscape fails to consider the other half of the fusion, CD74. As CD74 is the most common ROS1 fusion partner, occurring in approximately ∼50% of cases [22], it serves as an ideal model for exploring how a 3′ fusion partner contributes to the overall oncogenicity of the fusion.
Differential and equivalence expression analyses of mRNA-seq data for 23,342 genes revealed distinct expression profiles between A549 cells and the various transfected cell lines (CD74–ROS1, CD74Δ2–41–ROS1, and CD74–ROS1K439M), thereby validating our cellular model. The differential genes identified between A549 and the two mutants were many more that the A549 and CD74-ROS1 pair, thus this discovery merits future investigation. The 62 DEGs, identified from the comparison between A549 and CD74-ROS1, served as the foundation for our further analysis. This was important because we next compared whether specific alterations—either mutation of the ROS1 ATP-binding lysine or truncation of the CD74 ICD—shifted gene expression profiles toward those of A549 or CD74–ROS1 cells. Our analysis enabled the identification of genes that were most impacted by CD74’s intracellular domain deletion. In total, the downregulation of 9 genes, (NTS, IL6, CDH19, LUM, LOC105372424, SPINK6, C4BPB, NRAD1, and LHX8) and upregulation of 4 genes (F2RL2, DOC2B, CRISPLD1, and LHFPL4) were observed. Of these 13 genes, IL-6 was the most interesting due to its previously established role in NSCLC [71] as well as its connection with CD74 [53,54]. For the kinase-dead CD74-ROS1 variant, inactivation of ROS1 induced upregulation and downregulation of four genes (IL1RL1, PTPRD, LINC01895, and ZEB2) and one gene (KCNJ16), respectively. These results underscore the breadth and depth of the gene expression analysis, as most of the identified genes were previously unassociated with CD74–ROS1. Importantly, the RNA-seq data demonstrated that CD74 drives its distinct gene expression patterns.
Three groups were then created, including A549 and CD74-ROS1 (Figure 5A) A549, CD74-ROS1, and CD74Δ2–41-ROS1 (Figure 5B), and A549, CD74-ROS1, and CD74-ROS1K439M (Figure 5C) for further comparisons by the phospho-kinase array. Since mRNA and protein levels tend to be different, we wanted to get a better idea of what was actually happening at the protein level. From the first group, there was an overall increase in protein phosphorylation events, meaning activation of potentially multiple pathways enabled by CD74-ROS1 expression. Upregulation was obvious for CREB, HSP27, c-Jun, total b-Catenin, and less for p53 and RSK 1/2/3. From the second group (Figure 5B), comparing our control (A549 cells) with the ICD deletion variant, it became clear that changes in the phosphorylation of ERK1/2, c-Jun, and total β-Catenin were associated with CD74. Finally the last group (Figure 5C) revealed ROS1-mediated protein phosphorylation events such as GSK-3α/β, GSK-3β, and CREB.
Many of the cellular fates associated with CD74-ROS1 signaling lent themselves to growth, proliferation and survival, with the exception of p53 which had the opposite effect, promoting apoptosis and cell cycle arrest (Figure 7). Interestingly cells carrying either the point mutation or the ICD deletion showed elevated p53 levels. Based on this analysis, both protein partners contribute to the progression of cancer via promotion of several survival pathways. This finding is novel as it is the first piece of evidence that demonstrates the active role of CD74 in the oncogenic signaling of CD74-ROS1. Furthermore, the cellular fate signaling highlighted the reoccurring theme of MAPK-ERK 1/2 and STAT3 signaling being reproducible amongst CD74-fusions in this study and across the literature [59,72].
A key limitation of this study is that CD74-mediated signaling pathways cannot be definitively characterized without evidence of phosphorylation of signaling intermediates. Future work should use the observations and suggestions pointed out by the phospho-kinase array to follow up with in-depth signaling studies. Many of the proteins that could not be specifically attributed to neither CD74 nor ROS1, but rather the entire CD74-ROS1, were not previously reported in the literature and thus could be explored with the same variants to extend the current knowledge of CD74-ROS1 mediated pathways. Once these pathways are fully elucidated, the next step will be to develop therapeutic interventions that efficiently target CD74-ROS1 in its entirety.
4. Materials and Methods
4.1. Cell Culture
The human lung adenocarcinoma cancer cell line A549 was sourced from the American Type Culture Collection (ATCC; Manassas, VA). A549 cells were cultured in Ham’s F-12K medium supplemented with l-glutamine (Gibco, Waltham, MA), 10% FBS (Cytiva, Marlborough, MA), and 1% penicillin–streptomycin (Gibco, Waltham, MA). Cells were maintained in a humidified incubator with 5% CO2 at 37 °C.
4.2. Plasmid Design
The CD74-ROS1 fusion sequence was cloned into the mammalian expression vector, pcDNA3.1(+), between the NheI and ApaI cloning sites (Figure S7) and codon optimized for mammalian cell expression (GenScript, Piscataway, NJ). Using the WT plasmid of CD74-ROS1 as a template, CD74∆2-41-ROS1 and CD74-ROS1K439M were produced following the QuikChange site directed mutagenesis protocol (Agilent Technologies, Santa Clara, CA). The DNA oligos used for mutagenesis provided in the supporting information (Table S4). The polymerase chain reaction (PCR) products were digested with DpnI (New England Biolabs) and then transformed into XL10-Gold ultracompetent cells (Agilent Technologies, Santa Clara, CA). All variants were confirmed by whole plasmid sequencing (Quintara Biosciences, CA).
4.3. Stable Transfection
The CD74-ROS1, CD74∆2-41-ROS1, and CD74-ROS1K439M plasmids were linearized prior to transfection using the FastDigestScaI restriction enzyme (Thermo Fisher Scientific). Each linearized plasmid was introduced into A549 cells using the Lipofectamine 3000 Transfection Reagent (Invitrogen, Waltham, MA) according to the manufacturer’s protocol. Stably transfected cells were selected with 800 µg/mL G418 disulfate (Thermo Fisher Scientific) over the course of several weeks.
4.4. Genomic DNA (gDNA) Extraction and Sequencing
Prior to DNA extraction, the A549 cells that stably express CD74-ROS1, CD74∆2-41-ROS1, and CD74-ROS1K439M were harvested and washed with phosphate buffered saline (PBS) (Gibco, Waltham, MA). Total genomic DNA was isolated using the QIAamp DNA mini kit (QIAGEN# 51304) according to the manufacturer’s protocol. CD74-ROS1, CD74∆2-41-ROS1, and CD74-ROS1K439M nucleotide sequences were confirmed at the DNA level by Sanger sequencing. The DNA oligo used for Sanger sequencing are detailed in the supporting information (Table S5). Due to the nucleic acid (na) length of CD74-ROS1 variants and the reading limitations of Sanger sequencing, multiple primers were employed to confirm the entire na sequence of our fusion proteins.
4.5. RNA Extraction and Complementary DNA (cDNA) Synthesis
Total RNA was extracted from A549 cells expressing CD74-ROS1, CD74∆2-41-ROS1, and CD74-ROS1K439M, using the Quick-RNA Miniprep kit (Zymo Research, R1054) in accordance with the manufacturer’s instructions. cDNA was prepared from the isolated RNA using the SuperScript IV First-Strand Synthesis System (Invitrogen, Waltham, MA), following the manufacturer’s protocol.
4.6. Reverse Transcription Quantitative Polymerase Chain Reaction (RT-qPCR)
Transcript specific primers, designed on national center for biotechnology information (NCBI) Primer-BLAST [73], were used to amplify CD74-ROS1, CD74∆2-41-ROS1, and CD74-ROS1K439M (Forward: 5’- TGGATGCACCACTGGCTGCTA -3’ and Reverse: 5’- GGCCTTCTCCCACTGGATGCT -3’). GAPDH primers were used to amplify the GAPDH internal reference gene (Forward: 5’ GGAGCGAGATCCCTCCAAAAT 3’ and Reverse: 5’ GGCTGTTGTCATACTTCTCATGG 3’). The reaction mixture was composed of 10 µL iTaq Universal SYBR Green Supermix (Bio-Rad, Hercules, Ca), 100 ng of cDNA template, and 500 nM of forward and reverse primers. 20µL of that was added into a 96-well white PCR plate (Bio-Rad, Hercules, Ca). Experiments were run on the CFX Touch Real-Time PCR System (Bio-Rad, Hercules, Ca) and data were collected using CFX Maestro software version 4.0.2325.0418 for 45 cycles following the manufacturer’s instructions. All assays were performed in biological triplicates. Relative gene expression fold changes of CD74-ROS1 variants were determined using the 2-∆∆Ct method, having A549 as the control. The results are presented as mean ± standard deviation (SD). Each experimental group was independently compared to the control by the unpaired two-sample t-test on GraphPad Prism software version 10.4.2.
4.7. RNA Sequencing Analysis
Sequence alignment was performed using Bowtie2 v2.5.4 [74] with default parameters, aligning reads to the human reference genome (hg38) obtained from the University of California, Santa Cruz (UCSC) Genome Browser. Gene-level counts were generated with featureCounts v2.0.8 [75] with standard parameters, using the hg38 NCBI RefSeq GTF annotation, also sourced from UCSC. Quality control was performed with FastQC v0.12.1 [76].
4.8. Gene Expression Analysis
Differential expression analysis was conducted using DESeq2 v1.44.0 [77]. For each pairwise comparison, only genes with a minimum of 10 read counts in at least 3 replicates were tested. Two complementary null hypotheses were evaluated for each gene:
- 1.
- That the absolute fold change is less than 1.5 (i.e., |LFC| < 0.585), corresponding to no significant differential expression. This was tested with altHypothesis = “greaterAbs”. Rejecting this null hypothesis corresponds to finding evidence of differential gene expression.
- 2.
- That the absolute fold change is greater than 1.5 (i.e., |LFC| > 0.585), corresponding to equivalent expression. This was tested with altHypothesis = “lessAbs”. Rejecting this null hypothesis corresponds to finding evidence of minimal difference in gene expression.
False discovery rate (FDR)-adjusted p-values were computed for both tests, and results were considered significant at an adjusted p-value threshold of 0.05.
Principal component analysis (PCA) was performed on variance-stabilized transformed (VST) gene expression data using scikit-learn [78] v1.4.2 to visualize sample-level differences across conditions.
4.9. Assigning Similarity of Each Mutant Gene
Our goal was to determine, for each of the 62 genes, whether each mutant exhibited gene expression more similar to A549 or to CD74-ROS1. To do this, we used the results of the difference and equivalence tests performed using DESeq2 for each pairwise comparison. For a given gene and mutant, if the p-value for differential expression (“greaterAbs”) was lower when compared to A549 than when compared to CD74-ROS1, and the p-value for equivalence (“lessAbs”) was lower when compared to CD74-ROS1 than when compared to A549, the mutant was assigned to CD74-ROS1. This indicates quantitative evidence that the mutant’s expression pattern is more similar to CD74-ROS1 than A549. Conversely, if the pattern of p-values favored A549, the mutant was assigned to A549.
In other words, for each gene differentially expressed between A549 and CD74-ROS1, we categorized each mutant as “closer to A549” or “closer to CD74-ROS1” by comparing its difference and equivalence test p-values relative to each reference. The mutant was assigned to the group to which it was more equivalent and from which it was less different.
4.10. Phospho-Protein Array Analysis
Relative protein phosphorylation levels were analyzed using the Proteome Profiler Human Phospho-Kinase Array Kit (R&D Systems, Cat No. ARY003C). Previously frozen cell pellets (1 x 10⁷ total cells) of each sample was solubilized in lysis buffer supplemented with 10 µg/mL aprotinin (MP Biomedicals), 10 µg/mL leupeptin hemisulfate (Research Products International), and 10 µg/mL pepstatin A (VWR Life Science). Upon complete homogenization, the suspension was centrifuged for 5 min. at 14,000 x g. Supernatants were transferred into clean microcentrifuge tubes and sample protein quantification was performed using the Pierce BCA Protein Assay Kit (Thermo Fisher Scientific) following the manufacturer’s protocol. 600µg of cell lysate was used per array set (A and B) and further processed following the phospho-array R&D instructions. Membranes were visualized using the ChemiDoc XRS + Molecular Imaging System (Bio-Rad, Hercules, Ca) after 3 min. of exposure. Levels of phosphorylation were quantified using QuickSpots (Ideal Eyes System, Inc., Bountiful, UT) by averaging the pixel density of the pair of duplicate spots, corresponding to each phosphorylated protein, and correcting for background. Bar charts were created in GraphPad Prism software version 10.4.2.
Supplementary Materials
The following supporting information can be downloaded at: Preprints.org.
Author Contributions
“Conceptualization, J.O., and G.P.; methodology, J.V., J.O., and G.P.; software, J.V., J.O.; validation, J.V., J.O., and G.P.; formal analysis, J.V., J.O., and G.P.; investigation, J.V., J.O.; resources G.P.; data curation, J.V., J.O., and G.P.; writing—original draft preparation, J.V.; writing—review and editing, J.V., J.O., and G.P.; supervision, J.O. and G.P. All authors have read and agreed to the published version of the manuscript.”
Funding
This research received no external funding.
Data Availability Statement
The raw data related to mRNA analysis are available on request.
Acknowledgments
This work was supported by funds from the Chemistry Department of the University of the Pacific and Scholarly/Artistic Activities Grant (G.P.). Some of the figures were created with BioRender.com under the paid subscription.
Conflicts of Interest
The authors declare no conflicts of interest.
References
- Liu, Z.; Chen, M.; Zheng, W.; Yuan, S.; Zhao, W., Insights into the prognostic value and immunological role of CD74 in pan-cancer. Discov Oncol 2024, 15, (1), 222.
- Schroder, B., The multifaceted roles of the invariant chain CD74--More than just a chaperone. Biochim Biophys Acta 2016, 1863, (6 Pt A), 1269-81.
- Strubin, M.; Berte, C.; Mach, B., Alternative splicing and alternative initiation of translation explain the four forms of the Ia antigen-associated invariant chain. EMBO J 1986, 5, (13), 3483-8.
- Leng, L.; Metz, C. N.; Fang, Y.; Xu, J.; Donnelly, S.; Baugh, J.; Delohery, T.; Chen, Y.; Mitchell, R. A.; Bucala, R., MIF signal transduction initiated by binding to CD74. J Exp Med 2003, 197, (11), 1467-76.
- Merk, M.; Zierow, S.; Leng, L.; Das, R.; Du, X.; Schulte, W.; Fan, J.; Lue, H.; Chen, Y.; Xiong, H.; Chagnon, F.; Bernhagen, J.; Lolis, E.; Mor, G.; Lesur, O.; Bucala, R., The D-dopachrome tautomerase (DDT) gene product is a cytokine and functional homolog of macrophage migration inhibitory factor (MIF). Proc Natl Acad Sci U S A 2011, 108, (34), E577-85.
- Shi, X.; Leng, L.; Wang, T.; Wang, W.; Du, X.; Li, J.; McDonald, C.; Chen, Z.; Murphy, J. W.; Lolis, E.; Noble, P.; Knudson, W.; Bucala, R., CD44 is the signaling component of the macrophage migration inhibitory factor-CD74 receptor complex. Immunity 2006, 25, (4), 595-606.
- Bernhagen, J.; Krohn, R.; Lue, H.; Gregory, J. L.; Zernecke, A.; Koenen, R. R.; Dewor, M.; Georgiev, I.; Schober, A.; Leng, L.; Kooistra, T.; Fingerle-Rowson, G.; Ghezzi, P.; Kleemann, R.; McColl, S. R.; Bucala, R.; Hickey, M. J.; Weber, C., MIF is a noncognate ligand of CXC chemokine receptors in inflammatory and atherogenic cell recruitment. Nature Medicine 2007, 13, (5), 587-596.
- Schwartz, V.; Lue, H.; Kraemer, S.; Korbiel, J.; Krohn, R.; Ohl, K.; Bucala, R.; Weber, C.; Bernhagen, J., A functional heteromeric MIF receptor formed by CD74 and CXCR4. FEBS Lett 2009, 583, (17), 2749-57.
- Tarnowski, M.; Grymula, K.; Liu, R.; Tarnowska, J.; Drukala, J.; Ratajczak, J.; Mitchell, R. A.; Ratajczak, M. Z.; Kucia, M., Macrophage Migration Inhibitory Factor Is Secreted by Rhabdomyosarcoma Cells, Modulates Tumor Metastasis by Binding to CXCR4 and CXCR7 Receptors and Inhibits Recruitment of Cancer-Associated Fibroblasts. Molecular Cancer Research 2010, 8, (10), 1328-1343.
- Alampour-Rajabi, S.; El Bounkari, O.; Rot, A.; Müller-Newen, G.; Bachelerie, F.; Gawaz, M.; Weber, C.; Schober, A.; Bernhagen, J., MIF interacts with CXCR7 to promote receptor internalization, ERK1/2 and ZAP-70 signaling, and lymphocyte chemotaxis. The FASEB Journal 2015, 29, (11), 4497-4511.
- Lue, H.; Kapurniotu, A.; Fingerle-Rowson, G.; Roger, T.; Leng, L.; Thiele, M.; Calandra, T.; Bucala, R.; Bernhagen, J., Rapid and transient activation of the ERK MAPK signalling pathway by macrophage migration inhibitory factor (MIF) and dependence on JAB1/CSN5 and Src kinase activity. Cell Signal 2006, 18, (5), 688-703.
- Ishimoto, K.; Iwata, T.; Taniguchi, H.; Mizusawa, N.; Tanaka, E.; Yoshimoto, K., D-dopachrome tautomerase promotes IL-6 expression and inhibits adipogenesis in preadipocytes. Cytokine 2012, 60, (3), 772-7.
- Gore, Y.; Starlets, D.; Maharshak, N.; Becker-Herman, S.; Kaneyuki, U.; Leng, L.; Bucala, R.; Shachar, I., Macrophage migration inhibitory factor induces B cell survival by activation of a CD74-CD44 receptor complex. J Biol Chem 2008, 283, (5), 2784-92.
- Li, H.; He, B.; Zhang, X.; Hao, H.; Yang, T.; Sun, C.; Song, H.; Wang, Y.; Zhou, Y.; Zhu, Z.; Hu, Y.; Wang, Y., D-dopachrome tautomerase drives astroglial inflammation via NF-κB signaling following spinal cord injury. Cell & Bioscience 2022, 12, (1), 128.
- Lue, H.; Thiele, M.; Franz, J.; Dahl, E.; Speckgens, S.; Leng, L.; Fingerle-Rowson, G.; Bucala, R.; Luscher, B.; Bernhagen, J., Macrophage migration inhibitory factor (MIF) promotes cell survival by activation of the Akt pathway and role for CSN5/JAB1 in the control of autocrine MIF activity. Oncogene 2007, 26, (35), 5046-59.
- Lue, H.; Dewor, M.; Leng, L.; Bucala, R.; Bernhagen, J., Activation of the JNK signalling pathway by macrophage migration inhibitory factor (MIF) and dependence on CXCR4 and CD74. Cell Signal 2011, 23, (1), 135-44.
- Qi, D.; Atsina, K.; Qu, L.; Hu, X.; Wu, X.; Xu, B.; Piecychna, M.; Leng, L.; Fingerle-Rowson, G.; Zhang, J.; Bucala, R.; Young, L. H., The vestigial enzyme D-dopachrome tautomerase protects the heart against ischemic injury. The Journal of Clinical Investigation 2014, 124, (8), 3540-3550.
- Ji, H.; Zhang, Y.; Chen, C.; Li, H.; He, B.; Yang, T.; Sun, C.; Hao, H.; Zhang, X.; Wang, Y.; Zhou, Y.; Zhu, Z.; Hu, Y.; Li, A.; Guo, A.; Wang, Y., D-dopachrome tautomerase activates COX2/PGE2 pathway of astrocytes to mediate inflammation following spinal cord injury. Journal of Neuroinflammation 2021, 18, (1), 130.
- Gil-Yarom, N.; Radomir, L.; Sever, L.; Kramer, M. P.; Lewinsky, H.; Bornstein, C.; Blecher-Gonen, R.; Barnett-Itzhaki, Z.; Mirkin, V.; Friedlander, G.; Shvidel, L.; Herishanu, Y.; Lolis, E. J.; Becker-Herman, S.; Amit, I.; Shachar, I., CD74 is a novel transcription regulator. Proceedings of the National Academy of Sciences 2017, 114, (3), 562-567.
- Acquaviva, J.; Wong, R.; Charest, A., The multifaceted roles of the receptor tyrosine kinase ROS in development and cancer. Biochim Biophys Acta 2009, 1795, (1), 37-52.
- Birchmeier, C.; O’Neill, K.; Riggs, M.; Wigler, M., Characterization of ROS1 cDNA from a human glioblastoma cell line. Proc Natl Acad Sci U S A 1990, 87, (12), 4799-803.
- Drilon, A.; Jenkins, C.; Iyer, S.; Schoenfeld, A.; Keddy, C.; Davare, M. A., ROS1-dependent cancers - biology, diagnostics and therapeutics. Nat Rev Clin Oncol 2021, 18, (1), 35-55.
- Cerutti, G.; Arias, R.; Bahna, F.; Mannepalli, S.; Katsamba, P. S.; Ahlsen, G.; Kloss, B.; Bruni, R.; Tomlinson, A.; Shapiro, L., Structures and pH-dependent dimerization of the sevenless receptor tyrosine kinase. Mol Cell 2024, 84, (23), 4677-4690.e6.
- Jones, K.; Keddy, C.; Jenkins, C.; Nicholson, K.; Shinde, U.; Davare, M. A., Novel insight into mechanisms of ROS1 catalytic activation via loss of the extracellular domain. Sci Rep 2024, 14, (1), 22191.
- Ou, S. I.; Nagasaka, M., A Catalog of 5’ Fusion Partners in ROS1-Positive NSCLC Circa 2020. JTO Clin Res Rep 2020, 1, (3), 100048.
- Birchmeier, C.; Sharma, S.; Wigler, M., Expression and rearrangement of the ROS1 gene in human glioblastoma cells. Proc Natl Acad Sci U S A 1987, 84, (24), 9270-4.
- Charest, A.; Lane, K.; McMahon, K.; Park, J.; Preisinger, E.; Conroy, H.; Housman, D., Fusion of FIG to the receptor tyrosine kinase ROS in a glioblastoma with an interstitial del(6)(q21q21). Genes Chromosomes Cancer 2003, 37, (1), 58-71.
- Bergethon, K.; Shaw, A. T.; Ou, S.-H. I.; Katayama, R.; Lovly, C. M.; McDonald, N. T.; Massion, P. P.; Siwak-Tapp, C.; Gonzalez, A.; Fang, R.; Mark, E. J.; Batten, J. M.; Chen, H.; Wilner, K. D.; Kwak, E. L.; Clark, J. W.; Carbone, D. P.; Ji, H.; Engelman, J. A.; Mino-Kenudson, M.; Pao, W.; Iafrate, A. J., ROS1 Rearrangements Define a Unique Molecular Class of Lung Cancers. Journal of Clinical Oncology 2012, 30, (8), 863-870.
- Charest, A.; Wilker, E. W.; McLaughlin, M. E.; Lane, K.; Gowda, R.; Coven, S.; McMahon, K.; Kovach, S.; Feng, Y.; Yaffe, M. B.; Jacks, T.; Housman, D., ROS Fusion Tyrosine Kinase Activates a SH2 Domain–Containing Phosphatase-2/Phosphatidylinositol 3-Kinase/Mammalian Target of Rapamycin Signaling Axis to Form Glioblastoma in Mice. Cancer Research 2006, 66, (15), 7473-7481.
- Sato, H.; Schoenfeld, A. J.; Siau, E.; Lu, Y. C.; Tai, H.; Suzawa, K.; Kubota, D.; Lui, A. J. W.; Qeriqi, B.; Mattar, M.; Offin, M.; Sakaguchi, M.; Toyooka, S.; Drilon, A.; Rosen, N. X.; Kris, M. G.; Solit, D.; De Stanchina, E.; Davare, M. A.; Riely, G. J.; Ladanyi, M.; Somwar, R., MAPK Pathway Alterations Correlate with Poor Survival and Drive Resistance to Therapy in Patients with Lung Cancers Driven by ROS1 Fusions. Clin Cancer Res 2020, 26, (12), 2932-2945.
- Nguyen, K. T.; Zong, C. S.; Uttamsingh, S.; Sachdev, P.; Bhanot, M.; Le, M.-T.; Chan, J. L. K.; Wang, L.-H., The Role of Phosphatidylinositol 3-Kinase, Rho Family GTPases, and STAT3 in Ros-induced Cell Transformation*. Journal of Biological Chemistry 2002, 277, (13), 11107-11115.
- Zong, C. S.; Zeng, L.; Jiang, Y.; Sadowski, H. B.; Wang, L.-H., Stat3 Plays an Important Role in Oncogenic Ros- and Insulin-like Growth Factor I Receptor-induced Anchorage-independent Growth*. Journal of Biological Chemistry 1998, 273, (43), 28065-28072.
- Zeng, L.; Sachdev, P.; Yan, L.; Chan, J. L.; Trenkle, T.; McClelland, M.; Welsh, J.; Wang, L. H., Vav3 mediates receptor protein tyrosine kinase signaling, regulates GTPase activity, modulates cell morphology, and induces cell transformation. Mol Cell Biol 2000, 20, (24), 9212-24.
- Vargas, J.; Pantouris, G., Analysis of CD74 Occurrence in Oncogenic Fusion Proteins. International Journal of Molecular Sciences 2023, 24, (21), 15981.
- Esteban-Villarrubia, J.; Soto-Castillo, J. J.; Pozas, J.; San Román-Gil, M.; Orejana-Martín, I.; Torres-Jiménez, J.; Carrato, A.; Alonso-Gordoa, T.; Molina-Cerrillo, J., Tyrosine Kinase Receptors in Oncology. Int J Mol Sci 2020, 21, (22).
- Shaw, A. T.; Ou, S. H.; Bang, Y. J.; Camidge, D. R.; Solomon, B. J.; Salgia, R.; Riely, G. J.; Varella-Garcia, M.; Shapiro, G. I.; Costa, D. B.; Doebele, R. C.; Le, L. P.; Zheng, Z.; Tan, W.; Stephenson, P.; Shreeve, S. M.; Tye, L. M.; Christensen, J. G.; Wilner, K. D.; Clark, J. W.; Iafrate, A. J., Crizotinib in ROS1-rearranged non-small-cell lung cancer. N Engl J Med 2014, 371, (21), 1963-71.
- Drilon, A.; Siena, S.; Dziadziuszko, R.; Barlesi, F.; Krebs, M. G.; Shaw, A. T.; de Braud, F.; Rolfo, C.; Ahn, M. J.; Wolf, J.; Seto, T.; Cho, B. C.; Patel, M. R.; Chiu, C. H.; John, T.; Goto, K.; Karapetis, C. S.; Arkenau, H. T.; Kim, S. W.; Ohe, Y.; Li, Y. C.; Chae, Y. K.; Chung, C. H.; Otterson, G. A.; Murakami, H.; Lin, C. C.; Tan, D. S. W.; Prenen, H.; Riehl, T.; Chow-Maneval, E.; Simmons, B.; Cui, N.; Johnson, A.; Eng, S.; Wilson, T. R.; Doebele, R. C., Entrectinib in ROS1 fusion-positive non-small-cell lung cancer: integrated analysis of three phase 1-2 trials. Lancet Oncol 2020, 21, (2), 261-270.
- Drilon, A.; Camidge, D. R.; Lin Jessica, J.; Kim, S.-W.; Solomon Benjamin, J.; Dziadziuszko, R.; Besse, B.; Goto, K.; de Langen Adrianus, J.; Wolf, J.; Lee Ki, H.; Popat, S.; Springfeld, C.; Nagasaka, M.; Felip, E.; Yang, N.; Velcheti, V.; Lu, S.; Kao, S.; Dooms, C.; Krebs Matthew, G.; Yao, W.; Beg Muhammad, S.; Hu, X.; Moro-Sibilot, D.; Cheema, P.; Stopatschinskaja, S.; Mehta, M.; Trone, D.; Graber, A.; Sims, G.; Yuan, Y.; Cho Byoung, C., Repotrectinib in ROS1 Fusion–Positive Non–Small-Cell Lung Cancer. New England Journal of Medicine 2024, 390, (2), 118-131.
- Li, W.; Fei, K.; Guo, L.; Wang, Y.; Shu, C.; Wang, J.; Ying, J., CD74/SLC34A2-ROS1 Fusion Variants Involving the Transmembrane Region Predict Poor Response to Crizotinib in NSCLC Independent of TP53 Mutations. Journal of Thoracic Oncology 2024, 19, (4), 613-625.
- Takeuchi, K.; Soda, M.; Togashi, Y.; Suzuki, R.; Sakata, S.; Hatano, S.; Asaka, R.; Hamanaka, W.; Ninomiya, H.; Uehara, H.; Lim Choi, Y.; Satoh, Y.; Okumura, S.; Nakagawa, K.; Mano, H.; Ishikawa, Y., RET, ROS1 and ALK fusions in lung cancer. Nat Med 2012, 18, (3), 378-81.
- Zhang, X.; Wang, B.; Wang, C.; Liao, C.; Wang, S.; Cao, R.; Ma, T.; Wang, K., Case report: A novel reciprocal ROS1-CD74 fusion in a NSCLC patient partially benefited from sequential tyrosine kinase inhibitors treatment. Front Oncol 2022, 12, 1021342.
- Cai, W.; Li, X.; Su, C.; Fan, L.; Zheng, L.; Fei, K.; Zhou, C.; Manegold, C.; Schmid-Bindert, G., ROS1 fusions in Chinese patients with non-small-cell lung cancer. Ann Oncol 2013, 24, (7), 1822-1827.
- Chen, Y. F.; Hsieh, M. S.; Wu, S. G.; Chang, Y. L.; Shih, J. Y.; Liu, Y. N.; Tsai, M. F.; Tsai, T. H.; Yu, C. J.; Yang, J. C.; Yang, P. C., Clinical and the prognostic characteristics of lung adenocarcinoma patients with ROS1 fusion in comparison with other driver mutations in East Asian populations. J Thorac Oncol 2014, 9, (8), 1171-9.
- Giménez-Capitán, A.; Sánchez-Herrero, E.; Robado de Lope, L.; Aguilar-Hernández, A.; Sullivan, I.; Calvo, V.; Moya-Horno, I.; Viteri, S.; Cabrera, C.; Aguado, C.; Armiger, N.; Valarezo, J.; Mayo-de-las-Casas, C.; Reguart, N.; Rosell, R.; Provencio, M.; Romero, A.; Molina-Vila, M. A., Detecting ALK, ROS1, and RET fusions and the METΔex14 splicing variant in liquid biopsies of non-small-cell lung cancer patients using RNA-based techniques. Molecular Oncology 2023, 17, (9), 1884-1897.
- Arai, Y.; Totoki, Y.; Takahashi, H.; Nakamura, H.; Hama, N.; Kohno, T.; Tsuta, K.; Yoshida, A.; Asamura, H.; Mutoh, M.; Hosoda, F.; Tsuda, H.; Shibata, T., Mouse model for ROS1-rearranged lung cancer. PLoS One 2013, 8, (2), e56010.
- Nakano, Y.; Tomiyama, A.; Kohno, T.; Yoshida, A.; Yamasaki, K.; Ozawa, T.; Fukuoka, K.; Fukushima, H.; Inoue, T.; Hara, J.; Sakamoto, H.; Ichimura, K., Identification of a novel KLC1–ROS1 fusion in a case of pediatric low-grade localized glioma. Brain Tumor Pathology 2019, 36, (1), 14-19.
- Puno, M. R.; Lima, C. D., Structural basis for RNA surveillance by the human nuclear exosome targeting (NEXT) complex. Cell 2022, 185, (12), 2132-2147.e26.
- Iyer, S. R.; Nusser, K.; Jones, K.; Shinde, P.; Keddy, C.; Beach, C. Z.; Aguero, E.; Force, J.; Shinde, U.; Davare, M. A., Discovery of oncogenic ROS1 missense mutations with sensitivity to tyrosine kinase inhibitors. EMBO Mol Med 2023, 15, (10), e17367.
- Roskoski, R., Jr., ROS1 protein-tyrosine kinase inhibitors in the treatment of ROS1 fusion protein-driven non-small cell lung cancers. Pharmacol Res 2017, 121, 202-212.
- Xu, X.; Li, Y.; Xu, R.; Meng, Y.; Li, Z.; Zuo, D.; Wu, Y., CD74–ROS1 L2026M mutant enhances autophagy through the MEK/ERK pathway to promote invasion, metastasis and crizotinib resistance in non-small cell lung cancer cells. The FEBS Journal 2024, 291, (6), 1199-1219.
- Gou, W.; Zhou, X.; Liu, Z.; Wang, L.; Shen, J.; Xu, X.; Li, Z.; Zhai, X.; Zuo, D.; Wu, Y., CD74-ROS1 G2032R mutation transcriptionally up-regulates Twist1 in non-small cell lung cancer cells leading to increased migration, invasion, and resistance to crizotinib. Cancer Letters 2018, 422, 19-28.
- Sun, R.; Meng, Y.; Xu, R.; Li, Y.; Xu, X.; Li, Z.; Zuo, D., Construction of crizotinib resistant models with CD74-ROS1 D2033N and CD74-ROS1 S1986F point mutations to explore resistance mechanism and treatment strategy. Cellular Signalling 2023, 101, 110497.
- Hong, W. C.; Lee, D. E.; Kang, H. W.; Kim, M. J.; Kim, M.; Kim, J. H.; Fang, S.; Kim, H. J.; Park, J. S., CD74 Promotes a Pro-Inflammatory Tumor Microenvironment by Inducing S100A8 and S100A9 Secretion in Pancreatic Cancer. International Journal of Molecular Sciences 2023, 24, (16), 12993.
- Tanese, K.; Hashimoto, Y.; Berkova, Z.; Wang, Y.; Samaniego, F.; Lee, J. E.; Ekmekcioglu, S.; Grimm, E. A., Cell Surface CD74-MIF Interactions Drive Melanoma Survival in Response to Interferon-γ. J Invest Dermatol 2015, 135, (11), 2775-2784.
- Li, J.; Lan, T.; Zhang, C.; Zeng, C.; Hou, J.; Yang, Z.; Zhang, M.; Liu, J.; Liu, B., Reciprocal activation between IL-6/STAT3 and NOX4/Akt signalings promotes proliferation and survival of non-small cell lung cancer cells. Oncotarget 2015, 6, (2), 1031-48.
- Ranganathan, V.; Ciccia, F.; Zeng, F.; Sari, I.; Guggino, G.; Muralitharan, J.; Gracey, E.; Haroon, N., Macrophage Migration Inhibitory Factor Induces Inflammation and Predicts Spinal Progression in Ankylosing Spondylitis. Arthritis Rheumatol 2017, 69, (9), 1796-1806.
- Gu, Y.; Mohammad, I. S.; Liu, Z., Overview of the STAT-3 signaling pathway in cancer and the development of specific inhibitors. Oncol Lett 2020, 19, (4), 2585-2594.
- Braicu, C.; Buse, M.; Busuioc, C.; Drula, R.; Gulei, D.; Raduly, L.; Rusu, A.; Irimie, A.; Atanasov, A. G.; Slaby, O.; Ionescu, C.; Berindan-Neagoe, I., A Comprehensive Review on MAPK: A Promising Therapeutic Target in Cancer. Cancers (Basel) 2019, 11, (10).
- Jun, H. J.; Johnson, H.; Bronson, R. T.; de Feraudy, S.; White, F.; Charest, A., The oncogenic lung cancer fusion kinase CD74-ROS activates a novel invasiveness pathway through E-Syt1 phosphorylation. Cancer Res 2012, 72, (15), 3764-74.
- Chaturvedi, L. S.; Marsh, H. M.; Basson, M. D., Src and focal adhesion kinase mediate mechanical strain-induced proliferation and ERK1/2 phosphorylation in human H441 pulmonary epithelial cells. Am J Physiol Cell Physiol 2007, 292, (5), C1701-13.
- De Kock, L.; Freson, K., The (Patho)Biology of SRC Kinase in Platelets and Megakaryocytes. Medicina (Kaunas) 2020, 56, (12).
- Yang, W. S.; Caliva, M. J.; Khadka, V. S.; Tiirikainen, M.; Matter, M. L.; Deng, Y.; Ramos, J. W., RSK1 and RSK2 serine/threonine kinases regulate different transcription programs in cancer. Front Cell Dev Biol 2022, 10, 1015665.
- Hu, C.; Yang, J.; Qi, Z.; Wu, H.; Wang, B.; Zou, F.; Mei, H.; Liu, J.; Wang, W.; Liu, Q., Heat shock proteins: Biological functions, pathological roles, and therapeutic opportunities. MedComm (2020) 2022, 3, (3), e161.
- Pedone, E.; Marucci, L., Role of β-Catenin Activation Levels and Fluctuations in Controlling Cell Fate. Genes 2019, 10, (2), 176.
- Shang, S.; Hua, F.; Hu, Z. W., The regulation of β-catenin activity and function in cancer: therapeutic opportunities. Oncotarget 2017, 8, (20), 33972-33989.
- Wisdom, R.; Johnson, R. S.; Moore, C., c--Jun regulates cell cycle progression and apoptosis by distinct mechanisms. The EMBO Journal 1999, 18, (1), 188-197.
- Jun, H. J.; Roy, J.; Smith, T. B.; Wood, L. B.; Lane, K.; Woolfenden, S.; Punko, D.; Bronson, R. T.; Haigis, K. M.; Breton, S.; Charest, A., ROS1 signaling regulates epithelial differentiation in the epididymis. Endocrinology 2014, 155, (9), 3661-73.
- Steven, A.; Seliger, B., Control of CREB expression in tumors: from molecular mechanisms and signal transduction pathways to therapeutic target. Oncotarget 2016, 7, (23), 35454-65.
- Wang, L.; Li, J.; Di, L. J., Glycogen synthesis and beyond, a comprehensive review of GSK3 as a key regulator of metabolic pathways and a therapeutic target for treating metabolic diseases. Med Res Rev 2022, 42, (2), 946-982.
- Piazzi, M.; Bavelloni, A.; Faenza, I.; Blalock, W., Glycogen synthase kinase (GSK)-3 and the double-strand RNA-dependent kinase, PKR: When two kinases for the common good turn bad. Biochim Biophys Acta Mol Cell Res 2020, 1867, (10), 118769.
- Qu, Z.; Sun, F.; Zhou, J.; Li, L.; Shapiro, S. D.; Xiao, G., Interleukin-6 Prevents the Initiation but Enhances the Progression of Lung Cancer. Cancer Res 2015, 75, (16), 3209-15.
- Neel, D. S.; Allegakoen, D. V.; Olivas, V.; Mayekar, M. K.; Hemmati, G.; Chatterjee, N.; Blakely, C. M.; McCoach, C. E.; Rotow, J. K.; Le, A.; Karachaliou, N.; Rosell, R.; Riess, J. W.; Nichols, R.; Doebele, R. C.; Bivona, T. G., Differential Subcellular Localization Regulates Oncogenic Signaling by ROS1 Kinase Fusion Proteins. Cancer Res 2019, 79, (3), 546-556.
- Ye, J.; Coulouris, G.; Zaretskaya, I.; Cutcutache, I.; Rozen, S.; Madden, T. L., Primer-BLAST: a tool to design target-specific primers for polymerase chain reaction. BMC Bioinformatics 2012, 13, 134.
- Langmead, B.; Salzberg, S. L., Fast gapped-read alignment with Bowtie 2. Nat Methods 2012, 9, (4), 357-9.
- Liao, Y.; Smyth, G. K.; Shi, W., featureCounts: an efficient general purpose program for assigning sequence reads to genomic features. Bioinformatics 2014, 30, (7), 923-30.
- Simon, A., FastQC: a quality control tool for high throughput sequence data. Version 0.10 2010, 1.
- Love, M. I.; Huber, W.; Anders, S., Moderated estimation of fold change and dispersion for RNA-seq data with DESeq2. Genome Biol 2014, 15, (12), 550.
- Pedregosa, F.; Varoquaux, G.; Gramfort, A.; Michel, V.; Thirion, B.; Grisel, O.; Blondel, M.; Prettenhofer, P.; Weiss, R.; Dubourg, V., Scikit-learn: Machine learning in Python. the Journal of machine Learning research 2011, 12, 2825-2830.
Figure 1.
Illustration of CD74-ROS1 variants used in this study. ICD: intracellular domain, ECD: extracellular domain, EXT: N-terminal extension, TM: transmembrane domain, CLIP: class II-associated invariant chain peptide, TD: trimeric domain, KD: kinase domain.
Figure 1.
Illustration of CD74-ROS1 variants used in this study. ICD: intracellular domain, ECD: extracellular domain, EXT: N-terminal extension, TM: transmembrane domain, CLIP: class II-associated invariant chain peptide, TD: trimeric domain, KD: kinase domain.
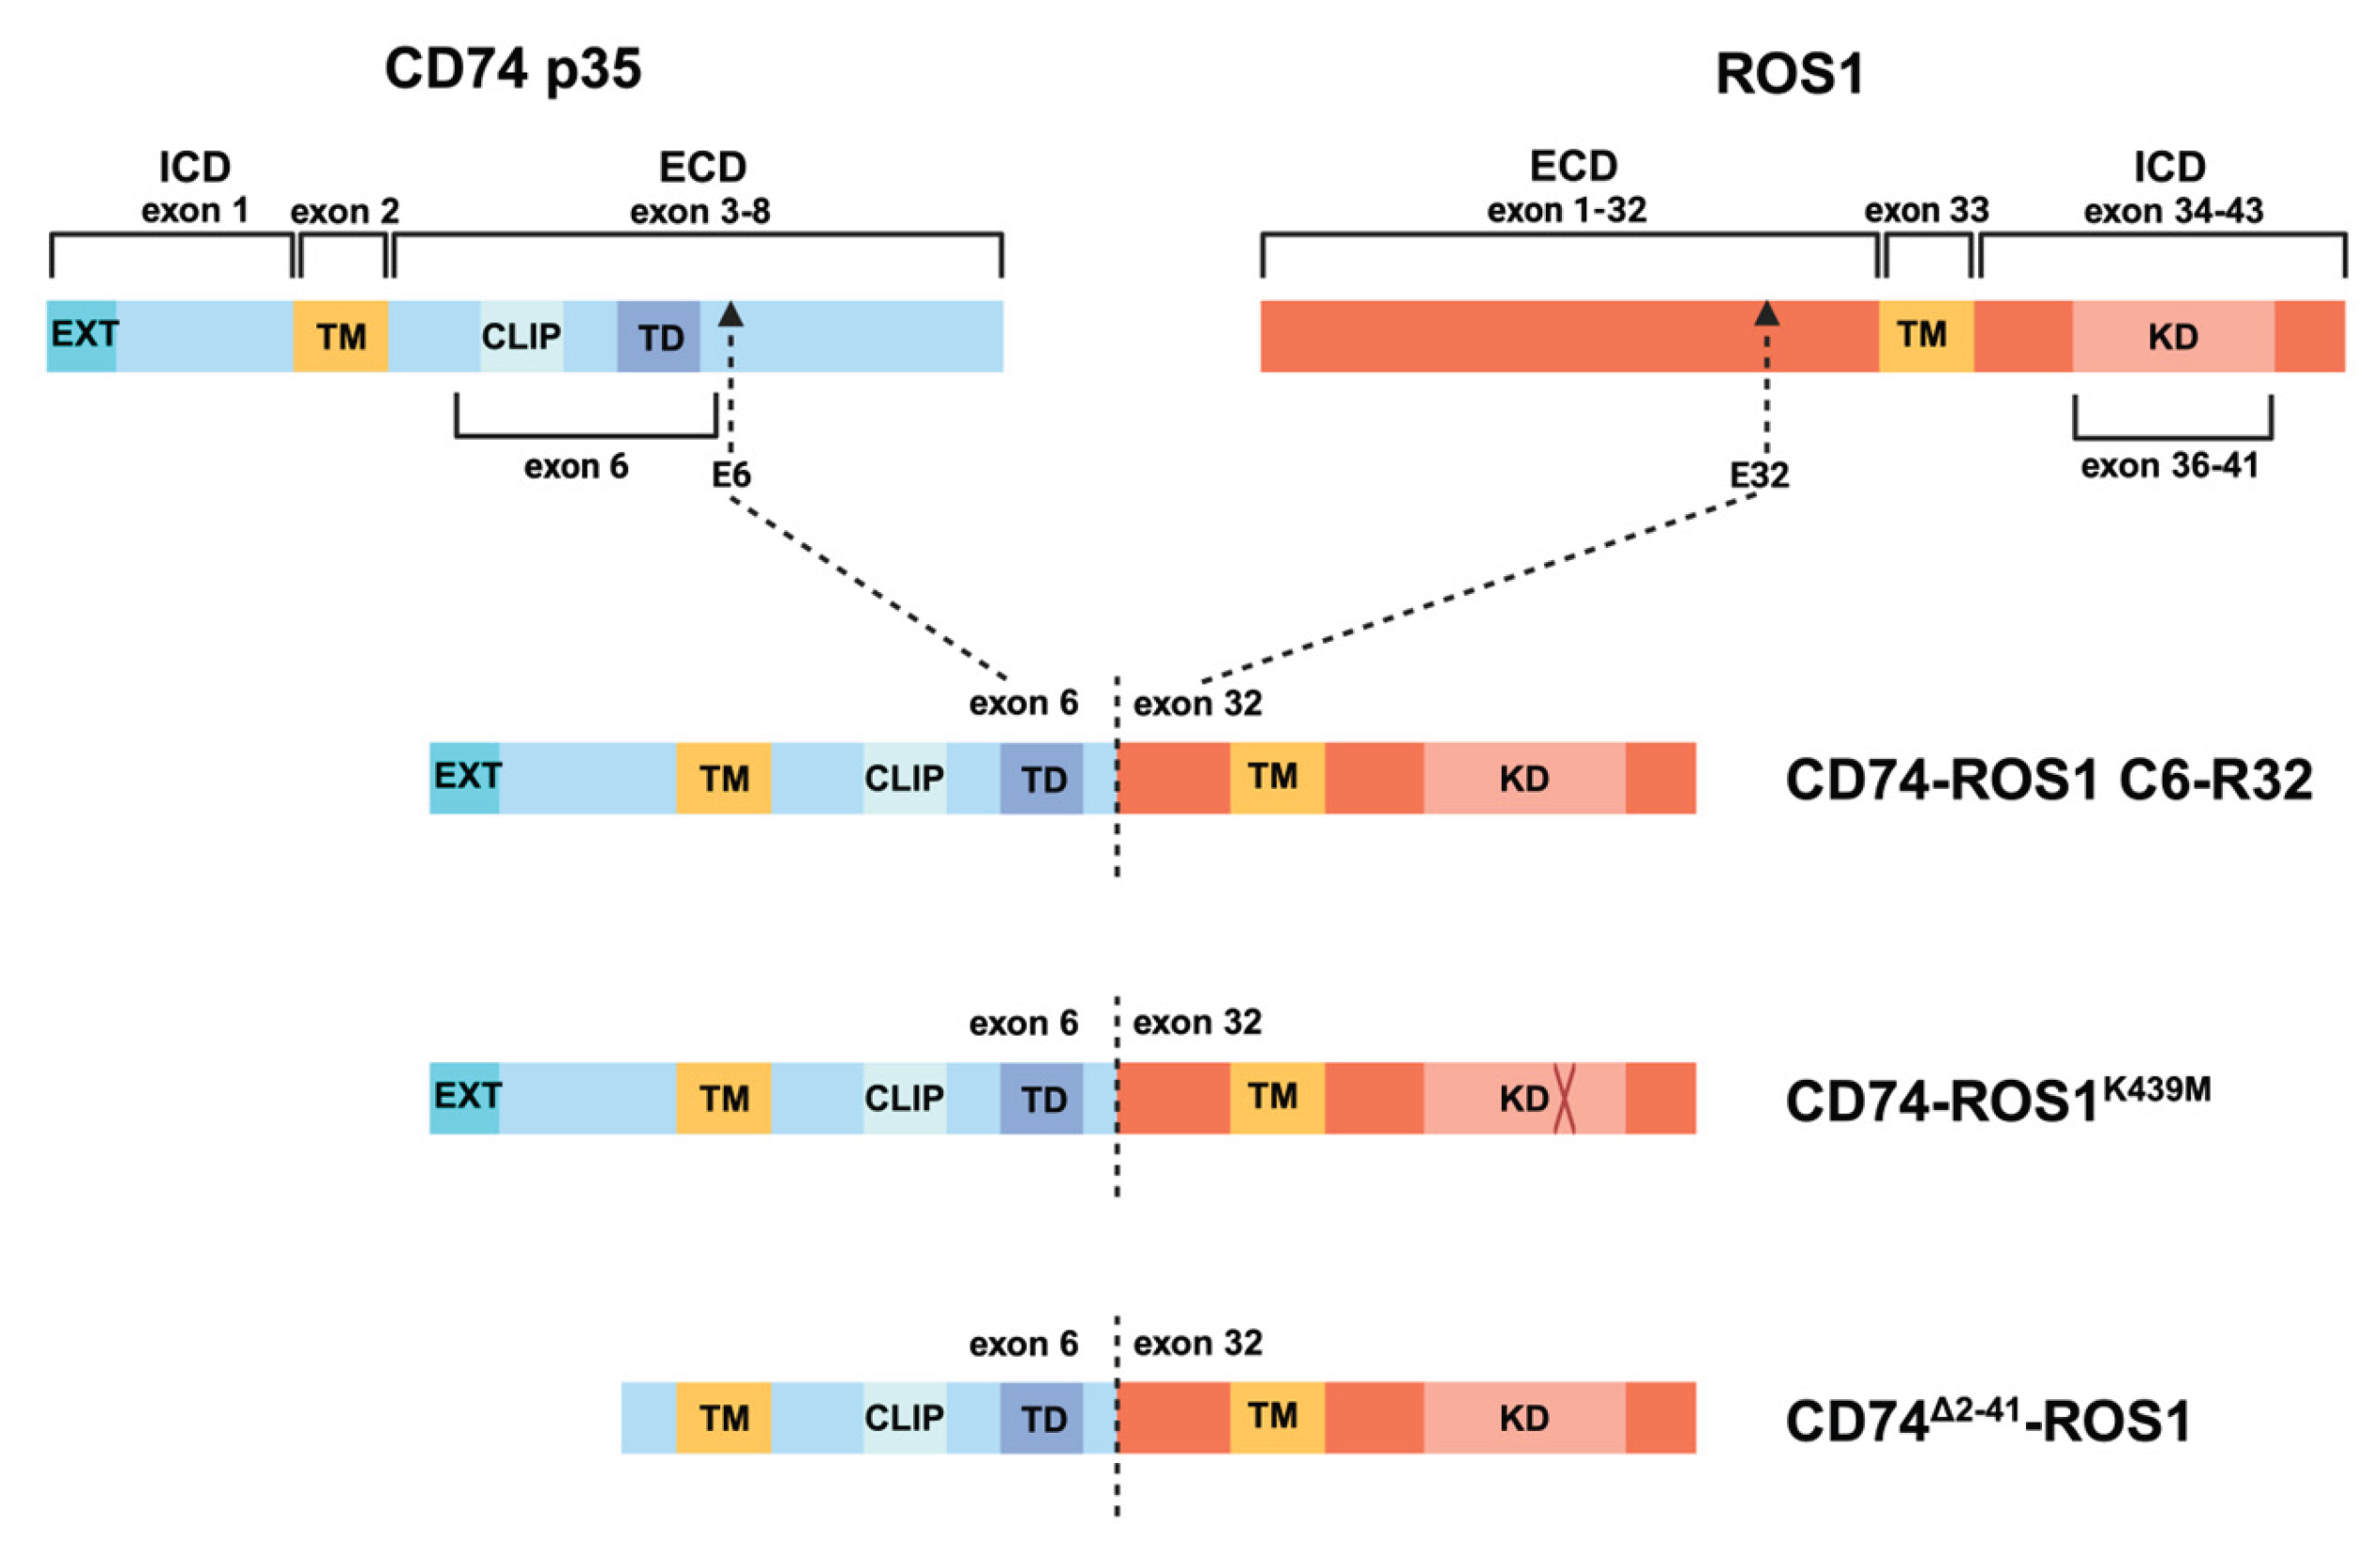
Figure 2.
UpSet plots showing the intersections of genes classified as (A) differentially or (B) equivalently expressed between pairwise comparisons of A549, CD74-ROS1, CD74Δ2-41-ROS1, and CD74-ROS1ᴷ⁴³⁹ᴹ. Horizontal bars indicate the total number of differentially (top) or equivalently (bottom) expressed genes identified in each comparison. Vertical bars represent the number of genes shared among the corresponding comparisons, with black filled circles denoting which comparisons are included in each intersection. A single filled circle indicates genes found to be significant in only that comparison.
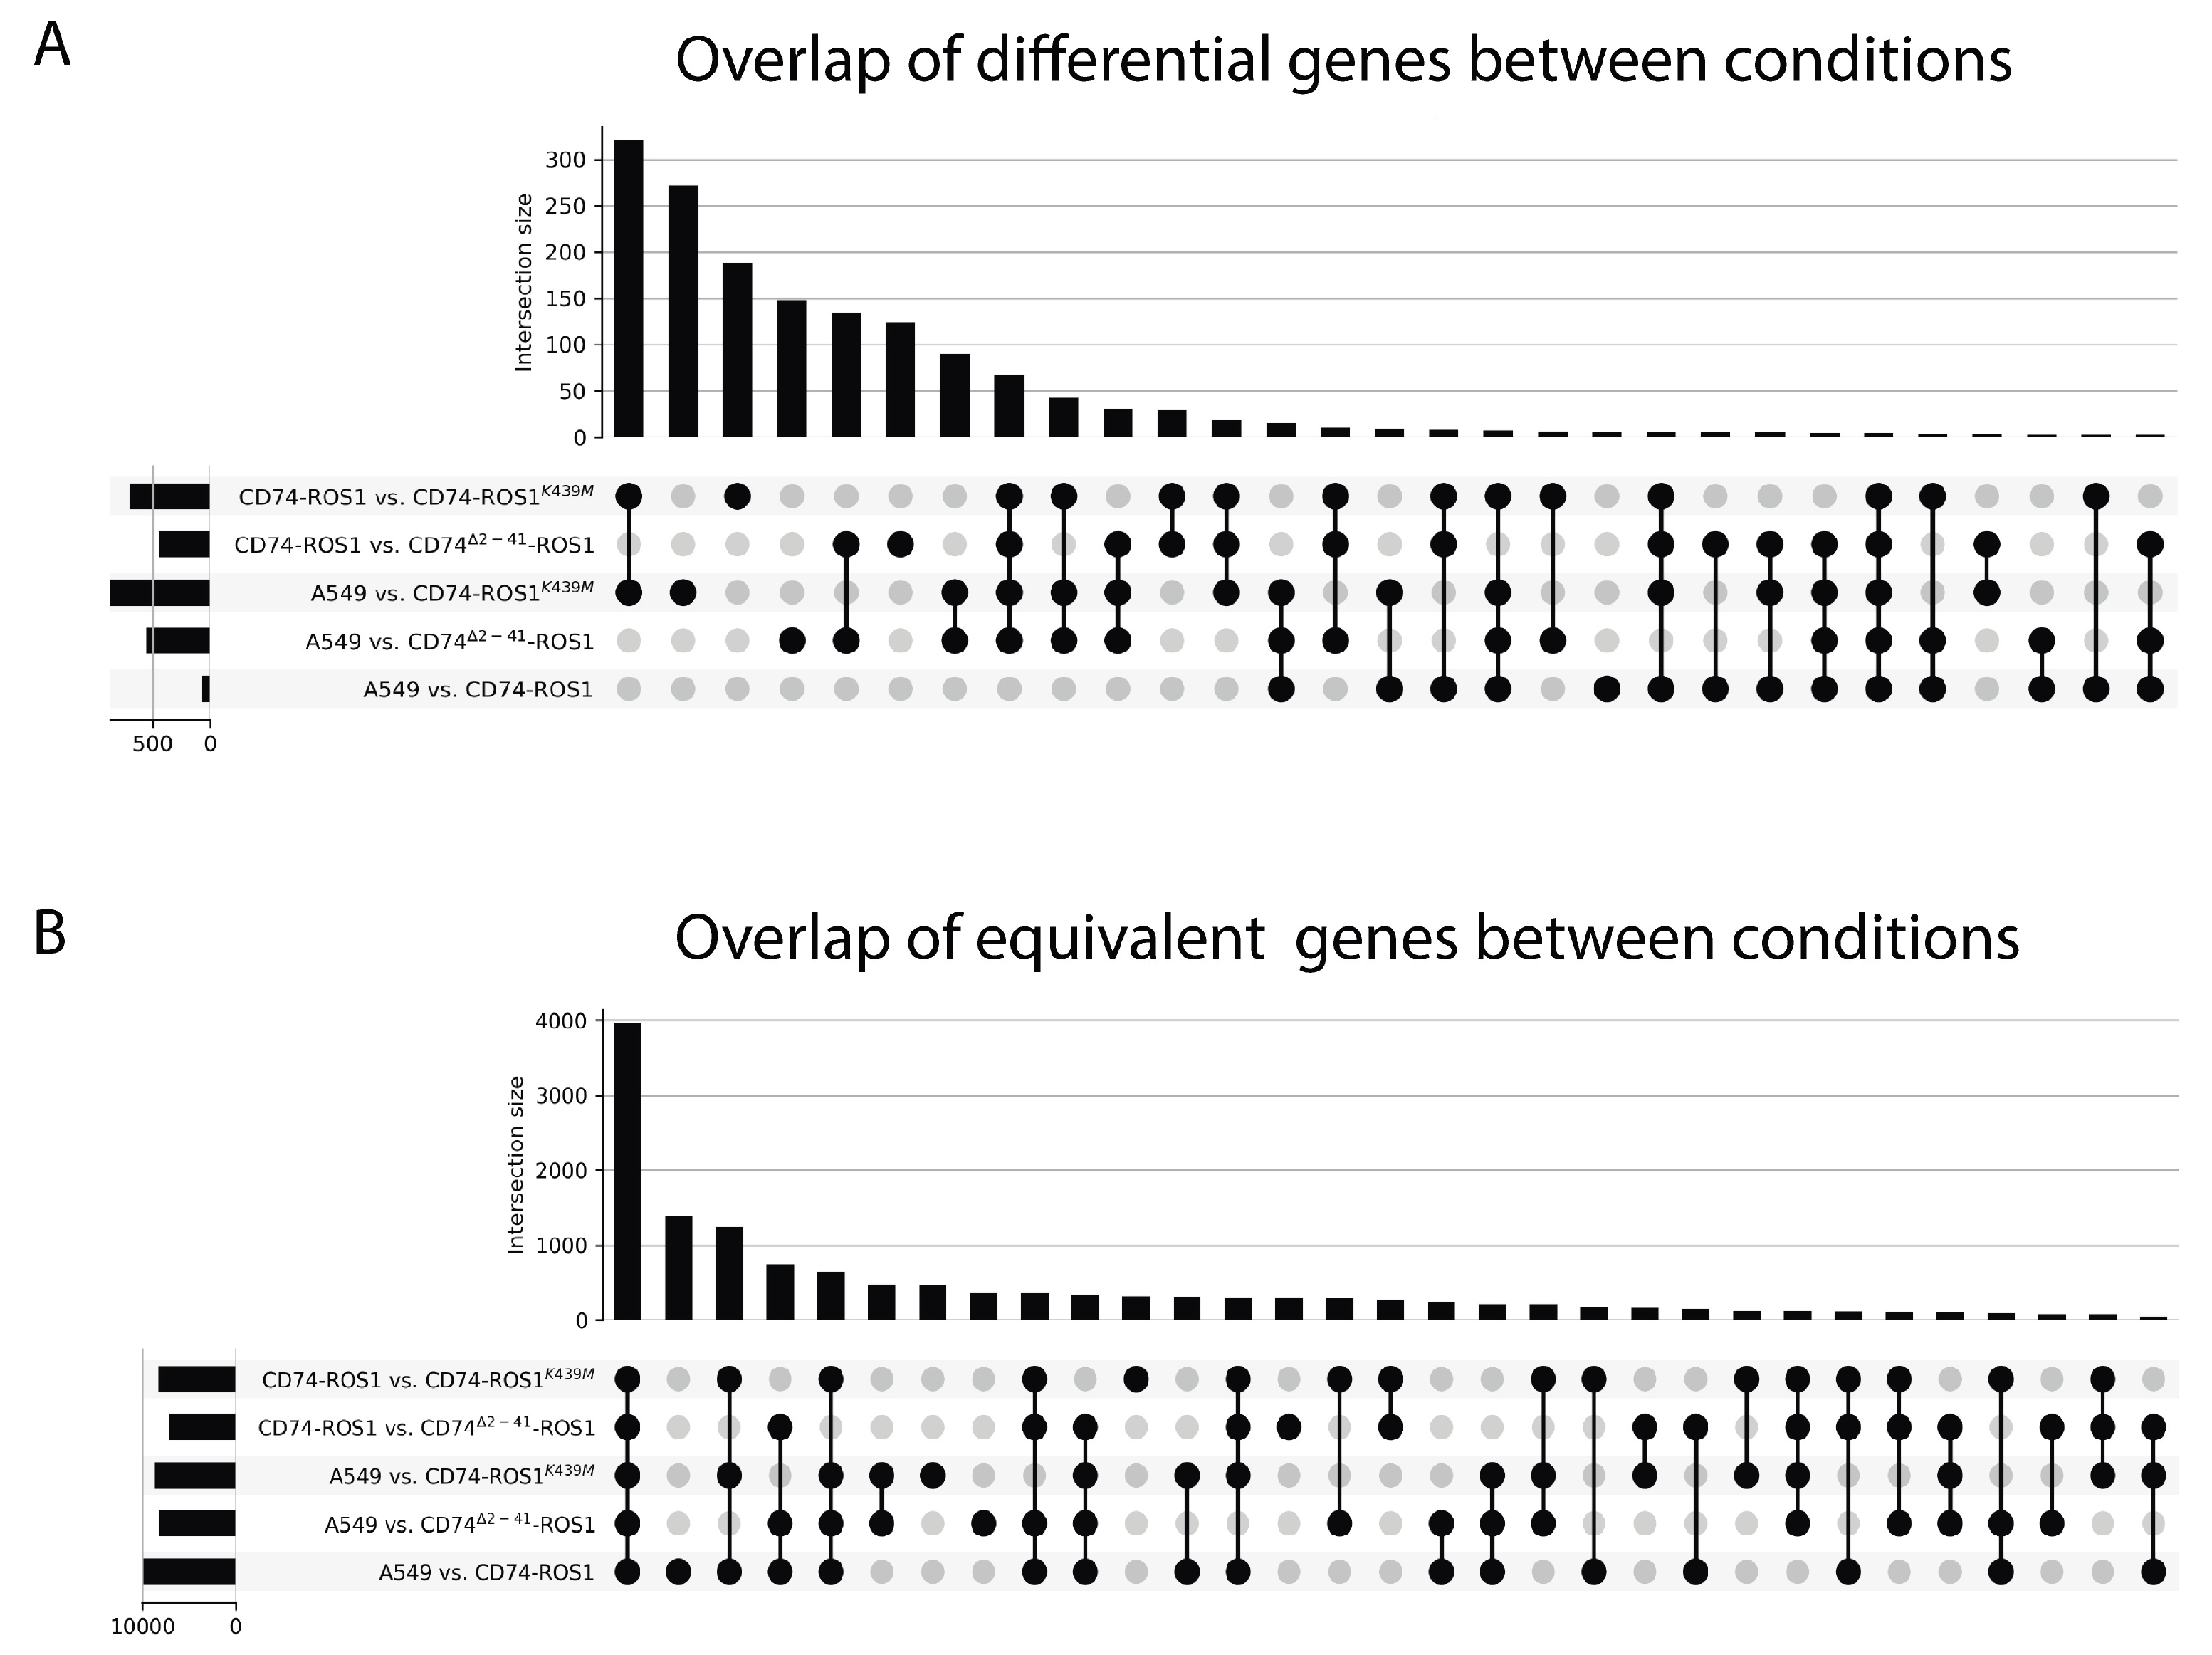
Figure 3.
Heatmap of the 62 DEGs identified from the pairwise analysis between A459 and CD74-ROS1. The normalized expression level of each gene is examined across the four groups. For clarity, the y-axes show the 62 genes divided equally between the two sides of the map (31 genes on each side). The x-axis presents the four groups included in our study. The numbers 1-3, shown next to each group, indicate the number of biological replicates. Dark blue (scale point 0) and light yellow (scale point 1) demonstrate low expression and high expression, respectively.
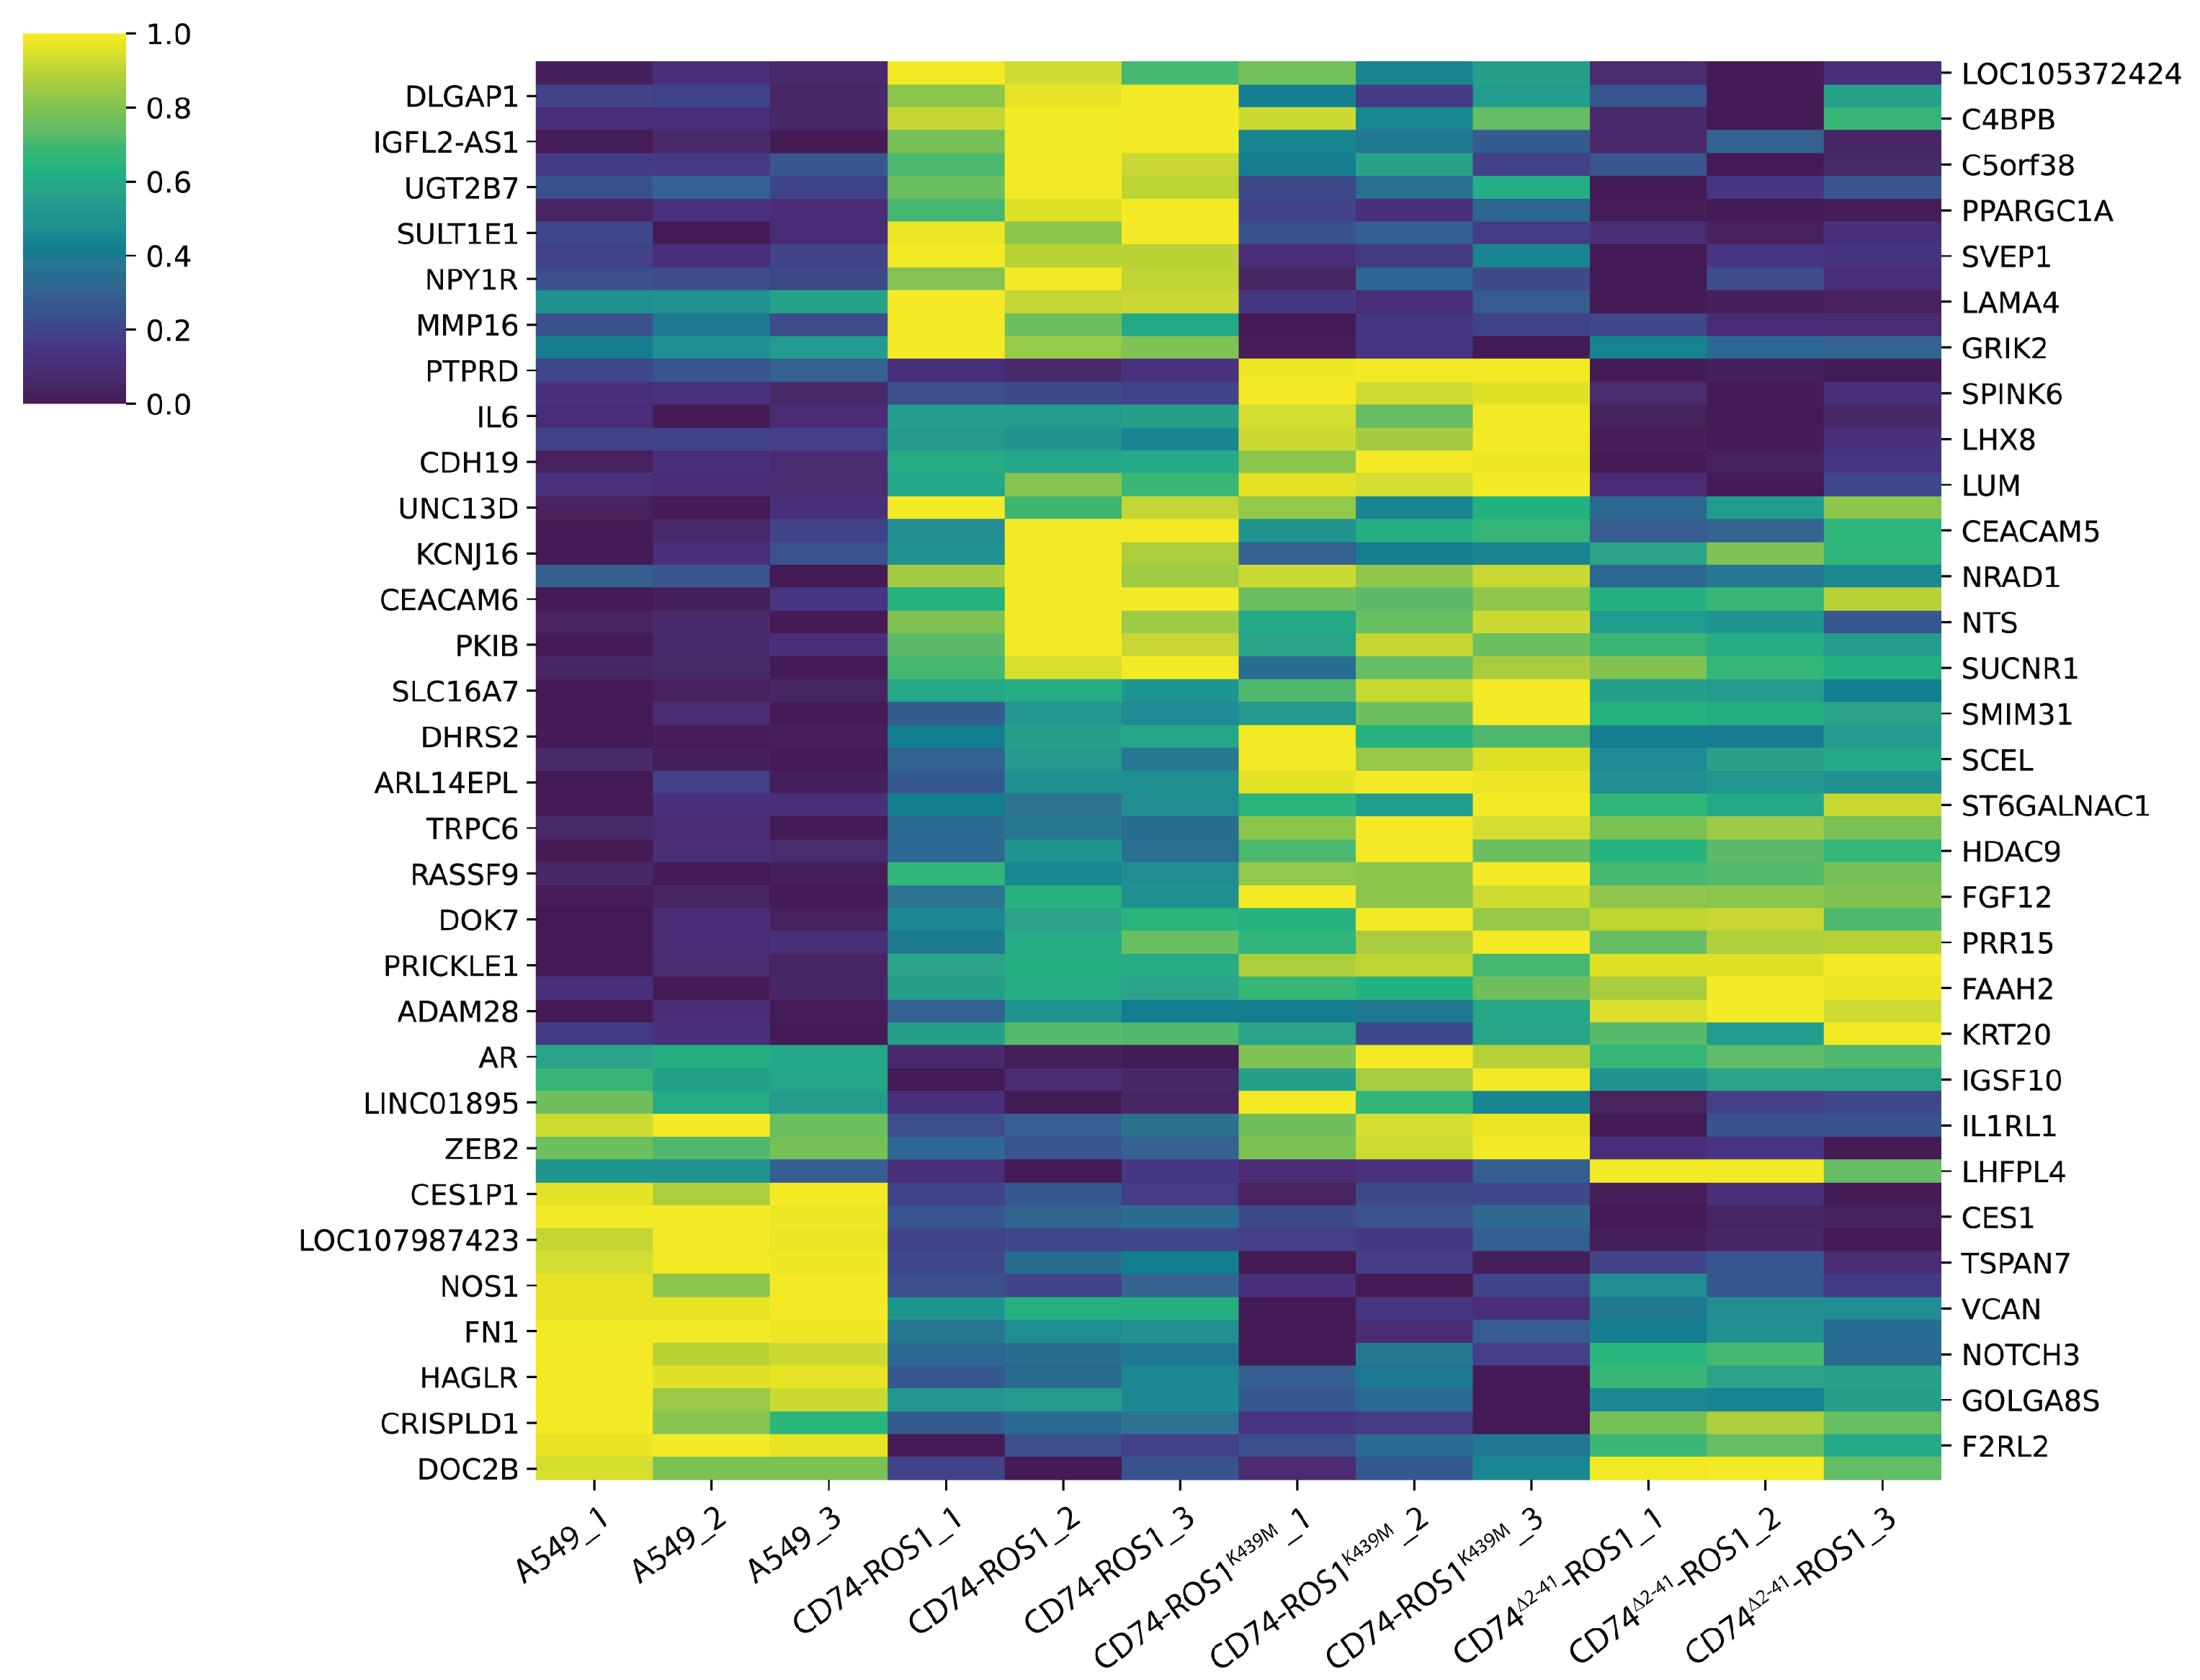
Figure 4.
Impact of CD74Δ2–41-ROS1 and CD74-ROS1K439M mutations on the expression of the 62 DEGs. A) Mutation of either CD74 or ROS1 alters the expression profiles of the 62 genes, shifting them toward patterns observed in either A549 or CD74-ROS1 expressing cells. The numbers within each box indicate the number of genes grouped within that cluster. The color scale represents the degree of gene clustering, with black and cream indicating low and high gene clustering, respectively. B) CD74- and ROS1-induced genes.
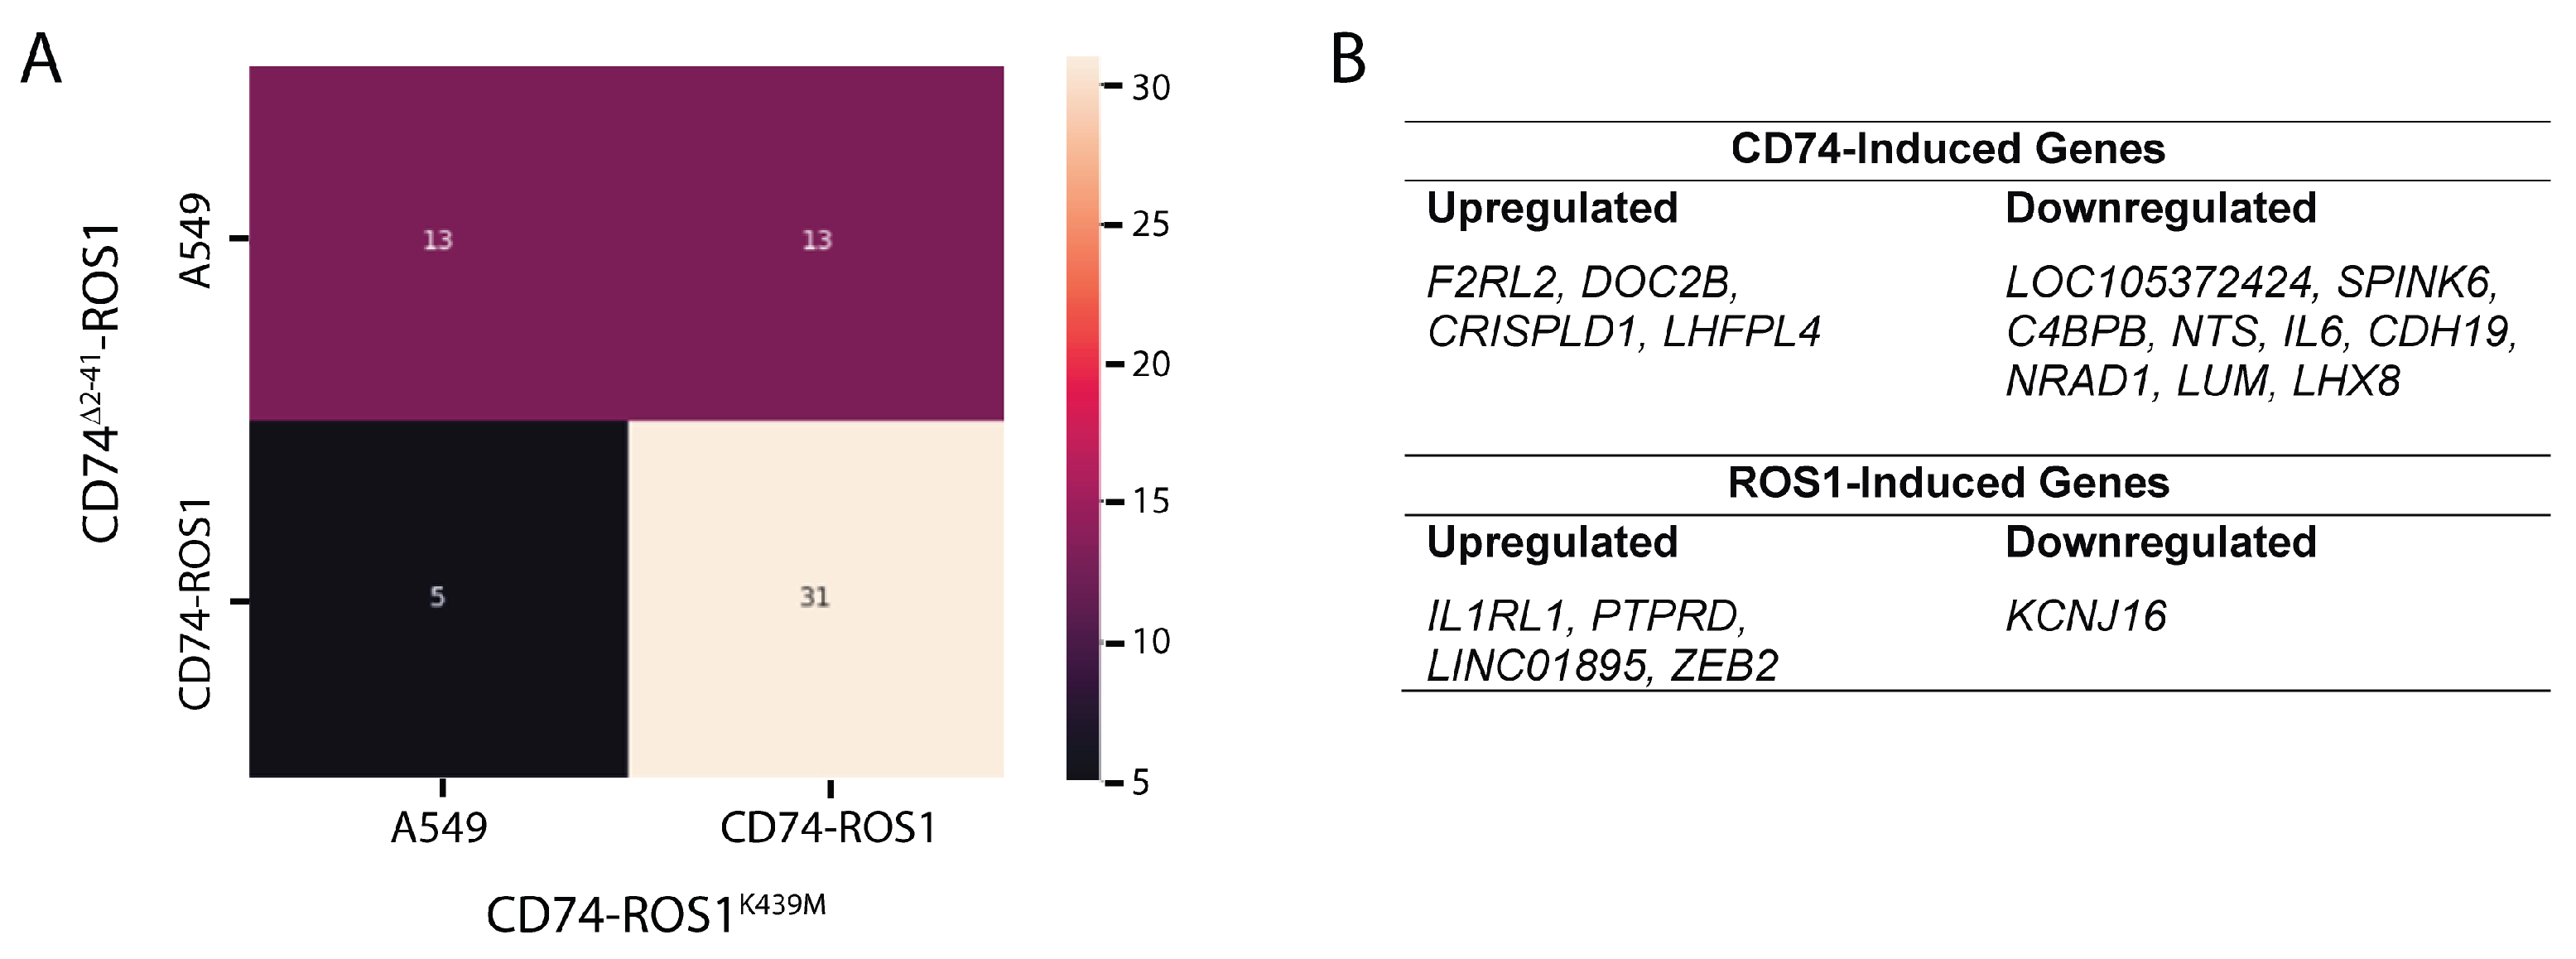
Figure 5.
Phospho-kinase array of A549 and CD74-ROS1 variants. For clarity, the phospho-kinase data were divided into three groups: A) A549 and CD74-ROS1, B) A549, CD74-ROS1, and CD74Δ2–41-ROS1, and C) A549, CD74-ROS1, and CD74-ROS1K439M. Proteins demonstrating noticeable changes across the samples are highlighted with different colors on the membranes (left). C stands for control. The mean pixel densities of these proteins were quantitated and plotted on bar charts (right).
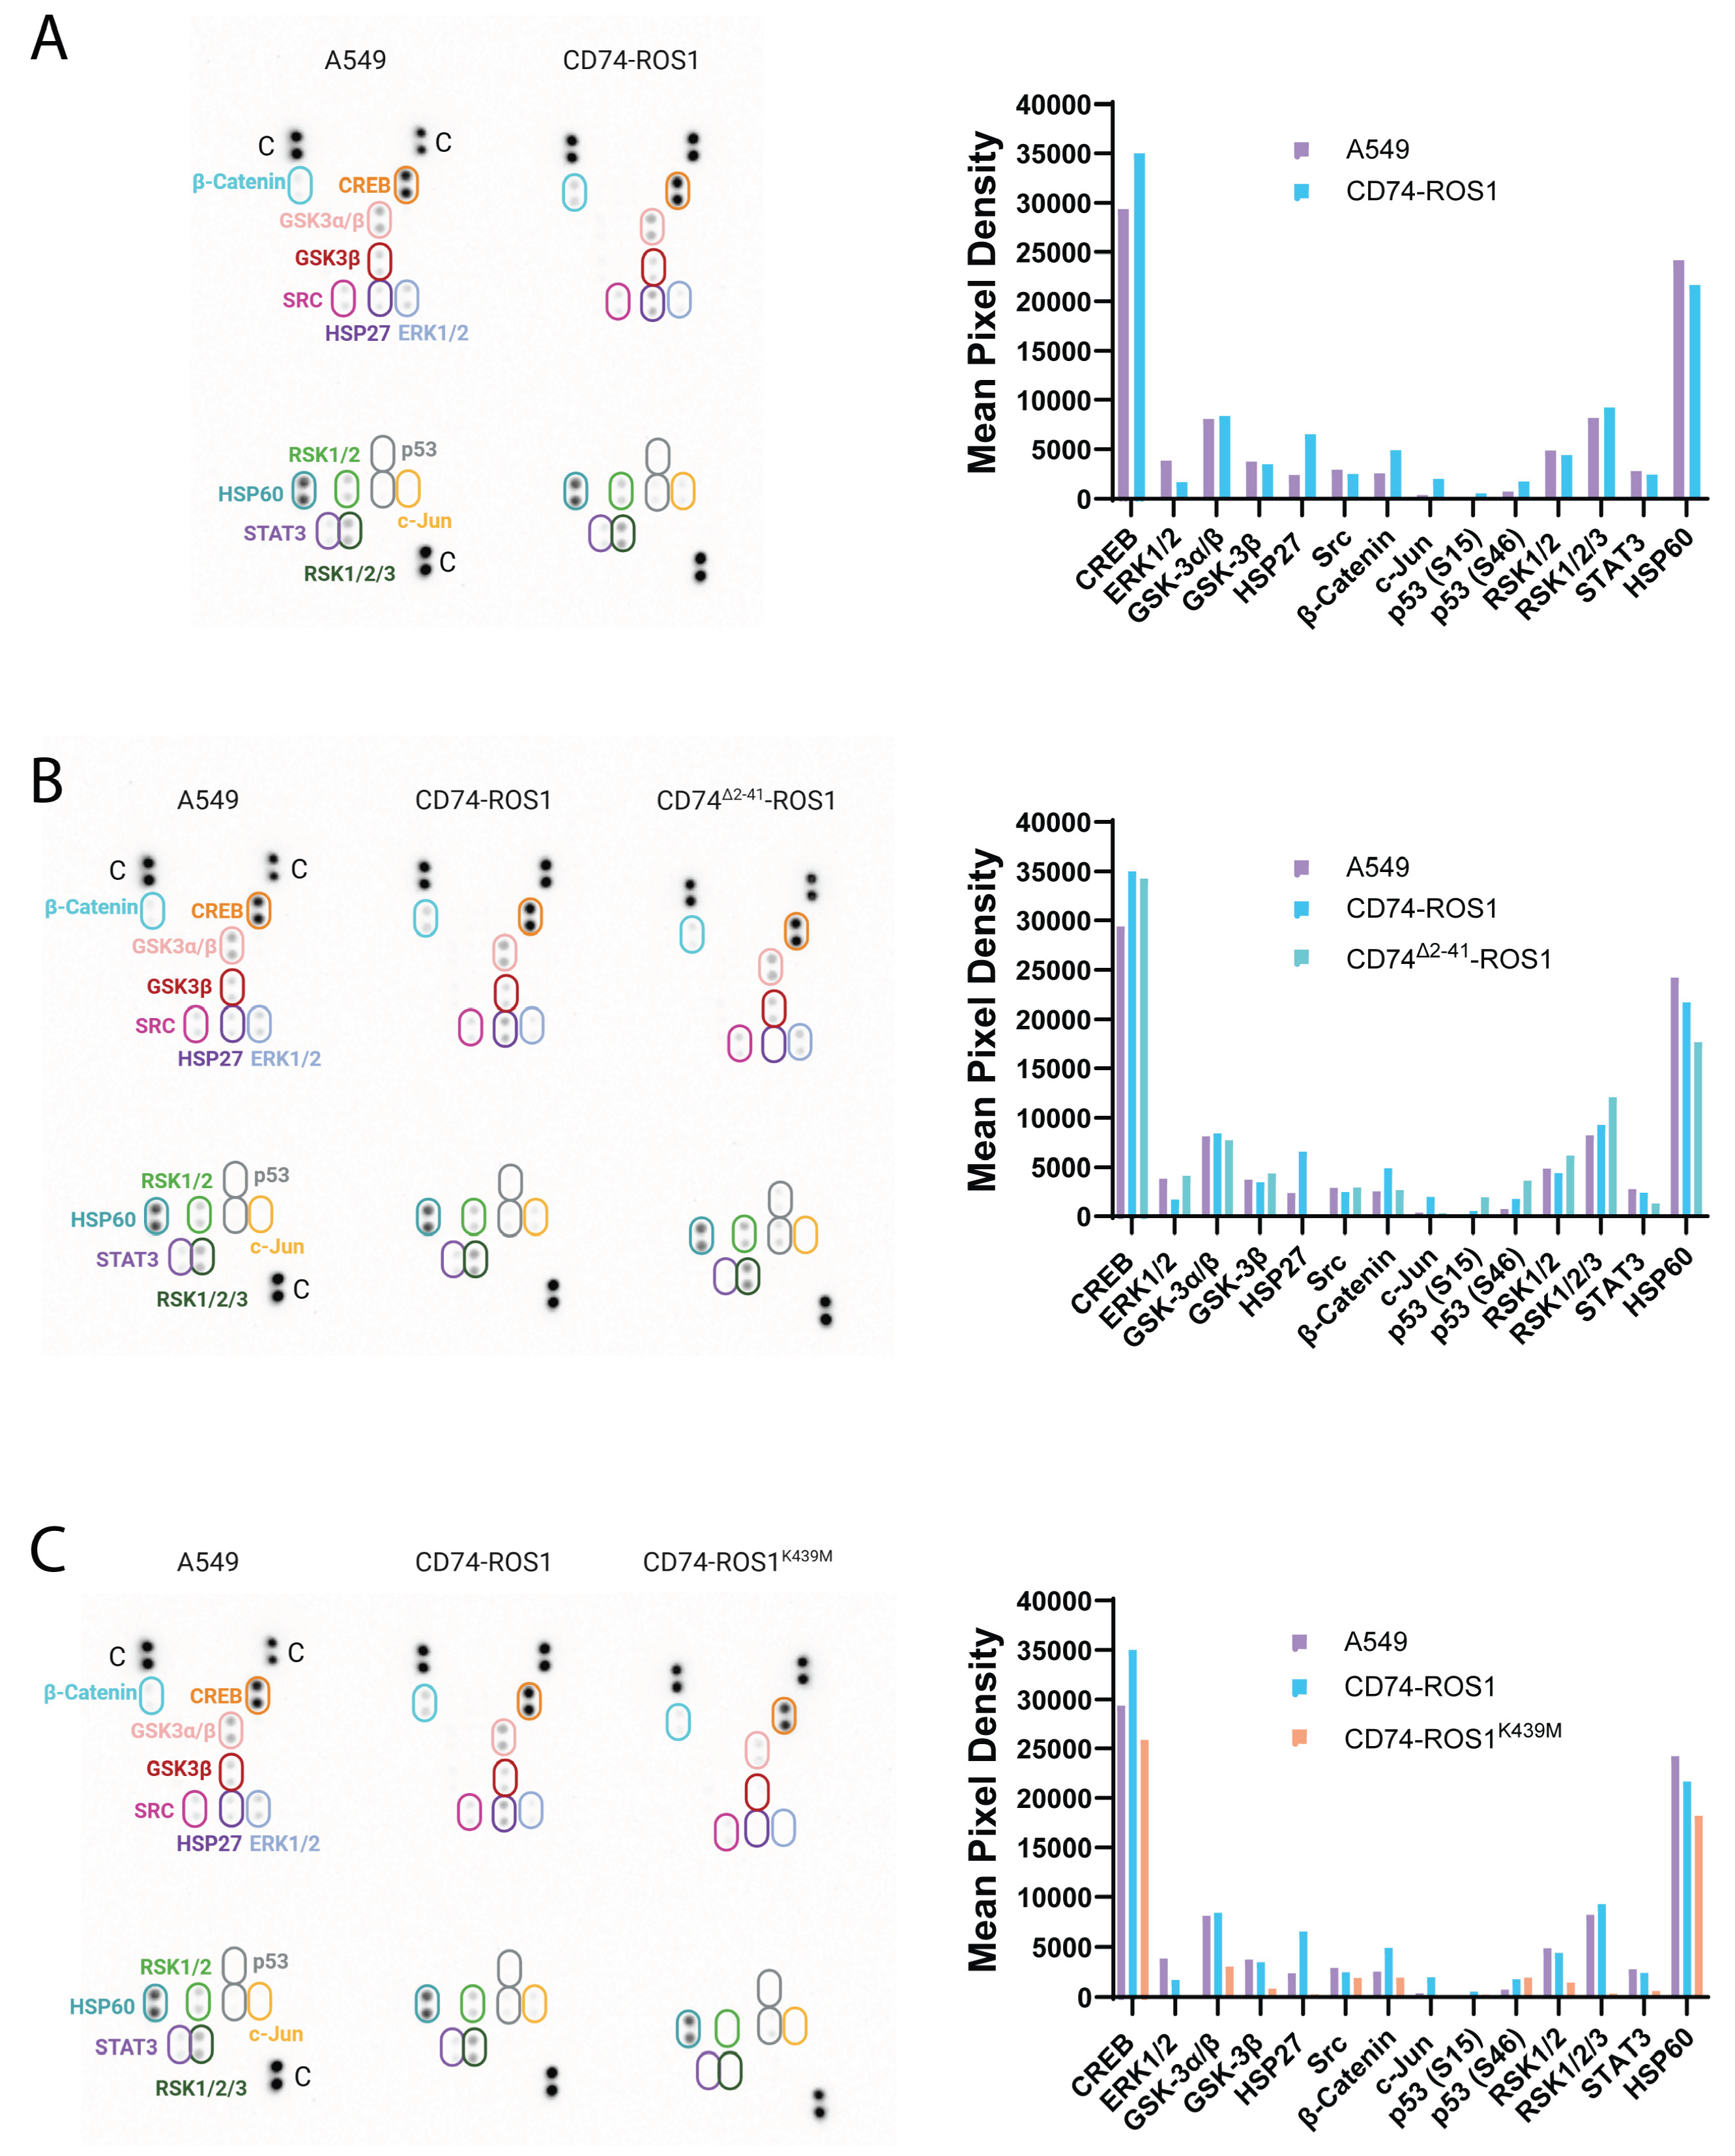
Figure 6.
Venn diagram illustrating the distribution of phospho-kinase results as CD74- or ROS1-mediated signaling pathways.
Figure 6.
Venn diagram illustrating the distribution of phospho-kinase results as CD74- or ROS1-mediated signaling pathways.
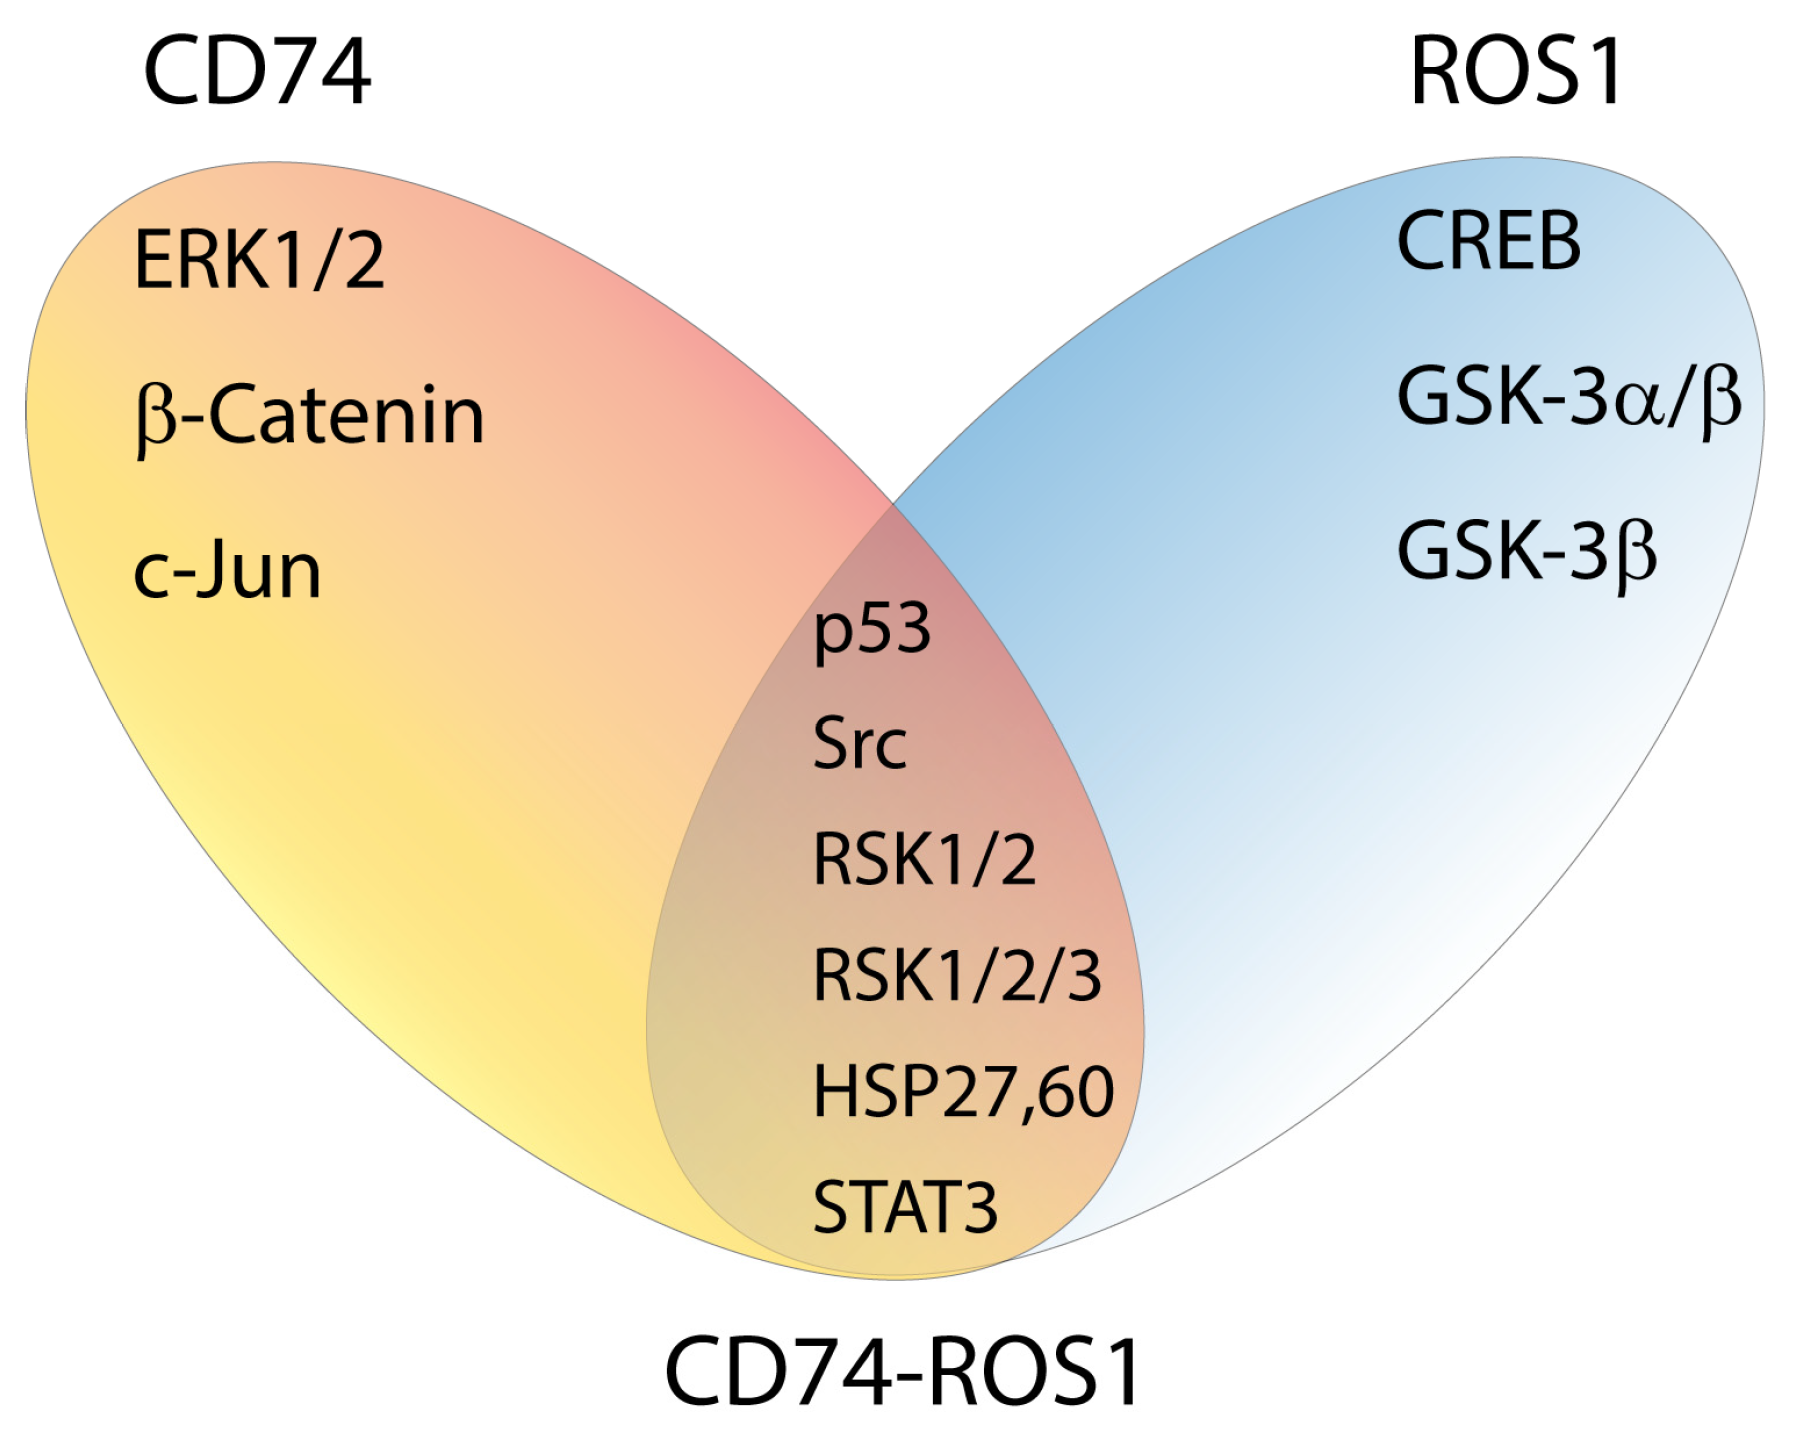
Figure 7.
Cellular fate of CD74-ROS1 signaling cascades, according to the CD74-ROS1 phospho-kinase array. Proteins are shown in ovals. ‘P’ indicates phosphorylated proteins detected by the array (total protein detected for β-Catenin and HSP60). Dashed arrows (⇣) point to proteins lacking array-confirmed intermediate signaling events. Solid arrows (↓) indicate literature-confirmed intermediate signaling events and activation. Flatheads (⊥) indicate an inhibitory effect. Kinases are depicted in orange circles. Transcription factors are depicted in green circles. Remaining proteins are shown in grey circles.
Disclaimer/Publisher’s Note: The statements, opinions and data contained in all publications are solely those of the individual author(s) and contributor(s) and not of MDPI and/or the editor(s). MDPI and/or the editor(s) disclaim responsibility for any injury to people or property resulting from any ideas, methods, instructions or products referred to in the content. |
© 2025 by the authors. Licensee MDPI, Basel, Switzerland. This article is an open access article distributed under the terms and conditions of the Creative Commons Attribution (CC BY) license (http://creativecommons.org/licenses/by/4.0/).
Copyright: This open access article is published under a Creative Commons CC BY 4.0 license, which permit the free download, distribution, and reuse, provided that the author and preprint are cited in any reuse.


