
Submitted:
06 November 2025
Posted:
07 November 2025
You are already at the latest version
Abstract
Submerged macrophytes play a vital role in regulating carbon and nitrogen cycling in aquatic ecosystems; however, their effects on greenhouse gas (GHG) emissions in aquaculture sys-tems remain poorly understood. This study quantified methane (CH₄) and nitrous oxide (N₂O) fluxes after planting Hydrilla verticillata (HV), Elodea nuttallii (EN), and Vallisneria natans (VN) in Eriocheir sinensis tanks to elucidate emission dynamics and identify low carbon management strategies. Compared with unvegetated controls, vegetated treatments signifi-cantly enhanced CH₄ emissions, with CH₄ contributing over 97% of the global warming po-tential (GWP). The overall GWP values were in the order HV > VN > EN > CK (control), in-dicating that V. natans had the lowest GWP value among all macrophyte treatments. Mecha-nistically, nitrogen availability and redox conditions jointly regulated GHG fluxes, while differences in aerenchyma development, root exudation, and algal attachment explained the observed species-specific variation. These findings suggest that optimizing plant composition, particularly through the introduction of V. natans or species with similar ecological traits, can effectively mitigate GHG emissions in crab aquaculture. Moreover, the identified mechanisms provide new insights into methane regulation in vegetated wetlands, supporting broader de-carbonization strategies for aquatic ecosystems.
Keywords:
submerged macrophytes
; Eriocheir sinensis
; greenhouse gas
; global warming potential
; aquaculture
1. Introduction
Global warming, primarily driven by increasing concentrations of greenhouse gases (GHG), poses an urgent environmental challenge. While carbon dioxide (CO2) dominates anthropogenic emissions, methane (CH4) and nitrous oxide (N2O) exert disproportionately large climate forcing effects on centennial timescales (GWP100 ≈ 28 for CH4 and ≈ 265 for N2O), thus requiring targeted quantification of their emission sources [1]. Recent syntheses have shown that inland and coastal aquatic systems are important and spatially heterogeneous contributors to the global CH4 and N2O budgets [2,3,4,5]. These findings highlight the importance of conducting system-specific investigations to explore the mechanisms of GHG production and flux control in aquatic environments [6,7].
Submerged macrophytes exert various mechanisms to control the dynamics of aquatic GHG. Oxygen released from their roots and photosynthetic can elevate the redox potential of sediments, inhibiting anaerobic methanogenesis and promoting aerobic CH4 oxidation [8]. Conversely, macrophytes also supply readily decomposable organic carbon, providing energy for methanogenesis and heterotrophic respiration [9]. Their aerenchymatous tissues facilitate plant-mediated CH4 transport from sediments to the atmosphere, effectively bypassing oxidative layers [10]. Regarding the nitrogen cycling, alterations to the nitrification-denitrification pathways caused by macrophytes can either enhance complete denitrification to produce N2 or promote the accumulation of N2O, depending on nitrate availability and the redox microgradients. Therefore, empirical studies report contrasting effects of submerged plants; some species enhance CH4 release, while others suppress it, indicating a strong species- and environment-dependent effect [11,12].
Aquaculture ponds differ fundamentally from natural water bodies in the factors influencing GHG generation and emission pathways [13]. Intensive feeding and stocking increase the input of organic matter and nitrogen [14,15], while water exchange and sediment disturbance during management modify oxygen dynamics and substrate availability [16]. Bioturbation by cultured organisms further redistributes nutrients and organic carbon in sediments, altering redox gradients critical for methanogenesis and denitrification. Therefore, mechanistic patterns derived from lakes or wetlands cannot be directly applied to aquaculture systems, which have been identified as concentrated hotspots for CH4 and N2O emissions in regional inventories [16]. In freshwater aquaculture in China, submerged macrophytes such as Hydrilla verticillata (HV), Vallisneria natans (VN), and Elodea nuttallii (EN) are typically introduced into Eriocheir sinensis ponds to stabilize water quality and improve habitat structure. However, the effects of these plants on GHG emissions remain uncertain. While root oxygenation and enhanced redox conditions may inhibit methanogenesis and N2O formation [8], labile carbon release and plant-mediated gas transport may counteract these benefits [10]. Recent studies have shown that plant-specific traits, such as aerenchyma structure, root exudation, and epiphytic algal colonization, significantly influence CH4 and N2O fluxes [17]. Given the prevalence of strong anthropogenic influences and nutrient enrichment in aquaculture ponds, elucidating the interactions between these plant and GHG is essential for developing low-carbon management strategies.
Therefore, this study aimed to investigate the effects of different submerged macrophytes (H. verticillata, V. natans, and E. nuttallii) on CH4 and N2O emissions in an E. sinensis aquaculture system. Specifically, the objectives were: to (i) quantify the CH4 and N2O fluxes under different macrophyte treatments and an unvegetated control, (ii) to identify key water quality parameters influencing GHG emissions, and (iii) to assess the overall contribution of submerged plants to GHG emissions. The results provide new insights into the mechanisms of GHG release in aquaculture ecosystems and highlight that macrophyte coverage often enhances the total GHG emissions in E. sinensis culture tanks.
2. Materials and Methods
2.1. Site Description
The study was conducted in the Datong Lake District of Yiyang City, Hunan Province, China (29°01′19″ N, 112°15′28″ E). The region has a humid continental monsoon climate, transitioning from the central to the northern subtropical zone. The mean annual temperature is 16.5 °C, and the water temperature typically ranges from 10 °C to 34 °C throughout the year. In the surface soil at the experimental site, the total nitrogen content was 1.34 g·kg−1, the total phosphorus content was 0.70 g·kg−1 and the total carbon content was 24.12 g·kg−1.
2.2. Experimental Design and Management
This experiment, conducted from 23 July to 23 August 2024, aimed to investigate the effects of different submerged macro phytes on CH4 and N2O emissions in Eriocheir sinensis aquaculture systems. Four treatments were established: H. verticillata (HV), V. natans (VN), E. nuttallii (EN), and a plant-free control (CK), with three replicates per treatment. Cylindrical polyethylene tanks (height: 1.0 m; radius: 0.7 m) were buried underground to simulate a pond environment, containing 0.2 m of bottom sediment and 0.75 m of overlying water.
During the 30-day experiment, CH4 and N2O fluxes were measured every five days between 08:30 AM and 11:00 AM, for a total of six samplings. Prior to stocking, submerged macrophytes were acclimated for one week. Juvenile E. sinensis were then introduced at a density of 1.3 plants·m−2. During the culture period, E. sinensis were fed commercial pelleted diet daily at 6:00 PM, with a crude protein content of not less than 36%. All treatments employed the same feeding schedules and water management practices to ensure consistency of experimental conditions.
2.3. Sampling and Analysis
CH4 and N2O fluxes were measured using static dark chamber gas chromatography (GC). The dark chamber was constructed of an opaque PVC cylinder (height: 0.5 m; diameter: 0.4 m) and equipped with an external insulation layer to minimize temperature fluctuations. Each chamber was equipped with a gas sampling port and a thermometer, with the sampling port connected to a three-way valve and a syringe via a flexible hose (Figure 1). During sampling, the chamber was fixed to stainless steel brackets and submerged in water for approximately 5 cm to ensure airtightness. Prior to sampling, chambers were equilibrated for 30 min. Gas samples were collected at 0, 15, 30, 45, and 60 min using a 30 mL syringe, injected into pre-evacuated glass vials, and stored in the dark until analysis. The internal temperature of the chamber was recorded simultaneously. Gas concentrations were determined using a gas chromatograph (8890, Agilent Technologies, China).
Simultaneously with gas sampling, 500 mL of mid-layer water was collected in a polyethylene bottle and immediately stored in the dark at - 4 °C. Nutrient and organic carbon contents were then analyzed. Total nitrogen (TN), total phosphorus (TP), and nitrate nitrogen (NO3−–N) were determined using an AA3 flow injection analyzer (Auto Analyzer 3-AA3, SEAL Analytical, USA). Total organic carbon (TOC) was measured using a total organic carbon analyzer (TOC-Vwp, Shimadzu, Japan). Dissolved oxygen (DO), water temperature (WT), the value of Eh, total dissolved solids (TDS), and chlorophyll (Chl) were measured in-situ using a multiparameter water quality analyzer (EXO, Xylem Analytics, China).
2.4. Flux Calculations
where f is the flux of CH4 or N2O (mg·m−2·h−1), ρ is the gas density of CH4 (0.717) or N2O (1.977) (kg·m−3), h is the height of the chamber above the water surface (m), P is the local atmospheric pressure (Pa), P0 is the standard atmospheric pressure (Pa), dc/dt is the concentration change rate (mg·m-3·h−1), and T is the water temperature (°C).
where F is the cumulative emission (kg·ha−1), f is the gas flux (mg·m−2·h), (t₍ᵢ₊1₎ – tᵢ) is sampling interval (days), 10−2 is the unit conversion factor, and 24 is the hourly conversion factor.
Global warming potential (GWP) was estimated on 100-year horizon as [19]:
where FCH4 and FN2O are the cumulative emissions of CH4 and N2O (kg·ha−1), respectively.
2.5. Data Processing and Statistical Analysis
All statistical analyses were performed using Microsoft Office 2019 and Origin 2024. Differences among treatments were evaluated using one-way analysis of variance (ANOVA), followed by Tukey’s honest test to determine pairwise significance. Pearson product-moment correlation coefficient was used to assess the correlation between GHG fluxes and water quality factors. Statistical significance was defined as p < 0.05.
3. Results
3.1. Temporal Dynamics and Cumulative Fluxes of GHG Emissions
CH4 fluxes exhibited a pronounced bimodal temporal pattern across all treatments. Emissions increased steadily during the initial 5 to 20 days, reaching the first peak around day 20, followed by a brief decline near day 25, most notably under the E. nuttallii (EN) treatment. Subsequently, CH4 fluxes rose sharply again, reaching their maximum values at the end of the monitoring period (Figure 2a). Significant differences were observed among treatments (p < 0.05). Throughout the experiment, the H. verticillata (HV) group consistently exhibited the highest emission rate, with peak fluxes exceeding 70 mg·m−2·h−1 and mean fluxes significantly higher than those of all other groups. The EN group followed, with a peak flux of approximately 65 mg·m−2·h−1, while the V. natans (VN) group showed moderate emissions, peaking at approximately 55 mg·m−2·h−1. In contrast, the CH4 emissions from the CK treatment group were almost negligible, indicating that it had the strongest emission mitigation effect (Figure 2a). Cumulative CH4 emissions displayed a clear gradient: HV > EN > VN > CK (Figure 2b). Significant differences in cumulative methane emissions were observed among the different treatment groups, all of which were significantly higher than those of CK (p < 0.05) (Figure 2b). The total emission from the HV treatment (250.10 ± 7.91 kg·hm−2) was approximately 15 times higher than that of the CK treatment.
In contrast, the trend of N2O flux was opposite to that of CH4. Emissions were concentrated in the early stages of the experiment, with overall emissions decreasing throughout the experiment, slightly rebounding around day 25, and then declining to the lowest level at the end of the monitoring period (Figure 3a). The VN group demonstrated the highest N2O fluxes, with an early peak of approximately 15 μg·m−2·h−1 and the highest mean emission rate across all groups. The HV group ranked second, with an initial peak close to 13 μg·m−2·h−1, but then rapidly declining. Both the EN and CK groups maintained relatively low and stable fluxes, with an early peak of 7 μg·m−2·h−1, indicating strong N2O mitigation potential (Figure 3a). The cumulative N2O emissions followed the order VN > HV > EN ≈ CK (Figure 3b). The VN treatment yielded the highest cumulative emissions (37.2 ± 1.45 μg·m−2), 116.78% higher than that of the CK treatment, while the HV treatment exceeded the control by 46.69%. These results collectively indicate that submerged macrophytes, particularly H. verticillata and V. natans, significantly enhanced greenhouse gas emissions in E. sinensis aquaculture tanks, while the unvegetated control group showed the best emission mitigation effect on both CH4 and N2O fluxes.
3.2. Global Warming Potential
All treatments emitted both CH4 and N2O, and there were significant differences in total GWP among the treatments (p < 0.05). The overall ranking was HV > EN > VN > CK (Figure 4). Compared with the unvegetated control group, the systems with submerged macrophytes had significantly higher GWP values (p < 0.05), with HV exhibiting the highest overall warming effect, approximately 13.8 times that of CK.
Although the warming effect of all vegetated treatments was significantly higher than that of the control group, significant differences were observed among different species. The GWP of the H. verticillata (HV) system was the highest, followed by E. nuttallii (EN), while V. natans (VN), despite its high total N2O emissions (Figure 3b; Figure 4), presented a relatively lower GWP, indicating a weaker overall warming effect than that of HV and EN, though still significantly higher than that of the CK (Figure 4).
In all treatments, CH4 was the dominant source of total warming potential, contributing over 97% of GWP, while N2O con tributed less than 3%. The pattern of cumulative CH4 emissions (HV > EN > VN > CK) was consistent with the difference in GWP (Figure 2b; Figure 4), confirming that CH4 is the primary driver of GHG impacts in these aquaculture systems.
3.3. Correlation Between Water Quality Factors and GHG Fluxes
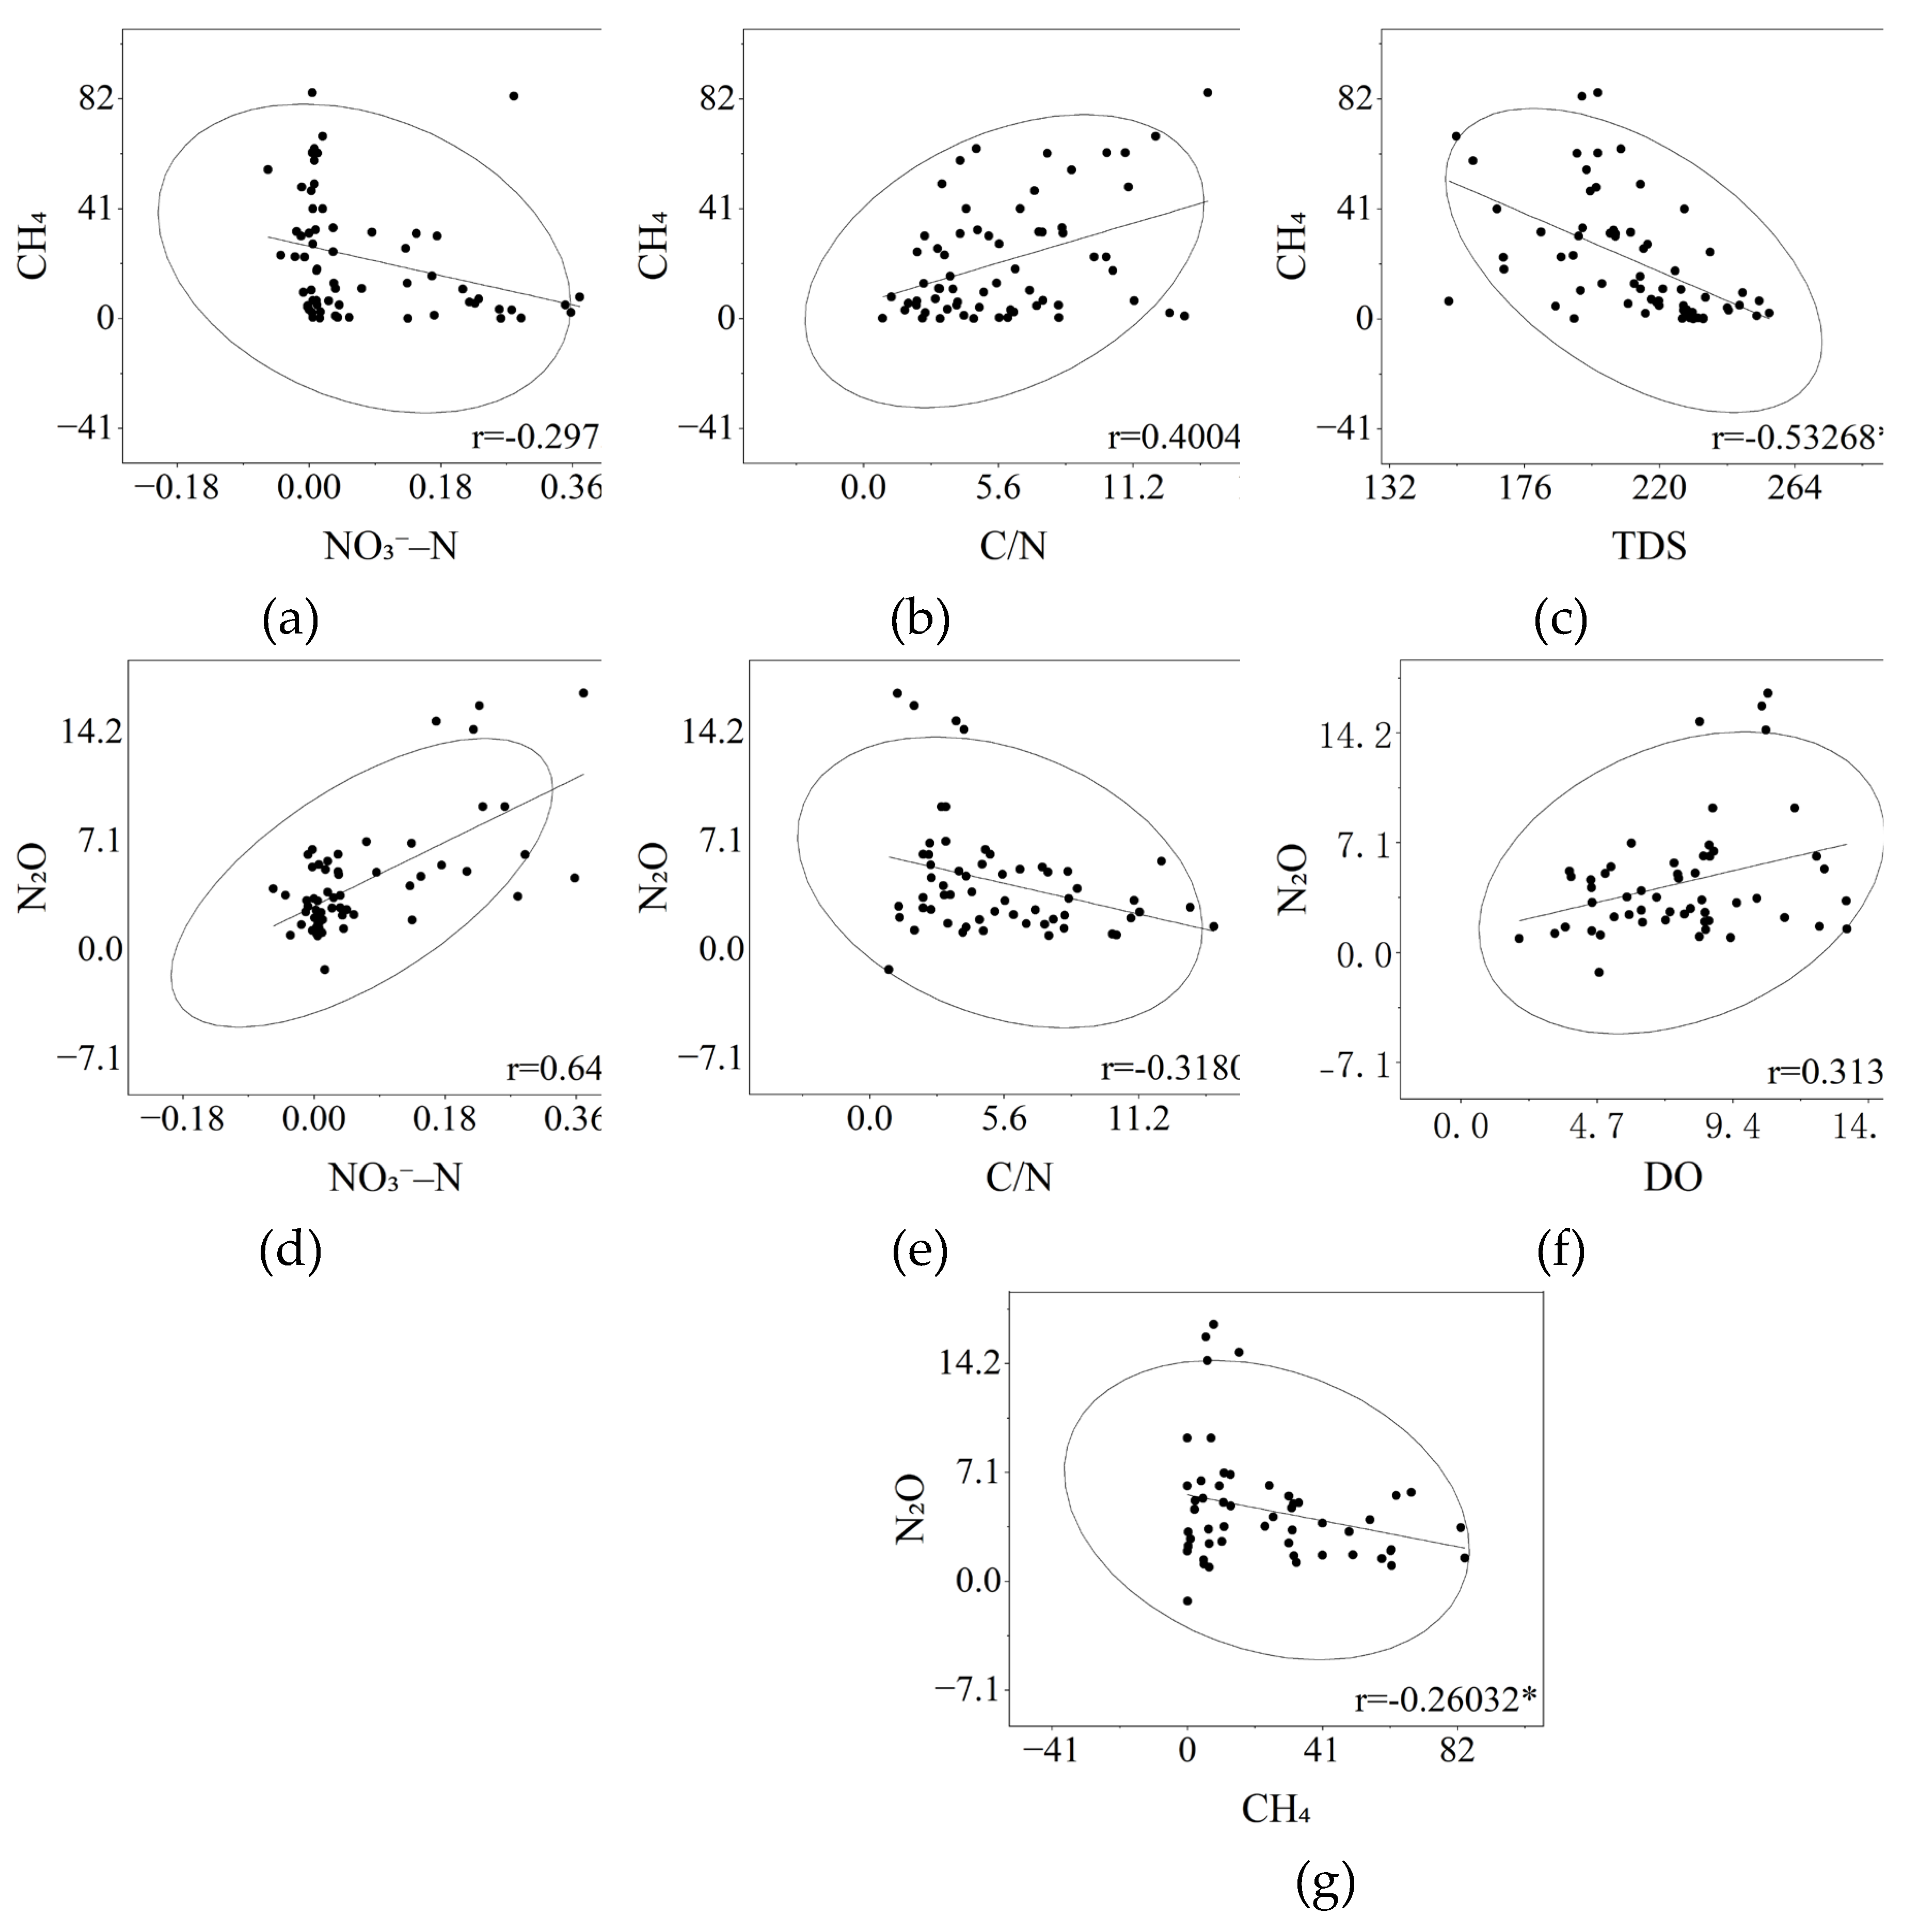
Correlation analysis revealed distinct control patterns for CH4 and N2O fluxes [20], with nitrogen-related parameters exerting opposite effects on these two gases (Figure 5a; Figure 5b; Figure 5d; Figure 5e ). CH4 fluxes were negatively correlated with NO3–N (r = –0.297, p < 0.05) and TDS (r = –0.533, p < 0.01) (Figure 5a; Figure 5c), but positively correlated with the carbon-nitrogen ratio (C/N) (r = 0.400, p < 0.05) (Figure 5b). In contrast, N2O fluxes showed a strong positive correlation with NO3–N (r = 0.646, p < 0.01) and DO (r = 0.313, p < 0.05) (Figure 5d; Figure 5f), but a negative correlation with the C/N ratio (r = –0.318, p < 0.05) (Figure 5e). The significant negative correlation between CH4 and N2O fluxes (r = –0.260, p < 0.05) (Figure 5g) indicates that an increase in one gas may suppress the emission of another under different treatment conditions. To sum up, nitrogen-related factors have opposite effects on CH4 and N2O fluxes, which are inversely related to each other.
4. Discussion
4.1. Species-Specific Controls of CH4 Emissions
Submerged macrophytes exert a strong control over CH4 emissions in aquaculture systems by influencing sediment oxygena tion, root exudation, and microbial activity [21]. In this study, all submerged macrophyte treatments enhanced CH4 flux compared to the unvegetated control (Figure 4), indicating that the presence of plants typically promotes methanogenesis by increasing labile carbon availability and providing transport pathways for CH4 diffusion [3,12]. However, significant species-specific differences were observed among HV, EN, and VN. HV exhibited the highest CH4 emissions, likely due to its extensive aerenchyma and dense canopy structure, which enhance sediment methanogenesis and facilitate CH4 release to the water surface [22]. EN showed moderate CH4 fluxes, indicating that methanogenesis was partially suppressed through better sediment oxygenation and less effective gas transport pathways. VN exhibited the lowest emissions among the vegetated groups, possibly due to its scattered distribution and weak aerenchyma, which limits plant-mediated CH4 transfer [23].
In addition, submerged macrophytes influence microbial and planktonic communities, indirectly affecting gas dynamics [24]. The broad leaf surfaces of HV and EN support the growth of dense periphyton and algal biofilms [14]. These communities increase organic matter input through detritus and microbial turnover, stimulating methanogenesis under oxygen-limited conditions [3,15]. In contrast, the smaller leaf surfaces and sparser canopies of VN reduce algal colonization and organic deposition, thus leading to lower CH4 production. Therefore, the observed emission differences can be attributed to plant morphology, aerenchyma-mediated transport efficiency, and the extent of algal and microbial colonization [24].
4.2. Mechanisms Underlying CH4 and N2O Emission Patterns
Although CH4 and N2O exhibit opposite temporal patterns, their production mechanisms are interconnected through shared environmental controls [25]. Both gases are regulated by Eh, DO, and nitrogen availability [4]. The negative correlation between CH4 and NO3−-N observed in this study suggests that elevated nitrate concentrations inhibit methanogenesis via competitive electron acceptance and stimulation of denitrification [26]. Conversely, higher CH4 emissions occur under low NO3−-N and high C/N conditions, consistent with enhanced anaerobic metabolism in carbon rich sediments [8].
The positive correlation between N2O and NO3−-N and DO indicates that incomplete denitrification is the main source under sub oxic conditions [4]. Among all treatments, the VN treatment showed the highest N2O emissions, likely due to sediment disturbance and fluctuations in the redox gradient favoring partial denitrification [16]. In contrast, HV and EN, due to their greater root oxygen release, may promote complete denitrification to generate N2, thus reducing N2O accumulation [27]. These findings are consistent with broader aquatic studies suggesting that macrophyte species regulate GHG emissions through complex feedback loops between oxygen transport, nitrogen cycling, and carbon supply [28,29].
4.3. Management Implications and Broader Perspectives
Although submerged vegetation typically enhances GHG emissions compared with the unvegetated control (Figure 4), their ecological functions, such as improving water quality, stabilizing sediments, and supporting crab growth, make them crucial in aquaculture [30]. Therefore, the goal should be not to eliminate macrophytes, but rather to identify optimal species and management strategies to minimize emissions while maintaining ecosystem function. According to this study, V. natans appears to offer the most balanced outcomes, with relatively low CH4 and N2O fluxes among vegetated treatments. Selecting species with low aerenchyma, moderate canopy density, and controlling planting area can effectively reduce GHG emissions in E. sinensis culture systems [31].
Beyond aquaculture, these findings contribute to understanding the mechanisms of carbon-nitrogen coupling and GHG regulation in vegetated wetlands and shallow-water ecosystems. Similar processes exist in natural lakes and restored wetlands, where plant species composition significantly influences sediment carbon turnover and CH4 transport. Therefore, incorporating species-specific traits into emission models can improve regional and global GHG inventories, thereby supporting climate-smart aquatic management strategies that align with IPCC [1] mitigation goals.
5. Conclusions
This study demonstrates that the cultivation of submerged macrophytes significantly enhanced GHG emissions in E. sinensis aquaculture systems, with significant species-specific differences. Among the plants tested, H. verticillata exhibited the highest CH4 and overall GWP, followed by E. nuttallii, while V. natans produced the lowest emissions among vegetated treatments. The relatively low GWP of V. natans can be attributed to its moderate root oxygen release, weak aerenchyma-mediated gas transport, and low algal attachment, which collectively suppressed methanogenesis and facilitated CH4 oxidation. These findings indicate that while the presence of macrophyte typically promotes GHG release compared to unvegetated systems, selecting species such as V. natans can effectively mitigate emissions while maintaining ecological and productive benefits. Therefore, optimizing plant composition and density in crab aquaculture represents a practical approach that balances productivity and climate-friendly management of aquatic ecosystems.
Author Contributions
Conceptualization, W.W.; methodology, W.W. and Y.H.X.; investigation, W.Z., Y.X. and Z.W.; data curation, W.Z.; writing—original draft preparation, W.Z.; writing—review and editing, W.Z. and W.W.; visualization, W.Z.; supervision, W.W. and Y.H.X.; funding acquisition, Y.H.X. All authors have read and agreed to the published version of the manuscript.
Funding
This research was funded by Hunan Provincial Innovation Ecological Construction Program Science and Technology Cooperation Project, grant number 2023WK2003; Hunan Provincial Science and Technology Innovation Platform Program, grant number 2022PT1010.
Institutional Review Board Statement
Not applicable.
Data Availability Statement
The data are available from the authors upon reasonable request as the data need further use.
Conflicts of Interest
The authors declare no conflicts of interest. The funders had no role in the design of the study; in the collection, analyses, or interpretation of data; in the writing of the manuscript; or in the decision to publish the results.
Abbreviations
The following abbreviations are used in this manuscript:
| GHG | greenhouse gas |
| CH4 | methane |
| N2O | nitrous oxide |
| GWP | global warming potential |
| HV | group with Hydrilla verticillata |
| VN | group with Vallisneria natans |
| EL | group with Elodea nuttallii |
| CK | plant-free control |
| TN | total nitrogen |
| TP | total phosphorus |
| NO3−–N | nitrate nitrogen |
| TOC | total organic carbon |
| DO | dissolved oxygen |
| WT | water temperature |
| TDS | total dissolved solids |
| Chl | chlorophyll |
| C/N | carbon-nitrogen ratio |
References
- Intergovernmental Panel on Climate Change. In Climate Change 2022 – Impacts, Adaptation and Vulnerability; 2023; pp. 197–378.
- Seitzinger, S.P.; Kroeze, C.J.G.b.c. Global distribution of nitrous oxide production and N inputs in freshwater and coastal marine ecosystems. Global biogeochemical cycles 1998, 12, 93–113. [Google Scholar] [CrossRef]
- Rosentreter, J.A.; Al-Haj, A.N.; Fulweiler, R.W.; Williamson, P. Methane and Nitrous Oxide Emissions Complicate Coastal Blue Carbon Assessments. Global Biogeochemical Cycles 2021, 35. [Google Scholar] [CrossRef]
- Zheng, Y.; Wu, S.; Xiao, S.; Yu, K.; Fang, X.; Xia, L.; Wang, J.; Liu, S.; Freeman, C.; Zou, J. Global methane and nitrous oxide emissions from inland waters and estuaries. Global change biology 2022, 28, 4713–4725. [Google Scholar] [CrossRef] [PubMed]
- Desrosiers, K.; DelSontro, T.; del Giorgio, P.A. Disproportionate Contribution of Vegetated Habitats to the CH and CO Budgets of a Boreal Lake. Ecosystems 2022, 25, 1522–1541. [Google Scholar] [CrossRef]
- Girard, L.; Davidson, T.A.; Tolon, V.; Bucak, T.; Rouifed, S.; Wezel, A.; Robin, J. The balance of carbon emissions versus burial in fish ponds: The role of primary producers and management practices. Aquaculture Reports 2024, 39. [Google Scholar] [CrossRef]
- Bastviken, D.; Treat, C.C.; Pangala, S.R.; Gauci, V.; Enrich-Prast, A.; Karlson, M.; Gålfalk, M.; Romano, M.B.; Sawakuchi, H.O. The importance of plants for methane emission at the ecosystem scale. Aquatic Botany 2023, 184. [Google Scholar] [CrossRef]
- Chingangbam, S.S.; Khoiyangbam, R.S. Submerged macrophytes enhance carbon emission (CO2 and CH4) from the freshwater wetland in Keibul Lamjao National Park, Manipur, India. Limnologica 2023, 103. [Google Scholar] [CrossRef]
- Cai, Z.X.; Li, Q.S.; Bai, H.; Zhu, C.Y.; Tang, G.H.; Zhou, H.Z.; Huang, J.W.; Song, X.S.; Wang, J.F. Interactive effects of aquatic nitrogen and plant biomass on nitrous oxide emission from constructed wetlands. Environmental Research 2022, 213. [Google Scholar] [CrossRef]
- Vroom, R.J.E.; van den Berg, M.; Pangala, S.R.; van der Scheer, O.E.; Sorrell, B.K. Physiological processes affecting methane transport by wetland vegetation – A review. Aquat. Bot. 2022, 182, 103547. [Google Scholar] [CrossRef]
- Theus, M.E.; Ray, N.E.; Bansal, S.; Holgerson, M.A. Submersed Macrophyte Density Regulates Aquatic Greenhouse Gas Emissions. Journal of Geophysical Research: Biogeosciences 2023, 128. [Google Scholar] [CrossRef]
- Ström, L.; Mastepanov, M.; Christensen, T.R. Species-specific Effects of Vascular Plants on Carbon Turnover and Methane Emissions from Wetlands. Biogeochemistry 2005, 75, 65. [Google Scholar] [CrossRef]
- Chen, Y.; Dong, S.; Wang, F.; Gao, Q.; Tian, X. Carbon dioxide and methane fluxes from feeding and no-feeding mariculture ponds. Environ. Pollut. 2016, 212, 489. [Google Scholar] [CrossRef] [PubMed]
- Ma, Y.; Sun, L.; Liu, C.; Yang, X.; Zhou, W.; Yang, B.; Schwenke, G.; Liu, D.L. A comparison of methane and nitrous oxide emissions from inland mixed-fish and crab aquaculture ponds. Sci. Total Environ. 2018, 637–638, 517. [Google Scholar] [CrossRef] [PubMed]
- Yuan, J.; Liu, D.; Xiang, J.; He, T.; Kang, H.; Ding, W. Methane and nitrous oxide have separated production zones and distinct emission pathways in freshwater aquaculture ponds. Water Res. 2021, 190, 116739. [Google Scholar] [CrossRef]
- Bhushan, A.; Goyal, V.C.; Srivastav, A.L. Greenhouse gas emissions from inland water bodies and their rejuvenation: A review. Journal of Water and Climate Change 2024, 15, 5626–5644. [Google Scholar] [CrossRef]
- Li, F.; Feng, J.; Zhou, X.; Xu, C.; Jijakli, M.H.; Zhang, W.; Fang, F. Impact of rice-fish/shrimp co- culture on the N2O emission and NH3 volatilization in intensive aquaculture ponds. Sci. Total Environ. 2019, 655, 284. [Google Scholar] [CrossRef]
- Chen, Q.; Li, H.; Huang, H.; Wang, W. Effect of Seedling Rates on Crop Yield and Methane Emissions from Rice Paddies. Atmosphere 2024, 15. [Google Scholar] [CrossRef]
- Yang, P.; He, Q.; Huang, J.; Tong, C. Fluxes of greenhouse gases at two different aquaculture ponds in the coastal zone of southeastern China. Atmospheric Environment 2015, 115, 269–277. [Google Scholar] [CrossRef]
- Guo, W.T.; Liu, T.T.; Fan, Z.T.; Xiang, L.Y.; Jian, C.; Chen, H.L.; Li, D.F.; Liu, S.S.; Xiao, Z.L.; Wang, X.F. Aquatic plants dominate spatiotemporal dynamics of N2O fluxes in small urban lake by regulating nutrient distribution and emission path. Environmental Research 2025, 274. [Google Scholar] [CrossRef]
- Yin, Y.; Ci, Z.; Qin, M.; Lin, H.; Zhang, Y.; Xun, F.; Xie, A.; Xing, P.; Chen, X.; Su, Y.; et al. Potential of submerged macrophytes restoration for reducing CH4 and CO2 emissions in a typical urban lake. Journal of Environmental Management 2025, 380. [Google Scholar] [CrossRef]
- Aben, R.C.H.; Junior, E.S.O.; Carlos, A.R.; van Bergen, T.J.H.M.; Lamers, L.P.M.; Kosten, S. Impact of plant species and intense nutrient loading on CH and NO fluxes from small inland waters: An experimental approach. Aquatic Botany 2022, 180. [Google Scholar] [CrossRef]
- Kim, W.-J.; Bui, L.T.; Chun, J.-B.; McClung, A.M.; Barnaby, J.Y.J.P.b.; biotechnology. Correlation between methane (CH4) emissions and root aerenchyma of rice varieties. Plant Breeding and Biotechnology 2018, 6, 381–390. [CrossRef]
- Wetzel, R.G.; Søndergaard, M. Role of submerged macrophytes for the microbial community and dynamics of dissolved organic carbon in aquatic ecosystems. In The structuring role of submerged macrophytes in lakes; Springer: 1998; pp. 133–148.
- McDaniel, M.D.; Saha, D.; Dumont, M.G.; Hernández, M.; Adams, M.A.J.E. The effect of land-use change on soil CH4 and N2O fluxes: A global meta-analysis. Ecosystems 2019, 22, 1424–1443. [Google Scholar] [CrossRef]
- Klüber, H.D.; Conrad, R.J.F.M.E. Effects of nitrate, nitrite, NO and N2O on methanogenesis and other redox processes in anoxic rice field soil. FEMS Microbiology Ecology 1998, 25, 301–318. [Google Scholar] [CrossRef]
- Majumdar, D.J.C.r.i.e.s.; technology. Biogeochemistry of N2O uptake and consumption in submerged soils and rice fields and implications in climate change. Critical Reviews in Environmental Science and Technology 2013, 43, 2653–2684. [CrossRef]
- Ribaudo, C.; Benelli, S.; Bolpagni, R.; Darul, R.; Bartoli, M. Macrophyte growth forms and hydrological connectivity affect greenhouse gas concentration in small eutrophic wetlands. Aquatic Botany 2023, 188. [Google Scholar] [CrossRef]
- Hilt, S.; Grossart, H.P.; McGinnis, D.F.; Keppler, F.J.L.; Oceanography. Potential role of submerged macrophytes for oxic methane production in aquatic ecosystems. Limnology and Oceanography 2022, 67, S76–S88. [Google Scholar] [CrossRef]
- Bao, J.; Jiang, H.; Li, X.J.R.i.A. Thirty years of rice-crab coculture in China—Research progress and prospects. Aquaculture 2022, 14, 1597–1612. [Google Scholar] [CrossRef]
- Tang, Y.; Peng, J.; Chen, J.; Zhao, Y.; Ding, Y.; Dai, J.; Hu, Z.; Huang, T.; Dong, M.; Xu, Z.J.F. Effect of Water Area and Waterweed Coverage on the Growth of Pond-Reared Eriocheir sinensis. Fishes 2022, 7, 282. [Google Scholar] [CrossRef]
Figure 1.
Schematic diagram of the layout of the experimental breeding tank and sampling box.
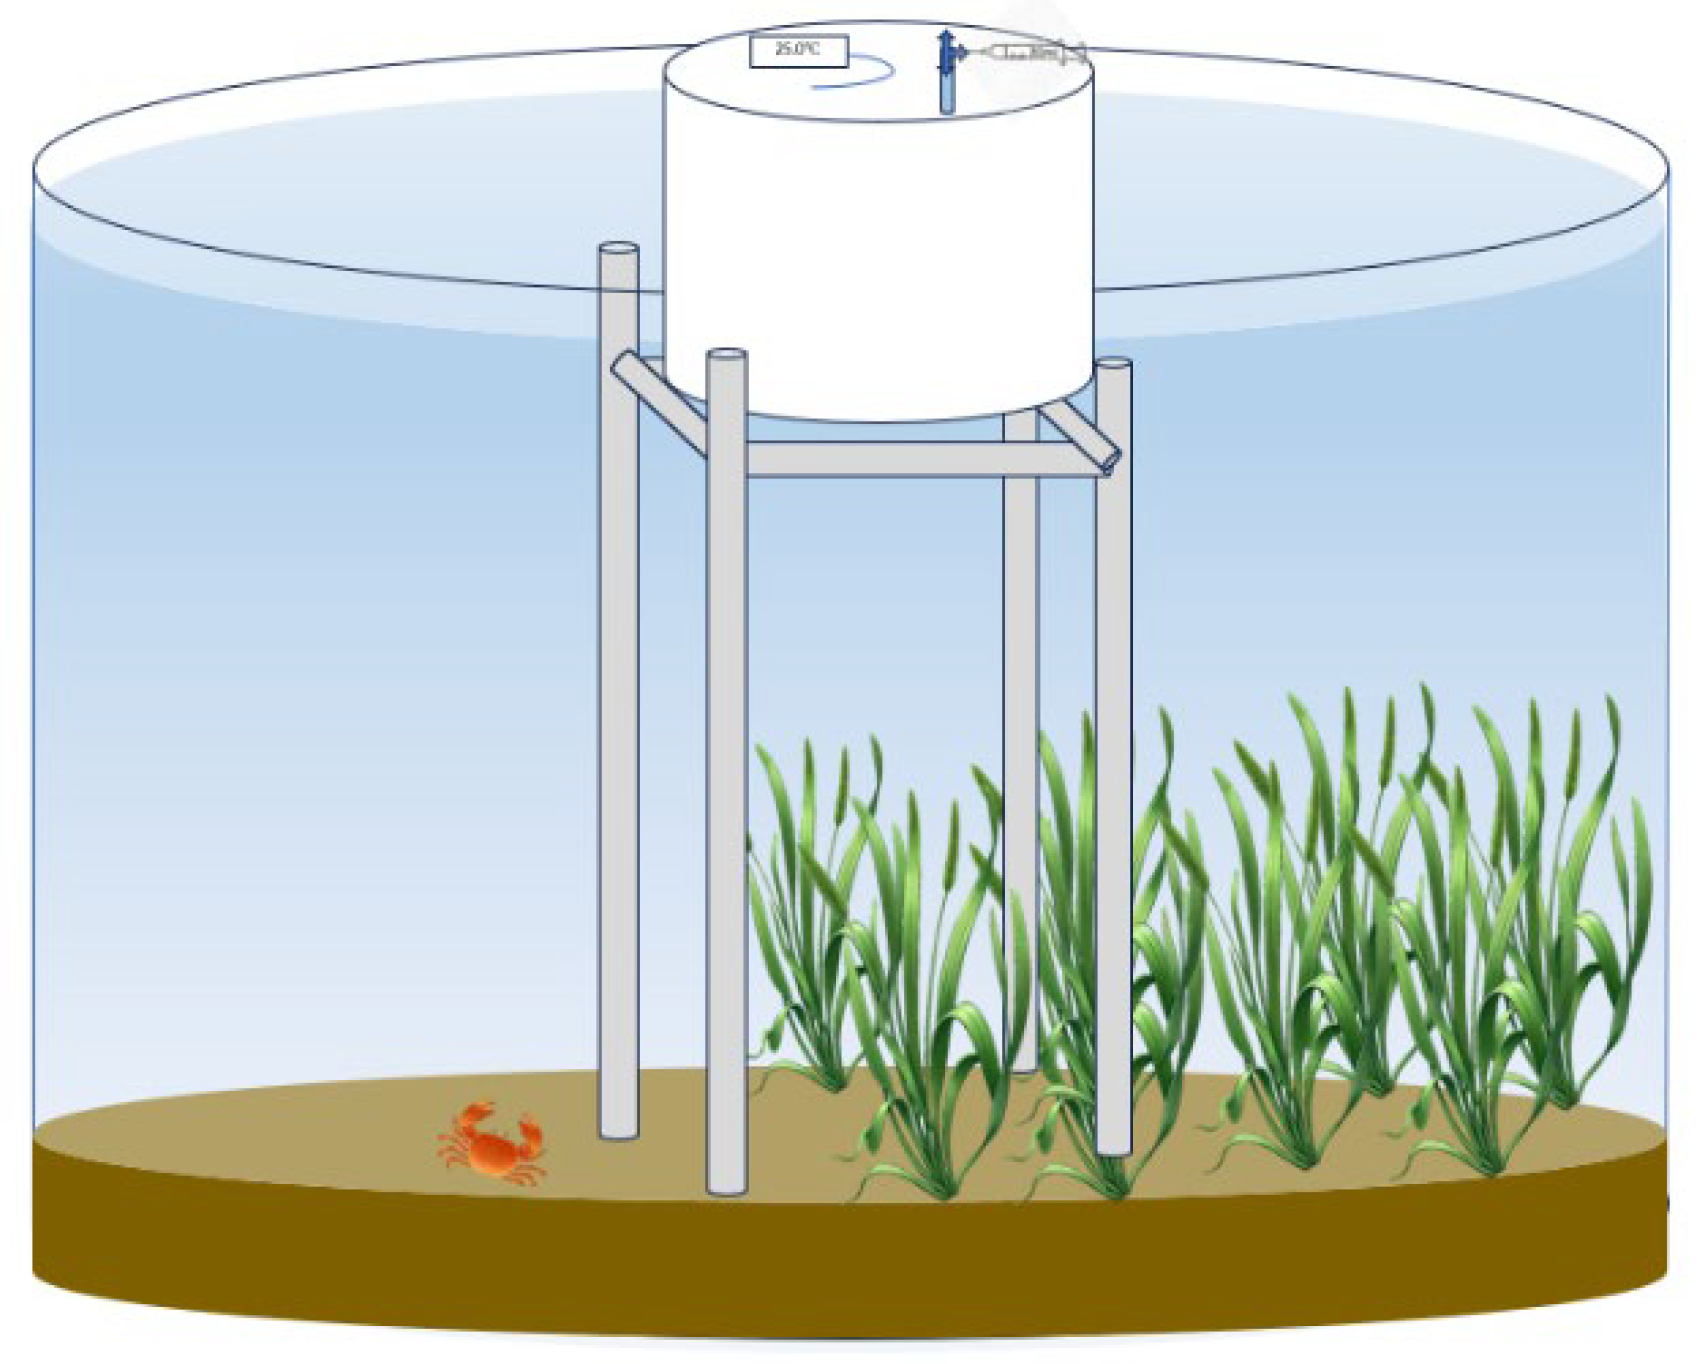
Figure 2.
Dynamic changes in CH4 emission flux under different submerged macrophytes (a) and cumulative emissions during the experiment (b). The bars represent the standard error range, and the same lowercase letter above the bars indicates no statistically significant difference (p > 0.05). HV, group with Hydrilla verticillata; VN, group with Vallisneria natans; EN, group with Elodea nuttallii; CK, plant-free control.
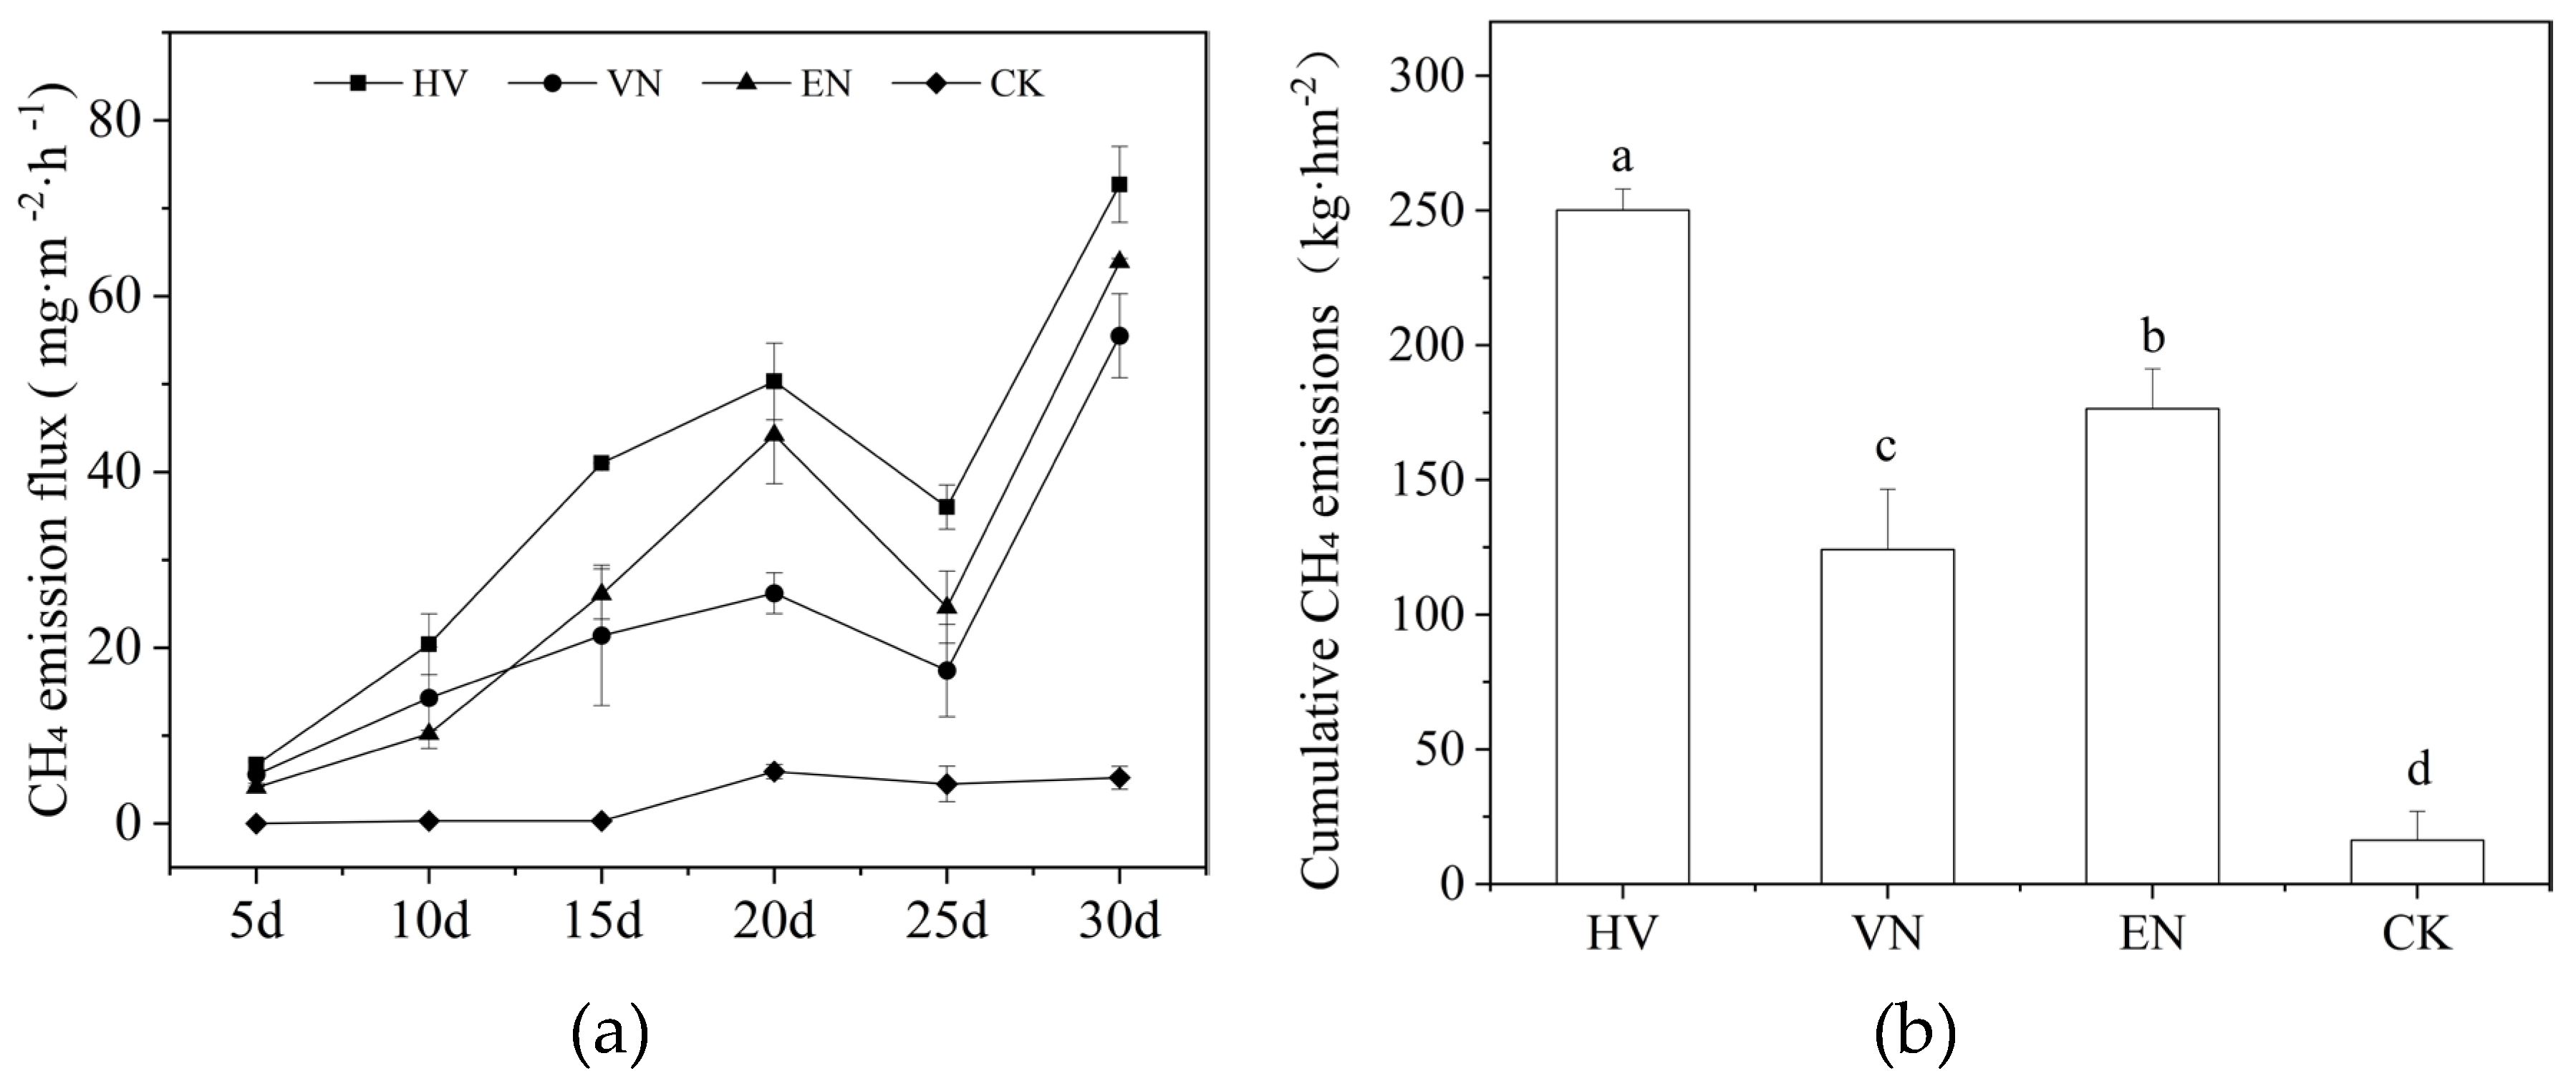
Figure 3.
Dynamic changes in N2O emission flux under different submerged macrophytes (a) and cumu lative emissions during the experiment (b). The bars represent the standard error range, and the same lowercase letter above the bar indicates no statistically significant difference (p > 0.05). HV, group with Hydrilla verticillata; VN, group with Vallisneria natans; EN, group with Elodea nuttallii; CK, plant-free control.
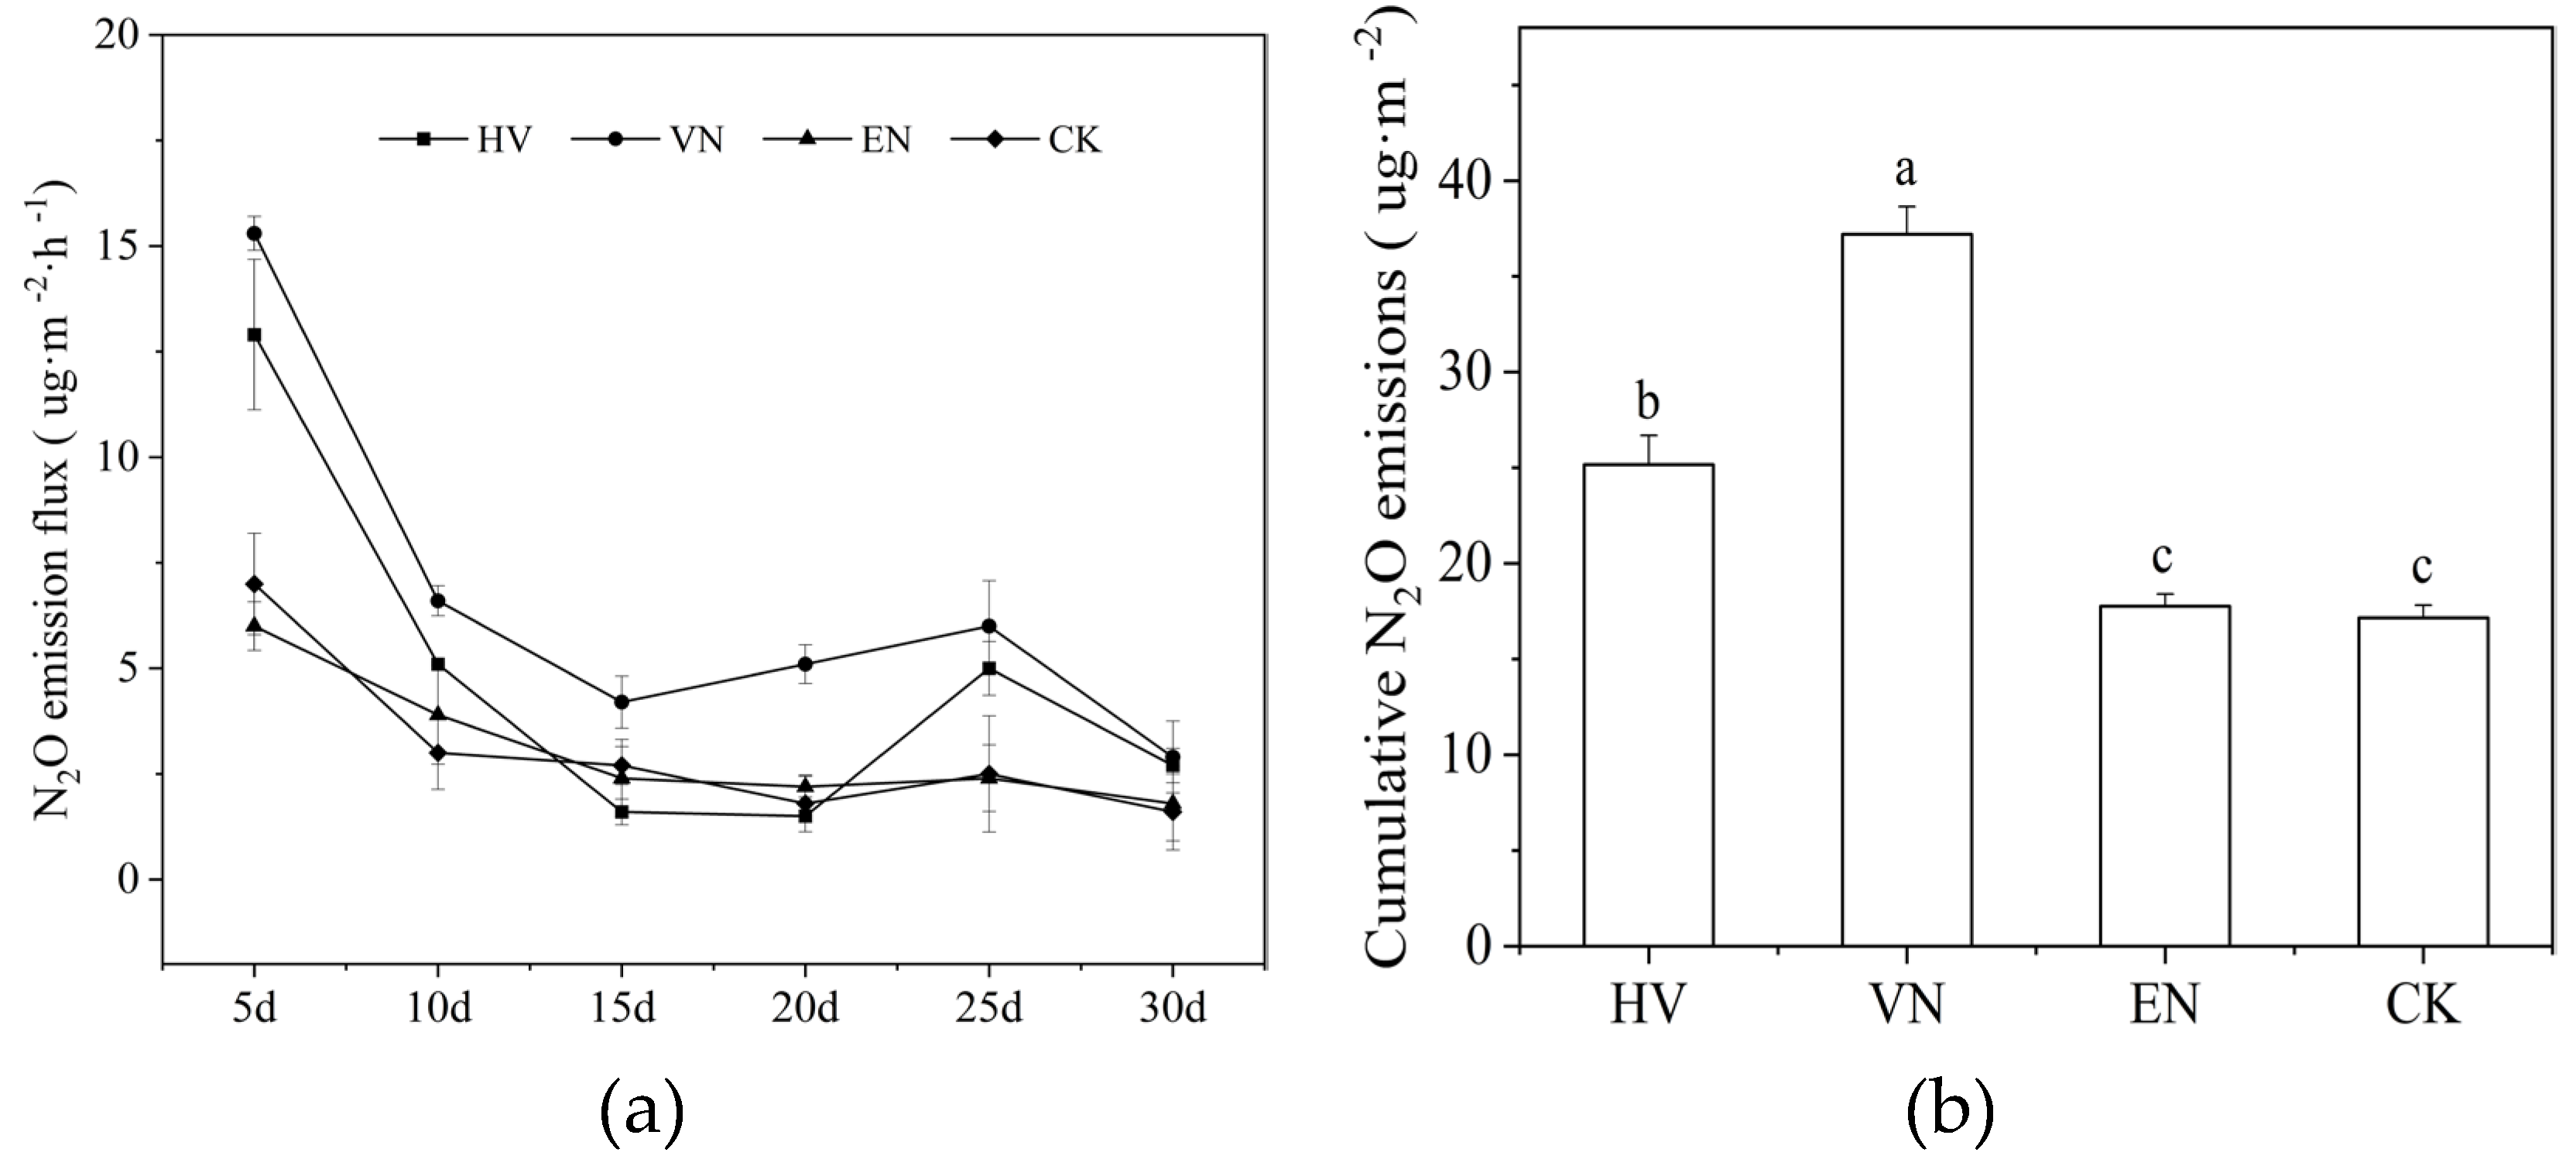
Figure 4.
Global warming potential values for each treatment. The bars represent the standard error range, and the same lowercase letter above the bar indicates no statistically significant difference (p > 0.05). HV, group with Hydrilla verticillata; VN, group with Vallisneria natans; EN, group with Elodea nuttallii; CK, plant-free control.
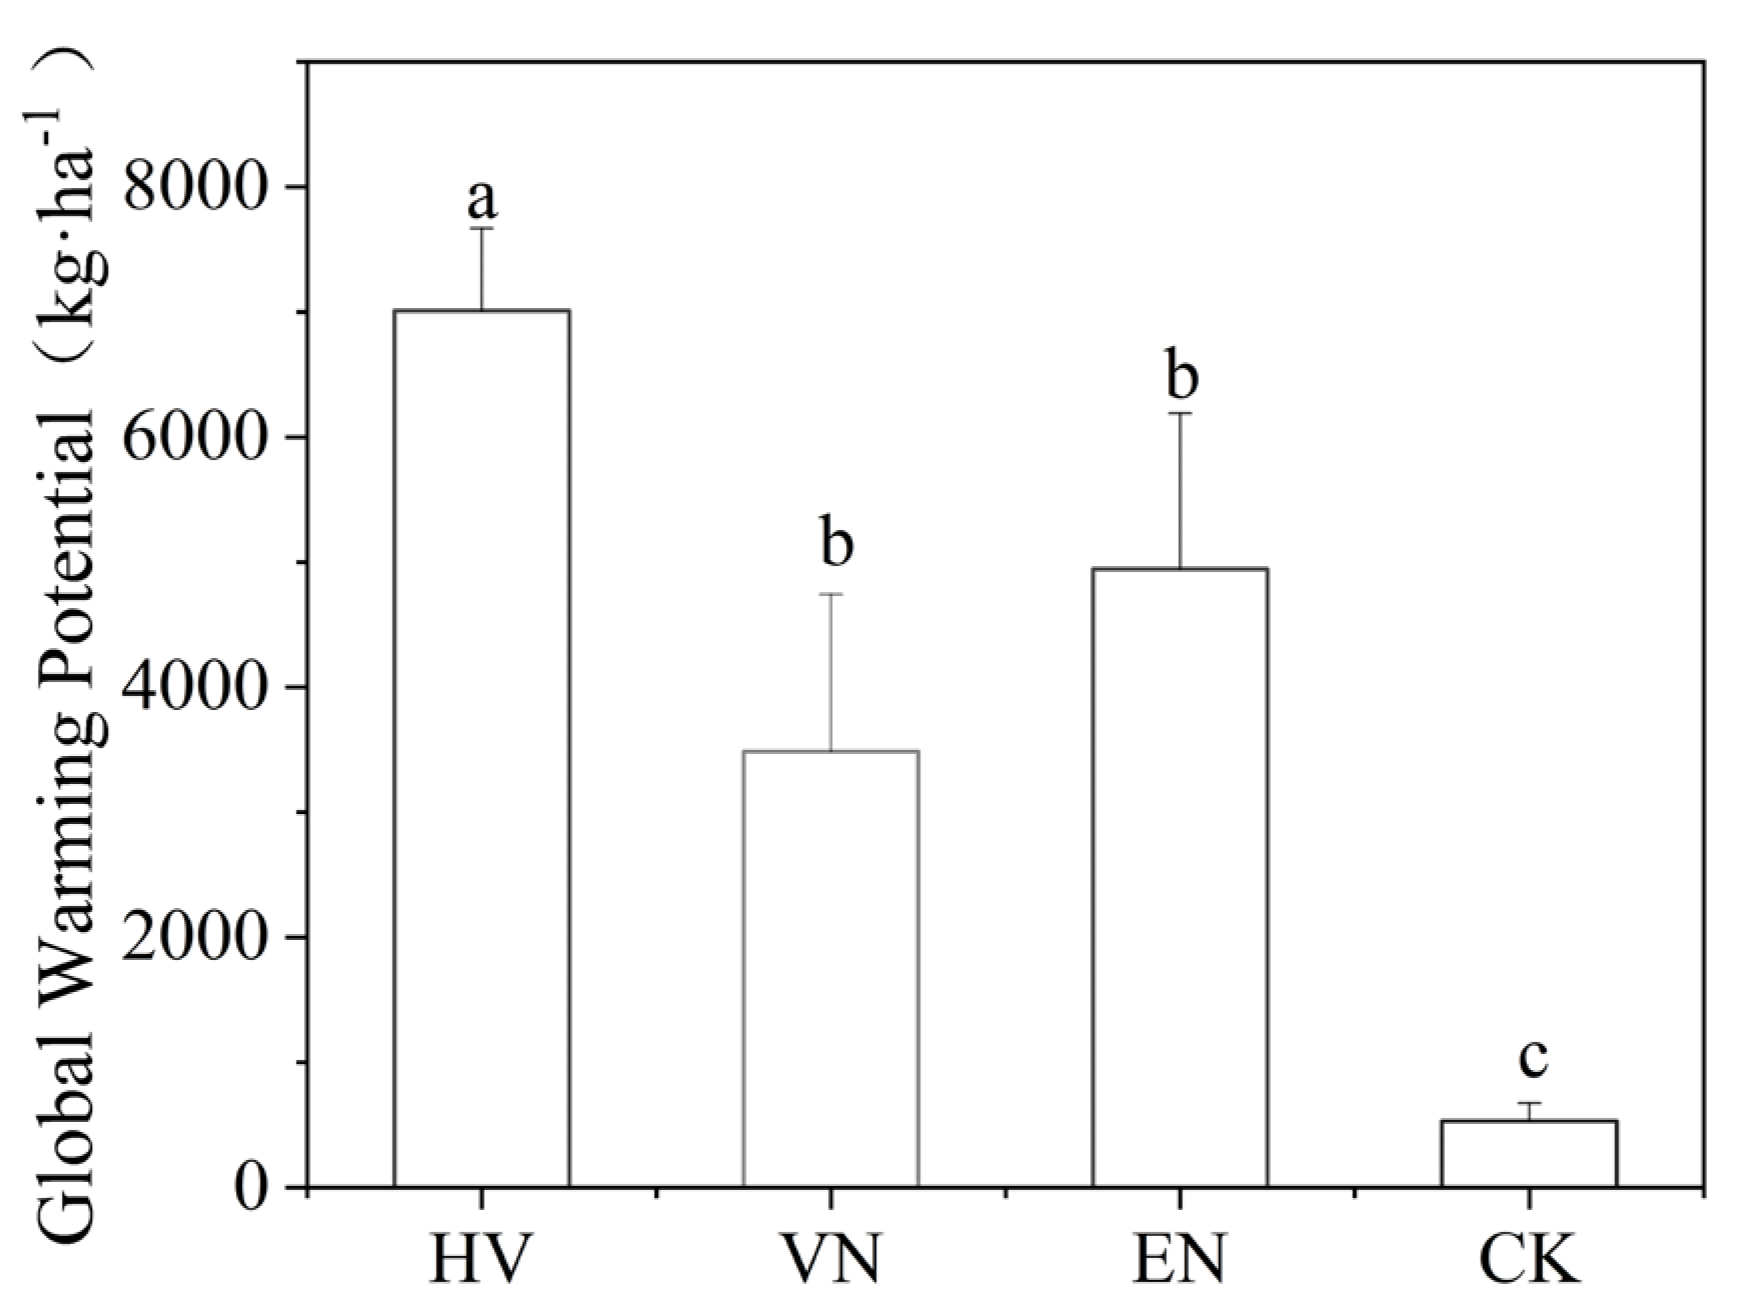
Figure 5.
The scatter plot illustrates the relationship between key water quality parameters and greenhouse gas (GHG) emissions. Ellipses represent 95% confidence intervals, and solid lines indicate fitted regression curves. The correlation coefficient (r) is calculated using the Pearson product-moment correlation coefficient. Only parameters with significant correlations are shown in the plot: (a) NO3–N concentration versus CH4 flux; (b) C/N ratio versus CH4 flux; (c) total dissolved solids (TDS) versus CH4 flux; (d) NO3–N concentration versus N2O flux; (e) C/N ratio versus N2O flux; (f) dissolved oxygen (DO) versus N2O flux; (g) CH4 flux versus N2O flux. * p < 0.05, ** p < 0.01.
Disclaimer/Publisher’s Note: The statements, opinions and data contained in all publications are solely those of the individual author(s) and contributor(s) and not of MDPI and/or the editor(s). MDPI and/or the editor(s) disclaim responsibility for any injury to people or property resulting from any ideas, methods, instructions or products referred to in the content. |
© 2025 by the authors. Licensee MDPI, Basel, Switzerland. This article is an open access article distributed under the terms and conditions of the Creative Commons Attribution (CC BY) license (http://creativecommons.org/licenses/by/4.0/).
Copyright: This open access article is published under a Creative Commons CC BY 4.0 license, which permit the free download, distribution, and reuse, provided that the author and preprint are cited in any reuse.


